Article

Hardware and Software Solutions for the Generation of a Database of HSV-Color Characteristics for the Main Ores and Rocks of the Khibiny Massif

by
Darya Nikolaevna Shibaeva
1,2,*,
Roman Pavlovich Voronin
1,2,
Alena Arkadievna Kompanchenko
3,
Denis Olegovich Volkov
1,2,
Danil Alekseevich Asanovich
1,2 and
Victor Vladimirovich Bulatov
1,2
1
Department of Mining Earth Sciences and Environmental Engineering, Apatity Branch of Murmansk Arctic University, 184209 Apatity, Russia
2
Mining Institute, Kola Science Centre, Russian Academy of Sciences, 184209 Apatity, Russia
3
Geological Institute, Kola Science Centre, Russian Academy of Sciences, 184209 Apatity, Russia
*
Author to whom correspondence should be addressed.
Minerals 2024, 14(2), 186; https://doi.org/10.3390/min14020186
Submission received: 30 November 2023 / Revised: 31 January 2024 / Accepted: 8 February 2024 / Published: 10 February 2024
(This article belongs to the Special Issue Colours in Minerals and Rocks, Volume II)

Abstract

:
This article presents developed hardware and software solutions based on the application of machine vision technology. The hardware and software solutions were created in order to generate a database of HSV-color value for the main ore types, host rocks, and minerals to define criteria for the in-process identification of the Khibiny apatite in testing the walls of blasting boreholes. The hardware ensures a multi-parametric assessment of the optical characteristics of samples and minerals located on their surface. The designed software solution allows the user to control the measurement process; systematize a description of the textural and structural features of the sample under study; and process images of the core surface. The resultant database of HSV-color value for the main ores and rocks of the Khibiny massif and their constituent minerals will provide an opportunity to search for criteria for the in-process identification of the Khibiny apatite in a mineral mixture.

1. Introduction

This article flows from an earlier published study [1] aimed at the development of an efficient and quick method of identifying apatite in the apatite–nepheline ores (or the ANO) of the Khibiny deposits (Kola Peninsula, Russia) and thereupon predicting the P2O5 content. The executed investigation confirms the ability of apatite to luminesce by a UV light source with a maximum wavelength of 365 nm [2,3,4,5,6] and evaluates the flow spectra of a series of luminescent minerals composing the ANO and host rocks of the Khibiny deposits such as nepheline, sodalite, a product of nepheline alteration, and calcite.
The luminescent mineral properties are useful for analyzing the surface of the blasting borehole walls to compile a distribution map for apatite. Apatite is the main industrial mineral in the Khibiny massif. The apatite emission color is supposed to be used as an identifier instead of a spectral feature with wavelength and emission intensity. The selection of the emission color as an identifier is influenced by the following:
(1)
High emission intensity (when contacting with an ultraviolet light source with a maximum wavelength of 365 nm) of sodalite in a broad band that includes yellow, orange, and red areas of the visible light range, which thus precludes from identifying apatite there;
(2)
An application area that requires using the shortest analytical times (for exposure and registration);
(3)
The available emission color differences in the studied monomineral fractions, including the pink-violet color of apatite emission, the blue-green one of nepheline, the pink-red one of calcite, and the orange-yellow one of sodalite.
This study is intended to develop a software-based product for the accumulation, systematization, and analysis of optical properties of minerals found on the surface of the exploratory borehole cores. As a result, it will help in identifying parameters for reliable (fault-free or high-precision) apatite detection in the ANO or apatite-bearing rocks when investigating the surface of the blasting borehole walls. The relevance and necessity of making changes to the existing approaches to retrieve information about the distribution of a valuable component in the block being prepared for stripping is described in [1]. A comparative evaluation of the quantitative and qualitative indicators for the drilling block models was executed to find a strategy for the ore flow quality management and demonstrated, in most cases, a discrepancy between the planned and actual indicators. The planned indicators are based on the exploration data (drill core analysis) and sampling data for drilling slurry of blasting boreholes.
Studies of the lithological composition and properties of rocks based on core photographs have been carried out by many geological and mining companies [7]. However, the high heterogeneity and variability of color characteristics for the lithotypes and properties prevent a common color classifier from being used for the identification of minerals. The classification features are defined by the experts in respect to the studied ore types and their locations. For the ANO of the Khibiny massif, the involvement of such analytical features as the mineral color and luminescence color will allow the consideration of the apatite color variations related to the host rock structure, grain size, and adjacent minerals, including those with similar color features.

2. Materials and Methods

2.1. Material

The core halves are used as model objects which clearly demonstrate mineral associations and distribution peculiarities of their components, and provide an opportunity for a comprehensive study of the properties of individual mineral components in these associations. The studies were carried out on core samples obtained from the grade control drilling at the Koashva deposit (Khibiny massif). The samples are represented by the main types of the ANO rocks and textural and structural varieties. The ANO samples include the following structural varieties: striped, spotted, spotted-striped, lenticular-spotted, and textural variations related to the grain size of apatite.
The host rocks are represented by urtite, feldspar urtite, feldspar urtite–ijolite, ijolite, feldspar urtite–ijolite contact, and juvite.
The detailed examination is exemplified by the most typical rocks and ores for the ANO deposits of the Khibiny massif, and namely:
-
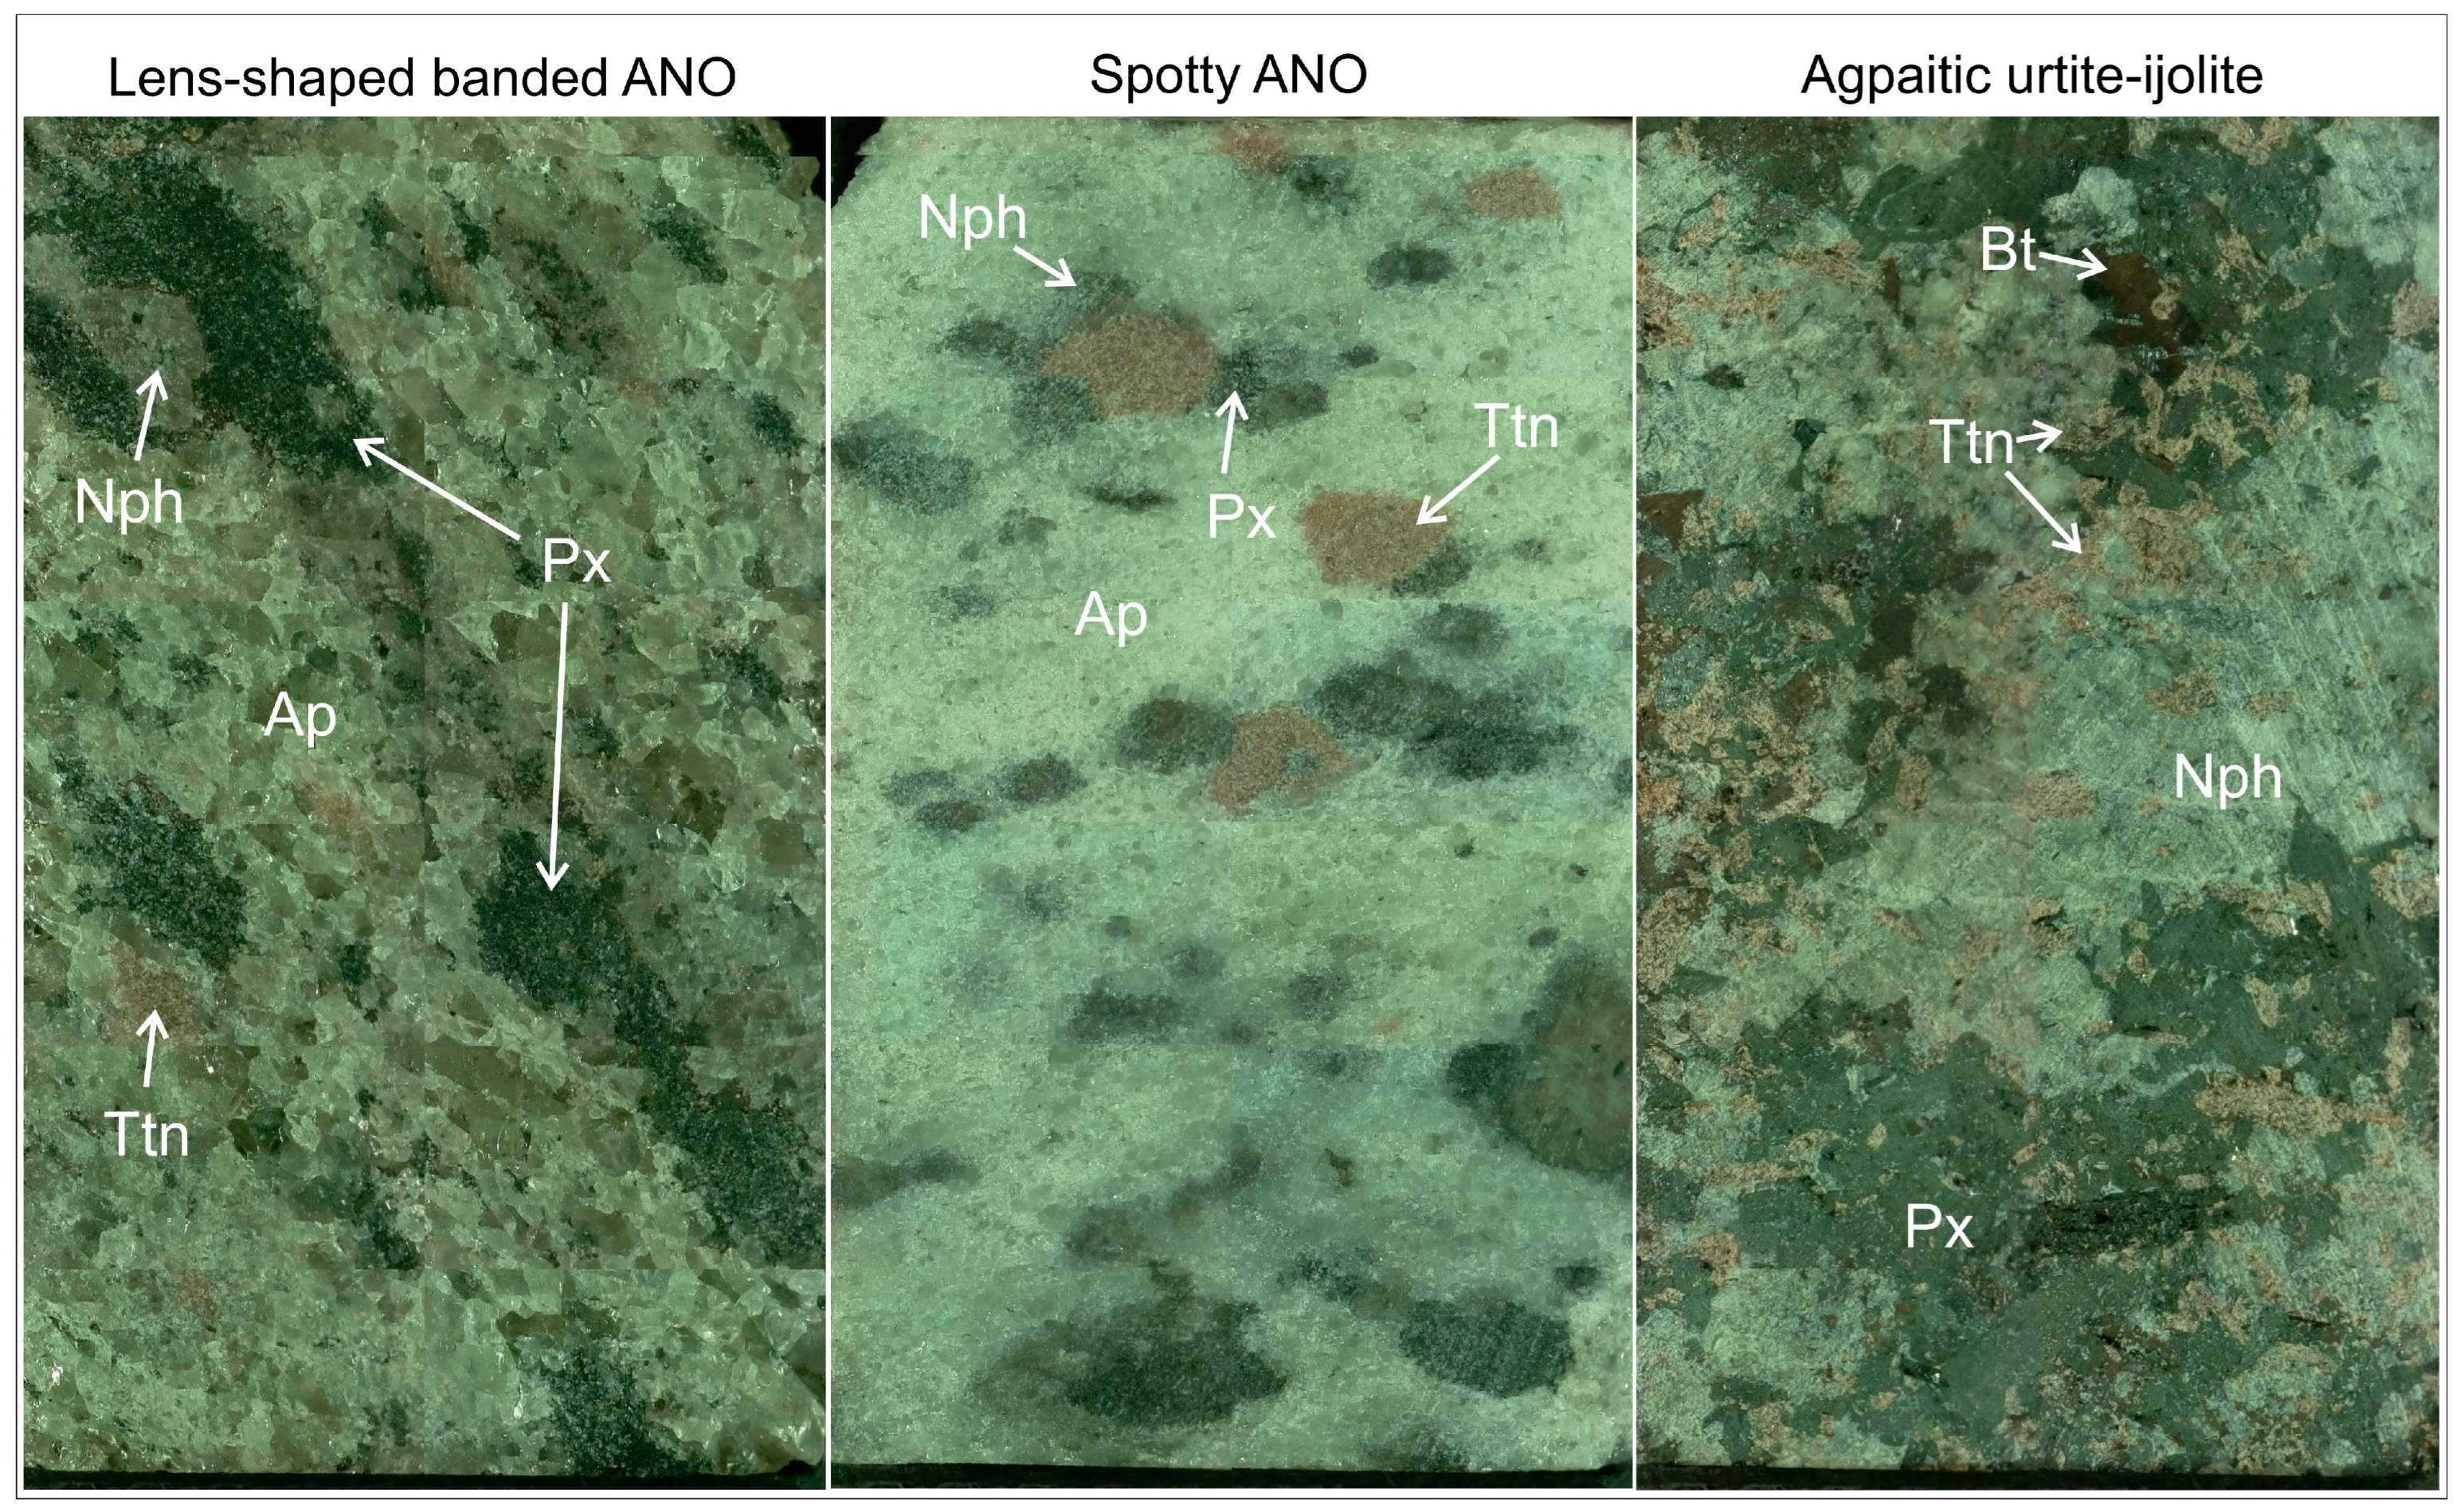
ANO with a taxitic, banded structure and a holocrystalline, inequigranular, and panidiomorphic-granular texture with elements of a poikilitic one;
-
ANO with a taxitic, spotty structure and a holocrystalline, inequigranular, and panidiomorphic-granular texture with elements of a poikilitic one;
-
Urtite–ijolite with a taxitic structure and a holocrystalline, inequigranular, hypidiomorphic-granular, and agpaitic texture (Figure 1).

2.2. Methods and Equipment

2.2.1. Systematization of Petrographic and Mineralogical Parameters of Ores and Rocks

To define the mineral composition of the samples, thin and polished sections were made. The study of ore minerals in transmitted and reflected light was conducted with an optical microscope Axioplane II (Carl Zeiss, Oberkochen, Germany). Also, the identification of minerals was carried out using the Raman spectrometer EnSpectr R532 with solid-state laser (532 nm) (by Spectr-M LLC, RAS Institute of Solid-State Physics, Chernogolovka, Russia) based on an Olympus BX43 optical microscope (by Olympus Corp., Tokyo, Japan).
The systematization of the Khibiny rocks and ores used in this study is based on their classification by mineral composition and textural and structural features, which have resulted from many years of geological surveys and mining development in this geographic area, as well as on the petrographic code [8]. The first stage involves sample grouping into ores, rocks, and contacts. The ores include samples with apatite content of >20% and a typical structure: spotty, banded, lens-shaped, reticulate, brecciated, block-shaped, and combinations thereof. The rocks represent such main Khibiny rock types as the urtite–ijolite–melteigite–jacupirangite series and their feldspar-bearing varieties, rischorrites, malignites, juvites, and nepheline syenites. A separate markup is provided for apatite-bearing rocks. The other parameters used for classification are structural and textural (grain size) features. They allow the choice of intermediate options, implying several names (e.g., lenticular-banded apatite ore). There is one more parameter for the description of ores and rocks, which concerns the type of the contained apatite: free, composing the ore matrix, and poikilitic, occurring in the form of inclusions in other minerals. This parameter may be important for the solution under development (varying/absent luminescence of the poikilitic apatite and related error) and for further processes of “deep” ore concentration (poikilitic apatite is harder to disintegrate; it comes to the apatite concentrate as intergrowths and degrades its quality [9]).

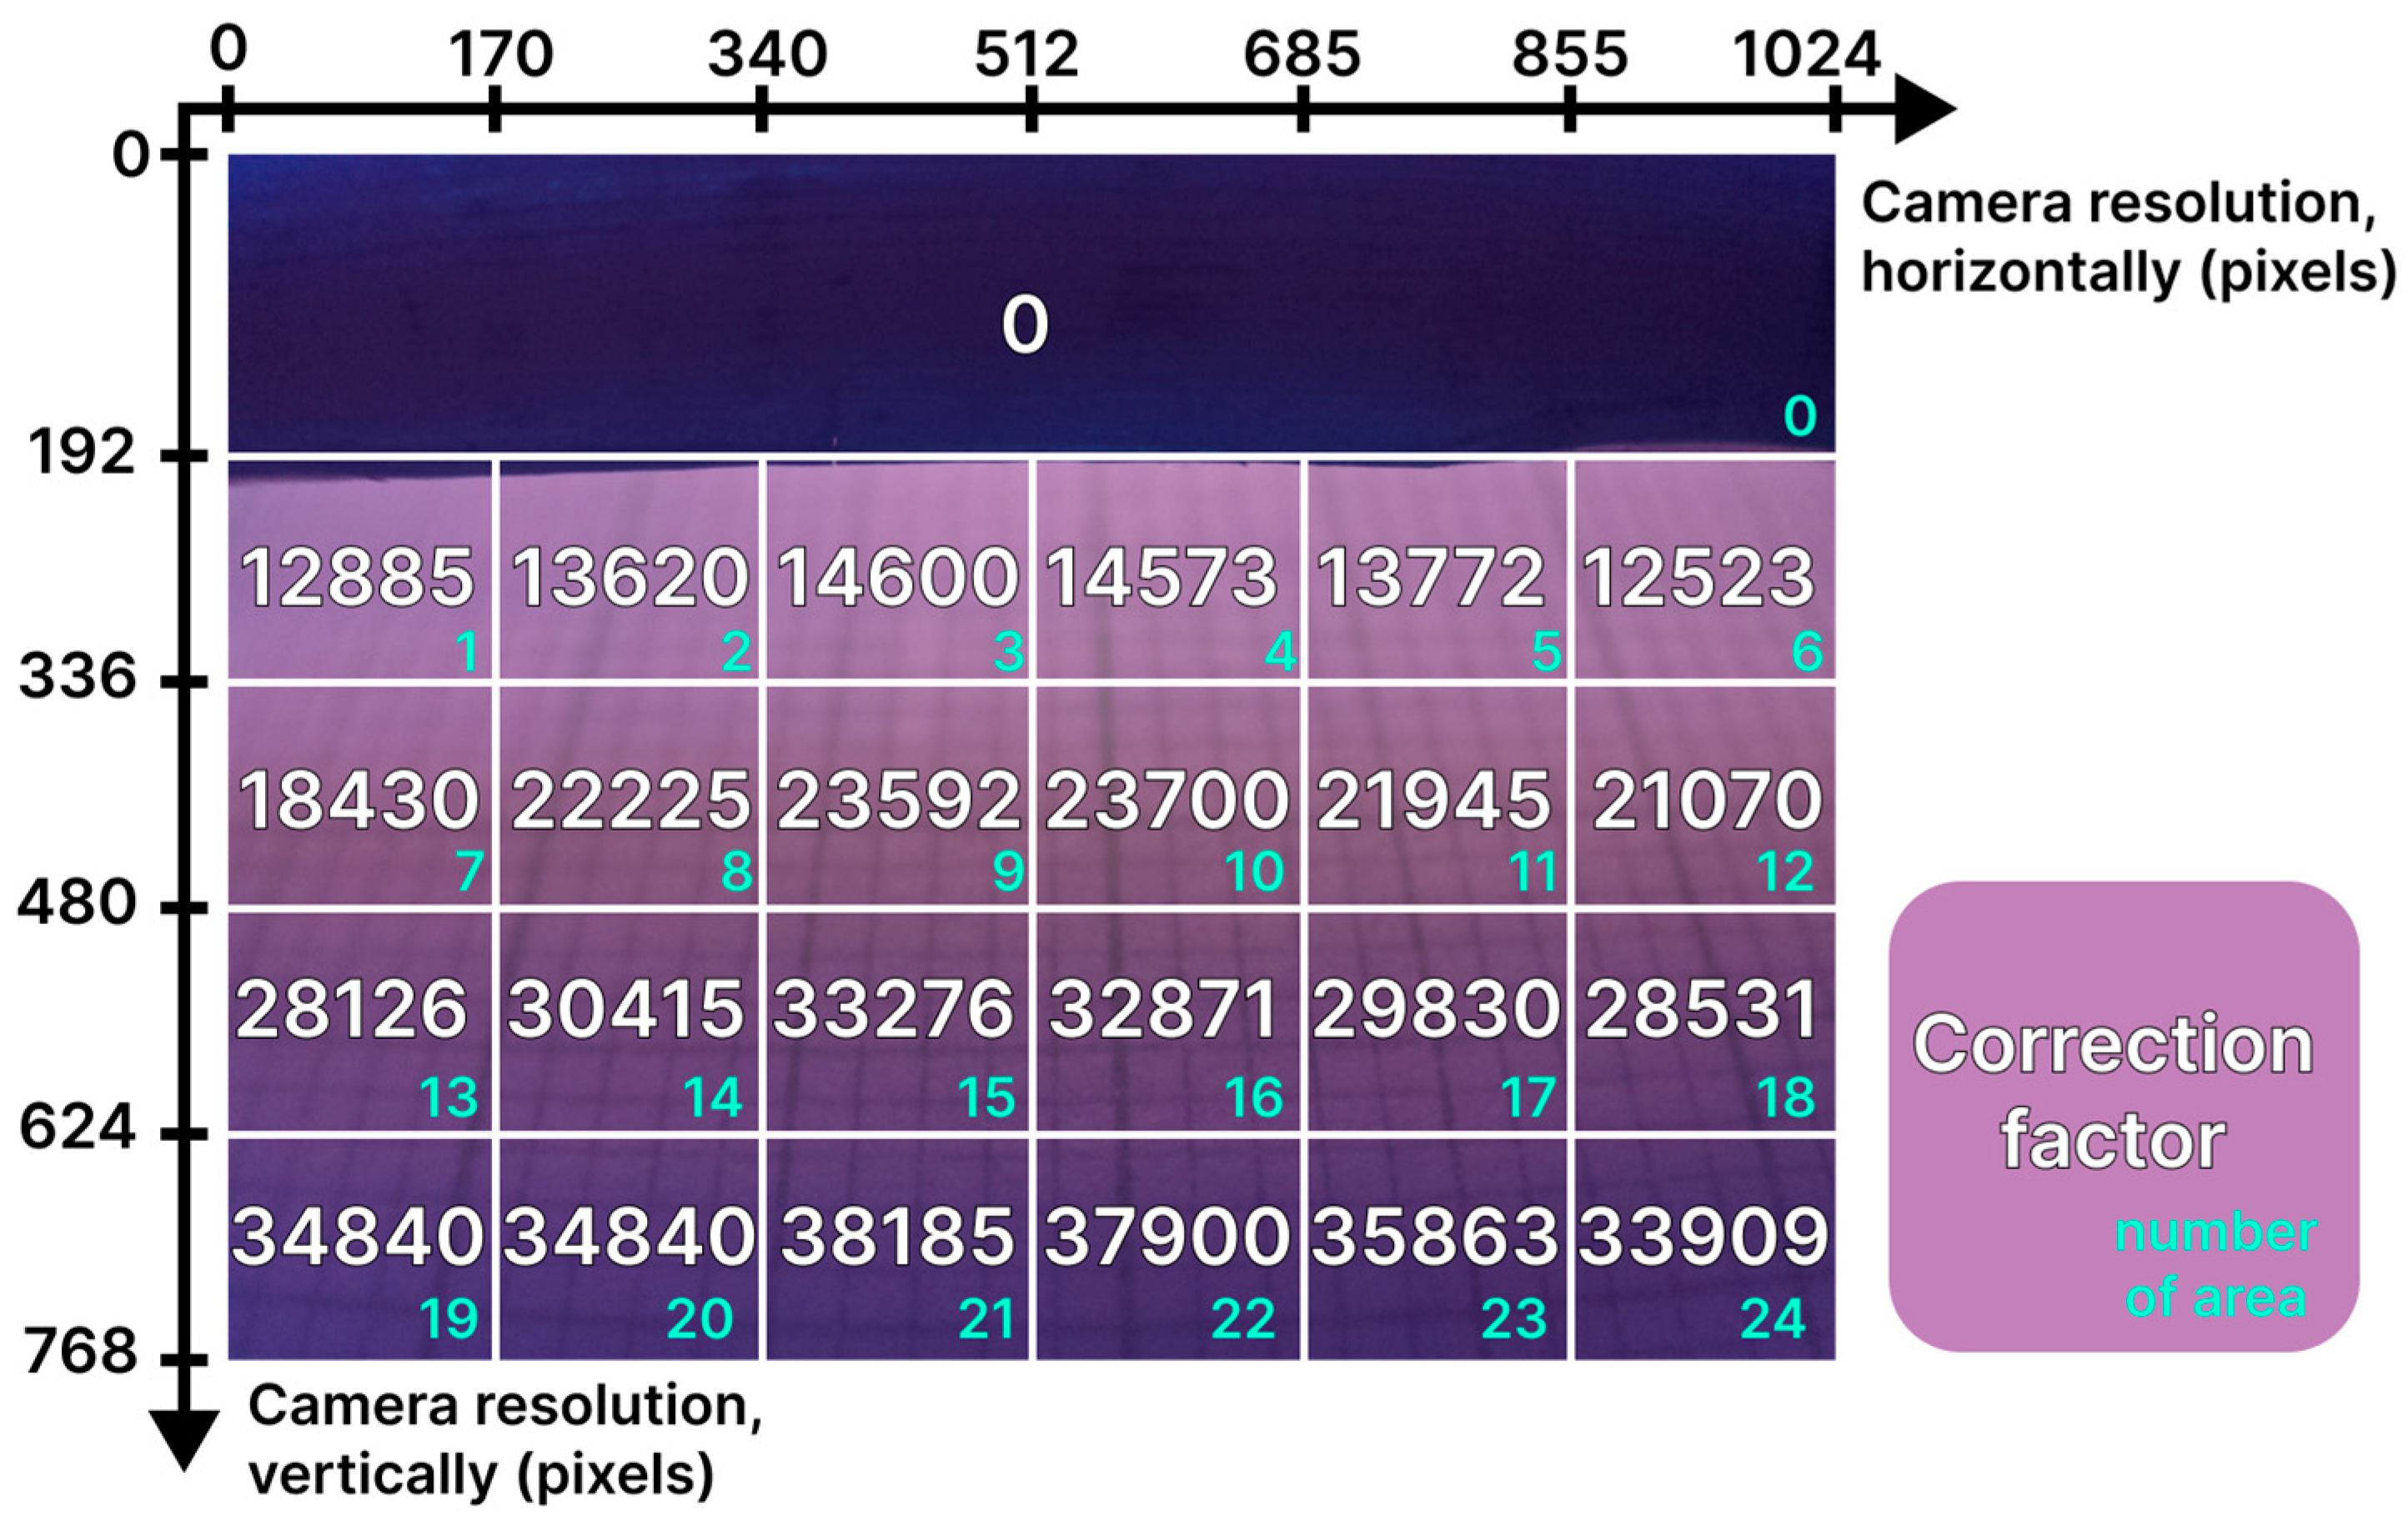
2.2.2. Hardware Solution for Studying HSV-Color Value of Main Ores and Rocks from the Khibiny Massif and Composing Minerals

The proposed hardware and software solution aimed at studying the HSV-color value of main ores and rocks from the Khibiny massif is driven by machine-based technologies. The HSV model is a color model where color rendition is defined by a set of the following color indices: H—Hue, S—Saturation, V—value. The HSV model is based on the RGB model (R—red, G—green, B—blue), but it has a different coordinate system: each color in this model is obtained by adding black or white color to the basic spectrum. For automated mineral recognition, an RGB-image obtained from regular cameras is used [10]. The authors note [10] that an alternative approach allows the achievement of better results due to the application of special equipment and domain-specific knowledge [11], but collecting data is time- and resource-consuming and requires high material costs.
The hardware part of the solution is based on the measuring stand for studying spectral characteristics (Figure 2). The surface of the core material (flat, rough core halves) is examined by a two-way sensor (or a video camera) in two modes that ensure the studying of such optical mineral features as color and luminescence. The color of minerals occurring on the core surface is analyzed when it is exposed to a visible light source. The luminescence of minerals is excited by long-wave ultraviolet light with a wavelength of 365 nm (Figure 2). The long-wave ultraviolet light source is equipped with a ZWB2 colored optical ultraviolet filter. The ZWB2 filter was used to highlight the required spectral area of the primary light source. In different regions of the spectral range, this filter has different transmittances. In the case where the transmission coefficient of colored optical glass is 40%, a spectral area in the range of 300 to 375 nm is detected; when the transmission coefficient reaches 80%, the spectral area is 325–375 nm.
The measuring chamber (Figure 2) is a light-insulated housing equipped with a core material movement system based on stepper motors. This system is designed to implement an automated measurement of the entire surface under study, taking into account the size of the areas of propagation of the primary radiation flux and the registration of secondary radiation by the detector in one cycle. The location and size of a mineral are analyzed by a video camera. The camera is located in such a way that the central axis of the light guide of monochromator and the central axis of the camera converge at a common point (Figure 2), providing the possibility of parallel measurements by these devices. Unfortunately, such camera positioning increases the image aberration (or distortion) [12].
To minimize this effect, the image is calibrated by correction factors calculating for individual image areas located at different distances from the camera axis. The use of a correction factor provides an increase in the accuracy of determining the real size of the analyzed area.
The correction factor is calculated through the ratio of the real object area measured in square centimeters, to the area occupied in the image measured in pixels.
The calibration results are combined into an “image map” (Figure 3), where a correction factor is assigned to each area. The area number is colored blue and is located in the lower right corner of the plot. The correction factor is displayed in the center of the area in white. The number of areas forming the image is determined by the researcher.
The size of an image map is determined by camera resolution, where the X-axis is the number of pixels horizontally and the Y-axis is the number of pixels vertically.
The image shown in Figure 3 is divided into 25 regions. The size of the zero area (N0) differs from the size of areas N1–24, because this area contains an image of a collimating device of a UV light source. This area (N0)) does not contain useful information for camera calibration. The boundaries of N1–24 areas are formed taking into account the achievement of the closest possible sizes to each other. According to the results of calibration it is acceptable to use 4 image areas for analysis, with N15, 16, 21, and 22 having the highest values of correction factors (pixel density per unit area) and insignificant deviations from each other.
The hardware system for controlling the process of moving core material in the space of the measuring chamber is based on the Arduino Nano controller board. A Raspberry pi 3 model B microcomputer was used to implement online control through a user interface that ensures interaction between the test bench hardware and the user.

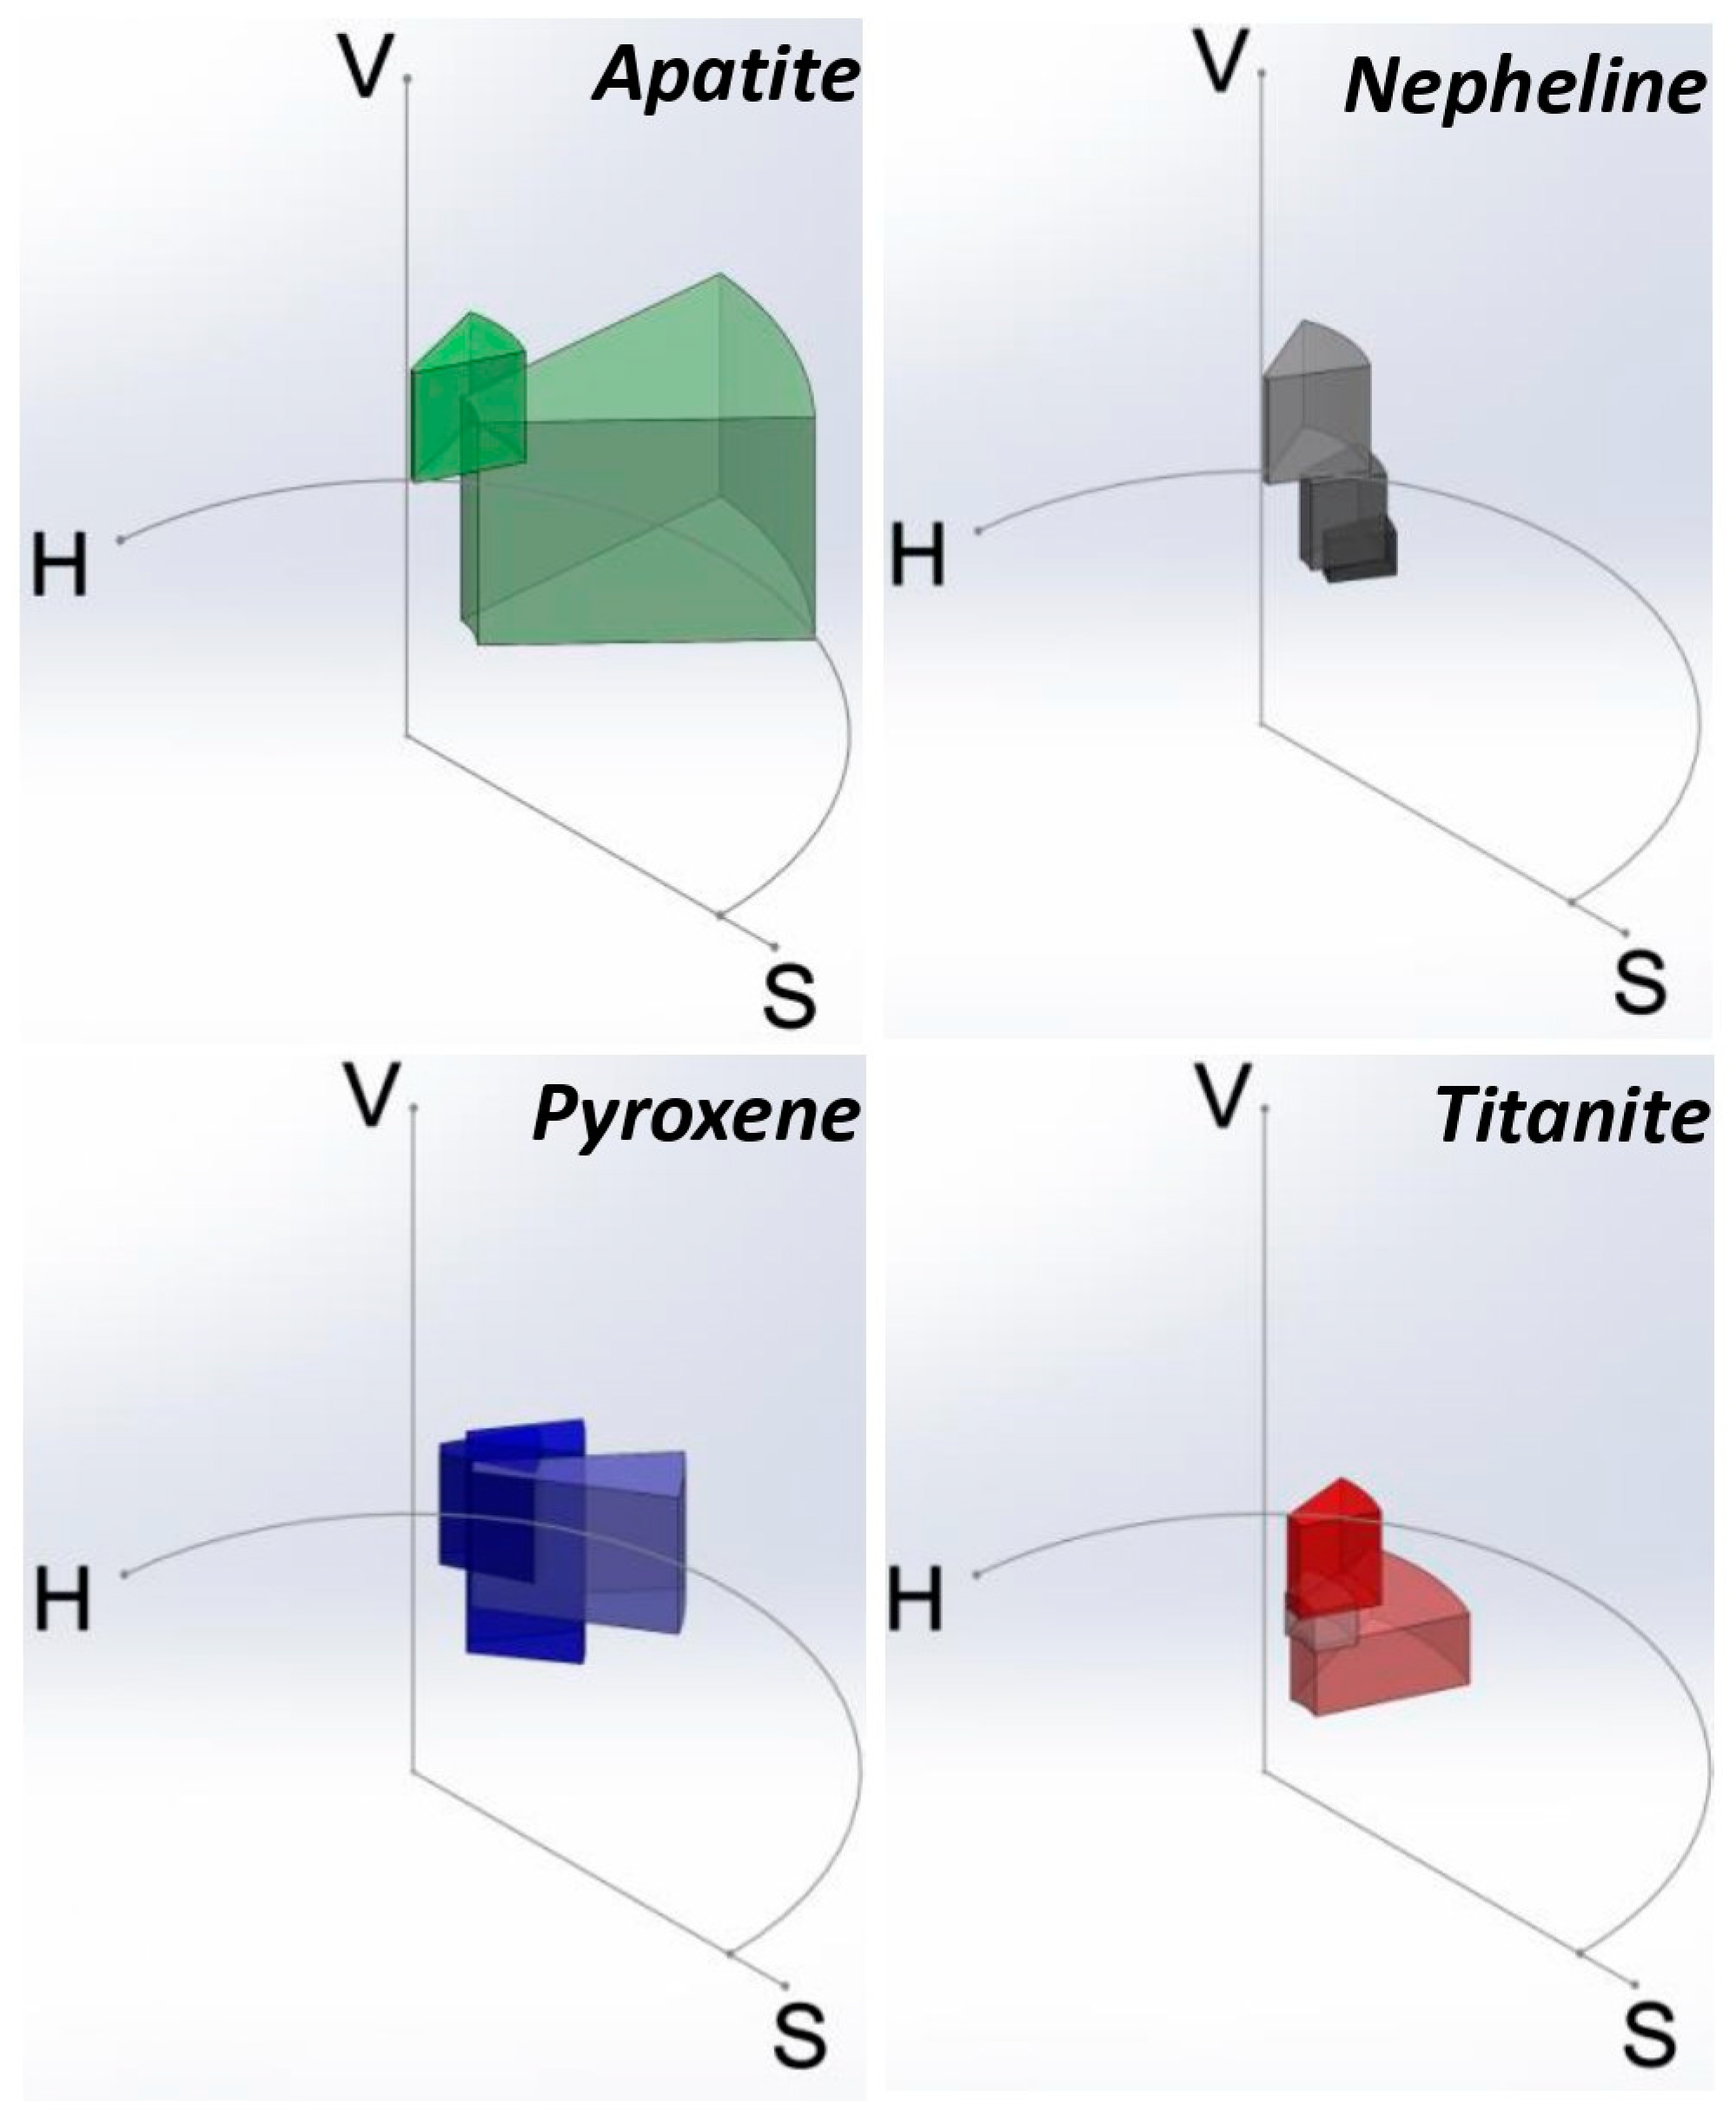
2.2.3. Analysis of HSV-Color Value of Minerals Occurring on the Surface of the Studied Samples

The mineral wealth of the Khibiny massif, multiple stages of its formation, and complications due to the diversity of geological processes define the rock alternation, altered zones, and fissuring zones caused by complex tectonics [13], which may be observed in the ore from the exploration borehole core even at a small area. Thus, to analyze the HSV-color characteristics of minerals located on the surface of the studied core samples, it is necessary to solve a problem of image segmentation for contouring areas with homogenous mineral composition (or the HMCA).
The determination of the HMCA is performed by marking images of the core surface obtained in the visible spectral range. The basis for this markup is the data of visual analysis of the core material and the assessment of morphological features of minerals and their optical (color, luster), mechanical (hardness), and magnetic properties, as well as a microscopic study of thin and polished sections.
The results of the investigation of HSV-color value in minerals are visualized in a cylindrical coordinate system, where the H-coordinate (Hue) is defined by a polar angle, the S-coordinate (Saturation) by a radius vector, and the V-coordinate (Value) by a Z-coordinate.
For contouring the HMCA, a binarization algorithm, which is perfect for image processing [14,15,16,17,18], including photos of the core surface, is applied. The binarization process is the conversion of a color image or a grayscale image into a black and white one. This image transformation is based on comparing the HSV-color characteristics of each pixel with a threshold value. The threshold value is set by the user. After comparison with the coordinates of the used HSV-color model, each pixel of the analyzed image is assigned 1 or 0; 1 is assigned to the area with the searched object (whose values are higher than the set threshold values) and 0 to the background.
To improve the accuracy of the measurements, binarization with a double limitation of upper and lower threshold filters was applied to reduce the range of HSV coordinates determined to belong to the searched object. As a result of binarization, the searched object, in our case HMCA, is displayed in a white color, and the other regions located outside the HMCA boundaries are colored in black.
The implementation of the global image binarization method with a color threshold filter in the Python programming language is presented in the official documentation for the Open CV computer vision library [19].

3. Results

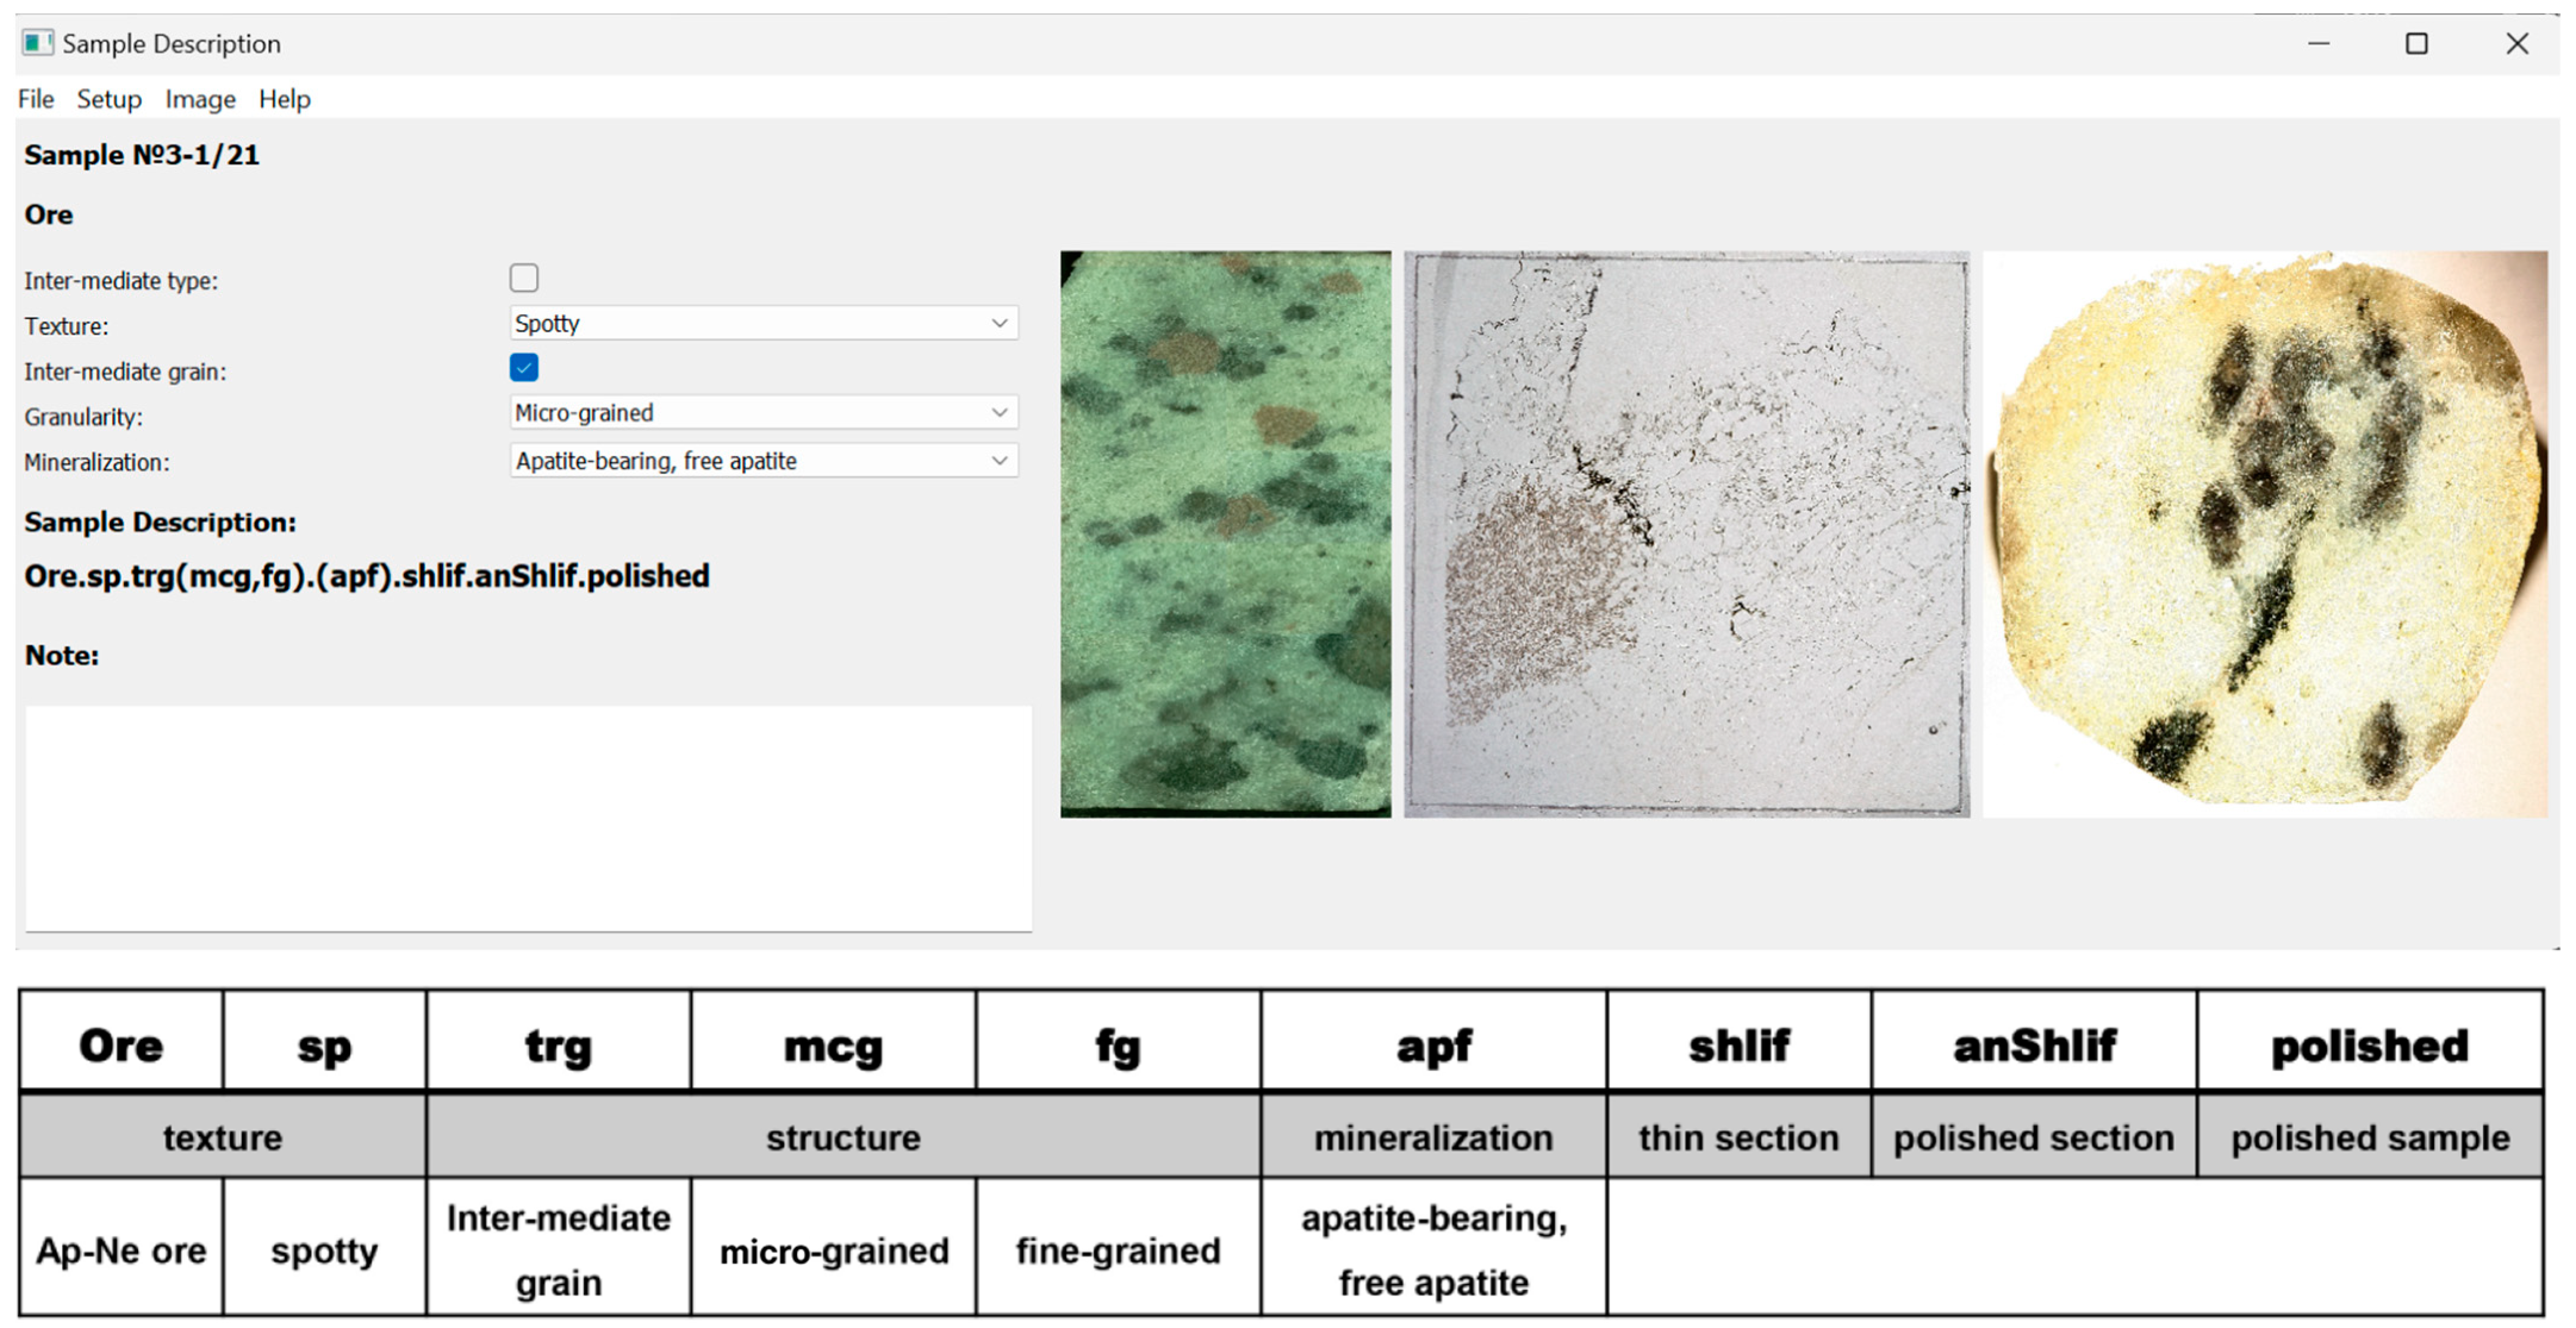
3.1. Cross-Platform Application: “Core Material Analysis”

The cross-platform application called “Core Material Analysis” is the software implementation of the spectral characteristic investigation for the ANO main types and textural and structural varieties. This Python-based application has an intuitively understandable user interface that allows the user:
-
To control the measurement process (by moving the core material through the analysis zone, camera calibration, and image recording);
-
To create and systematize the description of the textural and structural features in the studied sample;
-
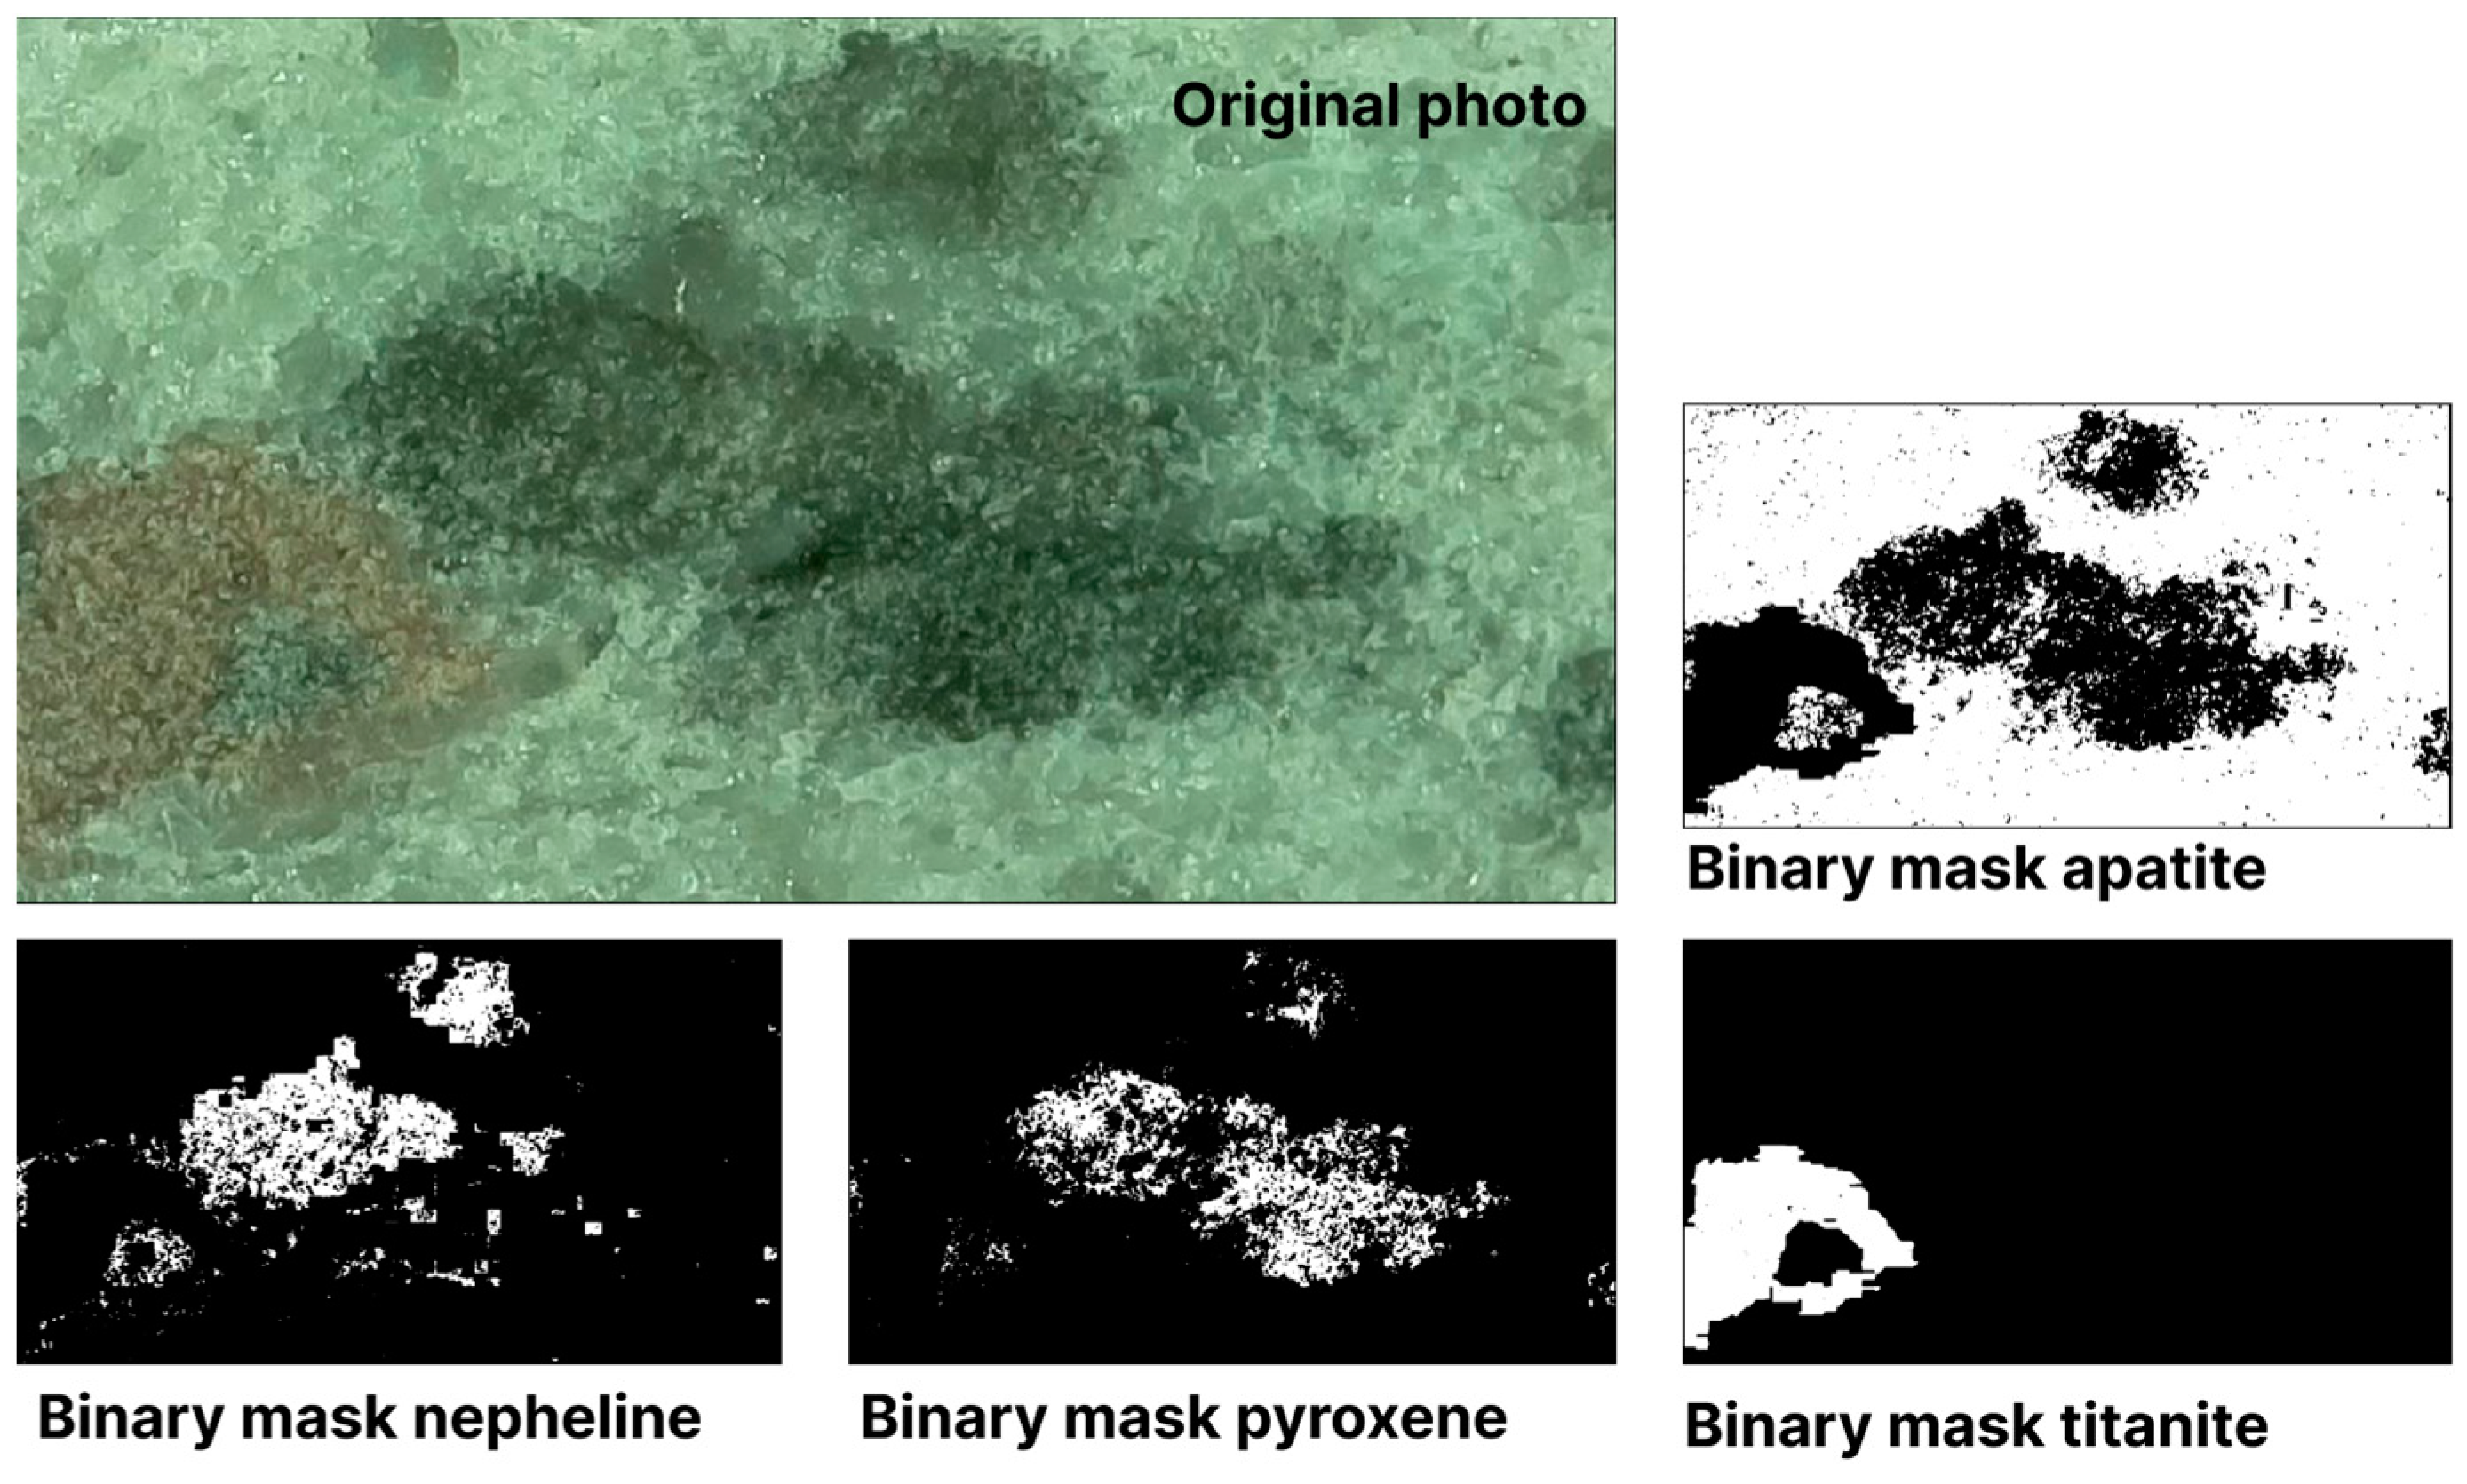
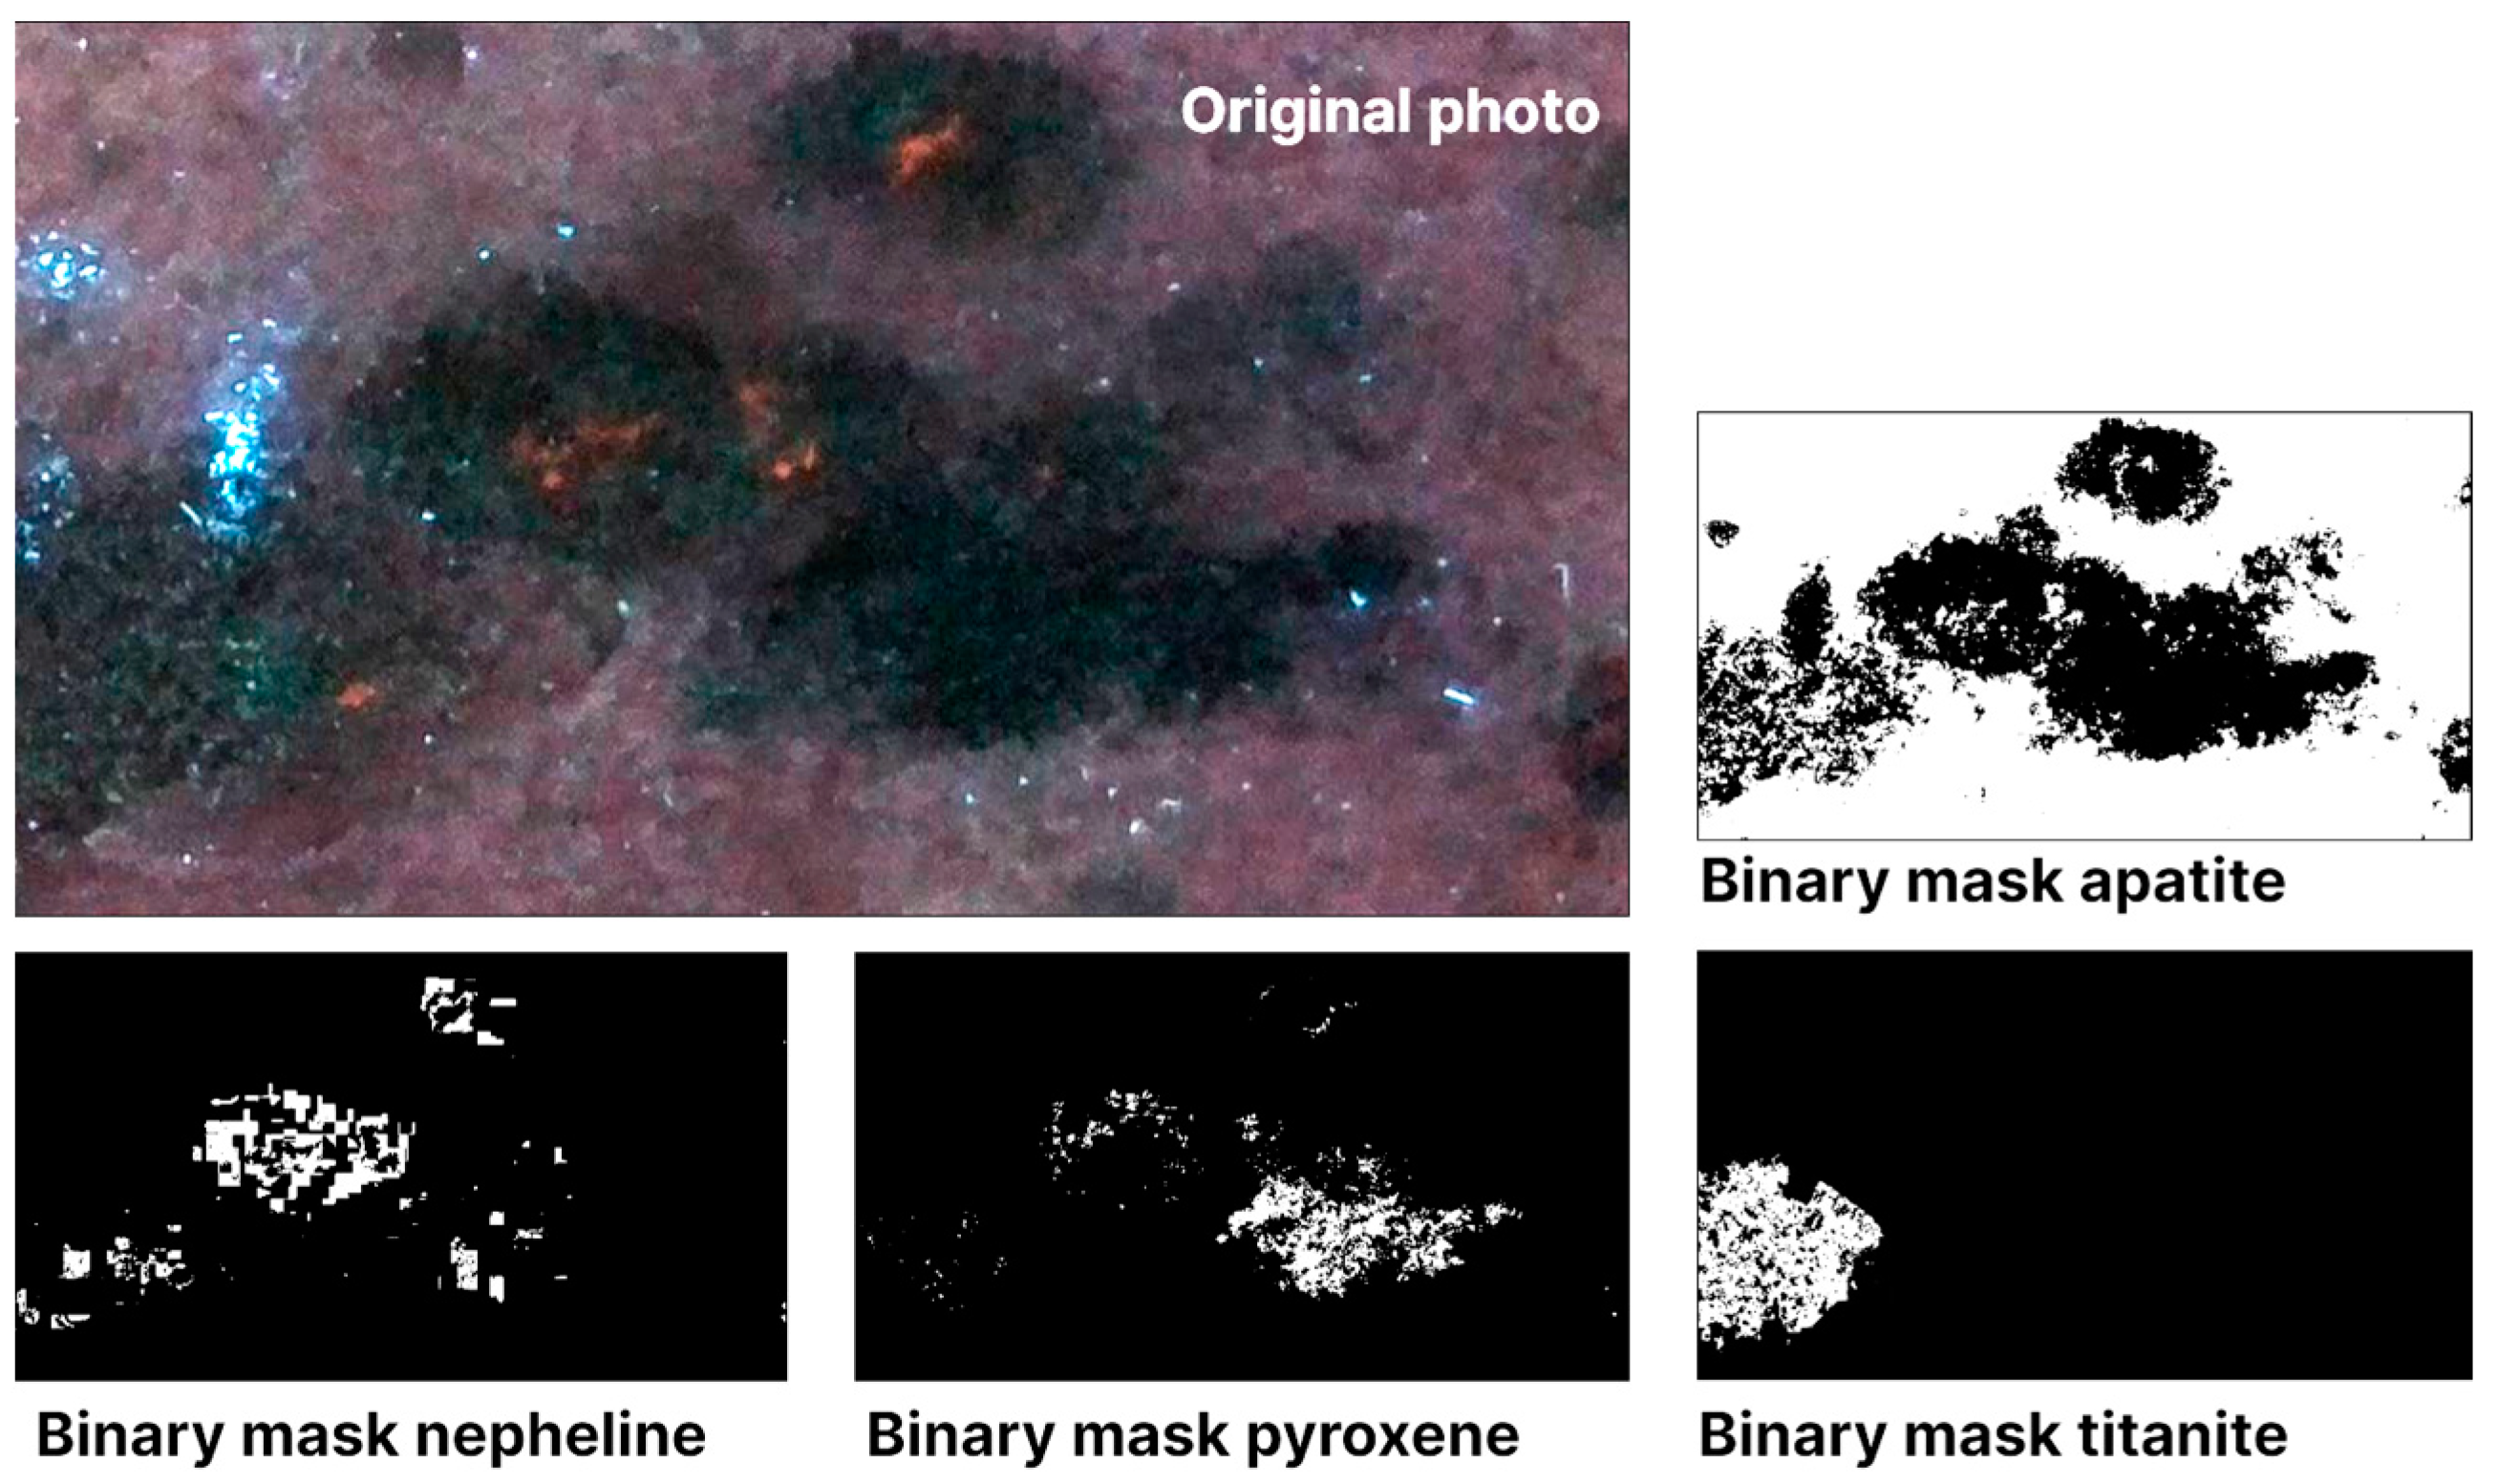
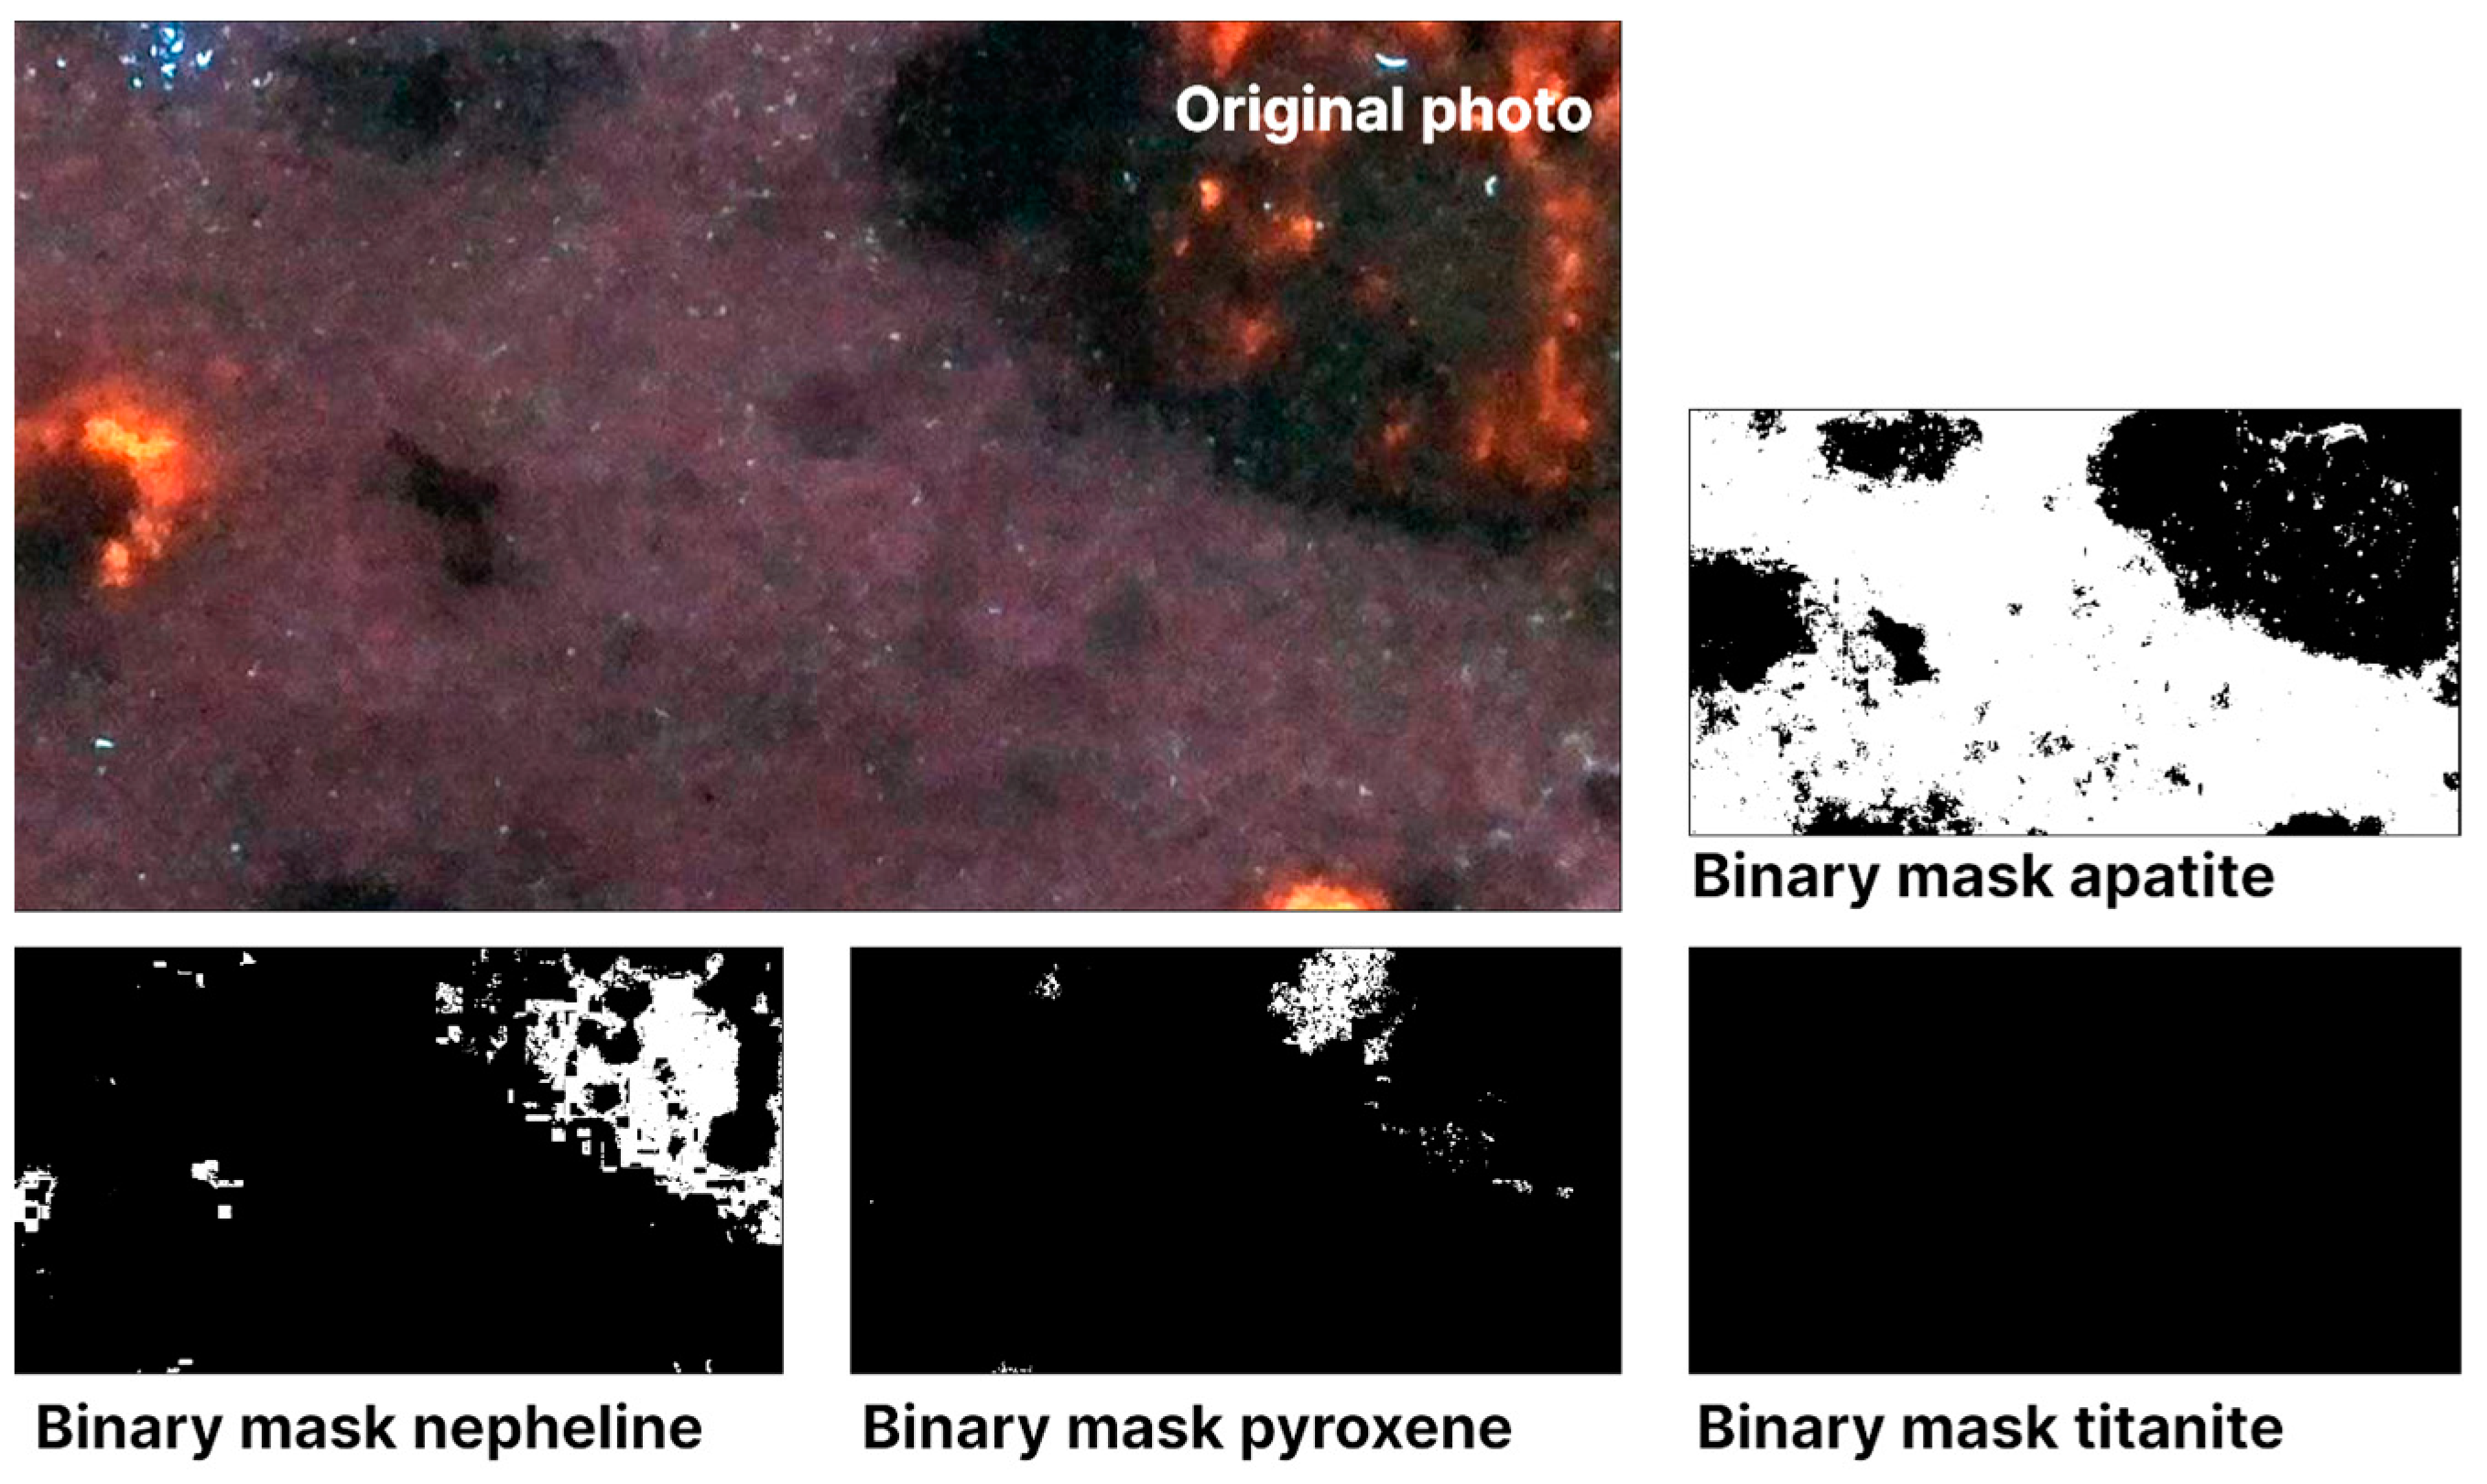
To process core surface images (by identifying structural units by their HSV-color characteristics, visualizing the results and reference markups, and demonstrating statistical information about the mineral to the user).
Figure 4 shows the layout of the database, which is created for the HSV-color characteristics of minerals (extracts for neural network learning). The resulting database will allow the application of computer vision techniques and deep learning algorithms (neural networks) to analyze the distribution of ores and rocks in the borehole by depth. The use of this information will provide predictions of the quality of mined minerals by a single well and by a network of wells in the block being prepared for stripping, as well as the selection of measures for the technological control of the quality of ore mass transported to the processing plant.
The minerals that occur on the sample surface are required to be ascribed to an exactly defined textural and structural type, and this is explained by the wide variability of their color palette depending on their affiliation. For example, the color of apatite depends on the structural features and grain size of the ore. The available apatite color differences perceived by the human eye (pale-bluish hue of apatite) are explained in [20] by the dispersed absorption of crystals in the violet part of spectrum. The absorption in the areas of 400–450 nm and 550–750 nm (green, yellow-green, and yellow) is caused by the Fe2+ → Fe3+ transition [21]. These absorption areas may be superimposed by the absorption bands of the Mn2+ center. There are also thermally sensitive absorption bands related to spot faults. The high optical density of smoky and black apatite from the Khibiny deposit is accounted for by the light dispersion by inclusions that result in the effect of total internal reflection [22].
The definition of petrographic varieties and forms of valuable components is performed in order to accumulate and use geological data for predicting the spatial distribution of the valuable component, including its quantification. At present, for the in-process assessment of quality features for the borehole bottom, a compliance table of natural apatite-ore types (varieties) composing the Khibiny massif and their average P2O5 values is being used. It is emphasized [23] that the application of such an approach is only possible where an ore body is composed of ore types with a persistent average content of components throughout the deposit and with clear borders between the ore types. A quantitative assessment of the simple visual diagnostics of minerals in raw samples is presented in [10]. Even in the case that the simple visual diagnostics are executed by experienced mineralogists, the error may reach 10%–20%.
Figure 5 exemplifies the accumulation of source data for a studied sample, including the affiliation to a natural ore type, the description of the structure and texture, the type of the constituent apatite, and additional information about the sample surface and the availability of preparations for an instrumental analysis. As a result, a sample receives a unique identifier: Ore.sp.trg (mcg, fg).(apf).shlif.anShlif.polished. The unique identifier is deciphered in Figure 5.
The unique identifier of the sample generated from a list of unified characteristics that systematize the textural and structural features of the described material allows the implementation of a comparative analysis of the HSV-color value of minerals on the surface of samples with the similar textural and structural features and the identification of analytical markers, and also provides the convenience of searching.
The boundaries of the HSV-color range (or the HMCA boundaries) in the designed software are determined by means of a separate module, which is similar to the one described in [14,24]. The setting of the ranges changes the limits of each HSV-color coordinate’s values, which are the threshold values determined by moving the program sliders (Figure 6). The result of binarization is visualized in a real time mode, providing the convenience and ease of selecting threshold values. A white field on the binary mask corresponds to the location of the apatite. Having achieved the desired result (an ideal/close match of the HMCA boundaries and contours formed by HSV values), the user imports the boundary HSV values into the main software solution, where the image is automatically transformed. This personalized setting of threshold filters allows the consideration of the features of the camera used and characteristics of the primary radiation sources, as well as secondary radiation (luminescence) resulting from their interaction with the sample surface. It is worth noting that the accumulation of a database (a training set) is implemented by means of expert markups of the core surface images (in the visible light range) based on the assessment of such physical properties of minerals as coloration, luster, cleavage, and hardness.

3.2. Results of the Analysis of HSV-Color Value in Minerals Occurring on the Surface of the Studied Samples

3.2.1. Visible Light Range

Figure 7 demonstrates binary masks resulting from the mineralogical mapping. It includes the definition of the HMCA boundaries by the values of the upper and lower threshold filters (or HSV-color values) and is exemplified by a sample of spotty apatite–nepheline ore. A white field on the binary mask corresponds to the location of the target HMCA.
Table 1 presents the HSV-color values of minerals obtained from the analysis of the core surface images being exposed to a visible light source. The analyzed samples are represented by the varieties of the apatite–nepheline ore (apatite ore with lens-shaped banded and spotty structures) and host rocks (agpaite urtite–ijolite).
The accepted parameters for recording images of the core surface and the binarization method used for image segmentation with double restriction (upper and lower threshold filters) make it possible to form individual binary masks of minerals based on HSV-color values. Problems of the apatite and nepheline separation have been noted for cases of their co-existence in spots composed of a fine-grained mixture of hard-to-diagnose minerals and medium–coarse crystalline grains of apatite.
The results presented in Table 1 confirm the variability of the apatite color palette depending on its affiliation to a textural–structural type. The H (Hue) values, which determine the affiliation to a section of the color space for the two presented textural–structural ANO varieties occupy the orange-yellow zone of the spectral range with insignificant displacements relative to each other (Figure 8). The range of changing S (saturation) and V (value) parameters is more than twice as wide for a medium-grained apatite from the lens-shaped banded ANO (Sample 1/21) compared to a fine-grained apatite from the spotty ANO (Sample 3-1/21).
The HSV-color value of dark-colored minerals from the Khibiny massif demonstrates the consistency of their coloration when found in various mineral associations (Figure 8).

3.2.2. Ultraviolet Light Range

Figure 9 presents binary masks resulting from the mineralogical mapping of the ANO sample surface areas with a spotty structure by an image obtained due to the exposure of its surface to an ultraviolet light source. A white field on the binary mask corresponds to the location of the HMCA. The numerical HSV-color values for the HMCA located on the surface of the studied samples are given in Table 2.
In the core surface images obtained due to the exposure to an ultraviolet light source, the HSV values of apatite allow the creation of an individual binary mask for it and ensure its reliable separation from the other rock-forming minerals presented in this sample (nepheline, pyroxene, or titanite). However, the proximity of the HSV value ranges for nepheline and pyroxene prevents them from being separated and creating their individual binary masks.

4. Discussion

One of the main tasks solved by means of the hardware and software solution is the generation of a training set, which includes a database of HSV-color values of minerals from the Khibiny massif with due regard to their textural and structural features. The identification of criteria for attribution to a natural type and textural and structural variety of ANO will increase the accuracy of predicting the amount of the valuable component (apatite).
It is worth noting that the addition of new textural and structural types of rocks and ores, as well as new parameters for classification, is envisaged as the data are accumulated. Such dynamic systematization will allow the maximum number of various types of rocks and ores from the Khibiny deposits to be covered, determining the strengths and weaknesses of the method under development, and establishing criteria that affect the accuracy of the analysis.
The analysis of the performed digital mineralogical mapping of structural units located on the surface of samples according to their HSV-color characteristics using the hardware and software solution called “Core material Analysis” indicates an increased efficiency of the contouring process due to the analysis of two optical characteristics of the mineral. These are the color of the mineral and color of its luminescence excited by an ultraviolet light source with a maximum wavelength of 365 nm (Figure 10).
The problems of apatite and nepheline separation observed when exposed to a visible light source are excluded during the mineralogical mapping of images obtained when the sample surface is exposed to a UV light source. The application of a UV source with a maximum wavelength of 365 nm provides an intensification of the differences in the HSV-color value of apatite and nepheline. The amplified contrast of properties is caused by the difference between absorption and reflection. Nepheline reflects emission at the boundary of the visible light range, capturing the border areas of the ultraviolet range and the violet region of the visible light range, while apatite absorbs part of this range and contributes to the color characteristics with its fluorescence. The availability of narrow bands with maxima of 568 nm and 581 nm, 602 nm and 608 nm, and 648 nm in the luminescence spectra of apatite presented in [1] and their absence in nepheline provide a shift in the color palette of minerals from the blue-green region of the visible light range for nepheline to pink-violet for apatite.
An approach used in the cross-platform application called “Core Material Analysis” to analyze certain regions instead of the whole surface of the core sample allows:
-
The amount of images in the training set to be increased;
-
The quality of analysis for each image to be improved;
-
Any errors to be identified and a comparative assessment executed of color characteristics for the HMCA distinguished in various core regions.
The size of the analyzed area is determined from the size of the camera’s field of view and conditions for selecting the areas that compose it, with the closest possible values of the number of pixels per square centimeter.
It is worth mentioning the convergence of the previously obtained results for the study of the color indicators on the monomineral fractions [1] and HSV-color characteristics of the minerals occurring on the surface of the core samples. The surfaces of the flat core halves were not subject to pre-treatment. The established data convergence allows for the assessment of the feasibility and efficiency of applying the luminescence color as one of the criteria for identifying apatite in the ANO mineral mixture of the Khibiny massif on something close to the target object, which is the surface of the blasting borehole wall.

5. Conclusions

This paper presents a stage of investigation which aims at searching for criteria and their application for the in-process identification of the Khibiny apatite in the mineral mix, and solves the problem of the digitization of the mineralogical mapping process using the cross-platform application called “Core Material Analysis”.
The efficiency of the HMCA contouring digitalization and automation are achieved due to the following:
-
The systematization of primary information about the core sample used (affiliation to the type of ore and/or rock, textural and structural characteristics of the constituent minerals, the form of apatite, etc.), which allows taking into account the variability of the color palette of apatite depending on its ore affiliation and granularity;
-
The generation of a training set based on expert markups of the core surface images (in the visible light range) relied upon the assessment of such physical properties of minerals as coloration, luster, cleavage, and hardness;
-
The analysis of two optical characteristics of the mineral, including the color of the mineral and color of its luminescence excited by an ultraviolet light source with a maximum wavelength of 365 nm.

Author Contributions

Systematization of petrographic and mineralogical parameters of ores and rocks, A.A.K. and D.O.V. Literature review, D.N.S. and A.A.K. Illustration preparations, D.N.S., A.A.K. and D.A.A. Software implementation of the process of sample description and image processing, R.P.V. Selection of image registration parameters, image registration, D.O.V., R.P.V., V.V.B. and D.A.A. All authors have read and agreed to the published version of the manuscript.

Funding

This research was funded by RSF (project No. 22-27-20153).

Data Availability Statement

Data are contained within the article.

Acknowledgments

The authors thank A.S. Rybnikova for checking the English and are grateful to the anonymous reviewers and the Editor for their help in improving this paper.

Conflicts of Interest

The authors declare no conflicts of interest.

References

  1. Shibaeva, D.N.; Kompanchenko, A.A.; Bulatov, V.V.; Asanovich, D.A. Express Assessment of Apatite Content in Apatite-nepheline Ores of Ultrabasic Alkaline Complexes Based on its Luminescent Properties (the first study stage). Minerals 2023, 13, 37. [Google Scholar] [CrossRef]
  2. Gorobets, B.S.; Rogozhin, A.A. Luminescence Spectra of Minerals. Guidebook; VIMS: Moscow, Russia, 2001; p. 316. ISBN 5-901837-01-0. [Google Scholar]
  3. Tereshchenko, S.V. Scientific Bases of Luminescent Separation of Mineral Raw Materials. Ph.D. Thesis, Saint Petersburg Northwestern State Technical University, Saint-Petersburg, Russia, 4 October 2005. [Google Scholar]
  4. Rassulov, V.A. Luminescent Spectrometry of Zircon, Fluorite, Scheelite and Apatite as an Indicator of the Ore-Formational Type of Deposits. Ph.D. Thesis, Russian State Geological Prospecting University, Moscow, Russia, 22 December 2011. [Google Scholar]
  5. Votyakov, S.L.; Borisov, D.R.; Kholodnov, V.V.; Chashchukhina, V.A.; Krasnobaev, A.A. Luminescence as a basis for typification of apatites from various rocks and ores of the Urals. Yearbook 1995, 1996, 74–78. [Google Scholar]
  6. Yan, Q.; Liu, Z.; Guo, Y. Study on Fluorescence Properties of Green-Blue Apatite. Crystals 2022, 12, 866. [Google Scholar] [CrossRef]
  7. Prozorova, G.V. Analysis of rock void space from digital core photographs using computer vision algorithms. Bulletin of the Russian New University. Ser. Complex Syst. Models Anal. Manag. 2021, 4, 48–57. [Google Scholar] [CrossRef]
  8. Petrographic Code of Russia. Magmatic, Metamorphic, Metasomatic, and Impact Formations, 3rd ed.; Sharpenok, L., II, Ed.; Corrected and Supplemented; VSEGEI Publishing House: St. Petersburg, Russia, 2009; p. 200. [Google Scholar]
  9. Neradovsky, Y.N.; Kompanchenko, A.A.; Chernyavsky, A.V. Texture and Mineral Composition of Magmatic Apatite-Nepheline Ores: Technological Consequences (Exemplified by Khibiny). In Proceedings of the IOP Conference Series: Earth and Environmental Science, Online, 10–12 January 2022; p. 032031. [Google Scholar] [CrossRef]
  10. Nesteruk, S.; Agafonova, J.; Pavlov, I.; Gerasimov, M.; Latyshev, N.; Dimitrov, D.; Kuznetsov, A.; Kadurin, A.; Plechov, P. MineralImage5k: A benchmark for zero-shot raw mineral visual recognition and description. Comput. Geosci. 2023, 78, 105414. [Google Scholar] [CrossRef]
  11. Plechov, P.Y.; Trousov, S.V.; Bychkov, K.A.; Konovalova, K.A. Multilayered mineralogical information in spectroscopy of minerals. In Proceedings of the XIX International Meetingon Crystal Chemistry, X-ray Diffraction and Spectroscopy of Minerals, Apatity, Russia, 2–8 July 2019; p. 43. [Google Scholar]
  12. Volotov, E.M.; Nesterov, S.V.; Mitrofanov, I.V.; Akimenko, T.A.; Efimov, A.N.; Kokorina, S.B. Method of elimination of the distortions of the image brought at the expense of the video camera lens distortion. Izv. Tula State Univ. Tech. Sci. 2018, 12, 283–291. [Google Scholar]
  13. Zhirov, D.V. New interpretation of the Khibiny foidolite complex tectonics and resourse potential of phospates. Proc. Fersman Sci. Sess. GI KSC RAS 2020, 17, 184–189. [Google Scholar] [CrossRef]
  14. Tudić, V.; Kralj, D.; Hoster, J.; Tropčić, T. Design and Implementation of a Ball-Plate Control System and Python Script for Educational Purposes in STEM Technologies. Sensors 2022, 22, 1875. [Google Scholar] [CrossRef] [PubMed]
  15. Ershov, E.I.; Korchagin, S.A.; Kokhan, V.V.; Bezmaternykh, P.V. A generalization of Otsu method for linear separation of two unbalanced classes in document image binarization. Comput. Opt. 2021, 45, 66–75. [Google Scholar] [CrossRef]
  16. Tabbone, S.; Wendling, L. Multi-scale binarization of images. Pattern Recognit. Lett. 2003, 24, 403–411. [Google Scholar] [CrossRef]
  17. Shaikh, S.H.; Maiti, A.K.; Chaki, N. A new image binarization method using iterative partitioning. Mach. Vis. Appl. 2013, 24, 337–350. [Google Scholar] [CrossRef]
  18. Ma, X.; Zhang, P.; Man, X.; Ou, L. A New Belt Ore Image Segmentation Method Based on the Convolutional Neural Network and the Image-Processing Technology. Minerals 2020, 10, 1115. [Google Scholar] [CrossRef]
  19. Open, C.V. Changing Color Spaces. Available online: https://docs.opencv.org/4.x/df/d9d/tutorial_py_colorspaces.html (accessed on 9 October 2022).
  20. Kostyleva-Labuntsova, E.E.; Borutsky, B.E.; Sokolova, M.N.; Shlyukova, Z.V.; Dorfman, M.D.; Dudkin, O.B.; Kozyreva, L.V. Mineralogy of the Khibiny Massif (Minerals); Nauka Pubish: Moscow, Russia, 1978. [Google Scholar]
  21. Marfinin, A.S.; Mineeva, R.M.; Mkrtchyan, A.R. Optical and Mössbauer spectroscopy of iron in rock-forming silicates. Izv. AS USSR Ser. Geol. 1967, 10, 86–102. [Google Scholar] [CrossRef]
  22. Dudkin, O.B. About the nature of characteristic coloring of some minerals in alkaline rocks and pegmatites. Mater. Mineral. Kola Peninsula 1967, 5, 169–184. [Google Scholar]
  23. Bulanova, Z.F. Testing of the Kukisvumchorr apatite deposit by ore types. Notes Leningr. Order Lenin Labor Red Banner Min. Inst. Named G.V. Plekhanov 1959, XXXVI, 84–94. [Google Scholar]
  24. Geiger, L.; Team, P. Larq: An Open-Source Library for Training Binarized Neural Networks. J. Open Source Softw. 2020, 5, 1746. [Google Scholar] [CrossRef]
Figure 1. Samples in this research: the ANO and host rocks in the deposits of the Khibiny massif (Kola Peninsula, Russia). Ap—fluorapatite, Bt—mica, Nph—nepheline, Px—pyroxene (aegirine-augite), Ttn-titanite.
Minerals 14 00186 g001
Figure 2. Stand for studying the spectral characteristics of the main types and textural and structural varieties of apatite–nepheline ores: 1, monochromator with light guide; 2, UV light source with a collimating device; 3, video camera; and 4, test sample.
Minerals 14 00186 g002
Figure 3. The example of Image Map.
Minerals 14 00186 g003
Figure 4. Layout of the HSV-color value database.
Minerals 14 00186 g004
Figure 5. Software window for the accumulation of source data on the studied sample.
Minerals 14 00186 g005
Figure 6. Software window for the generation of binary masks for the studied minerals.
Minerals 14 00186 g006
Figure 7. Binary mask of minerals in visible light (on the example of spotty ANO).
Minerals 14 00186 g007aMinerals 14 00186 g007b
Figure 8. Block diagram of HSV-color values of minerals in visible light.
Minerals 14 00186 g008
Figure 9. Binary mask of minerals in UV light (on the example of spotty ANO from Figure 7).
Minerals 14 00186 g009aMinerals 14 00186 g009b
Figure 10. Block diagram of HSV-color value for the studied minerals in the ANO and host rocks recorded when exposed to a source of (a) visible light and (b) UV light.
Minerals 14 00186 g010
Table 1. HSV-color values of minerals in visible light.
Studied SampleHMCAHSV-Color Value (H,S,V) MinHSV-Color Value (H,S,V) Max
3-1/21Apatite42,5,17774,72,255
SpottyNepheline42,30,10461,75,165
ANOPyroxene44,29,7778,56,106
Titanite25,31,8739,98,234
1/21Apatite33,41,6360,235,220
Lens-shaped Nepheline40,40,9550,80,125
BandedPyroxene46,31,3175,125,80
ANOTitanite23,34,12035,155,215
4-2/21Apatite41,4,17080,65,245
Agpaite Pyroxene44,21,10268,70,167
Urtite–ijoleteTitanite18,16,14943,73,226
Table 2. HSV-color values of minerals in UV light.
Studied SampleHMCAHSV-Color Value (H,S,V) MinHSV-Color Value (H,S,V) Max
3-1/21Apatite124,175,160160,255,255
SpottyNepheline131,215,120155,255,150
ANOPyroxene132,240,110137,255,147
Titanite134,240,162140,255,162
1/21Apatite118,184,55133,255,195
Lens-shaped Nepheline133,255,136139,255,160
BandedPyroxene131,254,80132,255,124
ANOTitanite140,253,150140,255,194
4-2/21Apatite125,215,168160,255,255
Agpaite Pyroxene120,230,70145,255,168
Urtite–ijoleteTitanite
Disclaimer/Publisher’s Note: The statements, opinions and data contained in all publications are solely those of the individual author(s) and contributor(s) and not of MDPI and/or the editor(s). MDPI and/or the editor(s) disclaim responsibility for any injury to people or property resulting from any ideas, methods, instructions or products referred to in the content.

