
Study of the Critical Safe Height of Goaf in Underground Metal Mines


Abstract
1. Introduction
2. Methods
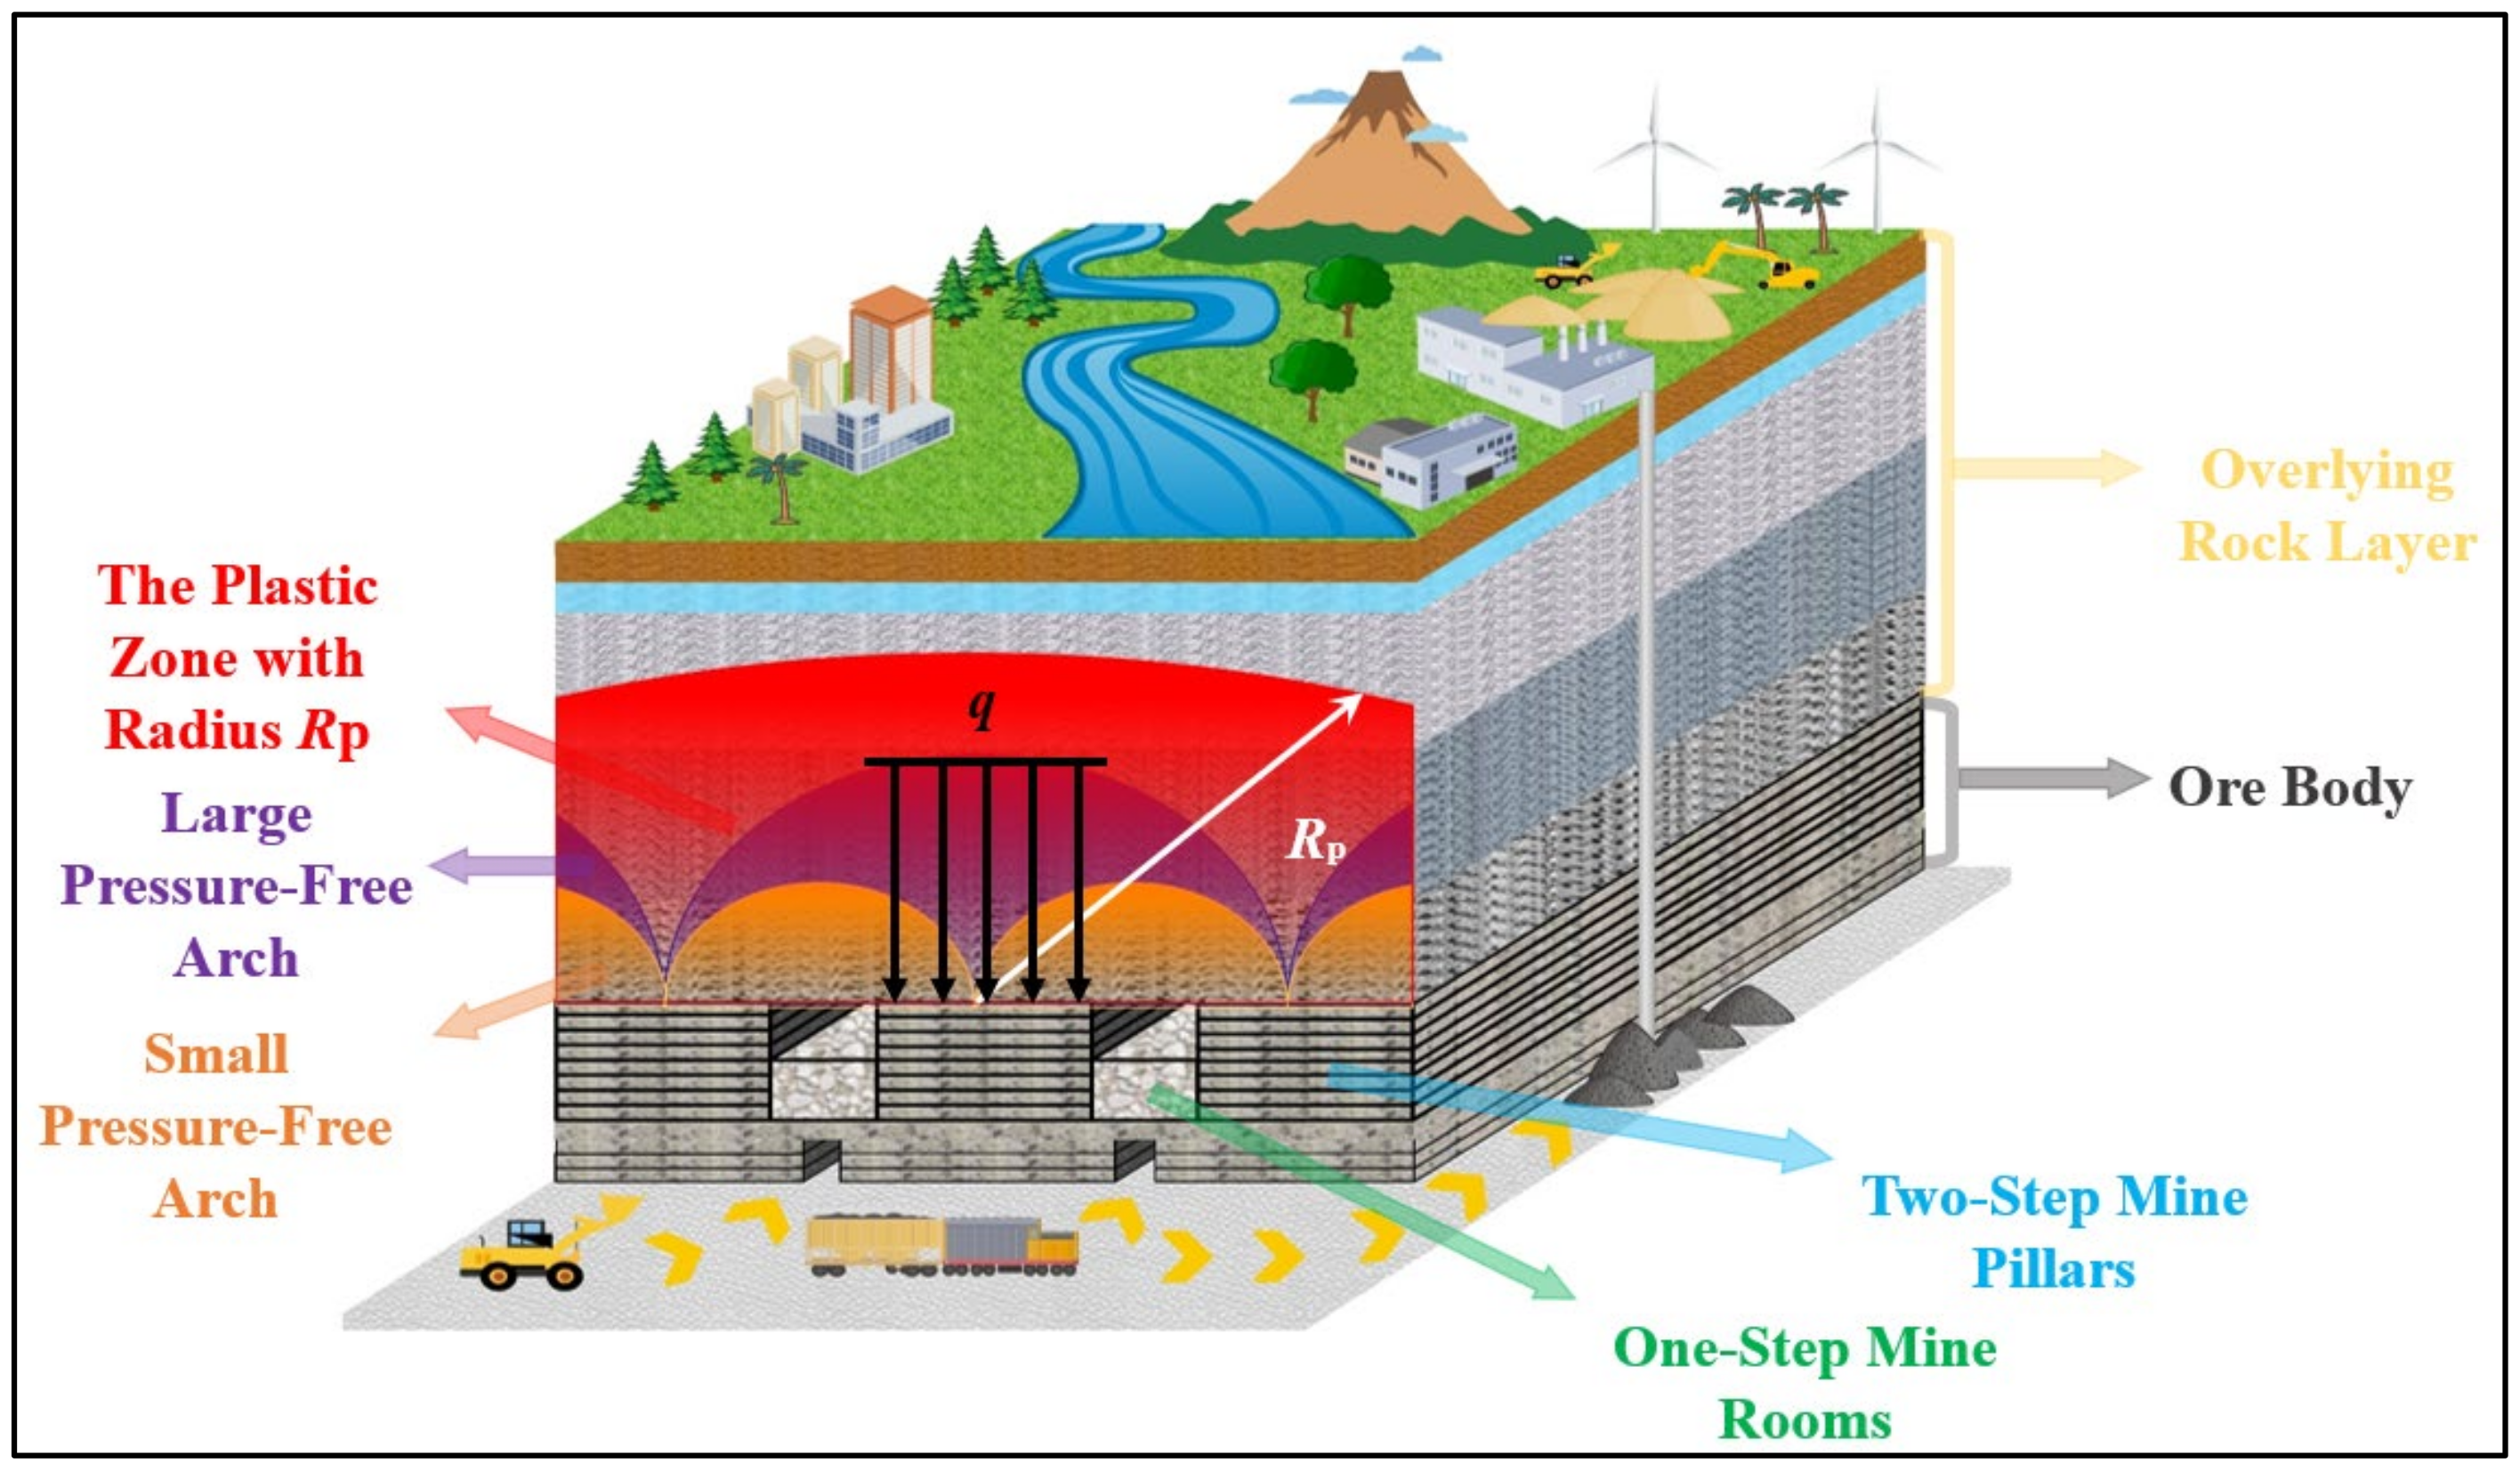
2.1. Study Site
2.2. Experiments Rock Mechanics Parameter and Their Reduction
2.3. Theoretical Modelling
2.4. Numerical Simulation Tests
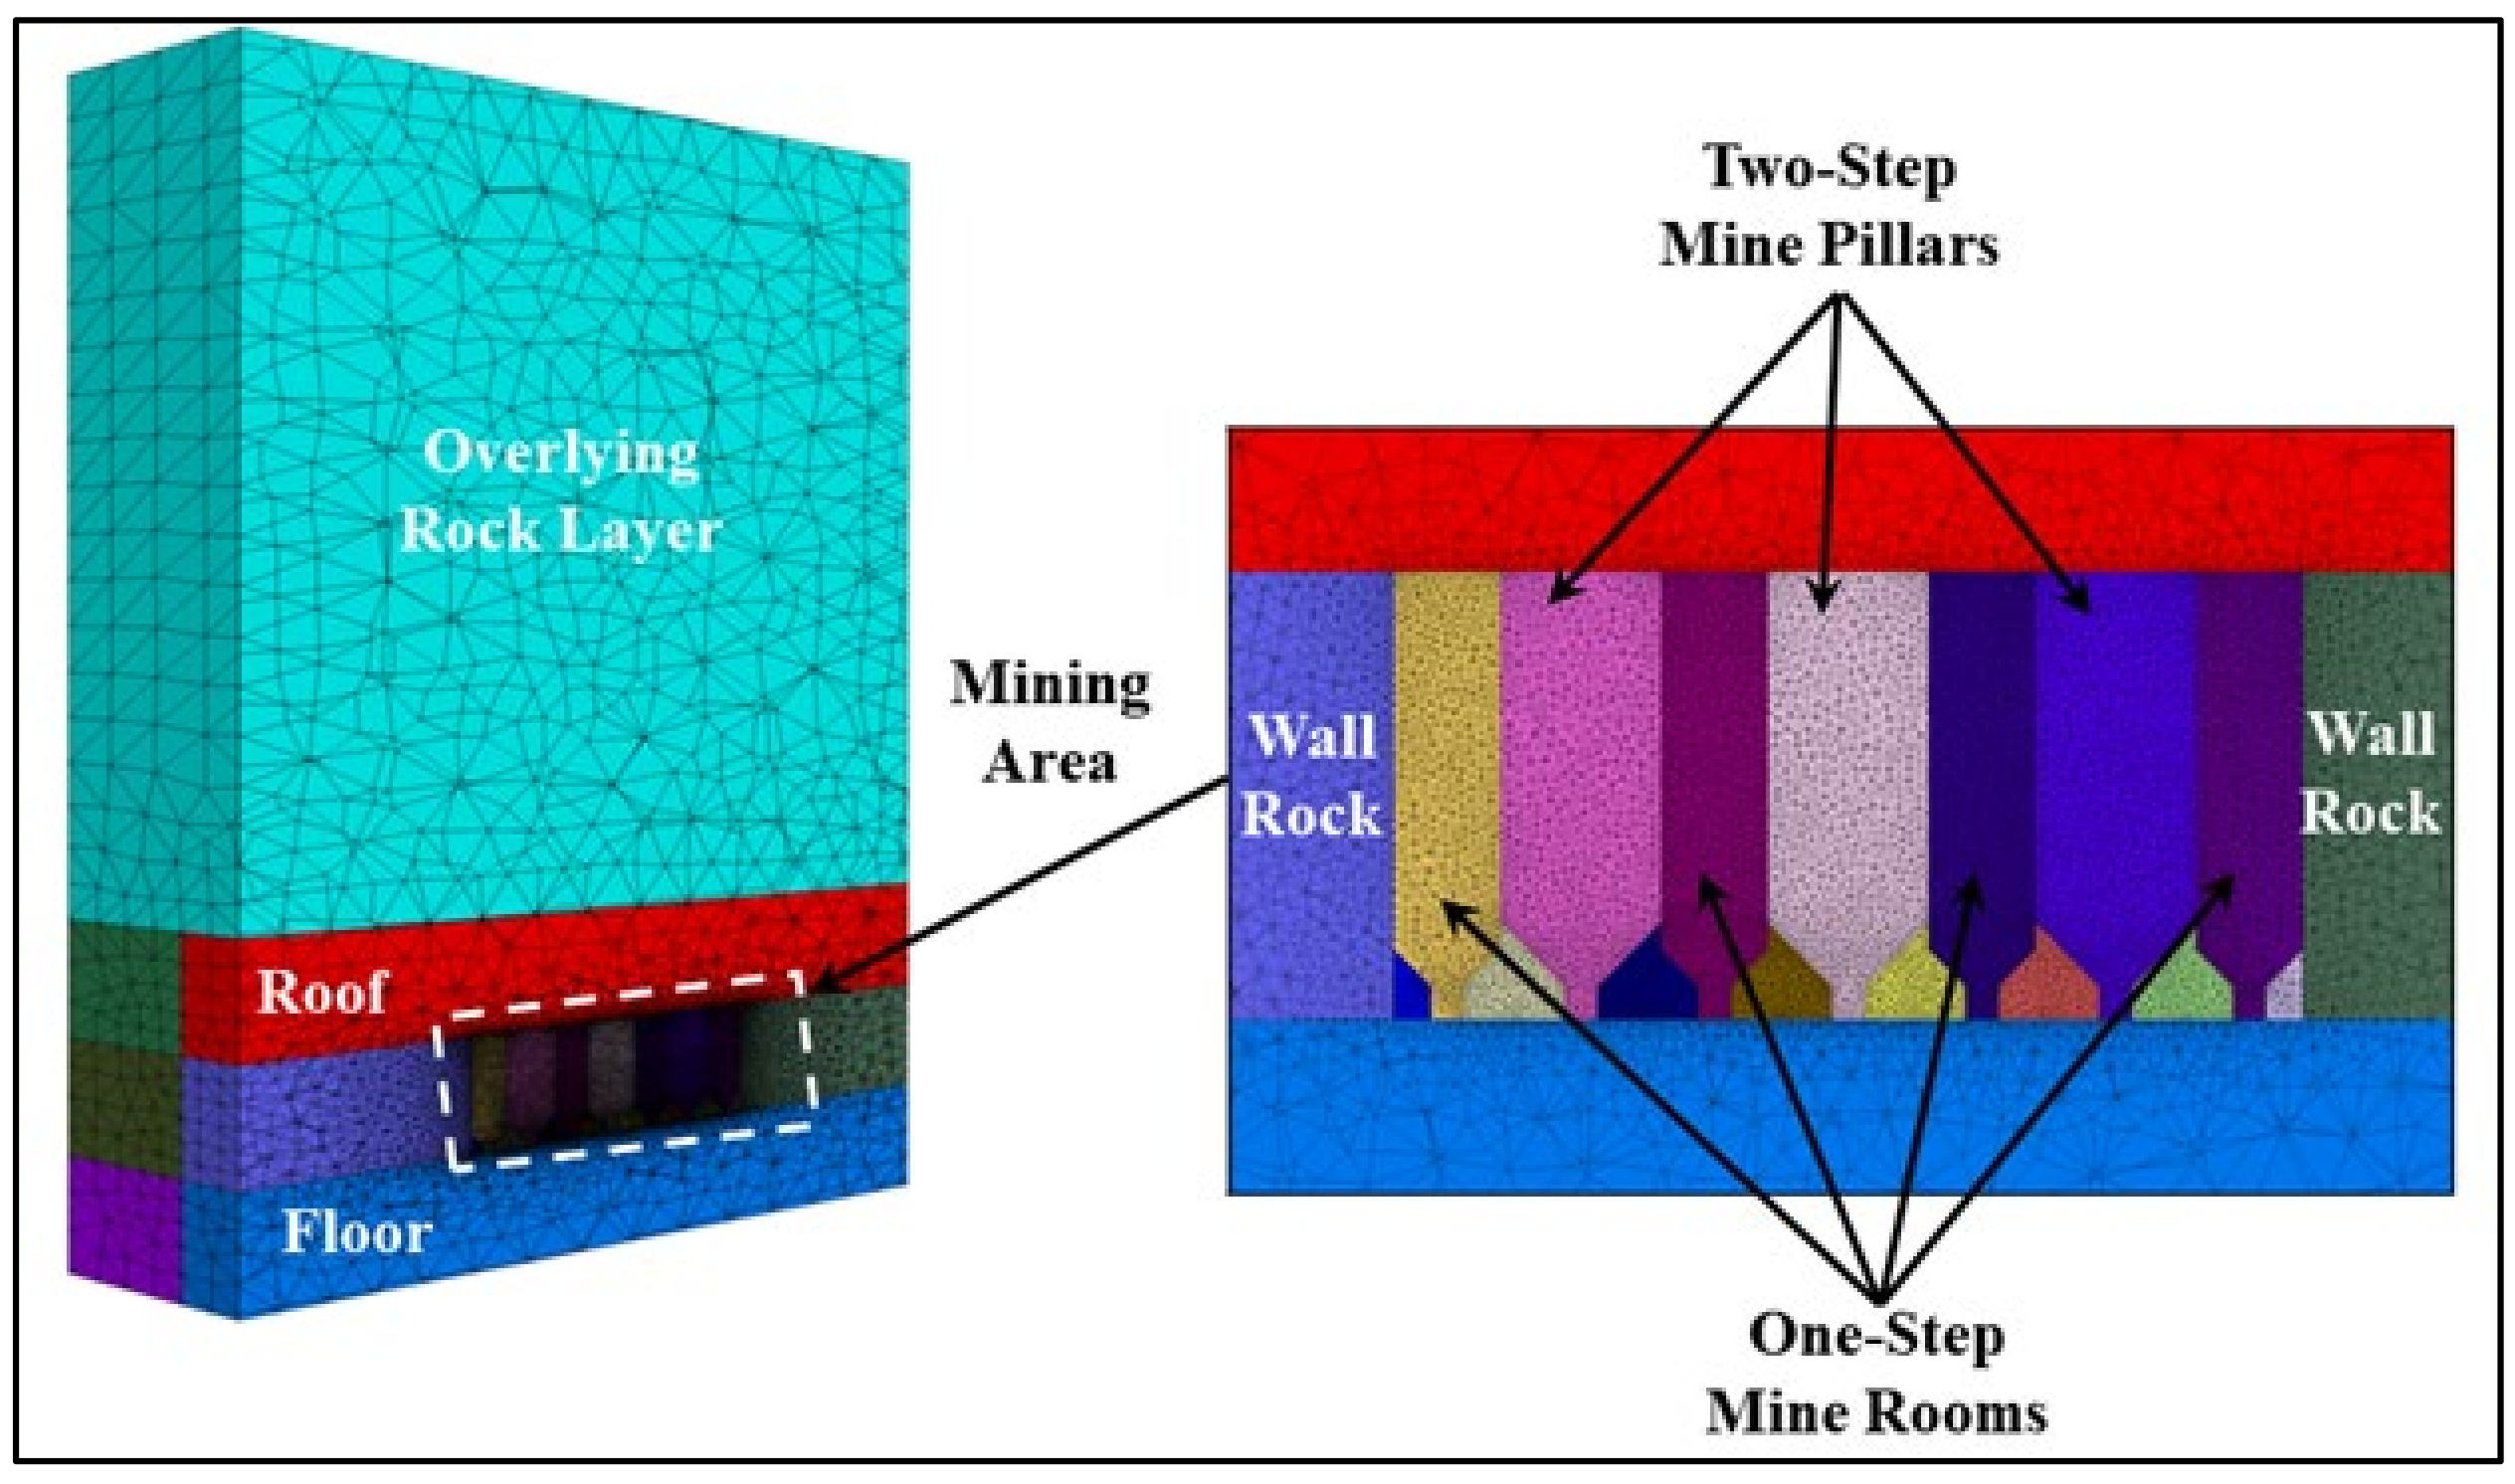
2.4.1. Modeling
2.4.2. Basic Assumption
- (1)
- The horizontal thickness and inclination of the excavated ore body are fixed values;
- (2)
- The ore body is assumed to be an ideal elastic-plastic body, and the strength and volume of the material do not change with plastic deformation after the yield point;
- (3)
- The ore body and peripheral rock are locally homogeneous and isotropic materials, and plastic deformation does not change the material isotropy;
- (4)
- Considering the brittleness of the rock, all physical quantities involved in the analysis are independent of time;
- (5)
- Strain hardening (or softening) is not considered;
- (6)
- The sides of the model limit horizontal displacements and the bottom limits vertical displacements;
- (7)
- Considering the limitations of the finite element program, it is assumed that there is no influence of tectonic activities in the site, the original rock ground stress is of geostrophic field type, there is an integrated contact between the rock layers, the interior of the rock layer is a continuous medium, the influence of groundwater activities is not taken into account in the model, and the existence and influence of structural surfaces, fissures, and weak layers in the rock layer and ore body are not taken into account;
- (8)
- The loads selected for the calculations will not change with the orientation of the units, but will always maintain their original orientation, with the surface loads acting normal to the surface of the deformed units and can be used to simulate “following” forces, the magnitude of which is the weight of the overlying rock formation;
- (9)
- Simulation of the most hazardous scenario, i.e., mining in intervals.
2.4.3. Parameters
2.4.4. Simulation Schemes
3. Results and Discussion
3.1. Results of Experiments Rock Mechanics Parameter and Their Reduction
3.2. Quantitative Analysis of Each Influencing Factor
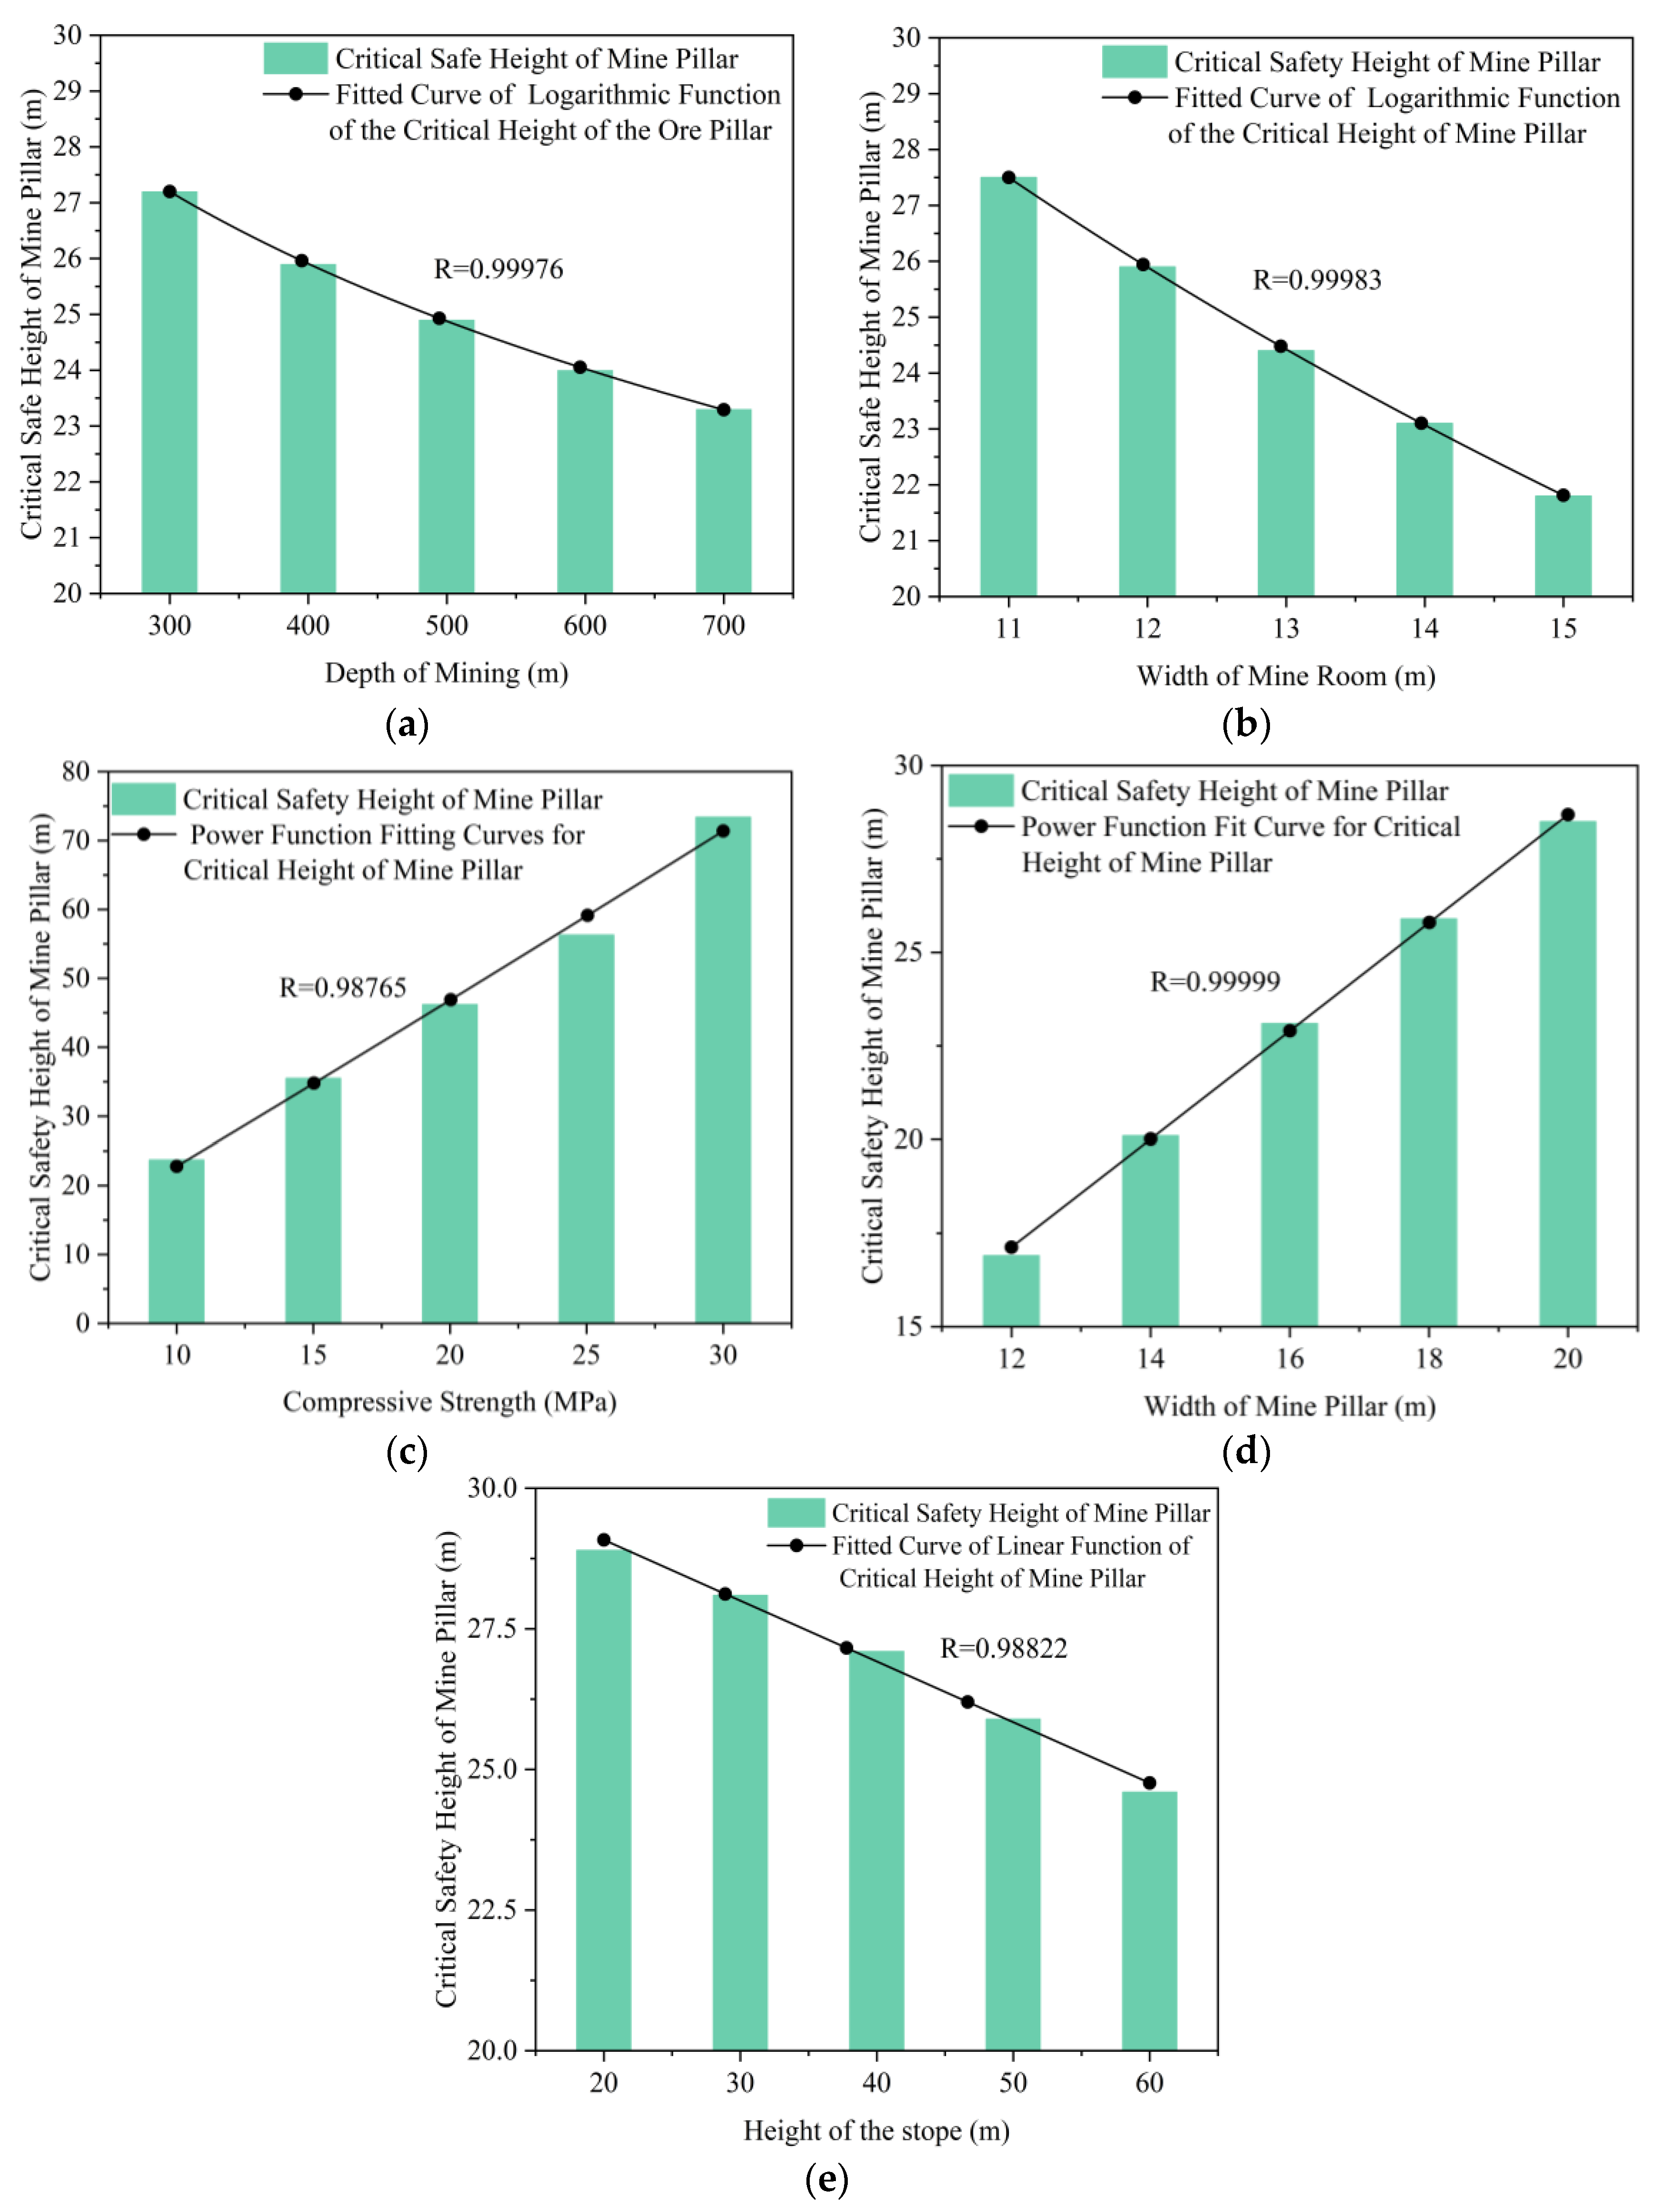
- The highest correlation coefficient for the function fit between the mining depth and the critical safe height of the goaf was 0.99976 for the logarithmic function fit, i.e., it follows the decreasing law of the logarithmic function (in which a1, b1, and c1 mainly depend on the mining depth, the rock body compressive strength, and other factors). Figure 3a shows the logarithmic function of the mining depth and the critical safe height of the goaf fitting curve. With increasing mining depth, the critical safety height of the goaf followed a logarithmic function with the rate of reduction gradually decreasing.
- The highest correlation coefficient between the width of the mining room and the critical safety height of the goaf function fit was the logarithmic function fit of 0.99983, that is, following a logarithmic function of the form , where a2, b2, and c2 mainly depend on the width of the mining room, the rock body compressive strength, and other factors. Figure 3b shows the fitting curve of the logarithmic function between the width of the mine room and the critical safe height of the goaf. As the width of the mine room increases, the critical safe height of the goaf decreases according to a logarithmic function with a gradually decreasing rate of decrease.
- The highest correlation coefficient between the rock compressive strength and the critical safety height of the goaf was 0.98765 for the power function fit, that is, following a power function , in which a3 and b3 mainly depend on the rock compressive strength and other factors. Figure 3c shows the rock body compressive strength and the critical safe height of the goaf power function fitting curve. As the rock body compressive strength increases, the critical safe height of the goaf increases gradually according to a power function, with the rate of increase gradually increasing.
- The highest correlation coefficient between the width of the mine pillar and the critical safety height of the goaf function fit as the logarithmic function fit of 0.99999, that is, following the logarithmic function of the incremental law (where a4, b4, and c4 mainly depend on the width of the mine pillar, the rock body compressive strength, and other factors). Figure 3d shows the logarithmic function fitting curve of the mine pillar width and critical safety height of the goaf. As the mine pillar width increases, the critical safe height of the goaf increases gradually according to a logarithmic function, with the rate of increase gradually increasing.
- The highest correlation coefficient of the function fit between the mining height and the critical safety height of the goaf was 0.98822, following a decreasing linear function of the form (in which a5 and b5 mainly depend on the mining height and other factors). Figure 3e shows the fitting curve of the logarithmic function between the mining height and the critical safe height of the goaf. As the mining height increases, the critical safe height of the goaf decreases linearly.
3.3. Theoretical Analysis of Project Examples
3.4. Numerical Simulation Testing of Project Examples
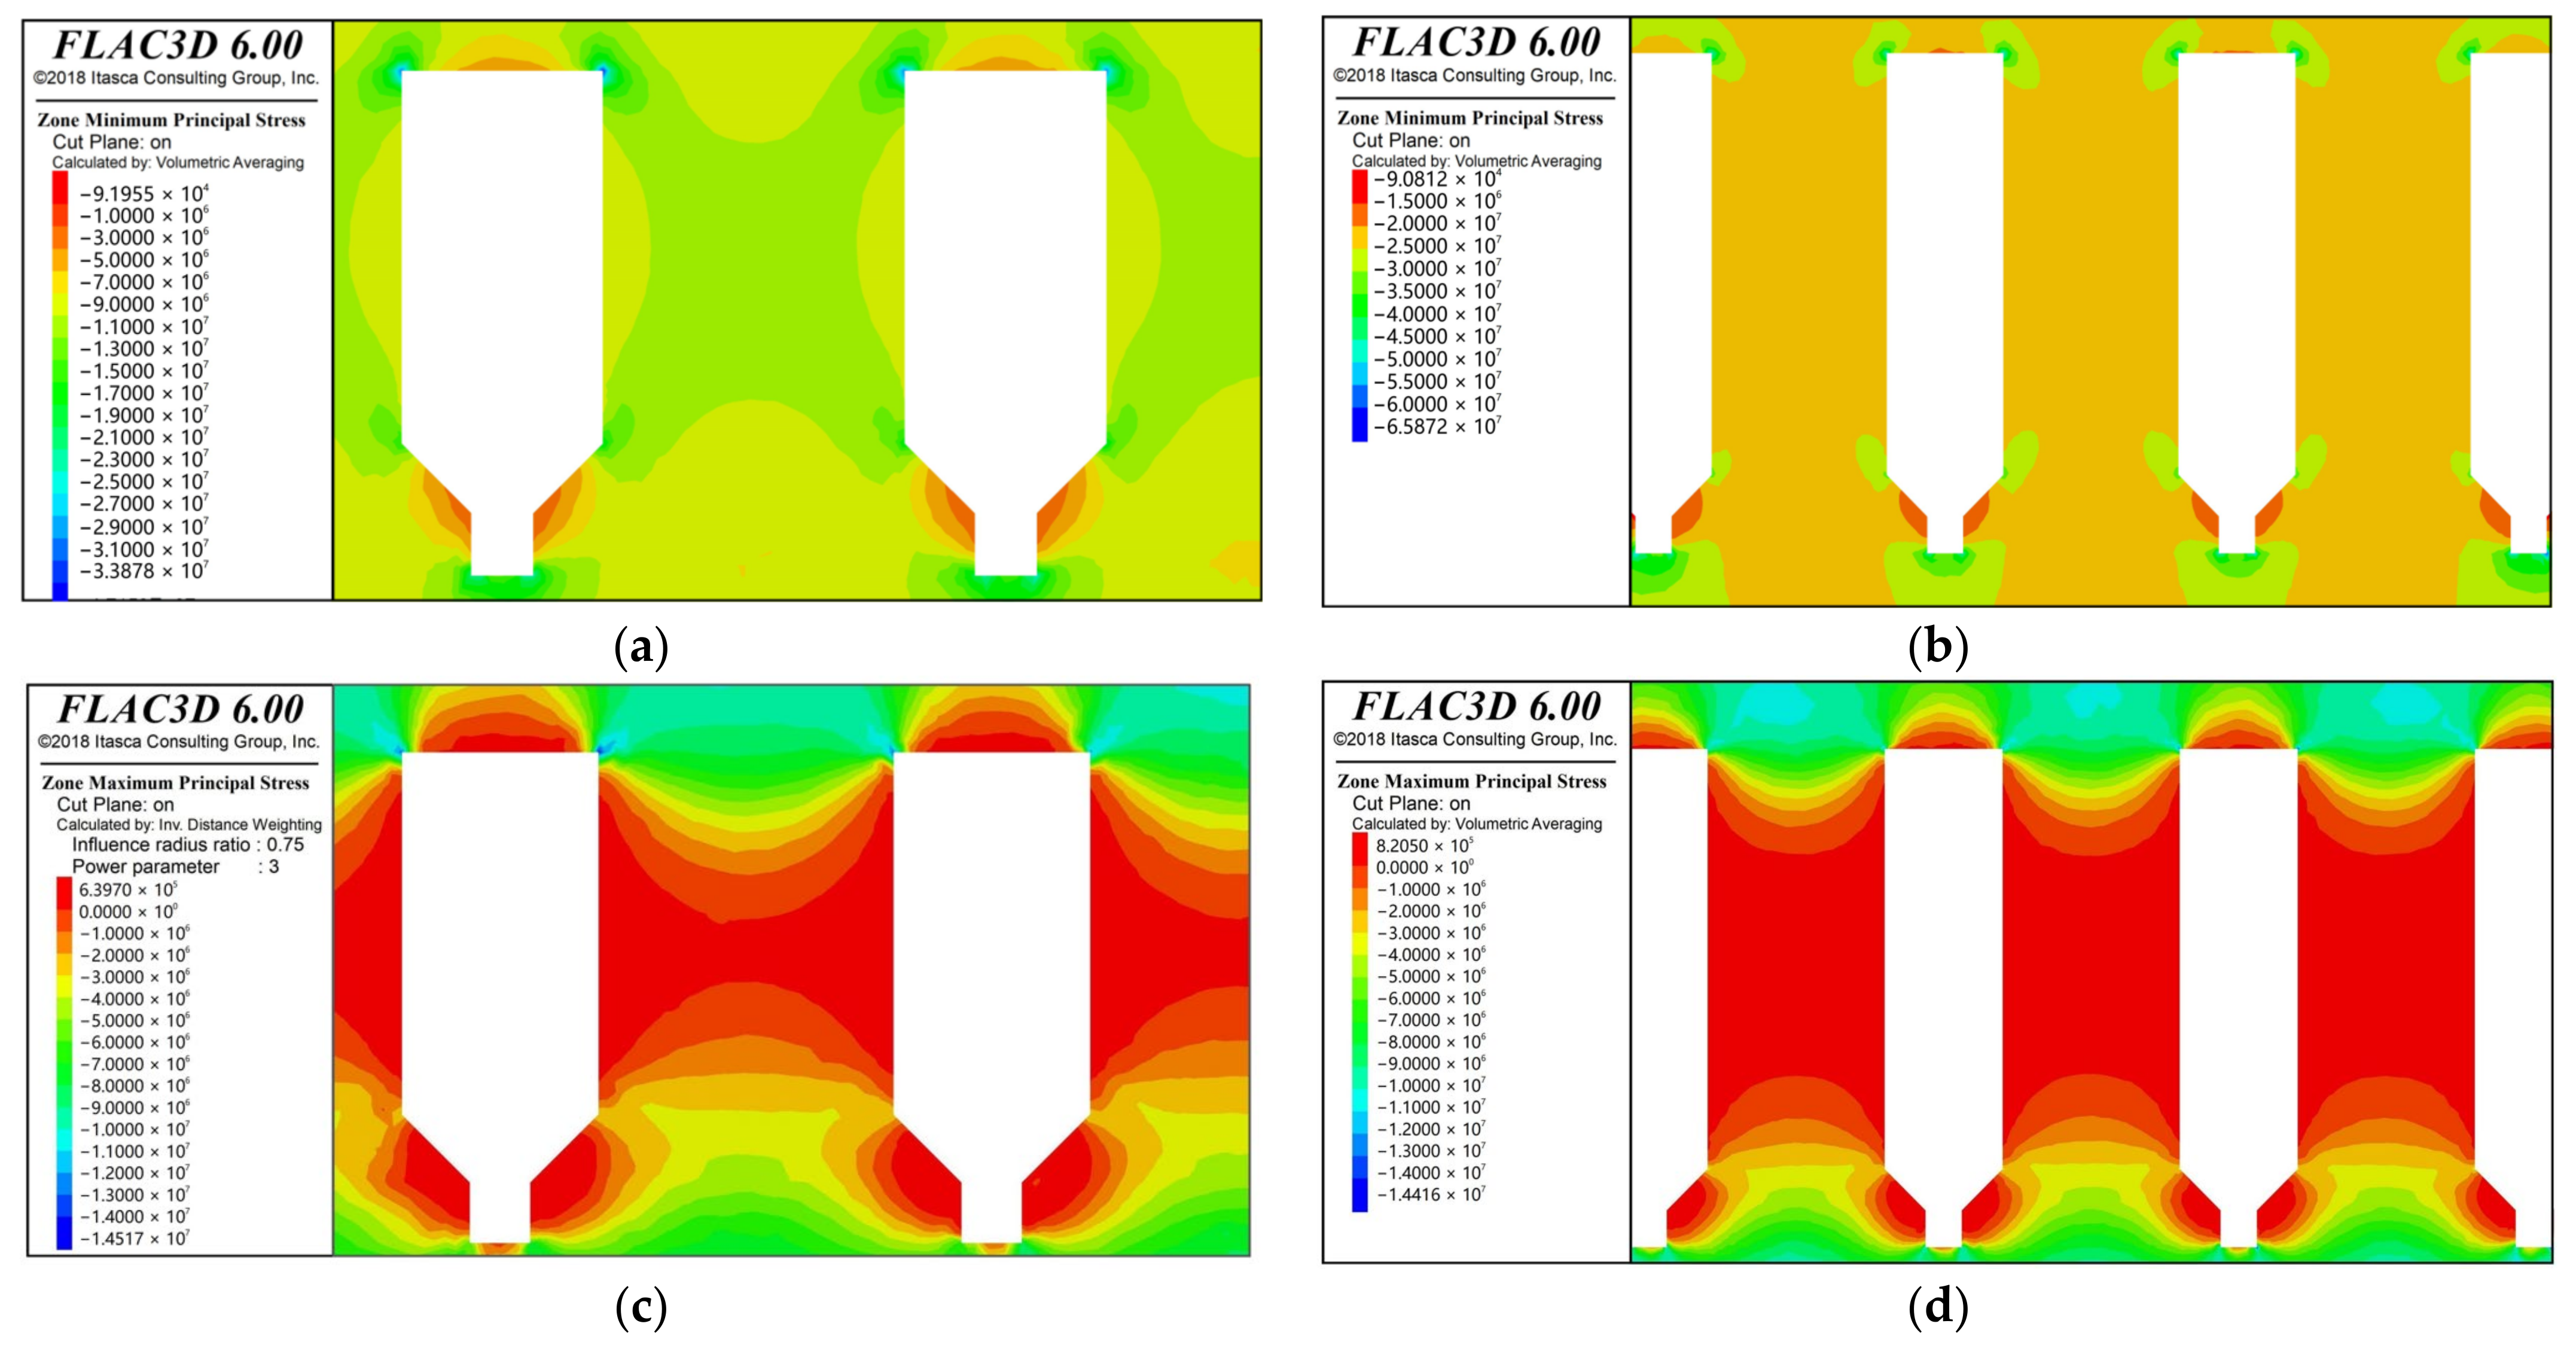
3.4.1. Compressive Stress Analysis
3.4.2. Tensile Stress Analysis
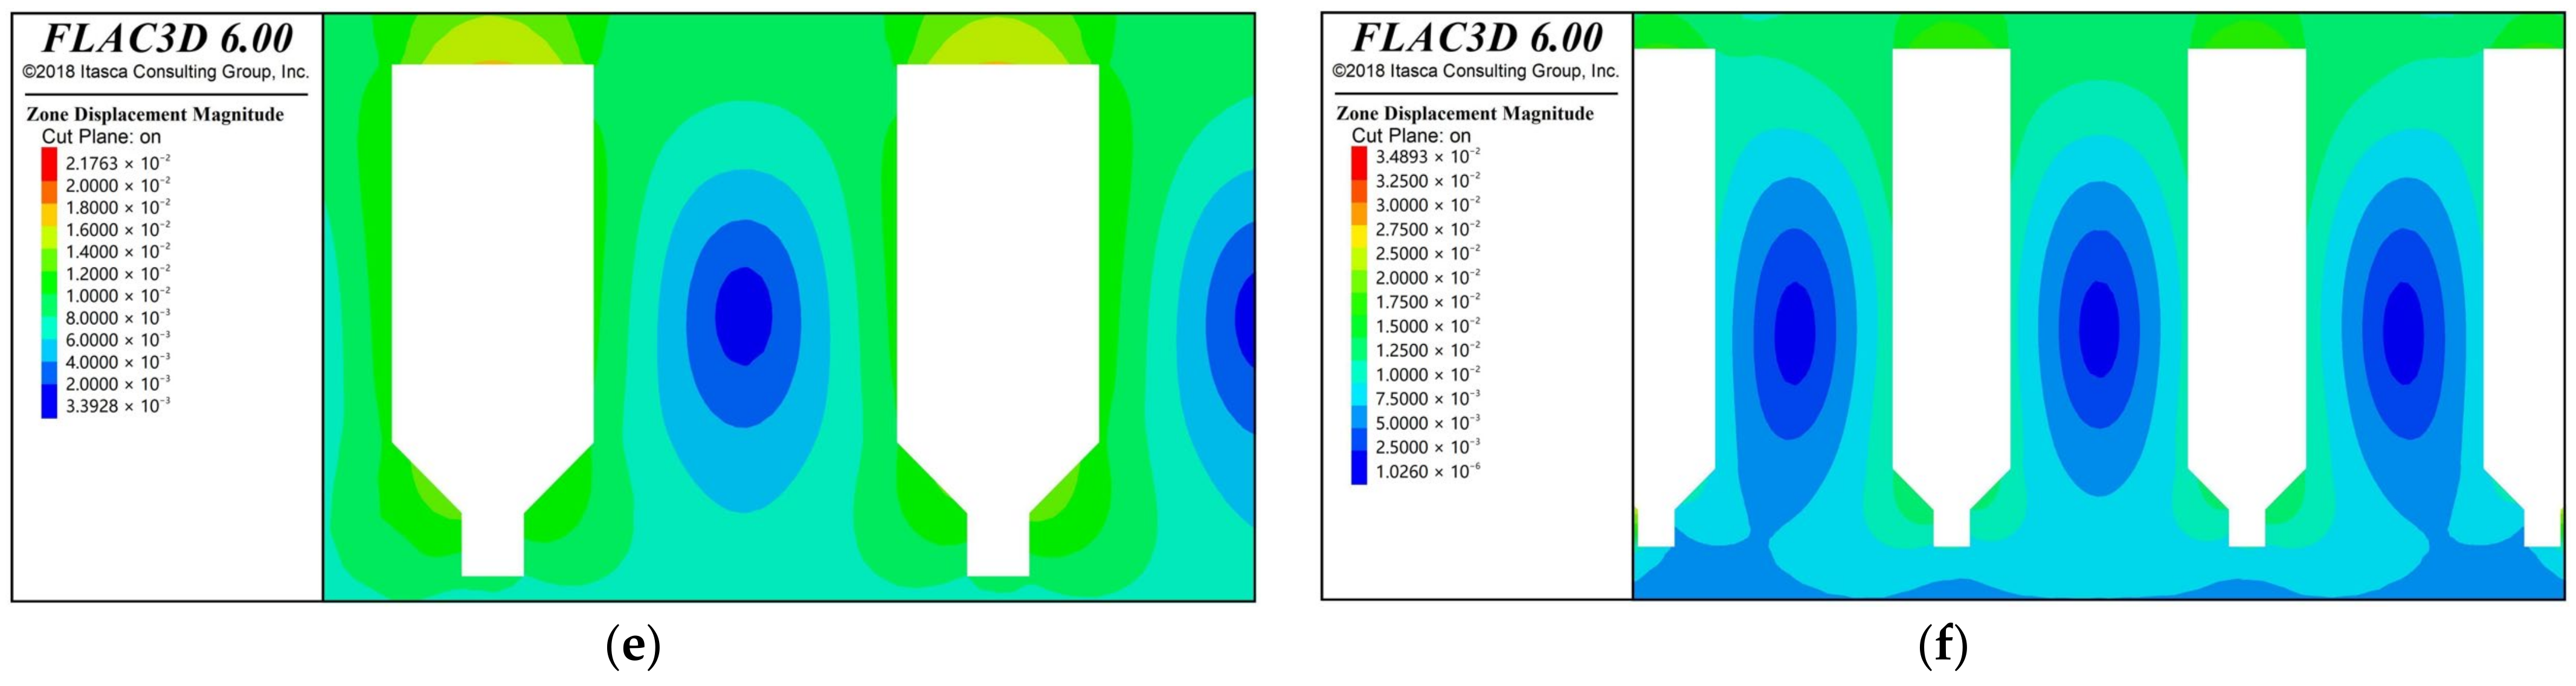
3.4.3. Displacement Analysis
4. Industrial Tests
4.1. Overview of the Experimental Stope
4.2. Results of Industrial Experiments
5. Conclusions
- (1)
- According to a comprehensive analysis of polar–orthogonal experiments, among the main factors affecting the critical safety height of the goaf, the impact of the compressive strength of the rock body is the most significant; followed by the width of the two-step mining pillar; and finally, the height of the stope, the depth of mining, and the width of the one-step mining room, the effect of which are almost the same. The effects of the mining depth, the width of the one-step mining room, and the critical safe height of the goaf follow decreasing logarithmic functions; the effects of the compressive strength of the rock body and the critical safe height of the goaf follow increasing power functions; the effects of the width of the two-step mining pillar and the critical safe height of the goaf follow increasing logarithmic functions; and the height of the goaf and the critical safe height of the goaf follow decreasing linear functions.
- (2)
- Based on the geological conditions of the mine and the current mining situation, the permissible critical height of mining safety was calculated for each area of the mine. The calculation results show that: in the area with poor rock stability, the heights of the stope should not exceed 28 m (−378 m middle section) and 27 m (−478 m middle section); in the area with better rock stability, the heights of the stope should not exceed 54 m (−378 m middle section) and 51 m (−478 m middle section).
- (3)
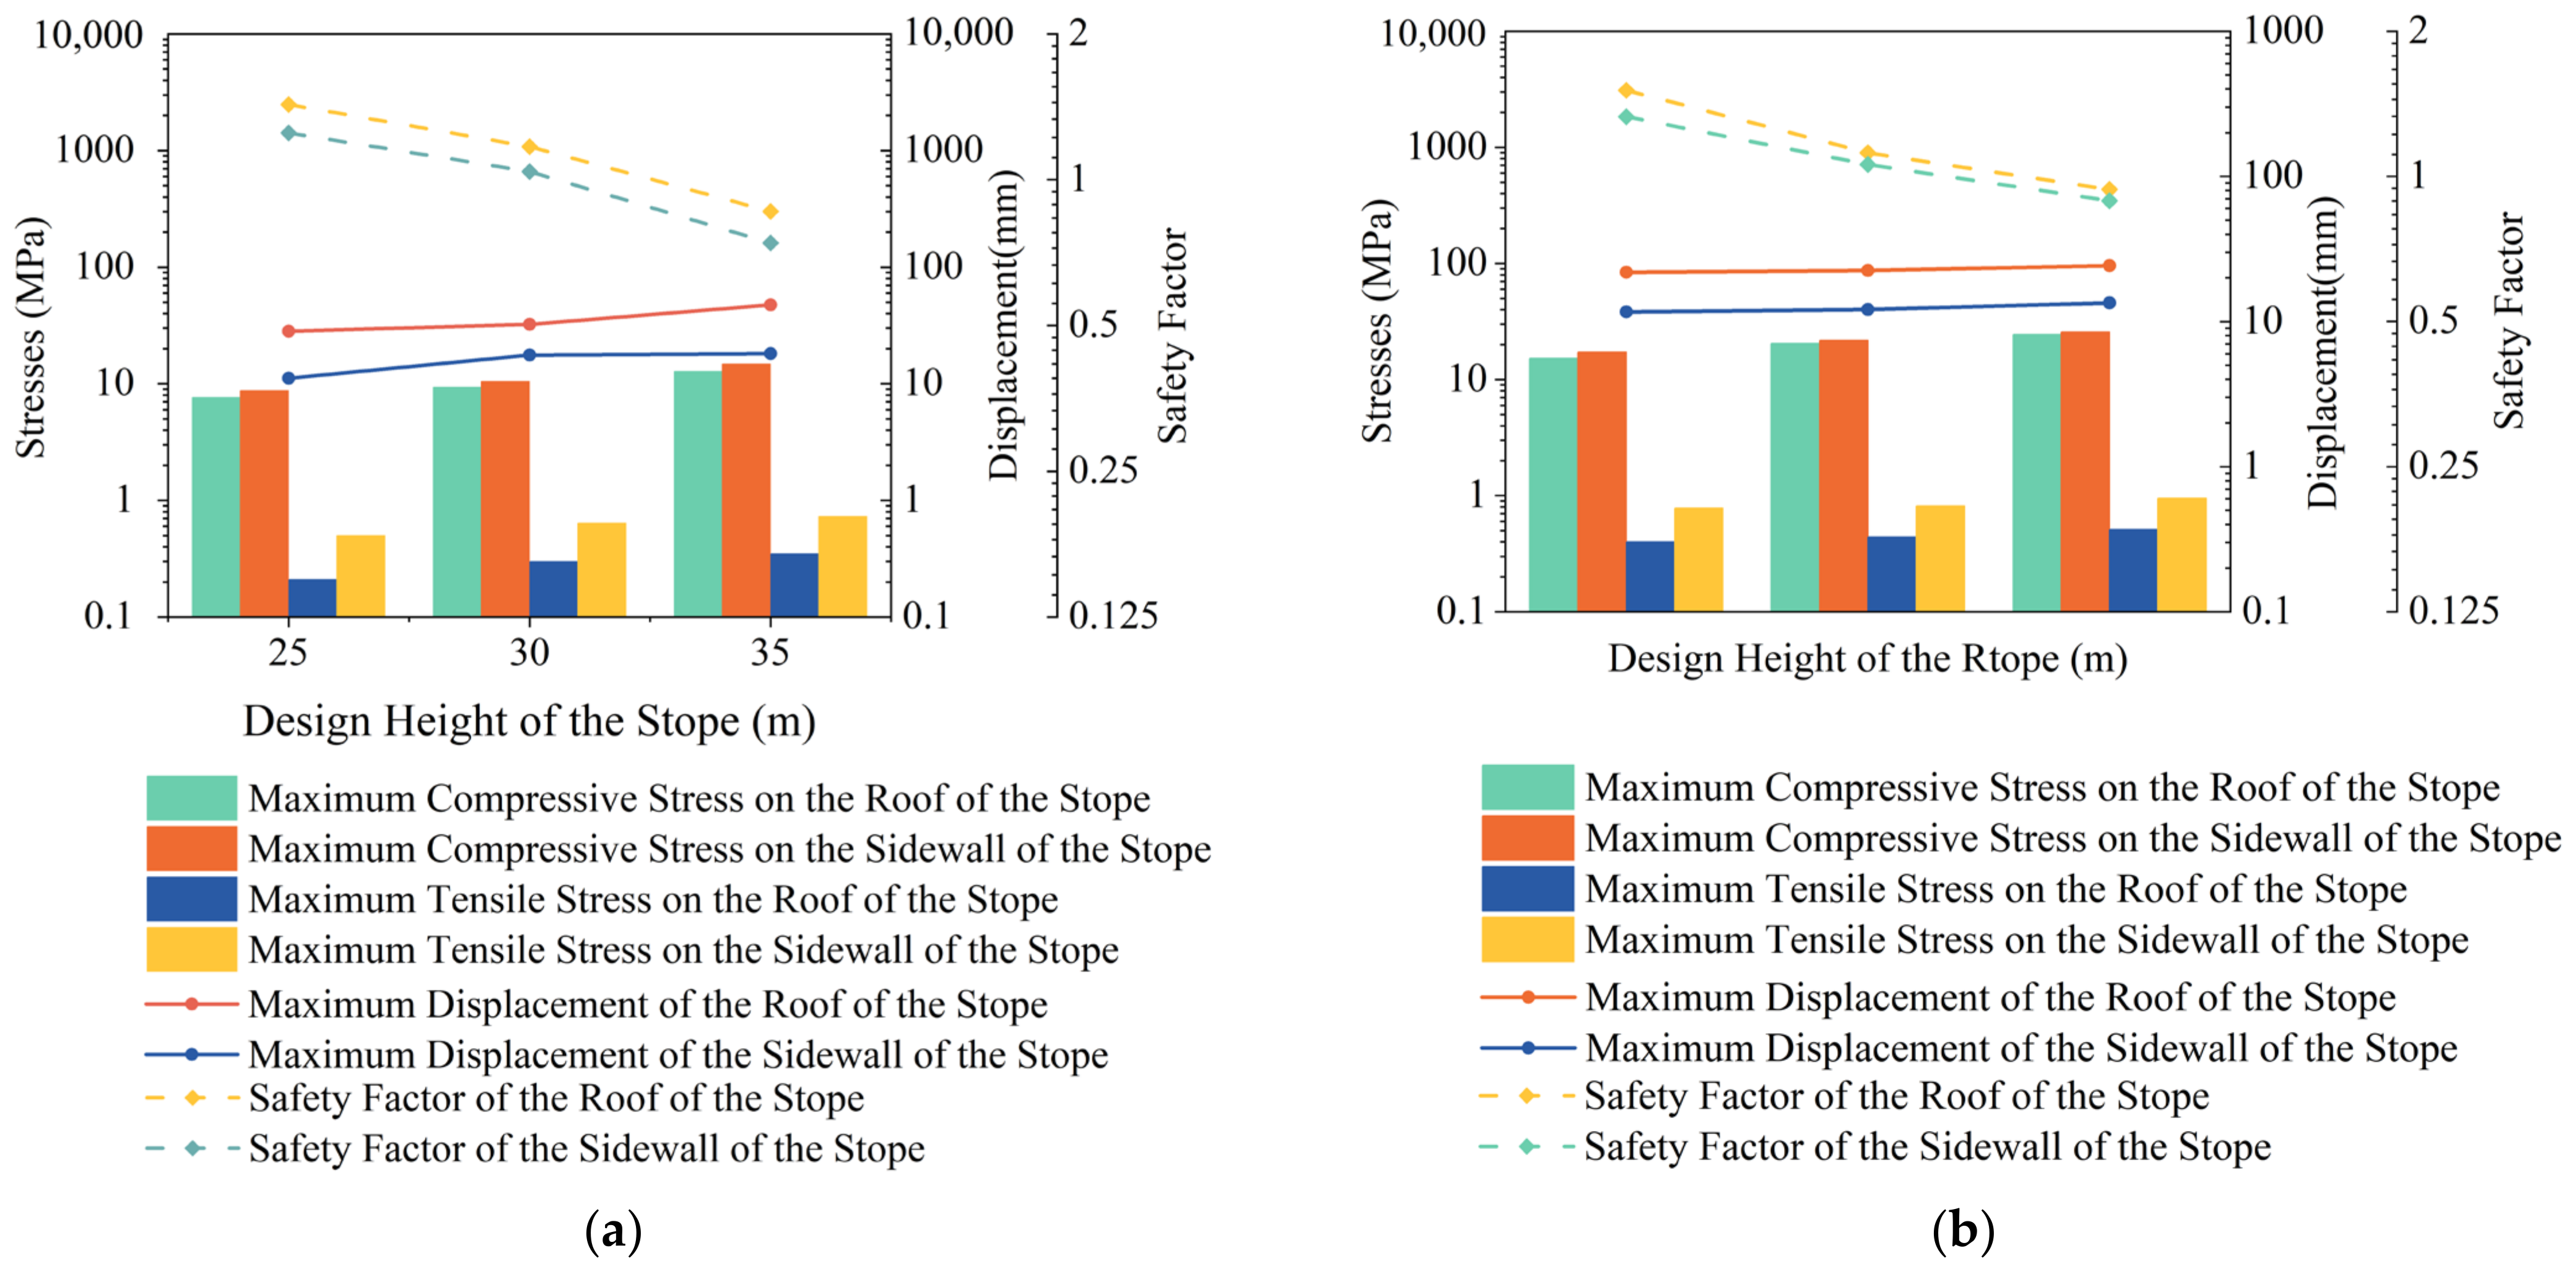
- Numerical simulation tests were carried out using FLAC 3D, and the results show that the stope is significantly affected by compressive stress and increases with increasing stope height; the tensile stress does not exceed the ultimate tensile strength of the rock body; and the displacement and deformation are relatively small and do not exhibit sudden changes. In the area of poor rock stability, when the height of the stope is 25 m, 30 m, and 35 m, respectively, the safety coefficients of the roof plate in the goaf is 1.43, 1.17, and 0.86; the safety coefficients of the sidewall in the goaf is 1.25, 1.04, and 0.74. In the area of better rock stability, when the height of the stope is 45 m, 50 m, and 55 m, respectively, the safety coefficients f of the roof plate in the goaf is 1.51, 1.12, and 0.94; the safety coefficients f of the r sidewall in the goaf is 1.33, 1.06, and 0.89. The former heights are slightly greater than the results suggested by the theoretical calculations, and the latter are basically the same as the theoretical calculation results.
- (4)
- The industrial test results show that the three test stopes are in a state of over-excavation but that the amount of over-excavation is relatively small, within the range of 1%–3%. The actual boundary of the open area is relatively regular and is basically consistent with the design boundary. On the whole, the boundary meets the basic requirements of safe production and does not affect two-step pillar mining.
Author Contributions
Funding
Data Availability Statement
Acknowledgments
Conflicts of Interest
References
- Chen, Q.; Zhou, H.; Wang, Y.; Wang, D.; Zhang, Q.; Liu, Y. Erosion wear at the bend of pipe during tailings slurry transportation: Numerical study considering inlet velocity, particle size and bend angle. Int. J. Miner. Metall. Mater. 2023, 30, 1608–1620. [Google Scholar] [CrossRef]
- Guo, L.; Wu, Y.; Zhang, Q.; Chen, Q. Stability evaluation of layered backfill considering filling interval, backfill strength and creep behavior. Minerals 2022, 12, 271. [Google Scholar] [CrossRef]
- Liu, Y.; Wang, Y.; Chen, Q. Using cemented paste backfill to tackle the phosphogypsum stockpile in china: A down-to-earth technology with new vitalities in pollutants retention and CO2 abatement. Int. J. Miner. Metall. Mater. 2023. Available online: http://ijmmm.ustb.edu.cn/en/article/id/e87e96bf-4935-4a0f-bbf2-0033535b0b9b (accessed on 1 December 2023).
- Liu, Y.; Molinari, S.; Dalconi, M.C.; Valentini, L.; Bellotto, M.P.; Ferrari, G.; Pellay, R.; Rilievo, G.; Vianello, F.; Salviulo, G.; et al. Mechanistic insights into pb and sulfates retention in ordinary portland cement and aluminous cement: Assessing the contributions from binders and solid waste. Hazard. Mater. 2023, 458, 131849. [Google Scholar] [CrossRef]
- Wang, R.; Zeng, F.; Li, L. Stability analyses of side-exposed backfill considering mine depth and extraction of adjacent stope. Int. J. Rock. Mech. Min. Sci. 2021, 142, 104735. [Google Scholar] [CrossRef]
- Qi, C.; Wu, M.; Liu, H.; Liang, Y.; Liu, X.; Lin, Z. Machine learning exploration of the mobility and environmental assessment of toxic elements in mining-associated solid wastes. J. Clean. Prod. 2023, 401, 136771. [Google Scholar] [CrossRef]
- Wu, M.; Qi, C.; Derrible, S.; Choi, Y.; Fourie, A.; Ok, Y.S. Regional and global hotspots of arsenic contamination of topsoil identified by deep learning. Commun. Earth Environ. 2024, 5, 10. [Google Scholar] [CrossRef]
- Yuan-hui, L.; Gang, L.; Shi-da, X.; Da-wei, W. The spatial-temporal evolution law of microseismic activities in the failure process of deep rock masses. J. Appl. Geophys. 2018, 154, 1–10. [Google Scholar] [CrossRef]
- Golik, V.I.; Klyuev, R.V.; Martyushev, N.V.; Kondratiev, V.V.; Tynchenko, V.S.; Gladkikh, V.A.; Iushkova, L.V.; Brigida, V. Reuse and Mechanochemical Processing of Ore Dressing Tailings Used for Extracting Pb and Zn. Materials 2023, 16, 7004. [Google Scholar] [CrossRef] [PubMed]
- Uzarowicz, Ł.; Wolińska, A.; Błońska, E.; Szafranek-Nakonieczna, A.; Kuźniar, A.; Słodczyk, Z.; Kwasowski, W. Technogenic soils (technosols) developed from mine spoils containing fe sulphides: Microbiological activity as an indicator of soil development following land reclamation. Appl. Soil. Ecol. 2020, 156, 103699. [Google Scholar] [CrossRef]
- Kongar-Syuryun, C.B.; Kovalski, E.R. Hardening backfill at potash mines: Promising materials regulating stress-strain behavior of rock mass. Geol. I Geofiz. Yuga Ross. Geol. Geophys. Russ. South. 2023, 13, 177–187. [Google Scholar]
- Kovalski, E.R.; Kongar-Syuryun, C.B.; Petrov, D.N. Challenges and prospects for several-stage stoping in potash minining. Sustain. Dev. Mt. Territ. 2023, 15, 349–364. [Google Scholar] [CrossRef]
- Khayrutdinov, M.M.; Golik, V.I.; Aleksakhin, A.V.; Trushina, E.V.; Lazareva, N.V.; Aleksakhina, Y.V. Proposal of an Algorithm for Choice of a Development System for Operational and Environmental Safety in Mining. Resources 2022, 11, 88. [Google Scholar] [CrossRef]
- Ganapathy, G.P.; Zaalishvili, V.B.; Chandrasekaran, S.S.; Melkov, D.A. Integrated monitoring of slope process in India and Russia. Sustain. Dev. Mt. Territ. 2020, 12, 572–581. [Google Scholar] [CrossRef]
- Driouch, A.; Ouadif, L.; Lahmili, A.; Belmi, M.A.; Benjmel, K. Geotechnical modeling of the method for mining cobalt deposits at the Bou Azzer Mine, Morocco. Min. Miner. Depos. 2023, 17, 51–58. [Google Scholar] [CrossRef]
- Obert, L.; Duvall, W.I. Rock Mechanics and Design of Structures in Rock; Jonh Wiley & Sons: New York, NY, USA, 1967. [Google Scholar]
- Jiang, L.; Yang, C.; Jiao, H. Ultimately exposed roof area prediction of bauxite deposit goaf based on macro joint damage. Int. J. Min. Sci. Technol. 2020, 30, 699–704. [Google Scholar] [CrossRef]
- Swift, G.; Reddish, D. Stability problems associated with an abandoned ironstone mine. Bull. Eng. Geol. Environ. 2002, 6, 227–239. [Google Scholar] [CrossRef]
- Peng, G.; Gaoyi, D.; Jingsong, C.; Zhou, C.; Manqing, L.; Weizhong, Z.; Yang, S. Study on optimization of stope structural parameters and filling scheme of wawu phosphate mine in yichang city, china. Front. Earth Sci. 2022, 10, 883572. [Google Scholar] [CrossRef]
- Zhienbayev, A.; Balpanova, M.; Asanova, Z.; Zharaspaev, M.; Nurkasyn, R.; Zhakupov, B. Analysis of the roof span stability in terms of room-and-pillar system of ore deposit mining. Min. Miner. Depos. 2023, 17, 129–137. [Google Scholar] [CrossRef]
- Hosseini, M.; Azhari, A.; Lotfi, R.; Baghbanan, A. Safety analysis of Sormeh underground mine to improve sublevel stoping stability. Deep. Undergr. Sci. Eng. 2023, 2, 173–187. [Google Scholar] [CrossRef]
- Bagde, M.; Sangode, A.; Jhanwar, J. Evaluation of Stoping Parameters through Instrumentation and Numerical Modelling in Manganese Mine in India: A Case Study. Procedia Eng. 2017, 191, 10–19. [Google Scholar] [CrossRef]
- Soni, A.; Monsalve, J.J.; Bishop, R.; Ripepi, N. Modified design of pillar based on estimated stresses and strength of pillar in an underground limestone mine. Min. Metall. Explor. 2023, 40, 529–541. [Google Scholar] [CrossRef]
- Zhang, Y.F.; Ni, P.P. Design optimization of room and pillar mines: A case study of the xianglushan tungsten mine. Q. J. Eng. Geol. Hydrogeol. 2018, 51, 352–364. [Google Scholar] [CrossRef]
- Qiu, H.Y.; Huang, M.Q.; Weng, Y.-J. Stability evaluation and structural parameters optimization of stope based on area bearing theory. Minerals 2022, 12, 808. [Google Scholar] [CrossRef]
- Bieniawski, Z.T. A method Revisited: Coal Pillar Strength Formula Based on Field Investigations. In Proceedings of the Workshop on Coal Pillar Mechanics and Design; US Department of the Interior, US Bureau of Mines: Washington, DC, USA, 1992; pp. 158–165. [Google Scholar]
- Fan, H.; Li, L.; Liu, H.; Hu, J.; Zhang, M.; Zhou, S.; Yang, G. Improvement to the calculating model of the pressure arch’s height considering the confining pressure in the excavation of shallow tunnels. Arab. J. Geosci. 2021, 14, 1130. [Google Scholar] [CrossRef]
- Kastner, H. Statik des Tunnel-Und Stollenbaues auf Der Grundlagen Geomechanischer Erkenntnisse; Springer: Berlin/Heidelberg, Germany, 2013. [Google Scholar]
- Tu, H.; Zhou, H.; Lu, J.; Gao, Y.; Shi, L. Elastoplastic coupling analysis of high-strength concrete based on tests and the Mohr-Coulomb criterion. Constr. Build. Mater. 2020, 255, 119375. [Google Scholar] [CrossRef]
- Zhang, J.; Wang, Z.; Song, Z. Numerical study on movement of dynamic strata in combined open-pit and underground mining based on similar material simulation experiment. Arab. J. Geosci. 2020, 13, 785. [Google Scholar] [CrossRef]
- Liu, B.; Zhou, J.; Wen, X.; Guo, J.; Deng, Z.; Hu, X. Mechanical performance and failure criterion of coral concrete under combined compression-shear stresses. Constr. Build. Mater. 2021, 288, 123050. [Google Scholar] [CrossRef]
- Wang, J.; Ren, L.; Xie, L.Z.; Xie, H.P.; Ai, T. Maximum mean principal stress criterion for three-dimensional brittle fracture. Int. J. Solids Struct. 2016, 102–103, 142–154. [Google Scholar] [CrossRef]


| Program Number | Rock Stability | Compressive Strength (σt/MPa) | Width of the Stope | Length of the Stope (m) | Height of the Stope (m) | |
|---|---|---|---|---|---|---|
| One-Step Mine Room (m) | Two-Step Mine Pillar (m) | |||||
| 1 | Poor | 10.93 | 12 | 18 | 50 | 25 |
| 2 | Poor | 10.93 | 12 | 18 | 50 | 30 |
| 3 | Poor | 10.93 | 12 | 18 | 50 | 35 |
| 4 | Better | 22.97 | 12 | 18 | 50 | 45 |
| 5 | Better | 22.97 | 12 | 18 | 50 | 50 |
| 6 | Better | 22.97 | 12 | 18 | 50 | 55 |
| Materials | Compressive Strength (σt/MPa) | Tensile Strength (σc/Mpa) | Elasticity Modulus (Em/Gpa) | Density (ρ/t·m−3) | Poisson’s Ratio (μ) | Cohesion (Cm/Mpa) | Internal Friction Angle (φm/°) |
|---|---|---|---|---|---|---|---|
| Overburden Rock | 68.54 | 8.89 | 39.29 | 2.84 | 0.24 | 10.31 | 50.41 |
| Phyllite ore body | 33.80 | 6.28 | 27.40 | 2.97 | 0.34 | 3.33 | 43.39 |
| Floor | 46.69 | 6.05 | 24.63 | 2.88 | 0.32 | 7.14 | 50.43 |
| Materials | Compressive Strength (σt/Mpa) | Tensile Strength (σc/Mpa) | Elasticity Modulus (Em/Gpa) | Density (ρ/t·m−3) | Poisson’s Ratio (μ) | Cohesion (Cm/Mpa) | Internal Friction Angle (φm/°) |
|---|---|---|---|---|---|---|---|
| Overburden Rock | 29.99 | 3.89 | 25.25 | 2.84 | 0.24 | 10.31 | 50.41 |
| Phyllite ore body (better) | 22.97 | 4.27 | 24.64 | 2970 | 0.34 | 3.33 | 43.39 |
| Phyllite ore body (poor) | 10.93 | 2.03 | 9.69 | 2970 | 0.34 | 3.33 | 43.39 |
| Floor | 18.23 | 3.75 | 20.69 | 2880 | 0.32 | 7.14 | 50.43 |
| Number of Tests | Mining Depth (m) | Compressive Strength (MPa) | Width of Mining Room (m) | Width of Mining Pillar (m) | Height of Stope (m) | Critical Height for Pillar Destabilization (m) |
|---|---|---|---|---|---|---|
| 1 | 300 | 11 | 10 | 12 | 20 | 20.7 |
| 2 | 300 | 12 | 12 | 14 | 30 | 32.1 |
| 3 | 300 | 13 | 14 | 16 | 40 | 43.7 |
| 4 | 300 | 14 | 16 | 18 | 50 | 55.4 |
| 5 | 300 | 15 | 18 | 20 | 60 | 67.2 |
| 6 | 400 | 11 | 10 | 16 | 50 | 33.7 |
| 7 | 400 | 12 | 12 | 18 | 60 | 45.1 |
| 8 | 400 | 13 | 14 | 20 | 20 | 67.7 |
| 9 | 400 | 14 | 16 | 12 | 30 | 44.9 |
| 10 | 400 | 15 | 18 | 14 | 40 | 16.0 |
| 11 | 500 | 11 | 10 | 20 | 30 | 57.3 |
| 12 | 500 | 12 | 12 | 12 | 40 | 49.6 |
| 13 | 500 | 13 | 14 | 14 | 50 | 39.5 |
| 14 | 500 | 14 | 16 | 16 | 60 | 17.1 |
| 15 | 500 | 15 | 18 | 18 | 20 | 31.6 |
| 16 | 600 | 11 | 10 | 14 | 60 | 42.8 |
| 17 | 600 | 12 | 12 | 16 | 20 | 66.6 |
| 18 | 600 | 13 | 14 | 18 | 30 | 22.4 |
| 19 | 600 | 14 | 16 | 20 | 40 | 33.7 |
| 20 | 600 | 15 | 18 | 12 | 50 | 23.5 |
| 21 | 700 | 11 | 10 | 18 | 40 | 71.2 |
| 25 | 700 | 12 | 12 | 20 | 50 | 23.5 |
| h1 | 42.02 | 43.82 | 45.14 | 19.94 | 31.4 | |
| h2 | 40.04 | 41.48 | 43.38 | 29.88 | 32.68 | |
| h3 | 37.16 | 39.02 | 38.32 | 40.52 | 40.82 | |
| h4 | 35.84 | 37.8 | 36.82 | 51.7 | 45.14 | |
| h5 | 36.24 | 37.8 | 36.26 | 57.88 | 49.88 | |
| R | 6.02 | 8.88 | 37.94 | 18.48 | 8.80 |
| Main Influencing Factors | Fitting Methods | Fitting Formula | Correlation Coefficient |
|---|---|---|---|
| Depth of Mining | Linear Function | 0.98279 | |
| Exponential Function | 0.98896 | ||
| Power Function | 0.99827 | ||
| Logarithmic Function | 0.99976 | ||
| Width of Mine Room | Linear Function | 0.99683 | |
| Exponential Function | 0.99962 | ||
| Power Function | 0.99853 | ||
| Logarithmic Function | 0.99983 | ||
| Compressive Strength | Linear Function | 0.98682 | |
| Exponential Function | 0.98707 | ||
| Power Function | 0.98765 | ||
| Logarithmic Function | 0.87614 | ||
| Width of Mine Pillar | Linear Function | 0.99778 | |
| Exponential Function | 0.98247 | ||
| Power Function | 0.99769 | ||
| Logarithmic Function | 0.99999 | ||
| Height of the Stope | Linear Function | 0.98822 | |
| Exponential Function | 0.98161 | ||
| Power Function | 0.90038 | ||
| Logarithmic Function | 0.98000 |
| Test Stope | Design Parameters of the Stope | Volume of the 3D Model of the Goaf(V2/m3) | Deviation Factor * (f/%) | |||
|---|---|---|---|---|---|---|
| Length (m) | Width (m) | Height (m) | Volume (V1/m3) | |||
| 1# | 50 | 12 | 25 | 12,511 | 12,787 | 2.21 |
| 2# | 50 | 12 | 30 | 15,405.5 | 15,752 | 2.25 |
| 3# | 50 | 12 | 50 | 27,292.5 | 27,665.5 | 1.37 |
Disclaimer/Publisher’s Note: The statements, opinions and data contained in all publications are solely those of the individual author(s) and contributor(s) and not of MDPI and/or the editor(s). MDPI and/or the editor(s) disclaim responsibility for any injury to people or property resulting from any ideas, methods, instructions or products referred to in the content. |
© 2024 by the authors. Licensee MDPI, Basel, Switzerland. This article is an open access article distributed under the terms and conditions of the Creative Commons Attribution (CC BY) license (https://creativecommons.org/licenses/by/4.0/).
Share and Cite
Zhang, Q.; Zhang, P.; Chen, Q.; Li, H.; Song, Z.; Tao, Y. Study of the Critical Safe Height of Goaf in Underground Metal Mines. Minerals 2024, 14, 227. https://doi.org/10.3390/min14030227
Zhang Q, Zhang P, Chen Q, Li H, Song Z, Tao Y. Study of the Critical Safe Height of Goaf in Underground Metal Mines. Minerals. 2024; 14(3):227. https://doi.org/10.3390/min14030227
Chicago/Turabian StyleZhang, Qinli, Peng Zhang, Qiusong Chen, Hongpeng Li, Zian Song, and Yunbo Tao. 2024. "Study of the Critical Safe Height of Goaf in Underground Metal Mines" Minerals 14, no. 3: 227. https://doi.org/10.3390/min14030227
APA StyleZhang, Q., Zhang, P., Chen, Q., Li, H., Song, Z., & Tao, Y. (2024). Study of the Critical Safe Height of Goaf in Underground Metal Mines. Minerals, 14(3), 227. https://doi.org/10.3390/min14030227