Article

Determining the Metabolic Processes of Metal-Tolerant Fungi Isolated from Mine Tailings for Bioleaching

Centre for Competence in Environmental Biotechnology, Department of Environmental Sciences, College of Animal and Environmental Science, University of South Africa, Florida Science Campus, Roodepoort 1709, South Africa
*
Author to whom correspondence should be addressed.
Minerals 2024, 14(3), 235; https://doi.org/10.3390/min14030235
Submission received: 30 November 2023 / Revised: 23 February 2024 / Accepted: 24 February 2024 / Published: 26 February 2024
(This article belongs to the Special Issue Bioremediation of Contaminants in Mine Areas)

Abstract

:
This study examined the metal tolerance and organic acid-producing capabilities of fungal isolates from South African tailings to assess their potential for future bioleaching applications. Four isolates were chosen for additional examination based on their capacity to generate organic acids and tolerance to metals. In terms of tolerance to Al, Zn, Ni, and Cr, these four isolates—Trichoderma, Talaromyces, Penicillium_3, and Penicillium_6—displayed varying degrees of resistance, with Trichoderma displaying a better metal tolerance index. The growth rates under metal stress varied among the isolates, with Trichoderma displaying the highest growth rates. In high-performance liquid chromatography results, citric acid emerged as the primary organic acid produced by the four isolates, with Trichoderma achieving the highest yield in the shortest timeframe. Gas chromatography–mass spectrometry results showed that the citric acid cycle is one of the main pathways for organic acid production, though other pathways related to lipid biosynthesis and carbohydrate metabolism also play significant roles. Three compounds involved in furfural breakdown were abundant. Using KEGG, a link between these compounds and the citric acid cycle was established, where their breakdown generates an intermediate of the citric acid cycle.

1. Introduction

The fungal domain is known for its remarkable metabolic versatility that enables these organisms to thrive in diverse environments such as metal-rich mine tailings [1,2]. These microorganisms have gained attention for their ability to produce secondary metabolites, particularly organic acids, with wide-ranging industrial applications, from pharmaceuticals to bioleaching [3,4]. In bioleaching, an eco-friendly approach for metal extraction, organic acids are the main leaching agents [5,6]. Consequently, the efficiency of metal solubilization depends on the continuous production of organic acids [7,8,9,10,11]. The production of organic acids is a result of microbial metabolic activities, and as a result, challenges such as slow kinetics and low yields are often expected during bioleaching processes [12,13,14].
Slow kinetics arise from various factors, including limited nutrient availability, metal toxicity, adaptability requirements, and environmental conditions [15]. For instance, before organic acids can be produced, cells must first utilize nutrients, grow, and multiply. Furthermore, the type of metal, carbon source, and the fungal genus or species play pivotal roles in determining the type of organic acid produced. For example, when grown in glucose-containing media, Aspergillus niger produces citric acid as the main organic acid whereas Aspergillus flavus produces malic acid [16,17]. Moreover, citric acid production varies when environmental conditions involve metals. For instance, in the presence of aluminum, A. niger produces citric acid as the main organic acid, but in the presence of manganese, citric acid production is inhibited while favoring the production of oxalic acid [18,19,20].
Organic acids are the main leaching agents in metal bioleaching by fungi, employing mechanisms like acidolysis (direct interaction of organic acid with metal-containing minerals) and complexolysis (formation of stable complexes between organic acids and metal ions) [5,6]. Consequently, organic acids such as citric and oxalic acid are known to bioleach metals such as Aluminum (Al), Chromium (Cr), Copper (Cu), Iron (Fe), Manganese (Mn), Nickel (Ni), and Zinc (Zn), with citric acid being more efficient than oxalic acid [21,22,23,24]. In fungi, the production of organic acids is intricately linked to their utilization of carbon sources. As a result, bioleaching studies determine and use optimal carbon sources for organic acid production to improve bioleaching process efficiency [11]. While this is a crucial step in optimizing fungal bioleaching, gaining a deeper understanding of carbon utilization at the metabolic level is imperative. This can be achieved through approaches like metabolomics, offering insights into the upregulated metabolic pathways during fungal carbon utilization and subsequent conversion into organic acids [25]. Such knowledge opens new avenues for process optimization.
In addition to organic acid production, fungal isolates with bioleaching potential should also demonstrate metal tolerance [26,27]. The challenges encountered during bioleaching processes, particularly slow kinetics and low metal yields, are exacerbated by elevated metal concentrations, which trigger adaptation and stress response mechanisms in fungal organisms [28]. Metal toxicity can disrupt growth phases, such as prolonging the lag phase, hindering organic acid production, or even completely inhibiting fungal growth [29]. To address these challenges, harnessing indigenous microbial communities adapted to extreme environments with high metal concentrations and low pH becomes advantageous [30]. These native microorganisms likely possess stress response mechanisms that facilitate efficient growth and potential bioleaching activities in metal-rich environments such as tailings.
As high-grade ores become depleted and the demand for metals increases, tailings become an increasingly attractive source of metals due to their accessibility [31,32]. Compared to other low-grade ores, re-extracting metals from tailings is more cost-effective because the minerals are already finely ground and exposed on the surface. Recent studies have demonstrated successful metal extraction from tailings, including phosphate, aluminum, magnesium, and zinc [33,34].
In this study, fungal isolates were obtained from mine tailings samples in South Africa with the objective of assessing their growth rates under various metal stresses to determine their metal tolerance and potential suitability for bioleaching. Furthermore, we investigated their organic acid production during growth stages at the metabolic level, using glucose as the carbon source to identify enriched metabolic pathways with significant importance towards organic acid production. This knowledge will contribute towards the optimization of the bioleaching process using fungal isolates with similar characteristics.

2. Materials and Methods

2.1. Fungal Isolation and Identification

Tailing samples were collected in Krugersdorp, a mining city in Gauteng province, South Africa, as previously described by Nkuna et al. [35]. To isolate fungi, we initially enriched microorganisms in the tailing samples using the media listed in Table 1, following the media outlined by Nkuna et al. [35]. Fungal isolates were obtained from enriched tailing samples using the same media, with slight modification involving the addition of 1.5% bacteriological agar. The purified isolates were stored in slants. For identification, ITS1—5′ CTTGGTCATTTAGAGGAAGTAA-3′ and ITS4—5′ CCTCCGCTTATTGATATGC-3′ primers were used to amplify the ITS gene of the pure isolates using extracted gDNA (BIOMICS extraction kit, Inqaba Biotech) as a template for the polymerase chain reaction (PCR) ([36]. Amplified genes were visualized using 1% gel electrophoresis. The PCR products containing the amplified ITS genes were sequenced at Inqaba Biotechnical Industries (Pty) Ltd, Pretoria, South Africa, using the ABI Big dye V3.1 kit according to the manufacturer’s instructions and sequenced using the ABI 3500XL genetic analyzer. The sequences were aligned using ClustalW multiple alignment on BioEdit and MAFFT—an online version of a multiple sequence alignment program. Operational taxonomic units (OTUs) were generated using MOTHUR to group similar species at a 97% similarity threshold. The representative OTU sequences were then compared to sequences in the GenBank database for identification.

2.2. Screening for Organic Acid Production and Metal Tolerance

Fifteen representative fungal isolates (based on OTUs) were screened for their organic acid production and metal tolerance using qualitative and quantitative assays. A flow diagram, showing a generalized quantitative and qualitative screening method where methods can be found in Figure S1.

2.2.1. Qualitative Assay

The isolates were grown in glucose yeast extract agar (GYEA) supplemented with 1% bromophenol blue indicator for organic acid screening. Five-millimeter mycelial plugs of fresh pure isolates (5–7 days old) were inoculated and incubated at 30 °C for 5–7 days. After incubation, the plates were observed for color change, where a yellow coloration of the medium indicated the production of organic acids [11]. The colony size as well as the color change around the colony were measured using a digital caliper (mm). Acid unitage (AU) was calculated using Formula (1) [42]. The same 15 isolates were also screened for their tolerance to Al, Zn, Ni, and Cr. Ten microliters of fungal spores was spread on GYEA media supplemented with 100 mg/L of each heavy metal [27]. Metal tolerance was determined by visible growth after 72 h of incubation at 30 °C.
A c i d   U n i t a g e A U = F u n g i   z o n e   w i t h   y e l l o w   h a l o   ( m m ) Z o n e   w i t h   F u n g i   ( m m )

2.2.2. Quantitative Analysis

Organic acid: Fresh fungal isolates were grown in glucose yeast extract broth (GYEB) for 5 days at 30 °C in a shaking incubator. The pH of the medium was adjusted to 5.5. After incubation, the final pH was measured.
Metal tolerance: Based on the qualitative organic acid assay, metal tolerance, and quantitative organic acid assay, isolates were selected for metal tolerance and growth rates assay. The isolates were grown in GYEA supplemented with increasing concentrations of metals as follows: Al from 100 to 1600 mg/L, Zn from 100 to 1000 mg/L, Ni from 100 to 400 mg/L, and Cr from 50 to 210 mg/L. To induce tolerance, each organism was allowed to grow for 5 days in one concentration of metal before being transferred to the next concentration. At each concentration, the measured growth diameter from the metal supplemented agar and the controls were used to calculate the tolerance index (TI) using Formula (2) [26].
T o l e r a n c e   I n d e x T I = F u n g a l   g r o w t h   i n   t h e   p r e s e n c e   o f   m e t a l   ( m m ) F u n g a l   g r o w t h   w i t h o u t   m e t a l   e x p o s u r e   ( m m )
  • Growth rate assays
Once the minimum inhibitory concentration (MIC) of metals was reached, the lowest and highest metal concentration (or the ones that showed susceptibility) were used to study the metal tolerance behavior, that is, the effect of metals on the growth phases of the fungi and growth rates (kd) of each isolate. MIC refers to the minimum heavy metal concentration that entirely inhibits the noticeable growth of microorganisms. In the metal tolerance behavior and growth rates experiment, a fresh fungal mycelia plug (5 mm) was aseptically inoculated onto the center of sterilized modified GYEA supplemented with each heavy metal. The plates were incubated at 30 °C for 5–7 days. The metal tolerance index was determined by measuring the diameter of the colonies with a digital caliper (RS PRO Pty Ltd., Midrand, South Africa) daily and used to plot a growth phase graph. The growth phase graph was interpreted using Figure 1. The kd of an individual fungus was determined by following Equation (3) [27].
k d = D / T
where D is the average diameter (mm) of the fungal colony (excluding the diameter of the inoculum, 5 mm), and T is the time (period) in hours (h).

2.3. Carbon Source for Organic Acid Production

2.3.1. Screening for Carbon Source

The ability of the four selected isolates to produce organic acids was further investigated using GYEB. The broth was supplemented with 30 g/L of either glucose, sucrose, or fructose, and the initial pH was adjusted to approximately 5.5. Five-millimeter mycelial plugs of freshly grown fungal isolates were inoculated into 100 mL broth containing either glucose or sucrose as the carbon source. The inoculated broth was incubated at 30 °C in a shaking incubator at 120 rpm for 5 days. After incubation, a cell-free extract was prepared by syringe-filtering the fungal culture using 0.2 µm filters. The filtrate was collected in 5 mL tubes to analyze for a decrease in pH and to determine the molarity of the produced organic acid. The filtrate was titrated against 0.1 M sodium hydroxide (NaOH) using a phenolphthalein indicator (0.5/100 mL). The molarity was determined by the formula below [11].
M a = M b V b V a
where Ma = the unknown molarity of organic acids, Va = the volume of the organic acid sample, Mb = the known molarity of Sodium Hydroxide solution, and Vb = the volume of NaOH.

2.3.2. Organic Acid and Metabolites Identification

The carbon source best utilized by the four isolates was selected based on the results obtained above. The isolates were grown as indicated above, except that 100 g/L of glucose was used. The collected samples were sent to the University of the Witwatersrand, South Africa, for gas chromatography–mass spectrometry (GC-MS) and high-performance liquid chromatography (HPLC) analyses. The HPLC was conducted as follows: The standard solutions were injected into the HPLC instrument (Agilent 1200 series) followed by the samples. The injection volume was 20 µL, with a flow rate of 1 mL/min, and 0.2 mL of sulfuric acid in 1L of deionized water was used as the mobile phase. The separation of components took place in a Bio-Rad fermentation column at a temperature of 65 °C. The separated components were then detected by the refractive index column, and the profile was observed. Quantification and detection were performed using Agilent CDS Open Lab software Rev c.01.10 (287). The GC-MS analysis was performed as follows: 1 µL sample was injected into a Shimadzu GC-MS-QP2010 Ultra instrument using the split injection method. The injector temperature was kept at 260 °C, while the oven temperature was held at 60 °C for 3 min before being ramped up to 280 °C and held there for 19 min. This resulted in a total run time of 21 min. The ion source temperature was kept at 200 °C.

3. Results

3.1. Microbial Isolation and Identification

A total of 60 fungal isolates were obtained from the different enriched tailing samples using different media as listed in Table 1. Most isolates were obtained from GYEA (67%) and YSM (23%).
To identify the fungal diversity, the Sanger sequences of each isolate were clustered into operational taxonomic units (OTUs) at a similarity of 97%. This analysis yielded 15 distinct OTUs, which were then compared to reference sequences in the NCBI database for taxonomic classification. The results revealed the presence of eight different fungal genera within the 15 OTUs. Penicillium emerged as the most abundant genus, followed by Trichoderma (see Figure S2). Table S1 provides a comprehensive overview of the 15 representative OTUs, their assigned genera, and their corresponding accession numbers.

3.2. Qualitative Screening

Two critical qualities for potential bioleaching fungi are organic acid production and metal tolerance [44,45]. To assess these qualities, the 15 isolates underwent screening. Among these 15 isolates, 12 were found to be positive for organic acid production, as indicated by the formation of a yellow zone on GYEA plates supplemented with bromophenol blue. Notably, the highest AU, exceeding 2, was observed in Penicillium_2 and Penicillium_3 (Table 2). Further evaluation of organic acid production employed a quantitative assay, wherein the isolates were cultured in GYEB, and the resulting decrease in pH was measured. As depicted in Table 2, Penicillium_6, Penicillium_3, Trichoderma, Fusarium, and Talaromyces exhibited a decrease in pH to below 4, with Talaromyces recording the lowest at 3.46.
For qualitative metal tolerance screening, growth appearance was used to determine positive results. These results were categorized as follows: visible growth (+), good visible growth (++), and very good visible growth (+++) [27]. Most fungal isolates displayed very good visible growth when cultivated on GYEA supplemented with 100 mg/L of Al, Zn, and Ni (Table S2). However, only Penicillium_6, Penicillium_3, and Trichoderma exhibited positive results for Cr tolerance. Consequently, based on the results of quantitative organic acid assays and qualitative metal tolerance screening, Trichoderma, Talaromyces, Penicillium_3, and Penicillium_6, were selected for further analysis due to their ability to achieve the lowest pH levels and their tolerance to all five metals. Talaromyces, while able to tolerate only four metals, was included due to having the lowest pH. Fusarium on the other hand was not included since its growth was inhibited by 100 mg/L of all the tested metals.

3.3. Quantitative Screening

The four selected isolates, Trichoderma, Talaromyces, Penicillium_3, and Penicillium_6, each underwent a quantitative metal tolerance screening using the tolerance index (TI) as the metric. This analysis assessed how their growth responded to different concentrations of four metals: Al, Zn, Ni, and Cr. A TI ≥ 1 signifies resistance or high metal tolerance, while a TI < 1 suggests low or no metal tolerance, indicating susceptibility. The results revealed Trichoderma as the most resilient isolate, demonstrating a higher tolerance (TI ≥ 1) to 300 mg/L of Al and Zn, as well as 100 mg/L of Ni (Figure 2). Conversely, the other three isolates showed a low metal tolerance (TI < 1) at these same metal concentrations. Talaromyces displayed the overall lowest tolerance among the three, consistently falling below 0.6 in TI across all metals tested. Interestingly, significant cell growth inhibition only occurred at higher metal concentrations across all isolates: 1600 mg/L for Al, 1000 mg/L for Zn, and 400 mg/L for Ni.
The growth rates (kd) of the four isolates were assessed as shown in Figure 3. It was observed that at 100 mg/L of Al, Zn, and Ni, Trichoderma exhibited higher growth rates compared to the control without added metal, while at the highest metal concentration, the metal toxicity affected the growth rates of Trichoderma. The other three isolates demonstrated lower kd values when compared to their controls.

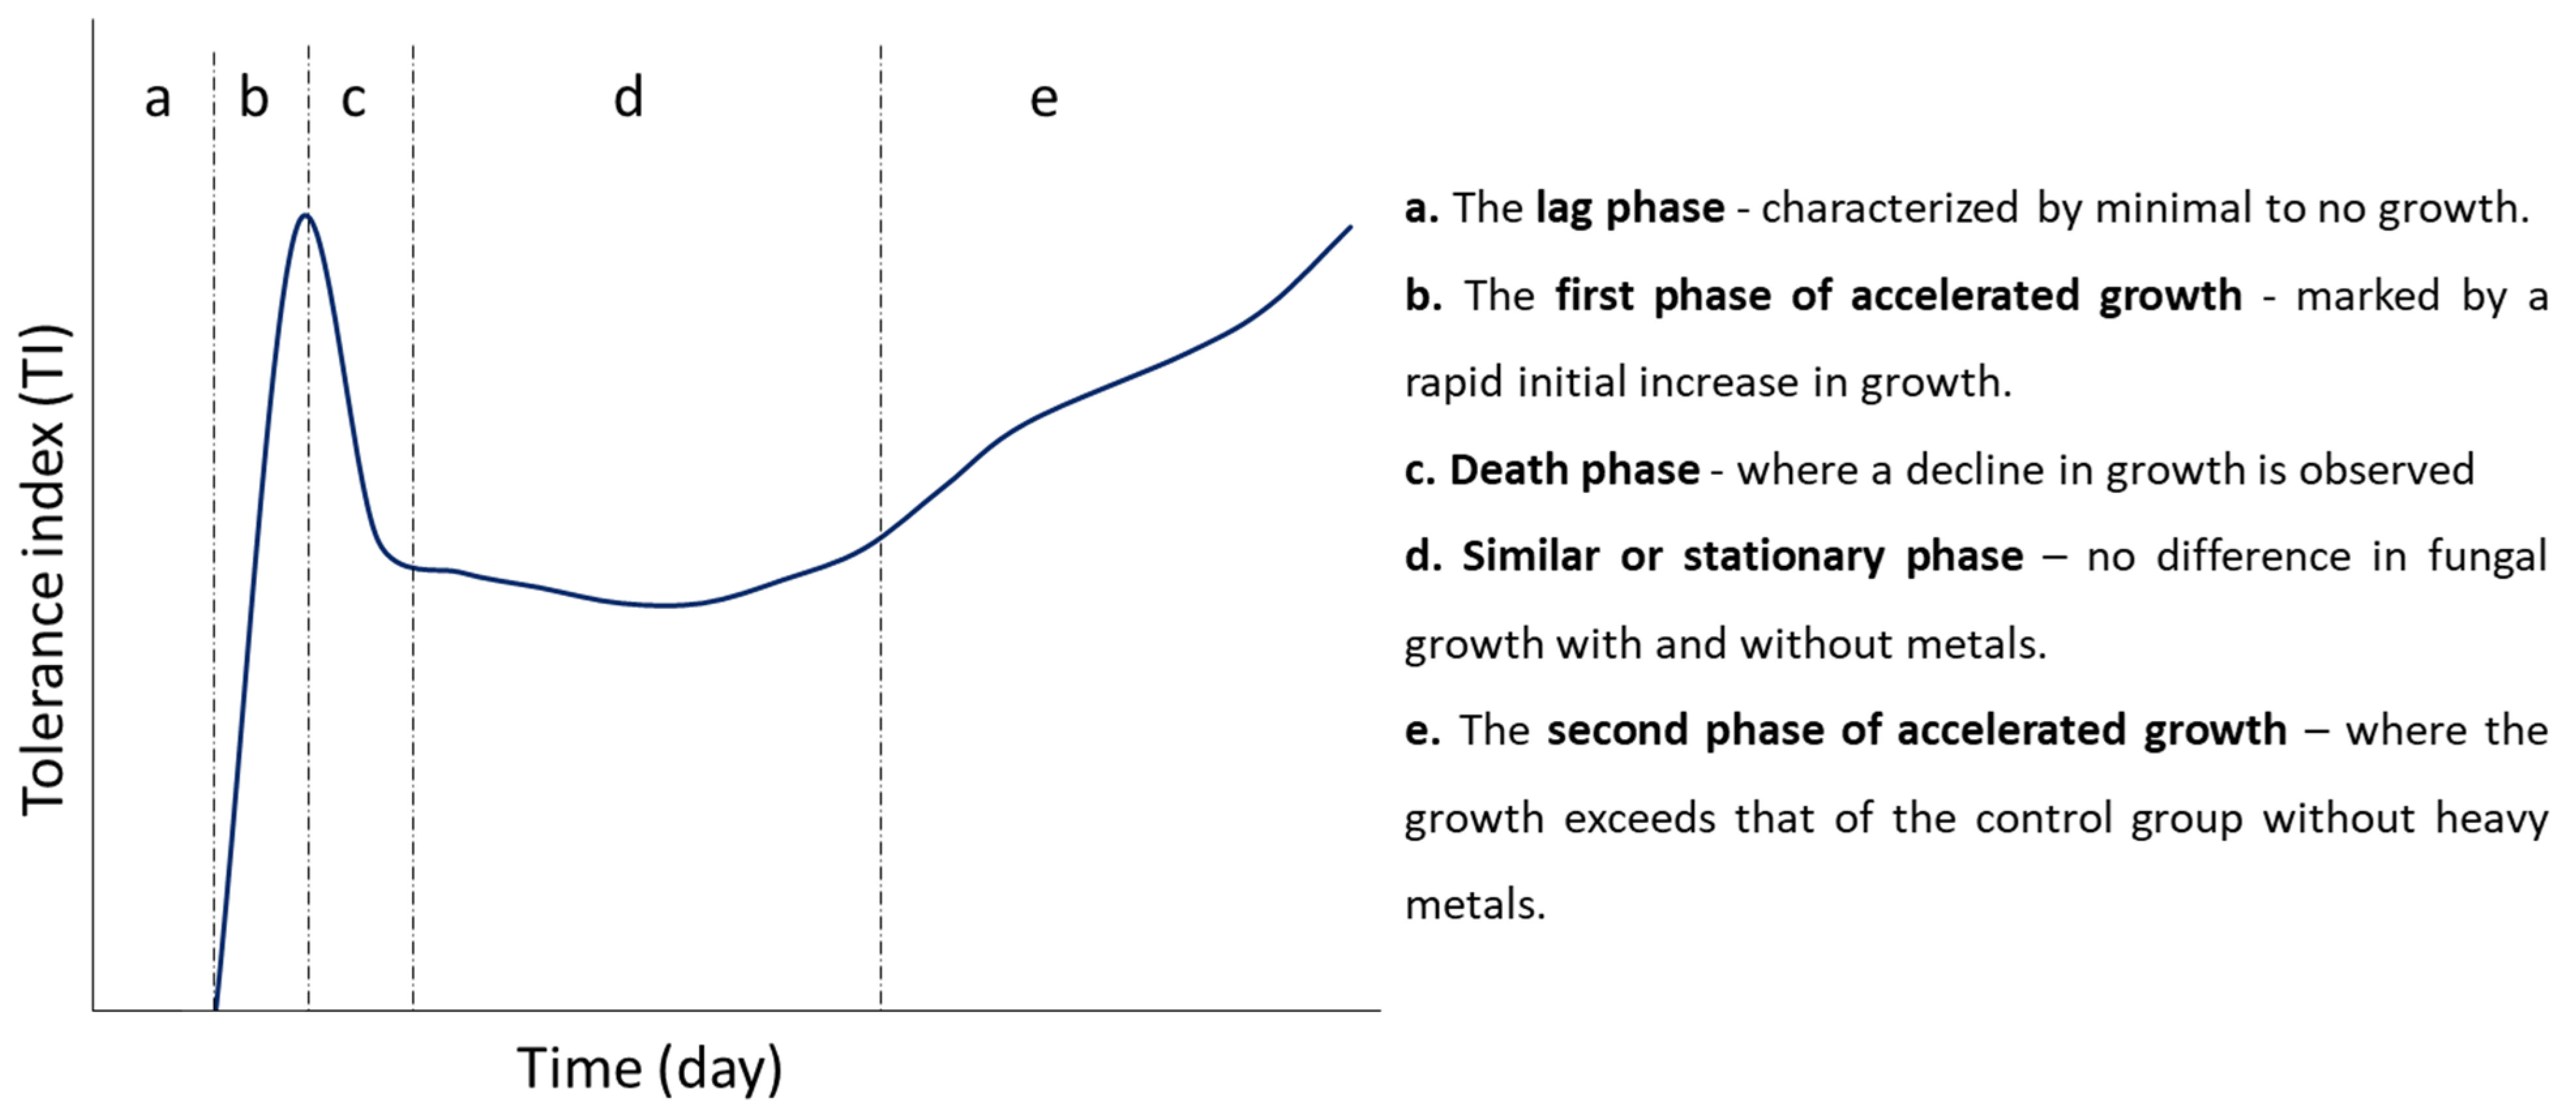
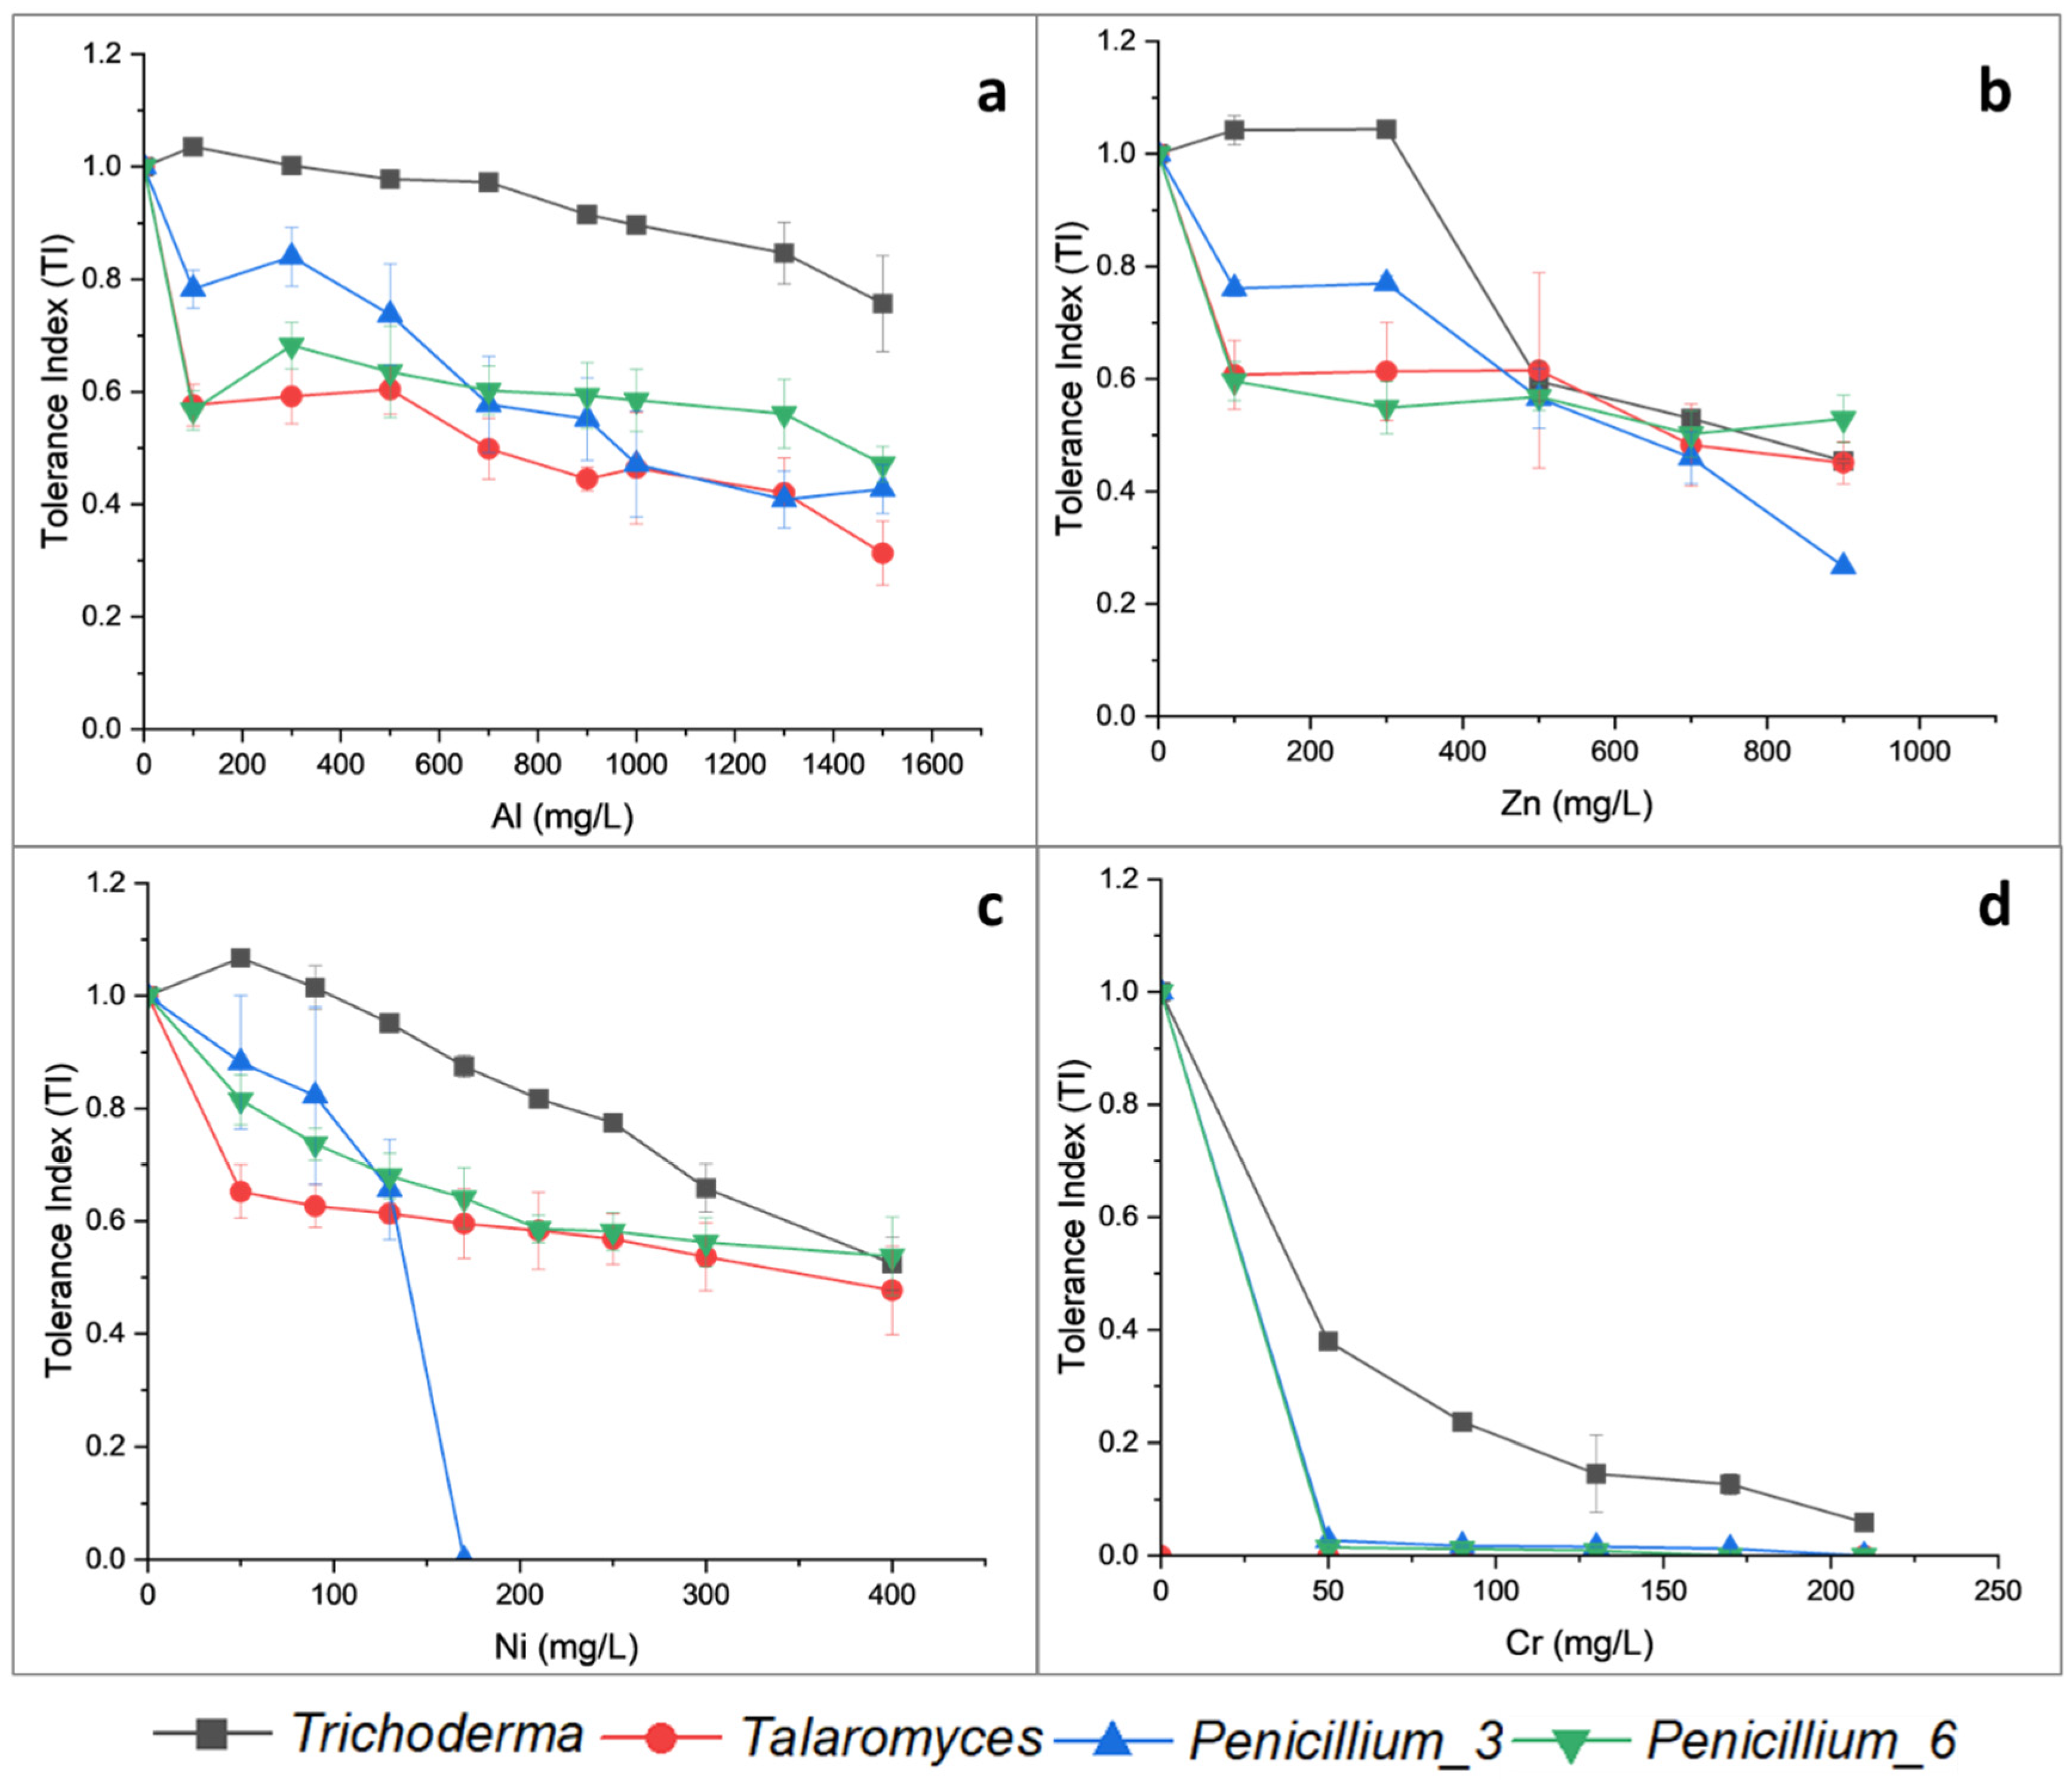
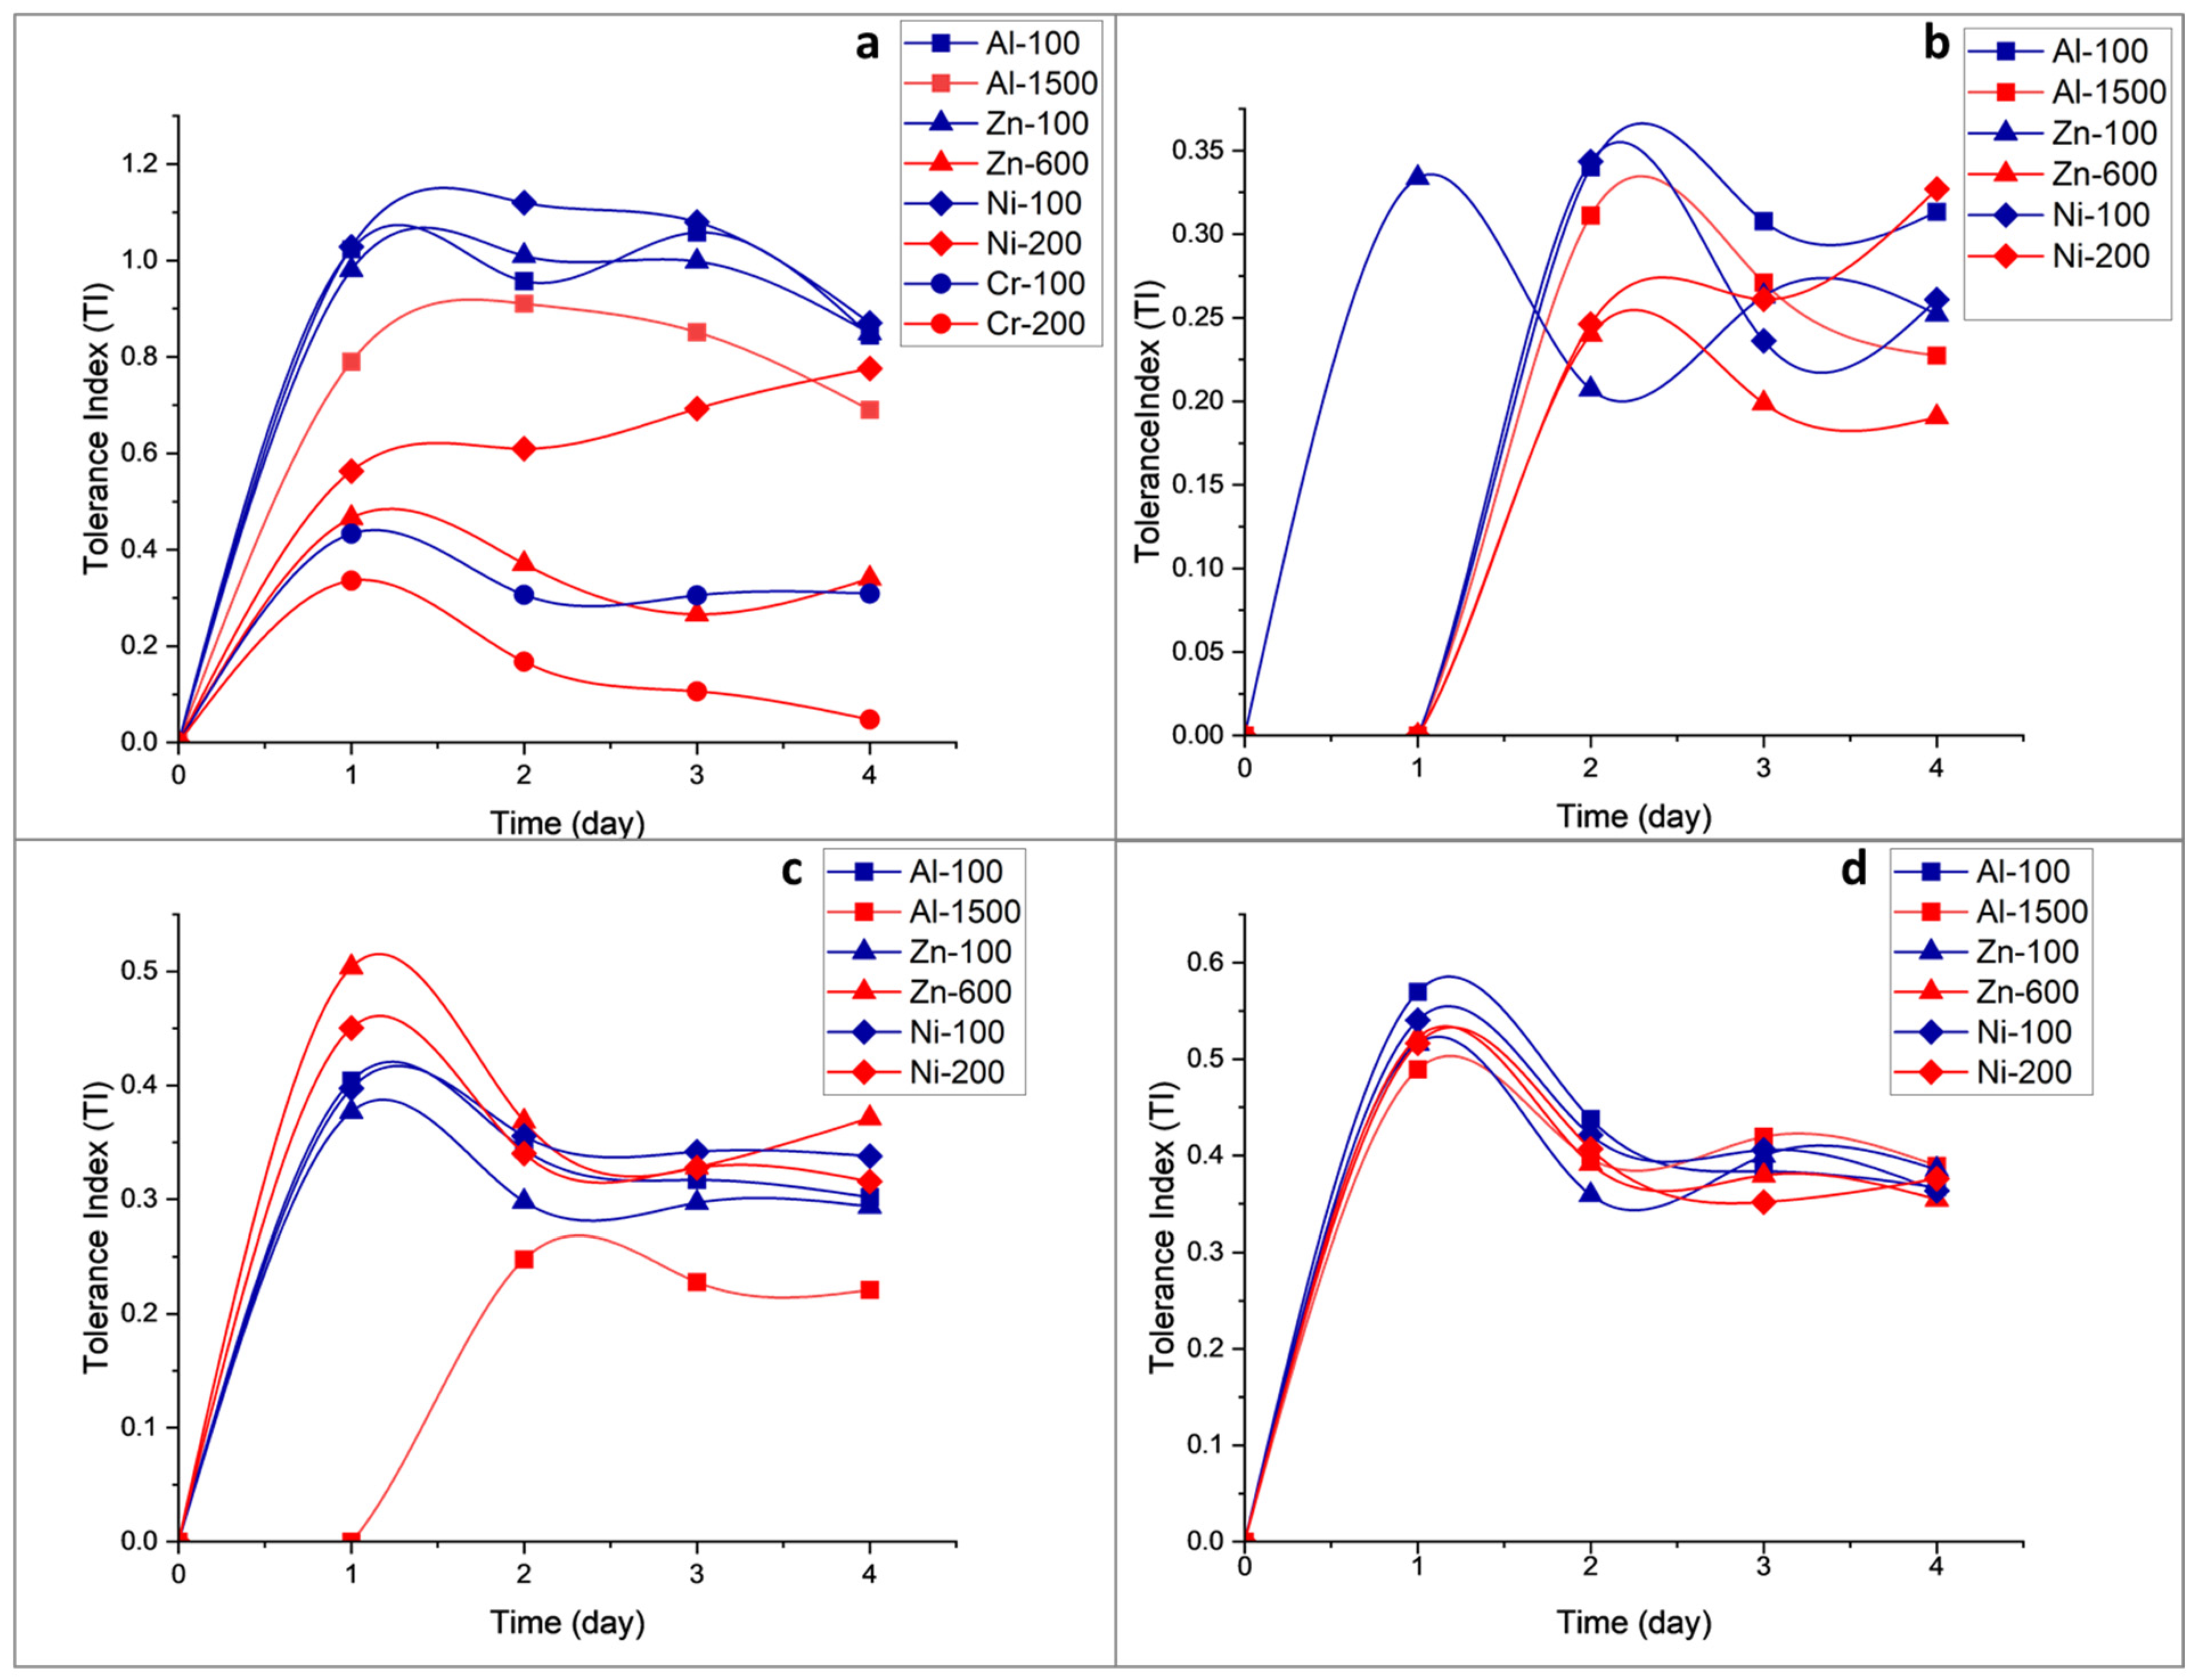
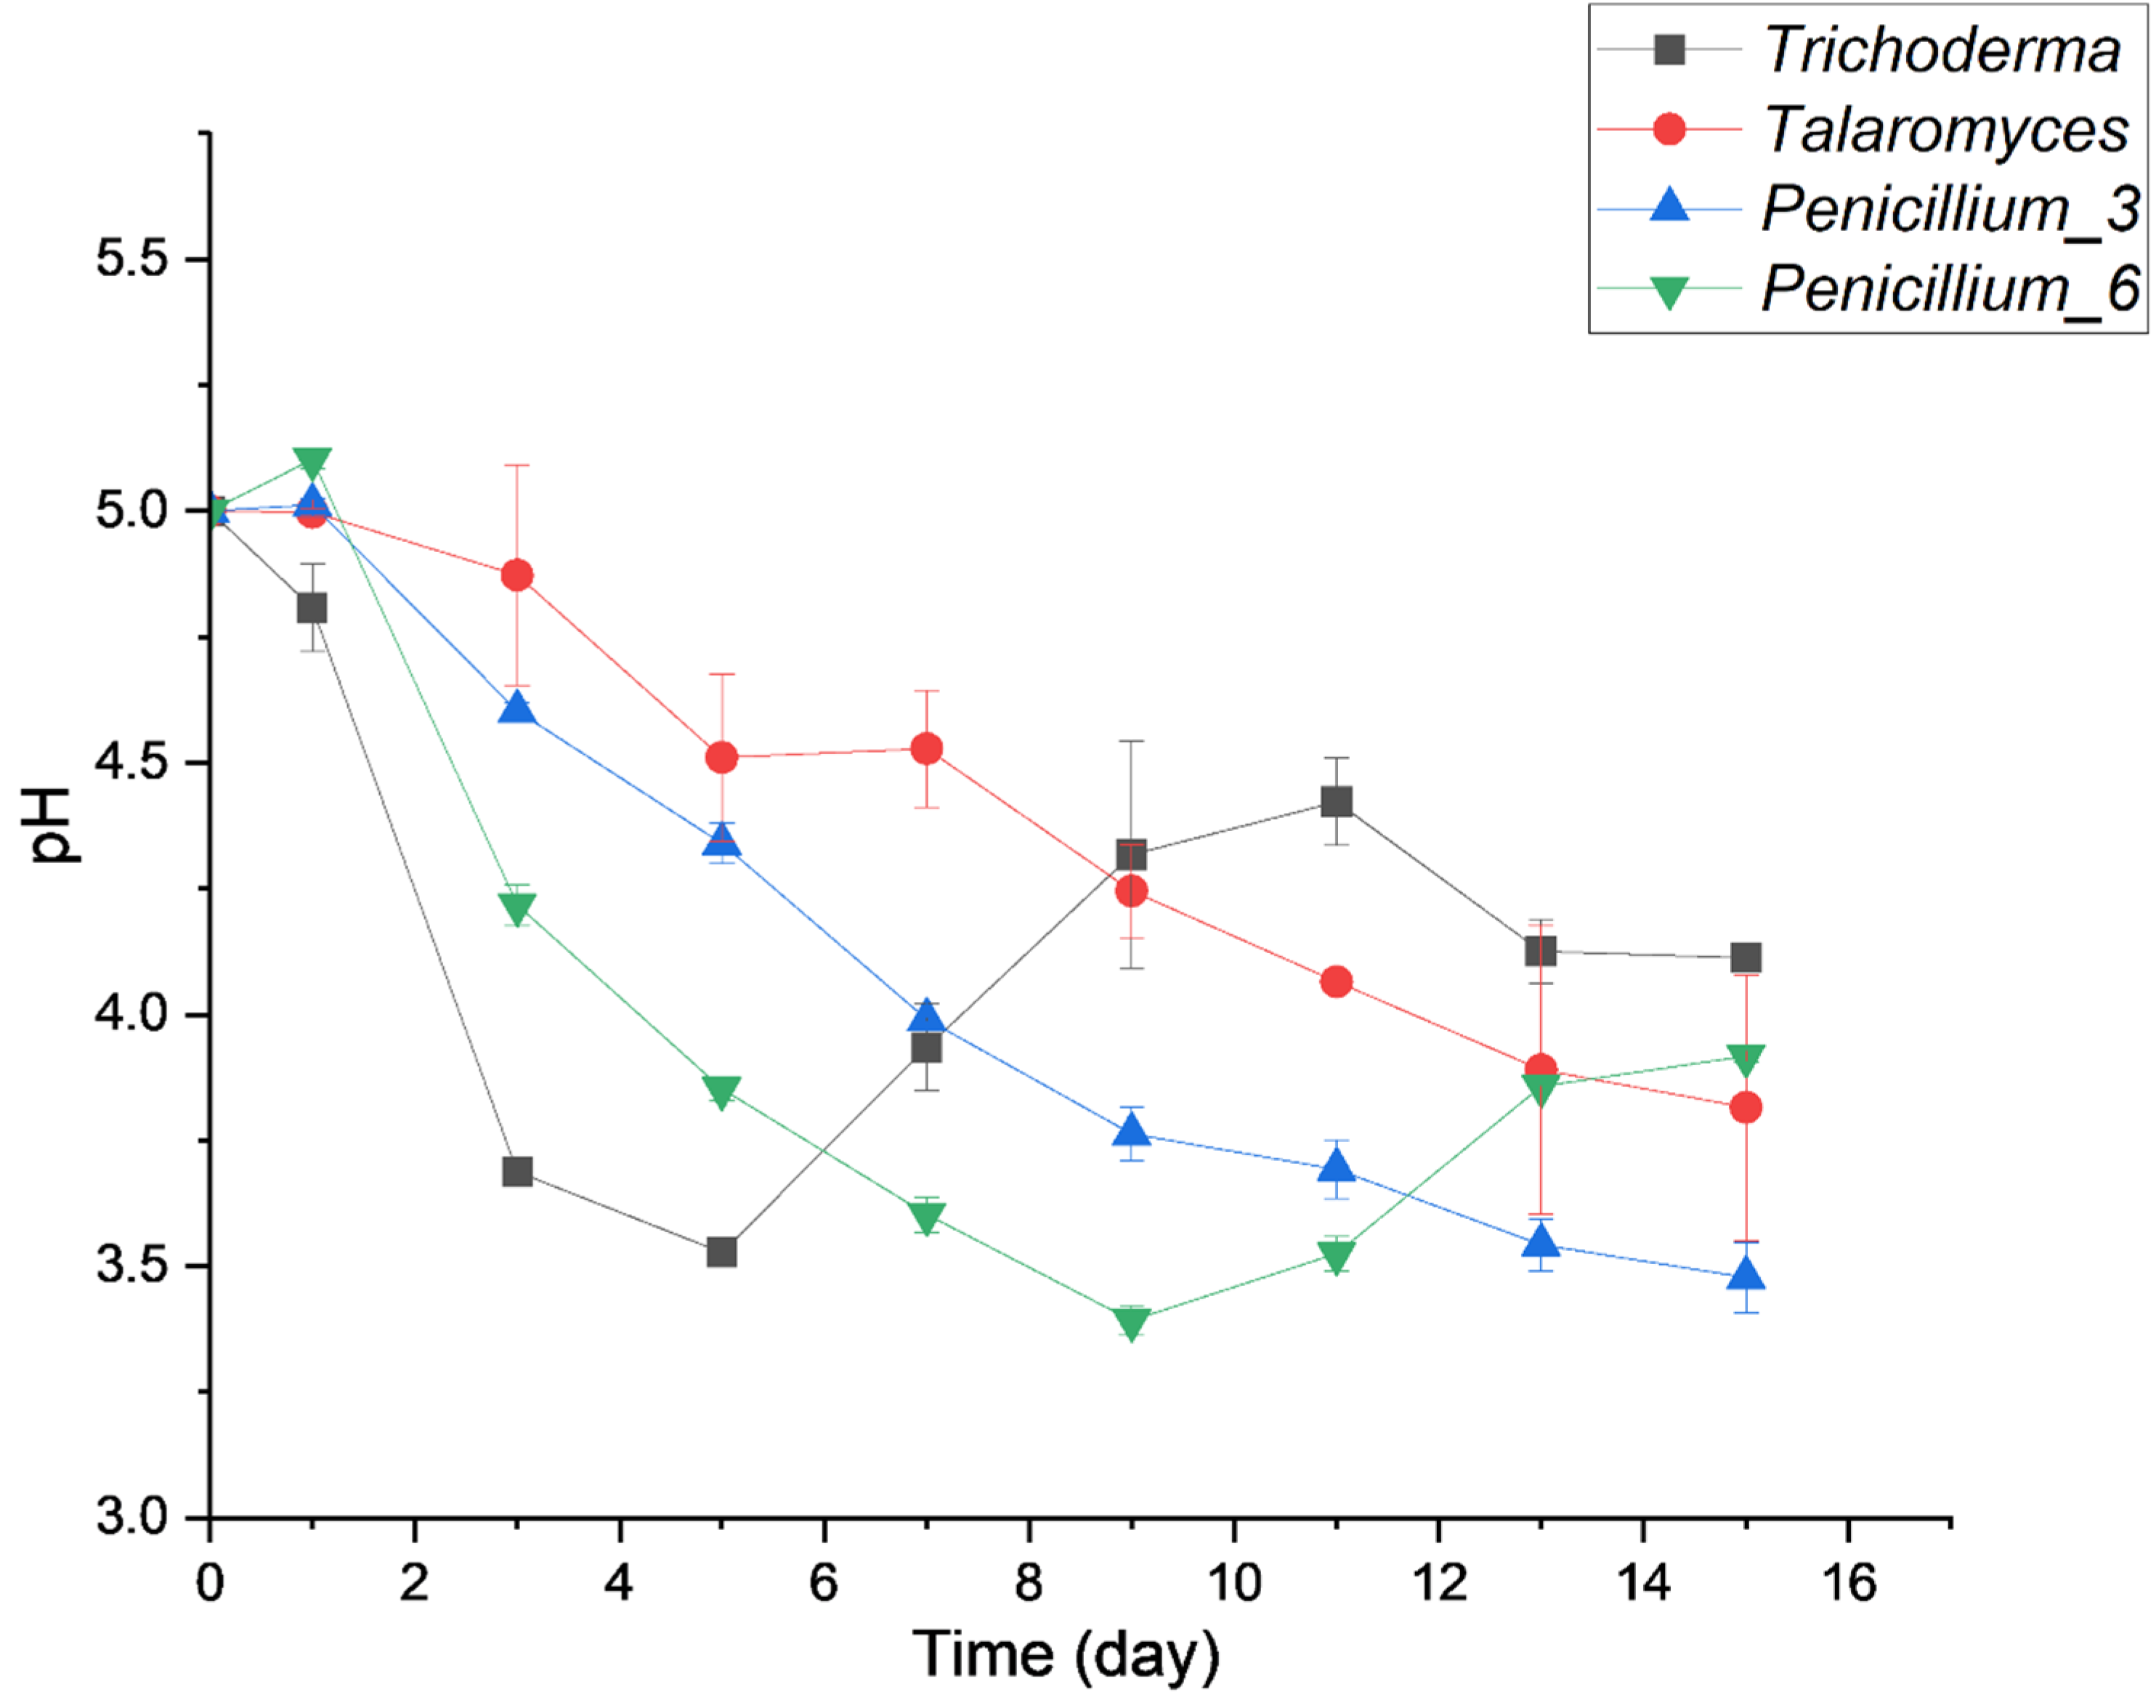
3.3.1. Effect of Heavy Metal Concentration on Fungal Growth Phases

To efficiently monitor the effect of metals on the growth of fungi, a five-growth-phase behavior of fungi under metal stress was used (Figure 1). This growth phase was initially proposed by Valix et al. [45] and Valix and Loon [26] and was also reported by Rose and Devi [27]. The five phases are indicated in Figure 3 and each phase is explained.
To assess the growth behavior of the four isolates in the presence of metals, two different concentrations of Al, Zn, Ni, and Cr were used as indicated in Figure 2. Ideally, the lowest concentration should be the one at which the organism demonstrates a TI greater than 1. However, this criterion is only applicable to Trichoderma. Nevertheless, we still evaluated the effect of metals on the growth rates of the other three organisms, using the initial metal concentration as the lowest. For all the organisms, the highest metal concentration differed per metal as depicted in Figure 2. When examining the growth behavior of Trichoderma (Figure 4a), it is evident that it does not follow the five-growth-phase behavior for Ni and Zn, both at the lowest and highest concentrations. For Al and Cr, we did observe a semblance of the five growth phases for Trichoderma, where phases b, c, and d were noticeable. In the case of Talaromyces, Penicillium_3, and Penicillium_6, five growth phases were observed for most metals at the lowest metal concentration. However, a noteworthy observation is the demonstration of susceptibility through an extended lag phase, especially in Talaromyces (Figure 4b) and Penicillium_3 (Figure 4c).

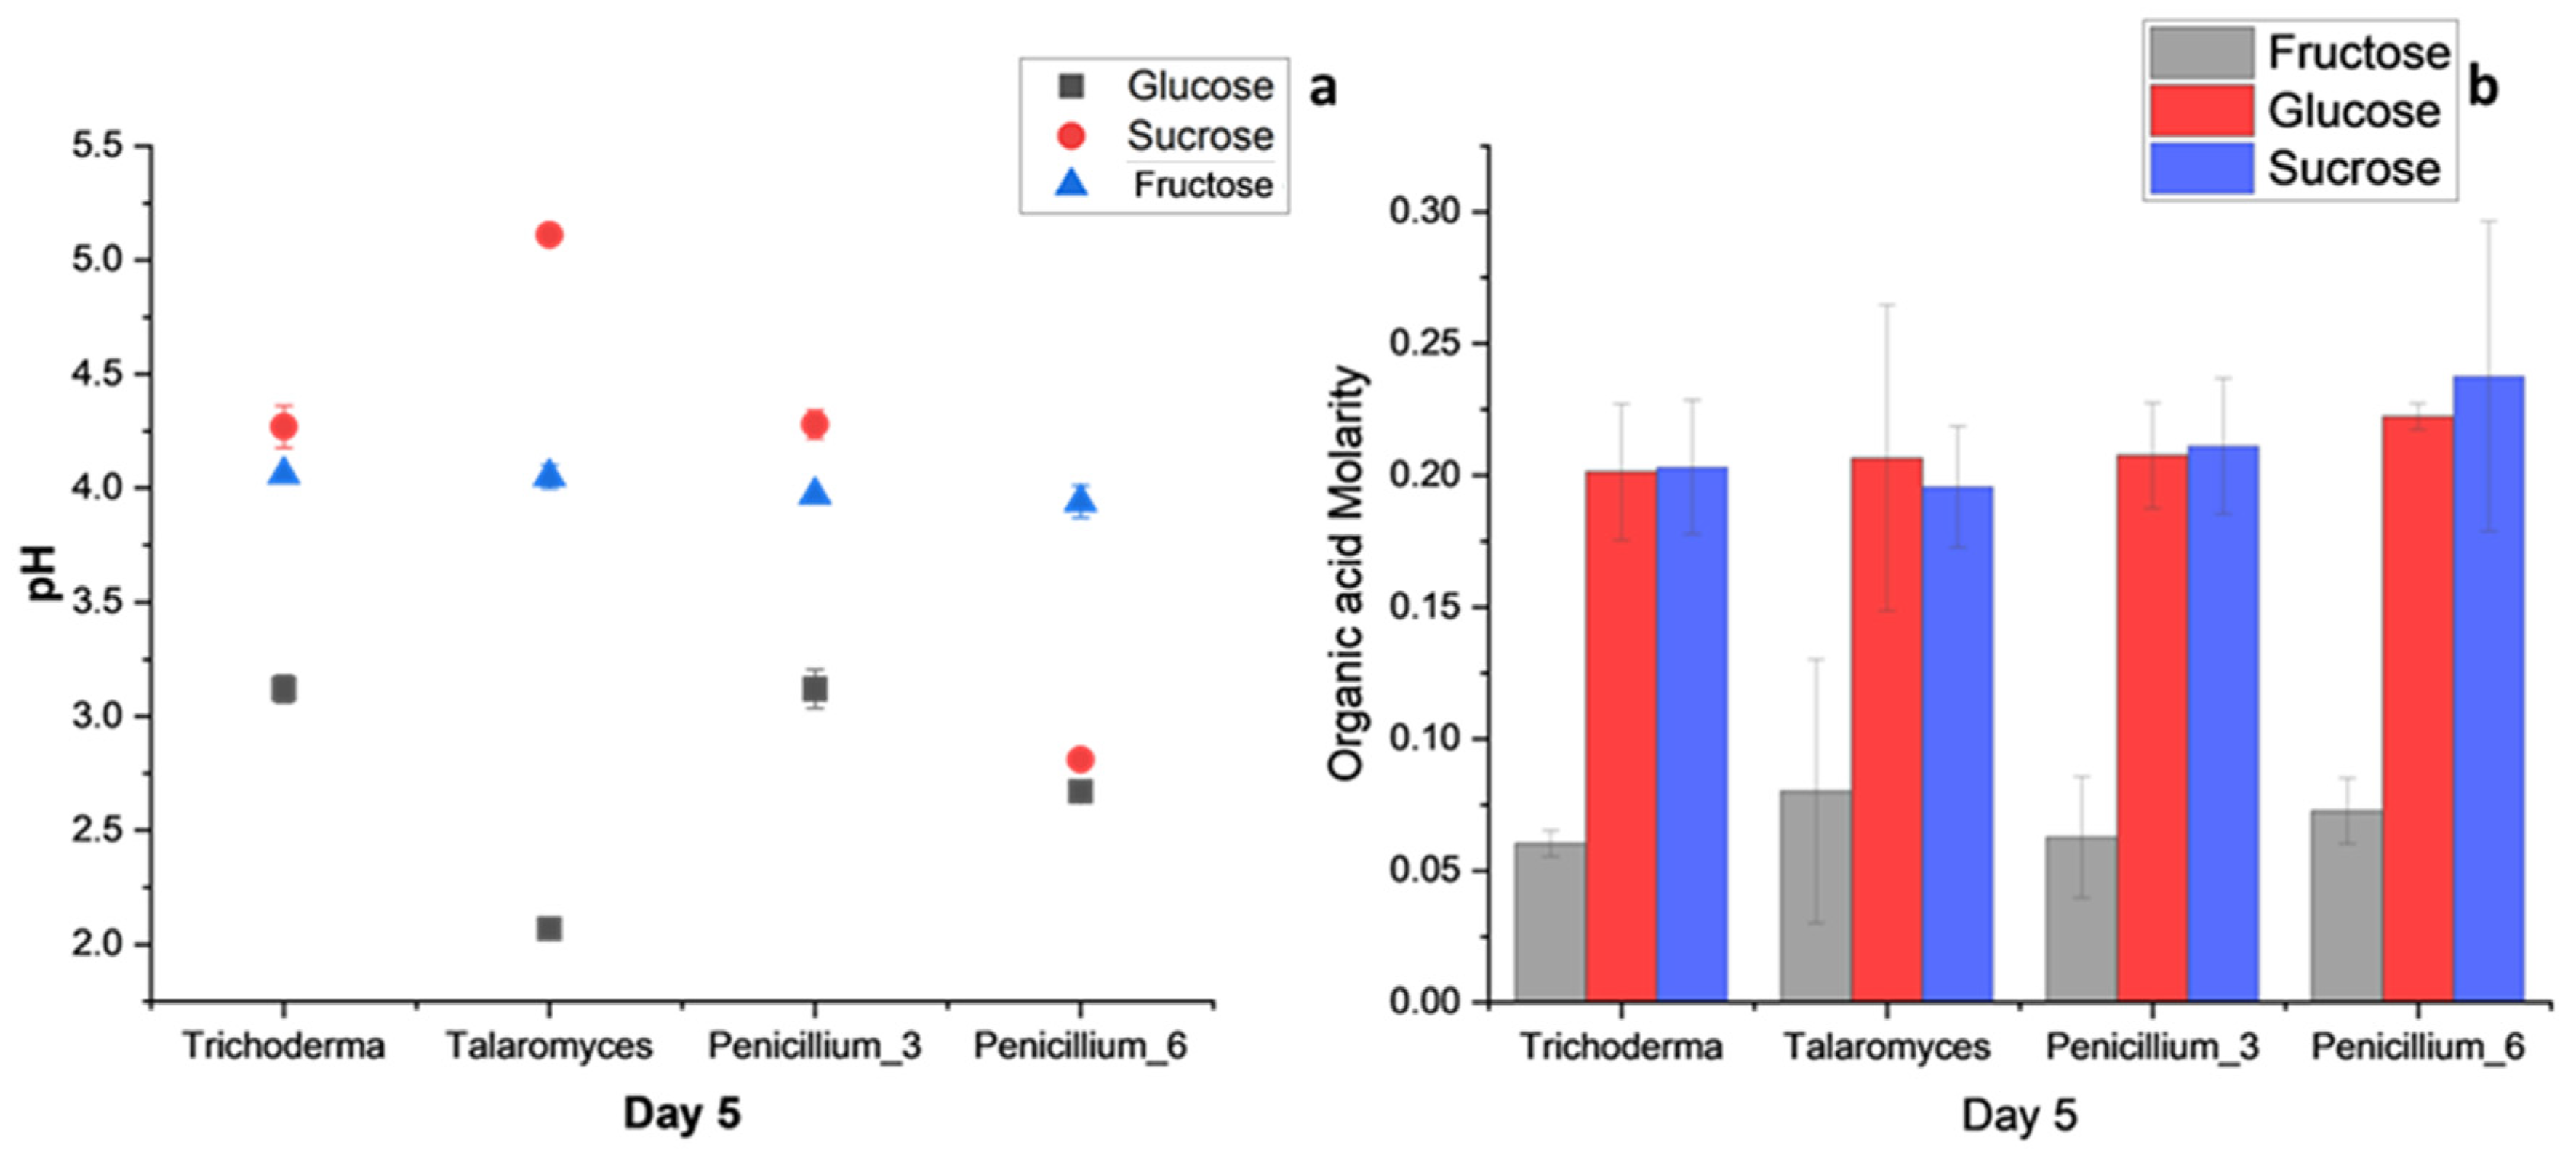
3.3.2. Carbon Utilization

To determine the optimal carbon source for organic acid production, the four isolates were cultivated in glucose, sucrose, and fructose. As illustrated in Figure 5a, the utilization of glucose as a carbon source resulted in the lowest pH for all four isolates, indicating that glucose is the most effectively utilized carbon source by the isolates. When comparing pH to molarity, as shown in Figure 5a,b, a significant difference is observed between sucrose and glucose pH levels, especially in Talaromyces.
Organic acid and metabolite production were monitored through HPLC and GC-MS analyses of samples collected every other day for 15 days from cultures grown in glucose media. In Figure 6, the pH profiles during the growth of these isolates revealed a difference in the metabolic activities of Trichoderma compared to the other isolates. Trichoderma exhibited the lowest pH reached within just 5 days of growth, in contrast to Day 9 for Penicillium_6 and Day 15 for Talaromyces and Penicillium_3. The organic acids produced during the growth of these four isolates were identified and quantified using HPLC. Figure S4 illustrates that citric acid was the primary organic acid produced by all four isolates, followed by oxalic acid. Propionic acid was only quantified for Trichoderma. When comparing citric acid production, it became evident that within 24 h, Trichoderma produced 350 g/L of citric acid, surpassing the other three isolates.

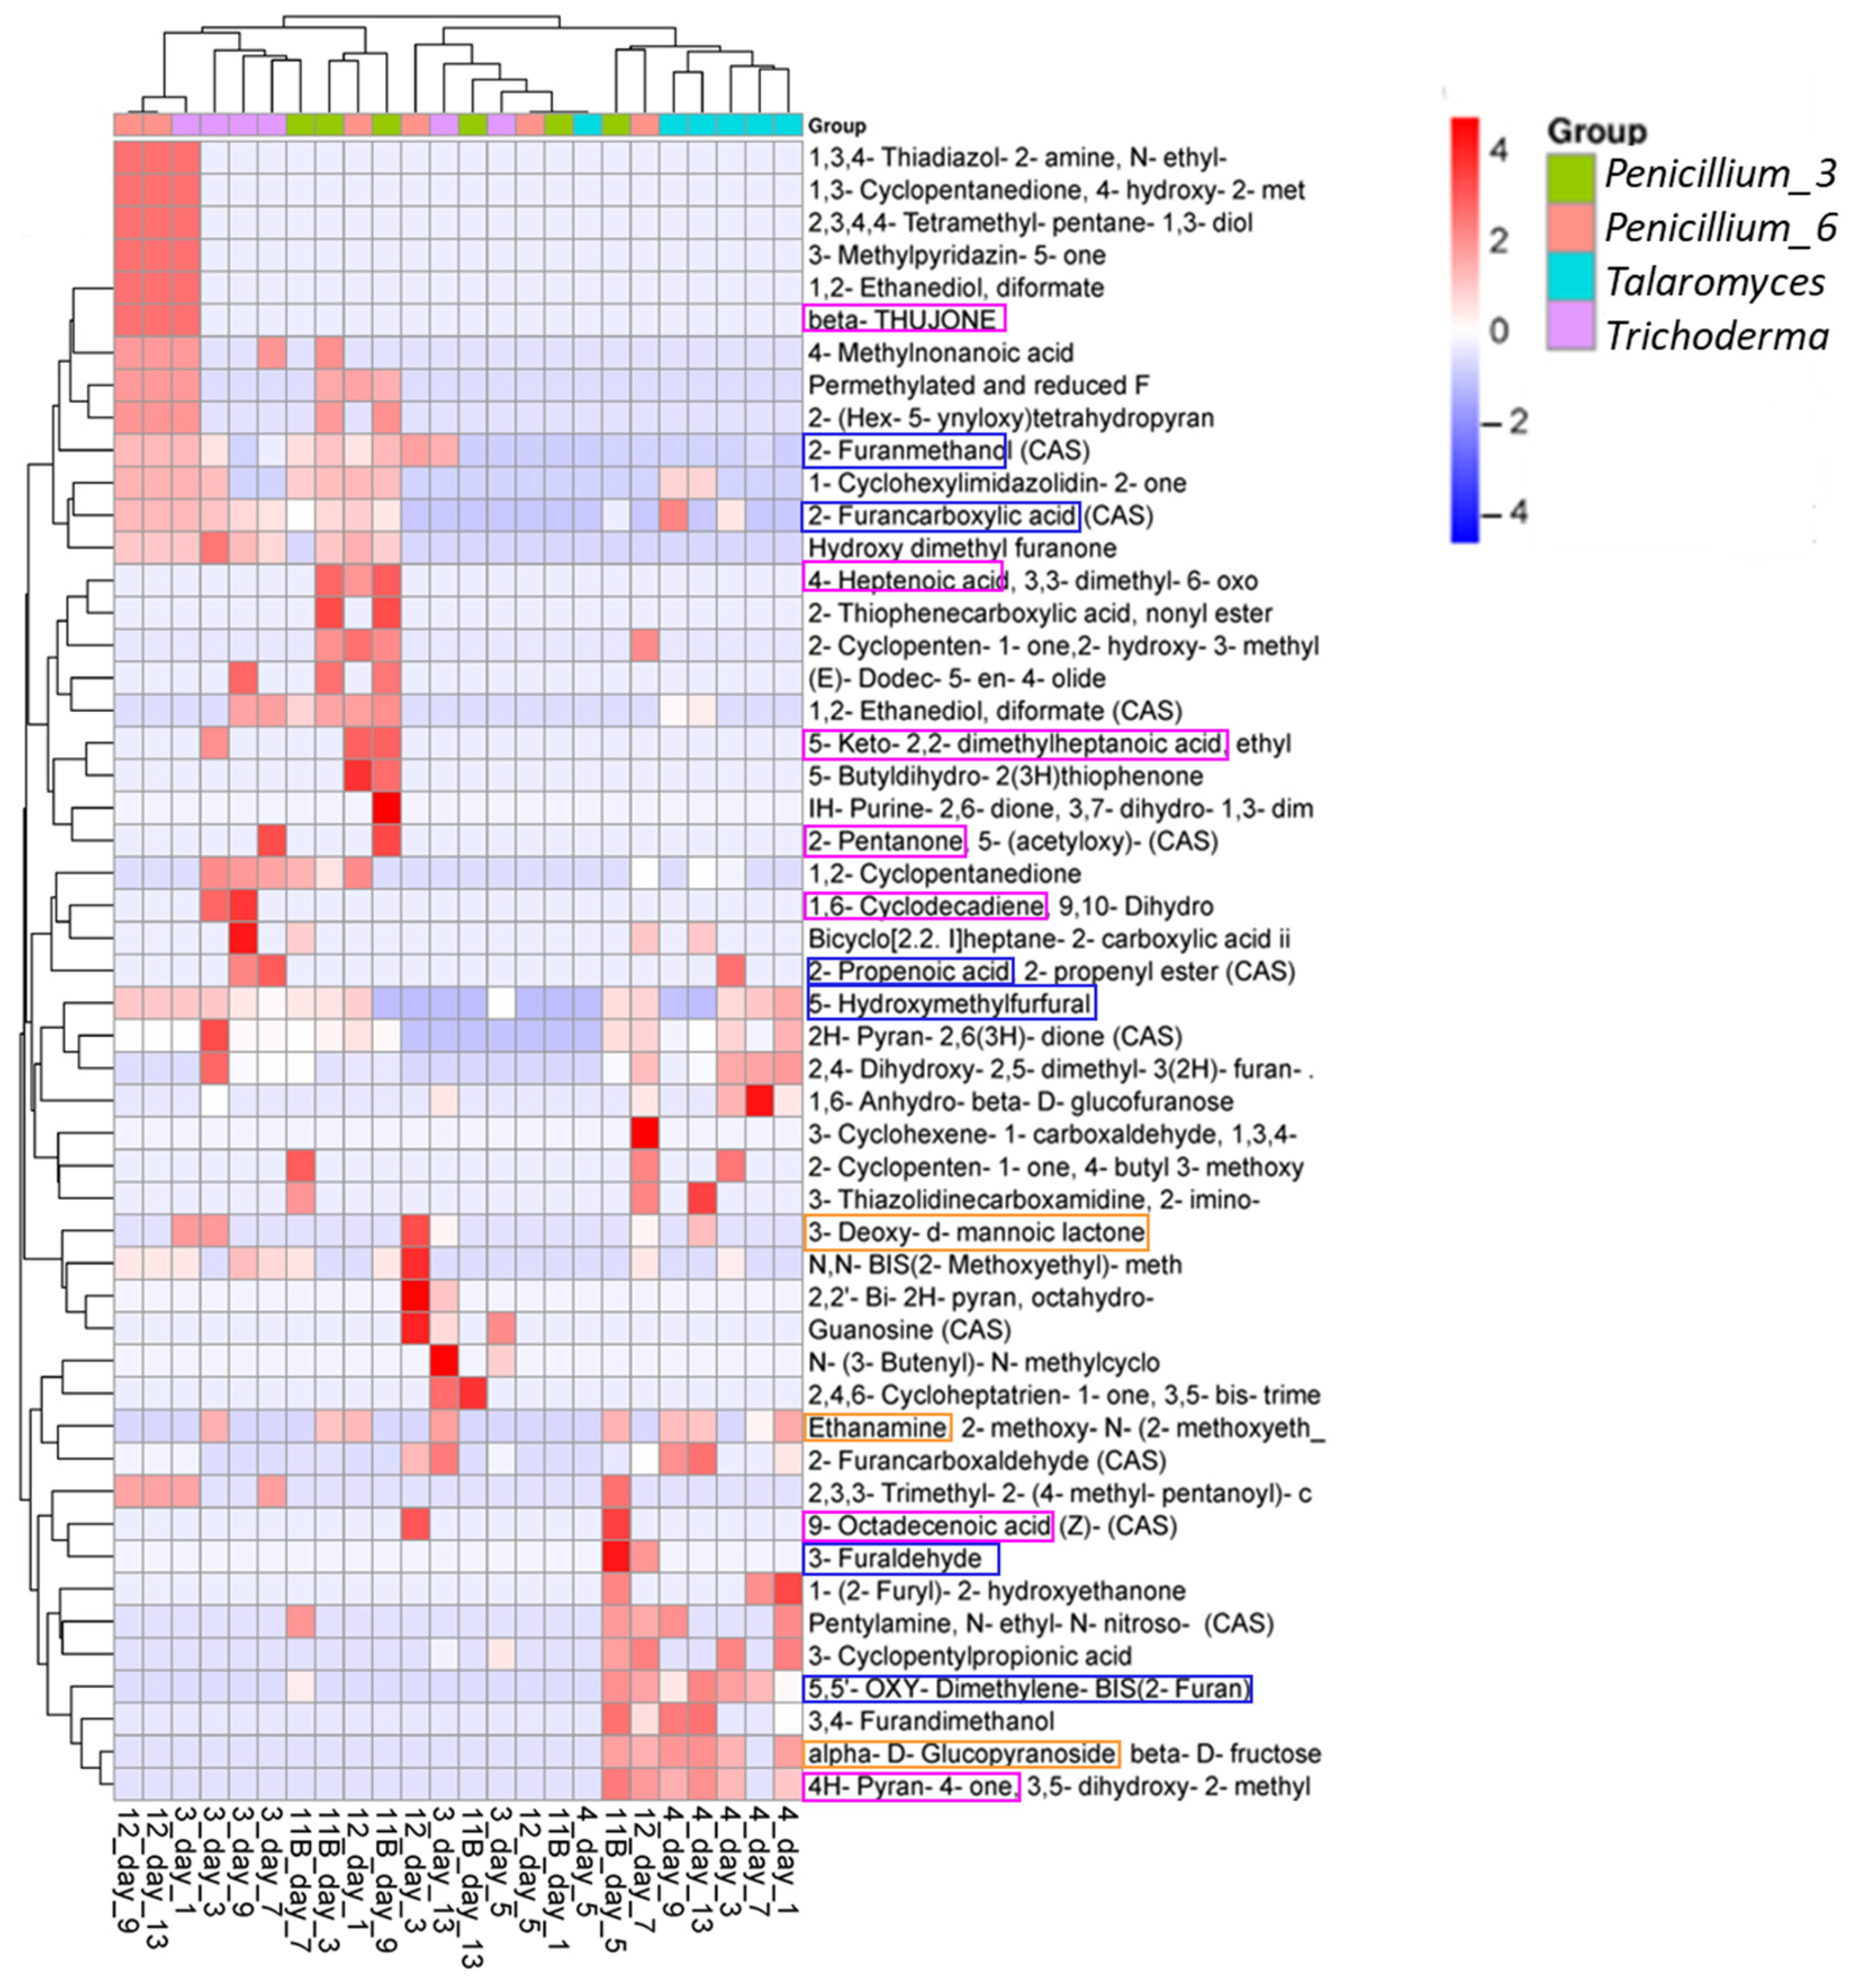
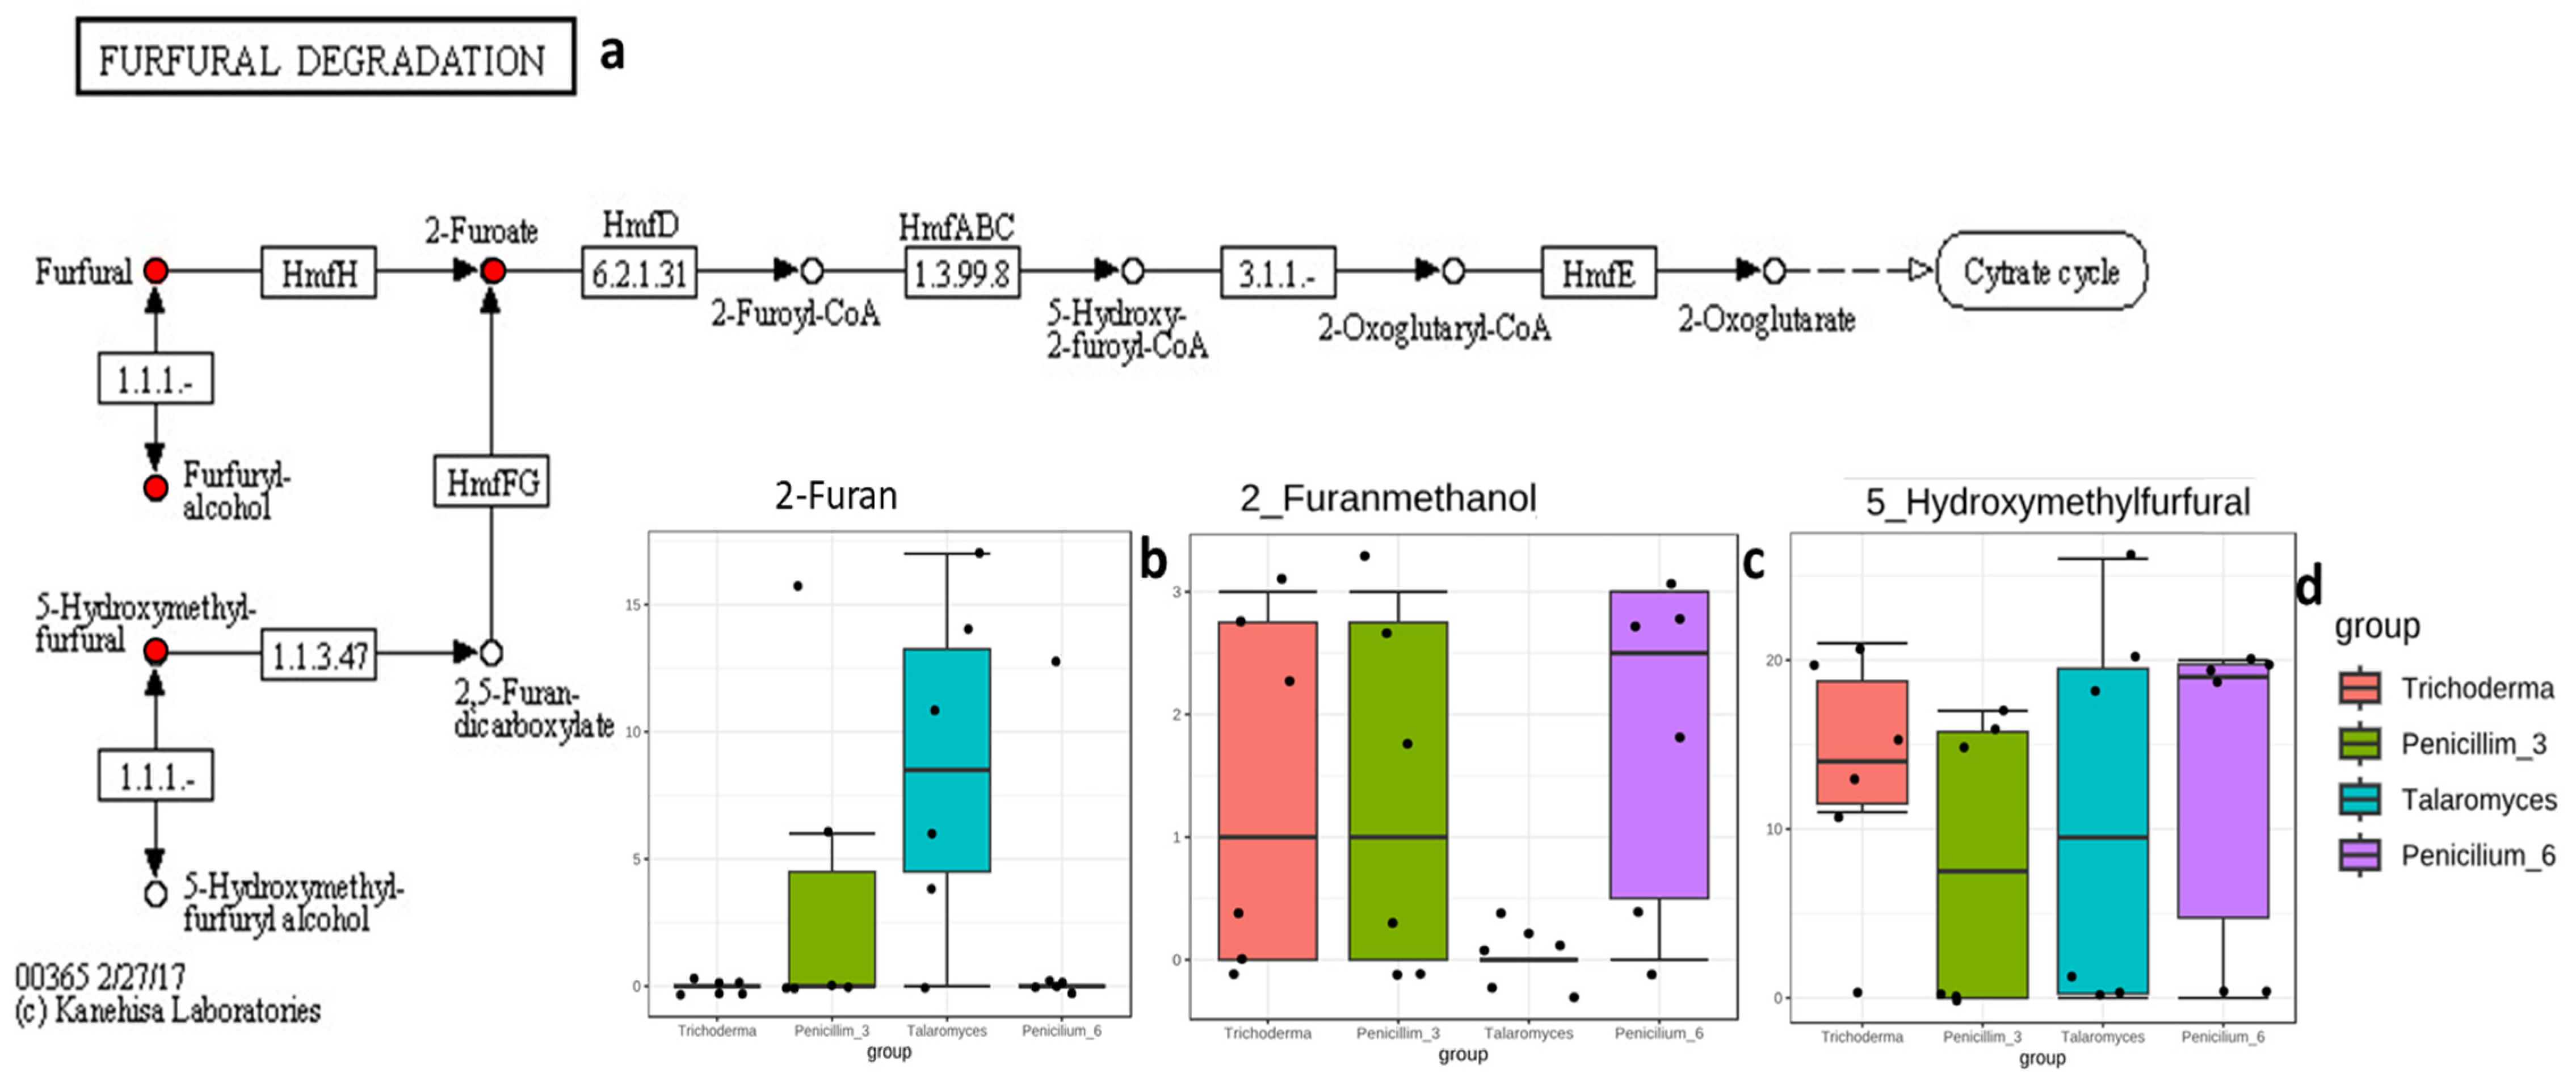
3.3.3. Compounds/Metabolites Screening

Employing GC-MS, we identified key metabolites involved in the upregulation of organic acid, especially citric acid production pathways by these isolates. Figure 7 displays the different chemical compounds that were identified. Kyoto Encyclopedia of Genes and Genomes (KEGG) was used for compound identification and determination of the pathways they are related to. Most of the compounds were associated with pathways related to the citric acid cycle (highlighted in blue), lipid biosynthesis (purple), and carbohydrate metabolism (orange). Compounds linked to carbohydrate metabolism were observed to be more abundant in the early growth stages of all four isolates, with Talaromyces exhibiting the most pronounced increase.
Compounds that eventually contribute to the citric acid cycle were also observed, which explains why all four isolates produced citric acid as the primary organic acid. These compounds include 2-Furan, 2-Furanmethanol, 2-Furancarboxylic acid, 3-Furaldehyde, and 5-Hydroxymethylfurfural, all of which are furan derivatives except 3-Furaldehyde [46,47]. Figure 8a shows that they are part of furfural degradation metabolism, as highlighted in red. Three of these compounds were observed to be abundant and were compared among the four isolates, as shown in Figure 8b–d. Talaromyces had the highest abundance of 2-Furan, followed by Penicillium_3, while 2-Furanmethanol was abundant in all isolates except Talaromyces. The compound 5-Hydroxymethylfurfural was abundant in all the four isolates.

4. Discussion

In the current study, mine tailing samples, representing an extreme environment, were used to isolate fungi and eight different genera identified. These genera have been reported or linked to bioleaching activities [41,48,49,50,51,52]. Thus, this study confirmed the importance of isolating potential bioleaching organisms from extreme environments.

4.1. Qualitative and Quantitative Assay: Organic Acid and Metal Tolerance

The ability of a fungi to cause a decrease in pH during growth is linked to the production of organic acids. Thus, the isolates were screened for organic acids, as one of the most important qualities for potential bioleaching fungi. The lowest pH during the growth of Trichoderma, Talaromyces, Penicillium_3, and Penicillium_6 was observed, and the isolates were selected for further analysis. Of the four, Trichoderma showed higher metal tolerance (Figure 2). Its growth at 300 mg/L of Al and Zn, as well as 100 mg/L of Ni, exceeded that of the controls without metals, suggesting an enhanced metal tolerance ability, possibly due to various mechanisms that allow the fungus to thrive in the presence of these metals such as metal uptake and sequestration, as well as stress responses [53,54]. A TI of less than 1 was observed for Talaromyces, Penicillium_3, and Penicillium_6. This implies that these isolates are susceptible to the toxicity of the metals. At TI < 1, a sublethal effect was observed since the organisms did not die but showed characteristics of impaired growth as compared to the controls (Figure S3), which may result from reduced or impaired metabolic functions [55]. While the growth of all four isolates was affected as the metal concentration increased, cell growth was not inhibited until an extremely high concentration (such as 1600 mg/L of Al) was used. This indicates the acclimatization potential of the isolates, meaning that the four isolates may adapt to even higher concentrations of the metals over time. This acclimatization effect was reported by Yang et al. [56], where the two un-adapted A niger strains were susceptible to Al and Fe; however, after six months of adaptation, the organism could tolerate up to 3500 mg/L Al and 700 mg/L Fe.

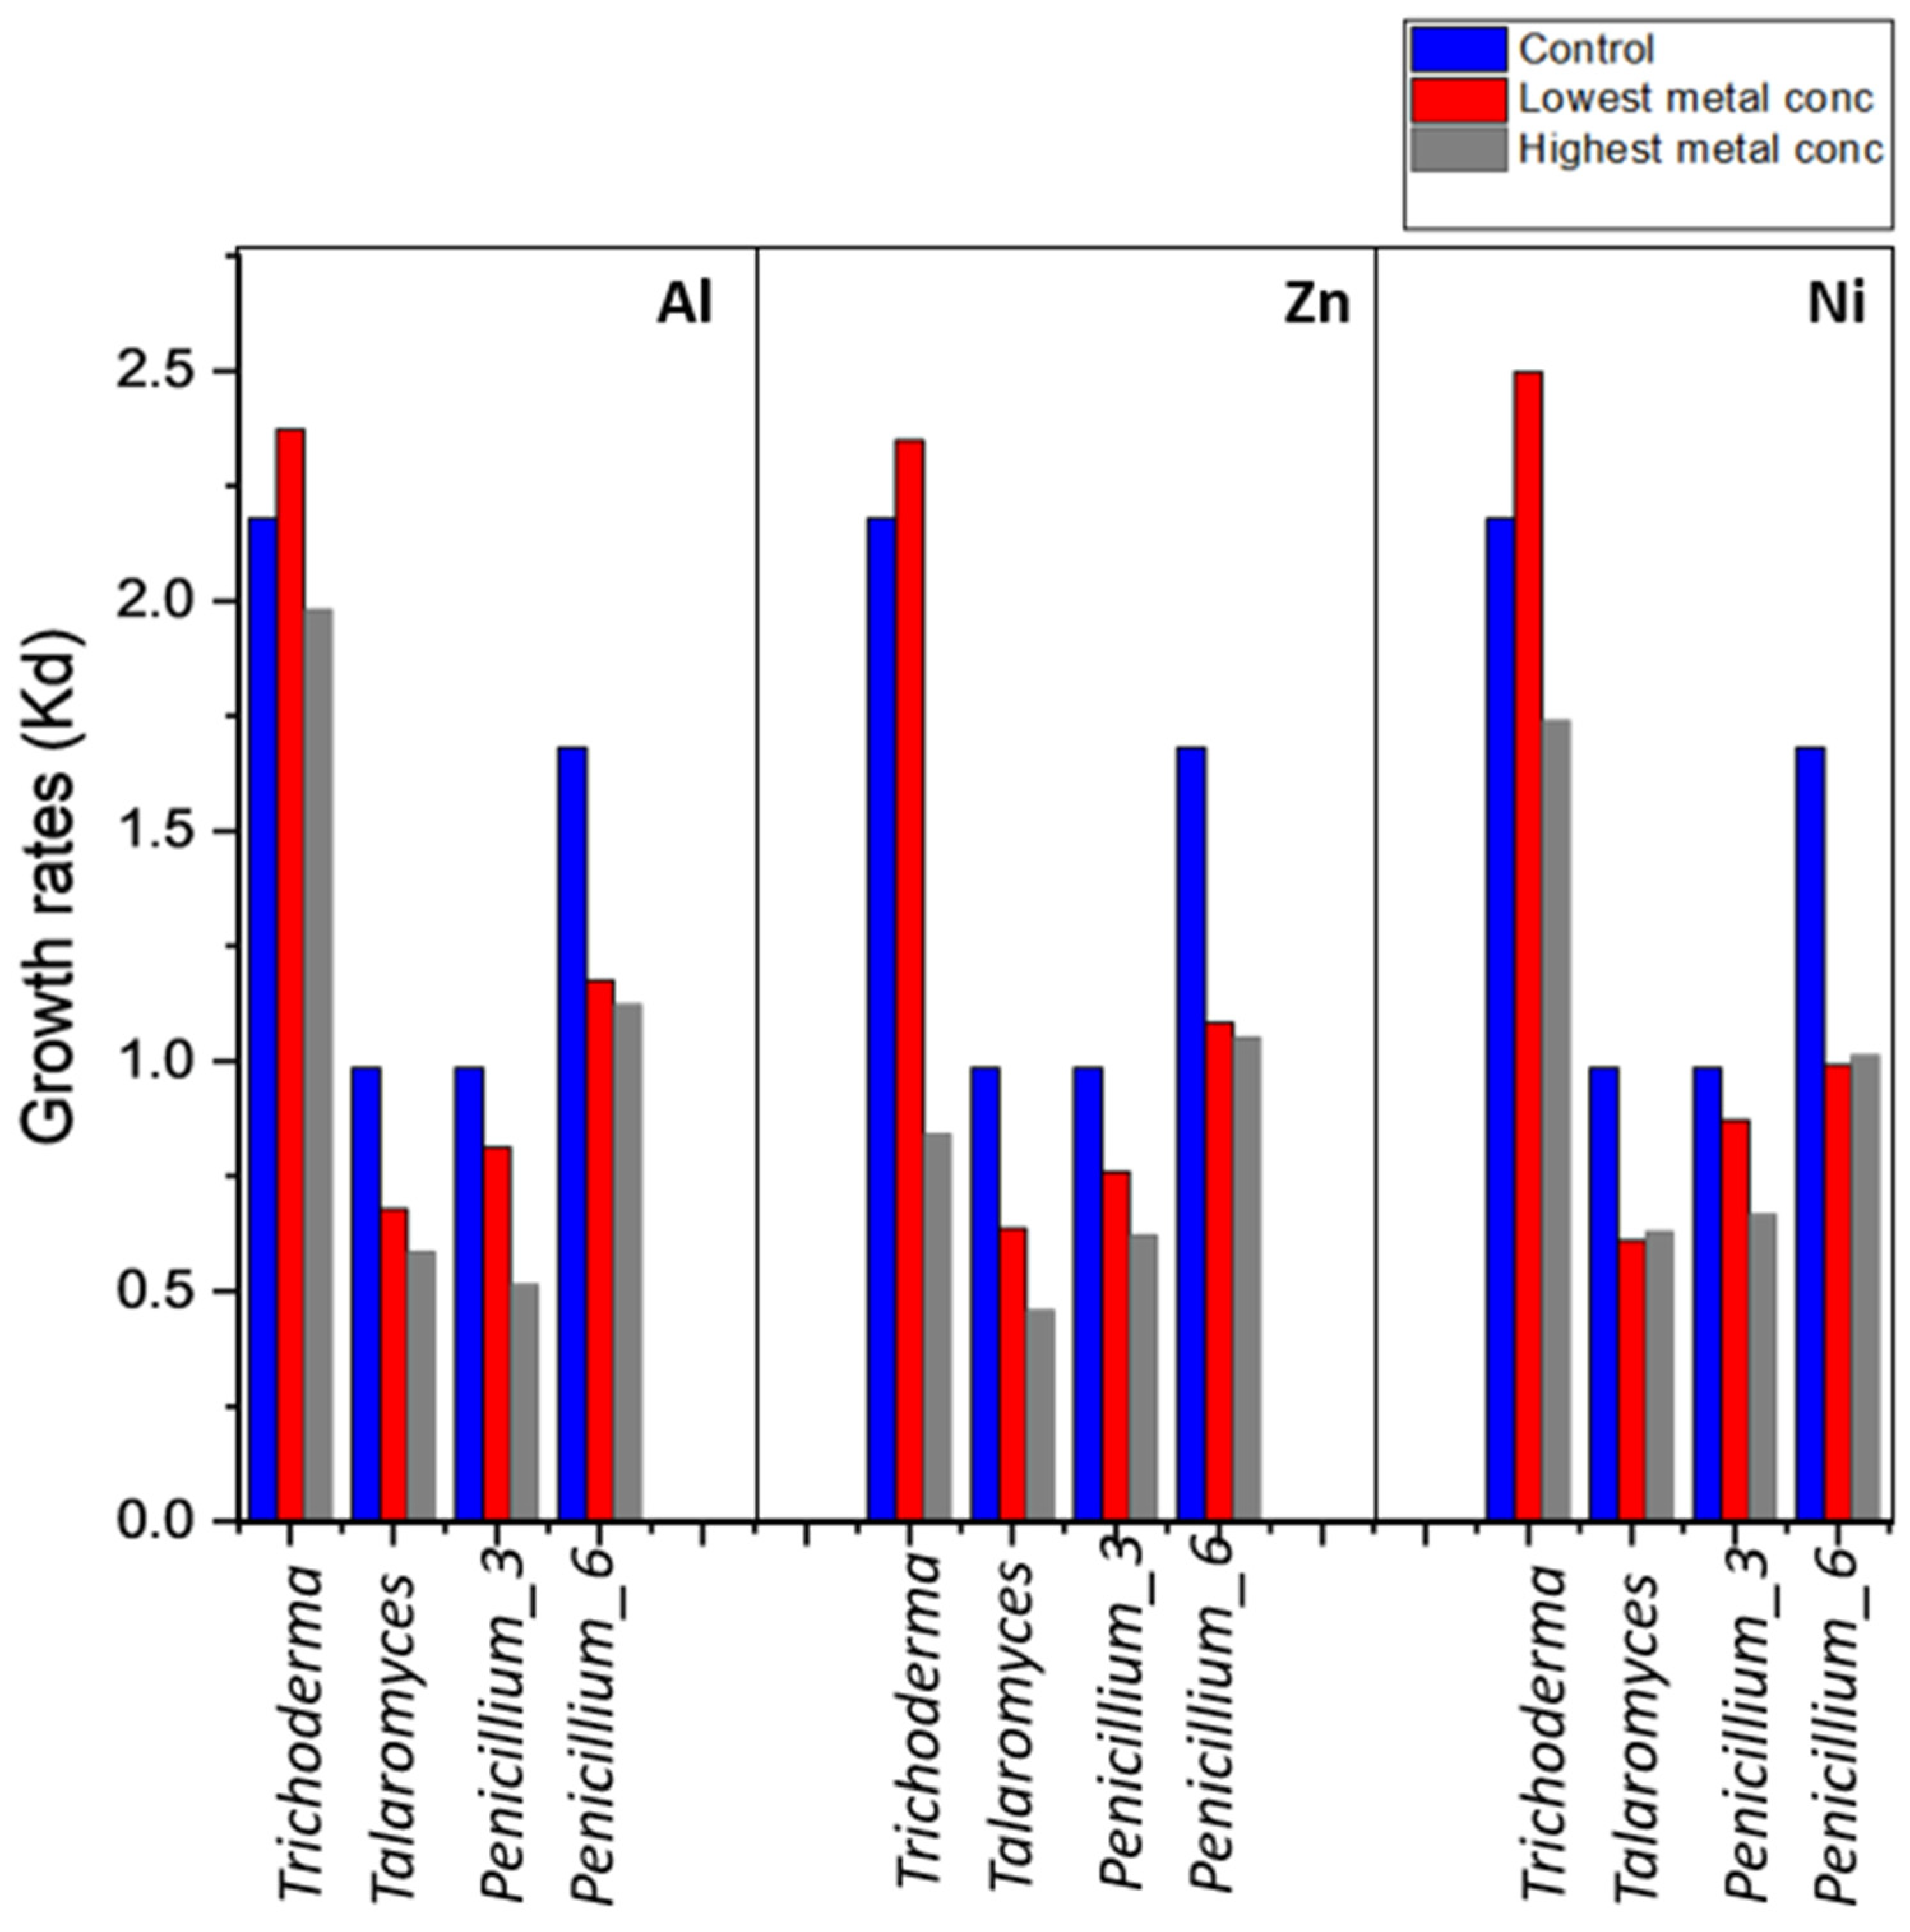
4.2. Growth Rates and Effects of Metal on Fungal Growth Phases

In bioleaching, one of the challenges lies in the slow kinetics, which can be attributed to the growth and activities of fungi. Therefore, identifying isolates with high growth rates under metal exposure is crucial. From the growth rate results, it was observed that Trichoderma exhibited higher growth rates compared to the control without added metal, while the opposite trend was noticed at the highest metal concentrations (Figure 3). According to Bahaloo-Horeh et al. [43] and Jang and Valix [57], microorganisms tend to respond to heavy metals in a biphasic manner, with low metal concentrations stimulating growth and higher metal concentrations inhibiting it. The high growth rates exhibited by Trichoderma at metal concentrations where it has a TI > 1 indicate its suitability as a bioleaching candidate.
The five-growth-phase behavior of fungi under metal stress was used to understand the effect of metals on the fungal growth (Figure 3). For a fungus to exhibit good tolerance towards a specific metal, it should demonstrate a higher TI (>1) at a similar growth phase, in this case, phase d. However, Trichoderma which demonstrated TI >1 did not follow the five-growth-phase behavior while others did (Figure 4). In a study by Rose and Devi [27], this observation was reported at a metal concentration in which the organism has TI < 1; however in our results, this was observed at TI > 1 and TI < 1 for Trichoderma and at TI < 1 for the other isolates. According to Valix and Loon [26], a higher TI in fungi is linked to the initial rapid fungal growth seen in phase b and the relatively low death rate noted in phase c. The other three isolates had a TI < 1 even at the lowest concentration and this can be attributed to the accelerated growth in phase b, while in phase c a continuous decline in growth rate was observed. Furthermore, a prolonged lag phase as seen in Talaromyces and Penicillium_3 also demonstrates the susceptibility of these isolates to metal, where their growth rates and activity are affected.

4.3. Carbon Source Utilization: Glucose, Sucrose, and Fructose

Organic acid production is mainly dependent on the availability of the carbon source. And from the literature, it is important to identify the carbon source best utilized by the organism in question [11,58,59]. In addition to using pH, the calculated molarity of organic acid was used to select the best utilized carbon source. However, there was no substantial difference in terms of the calculated molarity between the different carbon sources used while a pH difference was observed (Figure 5). This suggests that the molarity of the acids produced may not scale directly with pH. This phenomenon is likely due to the production of multiple acids by each organism when utilizing different carbon sources. Each acid has a unique effect on pH, and when titrated, some acids will be monoprotic, while others are weak acids, only partially dissociating [60]. Nevertheless, regardless of their identity and characteristics, all acids will still have an effect on pH. In this case, based on the lowest pH observed, glucose was selected as the best-utilized carbon source.

4.4. Comparison of Organic Acid Production using Glucose as the Carbon Source

A comparison of the four isolates showed that Trichoderma reached the lowest pH at the lowest time (Figure 6). This rapid decline in pH is indicative of Trichoderma’s rapid metabolic activities, suggesting that the provided carbon source was rapidly converted into organic acids and other metabolic products. Our findings align with a study conducted by Shah et al. [61], who investigated pH and organic acid produced during the growth of A. niger. Their study reported a similar phenomenon, where an increase in A. niger’s biomass coincided with a decrease in pH. Notably, a strong negative correlation between biomass and pH was observed, highlighting the significant role of metabolic activities in driving the production of organic acids. Using HPLC, citric acid, oxalic acid, and propionic acids were quantified (Figure S4). A comparison of citric acid, which was produced as the main organic acid, showed that the highest concentration was reached by Trichoderma in the shortest time. This further confirms Trichoderma’s fast metabolism, which also explains the quicker attainment of the lowest pH. Subsequently, the citric acid concentration in the other three isolates exceeded that of Trichoderma after Day 7, elucidating why their lowest pH was observed after Day 9. When it came to oxalic acid, Penicillium_3, and Penicillium_6 recorded the highest oxalic acid produced.
The purpose of this study was to screen fungal isolates for their bioleaching potential. In bioleaching, organic acids serve as the primary leaching agents, with citric and oxalic acid being major contributors through processes such as acidolysis and complexolysis, which involve chelation reactions [6,21]. Citric acid is typically generated via the citric acid cycle, whereas oxalic acid and propionic acid follow distinct pathways. The prevalence of citric acid production across all isolates suggests their metabolic processes are inclined toward the citric acid cycle. This alignment with the citric acid cycle could be attributed to its role in cellular respiration, the primary energy production pathway. GC-MS was used to identify metabolite/compound produced during the production of organic acids listed above, mainly citric acid (Figure 7). Higher levels of carbohydrate metabolites produced in the early growth stages were observed, which may be connected to biomass formation and energy production, crucial for cell functioning [62]. Additionally, pathways leading to lipid metabolite production, primarily fatty acyls, were also abundant. Lipids are primarily associated with energy storage [63]. Since the isolates were grown on glucose as a carbon source, excess glucose could have been converted into fatty acids and stored as lipids for later ATP generation.
Compounds such as 2-Furan, 2-Furanmethanol, and 5-Hydroxymethylfurfural were found in abundance (Figure 8). 2-Furan also known as furan, is a compound biologically produced by fungi as a secondary metabolite, which functions among others as a defense mechanism [64,65]. The compound 2-Furanmethanol is also a secondary metabolite with antimicrobial activities [66]. The compound 5-Hydroxymethylfurfural on the other hand is known for its antioxidant activities, that is, providing protection to cells against free radicals [67]. The question arises as to why these fungal isolates produced these compounds in abundance. One possible explanation may be due to excess carbon influx, where the high concentration of glucose led to a metabolic overflow [68]. In such a scenario, the excess carbon from metabolic pathways like glycolysis and gluconeogenesis could surpass the capacity of downstream pathways such as the citric acid cycle. Consequently, a metabolic diversion will occur, resulting in the production of these compounds in addition to lipid metabolism [69,70]. As illustrated in Figure 8a, they are involved in furfural degradation metabolism, ultimately contributing to the citric acid cycle (citrate cycle). This was explained in a metabolic analysis study of Penicillium by Yang et al. [71], stating that the increase in 2-Furoic acid in the furfural degradation pathway produces more α-ketoglutarate (also known as oxoglutarate), which is an important intermediate in the citric acid cycle. Thus, it may represent another metabolic pathway related to energy storage in fungi.

5. Conclusions

This study aimed to address common bioleaching challenges like slow kinetics and limited metal yield due to metal-induced microbial stress. Among the four screened isolates, Trichoderma emerged as a promising candidate for bioleaching due to its high metal tolerance, rapid growth, and potent organic acid production.
Metabolic profiling revealed that the citric acid cycle is the primary pathway for organic acid production in all four isolates, utilizing glucose as the carbon source. However, Trichoderma also exhibited enhanced activity in pathways related to lipid biosynthesis and carbohydrate metabolism, potentially contributing to its higher acid yields. Interestingly, the presence of compounds associated with furfural degradation suggests an additional metabolic pathway potentially serving as an energy storage mechanism in these fungi.
While the three non-Trichoderma isolates displayed a lower metal tolerance, their organic acid production profiles suggest potential roles in spent media bioleaching. Further bioleaching experiments are crucial to validate the practical efficacy of both Trichoderma (in direct bioleaching) and the other isolates (in spent media bioleaching) for specific metal recovery applications.

Supplementary Materials

The following supporting information can be downloaded at: https://www.mdpi.com/article/10.3390/min14030235/s1, Figure S1: A flow diagram, showing the screening method where quantitative and qualitative screening methods were applied; Figure S2: Relative abundance (number of isolates) of fungi isolated from the four tailing samples; Figure S3: The images depict the growth of Trichoderma in GYEA without metal (control) and its growth in a high metal concentration where it is susceptible. Impaired growth is observed com-pared to the control; Figure S4: Organic acid produced by Trichoderma, Talaromyces, Penicillium_3 and Penicillium_6, quantified using HPLC. a- citric acid, b- oxalic acid and c – propionic acid; Table S1: Operational taxonomic units of fungal isolates, clustered at 97% similarity. The identity of the representative isolates is presented at a genus level. The accession number of each isolated is also listed. Table S2: Qualitative screening of fungal isolates metal tolerance at 100 mg/L for Aluminum (Al), Zinc (Zn), Nickel (Ni), and Chromium (Cr).

Author Contributions

R.N. developed the research methodology, selected the software, validated the results, and performed the formal analysis. R.N. also collected and investigated the data, curated the data, and wrote the original draft of the manuscript. T.S.M. reviewed and edited the manuscript, supervised the project, and administered the project. T.S.M. also acquired the funding for the project. All authors have read and agreed to the published version of the manuscript.

Funding

This project was sponsored by the National Research Foundation of South Africa (NRF Grant Number: 138093 awarded) and the Department of Science and Innovation and the Technology Innovation Agency (Grant Number: 2022/FUN252/AA) awarded to Prof TS Matambo.

Data Availability Statement

Data is contained in supplementary materials.

Conflicts of Interest

The authors declare no conflicts of interest.

References

  1. Russo, F.; Ceci, A.; Pinzari, F.; Siciliano, A.; Guida, M.; Malusà, E.; Tartanus, M.; Miszczak, A.; Maggi, O.; Persiani, A.M. Bioremediation of Dichlorodiphenyltrichloroethane (DDT)-Contaminated Agricultural Soils: Potential of Two Autochthonous Saprotrophic Fungal Strains. Appl. Environ. Microbiol. 2019, 85, e01720-19. [Google Scholar] [CrossRef] [PubMed]
  2. Shourie, A.; Vijayalakshmi, U. Fungal Diversity and Its Role in Mycoremediation. Geomicrobiol. J. 2022, 39, 426–444. [Google Scholar] [CrossRef]
  3. Wösten, H.A.B. Filamentous Fungi for the Production of Enzymes, Chemicals and Materials. Curr. Opin. Biotechnol. 2019, 59, 65–70. [Google Scholar] [CrossRef] [PubMed]
  4. Mishra, S.; Panda, S.; Akcil, A.; Dembele, S. Biotechnological Avenues in Mineral Processing: Fundamentals, Applications and Advances in Bioleaching and Bio-Beneficiation. Miner. Process. Extr. Metall. Rev. 2023, 44, 22–51. [Google Scholar] [CrossRef]
  5. Pathak, A.; Kothari, R.; Vinoba, M.; Habibi, N.; Tyagi, V.V. Fungal Bioleaching of Metals from Refinery Spent Catalysts: A Critical Review of Current Research, Challenges, and Future Directions. J. Environ. Manag. 2021, 280, 111789. [Google Scholar] [CrossRef] [PubMed]
  6. Pathak, A.; Vinoba, M.; Kothari, R. Emerging role of organic acids in leaching of valuable metals from refinery-spent hydroprocessing catalysts, and potential techno-economic challenges: A review. Crit. Rev. Environ. Sci. Technol. 2021, 51, 1–43. [Google Scholar] [CrossRef]
  7. Wu, H.Y.; Ting, Y.P. Metal Extraction from Municipal Solid Waste (MSW) Incinerator Fly Ash—Chemical Leaching and Fungal Bioleaching. Enzym. Microb. Technol. 2006, 38, 839–847. [Google Scholar] [CrossRef]
  8. Narayanasamy, M.; Dhanasekaran, D.; Vinothini, G.; Thajuddin, N. Extraction and Recovery of Precious Metals from Electronic Waste Printed Circuit Boards by Bioleaching Acidophilic Fungi. Int. J. Environ. Sci. Technol. 2018, 15, 119–132. [Google Scholar] [CrossRef]
  9. Kolenčík, M.; Urík, M.; Čerňanský, S.; Molnárová, M.; Matúš, P. Leaching of Zinc, Cadmium, Lead and Copper from Electronic Scrap Using Organic Acids and the Aspergillus niger Strain. Fresenius Environ. Bull. 2013, 22, 3673–3679. [Google Scholar]
  10. Ren, W.X.; Li, P.J.; Geng, Y.; Li, X.J. Biological Leaching of Heavy Metals from a Contaminated Soil by Aspergillus niger. J. Hazard. Mater. 2009, 167, 164–169. [Google Scholar] [CrossRef]
  11. Din, G.; Hassan, A.; Rafiq, M.; Hasan, F.; Badshah, M.; Khan, S.; Chen, G.; Ripp, S.; Shah, A.A. Characterization of Organic Acid Producing Aspergillus Tubingensis FMS1 and Its Role in Metals Leaching from Soil. Geomicrobiol. J. 2020, 37, 336–344. [Google Scholar] [CrossRef]
  12. Pathak, A.; Morrison, L.; Healy, M.G. Catalytic Potential of Selected Metal Ions for Bioleaching, and Potential Techno-Economic and Environmental Issues: A Critical Review. Bioresour. Technol. 2017, 229, 211–221. [Google Scholar] [CrossRef] [PubMed]
  13. Moazzam, P.; Boroumand, Y.; Rabiei, P.; Baghbaderani, S.S.; Mokarian, P.; Mohagheghian, F.; Mohammed, L.J.; Razmjou, A. Lithium Bioleaching: An Emerging Approach for the Recovery of Li from Spent Lithium Ion Batteries. Chemosphere 2021, 277, 130196. [Google Scholar] [CrossRef] [PubMed]
  14. Roy, J.J.; Cao, B.; Madhavi, S. A Review on the Recycling of Spent Lithium-Ion Batteries (LIBs) by the Bioleaching Approach. Chemosphere 2021, 282, 130944. [Google Scholar] [CrossRef] [PubMed]
  15. Sajjad, W.; Zheng, G.; Din, G.; Ma, X.; Rafiq, M.; Xu, W. Metals Extraction from Sulfide Ores with Microorganisms: The Bioleaching Technology and Recent Developments. Trans. Indian Inst. Met. 2019, 72, 559–579. [Google Scholar] [CrossRef]
  16. Qayyum, S.; Meng, K.; Pervez, S.; Nawaz, F.; Peng, C. Optimization of PH, Temperature and Carbon Source for Bioleaching of Heavy Metals by Aspergillus flavus Isolated from Contaminated Soil. Main Group Met. Chem. 2019, 42, 1–7. [Google Scholar] [CrossRef]
  17. Keshavarz, S.; Faraji, F.; Rashchi, F.; Mokmeli, M. Bioleaching of Manganese from a Low-Grade Pyrolusite Ore Using Aspergillus niger: Process Optimization and Kinetic Studies. J. Environ. Manag. 2021, 285, 112153. [Google Scholar] [CrossRef]
  18. Muddanna, M.H.; Baral, S.S. Leaching of Nickel and Vanadium from the Spent Fluid Catalytic Cracking Catalyst by Reconnoitering the Potential of Aspergillus niger Associating with Chemical Leaching. J. Environ. Chem. Eng. 2019, 7, 103025. [Google Scholar] [CrossRef]
  19. Alavi, N.; Partovi, K.; Majlessi, M.; Rashidi, M.; Alimohammadi, M. Bioleaching of Metals from Cellphones Batteries by a Co-Fungus Medium in Presence of Carbon Materials. Bioresour. Technol. Rep. 2021, 15, 100768. [Google Scholar] [CrossRef]
  20. Santhiya, D.; Ting, Y.P. Bioleaching of Spent Refinery Processing Catalyst Using Aspergillus niger with High-Yield Oxalic Acid. J. Biotechnol. 2005, 116, 171–184. [Google Scholar] [CrossRef]
  21. Dusengemungu, L.; Kasali, G.; Gwanama, C.; Mubemba, B. Overview of Fungal Bioleaching of Metals. Environ. Adv. 2021, 5, 100083. [Google Scholar] [CrossRef]
  22. Sarkodie, E.K.; Jiang, L.; Li, K.; Yang, J.; Guo, Z.; Shi, J.; Deng, Y.; Liu, H.; Jiang, H.; Liang, Y.; et al. A Review on the Bioleaching of Toxic Metal(Loid)s from Contaminated Soil: Insight into the Mechanism of Action and the Role of Influencing Factors. Front. Microbiol. 2022, 13, 1049277. [Google Scholar] [CrossRef] [PubMed]
  23. Shekhar Samanta, N.; Das, P.P.; Dhara, S.; Purkait, M.K. An Overview of Precious Metal Recovery from Steel Industry Slag: Recovery Strategy and Utilization. Ind. Eng. Chem. Res. 2023, 62, 9006–9031. [Google Scholar] [CrossRef]
  24. Brown, R.M.; Mirkouei, A.; Reed, D.; Thompson, V. Current Nature-Based Biological Practices for Rare Earth Elements Extraction and Recovery: Bioleaching and Biosorption. Renew. Sustain. Energy Rev. 2023, 173, 113099. [Google Scholar] [CrossRef]
  25. Brisson, V.L.; Zhuang, W.Q.; Alvarez-Cohen, L. Metabolomic Analysis Reveals Contributions of Citric and Citramalic Acids to Rare Earth Bioleaching by a Paecilomyces Fungus. Front. Microbiol. 2020, 10, 3008. [Google Scholar] [CrossRef] [PubMed]
  26. Valix, M.; Loon, L.O. Adaptive Tolerance Behaviour of Fungi in Heavy Metals. Min. Eng. 2003, 16, 193–198. [Google Scholar] [CrossRef]
  27. Rose, P.K.; Devi, R. Heavy Metal Tolerance and Adaptability Assessment of Indigenous Filamentous Fungi Isolated from Industrial Wastewater and Sludge Samples. Beni Suef Univ. J. Basic Appl. Sci. 2018, 7, 688–694. [Google Scholar] [CrossRef]
  28. Mani, D.; Kumar, C. Biotechnological Advances in Bioremediation of Heavy Metals Contaminated Ecosystems: An Overview with Special Reference to Phytoremediation. Int. J. Environ. Sci. Technol. 2014, 11, 843–872. [Google Scholar] [CrossRef]
  29. Anahid, S.; Yaghmaei, S.; Ghobadinejad, Z. Heavy Metal Tolerance of Fungi. Sci. Iran. 2011, 18, 502–508. [Google Scholar] [CrossRef]
  30. Thavamani, P.; Samkumar, R.A.; Satheesh, V.; Subashchandrabose, S.R.; Ramadass, K.; Naidu, R.; Venkateswarlu, K.; Megharaj, M. Microbes from Mined Sites: Harnessing Their Potential for Reclamation of Derelict Mine Sites. Environ. Pollut. 2017, 230, 495–505. [Google Scholar] [CrossRef]
  31. Guo, D.; Hou, H.; Long, J.; Guo, X.; Xu, H. Underestimated Environmental Benefits of Tailings Resource Utilization: Evidence from a Life Cycle Perspective. Environ. Impact Assess. Rev. 2022, 96, 106832. [Google Scholar] [CrossRef]
  32. Golik, V.I.; Klyuev, R.V.; Martyushev, N.V.; Zyukin, D.A.; Karlina, A.I. Prospects for Return of Valuable Components Lost in Tailings of Light Metals Ore Processing. Metallurgist 2023, 67, 96–103. [Google Scholar] [CrossRef]
  33. Yu, Y.H.; Du, C.M. Leaching of Phosphorus from Phosphate Tailings and Extraction of Calcium Phosphates: Toward Comprehensive Utilization of Tailing Resources. J. Environ. Manag. 2023, 347, 119159. [Google Scholar] [CrossRef] [PubMed]
  34. Hu, M.; Zhao, X.; Gu, J.; Qian, L.; Wang, Z.; Nie, Y.; Han, X.; An, L.; Jiang, H. Metals Recovery from Polymetallic Sulfide Tailings by Bioleaching Functional Bacteria Isolated with the Improved 9K Agar: Comparison between One-Step and Two-Step Processes. Environ. Res. 2024, 240, 117511. [Google Scholar] [CrossRef] [PubMed]
  35. Nkuna, R.; Ijoma, G.N.; Matambo, T.S. Applying EDTA in Chelating Excess Metal Ions to Improve Downstream DNA Recovery from Mine Tailings for Long-Read Amplicon Sequencing of Acidophilic Fungi Communities. J. Fungi 2022, 8, 419. [Google Scholar] [CrossRef] [PubMed]
  36. Adeleke, R.; Cloete, E.; Khasa, D. Isolation and Identification of Iron Ore-Solubilising Fungus. S. Afr. J. Sci. 2010, 106, 1–6. [Google Scholar] [CrossRef]
  37. Chen, A.; Hao, X.; Xiao, Y.; Zou, K.; Liu, H.; Liu, X. Responses of Acidithiobacillus thiooxidans A01 to Individual and Joint Nickel (Ni2+) and Ferric (Fe3+). Minerals 2019, 9, 82. [Google Scholar] [CrossRef]
  38. Martínez, P.; Gálvez, S.; Ohtsuka, N.; Budinich, M.; Cortés, M.P.; Serpell, C.; Nakahigashi, K.; Hirayama, A.; Tomita, M.; Soga, T.; et al. Metabolomic Study of Chilean Biomining Bacteria Acidithiobacillus Ferrooxidans Strain Wenelen and Acidithiobacillus thiooxidans Strain Licanantay. Metabolomics 2012, 9, 247–257. [Google Scholar] [CrossRef]
  39. Ilyas, S.; Bhatti, H.N.; Bhatti, I.A.; Sheikh, M.A.; Ghauri, A. Bioleaching of Metal Ions from Low Grade Sulphide Ore: Process Optimization by Using Orthogonal Experimental Array Design. Afr. J. Biotechnol. 2010, 9, 2801–2810. [Google Scholar]
  40. Kishimoto, N.; Tano, T. Acidophilic Heterotrophic Bacteria Isolated from Acidic Mine Drainage, Sewage, and Soils. J. Gen. Appl. Microbiol. 1987, 33, 11–25. [Google Scholar] [CrossRef]
  41. Amiri, F.; Mousavi, S.M.; Yaghmaei, S. Enhancement of Bioleaching of a Spent Ni/Mo Hydroprocessing Catalyst by Penicillium Simplicissimum. Sep. Purif. Technol. 2011, 80, 566–576. [Google Scholar] [CrossRef]
  42. Shaikh, Z.; Qureshi, P. Screening and Isolation of Organic Acid Producers from Samples of Diverse Habitats. Int. J. Curr. Microbiol. Appl. Sci. 2013, 2, 39–44. [Google Scholar]
  43. Valix, M.; Usai, F.; Malik, R. Fungal Bio-Leaching of Low Grade Laterite Ores. Min. Eng. 2001, 14, 197–203. [Google Scholar] [CrossRef]
  44. Bahaloo-Horeh, N.; Mousavi, S.M.; Baniasadi, M. Use of Adapted Metal Tolerant Aspergillus niger to Enhance Bioleaching Efficiency of Valuable Metals from Spent Lithium-Ion Mobile Phone Batteries. J. Clean. Prod. 2018, 197, 1546–1557. [Google Scholar] [CrossRef]
  45. Le, L.; Tang, J.; Ryan, D.; Valix, M. Bioleaching Nickel Laterite Ores Using Multi-Metal Tolerant Aspergillus foetidus Organism. Min. Eng. 2006, 19, 1259–1265. [Google Scholar] [CrossRef]
  46. Dutta, S. Valorization of Biomass-Derived Furfurals: Reactivity Patterns, Synthetic Strategies, and Applications. Biomass Convers. Biorefin. 2023, 13, 10361–10386. [Google Scholar] [CrossRef]
  47. Kallio, H. Aroma of birch syrup. J. Agric. Food Chem. 1989, 37.5, 1367–1371. [Google Scholar] [CrossRef]
  48. Etemadzadeh, S.S.; Emtiazi, G.; Etemadifar, Z. Heterotrophic Bioleaching of Sulfur, Iron, and Silicon Impurities from Coal by Fusarium Oxysporum FE and Exophiala Spinifera FM with Growing and Resting Cells. Curr. Microbiol. 2016, 72, 707–715. [Google Scholar] [CrossRef]
  49. Martinez, P.; Vera, M.; Bobadilla-Fazzini, R.A.; Haghshenas, D.F.; Alamdari, E.K.; Bonakdarpour, B.; Darvishi, D.; Nasernejad, B.; Elissawy, A.; Ebada, S.S.; et al. Omics on Bioleaching: Current and Future Impacts. Appl. Microbiol. Biotechnol. 2015, 99, 8337–8350. [Google Scholar] [CrossRef]
  50. Tansengco, M.; Tejano, J.; Coronado, F.; Gacho, C.; Barcelo, J. Heavy Metal Tolerance and Removal Capacity of Trichoderma Species Isolated from Mine Tailings in Itogon, Benguet. Environ. Nat. Resour. J. 2018, 16, 39–57. [Google Scholar] [CrossRef]
  51. Vásquez, C.; Colmenárez, Y.; Morales-Sánchez, J.; Valera, N.; Sandoval, M.F.; Balza, D. Current and Potential Use of Phytophagous Mites as Biological Control Agent of Weeds. Weed Biol. Control 2015, 109, 110–126. [Google Scholar]
  52. Yin, X.; Shan, X.; Shao, W.; Liu, L.; Liang, G.; Zhou, Q.; Lin, W. Copper from Waste Printed Circuit Boards Was Effectively Bioleached Using Newly Isolated Microorganisms and Subsequently Recovered by Microbial Fuel Cell. Sustainability 2023, 15, 9996. [Google Scholar] [CrossRef]
  53. Bellion, M.; Courbot, M.; Jacob, C.; Blaudez, D.; Chalot, M. Extracellular and Cellular Mechanisms Sustaining Metal Tolerance in Ectomycorrhizal Fungi. FEMS Microbiol. Lett. 2006, 254, 173–181. [Google Scholar] [CrossRef] [PubMed]
  54. Moore, B.A.; Duncan, J.R.; Burgess, J.E. Fungal Bioaccumulation of Copper, Nickel, Gold and Platinum. Min. Eng. 2008, 21, 55–60. [Google Scholar] [CrossRef]
  55. Lobos, A.; Harwood, V.J.; Scott, K.M.; Cunningham, J.A. Tolerance of Three Fungal Species to Lithium and Cobalt: Implications for Bioleaching of Spent Rechargeable Li-Ion Batteries. J. Appl. Microbiol. 2021, 131, 743–755. [Google Scholar] [CrossRef] [PubMed]
  56. Yang, J.; Wang, Q.; Wang, Q.; Wu, T. Heavy Metals Extraction from Municipal Solid Waste Incineration Fly Ash Using Adapted Metal Tolerant Aspergillus niger. Bioresour. Technol. 2009, 100, 254–260. [Google Scholar] [CrossRef] [PubMed]
  57. Jang, H.C.; Valix, M. Overcoming the Bacteriostatic Effects of Heavy Metals on Acidithiobacillus thiooxidans for Direct Bioleaching of Saprolitic Ni Laterite Ores. Hydrometallurgy 2017, 168, 21–25. [Google Scholar] [CrossRef]
  58. Chaerun, S.K.; Sulistyo, R.S.; Minwal, W.P.; Mubarok, M.Z. Indirect Bioleaching of Low-Grade Nickel Limonite and Saprolite Ores Using Fungal Metabolic Organic Acids Generated by Aspergillus niger. Hydrometallurgy 2017, 174, 29–37. [Google Scholar] [CrossRef]
  59. Shen, L.; Zhou, H.; Shi, Q.; Meng, X.; Zhao, Y.; Qiu, G.; Zhang, X.; Yu, H.; He, X.; He, H.; et al. Comparative Chemical and Non-Contact Bioleaching of Ion-Adsorption Type Rare Earth Ore Using Ammonium Sulfate and Metabolites of Aspergillus niger and Yarrowia Lipolytica to Rationalise the Role of Organic Acids for Sustainable Processing. Hydrometallurgy 2023, 216, 106019. [Google Scholar] [CrossRef]
  60. Park, L.K.E.; Liu, J.; Yiacoumi, S.; Borole, A.P.; Tsouris, C. Contribution of Acidic Components to the Total Acid Number (TAN) of Bio-Oil. Fuel 2017, 200, 171–181. [Google Scholar] [CrossRef]
  61. Shah, S.S.; Palmieri, M.C.; Sponchiado, S.R.P.; Bevilaqua, D. Environmentally Sustainable and Cost-Effective Bioleaching of Aluminum from Low-Grade Bauxite Ore Using Marine-Derived Aspergillus niger. Hydrometallurgy 2020, 195, 105368. [Google Scholar] [CrossRef]
  62. Zuo, J.; Tang, J.; Lu, M.; Zhou, Z.; Li, Y.; Tian, H.; Liu, E.; Gao, B.; Liu, T.; Shao, P. Glycolysis Rate-Limiting Enzymes: Novel Potential Regulators of Rheumatoid Arthritis Pathogenesis. Front. Immunol. 2021, 12, 779787. [Google Scholar] [CrossRef] [PubMed]
  63. Lin, X.; Heitman, J. Chlamydospore Formation during Hyphal Growth in Cryptococcus Neoformans. Eukaryot. Cell 2005, 4, 1746–1754. [Google Scholar] [CrossRef]
  64. Chen, S.; Cai, R.; Liu, Z.; Cui, H.; She, Z. Secondary Metabolites from Mangrove-Associated Fungi: Source, Chemistry and Bioactivities. Nat. Prod. Rep. 2021, 39, 560–595. [Google Scholar] [CrossRef] [PubMed]
  65. Luo, Z.; Ren, H.; Mousa, J.J.; Rangel, D.E.N.; Zhang, Y.; Bruner, S.D.; Keyhani, N.O. The PacC Transcription Factor Regulates Secondary Metabolite Production and Stress Response, but Has Only Minor Effects on Virulence in the Insect Pathogenic Fungus Beauveria Bassiana. Environ. Microbiol. 2017, 19, 788–802. [Google Scholar] [CrossRef] [PubMed]
  66. Al-Rashdi, F.K.H.; Al-Sadi, A.M.; Al-Riyamy, B.Z.; Maharachchikumbura, S.S.N.; Al-Sabahi, J.N.; Velazhahan, R. Endophytic Fungi from the Medicinal Plant Aloe dhufarensis Lavranos Exhibit Antagonistic Potential against Phytopathogenic Fungi. S. Afr. J. Bot. 2022, 147, 1078–1085. [Google Scholar] [CrossRef]
  67. Zhu, A.; Zheng, F.; Zhang, W.; Li, L.; Li, Y.; Hu, H.; Wu, Y.; Bao, W.; Li, G.; Wang, Q.; et al. Oxidation and Antioxidation of Natural Products in the Model Organism Caenorhabditis Elegans. Antioxidants 2022, 11, 705. [Google Scholar] [CrossRef]
  68. Legiša, M.; Mattey, M. Changes in Primary Metabolism Leading to Citric Acid Overflow in Aspergillus niger. Biotechnol. Lett. 2007, 29, 181–190. [Google Scholar] [CrossRef]
  69. Liu, H.; Jin, Y.; Zhang, R.; Ning, Y.; Yu, Y.; Xu, P.; Deng, L.; Wang, F. Recent Advances and Perspectives on Production of Value-Added Organic Acids through Metabolic Engineering. Biotechnol. Adv. 2023, 62, 108076. [Google Scholar] [CrossRef]
  70. Morin, N.; Cescut, J.; Beopoulos, A.; Lelandais, G.; Le Berre, V.; Uribelarrea, J.L.; Molina-Jouve, C.; Nicaud, J.M. Transcriptomic Analyses during the Transition from Biomass Production to Lipid Accumulation in the Oleaginous Yeast Yarrowia Lipolytica. PLoS ONE 2011, 6, e27966. [Google Scholar] [CrossRef]
  71. Yang, Q.; Qian, X.; Routledge, M.N.; Wu, X.; Shi, Y.; Zhu, Q.; Zhang, H. Metabonomics Analysis of Postharvest Citrus Response to Penicillium Digitatum Infection. LWT 2021, 152, 112371. [Google Scholar] [CrossRef]
Figure 1. Five different growth phases of fungi in the presence of metals. This figure was adapted and modified from those observed in Rose and Devi [27] and Valix et al. [43].
Minerals 14 00235 g001
Figure 2. Tolerance index of Trichoderma, Talaromyces, Penicillium_3, and Penicillium_6 to increasing concentration of four different metals: (a) Aluminum, (b) Zinc, (c) Nickel, and (d) Chromium.
Minerals 14 00235 g002
Figure 3. Illustrates a comparison of the growth rates of Trichoderma, Talaromyces, Penicillium_3, and Penicillium_6 under varying metal concentrations. Lowest metal concentration (100 mg/L) and the highest metal concentrations (1500 mg/L for Al, 600 mg/L for Zn, and 200 mg/L for Ni). This was in contrast to the control group (no added metal).
Minerals 14 00235 g003
Figure 4. Growth behavior of the four isolates in the presence of metals: (a) Trichoderma, (b) Talaromyces, (c) Penicillium_3, and (d) Penicillium_6.
Minerals 14 00235 g004
Figure 5. Glucose, sucrose, and fructose utilization by the four selected isolates. (a) represents the pH decrease after 5 days of incubation, and (b) represents the calculated molarity of organic acids. Carbon source utilization is directly linked to the production of organic acids which causes a decrease in pH. The use of glucose resulted the lowest pH for Trichoderma, Talaromyces, Penicillium_3, and Penicillium_6.
Minerals 14 00235 g005
Figure 6. pH measurements during the growth of Trichoderma, Talaromyces, Penicillium_3, and Penicillium_6 with glucose as the carbon source after 15 days. Error bars represent ±SD; n = 3.
Minerals 14 00235 g006
Figure 7. The heatmap depicts the average levels of identified metabolites detected during the growth of Trichoderma, Talaromyces, Penicillium_3, and Penicillium_6. Columns represent sample collection days for each isolate, while rows represent different metabolites. Metabolites highlighted in blue are associated with the citric acid cycle, those in purple pertain to lipids, and those in orange are related to carbohydrate metabolism. The clusters in the heatmap were formed using hierarchical clustering. This method grouped the metabolites by their similarities in Euclidean distances, aiming to minimize the variance within each cluster.
Minerals 14 00235 g007
Figure 8. (a) The furfural degradation pathway, with the four compounds highlighted in red. (bd) The error bar plots represent the most abundant metabolites and show their comparison among the four isolates, which eventually contribute to the citric acid cycle. The Kyoto Encyclopedia of Genes and Genomes (KEGG) was used for compound identification and determination of the pathways they are related to.
Minerals 14 00235 g008
Table 1. Media composition for enrichment and isolation of bioleaching microorganisms [37,38,39,40,41].
Name Composition
General
Basic bioleaching media composition3.0 g/L (NH4)2SO4, 0.5 g/L MgSO4·7H2O, 0.5 g/L K2HPO4, 0.1 g/L KCl, FeSO4·7H2O or sulfur and 1.5% Agar bacteriological
Compounds Different in Each MediapHReferences
Silverman and Lundgren 9 K0.01 g/L Ca (NO3)21.8[37]
KDM0.145 g/L NaH2PO4, 0.021 g/L CaCL21.8[38]
Iron-tryptone soya broth (FeTSB)0.05 g/L Ca (NO3)2, 0.25 g/L Tryptone soy broth1.8[39]
Glucose yeast extract medium (GYEM), when prepared as broth—GYEB, and when prepared as agar—GYEA5 g/L glucose, 0.05 g/L yeast extract3[40]
Yeast sucrose media (YSM)100 g/L sucrose, 1.5g/l NaNO3, 1.6 g/L yeast extract3[41]
Table 2. Qualitative and quantitative screening of fungal isolates for organic acid production. Error bars represent ± SD; n = 3.
OrganismOrganic Acid
QualitativeQuantitative
Colony Zone (mm)Yellow Zone (mm)Acid Unitage (AU)pH
Penicillium_727.9149.041.75 ± 0.066.25 ± 0.10
Coniochaeta28.0644.681.59 ± 0.036.16 ± 0.14
Acidiella0.000.000.006.15 ± 0.14
Penicillium_423.9144.741.87 ± 0.066.013 ± 0.02
Penicillium_123.5534.421.46 ± 0.036.04 ± 0.03
Acidomyces0.000.000.005.965 ± 0.01
Penicillium_221.7644.992.03 ± 0.035.88 ± 0.4
Talaromyces_225.3436.671.45 ± 0.145.76 ± 0.02
Fodinomyces0.000.000.005.53 ± 0.06
Penicillium_526.2146.551.77 ± 0.355.07 ± 0.0
Fusarium32.5037.751.16 ± 0.054.14 ± 0.0
Penicillium_621.5028.811.33 ± 0.174.16 ± 0.03
Penicillium_317.8637.972.13 ± 0.114.08 ± 0.01
Trichoderma35.7148.811.37 ± 0.0073.70 ± 0.003
Talaromyces_18.5615.621.82 ± 0.023.46 ± 0.01
Disclaimer/Publisher’s Note: The statements, opinions and data contained in all publications are solely those of the individual author(s) and contributor(s) and not of MDPI and/or the editor(s). MDPI and/or the editor(s) disclaim responsibility for any injury to people or property resulting from any ideas, methods, instructions or products referred to in the content.

