Article

Efficient Extraction of Lithium from Calcined Kaolin Lithium Clay with Dilute Sulfuric Acid

1
Zijin School of Geology and Mining, Fuzhou University, Fuzhou 350108, China
2
Fujian Key Laboratory of Green Extraction and High-Value Utilization of New Energy Metals, Fuzhou 350108, China
3
Yunnan Yuntianhua Co., Ltd., Kunming 650228, China
*
Author to whom correspondence should be addressed.
Minerals 2024, 14(4), 359; https://doi.org/10.3390/min14040359
Submission received: 22 November 2023 / Revised: 22 December 2023 / Accepted: 26 December 2023 / Published: 29 March 2024
(This article belongs to the Special Issue Recent Advances in Extractive Metallurgy)

Abstract

:
In this study, the structure and phase transition of kaolin lithium clay at different calcination temperatures were studied and discussed; subsequently, the effects of Li leaching with sulfuric acid under various factors were investigated in detail. The experimental results indicated that an optimal Li leaching rate of 81.1% could be achieved when kaolin lithium clay was calcined at 600 °C for 1 h, followed by leaching with 15.0% sulfuric acid at 80 °C for 2 h. The TG-DSC, XRD, and SEM analyses showed that the layered structure of the clay was not destroyed during the leaching and calcination processes. During the process of calcination, kaolinite was converted to metakaolinite via dehydroxylation. During the process of leaching, the Al on the surface of the metakaolinite was dissolved by sulfuric acid, resulting in the destruction of the Al-O structure; then, Li+ was exchanged for H+ to the surface of the mineral and entered the solution under the action of diffusion. The leaching kinetics showed that the leaching process was controlled by a diffusion model, and the activation energy (Ea) was 41.3 kJ/mol. The rapid extraction of Li from calcined kaolin lithium clay with sulfuric acid leaching offers a high-efficiency, low-energy-consumption strategy for the utilization of new lithium resources.

1. Introduction

The ever-increasing demand for Li caused the price of Li2CO3 to rise rapidly. As such, diversifying the global Li supply chain by finding new lithium reserves is an imperative [1,2,3]. Fortunately, a new clay-type lithium resource deposit has been discovered in China [4]. Clay minerals are lithium’s most probable host mineral: Li+ may occur in the interlayer structure of clay [5,6,7]. According to the main different clay minerals present, lithium clay can be divided into the kaolinite type and montmorillonite type. The properties and structures of these two types are different, so the extraction methods used for each clay type also differ. Usually, montmorillonite is a 2:1 type structure composed of two layers of tetrahedral silicon oxygen sheets sandwiching one layer of octahedral aluminum sheet, so the interlayer carries a negative charge and has strong ion exchange capabilities [8]. Kaolinite is a 1:1 structure formed by the connection of one tetrahedral silicon oxygen sheet and one octahedral aluminum sheet. The layers are connected to each other through hydrogen bonds, which has a strong interlayer binding force and makes ion exchange between the layers almost impossible [9].
At present, researchers have mainly focused on montmorillonite lithium clay, and they have agreed that the leaching of Li+ occurs via a special ion exchange process, rather than via mineral dissolution [10]. Sun exchanged Li+ with Na+ in montmorillonite clay via high-energy milling, where the leached recovery of lithium reached 60.0% [11]. To further improve the leaching rate of Li, Zhu et al. studied the leaching of roasted montmorillonite lithium clay using different sulfate solutions, and the results indicated that the use of Fe2(SO4)3 solution could achieve a maximum Li extraction rate of 73.6% [12]. Notably, the presence of excessive amounts of metal ions (e.g., Na+ and Fe+) may have a negative impact on the subsequent preparation of Li2CO3. However, H2SO4 contains a large amount of H+, so was found to be suitable for Li exchange in clay. Zhang et al. employed mixed high-concentration acid for the direct leaching of Li-rich bauxite mine tailings, which mainly contained kaolinite, and a high Li leaching rate of 96.4% was achieved. Nevertheless, the high-concentration acid in the leaching process increases costs and would lead to environmental pollution [13]. A previous study found that calcination could greatly promote the leaching of Li using a simple and low-concentration-acid system. A Li leaching rate of 73.6% could be achieved from roasted montmorillonite lithium clay with 15.0% H2SO4 solution [14]. The calcination and acid leaching method may also be suitable for kaolin-type lithium clay. In comparison with the extensive investigations on leaching Li from montmorillonite-type lithium clay, the Li extraction from kaolin-type lithium clay has been less studied. Additionally, there have been few studies on the effect of the calcination and leaching process on Li, and its Li leaching mechanism has not been accurately described.
In this study, kaolin lithium clay was characterized, and its thermodynamic properties were analyzed. Furthermore, the leaching efficiency of Li in calcined clay was studied by changing the calcination temperature, calcination time, leaching temperature, leaching time, and sulfuric acid concentration. Finally, the morphology and structure of kaolin lithium clay before and after leaching were studied, and the leaching mechanism of Li+ in kaolin clay was further explained through leaching kinetics. This study will be beneficial for the further processing of lithium clay.

2. Experimental Materials and Methods

2.1. Materials

The lithium clay used in this study was collected from Yuxi City, northeast Yunnan, China. Table 1 describes the composition of the clay as measured using X-ray fluorescence (XRF). Alumina oxides and silicon oxides were the main components of the clay. The content of Li2O in the ore was 0.4%, and the content of Li was calculated as 1867 μg/g. Cui reported that lithium clay contains an average of 980 μg/g Li (with the highest concentration reaching 3453 μg/g) [15]. This means that the lithium clay used in this study had a relatively high lithium content.

2.2. Methods

After crushing and grinding, samples less than 74 µm in size were obtained, which were calcined in a muffle furnace at 600 °C for 1 h. Then, the calcined clay was leached in 15.0% H2SO4 solution using a solid–liquid ratio of 1:5 g/mL, which was stirred at 300 r/min for 2 h at 90 °C. After filtration, NaOH was added into the leaching solution to adjust the pH to 4, which was left to stand for 6 h. Al3+ and Fe2+ were precipitated and removed.

2.3. Characterization

The element concentrations in the leaching solutions were determined using inductively coupled plasma–atomic emission spectrometry (ICP-OES). Differential scanning calorimetry (DSC) and thermogravimetric analysis (TGA) were performed using a STA 449F5 DSC-TG Jupiter test machine (Netzsch, Germany) at a heating rate of 10 °C/min to characterize the decomposition behavior of lithium clay in nitrogen atmosphere from 0 to 1200 °C. The morphology and element distribution of the lithium clay samples calcined at different calcining temperatures were characterized using scanning electron microscopy (SEM).

3. Results and Discussion

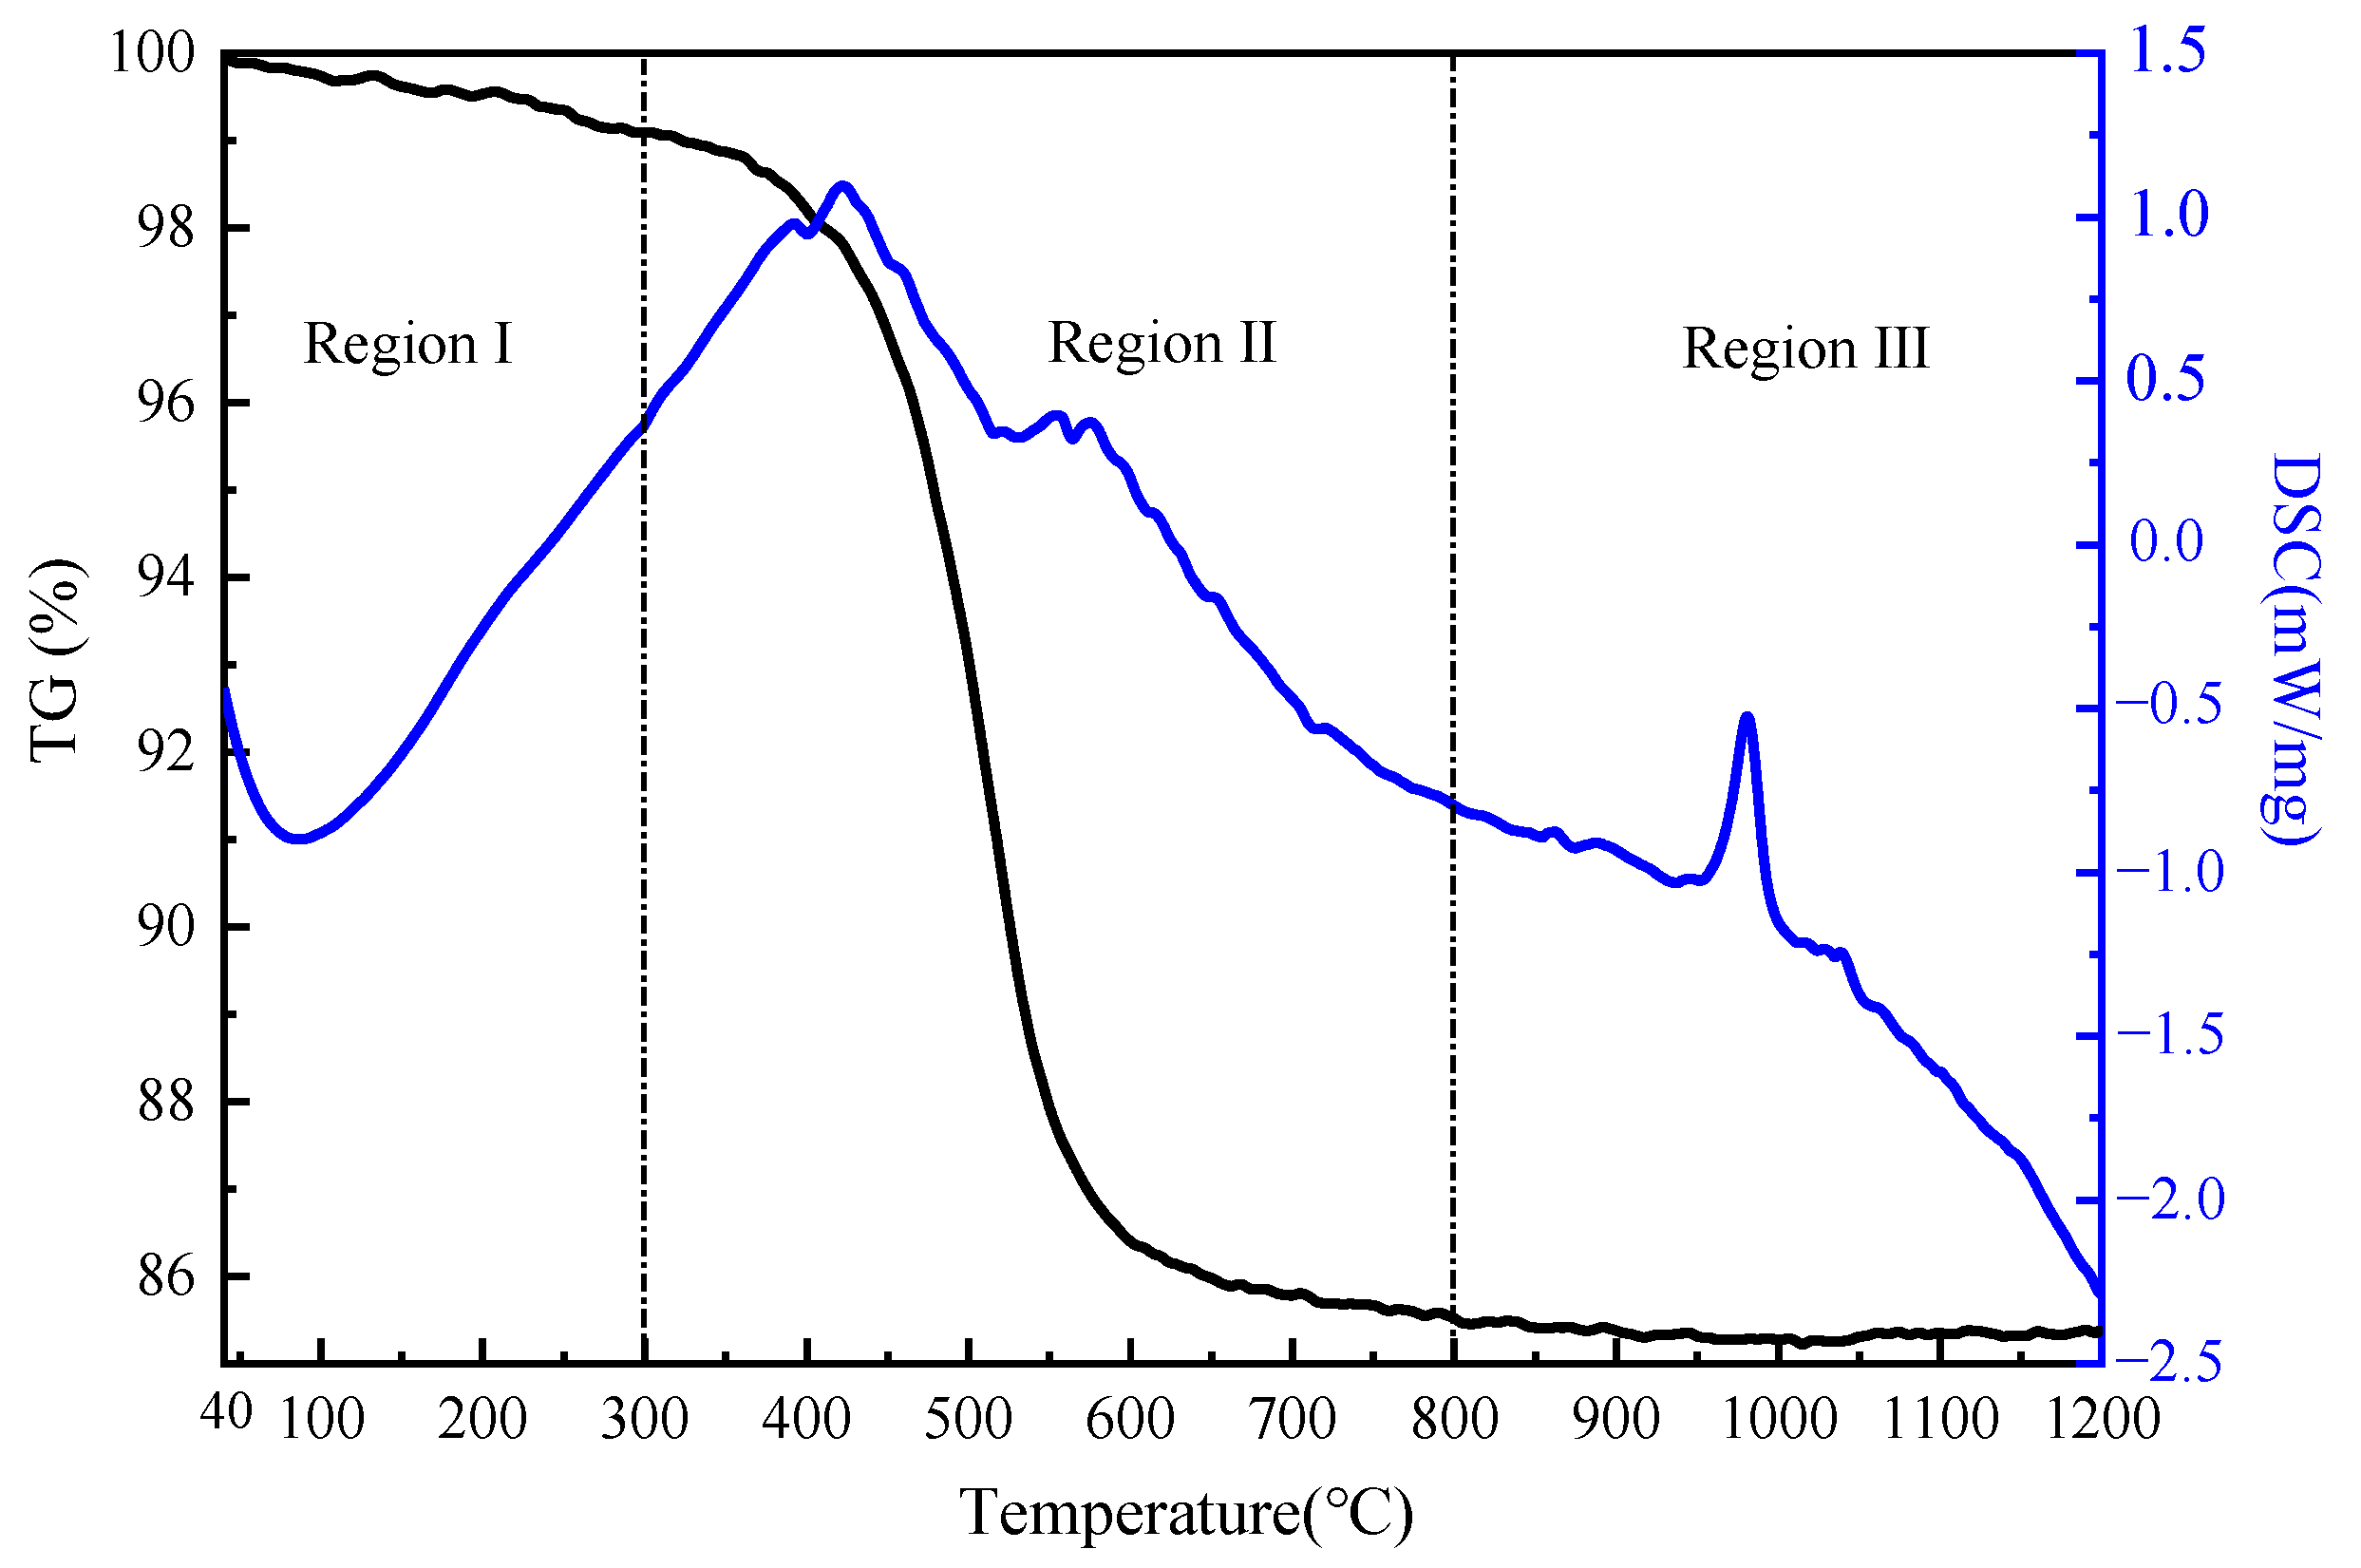
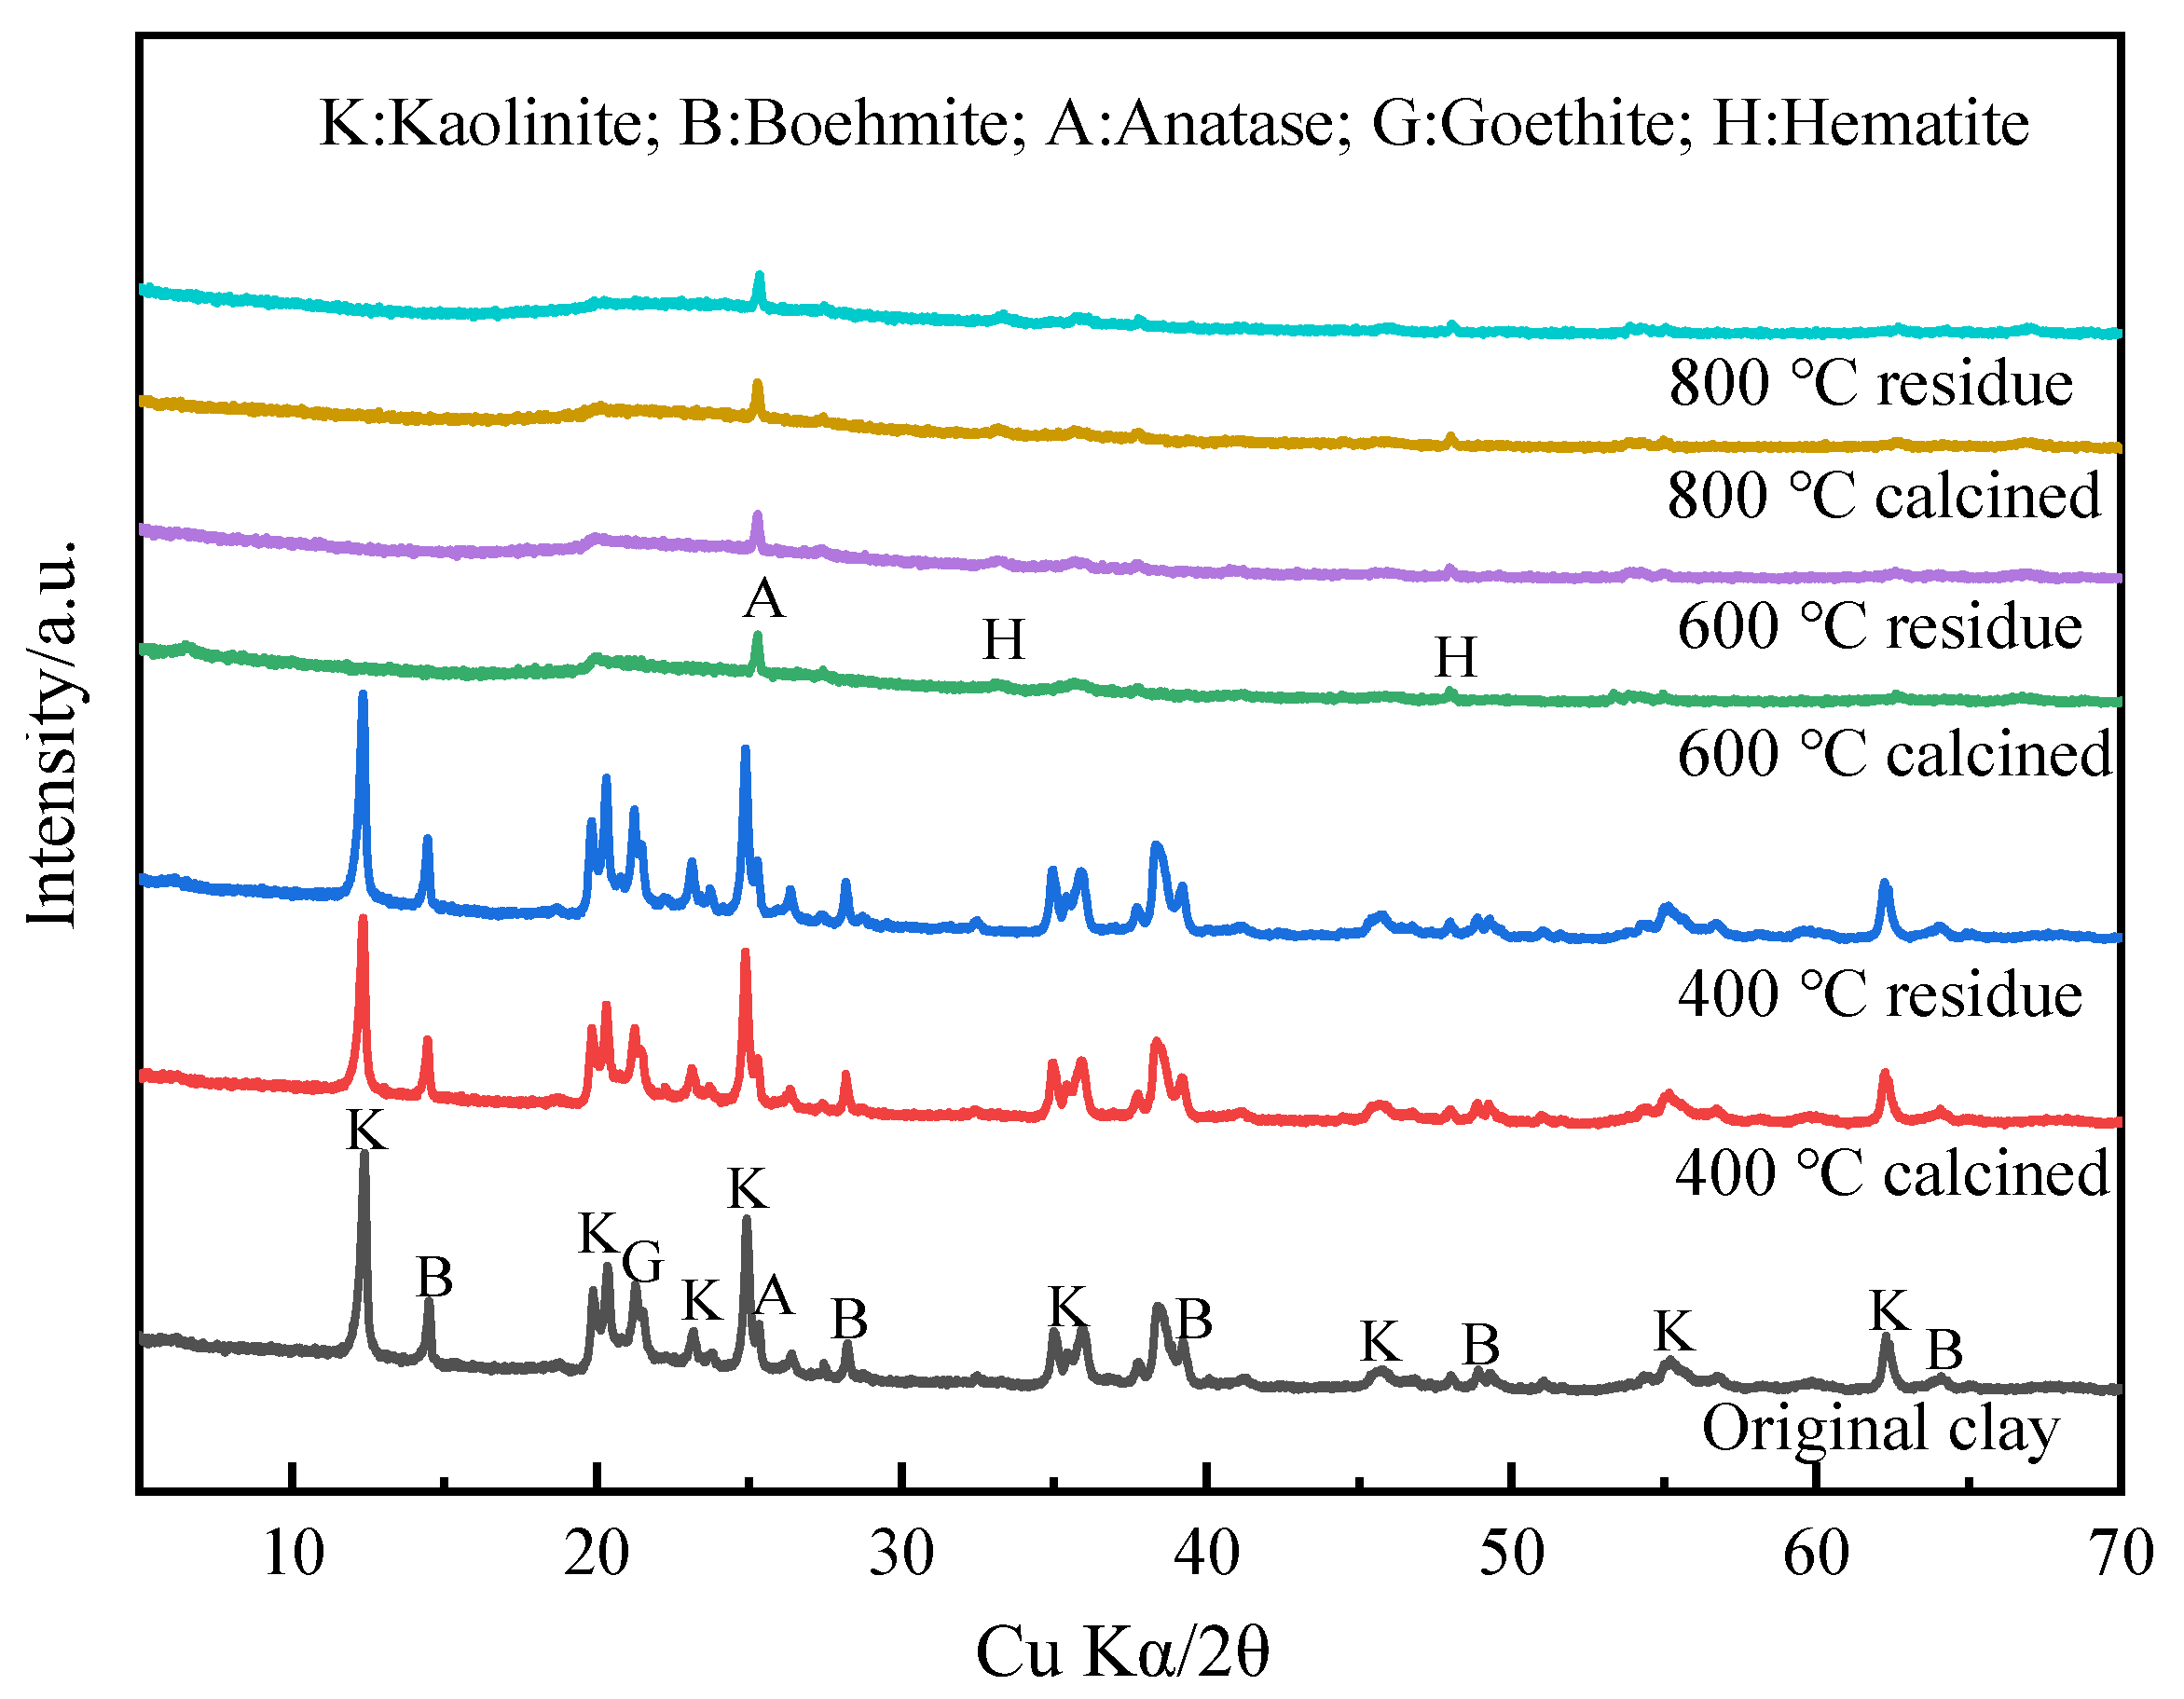
3.1. Composition and Thermodynamic Properties of Kaolin Lithium Clay

The thermodynamic properties of lithium clay can be analyzed using TG-DSC. This method can be used to simply and accurately analyze the phase transition characteristics of lithium clay and reflect the initial temperature of the phase transition of lithium clay [16]. Figure 1 shows the TG and DSC curves of the lithium clay. The TG curve decreases slightly before 300 °C, drops sharply from 300 °C to 800 °C, and barely changes after 800 °C. According to mass variation trend, the DSC curve can be divided into three temperature regions. In region I, from 40 °C to 350 °C, the first endothermic peak at around 100 °C in DSC curve corresponds to the dehydration of adsorbed water [17]. In region Ⅱ, from 300 °C to 800 °C, the loss of structural water causes the weight loss to increase sharply; the second endothermic peak at 520 °C on the DSC curve is related to the hydroxylation of the lithium clay sample [18]. In region Ⅲ, from 800 °C to 1200 °C, no weight was lost, and the exothermic peak at 980 °C suggests the recrystallization of lithium clay [19].
It can be seen from Figure 2 that the main minerals in the clay were kaolinite, boehmite, goethite, and their peaks gradually disappeared after 600 °C, which were converted to metakaolinite, γ-Al2O3, and hematite, respectively. With further increases in the calcination temperature, metakaolinite was converted to mullite at 900 °C [20,21,22]. This is consistent with the TG and DSC results above.

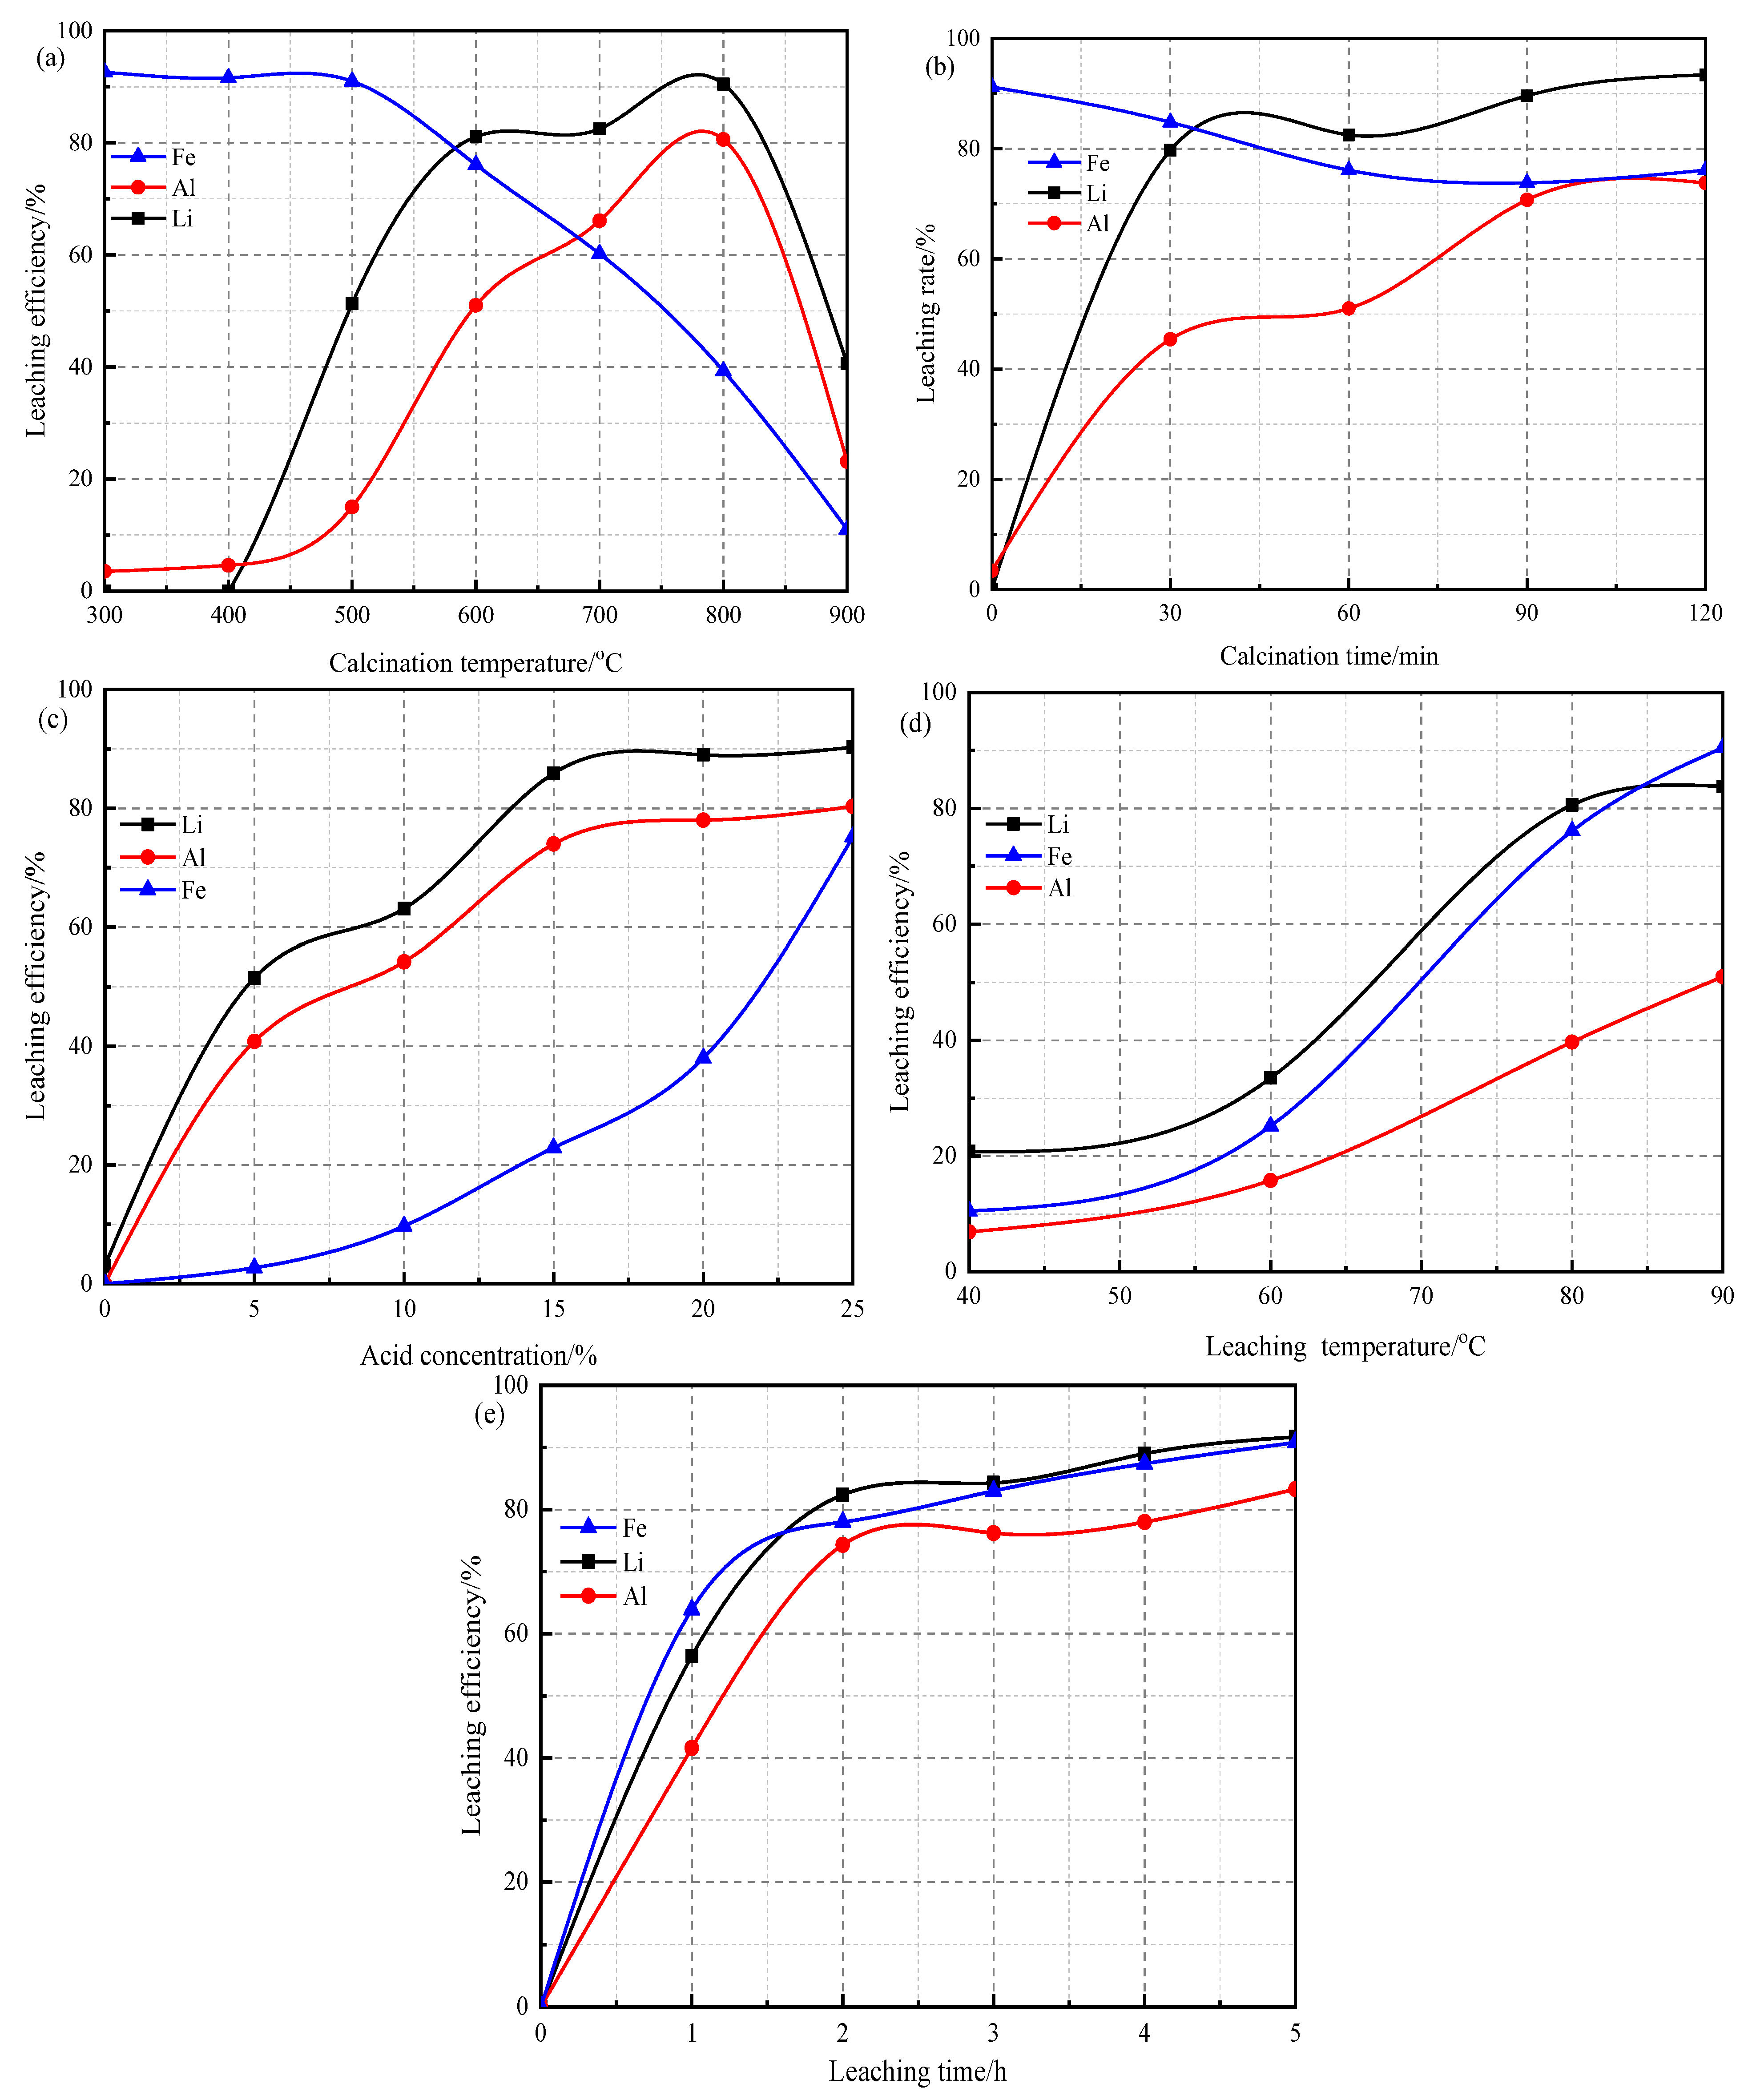
3.2. Lithium Ion Leaching Rate under Different Influencing Factors

Clay minerals are present in different phases at different calcining temperatures; combined with the thermodynamic properties of clay minerals, the leaching mechanism can be analyzed [23]. Figure 3a shows the leaching behaviors of the metals from raw lithium clay and its converted products calcined at different temperatures. Before 500 °C, with the increase in temperature, the adsorption water started to decrease, and the weight loss increased gradually, which led to the decrease in the interlayer spacing of the lithium clay, so the H+ in the solution experienced difficulty in entering the interlayer. This process can explain why the leaching rate of Li was almost 0 in the lithium clay calcined at 300 °C and 400 °C [24]. In the range of approximately 500 °C to 800 °C, lithium clay undergoes structural collapse because of the loss of structural water. Here, smaller ions can enter into the Al-O structure, which replace Li. This behavior may be thought of as a special ion exchange process [16,19]. Moreover, the Al-O structure may retighten as temperature increases [14]. This behavior can explain the higher leaching rate of Li in solution at 500 °C and 600 °C, and then the moderate rise from 600 °C and 800 °C. The aluminum in clay was mainly found in kaolinite and boehmite, the structure of which is relatively stable and is not easily dissolved using sulfuric acid. After 500 °C, kaolinite transformed into structurally unstable metakaolinite under dehydroxylation, and the aluminum on its surface was dissolved by sulfuric acid. Meanwhile, the boehmite converted to Al2O3 and was easily dissolved by sulfuric acid. This explains why the recovery rate of Al increased with increasing temperature before 800 °C. The iron in clay is usually present in the form of hydroxide, which can be dissolved using inorganic acids at room temperature or under heating conditions [25]. After 500 °C, brown goethite FeO(OH) dehydrated into red hematite Fe2O3, which has a more compact structure, which explained why the Fe leaching ratio remained at 90.0% below 500 °C but decreased steadily with increasing leaching temperature [26]. At temperatures above 900 °C, the kaolinite recrystallized to form mullite, which solidified the metals, preventing their leaching by the solution and causing the leaching rates of all three investigated metals to sharply decrease at 900 °C [27]. The leaching rate of Li was about 80.0% at 600 °C to 800 °C, while the leaching rate of Al was 51.0% and 81.6% at 600 °C and 800 °C, respectively. Al is an important contaminant in the extraction process that presents difficulties for subsequent separation, so it is very important to reduce the content of aluminum in the leaching solution. As discussed above, it was suggested that a calcination temperature of 600 °C is the optimal condition [28].
The calcination time has an important effect on the leaching rate: an appropriate calcination time can ensure the crystal phase of the mineral completely transforms [29]. Figure 3b shows the change in metal leaching amount with calcining time. Li and Al were barely leached from the uncalcined lithium clay, while the leaching rate of Fe at this time reached the highest value of 91.2%. When the calcination time reached 30 min, the leaching rate of Li was 80.0% and that of Al was 45.4%. With the increase in calcination time, the leaching rate of Li changed little, while the leaching rate of Al increased greatly, reaching 73.8% when the calcination duration was 120 min. The leaching rate of Fe decreased with the increase in calcination time, reaching 73.8% at 90 min. The lower the contents of Fe and Al, the better the subsequent process. The leaching of Al and Fe were less than 51.0% and 76.1% at 60 min, respectively. Therefore, the optimum calcination time for Li extraction was 60 min, and the extraction rate of Li was 82.5%.
The concentration of sulfuric acid in the leaching process is very important because different concentrations of H2SO4 have different H+ concentrations. As shown in Figure 3c, the leaching rate of the three metal ions increased with the increase in the sulfuric acid concentration when the sulfuric acid concentration was less than 15%. The highest leaching rate of Li was 85.9%. This is because with the increase in the sulfuric acid concentration, sulfuric acid ionization resulted in the increase in the hydrogen ion concentration. Higher H+ concentrations are conducive to the release of cations from soluble minerals [30]. The increases in Li and Al leaching were less than 2.0%, but the leaching rate of Fe increased obviously as the H2SO4 concentration rose. The low concentration of ions of impurities is beneficial for the subsequent purification process; therefore, 15% H2SO4 was found to be the optimal condition.
An increase in temperature in the leaching process increases the internal energy of the reactants, which improves the leaching reaction rate and shortens the time required for the leaching to reach the equilibrium point [31]. Figure 3d shows the variation in the metals that leached with increasing leaching temperature. The leaching of Li increased before 80 °C and then remained at about 80%, while the leaching of Al and Fe increased with temperature. So, choosing 80 °C as the leaching temperature can effectively reduce the content of ion impurities. The leaching rate of Li reached 80.6%, which was higher than those of Al and Fe, which were 39.7% and 76.1%, respectively.
Finding the appropriate leaching time can effectively improve the leaching rate and reduce the cost. When the leaching time is too short, the leaching reaction is not balanced, and when the leaching time increases, the ion leaching rate is higher. However, as the leaching time continues to increase, the leaching rate of metal ions does not increase much [32]. The change in the rate of metal leaching with increasing leaching time is shown in Figure 3e. The leaching recoveries of the three metal ions apparently increased in the first 120 min, and then a slow increase was observed. The leaching rate of lithium reached 82.4% when the leaching time was 120 min, which was higher than those of Al and Fe, which were 74.3% and 78.0%, respectively. When the leaching time was further extended to 300 min, the leaching rate of Li was 91.7%; those of Al and Fe were 83.3% and 90.8%, respectively. Beyond 120 min, the increase in leaching time had a weak impact on the leaching rate but greatly increased the cost. Therefore, the optimal leaching time is suggested as 120 min.
In summary, the optimum conditions for extracting lithium from kaolin lithium clay with sulfuric acid are calcination at 600 °C for 1 h and leaching with 15.0% sulfuric acid for 80 °C for 2 h. Under these conditions, recoveries of 81.1% Li, 76.1% Fe, and 51% Al were achieved, respectively.

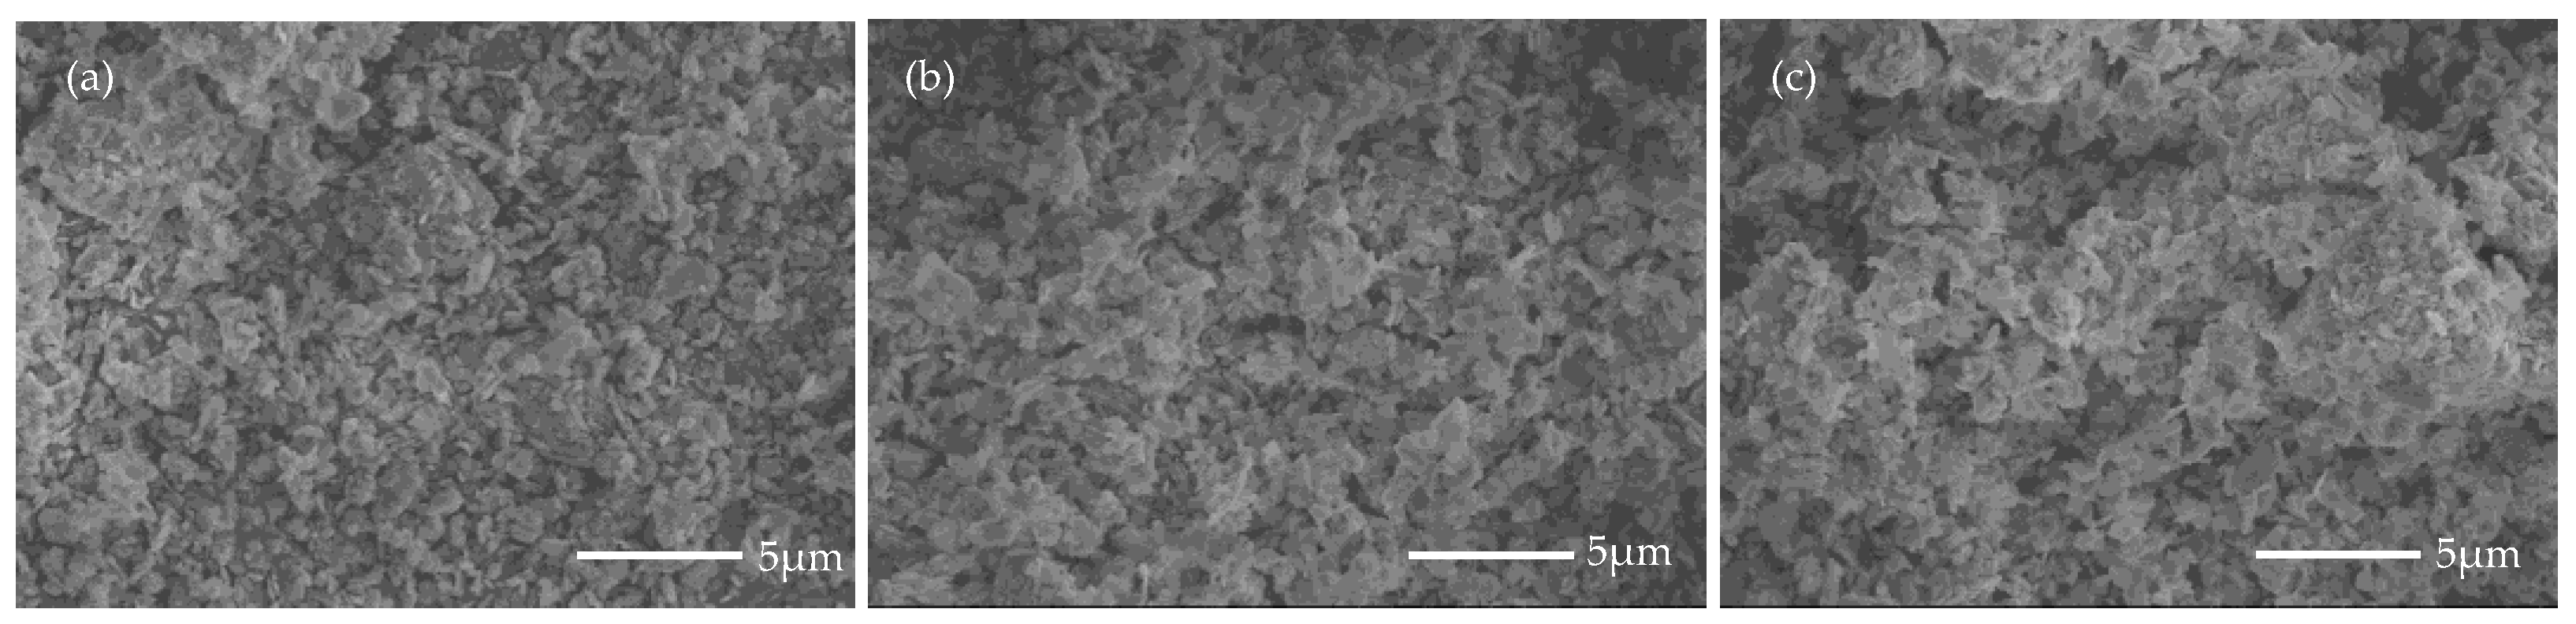
3.3. Morphology and Structure of the Residue
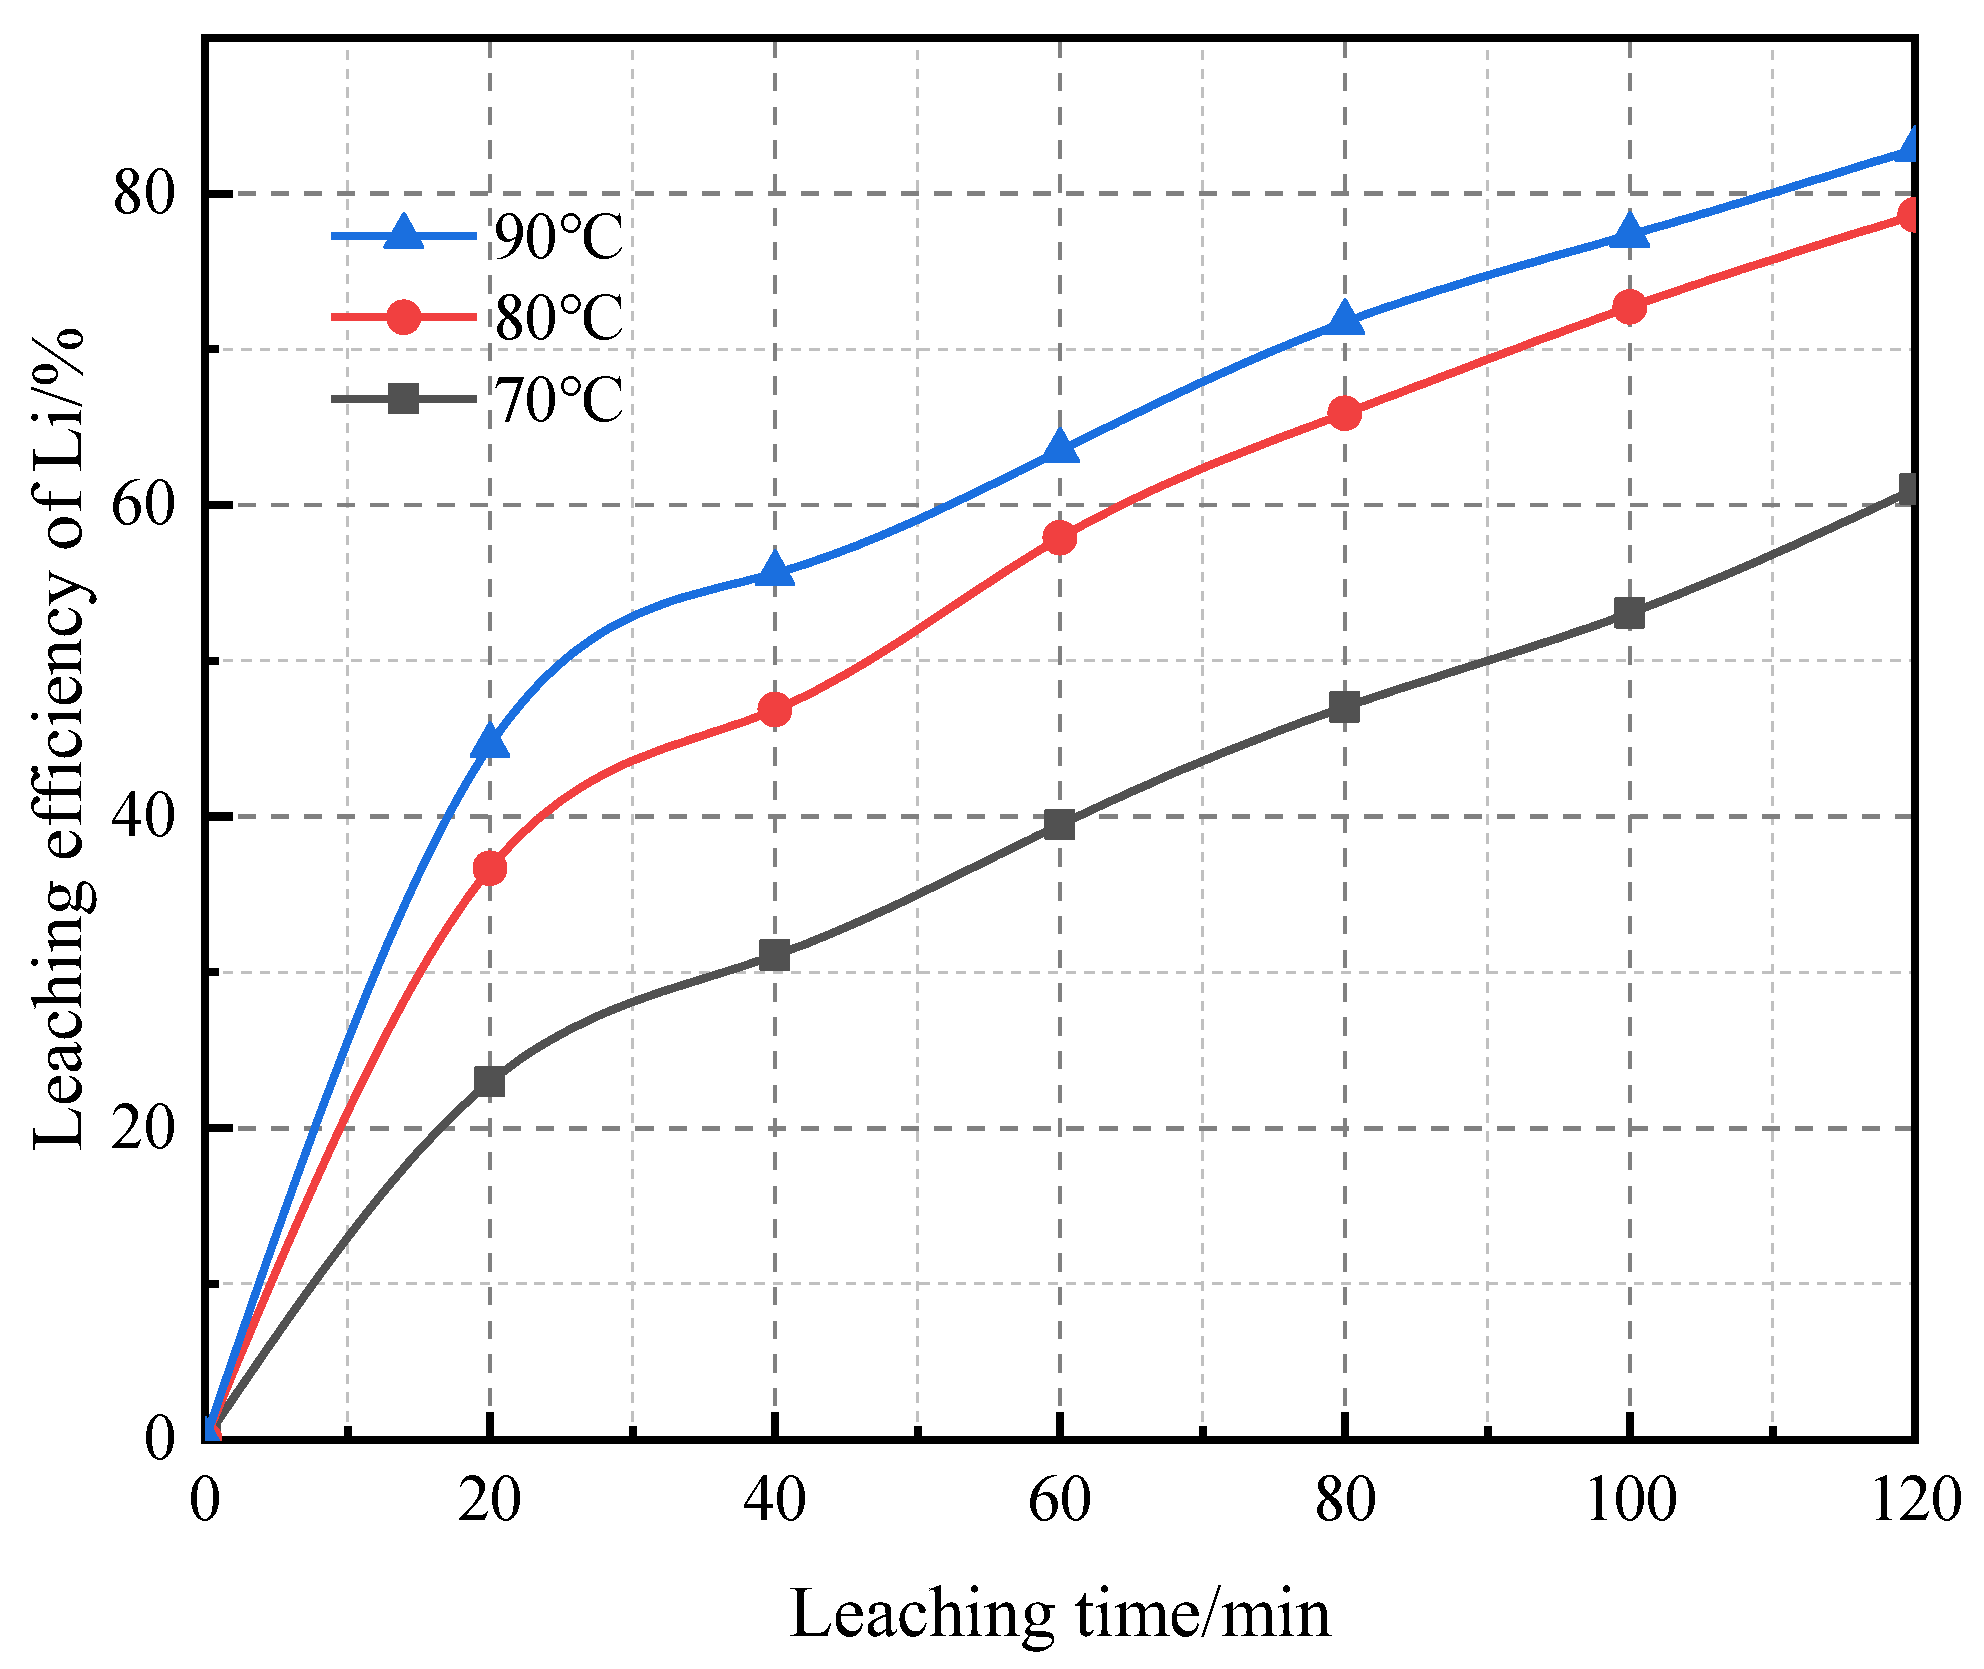
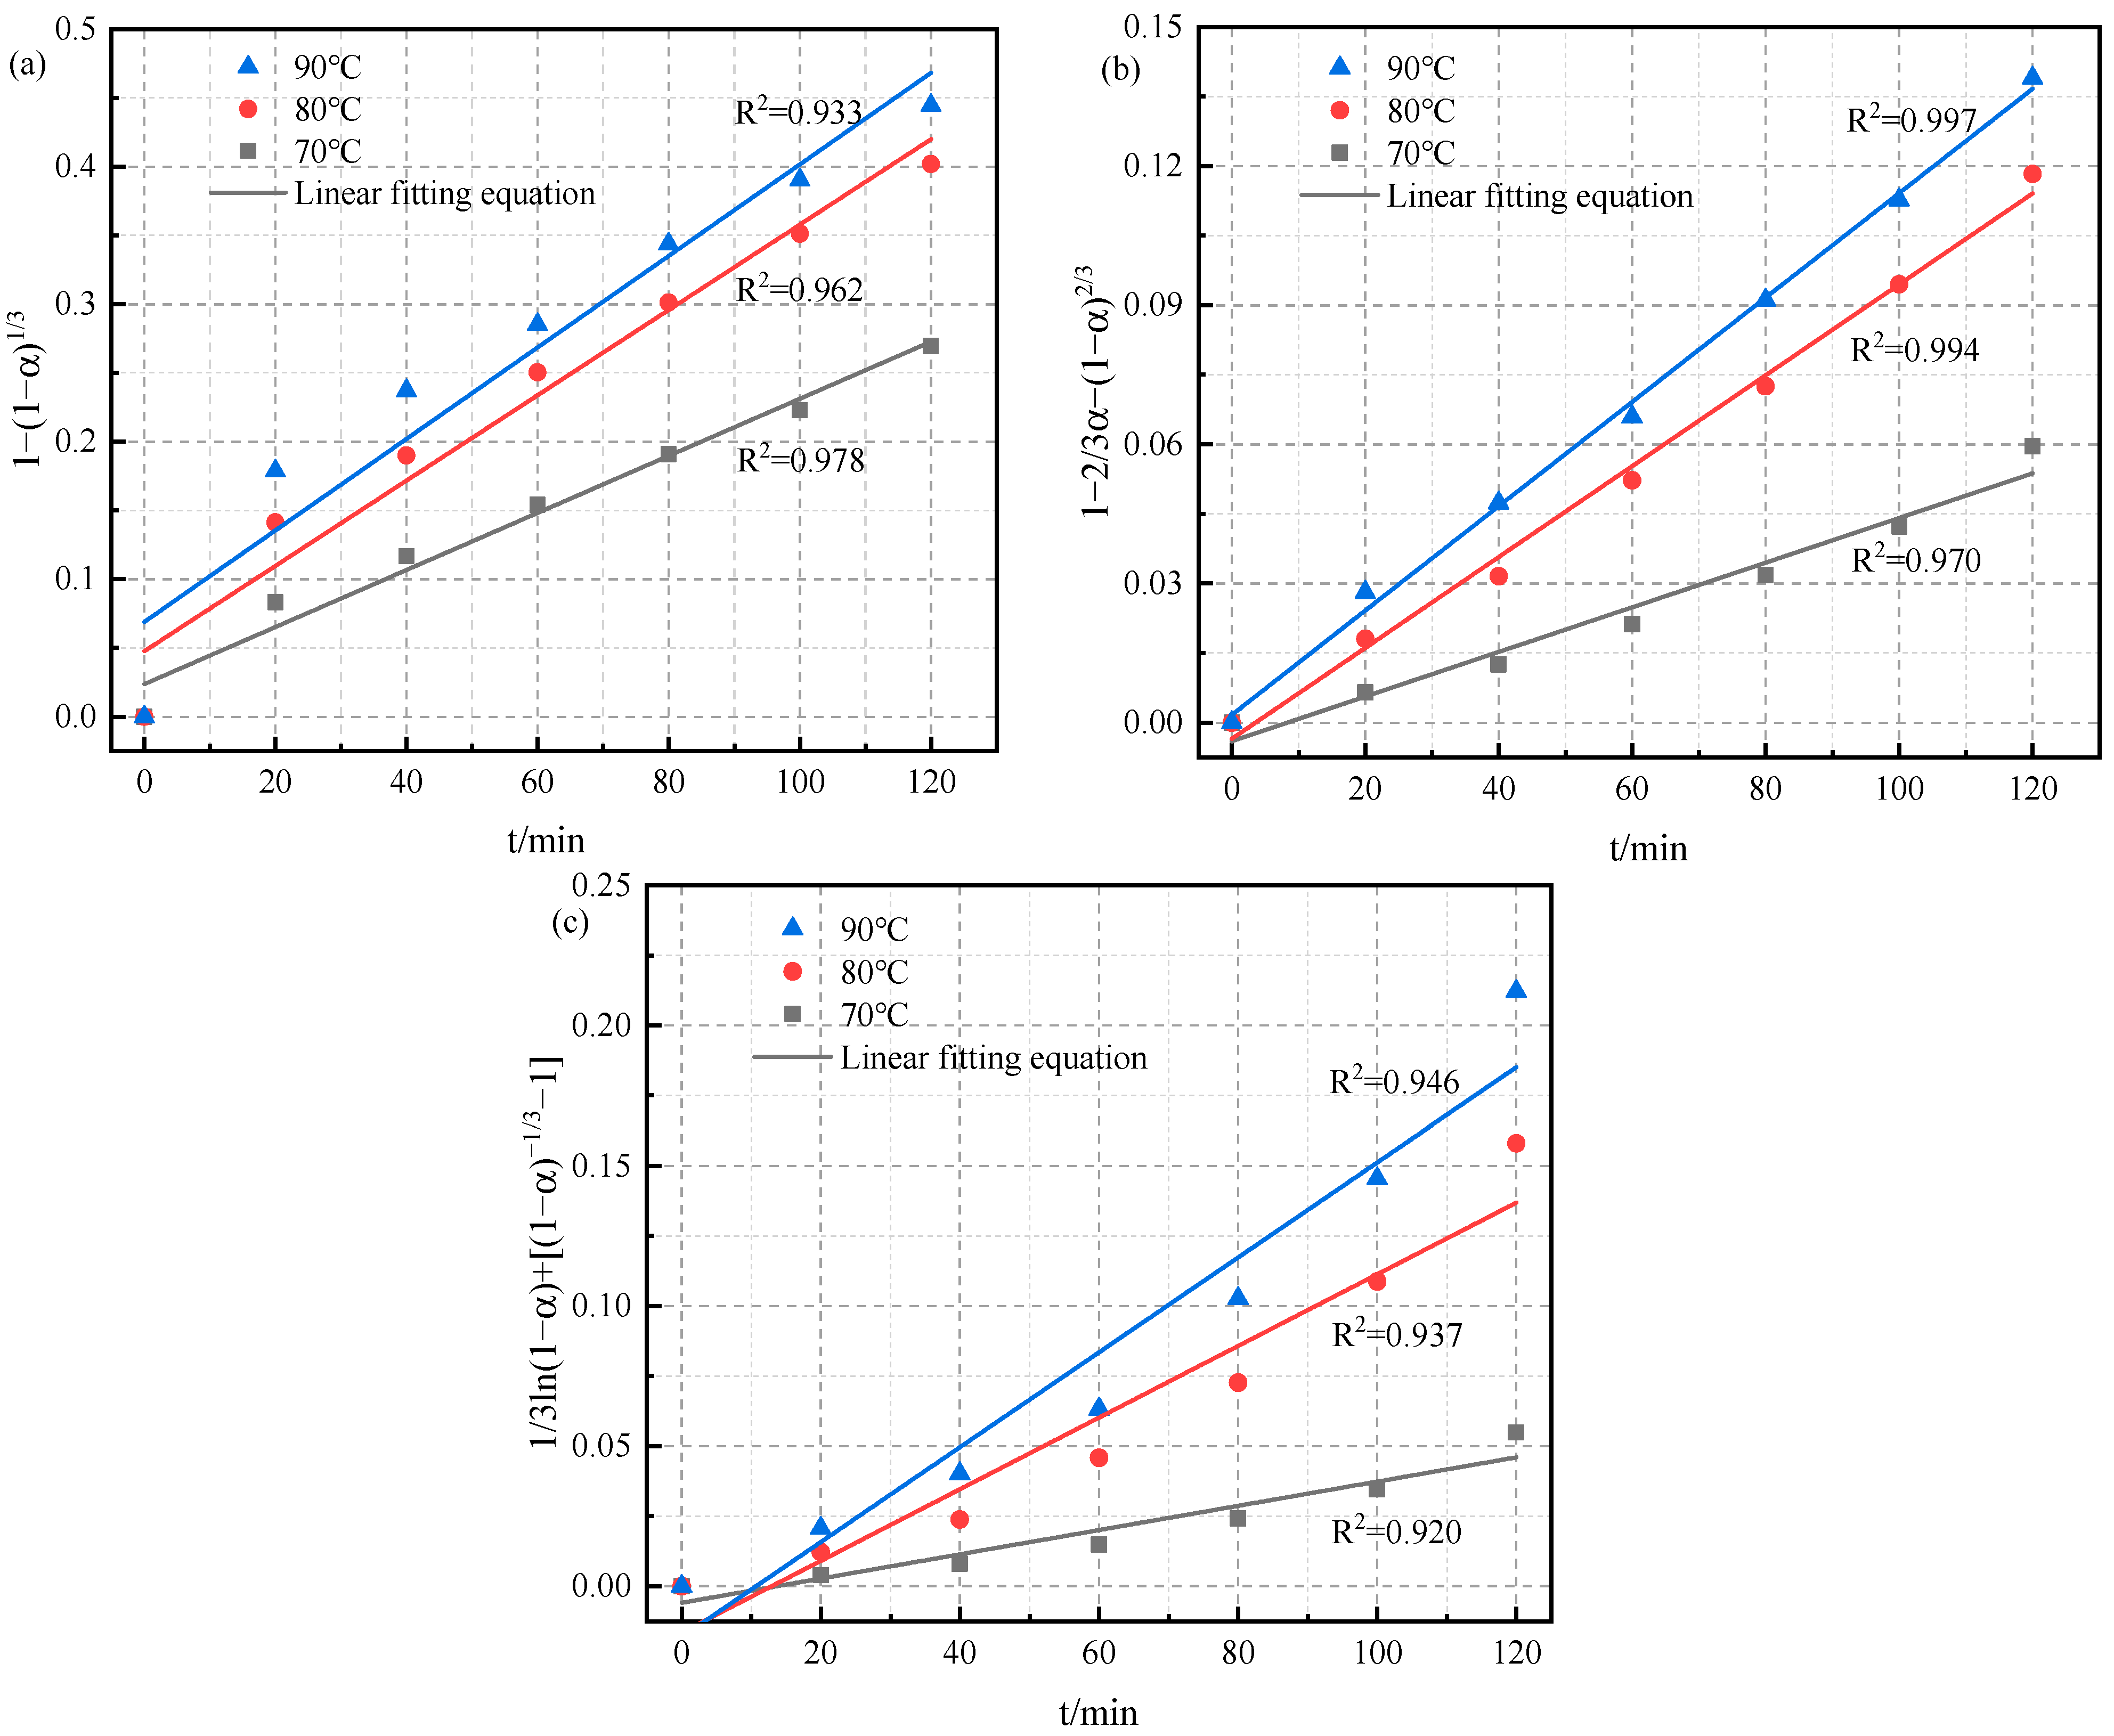
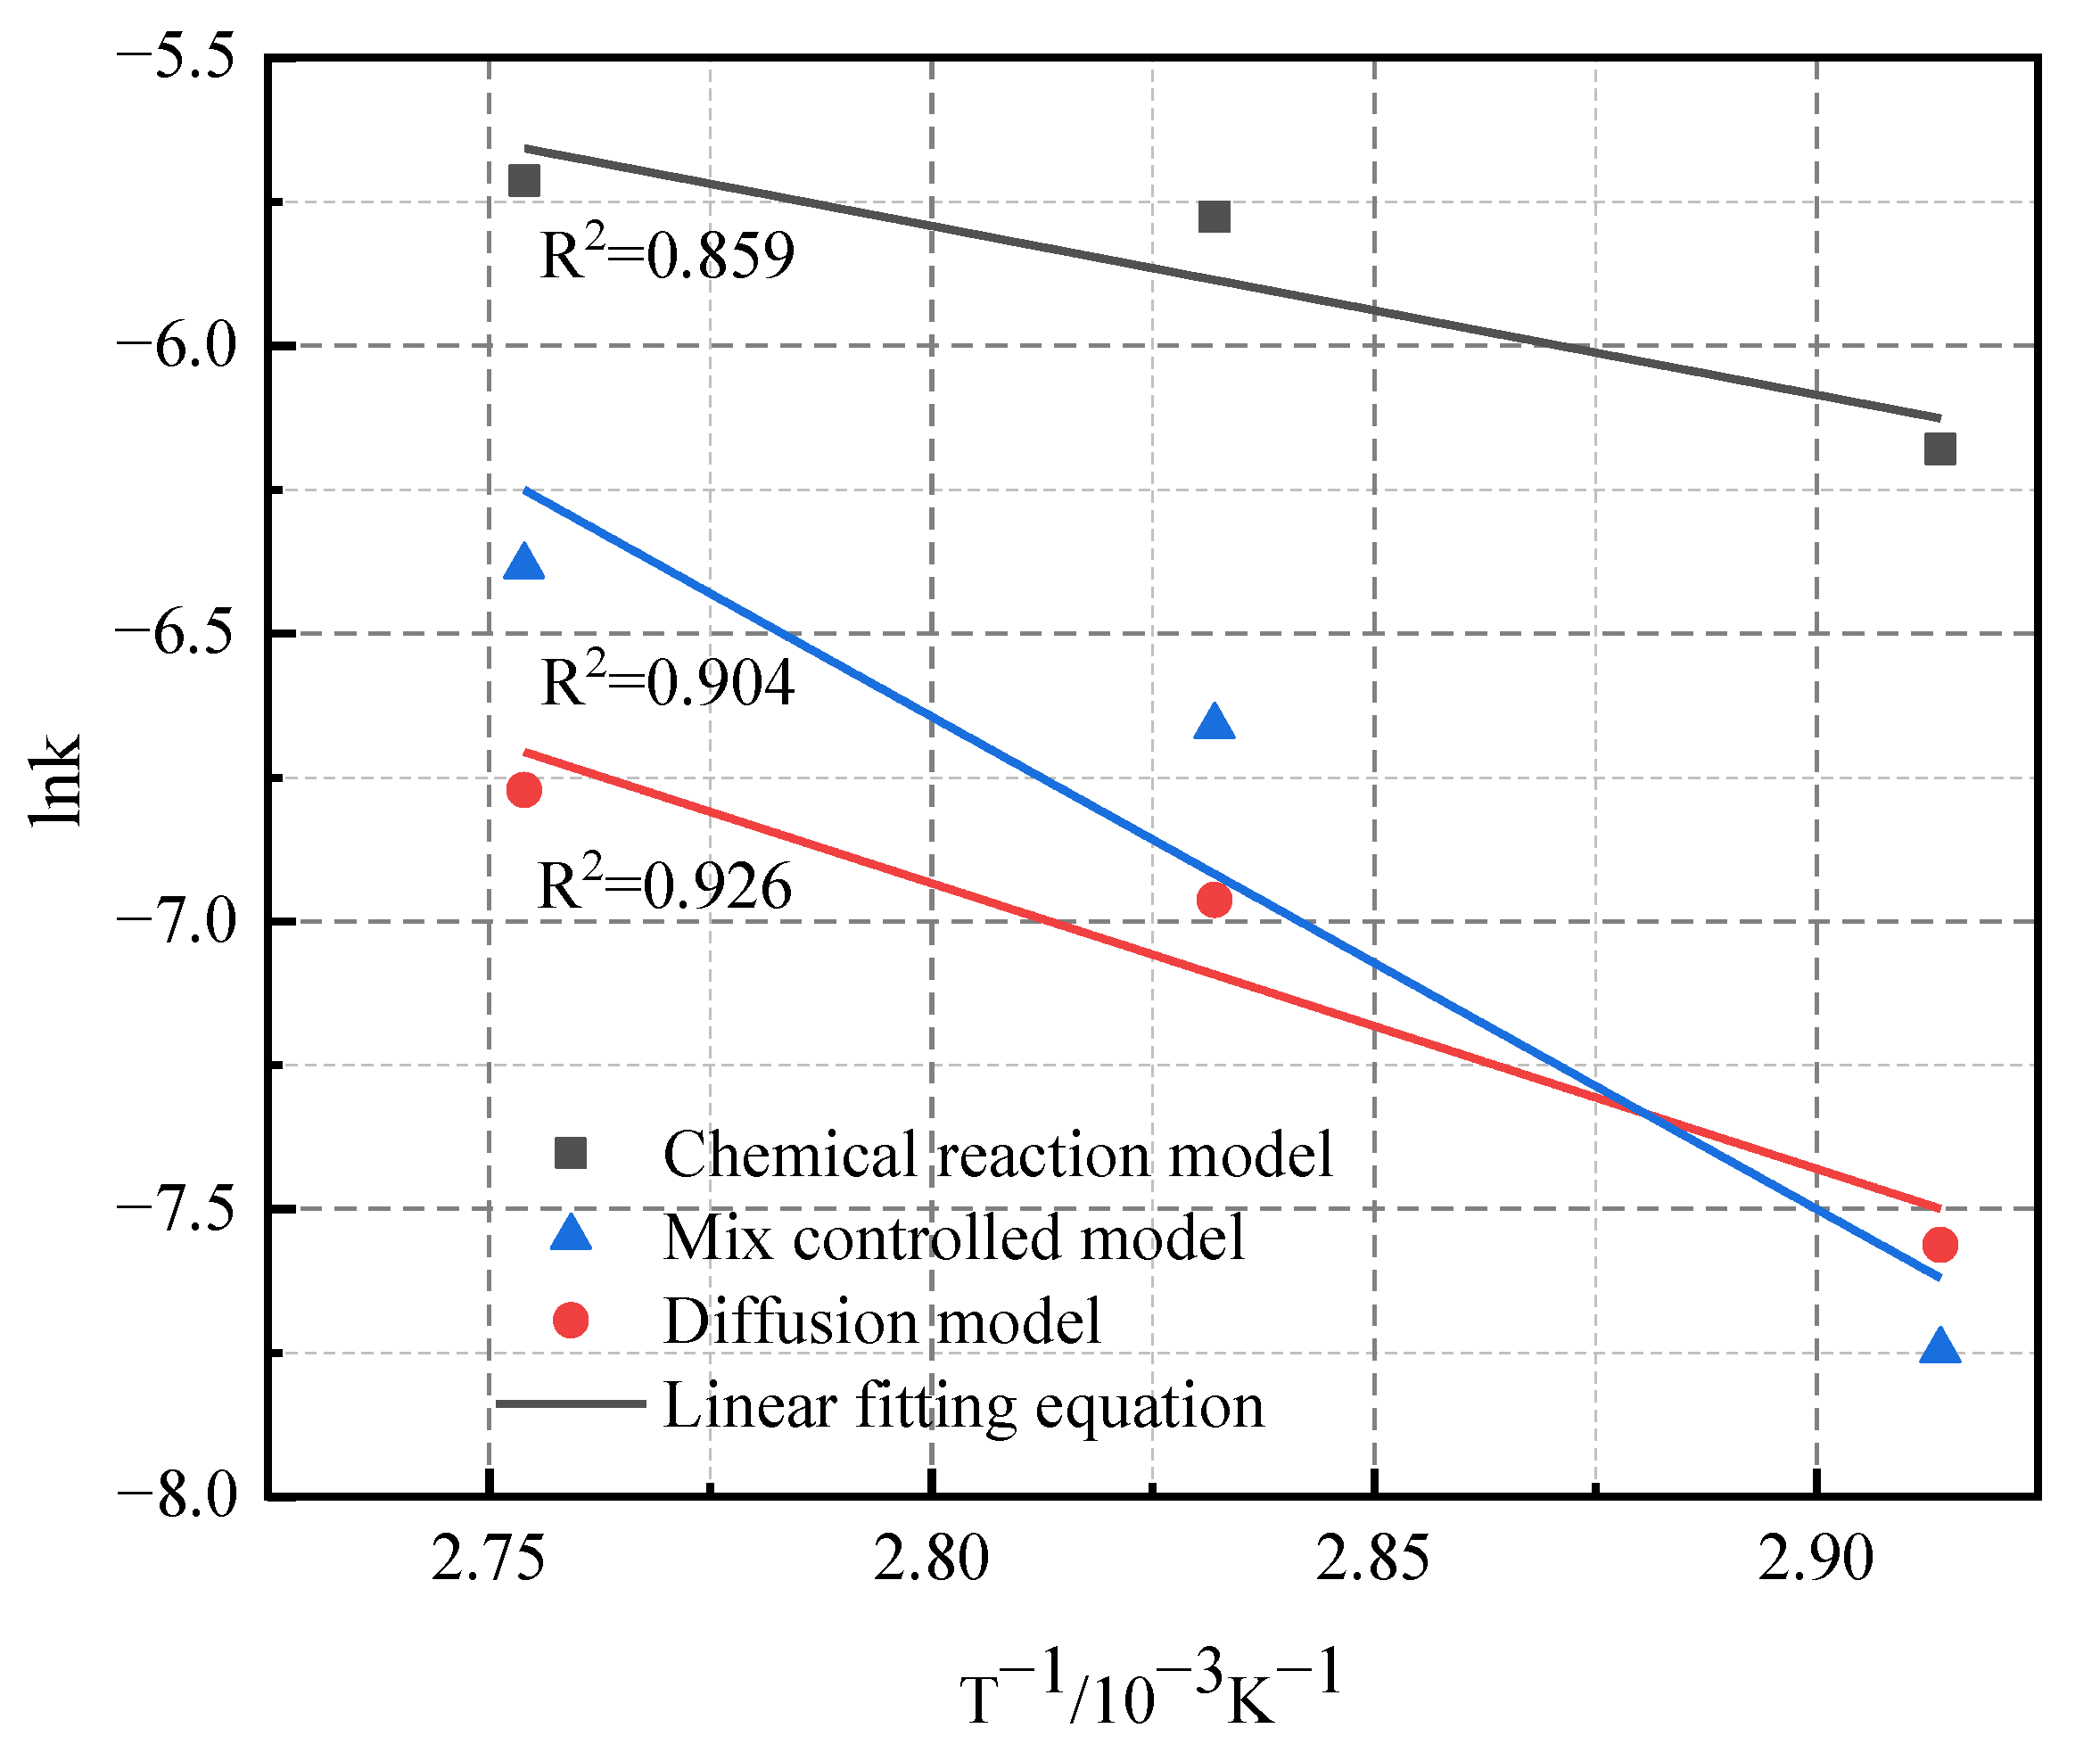
The SEM images before and after leaching under the optimal conditions are shown in Figure 4. It can be seen that the clay always maintained a layered structure after the calcination and leaching process, but the surface of the mineral became more blurred, which indicated that the structure of the clay was maintained, except for some minimal surface dissolution. In the calcination process, kaolinite is transformed into structurally unstable metakaolinite under the action of dehydroxylation, resulting in the mineral surface becoming rough. During the leaching process, the Al on the surface of metakaolinite is dissolved by sulfuric acid, resulting in the destruction of the Al-O structure of the mineral, making the surface of the mineral more blurred.
Figure 5 shows XRD patterns of the raw lithium clay, the calcined lithium clay, and the leaching residues at different temperatures. The lithium clay calcined at different calcination temperatures produced different leaching rates. There was no new phase formed and the original phase disappeared during the leaching process, which indicated that the clay did not undergo phase change during the leaching process.

3.4. Kinetics Study

Kinetic analysis is a useful tool for understanding the reaction rate and mechanism of the leaching process [33]. Currently, for the kinetic analysis of the leaching process, the shrinking core model is primarily used [34]. The leaching process is generally considered to be controlled in the following steps: (1) by surface chemical reactions (Equation (1)); (2) by diffusion through the product layer (Equation (2)); (3) mixed control by surface reactions and product layer diffusion (Equation (3)) [35]. And, the activation energy of extracting lithium from roasted ore by sulfuric acid is calculated using the Arrhenius equation (Equation (4)). The α is the leaching efficiency of Li, which was shown in Figure 6.
1 1 α 1 3 = K c t
1 2 3 α 1 α 2 3 = K d t
1 3 ln 1 α   +   [ 1 α 1 3 1 ] = K m t
k = A exp ( E a / RT )
The leaching kinetics of Li were studied in the temperature range of 70~90 °C. As shown in Figure 7, the R2 values of the product layer diffusion model were 0.997, 0.994, and 0.970, respectively, being higher than those of the other two models. The R2 values of the surface chemistry model were 0.933, 0.962, and 0.978, respectively; the R2 values of the mixed-control model were 0.946, 0.93,7 and 0.920, respectively. It can be seen from the fitting results and the R2 values that the diffusion model accurately fit the leaching process of Li, indicating that the leaching rate of Li is mainly controlled by the diffusion reaction.
The above three models were studied. As shown in Figure 8, the accuracy of the model can be easily judged using the average R2 values. From Table 2, the R2 of the product layer diffusion model was 0.957, which was higher than that of the other two models. The R2 of the surface chemical model was 0.908, and the R2 of the mixed-control model is 0.919, so the diffusion model could more accurately fit the leaching process of Li, and the activation energy was 41.3 kJ/mol. This further indicates that Li+ is extracted by ion exchange. In the leaching process, the Al on the surface of metakaolinite is dissolved by H2SO4, resulting in the destruction of the Al-O structure, in which Li+ is exchanged by H+ to the surface of the mineral and enters the solution under the action of diffusion.

4. Conclusions

(1)
The main minerals in the sampled clay were kaolinite, boehmite, and goethite, while there was no independent lithium mineral. The lithium content in the clay was 1867 μg/g, which was found to exist in the form of ions in the kaolinite structure.
(2)
In the calcination process, the dehydroxylation of kaolinite produced an unstable metakaolinite. In the leaching process, the Al on the mineral surface was dissolved by H2SO4, resulting in the destruction of the Al-O structure of the mineral. The Li+ in the mineral was exchanged by H+ and entered the solution under the action of diffusion.
(3)
The results of t leaching test showed that the calcination temperature had the greatest influence on the leaching of Li. After calcination at 600 °C for 1 h, then using 15.0% sulfuric acid at 80 °C for 2 h, the optimal leaching rate of lithium was 81.1%. The main ions in the leaching solution were Al3+ (12,696 mg/L), Fe2+ (3983 mg/L), and Li+ (336 mg/L).
(4)
The results of leaching kinetics analysis showed that the leaching of lithium was controlled by a diffusion model, with a special model ion exchange. The activation energy (Ea) of the process was 41.3 kJ/mol.

Author Contributions

L.Y. and F.R.: data curation, review and editing, and supervision; W.Z.: investigation, formal analysis, and writing—original draft; L.T. and H.F.: validation, data curation, and resources. All authors have read and agreed to the published version of the manuscript.

Funding

This study was financially supported by the National Natural Science Foundation of China (No. 51974093), Qishan Scholars Research Launch Project (No. XRC-22023), Major Science and Technology Project of Yunnan Province (No. 202302AF08004), and Natural Science Foundation of Fujian Province (No. 2023J05111).

Data Availability Statement

Due to the nature of this research, participants of this study did not agree for their data to be shared publicly, so supporting data is not available.

Conflicts of Interest

The authors declare that they have no known competing financial interest or personal relationship that could have appeared to influence the work reported in this paper.

References

  1. Rosales, G.; Resentera, A.; Gonzalez, J.; Wuilloud, R.; Rodriguez, M. Efficient extraction of lithium from spodumene by direct roasting with NaF and leaching. Chem. Eng. Res. Des. 2019, 150, 320–326. [Google Scholar] [CrossRef]
  2. Benson, T.; Coble, M.; Rytuba, J.; Mahood, G. Lithium enrichment in intracontinental rhyolite magmas leads to Li deposits in caldera basins. Nat. Commun. 2017, 8, 270. [Google Scholar] [CrossRef] [PubMed]
  3. Wang, H.; Zhong, Y.; Du, B.; Zhao, Y.; Wang, M. Recovery of both magnesium and lithium from high Mg/Li ratio brines using a novel process. Hydrometallurgy 2018, 175, 102–108. [Google Scholar] [CrossRef]
  4. Zhao, Y.; Wen, H.; Luo, C.; Xu, L. Geochemical characteristics and indicative significance of clay lithium carbonate deposits in Yunnan-Guizhou area. Earth-Sci. Rev. 2019, 189, 159–176. [Google Scholar] [CrossRef]
  5. Zhang, J.; Wang, Q.; Liu, X.; Zhou, G.; Xu, H.; Zhu, Y. Provenance and oreforming process of Permian lithium rich bauxite in central Yunnan, SW China. Ore Geol. Rev. 2022, 145, 104862. [Google Scholar] [CrossRef]
  6. Yang, J.; Luo, C.; Du, S.; Yu, W.; Yang, Y.; Wen, H. Discussion on the applicability of paleo environmental indexes of sedimentary rocks with high clay content. Acta Mineral. Sin. 2020, 40, 723–733. [Google Scholar] [CrossRef]
  7. Vigier, N.; Decarreau, A.; Millot, R.; Carignan, J.; Petit, S.; France, C. Quantifying Li isotope fractionation during smectite formation and implications for the Li cycle. Geochim. Cosmochim. Acta. 2008, 72, 780–792. [Google Scholar] [CrossRef]
  8. He, M.; Fang, Z.; Zhang, P. Atomic and electronic structures of montmorillonite in soft rock. Chin. Phys. B 2009, 18, 2933. [Google Scholar] [CrossRef]
  9. Shaifei, L.; Adhikari, P.; Ching, W. DFT Study of Electronic Structure and Optical Properties of Kaolinite, Muscovite, and Montmorillonite. Crystals 2021, 11, 618. [Google Scholar] [CrossRef]
  10. Wen, H.; Luo, C.; Du, S.; Yu, W.; Gu, H.; Ling, K.; Cui, Y.; Li, Y.; Yang, J. Discovery and significance of carbonate clay lithium resources. Sci. Bull. 2020, 65, 53–59. [Google Scholar] [CrossRef]
  11. Sun, Z.; Chen, H.; Caldwell, T.B.; Thurston, A.M. Selective Extraction of Lithium from Clay Minerals. U.S. Patent 17/136,701, 29 December 2020. [Google Scholar]
  12. Zhu, L.; Gu, H.; Wen, H.; Yang, Y. Lithium extraction from clay-type lithium resource using ferric sulfate solutions via an ion-exchange leaching process. Hydrometallurgy 2021, 206, 105759. [Google Scholar] [CrossRef]
  13. Zhang, Y.; Zhang, J.; Wu, L.; Tan, L.; Xie, F.; Cheng, J. Extraction of lithium and aluminium from bauxite mine tailings by mixed acid treatment without roasting. J. Hazard. Mater. 2021, 404, 124044. [Google Scholar] [CrossRef] [PubMed]
  14. Gu, H.; Guo, T.; Wen, H.; Luo, C.; Cui, Y.; Du, S.; Wang, N. Leaching efficiency of sulfuric acid on selective lithium leach ability from lithium clay. Miner. Eng. 2020, 145, 106076. [Google Scholar] [CrossRef]
  15. Cui, Y.; Luo, C.; Xu, L.; Zhang, H.; Deng, M.; Gu, H.; Meng, Y.; Qin, C.; Wen, H. Weathering origin and enrichment of lithium in clay rocks of the Jiujialu Formation, central Guizhou Province, Southwest China, Bulletin of Mineralogy. Earth-Sci. Rev. 2018, 37, 696–704. [Google Scholar] [CrossRef]
  16. Zhang, Y.; Sun, Q.; Geng, J. Microstructural characterization of limestone exposed to heat with XRD, SEM and TG-DSC. Mater. Charact. 2017, 134, 285–295. [Google Scholar] [CrossRef]
  17. Wan, Q.; Rao, F.; Song, S. Reexamining calcination of kaolinite for the synthesis of metakaolin geopolymers roles of dehydroxylation and recrystallization. Non-Cryst. Solids 2017, 460, 74–80. [Google Scholar] [CrossRef]
  18. Chen, J.; Yan, C.; Tu, J. The structure and property of Suzhou kaolin at different temperature. Non-Met. Mines 2019, 32, 21–24. [Google Scholar] [CrossRef]
  19. Heller, K.L. Thermally modifified clay minerals. In Handbook of Clay Science, 2nd ed.; Bergaya, F., Lagaly, G., Eds.; Elsevier: Amsterdam, The Netherlands, 2013. [Google Scholar]
  20. Kassa, A.; Shibeshi, N.; Tizazu, B. Kinetic analysis of dehydroxylation of Ethiopian kaolinite during calcination. J. Therm. Anal. Calorim. 2022, 147, 12837–12853. [Google Scholar] [CrossRef]
  21. Lin, Z.; Natoli, J.; Picuri, J.; Shaw, S.; Bowyer, W. Replication of the conversion of goethite to hematite to make pigments in both furnace and campfire. J. Archaeol. Sci. 2021, 39, 103314. [Google Scholar] [CrossRef]
  22. Huestis, P.; Graham, T.; Mergelsberg, S.; LaVerne, J. Identification of radiolytically-active thermal transition phases in boehmite. Thermochim. Acta 2020, 689, 178611. [Google Scholar] [CrossRef]
  23. Drits, V.; Derkowski, A.; Sakharov, B.; Zviagina, B. Experimental evidence of the formation of intermediate phases during transition of kaolinite into metakaolinite. Am. Miner. 2016, 101, 2331–2346. [Google Scholar] [CrossRef]
  24. Hu, Q.; Yong, Q.; He, L.; Gu, Y.; Zeng, J. Structural evolution of kaolinite in muddy intercalation under microwave heating Materials Research Express. Therm. Anal. Calorim. 2021, 8, 105503. [Google Scholar] [CrossRef]
  25. Wang, N.; Gu, H.; Wen, H.; Liu, S. Enrichment of niobium and titanium from kaolin using an acid-alkali leaching process. Metall. Mater. Trans. B 2018, 49, 3552–3558. [Google Scholar] [CrossRef]
  26. MacDonald, B.; Fox, W.; Dubreuilc, L.; Beddardc, J.; Pidruczny, A. Iron oxide geochemistry in the Great Lakes Region (North America): Implications for ochre provenance studies. J. Archaeol. Sci. 2018, 19, 476–490. [Google Scholar] [CrossRef]
  27. Stevenson, C.; Gurnick, M. Structural collapse in kaolinite, montmorillonite and illite clay and its role in the ceramic rehydroxylation dating of low fired earthenware. J. Archaeol. Sci. 2016, 69, 54–63. [Google Scholar] [CrossRef]
  28. Li, H.; Kuang, G.; Hu, S.; Guo, H.; Jin, R.; Vekariya, R. Removal of aluminum from leaching solution of lepidolite by adding ammonium. JOM 2016, 68, 2653–2658. [Google Scholar] [CrossRef]
  29. Lin, G.; Li, J.; Zeng, B.; Wang, W.; Li, C.; Zhang, L. Leaching of rubidium from biotite ore by chlorination roasting and ultrasonic enhancement. Arab. J. Chem. 2022, 15, 104275. [Google Scholar] [CrossRef]
  30. Nada, A.; Imam, N.; Aassy, I.; Ghanem, A. Effect of different concentrations of sulfuric acid on leaching of radionuclide isotopes in sedimentary rock samples. J. Radioanal. Nucl. Chem. 2019, 322, 347–359. [Google Scholar] [CrossRef]
  31. Hui, X.; Zhang, J.; Liang, Y.; Chang, Y.; Zhang, W.; Zhang, G. Comparison and evaluation of vanadium extraction from the calcification roasted vanadium slag with carbonation leaching and sulfuric acid leaching. Sep. Purif. Technol. 2022, 297, 121466. [Google Scholar] [CrossRef]
  32. Lv, Z.; Pan, X.; Geng, X.; Yu, H. Synergistic removal of calcium and iron impurities from calcium-rich and high-alumina fly ash by acid leaching control. J. Environ. Chem. Eng. 2022, 10, 107268. [Google Scholar] [CrossRef]
  33. Dhawan, N.; Safarzadeh, M.S.; Birinci, M. Kinetics of hydrochloric acid leaching of smithsonite. Russ. J. Non-Ferr. Met. 2021, 52, 209–216. [Google Scholar] [CrossRef]
  34. Xiao, Y.; Liu, Y.; Yang, K.; Yang, Y.; Zhou, X.; Lu, C.; Xiao, J.; Liu, F.; Zhang, X. Recovery of rare earths from weathered crust elution-deposited rare earth ore without ammonia-nitrogen pollution: I. Leaching with magnesium sulfate. Hydrometallurgy 2015, 439, 58–60. [Google Scholar] [CrossRef]
  35. Bai, Y.; Wang, W.; Xie, F.; Lu, D.; Jiang, K. Effect of temperature, oxygen partial pressure and calcium lignosulphonate on chalcopyrite dissolution in sulfuric acid solution. Trans. Non-Ferr. Met. Soc. China 2022, 32, 1650–1663. [Google Scholar] [CrossRef]
Figure 1. Thermal analysis curves of the lithium clay.
Minerals 14 00359 g001
Figure 2. XRD of lithium clay and its calcining products at different temperatures.
Minerals 14 00359 g002
Figure 3. Effects of different factors on the leaching efficiency of Li, Al, and Fe from lithium clay: (a) calcination temperature, (b) calcination time, (c) acid concentration, (d) leaching temperature, and (e) leaching time.
Minerals 14 00359 g003
Figure 4. SEM images of (a) raw lithium clay, (b) lithium clay calcined at 600 °C, and (c) the leaching residue after the acid leaching process.
Minerals 14 00359 g004
Figure 5. XRD patterns of the raw lithium clay; lithium clay calcined at 400 °C, 600 °C, and 800 °C; as well as the leaching residues after the acid leaching process.
Minerals 14 00359 g005
Figure 6. Effect of the leaching time on the leaching efficiency of Li from lithium clay at different leaching temperatures. Calcined at 600 °C for 90 min at under leaching conditions of 15.0% H2SO4 with a liquid–solid ratio of 5:1 mL/g.
Minerals 14 00359 g006
Figure 7. Fitting of Li leaching at 70–90 °C using (a) chemical reaction model, (b) diffusion model, and (c) mixed-control model.
Minerals 14 00359 g007
Figure 8. Arrhenius plot of Li leaching kinetics.
Minerals 14 00359 g008
Table 1. Chemical compositions of the lithium clay.
ComponentAl2O3SiO2TFeLi2OMgOCaO
wt%41.0236.993.010.400.220.074
Table 2. The numerical values of Li leaching kinetics.
Leaching ProcessLinear Fitting EquationAverage R2Ea
Chemical reaction modely = −2.932x + 2.4170.90824.4 kJ/mol
Mix controlled modely = −8.555x + 17.3110.91971.1 kJ/mol
Diffusion modely = −4.961x + 6.9550.95741.3 kJ/mol
Disclaimer/Publisher’s Note: The statements, opinions and data contained in all publications are solely those of the individual author(s) and contributor(s) and not of MDPI and/or the editor(s). MDPI and/or the editor(s) disclaim responsibility for any injury to people or property resulting from any ideas, methods, instructions or products referred to in the content.

