1. Introduction
Mineral crystal structures, defined by their unit cells and repeating arrangements of atoms [
1], are fundamental to understanding the origins and evolution of diversity in the mineral kingdom. The symmetry of a unit cell is characterized by the crystal system to which it belongs, and the symmetry operators present therein. The seven known crystal systems can be subdivided into crystallographic point groups defined by their specific symmetry operators. Applying the crystallographic restriction theorem to these groups yields the 32 classical crystallographic point groups. Combining these 32 point groups with one of the possible centering types of atoms within the unit cell given by 14 possible Bravais lattices yields 230 possible space groups [
2]. Different symmetry operators and the dimensions of a unit cell create different multiplicities, which are defined as the maximum number of times a single atom in a general position is multiplied by the symmetry operators within a single unit cell. Multiplicity, which is the basis of the Dolivo-Dobrovol’sky symmetry index, is a particularly useful and simple metric of mineral symmetry because it can be defined both for space groups and crystallographic point groups.
Starting with the pioneering work of Naumann [
3], who investigated the distribution of 546 mineral species within crystal systems, several researchers have considered the world of mineral symmetry from a statistical standpoint [
4,
5,
6,
7,
8,
9,
10]. Bermanec and colleagues [
11] investigated symmetry distributions among 5674 International Mineralogical Association (IMA)-approved minerals species as of October 2022 from
https://rruff.info/ima (accessed on 5 March 2024).
Early research [
12,
13] concluded that the distribution of minerals among crystal symmetry classes has remained constant despite the increasing number of newly discovered rare mineral species. This conclusion proved to be an error—a problem of insufficient sample size. Dolivo-Dobrovol’sky [
14] demonstrated the gradual lowering of mineral symmetry by showing that the crystal structures of minerals discovered between 1980 and 1984 had a higher percentage of monoclinic minerals and a lower percentage of cubic minerals than the complete dataset available at that time. Moreover, Yushkin et al. [
15] discussed the problem of the “weight” of a single mineral within the dataset. Each mineral was counted only once, despite the relative rarity of some species—an approach that equalized the effects of abundant rock-forming minerals with those occurring only at a single locality.
Urusov [
16] explained the gradual drop of symmetry throughout Earth’s history as a consequence of an increase in the number of rare (presumably on average of lower symmetry) species of minerals. While this “dissymmetrization” trend is present, and further confirmed by Gavryliv et al. [
17], it does not explain the root cause for the symmetry decrease. These ideas were further expanded by Urusov [
18] with examples of reactions where products have a lower symmetry than the reactant minerals. Krivovichev and colleagues [
19,
20,
21] demonstrated that the chemical and structural complexity of minerals increases through several progressive stages of mineral evolution, giving further support to this theory.
An important question relates to why the number of rare mineral species—those documented at fewer than five localities (
https://mindat.org, accessed on 5 March 2024)—has appeared to increase over Earth’s history. In part, the reason may be a preservational bias, as more ancient rocks have been preferentially lost by erosion [
22]. Furthermore, many rare minerals are scarce in part because they are exclusively found in ephemeral, near-surface phases [
23]. A counterclaim might be made that certain meteorites (e.g., the Allende carbonaceous chondrite) contain numerous rare and exotic phases [
24], suggesting an as-yet under-documented abundance of rare minerals from the earliest stages of mineral evolution. However, a more likely explanation is the remarkable application by Prof. Chi Ma of high-resolution electron microscopy (TEM) specifically to probe Allende and other meteorites for nano-scale exotic minerals. A similar focus employing TEM on more recent terrestrial lithologies might reveal a corresponding abundance of previously undocumented nano-minerals. We suggest that on Earth, increased fluid–rock interactions, especially in association with plate tectonics, atmospheric oxidation, and the rise of the terrestrial biosphere, resulted in the selection and concentration of rare element suites in local environments that, in turn, led to thousands of new rare mineral species.
As evidence for a change in symmetry statistics over time has grown, the reasons for these changes have become topics of more intensive study and discussion. In the last decade, most mineral symmetry research has been focused on information theory approaches used to quantify the structural (and chemical) complexity of mineral species [
21,
25,
26,
27,
28]. Shannon-based and Kolmogorov-based (i.e., algorithmic) information models were proposed by Krivovichev and colleagues [
20,
26,
27,
28,
29] to define the least amount of data needed to describe the crystal structure of a given mineral, hence quantifying the structural complexity of that mineral.
Bermanec et al. [
29,
30] revised symmetry index calculations from Yushkin et al. [
15], Dolivo-Dobrovol’sky [
14], and Urusov [
16] and applied calculations to characterize the decrease in average symmetry indices throughout the stages of mineral evolution described by Hazen and colleagues [
31,
32]. Because the Dolivo-Dobrovol’sky approach was based on the multiplicity of a holohedral point group of a crystal system, it could also be easily adapted and used for other point groups and space groups. Therefore, we here expand applications of this approach to several co-evolving mineral attributes, including rarity, hydrogen content, and other averaged attributes of paragenetic modes [
33]. In the effort to develop a more accurate metric of symmetry through time, in this paper, we did not only use the maximum multiplicities of holohedral classes of each crystal system but rather the maximum multiplicities of all 32 point groups. This approach resulted in a formula similar to the one given by Bermanec et al. [
30]:
where
I is the symmetry index of a dataset,
ni is the number of minerals that crystallize in a certain point group, and
si is the maximum multiplicity of that point group.
2. Symmetry Statistics in Different Environments and Times
The formation of new mineral species depends on both the local chemical composition of the system and its pressure–temperature (
PT) conditions. These distinct environments and formation conditions inevitably result in the formation of diverse minerals. Examining the variations in mineral properties across different environments can enhance our understanding of the significance of paragenetic modes in mineral formation. Hazen and Morrison [
34] define a mineral paragenetic mode as “a natural process by which a collection of atoms in solid and/or fluid form is reconfigured into one or more new solid forms”. This definition encompasses a broad range of 57 environments and processes in which new minerals can form. All 5679 mineral species that had been approved by the IMA-CNMNC at the time of that compilation (October 2021) were assigned to one or more paragenetic modes. Note that only minerals recovered from Earth’s upper 3 km have been considered. However, these phases include numerous impact minerals found in meteorites (paragenetic mode 6), terrestrial impacts (paragenetic mode 30, and high-pressure and ultra-high-pressure metamorphism (paragenetic mode 39). Consequently, many high-pressure and high-temperature minerals thought to occur as major rock-forming minerals in Earth’s mantle, including ahrensite, bridgmanite, feiite, hemleyite, majorite, and ringwoodite, are represented in our analyses.
The co-evolution of minerals and the biosphere has contributed to Earth’s unparalleled mineral diversity among planetary bodies, with more than 6000 mineral species officially approved by the IMA (
https://rruff.info/ima; accessed on 5 March 2024). Consequently, data-driven approaches can be applied to mineral properties and their relation to paragenetic modes to advance our understanding of mineral evolution in planetary systems. For example, Hummer et al. [
35] used the Mineral Evolution Database (MED;
https://rruff.info/evolution (accessed on 5 March 2024)) to show a connection between the increase in the average oxidation state of manganese minerals and atmospheric oxygenation. This finding also showed the importance of supercontinent cycles in the episodicity of mineral formation and evolution [
36].
In complementary studies, Filatov [
37] investigated symmetry statistics of mineral species in diverse thermodynamic environments, specifically exploring variations in depth in Earth’s crust and mantle. His study revealed a positive correlation between the symmetry index and the temperature and depth of mineral formation, indicating that higher temperatures and deeper formation depths lead to increased average mineral symmetry. Additionally, Hong et al. [
38] demonstrated a significant correlation between melting temperature and the age of minerals, with the oldest known minerals exhibiting the highest melting temperatures. This finding points to the need for a broader investigation of the roles of paragenetic modes and the environments of mineral formation in symmetry statistics. Bermanec et al. [
39] used a mineral dataset to show a gradual drop in symmetry through stages of mineral evolution. In this contribution, we employ a mineral/paragenetic mode pair dataset with mineral properties averaged over all minerals in each of the 57 possible paragenetic modes.
The distinct behavior and impact of common minerals compared to rare ones have been discussed by Hazen and Ausubel [
23]. Interestingly, Gavrilyv et al. [
17] observed that as rarity increases, symmetry indices decrease while the complexity of minerals increases. Although the reciprocal relationship between symmetry indices and mineral complexity is well documented, it has not yet been quantified in the works of Krivovichev and colleagues [
21,
25,
26,
27,
28,
29].
3. Data Description and Results
The dataset and code used in this study are stored in the Symmetry Index Evolution database [
30]. To promote FAIR principles of data resources [
40], all code used for data visualization and sorting is publicly available on GitHub (NoaVidovic/pgm-symmetry-analysis (
github.com)). The dataset (
Supplementary Table S1) comprises a compilation of IMA-approved species, including mineral formulas, crystal systems, point groups, and mineral evolution stages [
31,
32]. The data are sourced from various repositories such as RRUFF [
41]; Mindat (
https://mindat.org; accessed on 5 March 2024) and its open data service [
42]; the Mineral Evolution Database [
43]; the American Mineralogist Crystal Structure Database [
44]; and peer-reviewed scientific publications. Additionally, for this research, our database has been expanded to include point group data for all minerals.
The calculation of symmetry indices in this study follows the Dolivo-Dobrovol’sky approach, utilizing the multiplicity of a point group as a symmetry metric [
30]. It is important to note that the mineral dataset may exhibit a bias towards rare minerals because each mineral is counted as a single input in the database, thereby giving more weight to less common minerals occurring in only one or two paragenetic modes. To address this bias and provide additional context on the importance of more abundant and widespread minerals, we created the mineral/paragenetic mode database.
In the mineral/paragenetic mode database, we segmented the data into 57 different paragenetic modes, with a bin for each paragenetic mode (the paragenetic node numbers from p1 to p57 correspond to those employed by Hazen and Morrison [
34]). Each mineral species was cast into one or more of the 57 bins, corresponding to all paragenetic modes in which it occurs. We then calculated the average symmetry index for each paragenetic mode, based on all the minerals that belong to that paragenetic mode. The numerical symmetry value for each mineral was assigned based on its point group. For minerals known to have multiple point groups, each point group was counted separately.
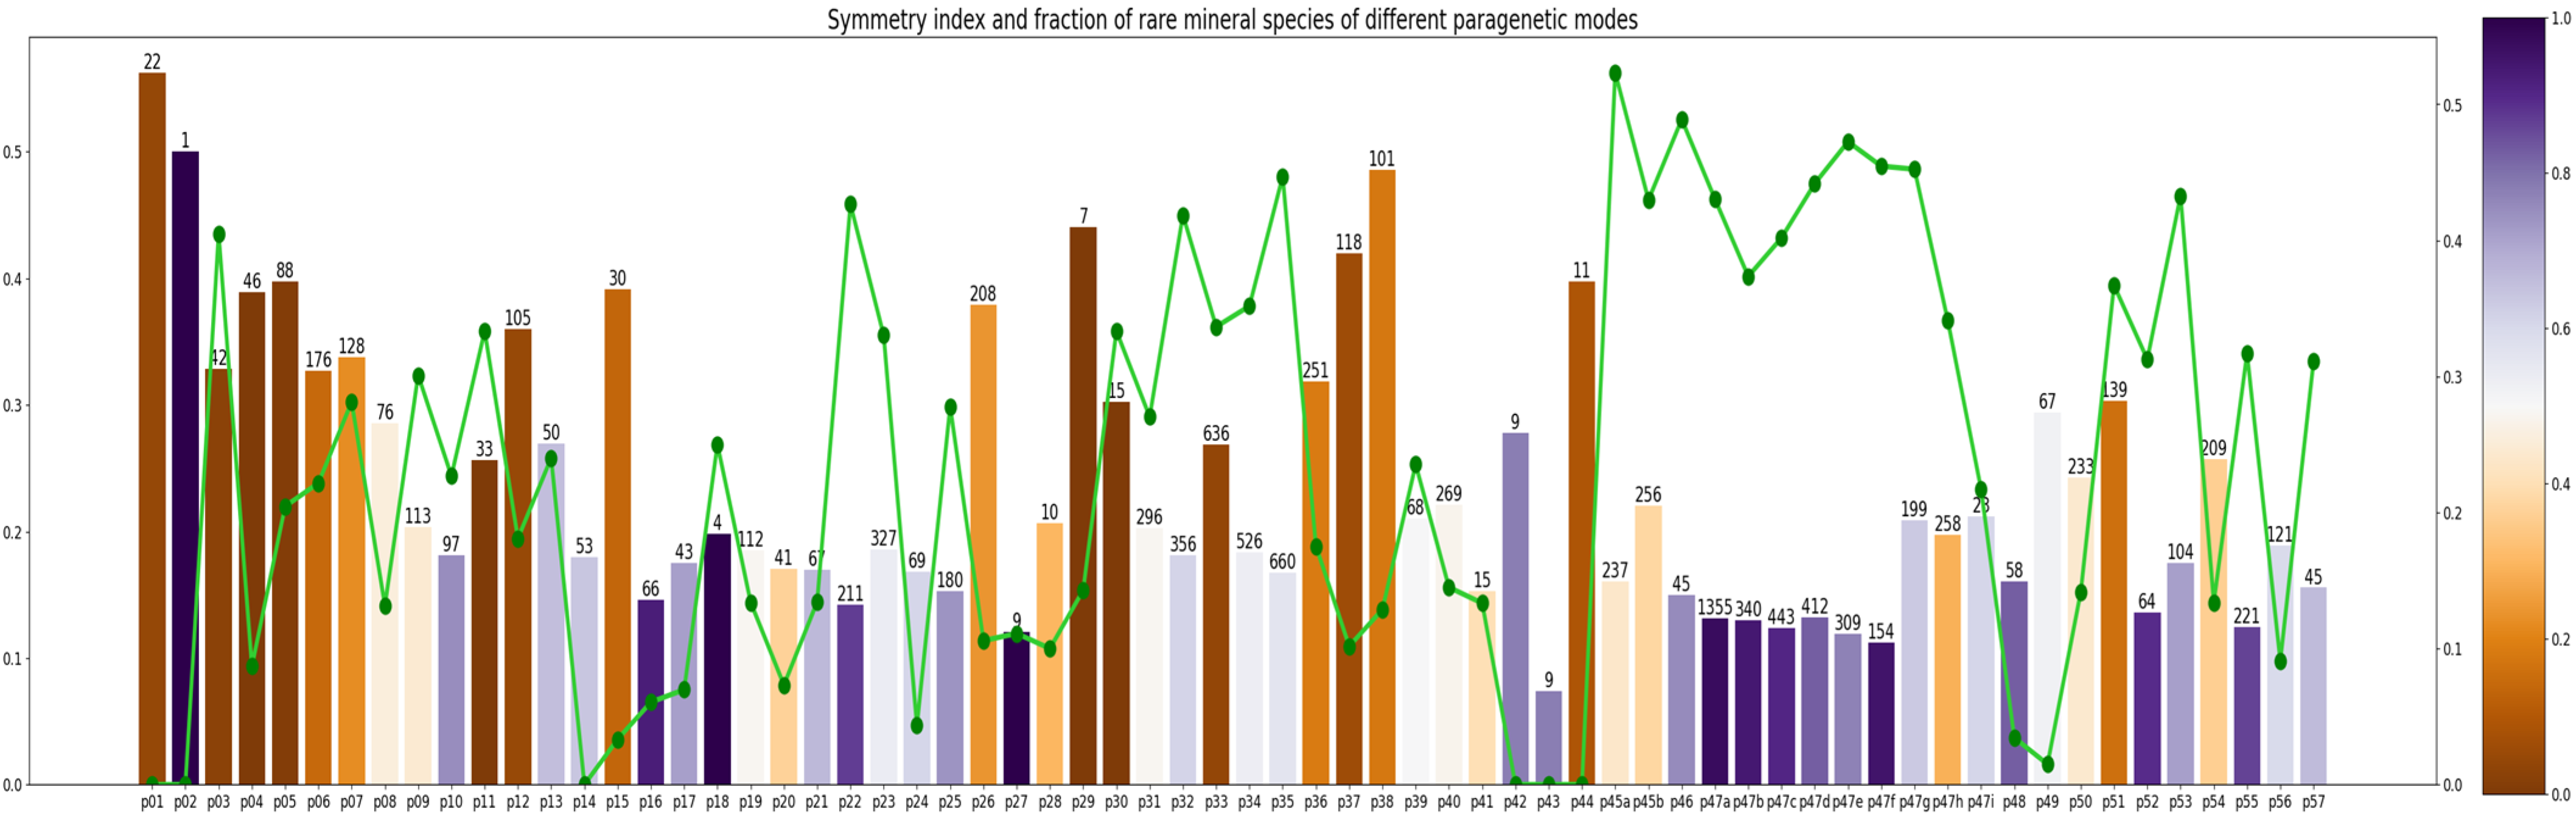
Data presented in
Figure 1 reveal a wide range of the average symmetry index from >0.55 for p1 (stellar atmosphere condensates) to <0.10 for p43 (minerals produced through shearing at fault zones). Five other modes with a symmetry index > 0.4 include p2 (interstellar condensates), p29 (lightning-generated minerals), p37 (layered igneous intrusions), p38 (ophiolites), and p44 (anoxic microbially mediated minerals). Five contrasting paragenetic modes have a symmetry index < 0.15, including p22 (hydration and low-temperature aqueous alteration), p27 (radioactive decay; auto-oxidation), p47 (low-temperature hydration and oxidative weathering), p52 (guano- and urine-derived minerals), and p55 (anthropogenic mine minerals, such as mine drainage precipitates).
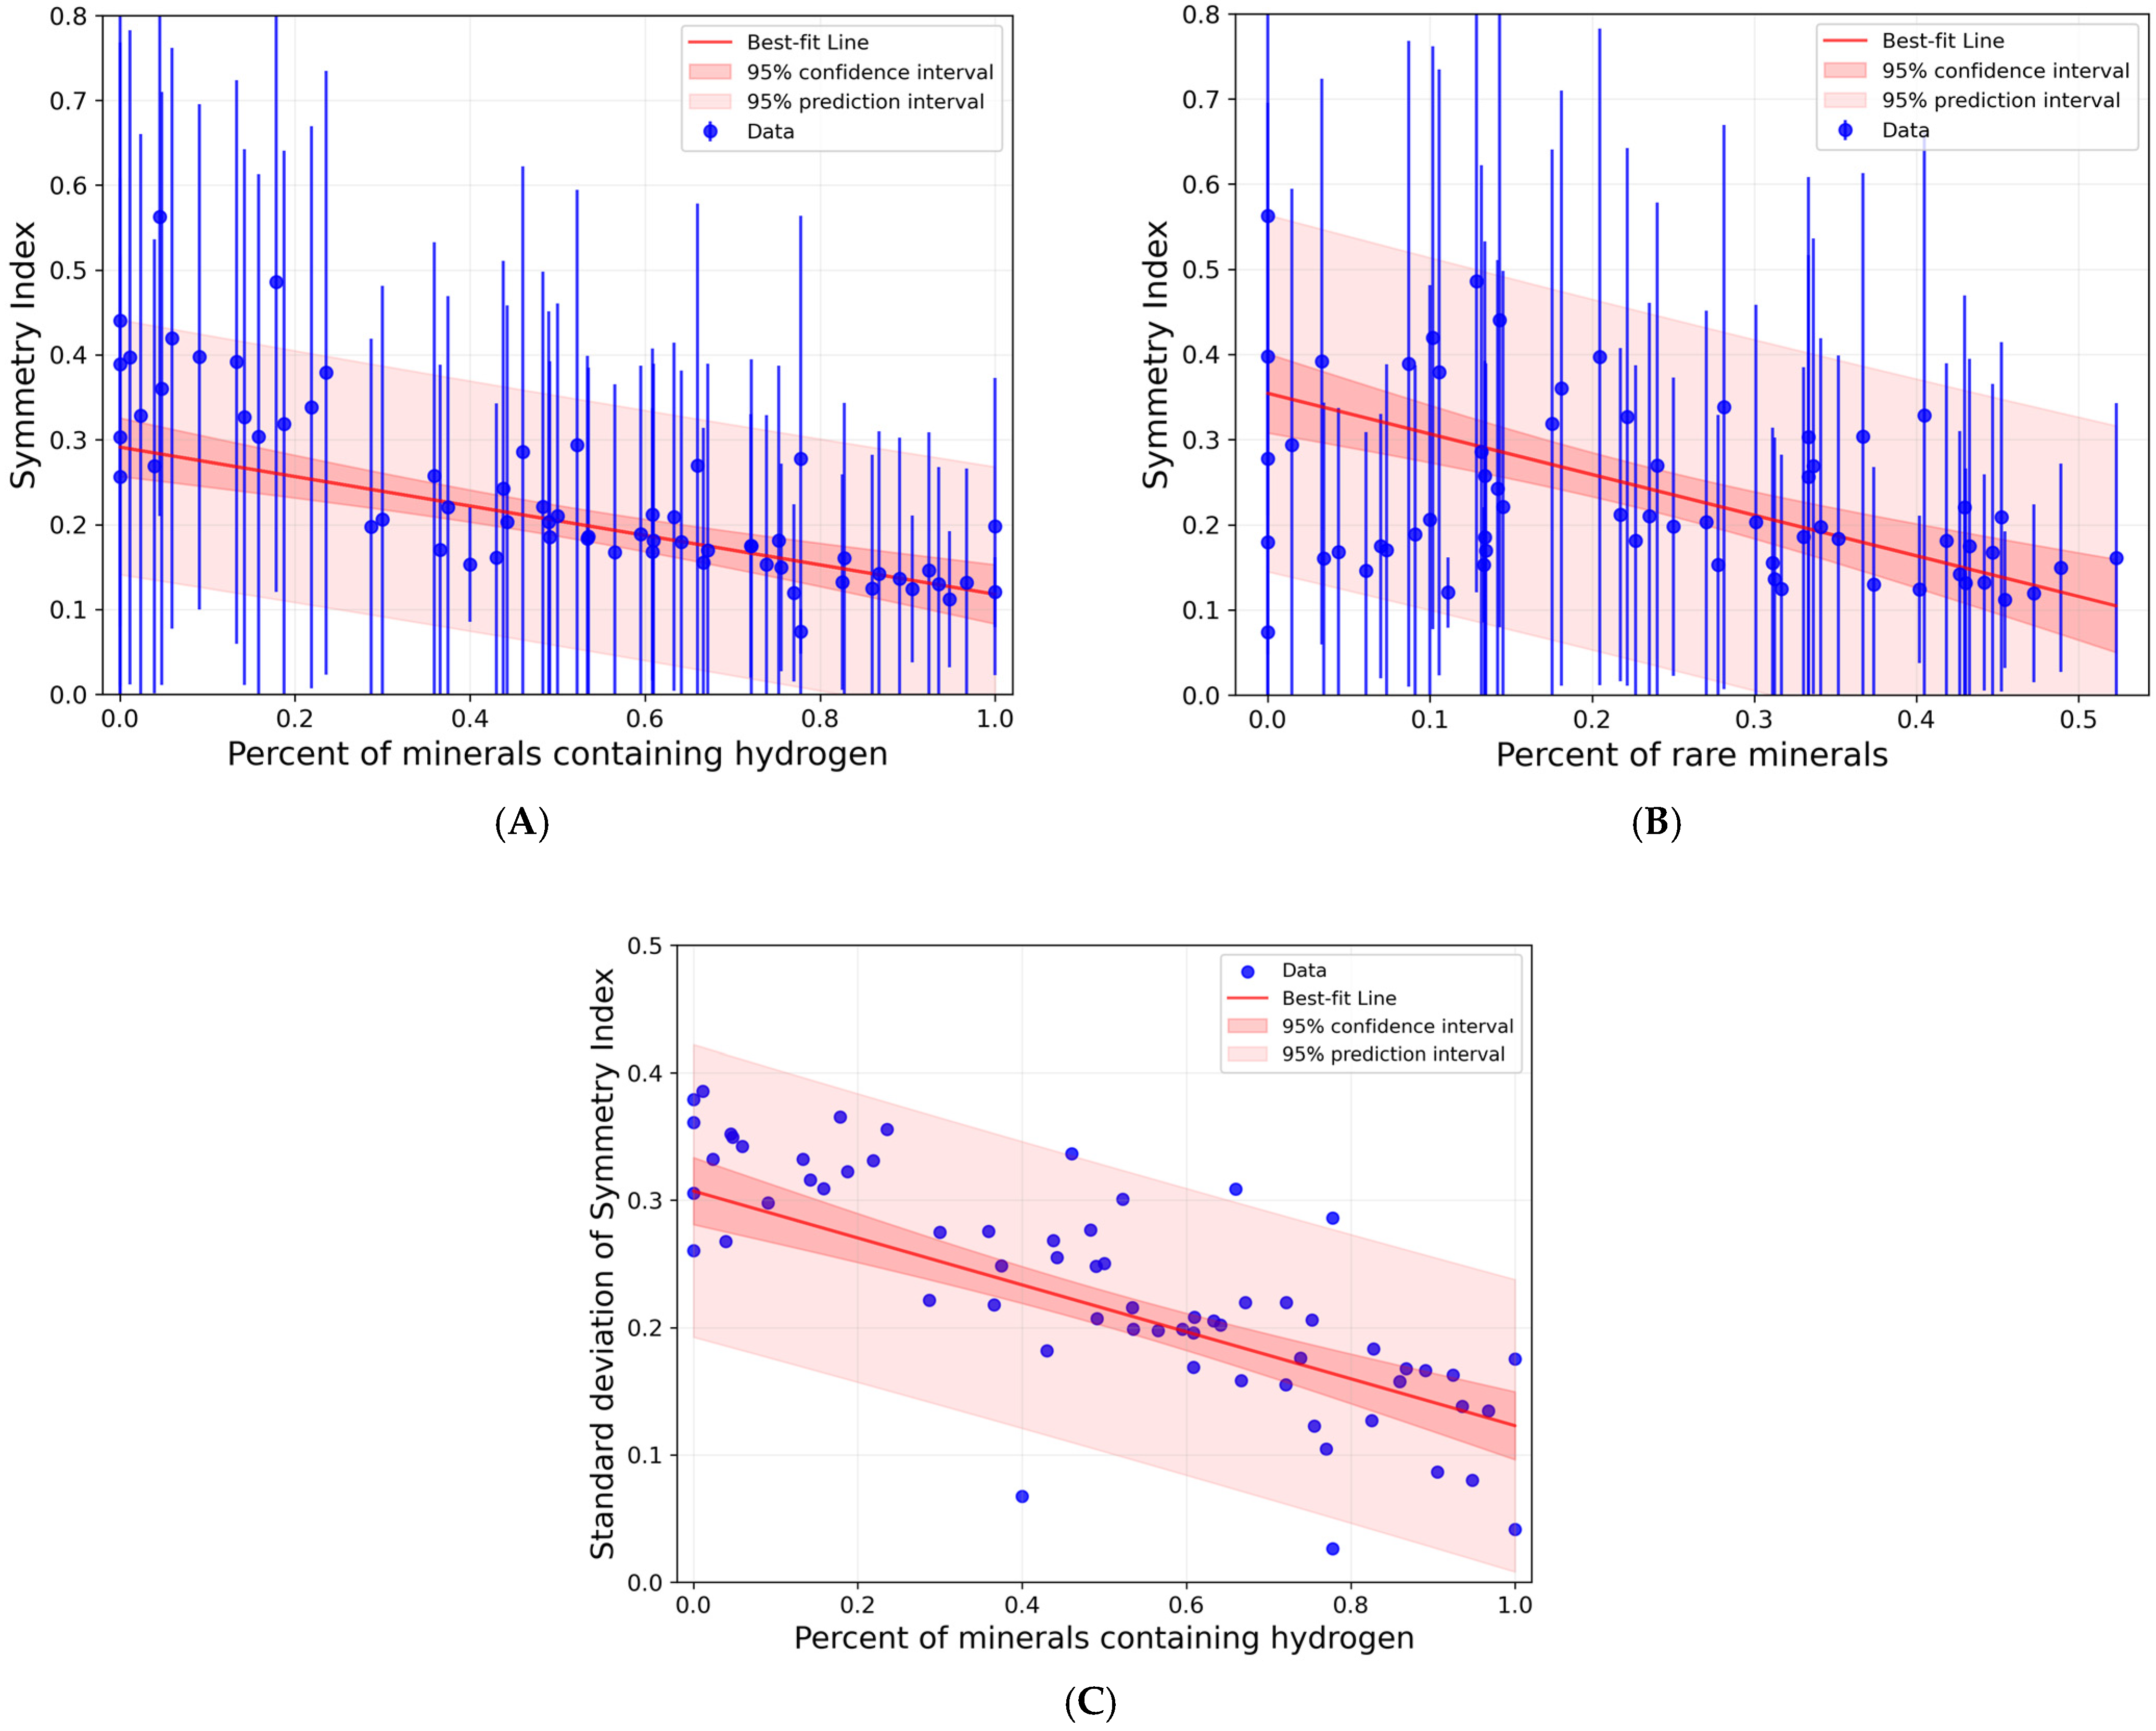
Significant correlations appear in
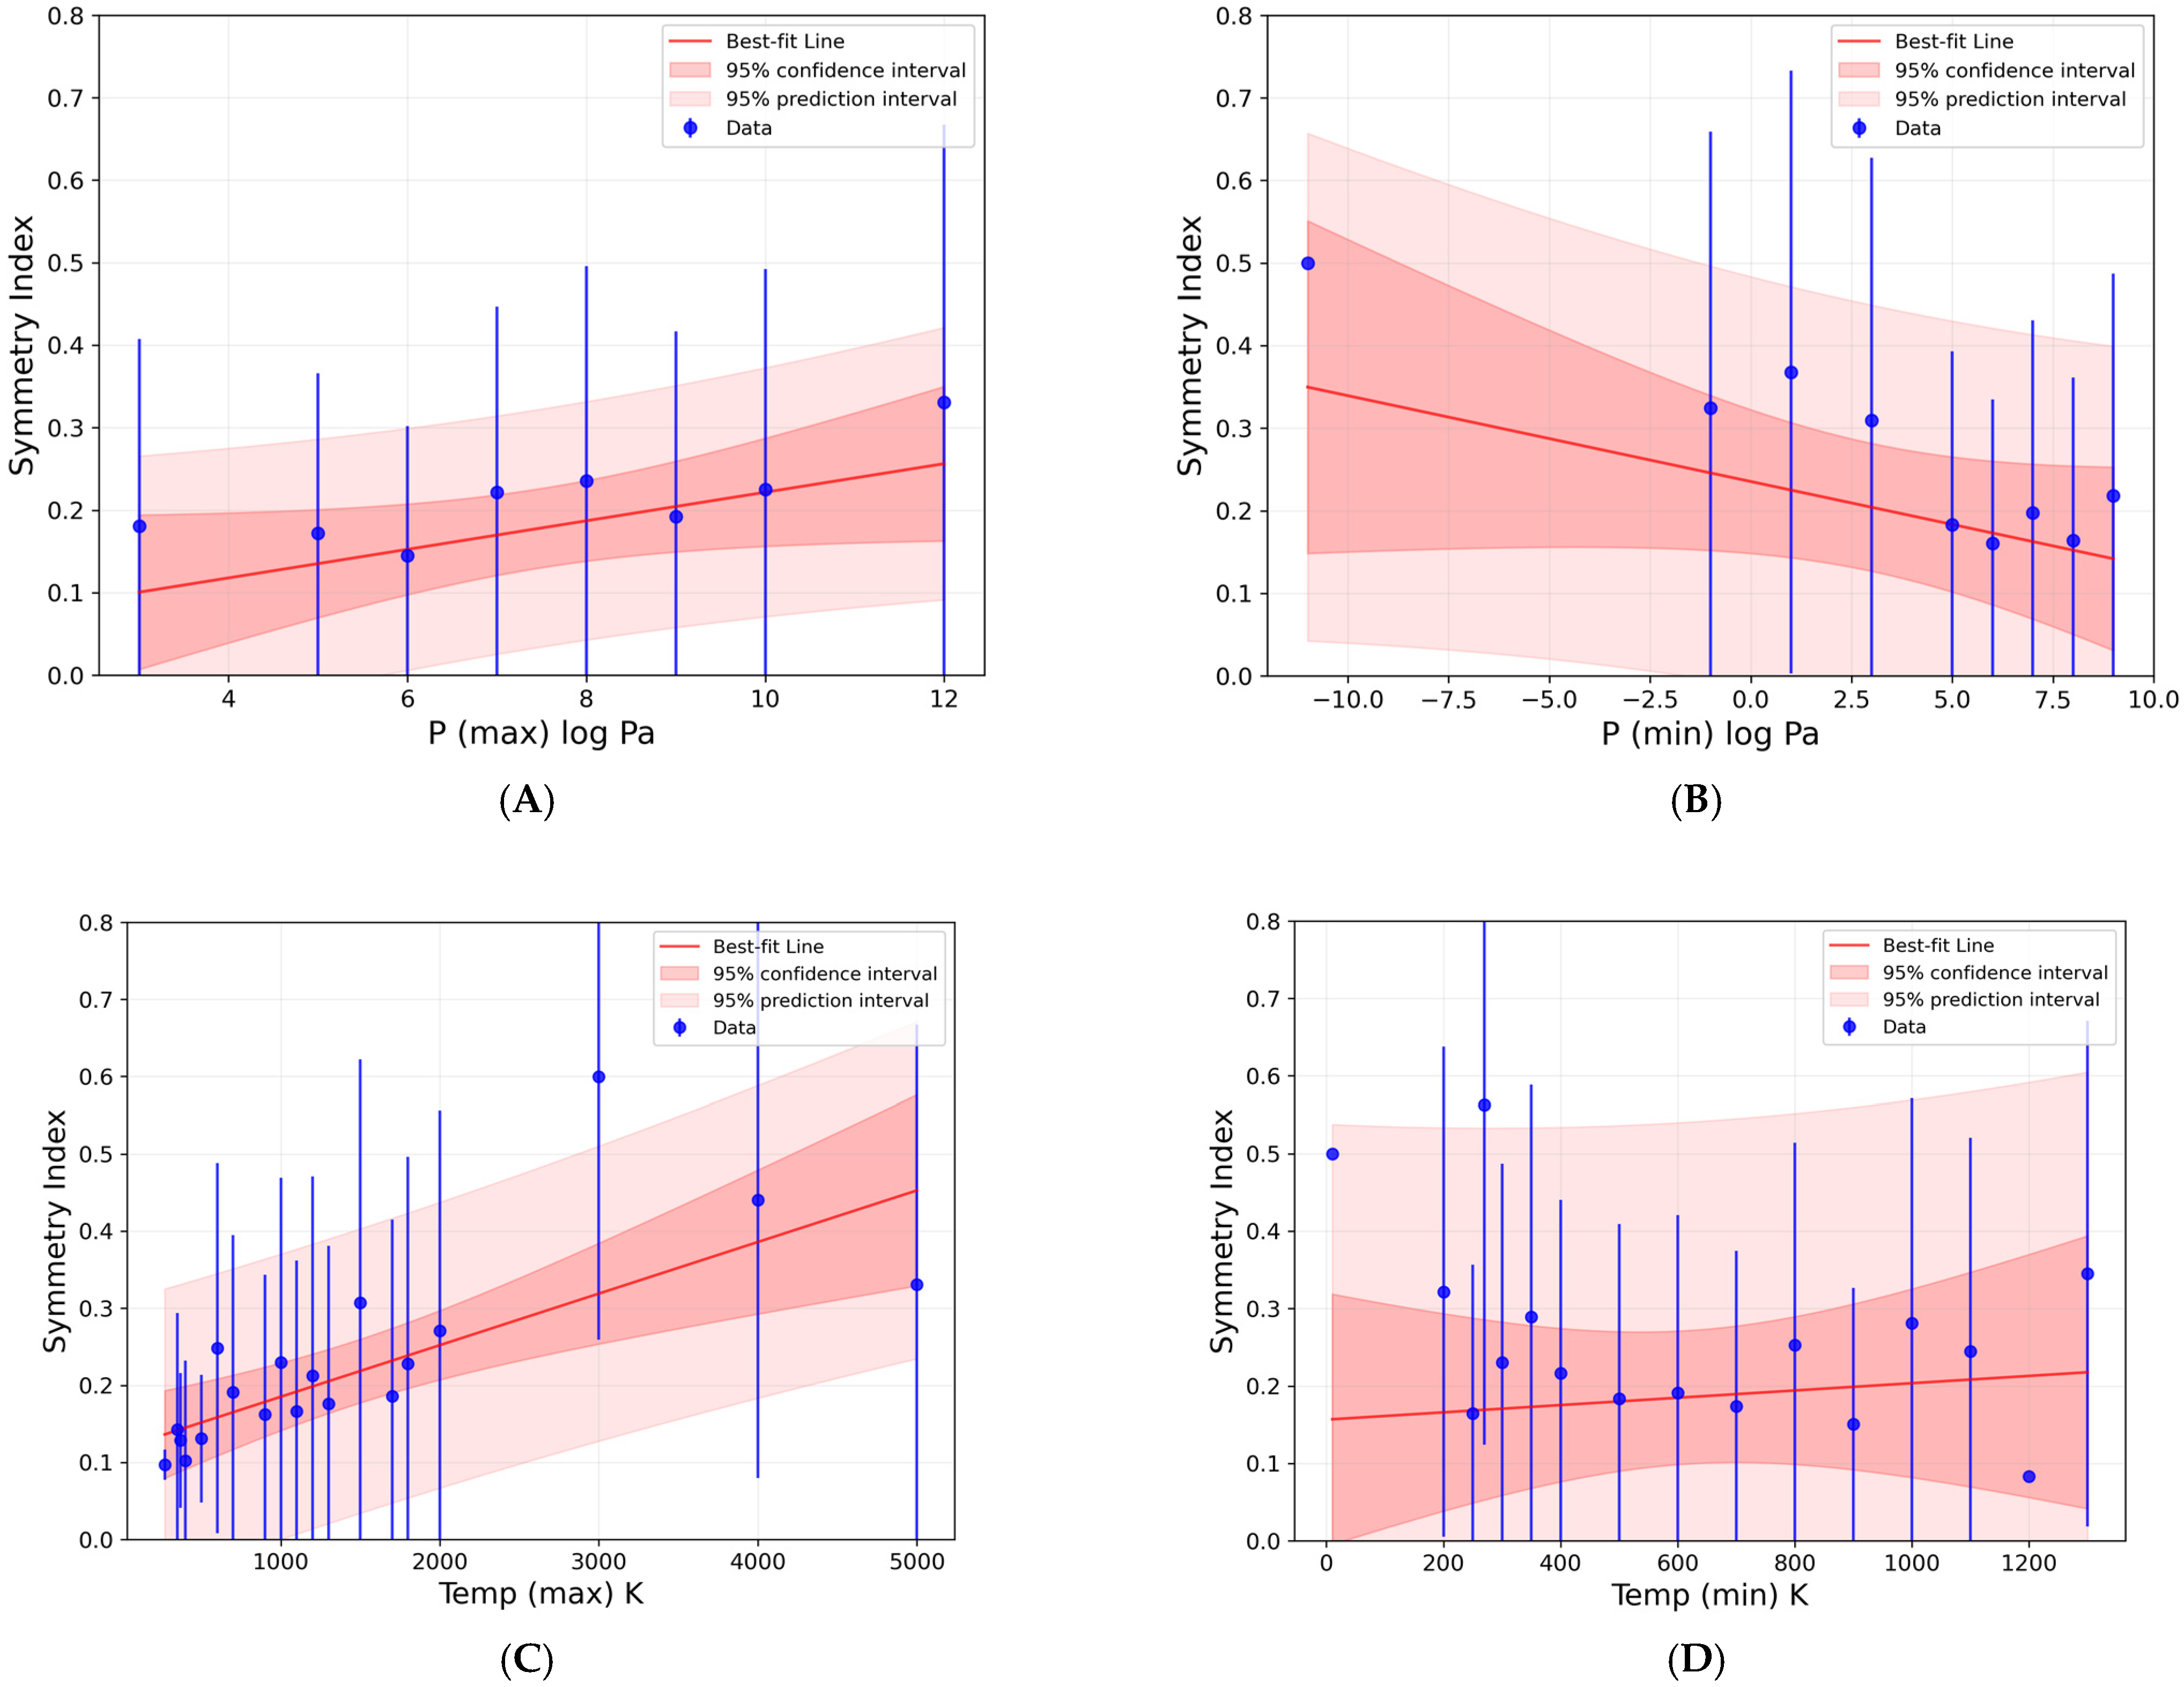
Figure 2A,B for the average symmetry index versus the percent of hydrous minerals and percent of rare mineral species. Additionally, we examined correlations between the average mineral symmetry index and the maximum and minimum pressure and temperature conditions associated with each of the 57 paragenetic modes. For each paragenetic mode, Hazen et al. [
33] estimated minimum and maximum
PT values at which minerals from that subset are likely to form. These values, which were used to clump minerals according to their
PT formation conditions, are presented in
Figure 3 alongside their respective best-fit lines.
The linear fits for all the plots have been weighted proportional to the number of minerals in each paragenetic mode or, as is the case for the
PT plots, the groups of paragenetic modes sharing the same minimum or maximum pressure or temperature values. The weighting of the linear fit with the number of minerals was chosen to reflect the reliability of each data point, ensuring that spots with more measurements contribute more significantly to the regression line, thereby better representing the underlying trend while maintaining simplicity in implementation. For each linear fit, 95% confidence and prediction intervals are provided, calculated using the formulae by Faraway [
45]. The confidence interval is a statistical range that quantifies the uncertainty surrounding an estimated parameter, providing a plausible range of values within which the true correlation is likely to fall with a certain level of confidence, whereas the prediction interval estimates the range within which future individual observations are likely to fall, accounting for both the variability in the data and the uncertainty in the estimation process.
In general, high-symmetry paragenetic modes form a smaller number of minerals, which means the weighted fit puts less emphasis on these paragenetic modes. The error bars on each plot are the standard deviations of the symmetry index of the population of each paragenetic mode (or equivalent group). It is important to note that this is not an error of measurement, but a measure of the variance within each paragenetic mode (i.e., how varied the symmetry index of the species belonging to this paragenetic mode is). In this vein, we have also plotted the standard deviation for each paragenetic mode as a function of the percentage of hydrous minerals, showing that these are also tightly correlated (
Figure 2C). Therefore, we can conclude that a higher percentage of hydrous minerals in a paragenetic mode brings down not only the mean symmetry index but also the variance thereof.
3.1. Pressure and Temperature
Figure 3A,B reveal a trend for minerals formed under different pressure conditions. Interestingly, the minimum and maximum pressures of formation seem to have opposite correlations with the symmetry index of minerals. While the minimum pressure of formation is strongly negatively correlated with the symmetry index, the maximum pressure of formation shows that higher-pressure conditions tend to have greater average symmetry indices than for lower pressure. However, despite prior findings by Filatov [
37], we observe no significant correlation for symmetry index versus the estimated minimum or maximum temperature of formation for the 57 paragenetic modes (
Figure 3C,D).
3.2. The Role of Hydrogen
A striking finding of this study, revealed in both
Figure 1 and
Figure 2A, is that hydrous minerals tend to be of lower average symmetry than anhydrous phases. Indeed, the average symmetry index for all anhydrous minerals is 0.376, compared to 0.204 for hydrous minerals. In detail, five of the six paragenetic modes with the lowest average symmetry indices (p22, p43, p47, p52, and p55) are inherently aqueous processes, whereas five of the six paragenetic modes with the highest average symmetry indices (p1, p2, p29, p37, and p38) are characterized by low water activity. We suggest that this finding points to the important modifying roles of hydrogen—notably through the non-centrosymmetric character of H
2O molecules and hydrogen bonding in the formation of crystal structures, as discussed by Hawthorne [
46]. Furthermore,
Figure 2C shows that a higher percentage of hydrous minerals in a paragenetic mode brings down not only the mean symmetry index but also the variance of the symmetry index, suggesting a stabilizing or moderating effect of hydrogen incorporation on lower symmetry crystal structure modifications.
3.3. The Influence of Mineral Rarity
Rare minerals that are known from fewer than 5 localities (
https://mindat.ord; accessed on 5 March 2024) are on average of significantly lower symmetry, as shown in
Figure 1 and
Figure 2B. Note that the threshold of fewer than five minerals was argued by Gavryliv et al. [
17] to be a barrier between rare groups of minerals and groups of minerals that are transitional between rare and common.
The paragenetic modes with the highest percentage of rare minerals, all >40 percent, include near-surface weathering and oxidation minerals (p46, p47), taphonomic minerals (p53), and minerals from compositionally unusual deposits, including Ba-Mn-Pb-Zn-rich lithologies (p32) and ultra-alkaline agpaitic rocks (p35). In addition, two modes have received detailed attention in the search for rare minerals, including refractory condensed nanophases in chondrite meteorites (p3) and from volcanic fumarole minerals (p45). Each of these paragenetic modes has a significant number of minerals that are only known to form in one way.
By contrast, paragenetic modes with the lowest percentage of rare minerals, all <10 percent, include pre-solar condensates (p1 and p2), hot springs and geysers (p14), authigenic minerals (p24), manganese nodules (p42), shear-induced minerals (p43), anoxic microbially mediated minerals (p44), soil-leaching zone minerals (p48), and cellular biomineralization (p49). Almost all of the minerals in these paragenetic modes also form in other ways.
3.4. Age
Figure 1 hints at a general tendency for older minerals to have greater average symmetry indices than minerals from the most recent paragenetic modes—a finding consistent with that of Bermanec et al. [
30]. In
Figure 1, 12 of the first 15 paragenetic modes have greater-than-average symmetry indices, whereas 14 of the last 20 modes have lower-than-average symmetry indices. It might seem unlikely for age to affect symmetry in any significant way; however, older paragenetic modes form minerals from fewer different chemical elements and with correspondingly simpler chemical formulas [
47,
48]. We suggest that there is likely to be a strong correlation between a higher symmetry index and simpler chemical formulas, as suggested by studies of mineral complexity [
19,
20,
21]. In addition, the correlation between greater age and a higher symmetry index is possibly influenced by the gradual increase in hydrous and rare minerals over billions of years of Earth’s history.
4. Discussion
This investigation into the behavior of the Dolivo-Dobrovol’sky symmetry index in relation to various paragenetic modes of minerals provides significant insights into mineral formation processes. Our findings highlight the importance of considering the average properties of specific paragenetic modes—in this study, notably composition, rarity, age, and formation conditions—when examining the symmetry index.
The observed trends in the correlation between the symmetry index and the average attributes of minerals from different paragenetic modes shed light on the underlying mechanisms governing mineral formation. There is a significant correlation of average symmetry with age, rarity, and hydrogen content. There also exists a modest correlation of symmetry index with the pressure of formation, though no obvious trend with temperature. These correlations reinforce the idea that formation environments can play roles in the distribution of crystal systems and symmetry characteristics in the mineral kingdom. However, our understanding may be limited because of at least three factors.
4.1. Complexity and Variability
Mineral formation is a complex process influenced by multiple factors, including composition, temperature, pressure, and fluid chemistry. Considering mineral/paragenetic mode pairs introduces additional complexity, as each paragenetic mode may have its unique combination of conditions. This variability can contribute to a diluted correlation between specific formation conditions and mineral/paragenetic mode pairs.
4.2. Incomplete Knowledge
The determination of paragenetic modes for minerals is a challenging task; consequently, our knowledge of all possible paragenetic modes and their PT conditions is incomplete. As a result, the dataset of mineral/paragenetic mode pairs may not capture the full range of formation conditions for certain minerals. This limitation could hinder the ability to establish strong correlations with specific pressure and/or temperature values. Nevertheless, the fact that a correlation is present at all with such generalized data for each paragenetic mode demonstrates that symmetry statistics depend on the formation conditions and environments of crystalline solids.
4.3. Contextual Information
While mineral/paragenetic mode pairs provide valuable context by linking the average properties of genetically related subsets of minerals and their formation processes, this perspective shifts the focus from individual minerals to combinations of minerals and their associated paragenetic modes. This broader perspective has the potential to mask the influence of specific formation conditions on individual minerals, leading to weaker correlations.
These and other factors suggest that the analyses of average properties of mineral/paragenetic mode pairs may introduce complexities and variations that impact the strength of the correlations among the varied mineral attributes. Nevertheless, our study reveals and elucidates aspects of the intricate relationships between the average properties of minerals and the Dolivo-Dobrovol’sky symmetry index across 57 different paragenetic modes. These findings have implications for the broader field of mineralogy and planetary sciences and can serve as a basis for further investigations into the geological processes governing mineral formation.
Further research should focus on exploring the specific mechanisms through which pressure, temperature, and other parameters influence the symmetry statistics of minerals within different paragenetic modes. Studying the average properties of minerals and chemical compounds through time has already proven to be a valuable method to explore the evolution of Earth through time. Systematic changes in mineralogy [
31,
32], the redox states of elements [
49,
50,
51], Mohs hardness [
22], elemental composition [
52], structural and chemical complexity [
24,
25,
26,
27,
28,
29], atmosphere composition [
53], and molecular complexity [
54] have all been documented and used to give further insights into different geological events such as the initiation of plate tectonics, the episodes of glaciation, the oxidation of the atmosphere and soil, the co-evolution of Earth and microbial life, and the rise of the terrestrial biosphere. Further investigation of the role of these and other factors in conjunction with paragenetic modes may provide a more comprehensive understanding of the symmetry index behavior and the evolution of minerals through time. These insights might also be applicable to future studies of the evolutionary history of other planetary bodies, such as Mars, the Moon, and asteroids.
In conclusion, this investigation underscores the importance of considering paragenetic modes when studying the symmetry index of minerals. The correlations identified between formation conditions, rarity, the incorporation of hydrogen, age, and the average symmetry index for different paragenetic modes contribute to our understanding of mineral formation processes and provide a framework for future investigations in this field.


