Article

A Genetic Mechanism for Chemical Compaction in Mudstones: Case Study from the Xihu Depression, East China Sea Shelf Basin

1
School of Earth Sciences and Engineering, Xi’an Shiyou University, Xi’an 710065, China
2
Shaanxi Key Laboratory of Petroleum Accumulation Geology, Xi’an Shiyou University, Xi’an 710065, China
3
Key Laboratory of Petroleum Resources Research, Lanzhou 730000, China
4
Northwest Institute of Eco-Environment and Resources, Chinese Academy of Sciences, Lanzhou 730000, China
5
Shanghai Branch of CNOOC Ltd., Shanghai 200030, China
*
Author to whom correspondence should be addressed.
Minerals 2024, 14(4), 413; https://doi.org/10.3390/min14040413
Submission received: 23 February 2024 / Revised: 14 April 2024 / Accepted: 15 April 2024 / Published: 17 April 2024
(This article belongs to the Special Issue Petrological and Geochemical Characteristics of Reservoirs)

Abstract

:
Mudstone compaction is widely used in the estimation of subsidence caused by sediment load, basin modeling, and overpressure genesis. The boundary for the depth at which chemical compaction in mudstones begins in the Xihu Depression is across two wells; in Well A, the depth is 2200 m, while in Well D, it is 1750 m. The porosity shows a gradual decreasing trend, followed by a sharp decrease and then an increase. Compared with Well A, the pores in Well D show a faster reduction (resulting in higher compaction) with increasing burial depth. The compaction process is controlled by clay mineral transformation and temperature increase. At a temperature range of 65–105 °C, local dissolution of quartz and pyrite, as well as precipitation of plagioclase, occur in Well D. The quartz, pyrite, and plagioclase contents in Well A do not significantly change, while K-feldspar corrosion and illitization are dominant. At a temperature range of 125–135 °C, diagenesis is reversed. The mixed layer increases across a low range, while chlorite and kaolinite contents increase; the dissolution of dolomite and the intermittent dissolution of calcite cause a local increase in pore size at 4460 m in Well A and 3300 m in Well D. The report values of geothermal gradient raise the depth limit of chemical compaction in Well D compared to that in Well A, thus accelerating the process of illitization and the cementation rate of quartz, and becoming the leading cause of the steeply decreasing trend of porosity in Well D. A compaction model for the Xihu Depression has also been established, which involves mechanical compaction, coexistence of chemical compaction and mechanical compaction, and chemical compaction. In the chemical compaction stage, the chemical/diagenetic compaction of mudstones locally increases the pore size. Moreover, abnormally enlarged pores became important reservoirs in the Xihu Depression.

1. Introduction

Fine-grained argillaceous clastic rocks account for about 70%–80% of global sedimentary rocks [1]. Mudstone is a typical representative of fine-grained clastic sediments in sedimentary basins. Compaction is a common and important natural phenomenon in sedimentary basins, which can cause changes in the physical properties of sediments during burial. The variation in physical properties (such as porosity and density) with depth is a complex function of mechanical and chemical compaction, which is generally referred to as the “compaction curve” or “compaction trend” [2,3]. Compaction trend is widely used in the estimation of subsidence caused by sediment load [4], basin modeling [5], and overpressure genesis [6,7]. The amount of overpressure can be estimated by analyzing the deviation from the expected normal compaction trend in the direction of the higher porosity, lower bulk density, or slower sound velocity [8]. The compaction trend varying with depth can also be extended to denudation estimation, geomechanical modeling, reservoir characterization, and sealing evaluation [9,10,11].
In shallow buried areas, the changes in physical and acoustic properties are mainly affected by mechanical compaction, which reduces the porosity and increases the bulk density of sediments. Most mudstones have a relatively predictable trend of mechanical compaction, and extensive research on mechanical compaction has been undertaken in the past twenty years [4,11,12,13,14]. When buried deeply (corresponding to a burial temperature of 70–100 °C), porosity loss begins to be controlled by chemical compaction, and smectite is transformed into illite and quartz cement [10,15,16]. Mechanical compaction causes an anisotropic rearrangement of clay particles in unconsolidated sediments. Once chemical diagenesis occurs, the compaction process is further controlled by the transformation of the clay minerals and chemical cementation [17].
Most scholars believe that the shallow layer is dominated by mechanical compaction. With an increase in burial depth and temperature, chemical diagenesis begins compaction, resulting in the deeper layers showing chemical compaction driven by thermodynamics [3,15,18,19,20,21]. However, many scholars still believe that the compaction is mainly mechanical and controlled by the vertical effective stress, sediment structure deformation capacity, and particle strength [11,22]. The main reason that chemical compaction has not been given enough attention is the chemical compaction process and genesis are complex; meanwhile, the core scientific problem of genetic mechanism has not been independently and effectively confirmed in most basins [15,18,19,20,21].
Chemical compaction essentially involves the dissolution of unstable minerals and the precipitation of thermodynamically stable minerals. The volume and content of clay minerals are enhanced during mechanical compaction. The transformation and alteration of clay minerals rate the diagenetic dissolution kinetics and play a catalytic role in chemical compaction [3,10,15,16,17,18,19,20]. At the same time, temperature plays a decisive role in chemical compaction. The transformation of clay minerals, and fluid migration and evolution need to be carried out at a specific temperature [23,24,25]. Smectite is only a component in the initial stage of clay mineral transformation. With an increase in formation temperature (>65–75 °C), the content of smectite decreases significantly [3,18,19,26,27]. Furthermore, the acids discharged from the mudstones rich in organic matter at high temperatures result in the dissolution of unstable minerals such as feldspar and carbonates, which significantly affects the comprehensive compaction [23,28].
The geological research related to the mudstones of the Xihu Depression has attracted extensive interest from many geologists in recent years [7,11,29,30]. Compaction in the Xihu Depression is divided into mechanical compaction, chemically enhanced mechanical compaction, and stable compaction, as determined by Fan and Wang [11] using logging data to mark changes in the clay mineral content. The compaction stage shows that (1) the independently calibrated, single-well logging curve would reflect the compaction process, and that (2) clay mineral transformation occurred in the layer of the Xihu Depression [31].
Unfortunately, many scholars have not given a clear conclusion on whether the mudstones in the Xihu Depression are chemically compacted or not; thus, the summarized compaction stage could not fully reveal the compaction process.
Taking the typical wells in the key area of the Xihu Depression in the East China Sea Shelf Basin as an example, this study aims to achieve three goals: (1) reveal the variation trend of compaction with burial depth using the independently calibrated single-well logging curve data, as well as the mechanical compaction experiment [12,13]; (2) analyze the diagenetic transformation of clay minerals, chemical compaction process, and its genetic mechanism through a scanning electron microscope (SEM), whole-rock experiment, X-ray diffraction (XRD), and temperature distribution; (3) study the compaction process and establish a compaction model based on mechanical and chemical compaction behavior, clay mineral transformation, and temperature distribution.

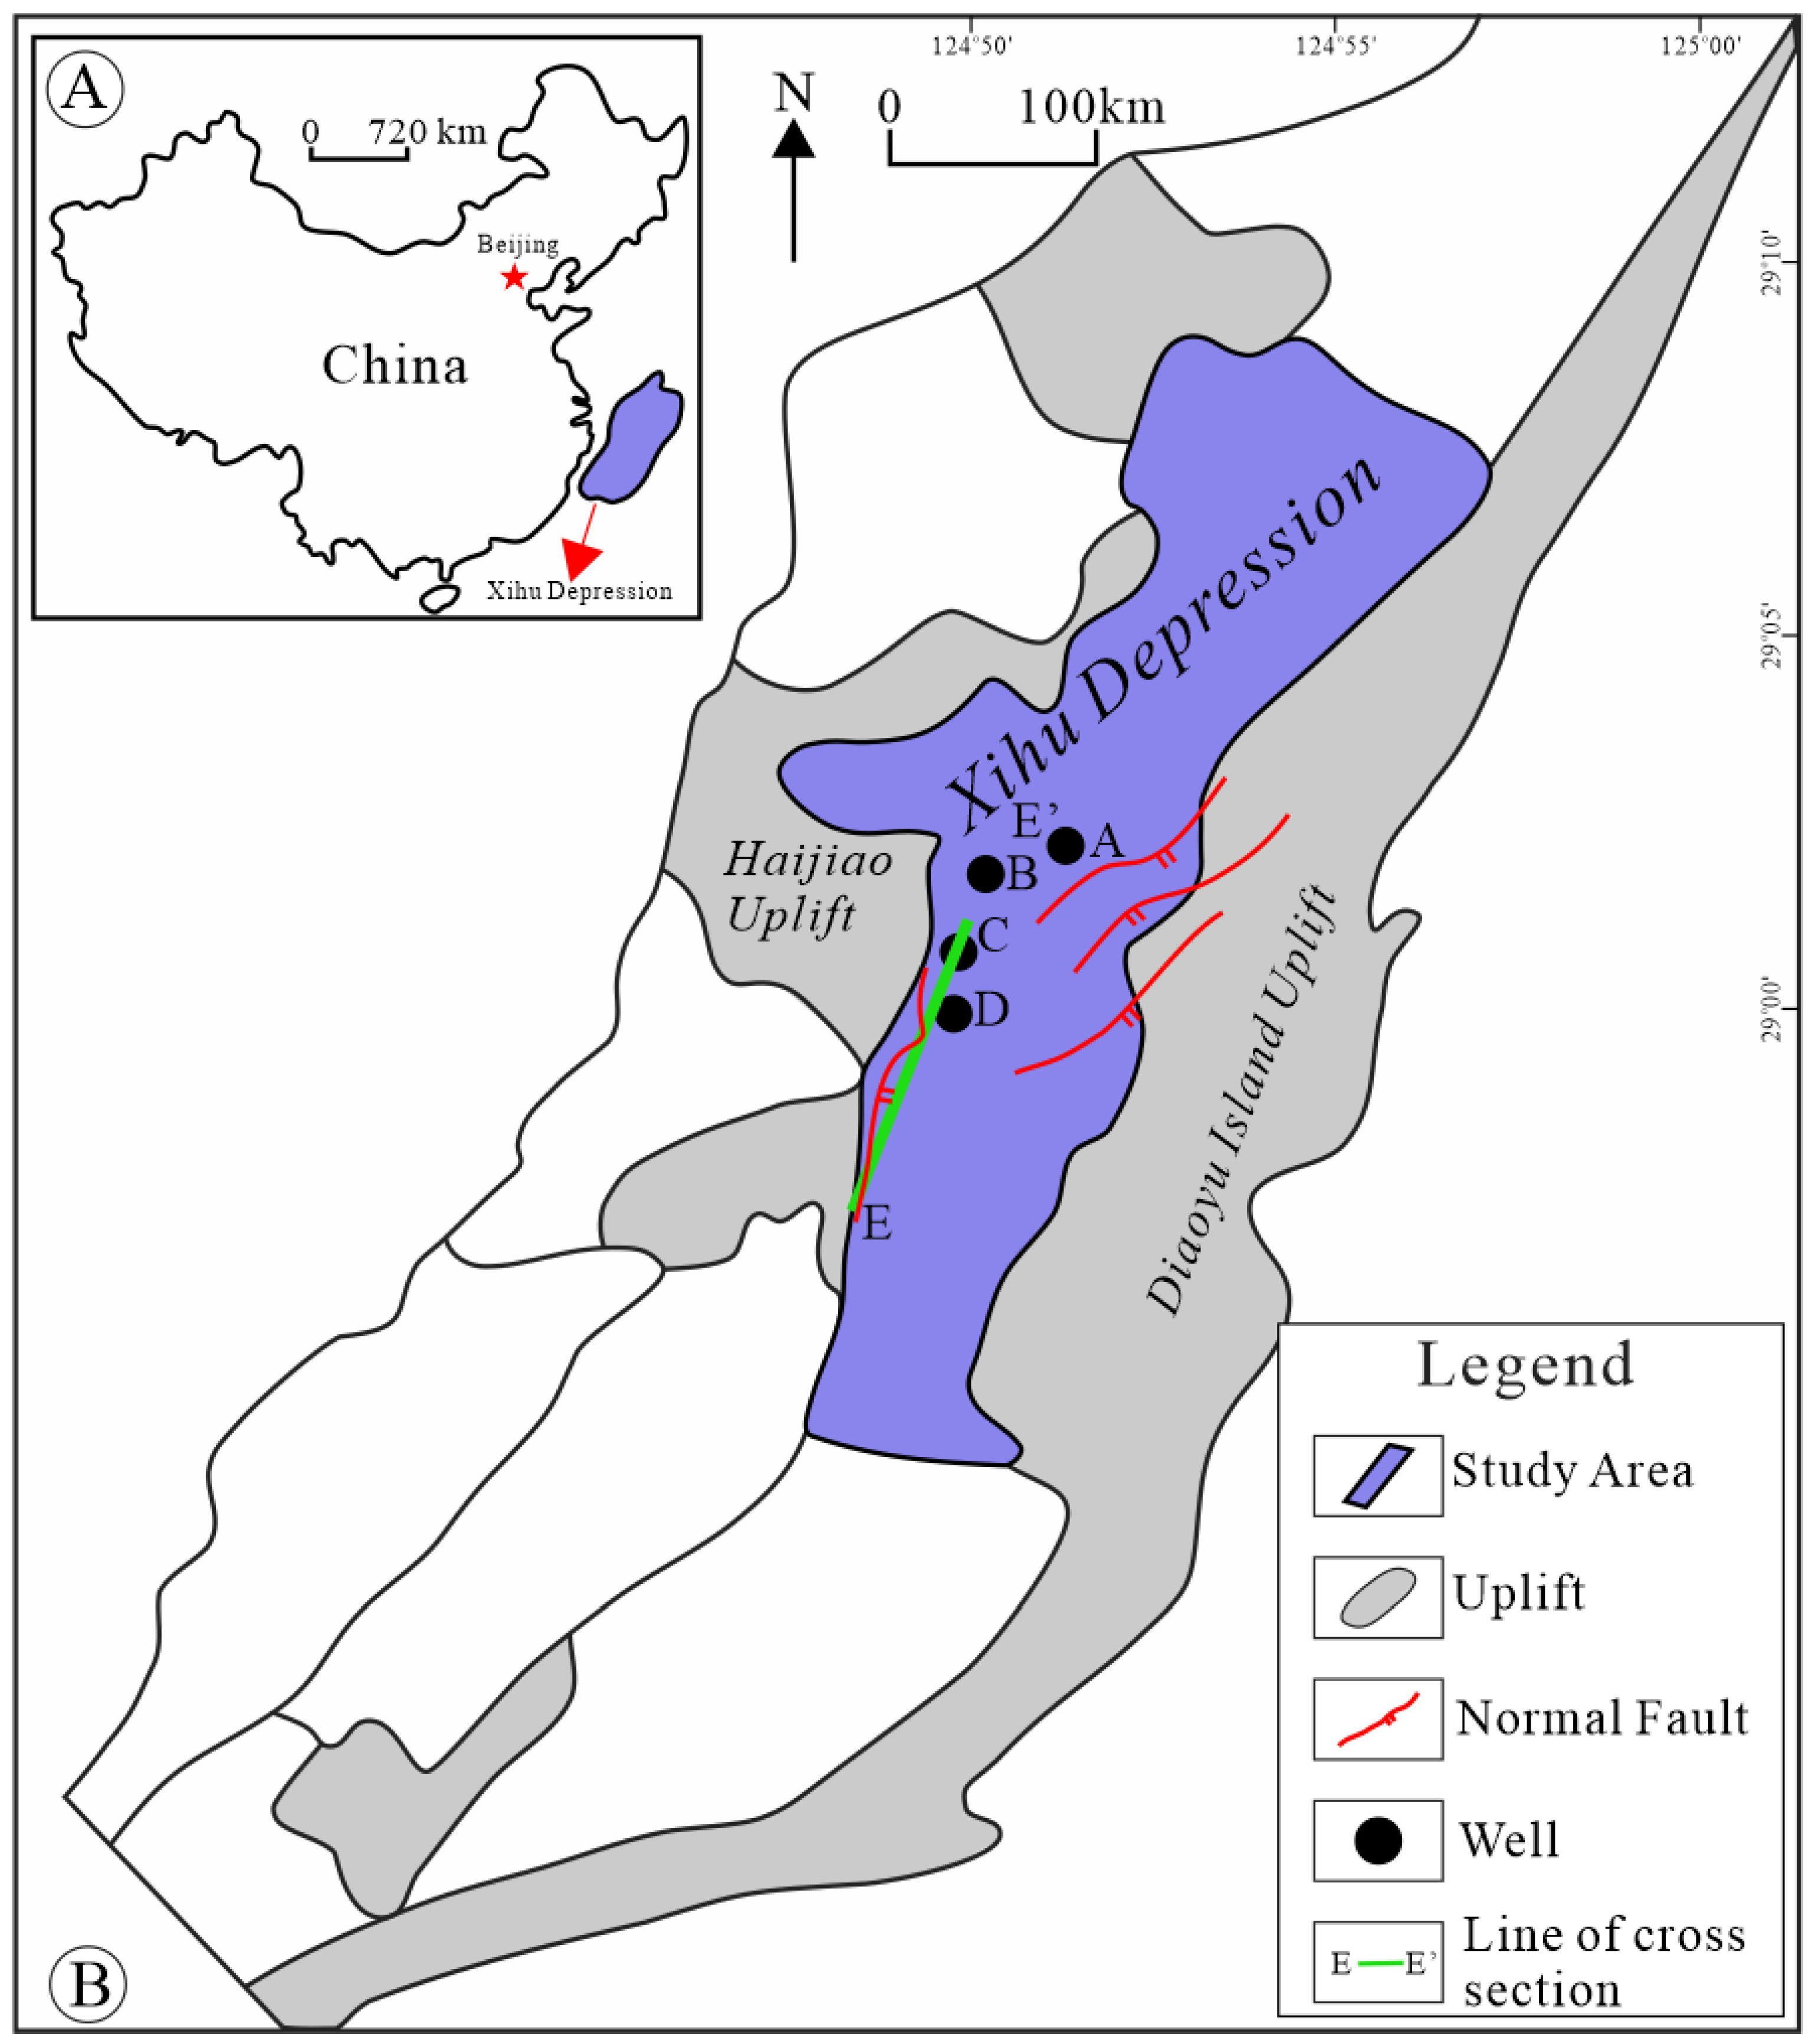
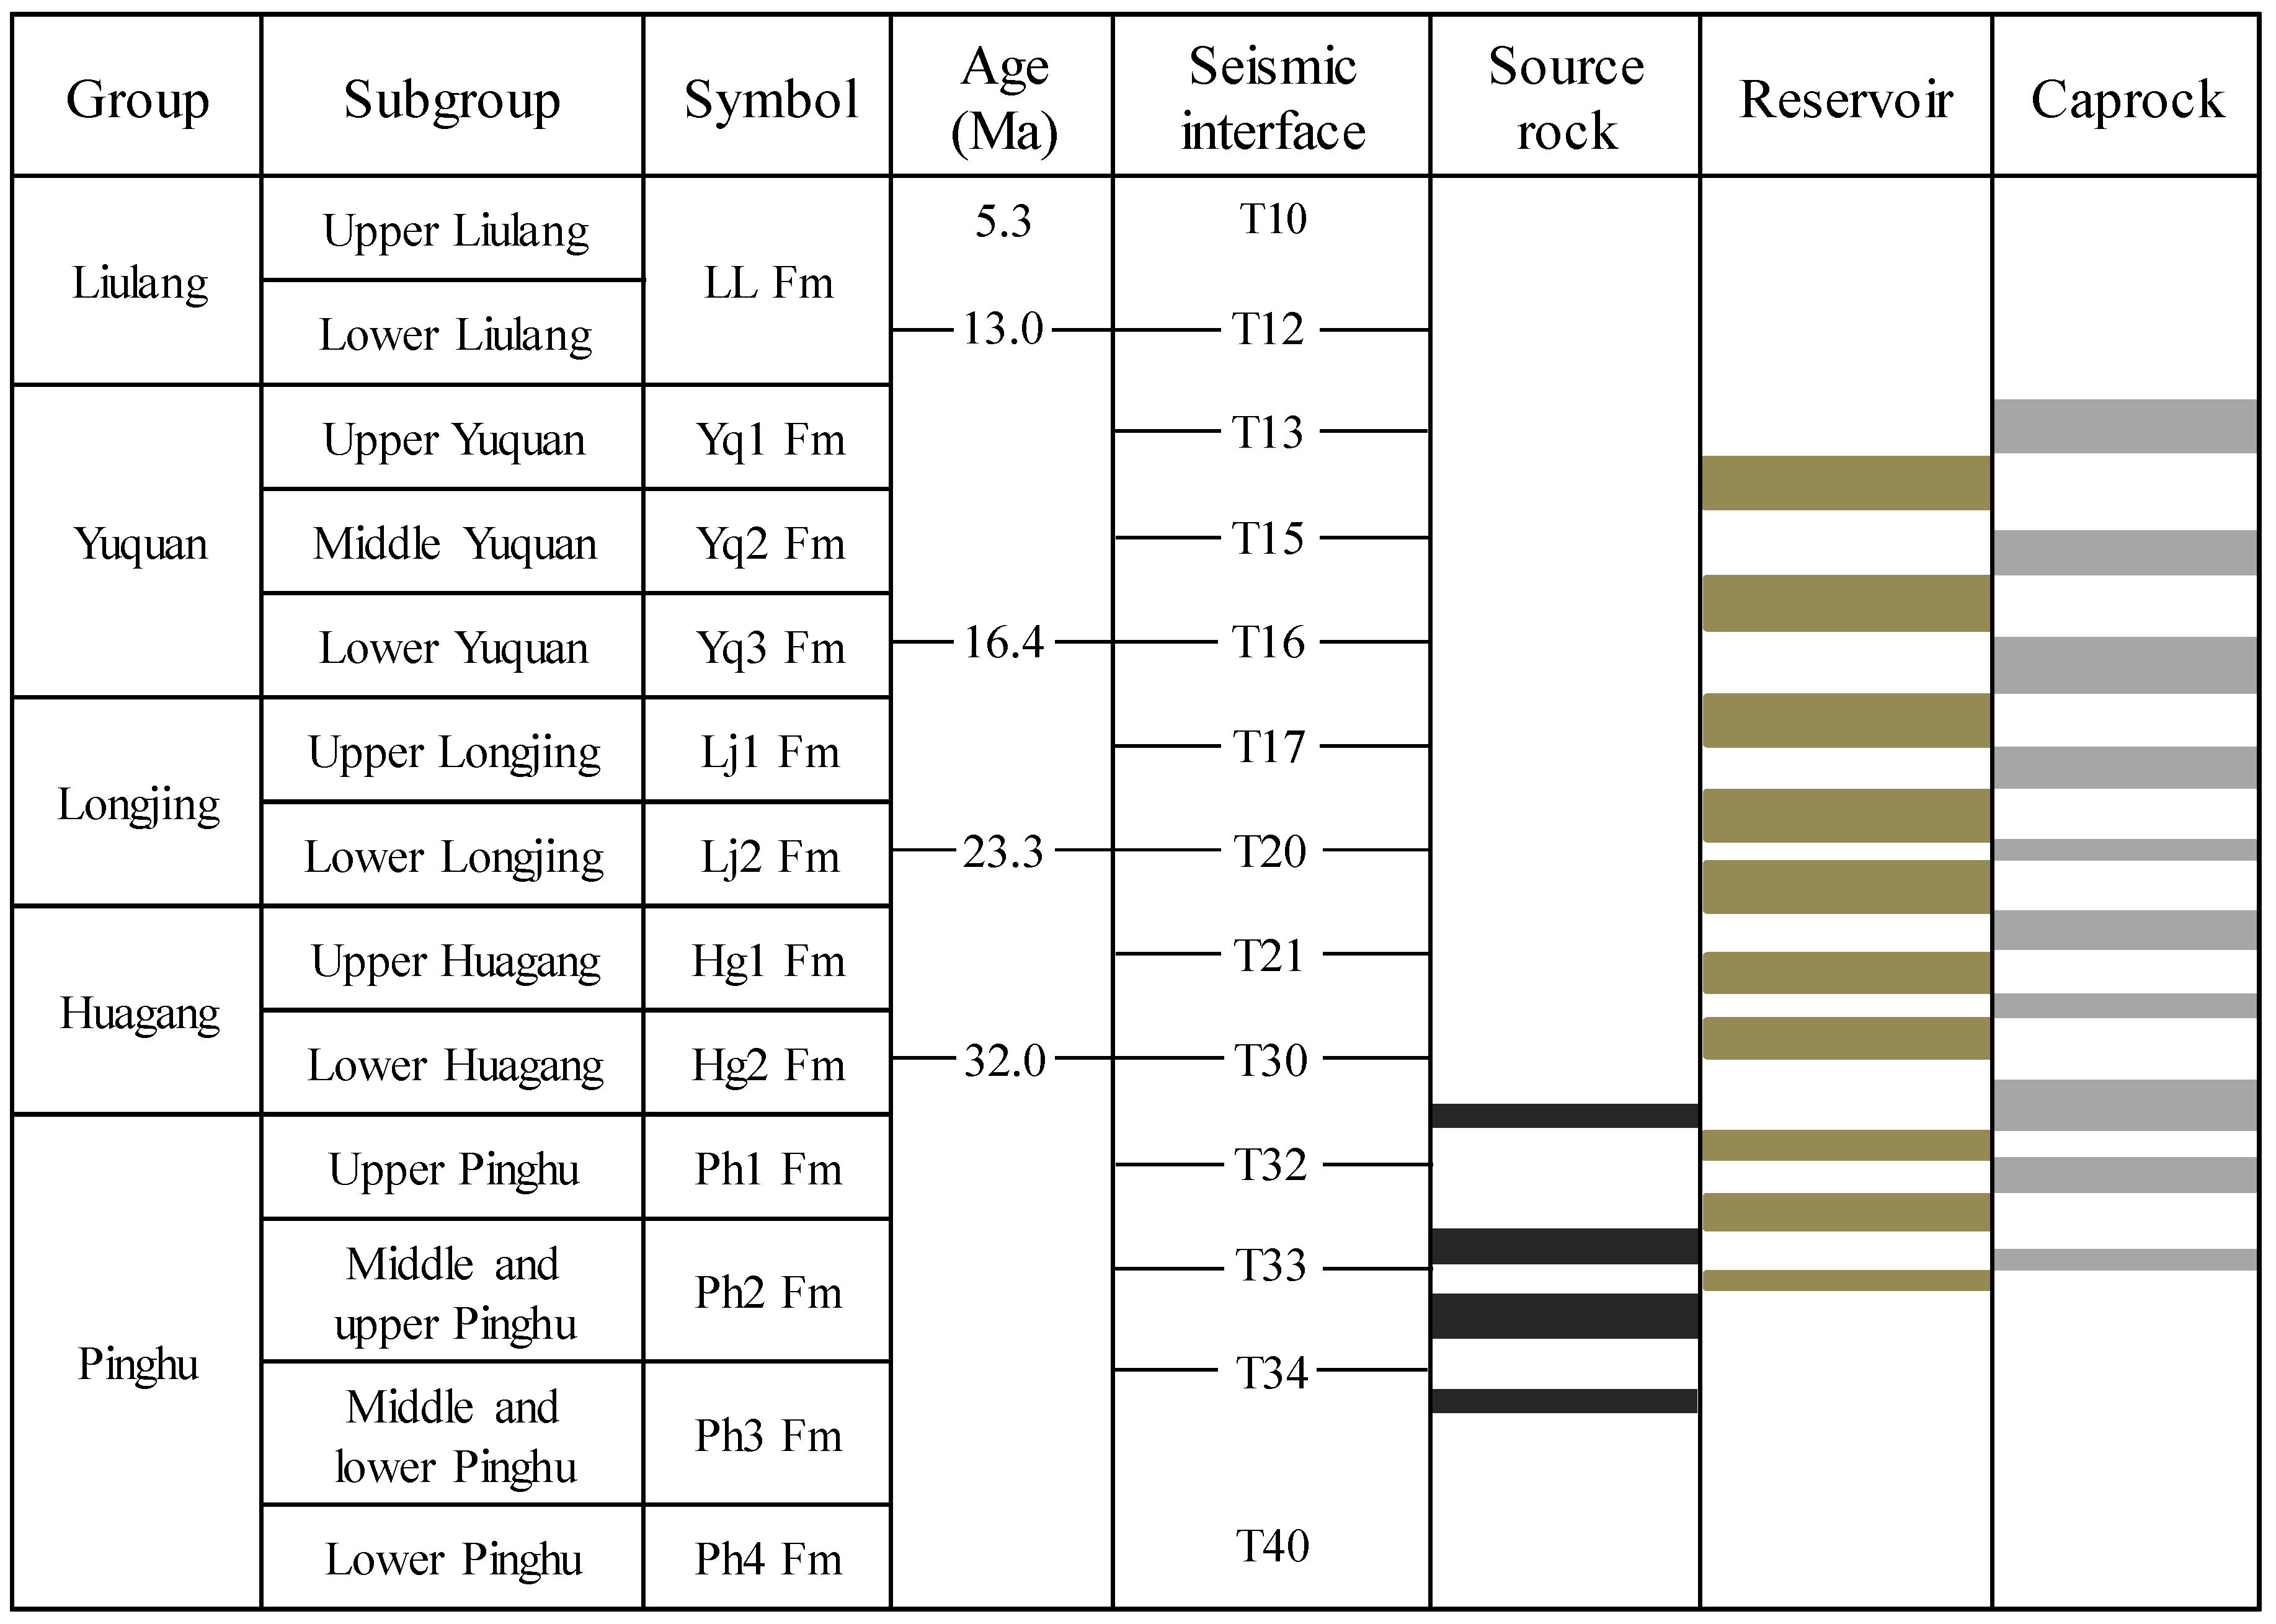
2. Geological Setting

The East China Sea Shelf Basin is located in the East China Sea (Figure 1A), and the Xihu Depression is situated in the north-central part of the East China Sea Shelf Basin (Figure 1B). Samples are taken from the Pinghu Formation (PH Fm), Huagang Formation (HG Fm), Longjing Formation (LJ Fm), and Yuquan Formation (YQ Fm) in the western slope zone of the Xihu Depression. The sample types of high-quality source rocks and potential argillaceous caprocks are observed vertically from deep to shallow regions (Figure 2). The sedimentary environment of the Pinghu Formation mostly comprises a barrier lagoon, delta front, and delta plain. The formation environment of the Pinghu Formation is marine-terrigenous transitional sedimentation [32]. The sedimentary environment of the Huagang Formation is constructed by the fluvial-lacustrine delta system, whose sedimentary environment is diverse, and comprises a distributary bay, flood plain, and underwater natural levee [33,34]. The sedimentary facies of the Longjing Formation and the Yuquan Formation on the western slope of the Xihu Depression have been rarely studied. The formation environment is generally summarized as the lacustrine–fluvial facies [35]. Mudstones of the Pinghu Formation are rich in organic matter and provide a high-quality and sufficient hydrocarbon source for the formation of tight and conventional sandstone reservoirs in the slope zone of the Xihu Depression [29,35]. The tight sandstone in the Pinghu Formation and tight-conventional sandstone in the Huagang Formation might become potential reservoirs in the slope zone of the Xihu Depression [33,34,35], and the overlying mudstones of the reservoir might become potential caprocks (Figure 2).
The four typical wells in Figure 1 are drilled through the Huagang Formation to reach the Pinghu Formation (Figure 1). Well A and B are distributed in the Kongqueting gas field, well C is located in the Baoyunting gas field, and Well D is situated in the Pinghu gas field of the Xihu Depression, East China Sea Shelf Basin. The samples selected for analysis in this paper are mudstone drilling cuttings from wells A and D, in which different horizons and sedimentary environment types are involved. Figure 1 of the study by [11] could be referred to determine the distribution area of gas fields in the western slope zone of the Xihu Depression. The tectonic evolution history of the Xihu Depression can be obtained from published documents such as those of Zhou et al. [37], Li et al. [7], and Fan and Wang [11], which are out of scope of the present study.

3. Methods

3.1. Logging Curves

Total Gamma-ray wireline logging is used to estimate the mud content. The mud content threshold is >0.5, and the stratigraphic unit dominated by mudstone from other lithologies could be distinguished [10]. The mudstone drilling cuttings after core homing is used to calibrate the reading values of the logging curve. Logging value due to well diameter expansion is further eliminated. Compaction curves, including natural gamma-ray (GR), resistivity (RT), the acoustic time difference (AC), compensated neutron (CNL), density (DEN), and well diameter logging (CAL) are compiled comprehensively.
The porosity error analysis of actual samples is not carried out for the porosity calculated using the AC and DEN due to the limitations associated with the actual sampling of core samples. In this paper, two methods of AC and DEN logging are used to calculate porosity with the intent of avoiding the calculation error of porosity as much as possible.
(1) Porosity is calculated using Wyllie’s acoustic time difference equation [11,38]:
ΦAC = (ΔtΔtma)/(ΔtfΔtma)
where Δt represents the acoustic time difference, which is equal to the value of the logging curve at burial depth z; Δtf is the acoustic time difference of pore fluid, which is taken as the empirical value in the study area, Δtf = 189.0 μs/ft [7]; Δtma is the matrix (or particle) acoustic time difference, which is taken as the empirical value of the study area (Δtma = 56.5 μs/ft) [11], and ΦAC represents the porosity at burial depth z.
(2) The porosity calculated by density logging is determined by the following formula [39]:
ΦDEN = (ρmaρb)/(ρmaρf)
where ρma is the density of the matrix when taking the empirical value of the study area (ρma = 2.71 g/cm3) [7,11]; ρb is the volume density obtained from density logging; ρf is the pore fluid density, which is the experimental value of formation water analysis in the study area. The average formation water density is 1.02 g/cm3.
Mineralogical analysis of Well A and D revealed a clay mineral content of approximately 40.1 to 69.8% in mudstone drilling cuttings. Among the synthetic clay mixtures tested in the laboratory, the silt-clay ratio of 25:75 should be the most relevant and representative of the mechanically compacted synthetic mixture [10]. The upper and lower limits of porosity caused by pure mechanical compaction are obtained from 100% smectite [12] and 50:50 kaolinite-silt mixtures [13]. The upper and lower limits, used to distinguish the boundaries of mechanical and chemical compaction, clarify whether the mudstones in the study area have been undergone chemical compaction, and determine the strength of the compaction process. To facilitate the direct comparison of porosity, Mondol et al. [12,13] determined the plate is roughly equivalent to the vertical effective stress of 10 MPa (100 bar) per kilometer of burial depth.

3.2. Scanning Electron Microscope (SEM)

The SEM experiment was completed in the Shaanxi Key Laboratory of Petroleum Accumulation Geology (Xi’an Shiyou University, China). Mudstone drilling cutting samples are selected, sorted, pasted, and prepared in the laboratory. The cross section ion polishing instrument (IB-09020CP, Japan) is used to perform sectioning and polishing on the samples. The sliced sample is put into the automatic ion sputtering instrument (JEC-3000FC, Japan) to spray gold on its surface. The samples are analyzed using a high-resolution field emission scanning electron microscope (Tescan, Brno, Czech Republic) with an accelerating voltage of 0.1–30 kV (continuously adjustable) and a beam range of 1 pa–200 nA (continuously adjustable) at 25–1,000,000× magnification. Different types of clay minerals, pore distributions, and connectivity structures of samples are observed, and the qualitative identification of mineral unit compositions in the micro area are determined in real-time by an electric refrigeration energy spectrometer (X-Max20, USA).

3.3. X-ray Diffraction (XRD)

The testing of mudstone, whole rock, and clay minerals was completed at CNOOC EnerTech-Drilling & Production Co., China. The whole-rock composition and specific clay mineral types are detected according to the China Petroleum and Natural gas Industry Standard SY/T5163-2018 (X-ray diffraction analysis method of clay minerals and common clay minerals in sedimentary rocks). Clay minerals are separated from the mudstone drilling cuttings using the Stokes sedimentation method [40,41]. This extraction method is primarily for minerals with particle size < 2 μm. Under the existing technical conditions, the presence of quartz could not be completely avoided during the extraction of clay minerals. However, the following points are noteworthy: (1) the height of the quartz peak does not interfere with the quantification of clay minerals and does not participate in the computation of clay minerals; (2) the quality of the single sample spectrum can be controlled according to the fixed position of the main peak (26.64°) of quartz, which implies that the peak position of quartz can be used to adjudge whether the peak angle of the measured spectrum is offset. The XRD patterns of clay mineral samples are obtained using the SmartLab SE X-ray diffractometer (Rigaku Corporation, Tokyo, Japan) and 1D Hy-Pix-400 detector. For the diffractometer with Cu-Kα Radiation, the angle between the emission slit and the scattering slit is 1°; the width of the receiving slit is 0.3 mm, and a strict energy resolution limit is realized. The scanning speed is maintained at 2°/min for a scanning range of 3–30°. The corresponding mineral integral area is read in the Jade 9 software and calculated using Microsoft Excel according to the standard formula given in SY/T5163-2018.

4. Results

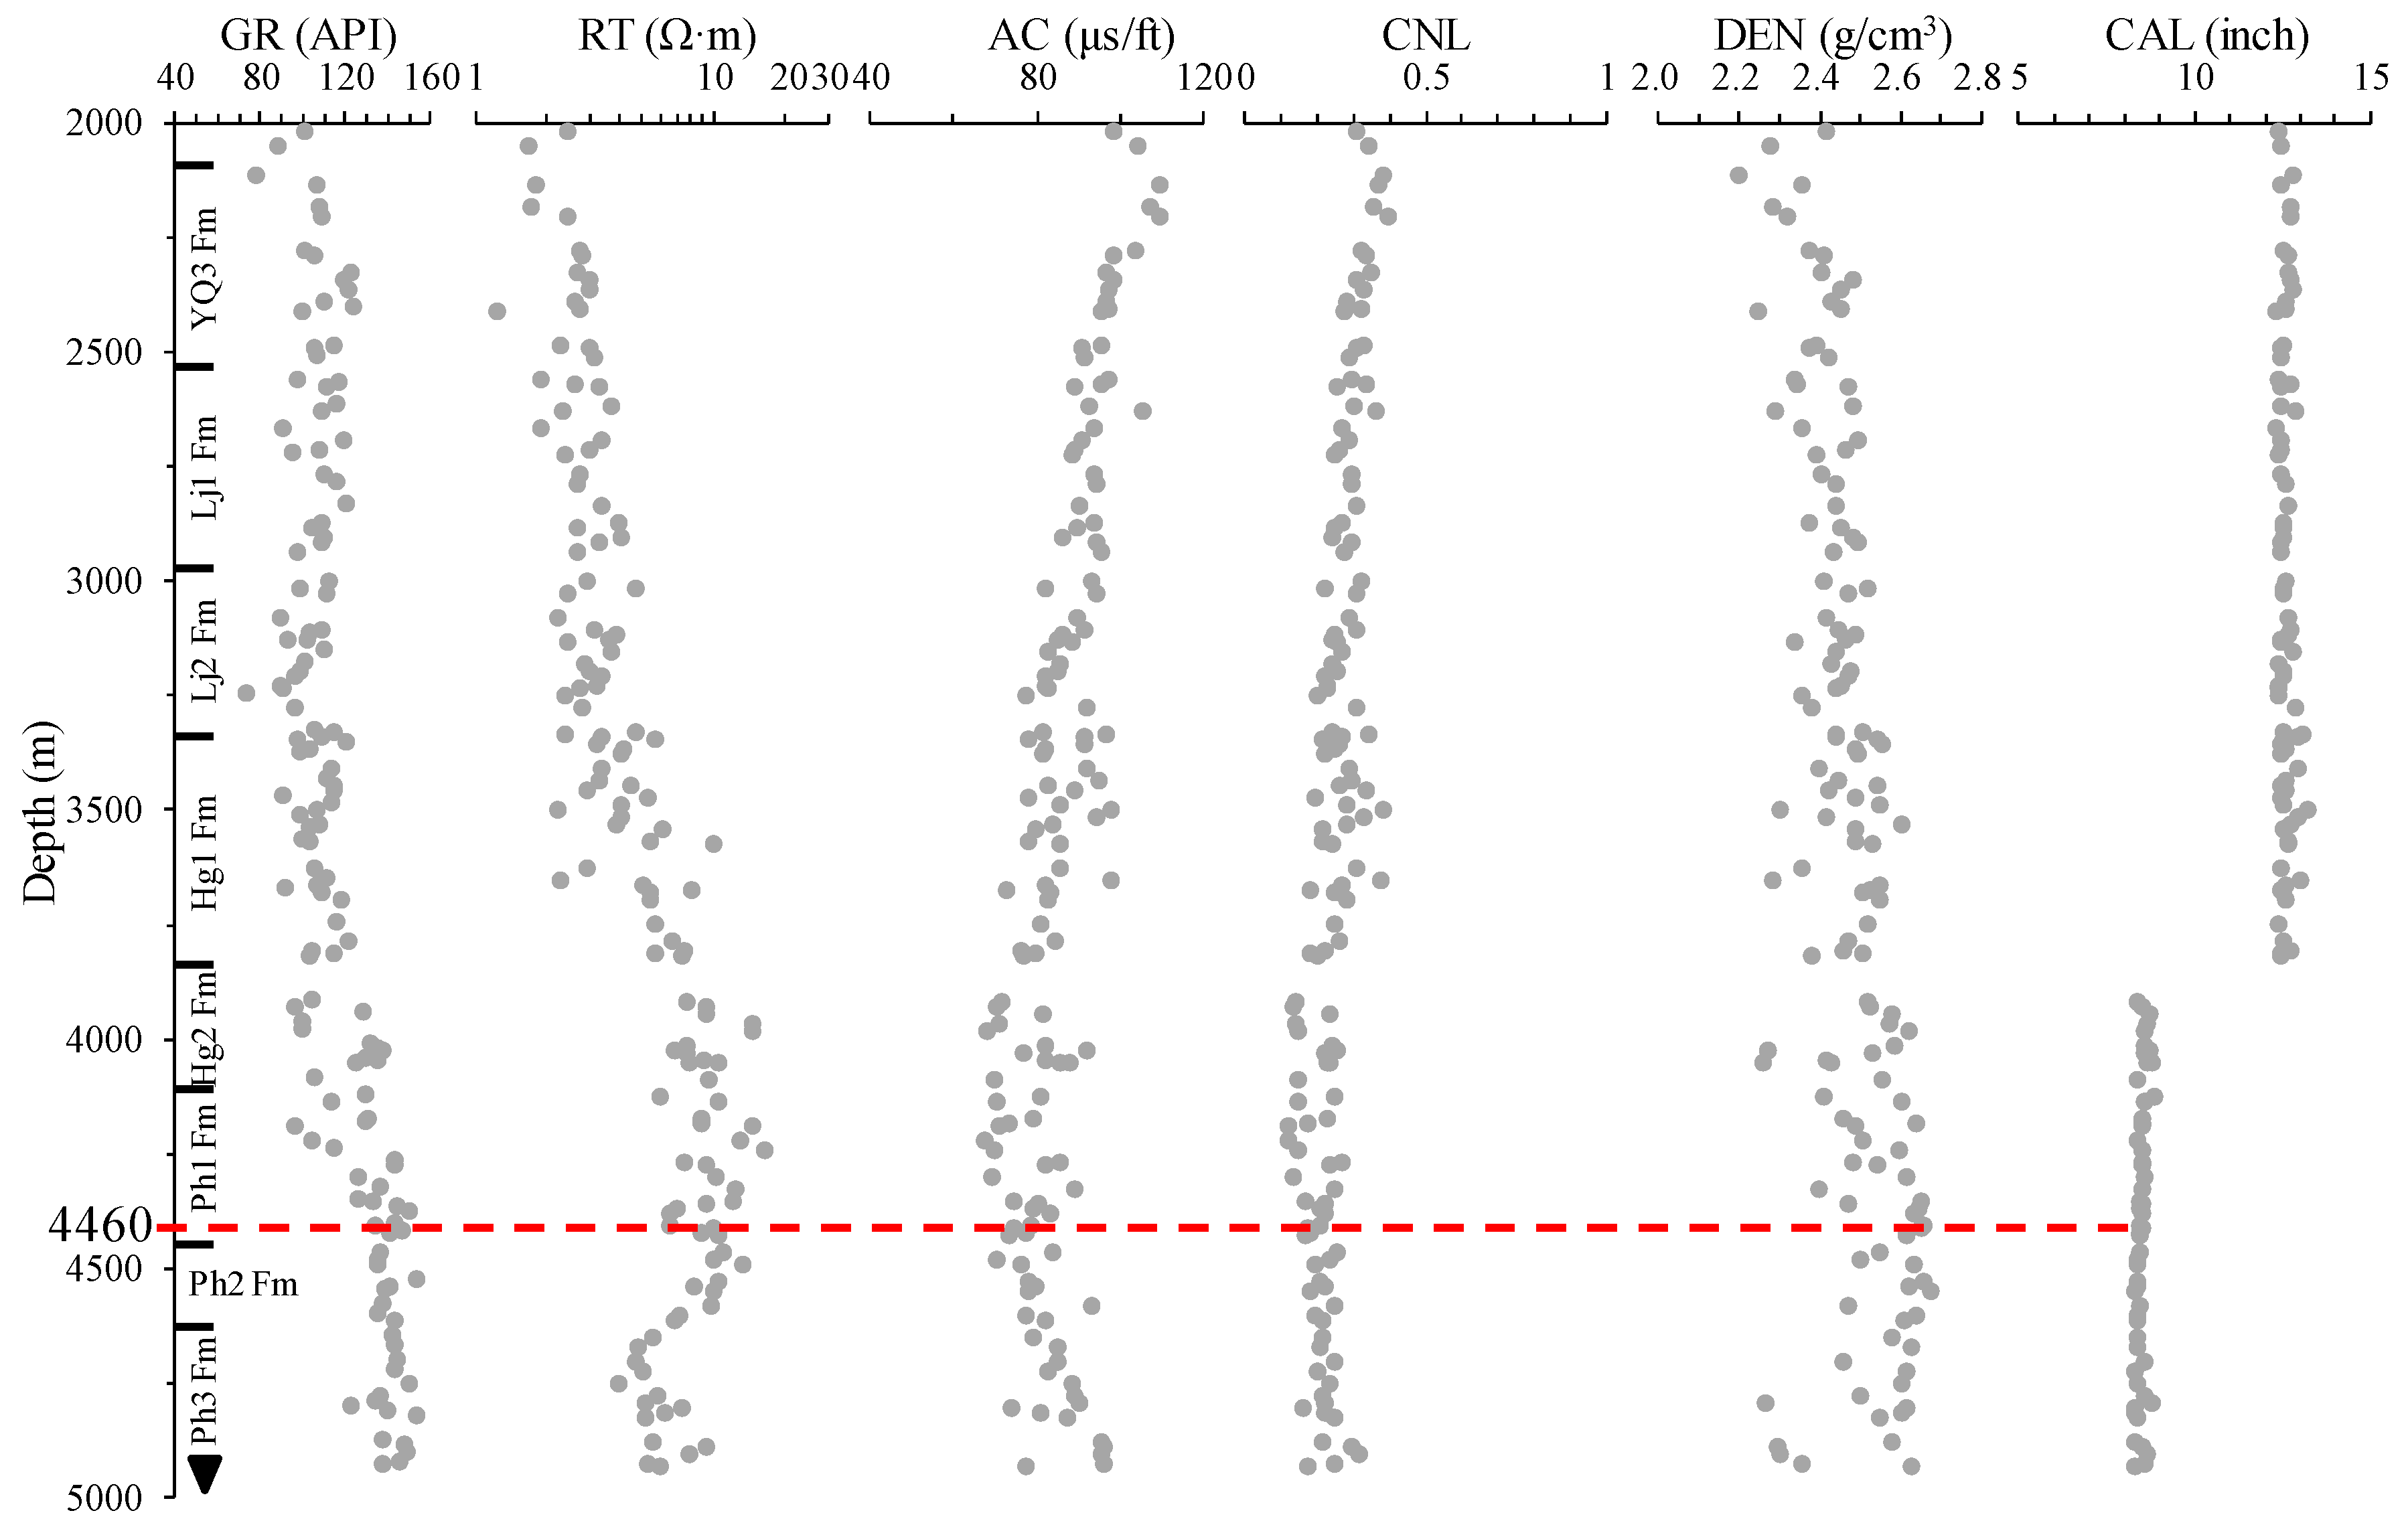
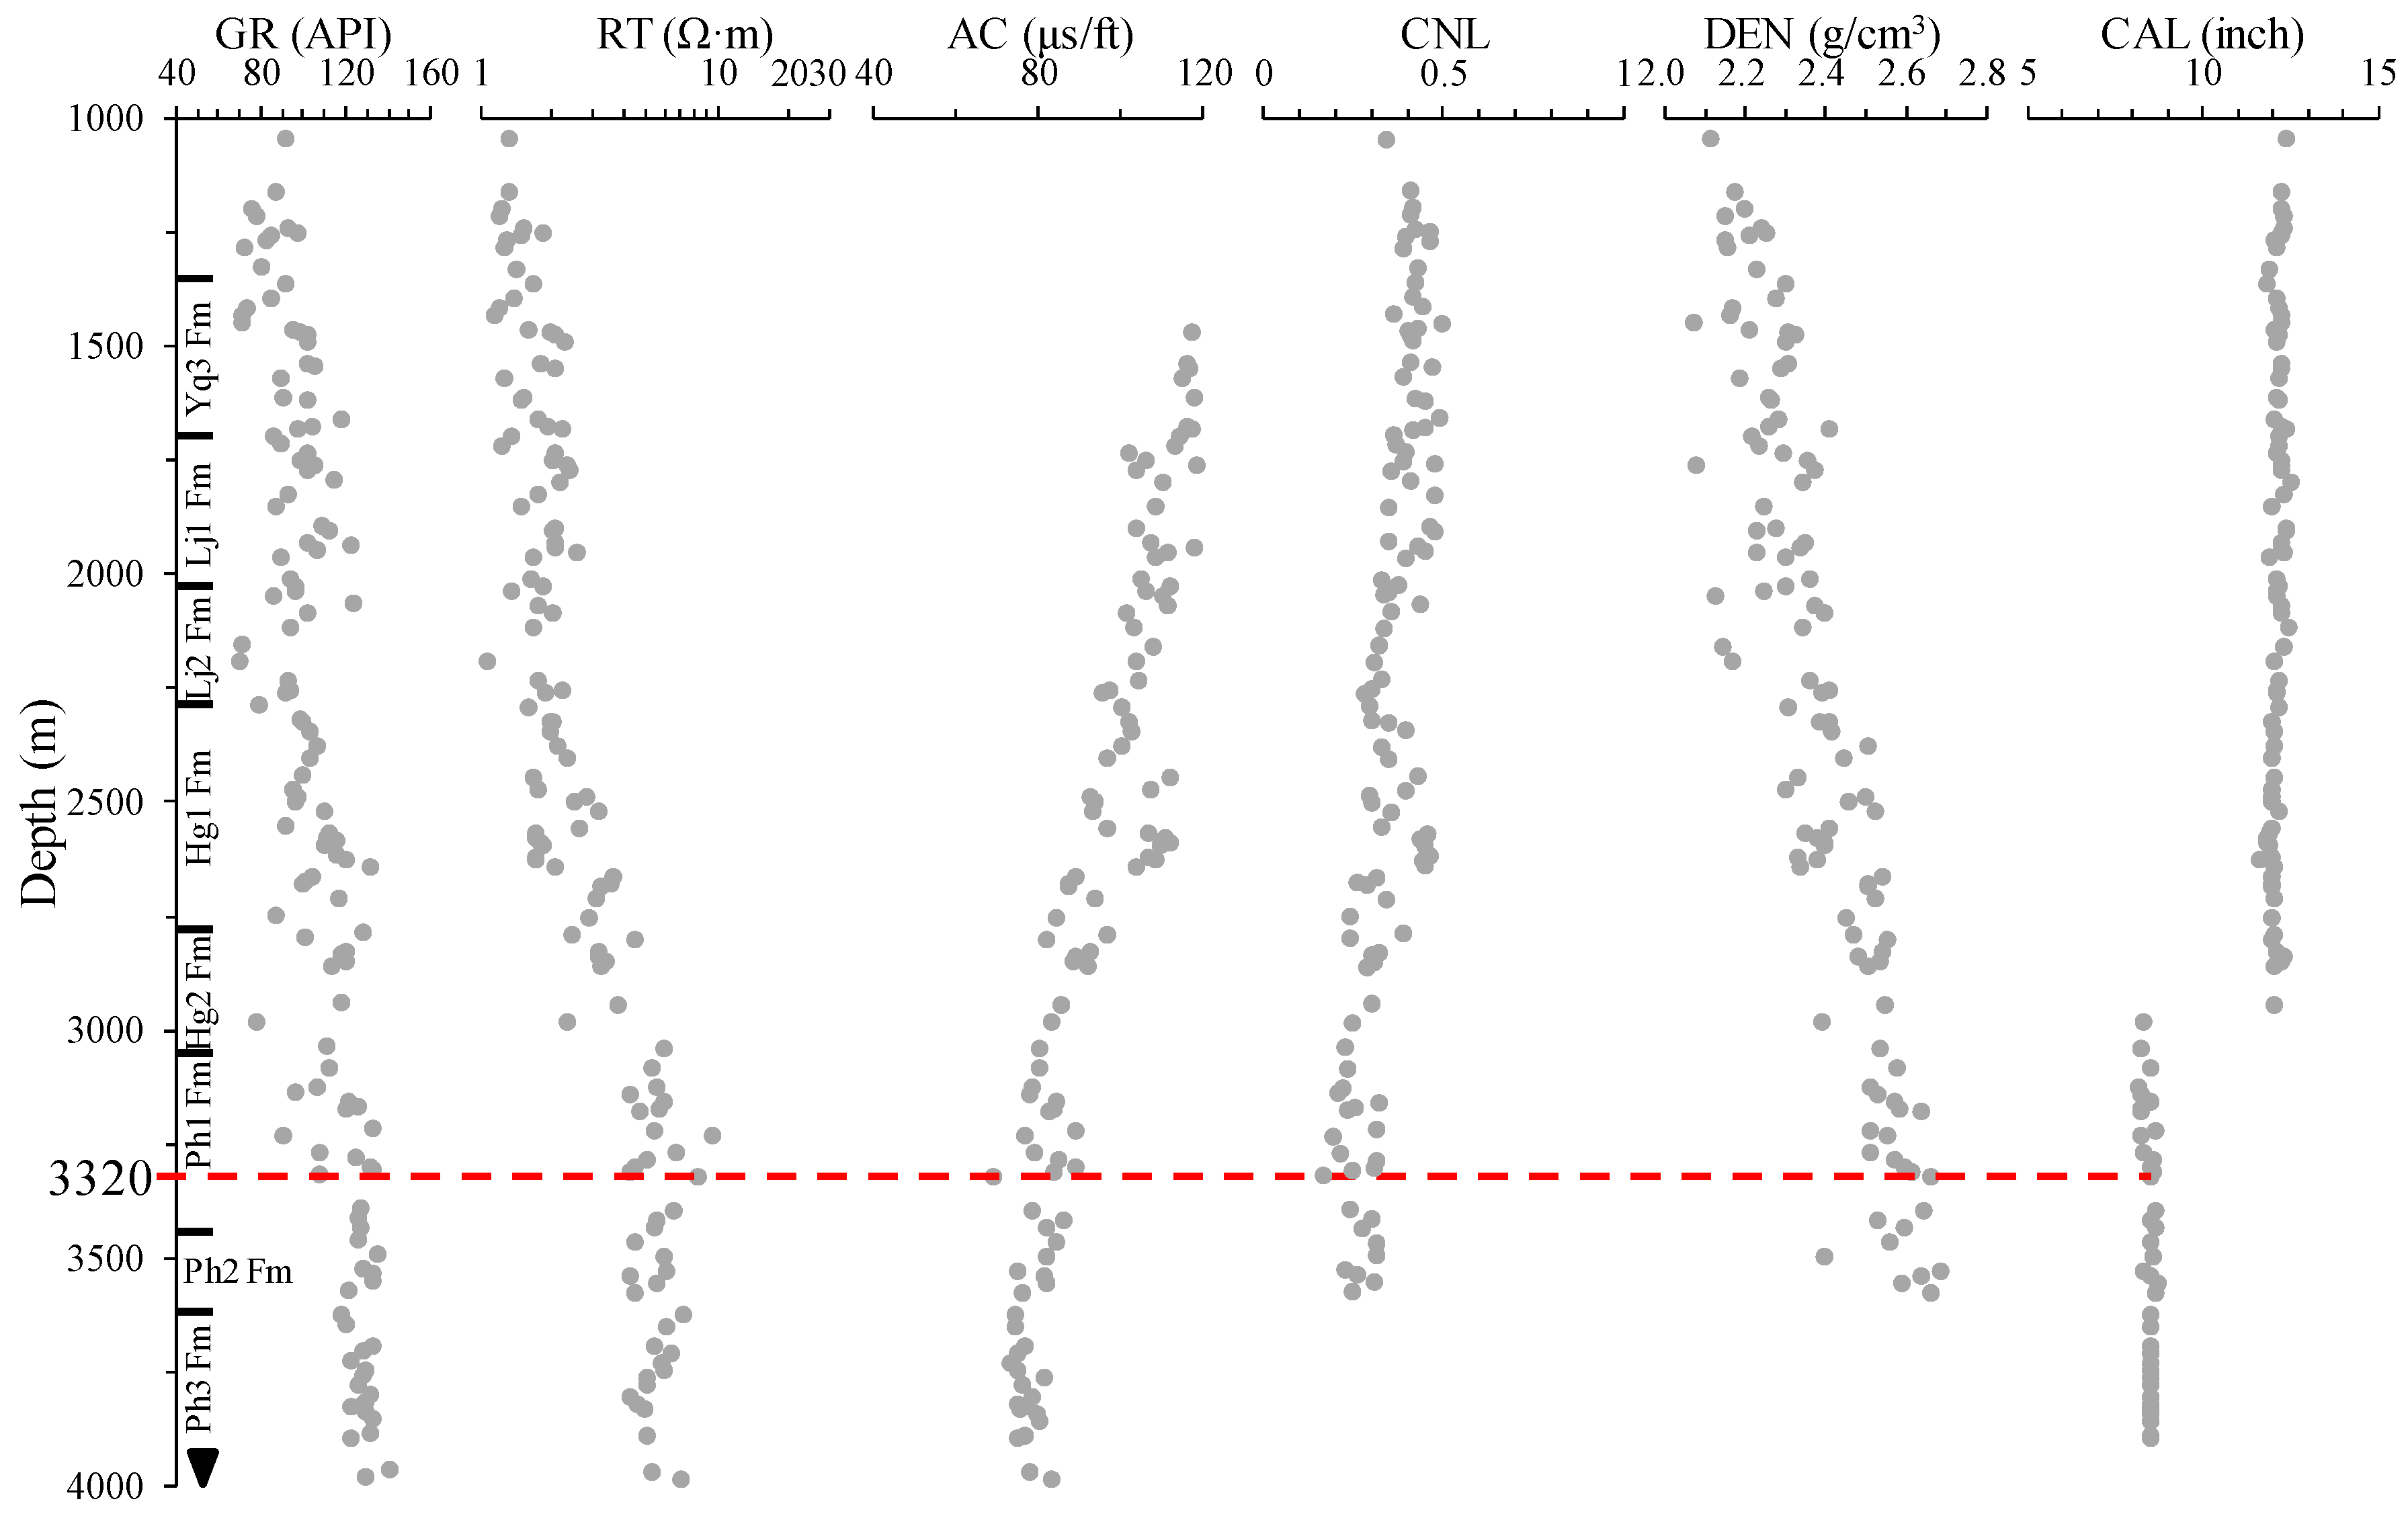
4.1. Logging Characteristics of Mudstones

Figure 3 and Figure 4 show the variation trends of mudstone characteristics of Wells A and D in the Xihu Depression with burial depth, respectively; the RT, AC, and CNL values generally increased with the burial depth. The resistivity values of Well A at 4460 m and Well D at 3320 m showed a downward trend, which was followed by an upward trend. The AC did not continue to decrease at 4460 m of Well A and 3320 m of Well D, respectively, and the value “reversed” and increased.
Well drilling revealed that Wells A and D did not drill through PH3 Fm (Figure 3 and Figure 4). There is no significant difference in the sedimentary environment of mudstones vertically because the average GR logging values of Wells A and D are 117.0 and 120.0 API, respectively. The inversion and increase of RT and AC logging values of Well A and Well D are in the Ph2 Fm; however, the depths are different for Well A and Well D (4460 m and 3320 m, respectively). RT and AC logging values are quite different, which reflects the difference in the compaction process under the complex interaction of physical and chemical diagenesis in different well areas of the Xihu Depression [2,3,9,10,11,29,42,43].

4.2. Whole-Rock Mineralogy

The whole-rock XRD data of mudstone drilling cuttings samples are mainly composed of quartz and clay minerals (Figure 5). The contents of quartz and clay minerals in Well A are 23.6%–38.8% and 47.4%–69.8%, respectively, with an average of 34.4% and 57.7%, respectively. The contents of quartz and clay minerals in Well D are 19.0%–53.5% and 40.1%–68.1%, respectively, with an average of 36.2% and 51.8%, respectively. Figure 5 confirm that there is a minor difference in the contents of quartz and clay minerals of Well A and Well D. Carbonates, feldspar, pyrite, and anhydrite constitute the remaining mineral assemblages. Quantities of carbonates, including calcite, ankerite, and siderite, among which ankerite and dolomite are only distributed in the Pinghu Formation. Feldspar can be categorized into K-feldspar and plagioclase. Anhydrite is only developed in some depth sections of Well A. Pyrite is not developed in the interval where anhydrite is found, and pyrite distribution is in the upper and lower sections.

4.3. Clay Mineral Characteristics

XRD analysis shows that the clay minerals are mainly dominated by silicate, including I/S, illite, chlorite, and kaolinite (Figure 6). For detailed information on clay minerals and their related mineralogical proportions, please refer to Zhao et al. [30]. The composition of smectite in the mixed layer is reduced; the peak intensity of the discrete and independent illite spectrum is high, accounting for a large number of clay minerals (Figure 6). SEM images are consistent with XRD experimental results; that is, with an increase in burial depth and illitization degree, the illite content in the I/S mixed layer increases. This phenomenon shows that an increase in the discrete illite content might come from the growth of clastic illite and the nucleation and growth of authigenic illite in the I/S mixed layer [47].
Figure 6 confirms that the clay mineral data shows that the contents of illite and I/S mixed layer in Well A are 22%–62% and 18%–63%, with an average of 43% and 44%, respectively. The contents of illite and I/S mixed layer in Well D are 18%–61% and 18%–64%, with an average of 40% and 38%, respectively [30]. There is little difference in the illite contents of Well A and D. The average contents of chlorite and kaolinite in Well A are 7.1% and 6.1%, respectively. In comparison, the average contents of chlorite and kaolinite in Well D are 9.7% and 12.3%, respectively [30]. This implies that the clay minerals of Well A and D are mainly illite and the I/S mixed layer. The proportion of illite and smectite in the I/S is approximately 4:1, while illite occupies the main body.

5. Discussion

5.1. Chemical Compaction

The overall longitudinal variation trend and relative size of porosity can be recognized. In addition, the quantitative logging calculation of porosity can also be easily compared with the porosity of the mechanical compaction experiment, which effectively increases the quantitative differentiation of mechanical and chemical compaction.
Figure 7 shows the porosity calculated using the AC (Figure 7A) and DEN (Figure 7B) of Well A and the porosity trend line of pure mechanical compaction of 100% smectite (indicated by the black dotted line) and 50:50 kaolinite–silt (indicated by a solid black line). The burial depth is greater than 2200 m, and the porosity between that of 100% smectite and 50:50 kaolinite–silt produced by pure mechanical compaction; this indicates that the burial depth of Well A is greater than 2200 m, and the mechanical compaction mainly causes the reduction of porosity. At a depth of 2200 m, chemical compaction begins, which leads to a sharp decrease in porosity (Figure 7). Below 4400 m, the porosity of mudstones deviates from the normal decreasing trend line, the porosity increases and “inversion“ occurs. Despite the inversion, the porosity is still controlled by chemical compaction, and the porosity is abnormally increased locally (Figure 7).
Figure 8 reflects the porosity calculated by the AC (Figure 8A) and DEN (Figure 8B) of Well D. The Obvious difference from Well A is that Well D is buried shallowly at 1750 m, and the porosity is reduced, which is mainly caused by the mechanical compaction. When the burial depth is 1750–3300 m, the chemical compaction begins and occurs on a large scale. The porosity decreases linearly, and the reduction range is stronger than that of Well A; that is, the reduction trend of porosity in Well D is “steeper” than that of Well A (Figure 8). Below 3300 m, the porosity of Well D deviates from the normal, and the porosity decreases and increases, showing a small “inversion“ (Figure 8).
The overall change of porosity of Well A and D is consistent, which further proves that the sedimentary environment and burial denudation background of the two wells are similar in the Xihu Depression, East China Sea Shelf Basin. Obvious differences: (1) the boundary of chemical compaction depth experienced by mudstones is inconsistent. Well A is 2200 m (Figure 7), and Well D is 1750 m (Figure 8). (2) The porosity decreases sharply from the normal decreasing trend, and the burial depth that begins to increase varies, namely, Well A is 4400 m (Figure 7), and Well D is 3300 m (Figure 8). Considering that the composition of Well A and Well D is similar (Figure 5), and the difference in clay mineral composition is not obvious, it shows that the composition could not cause a significant difference in burial depth between the two wells. Clay mineral transformation and temperature distribution should be the main factors controlling the compaction process in the Xihu Depression after eliminating the above factors affecting compaction [2,3,8,15,19,42,48,49,50,51].

5.2. Clay Mineral Transformation

Mudstone clay minerals include illite, chlorite, kaolinite, and I/S mixed layer. The main diagenetic transformation relationship of clay minerals is as follows:
  • Illitization. Illitization of I/S and kaolinite is the most important transformation process in the diagenetic process of clay minerals, which are usually illite and SiO2. The simplified reaction equation is [52]:
Smectite + K+ → Illite + SiO2 + H2O
Kaolinite + K+ → Illite + SiO2 + H2O
The clay minerals in the samples are mainly illite and I/S mixed layer, and the content of smectite is 0, which indicates that smectite in different depth sections has undergone illitization. The transformation of original smectite into illite usually begins at 50–60 °C, and the transformation from kaolinite to illite occurs at a relatively high burial temperature (>200 °C) [53]. The main controlling factors of illitization are temperature and potassium availability [54]. Kaolinite and I/S mixed layer decrease rapidly after 120 °C, illite content increases gradually, and the dissolution of K-feldspar leads to K+ production (Figure 9, Figure 10 and Figure 11). Conversion of I/S to illite will release a variety of elements, including Na+, Mg2+, Si4+, Ca2+, Fe2+, and H2O [55]. Conversion of I/S to illite releases various elements, including Na+, Mg2+, Si4+, Ca2+, Fe2+, and H2O [55]. The above process not only leads to the rapid increase in illite content, but also provides part of the Fe2+ content for forming pyrite (Figure 9). Illite content does not show an obvious increasing trend between 65 and 105 °C (Figure 10); the content of the I/S mixed layer increases, indicating that the generated illite dissolves and partially transforms into I/S mixed layer (Figure 11A).
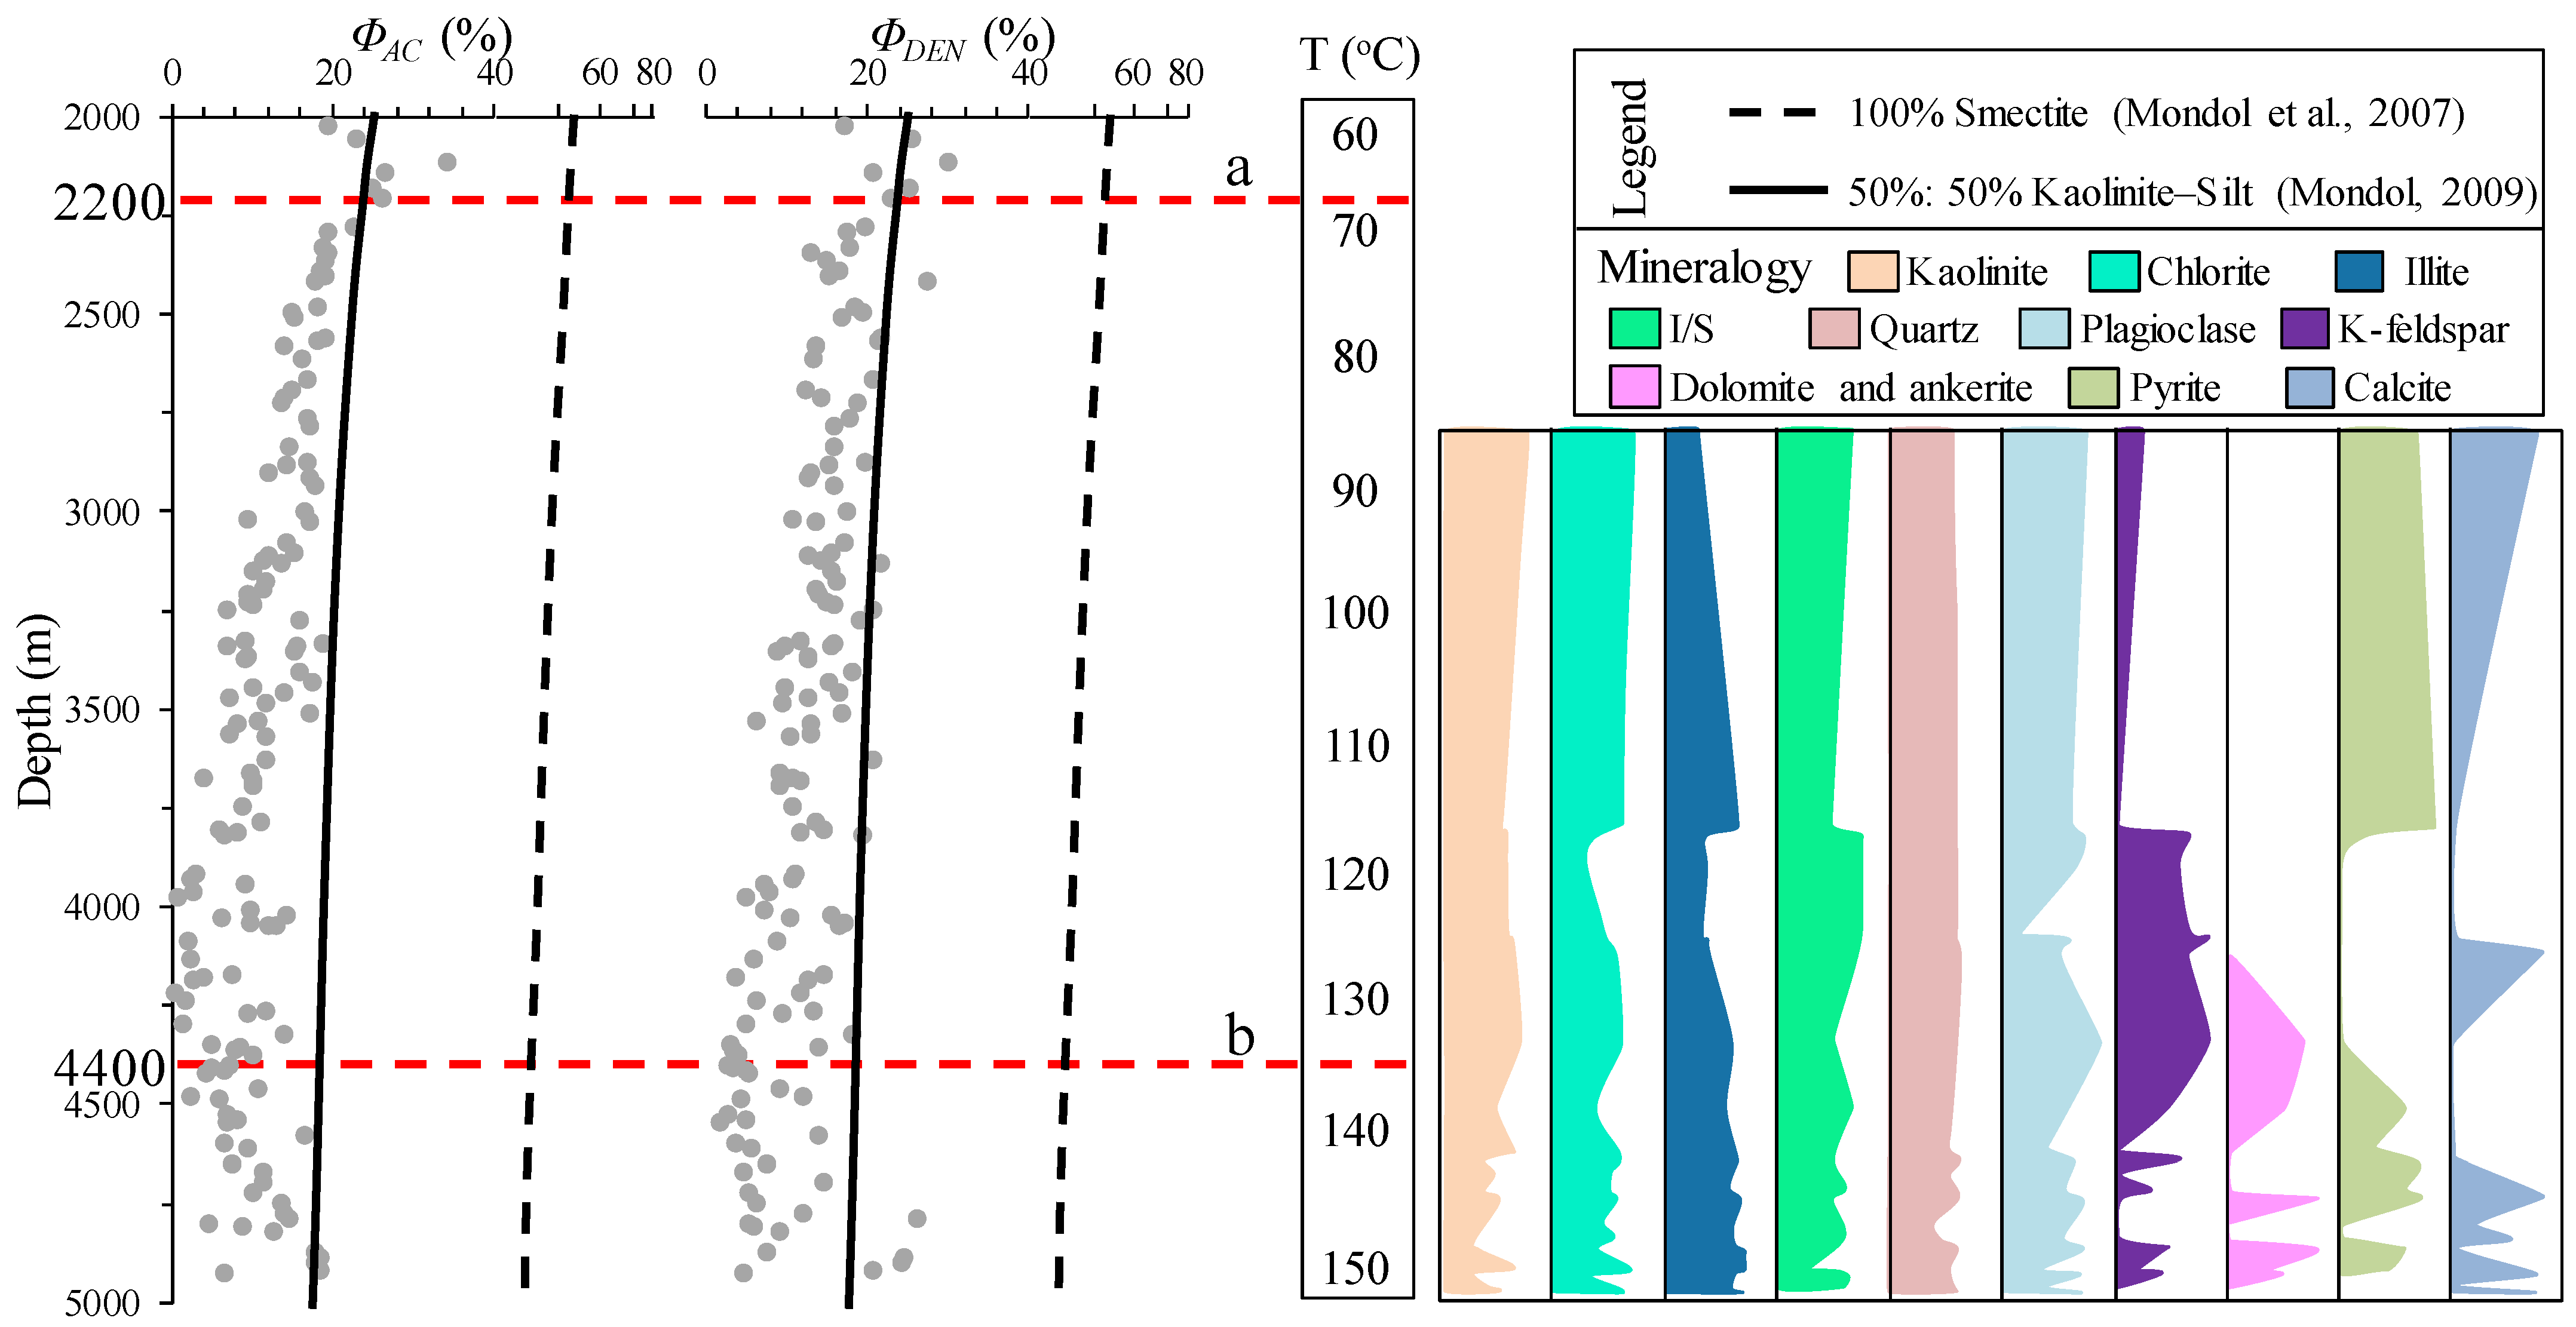
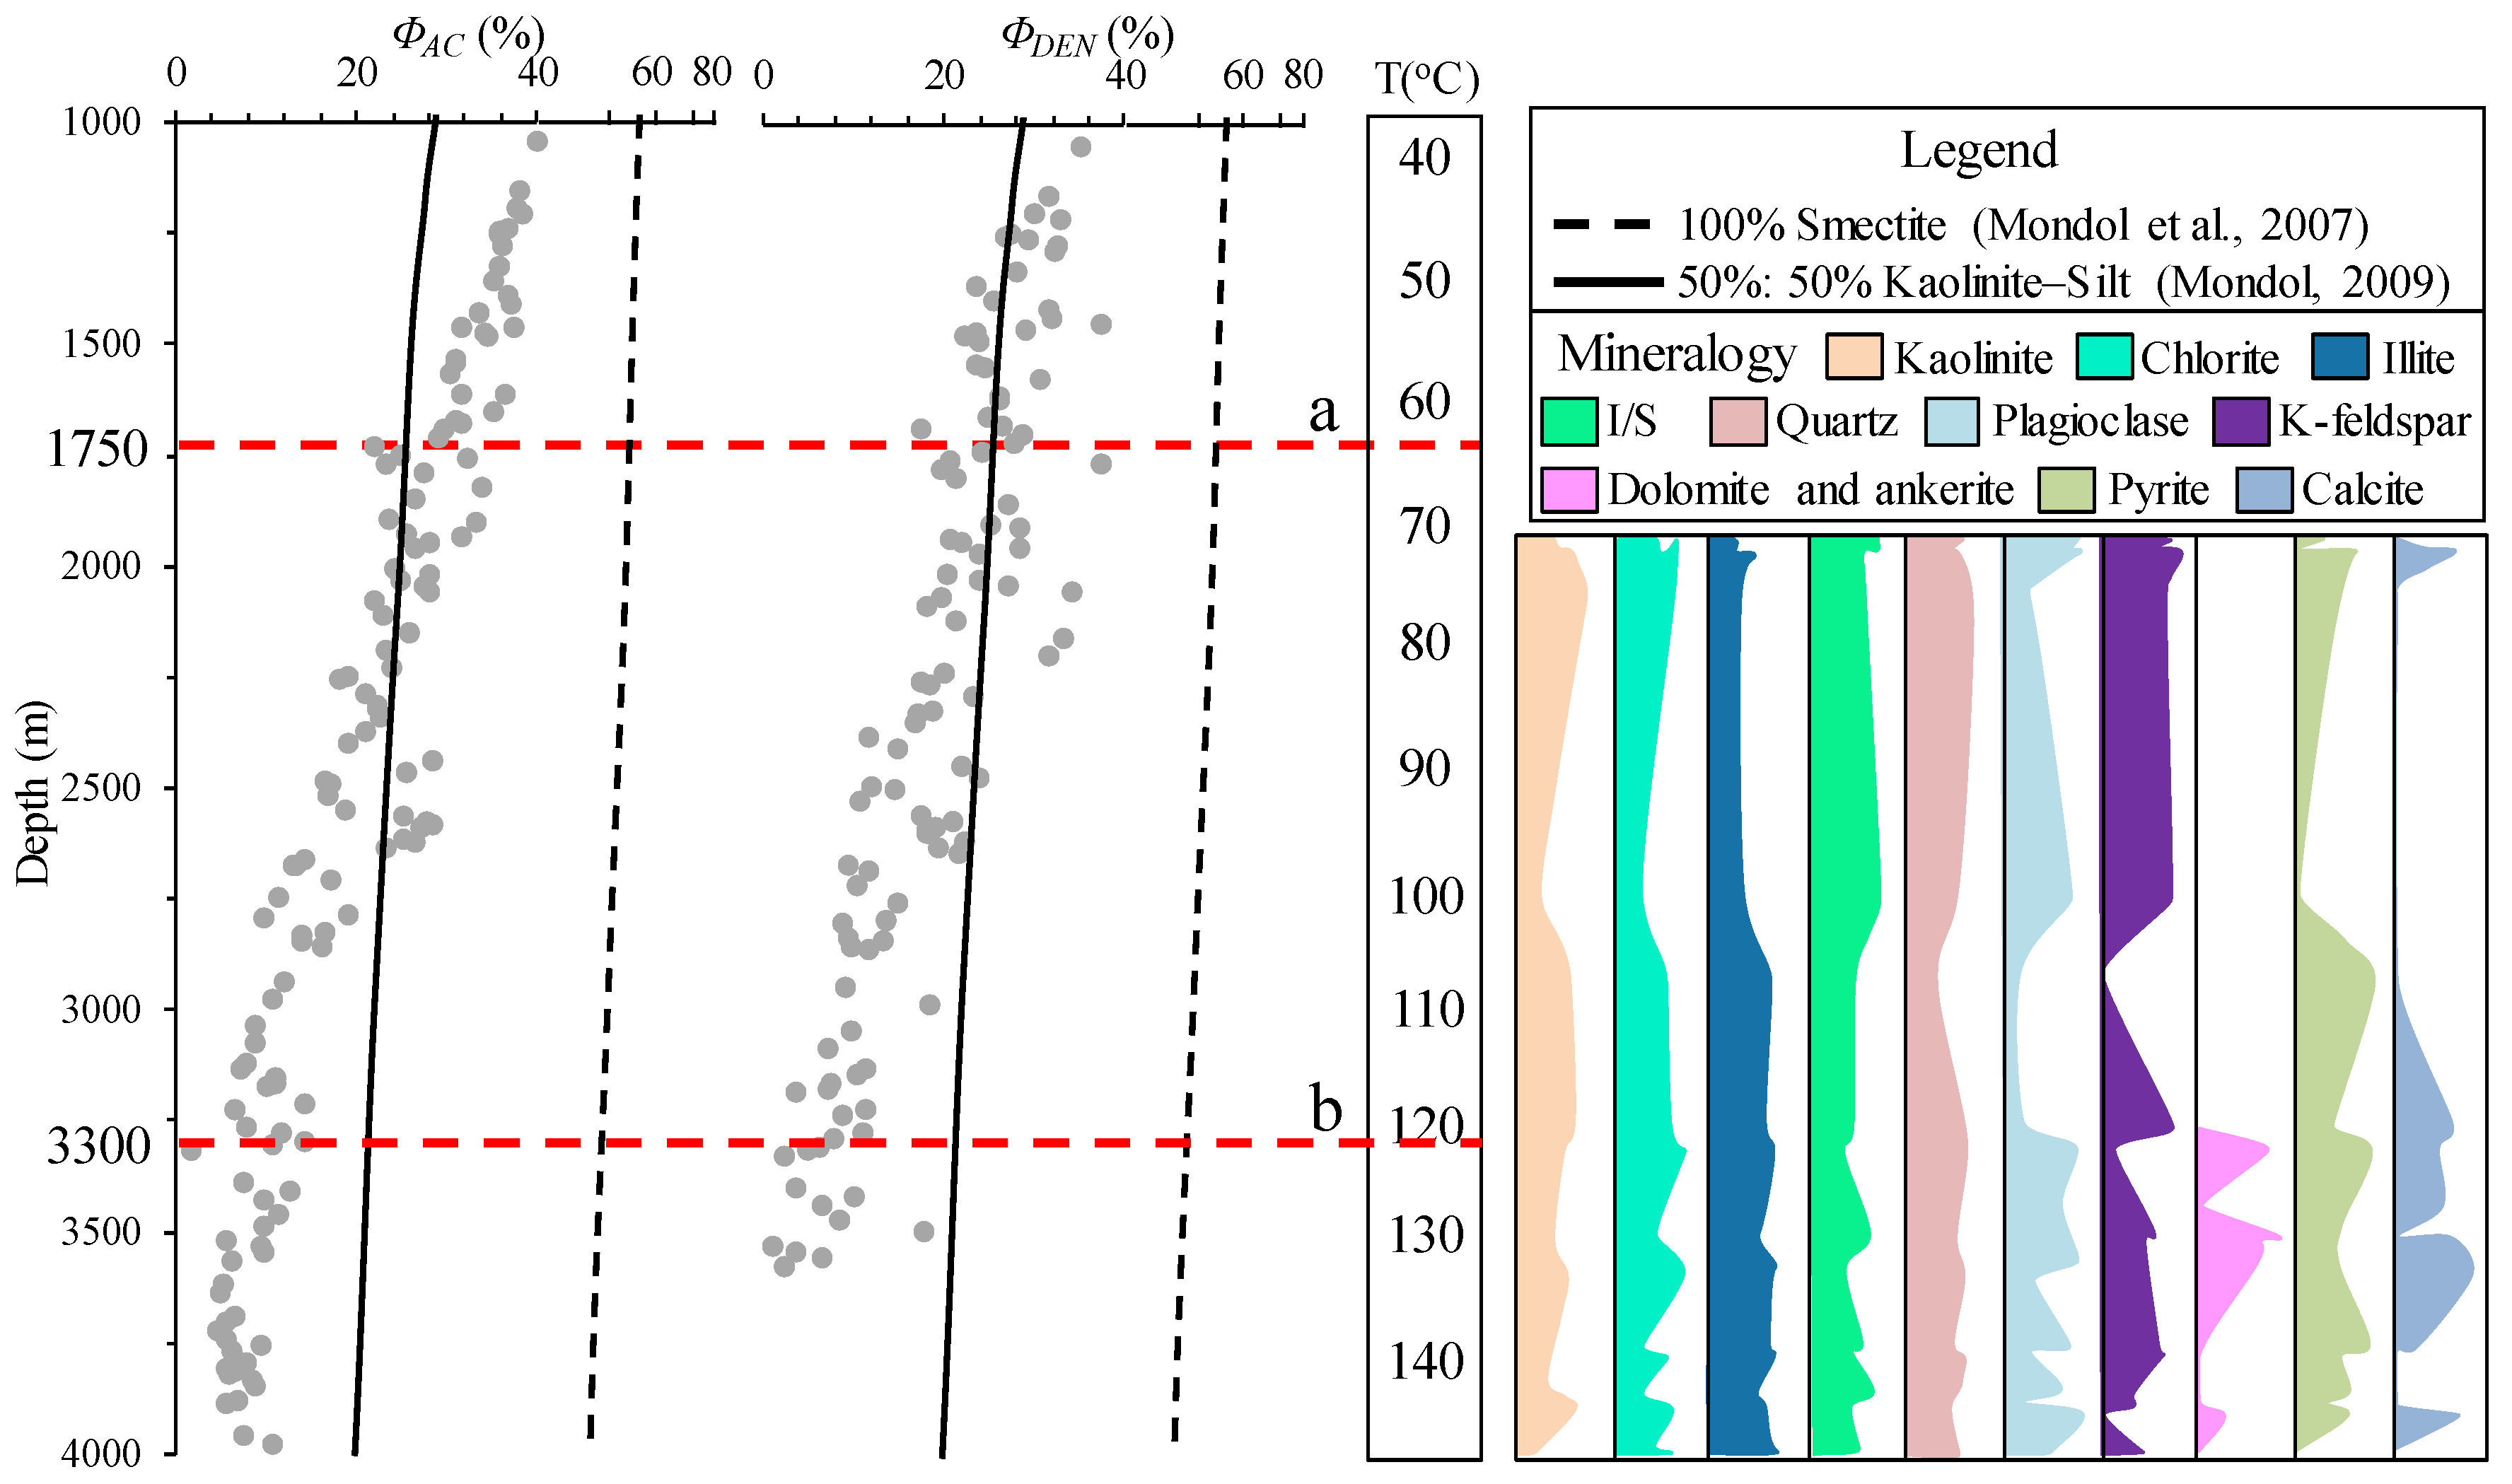
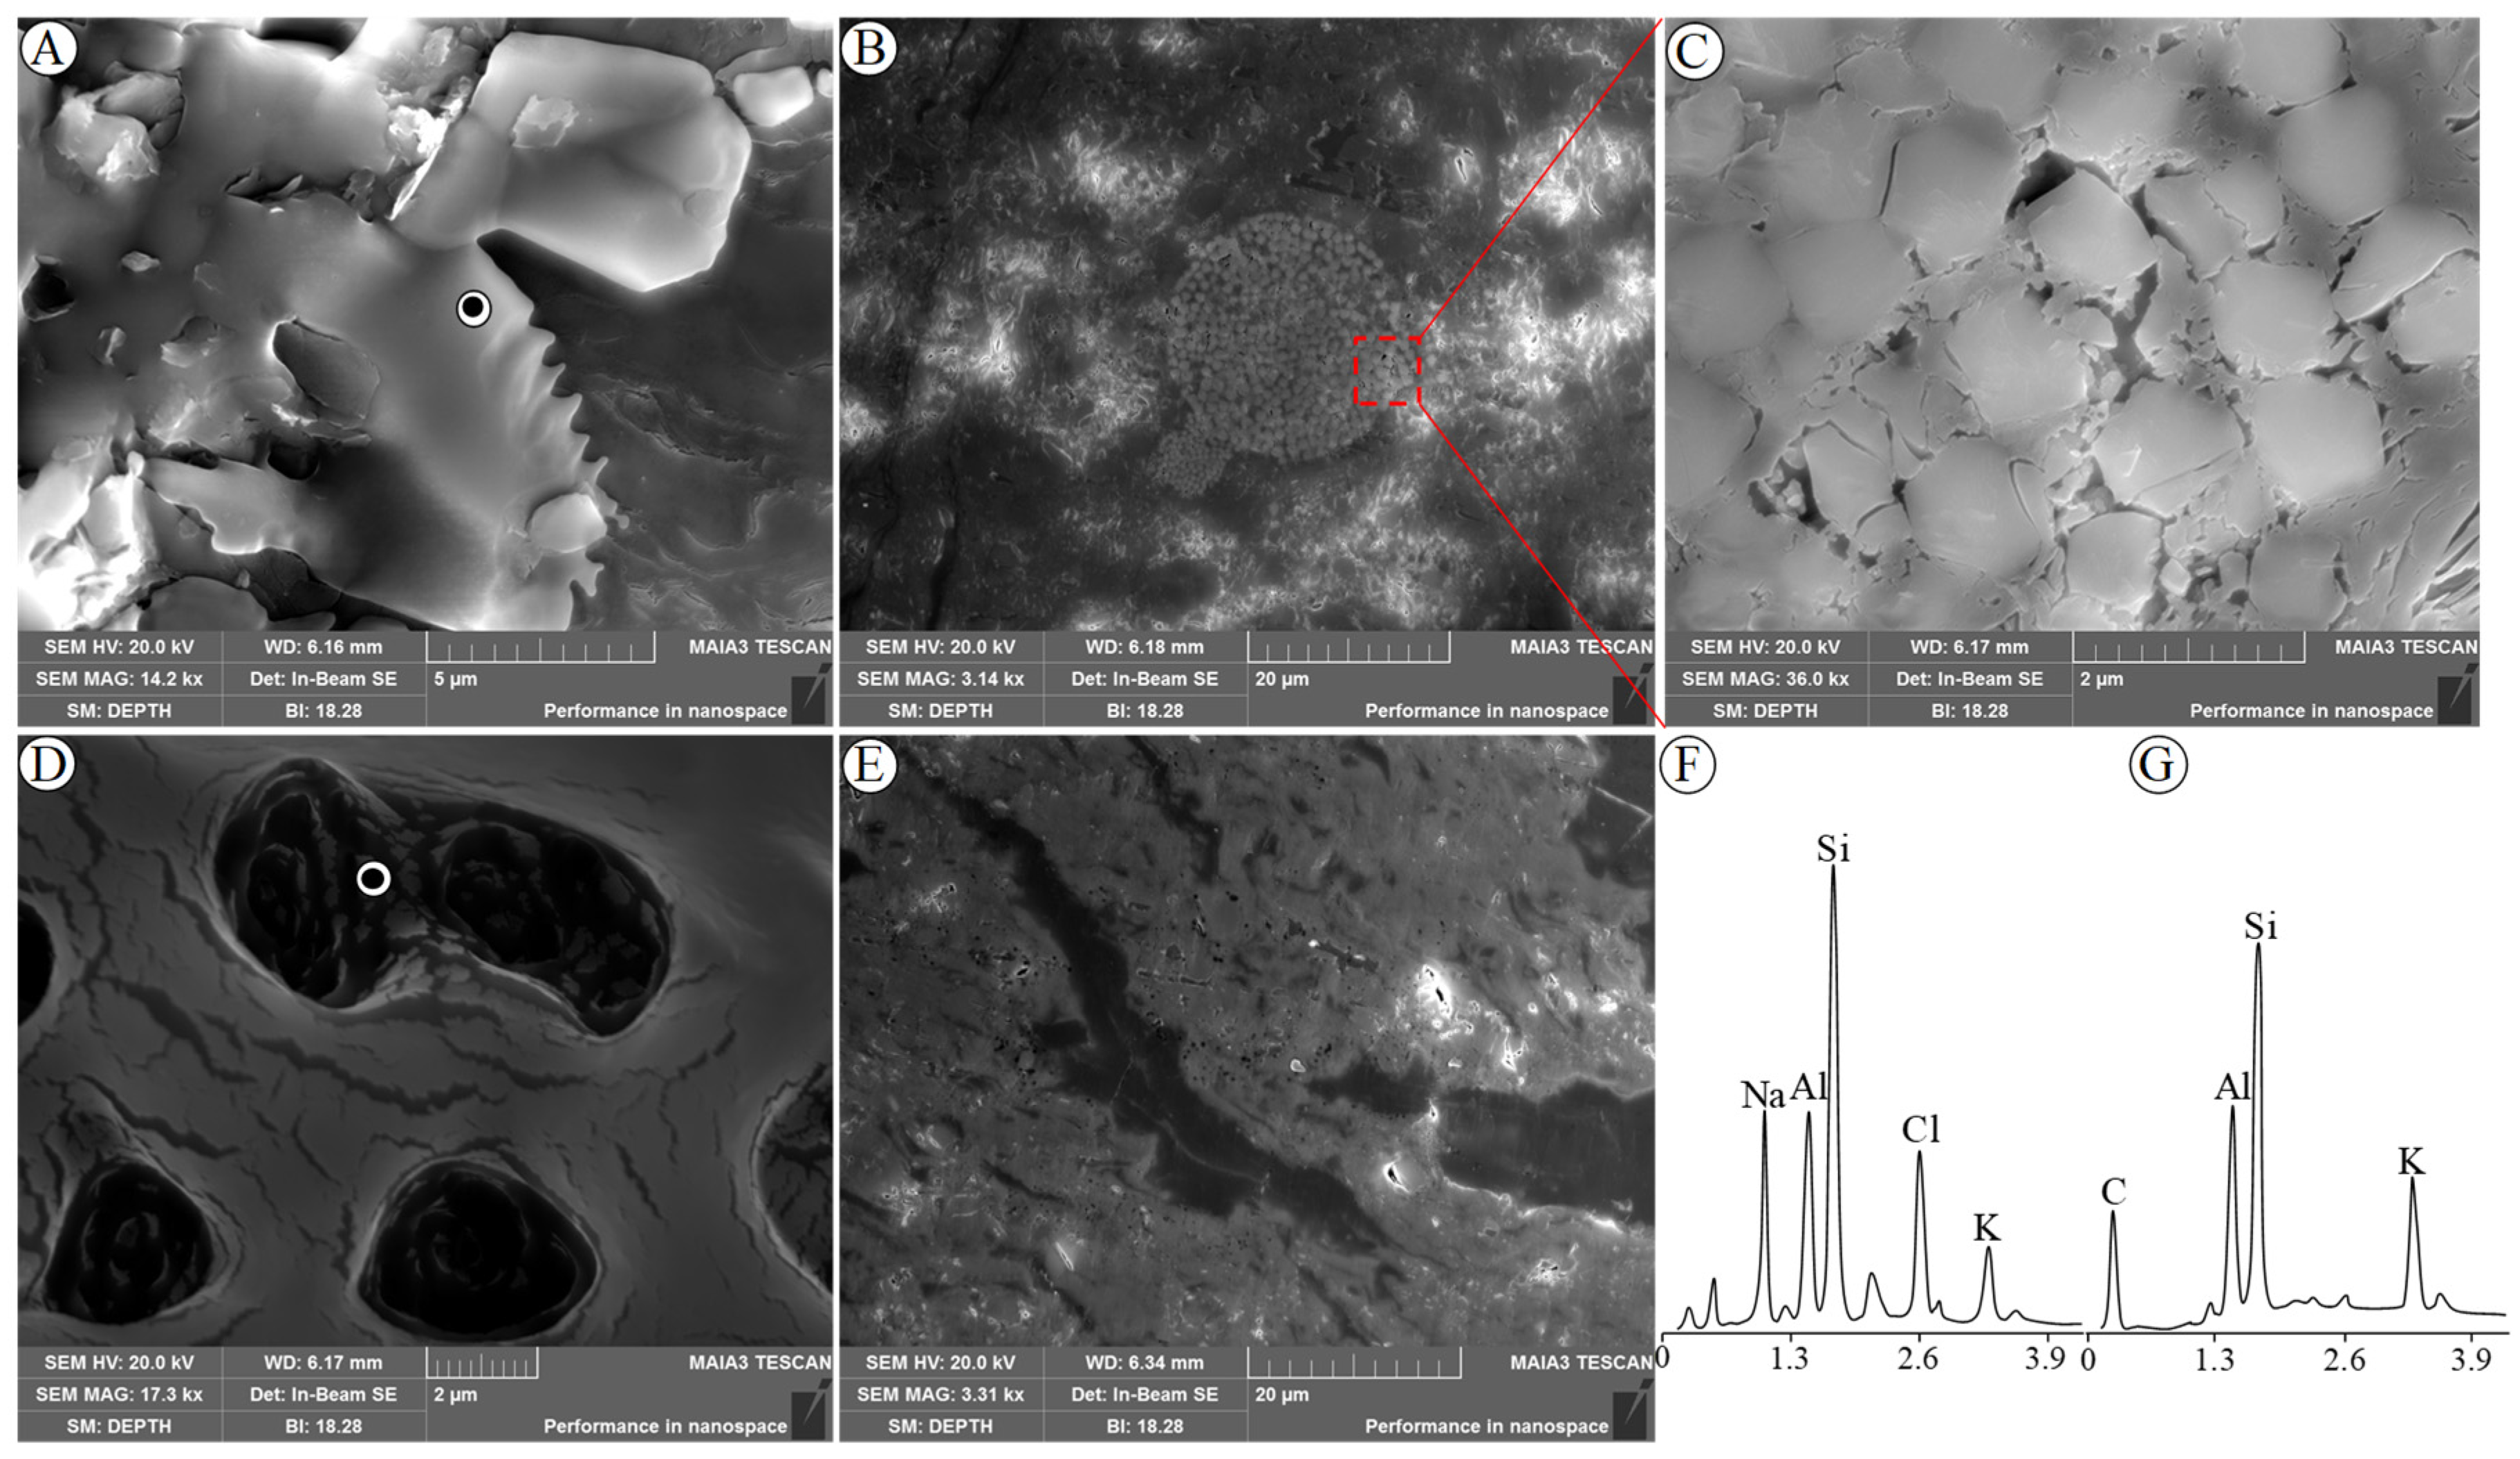
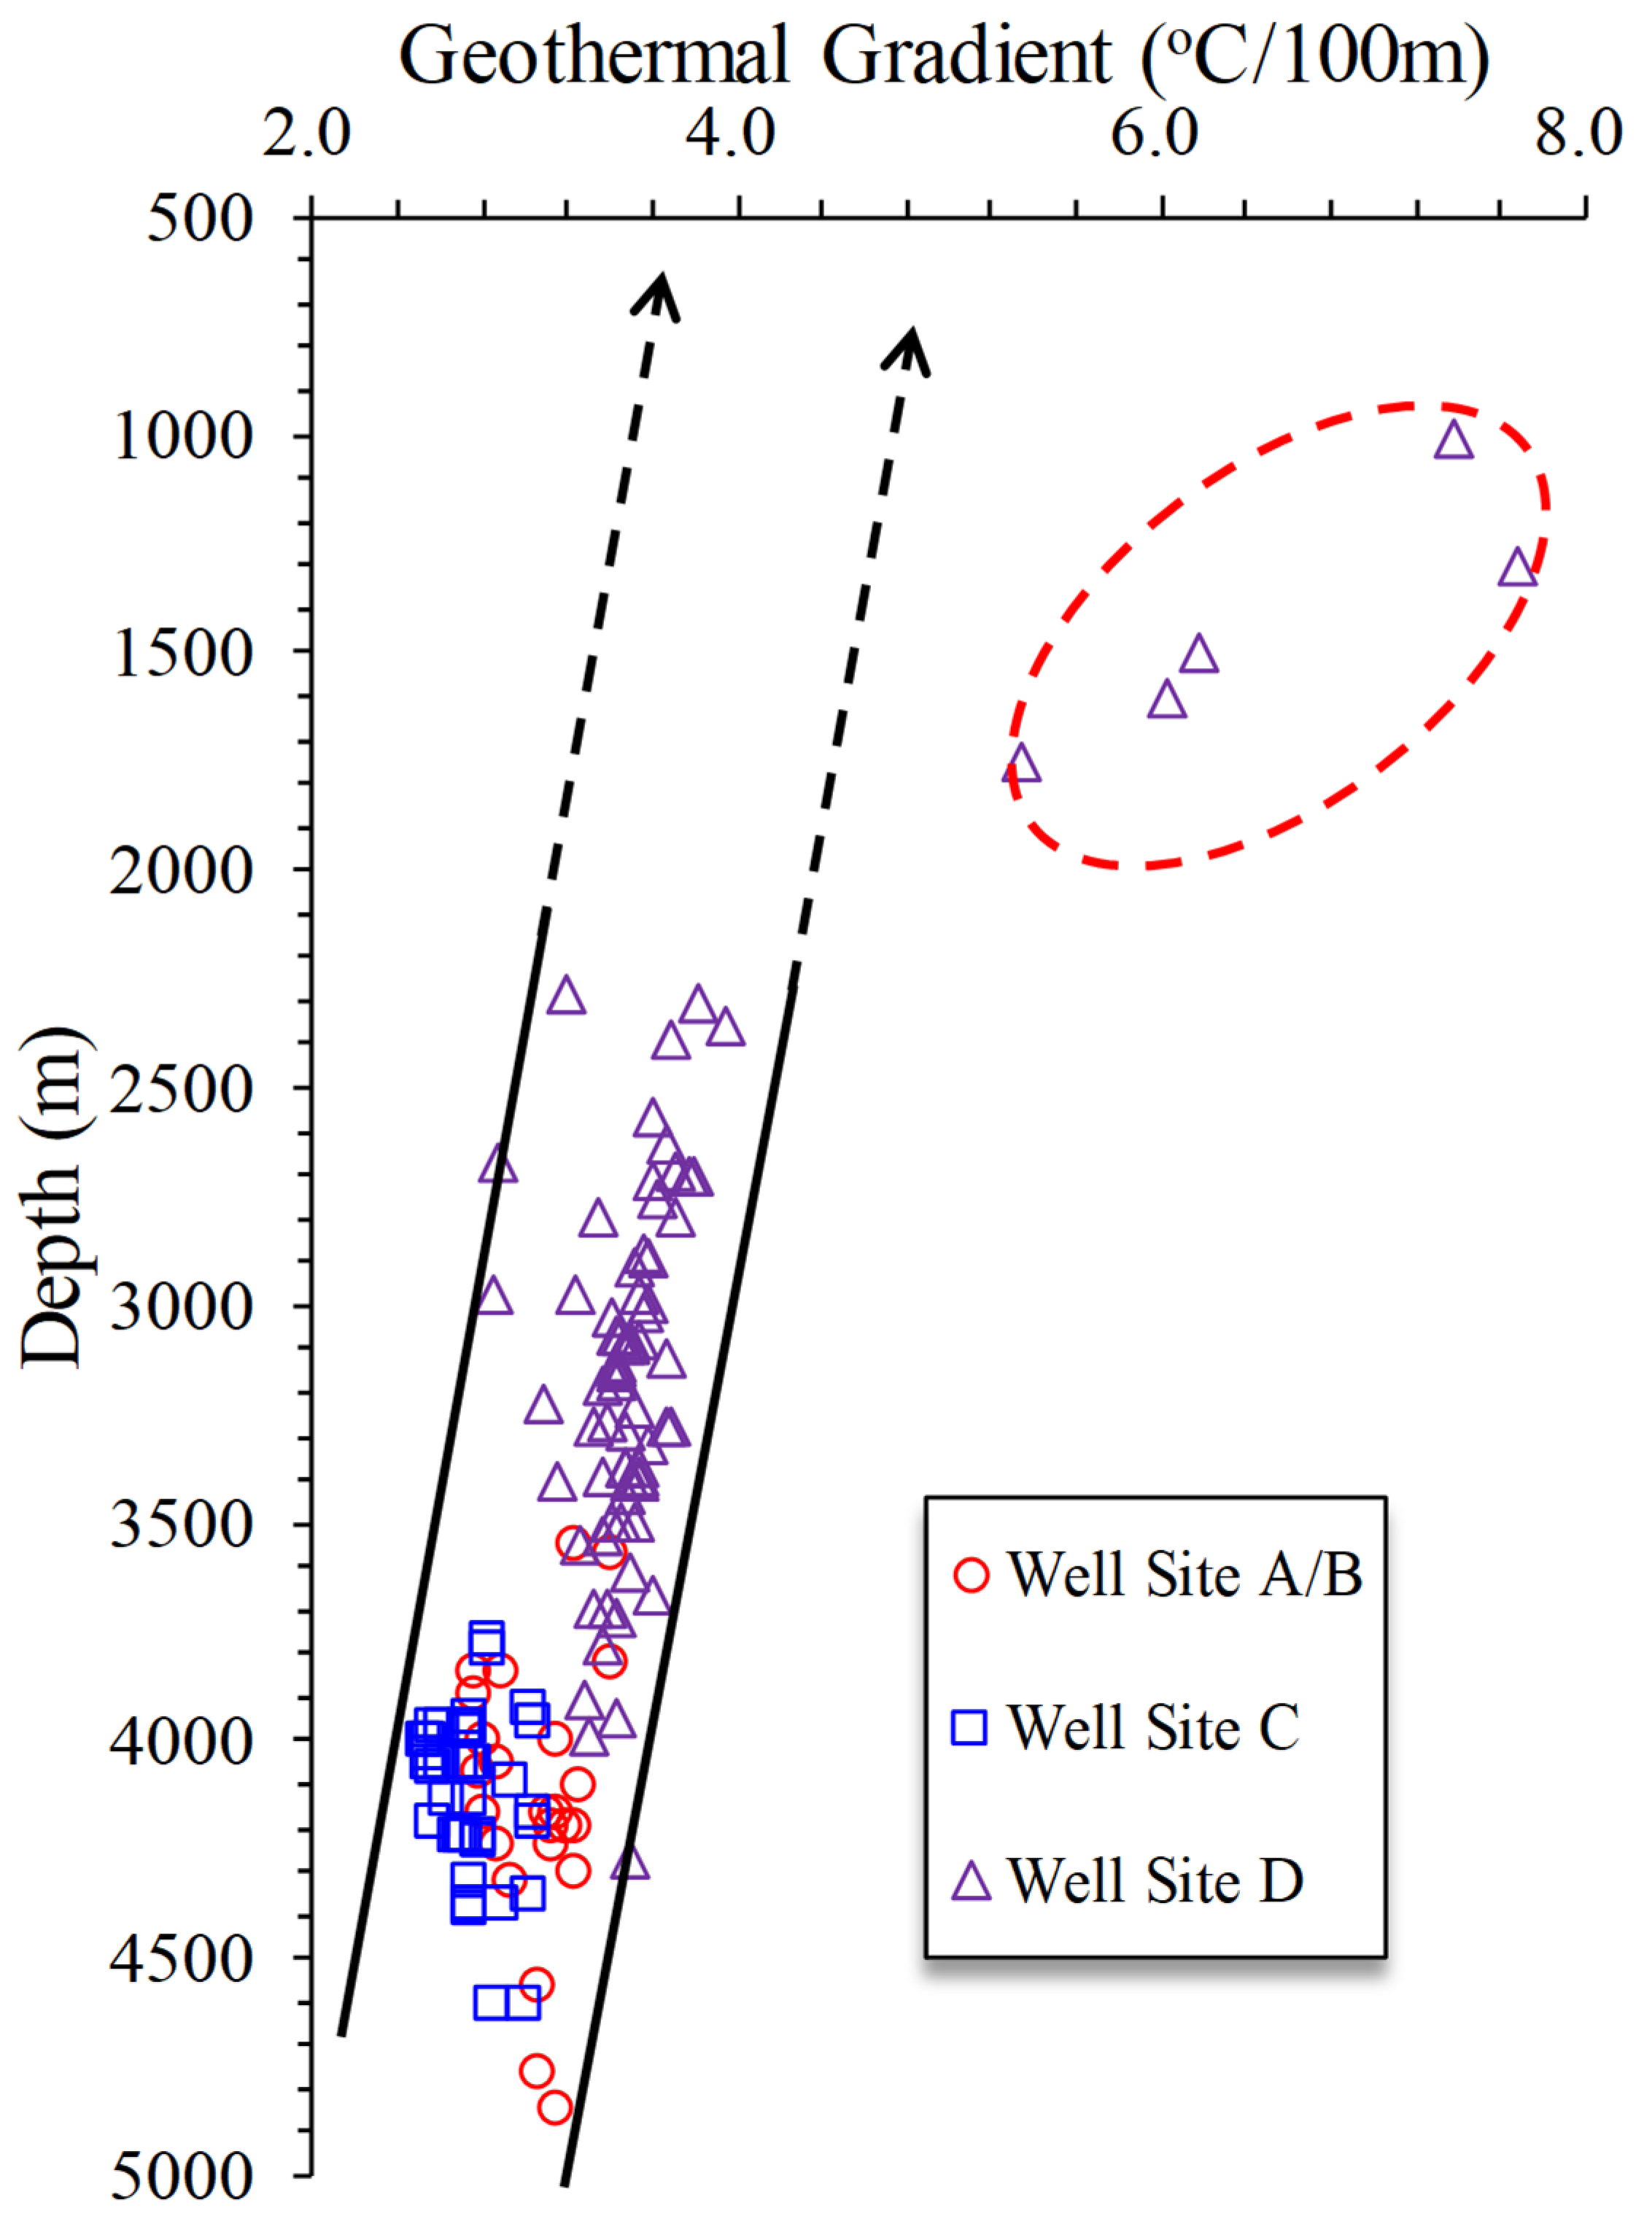
  • Quartz. Reaction Equations (3) and (4) show that the illitization process occurs in a relatively closed diagenetic system, and the resulting SiO2 rapidly reaches the supersaturated state [56]. The saturated solution of high concentration SiO2 and the quartz’s slow growth lead to quartz crystals’ rapid precipitation and the rapid increase in content at the temperature of 60–80 °C [52]. However, the illitization of the multi-stage I/S mixed layer and the illitization of some kaolinite do not cause significant changes in quartz content at 90–145 °C (Figure 9). Figure 10 shows that the quartz content of Well D decreases in the range of 80–105 °C. This phenomenon is explained as follows: (1) no large-scale illitization of clay minerals within this temperature range, and the illite content does not change, so the SiO2 concentration is not controlled by the illitization process (Figure 10). (2) the diagenetic environment is relatively open, the saturated solution of high concentration SiO2 quickly migrates to the adjacent sandstone, and the quartz content does not change significantly (Figure 9). (3) The stratigraphic unit is a diagenetic environment with frequent acid-alkaline interaction [36,57]. The precipitation rate of SiO2 is almost the same as the dissolution rate. The dissolved Si4+ combines with OH to form chlorite (Figure 9 and Figure 10 [58]). Si4+ combines with K+ to form K-feldspar (Figure 11D,F [59]), resulting in no significant change or decreasing trend in the overall content of quartz (Figure 9 and Figure 10). In other words, quartz cementation during illitization reaction is a pore failure mechanism and non-pore protection mechanism [60].
  • Chlorite. Two different dissolution precipitation mechanisms for the formation of chlorite. The first is the dissolution-precipitation mechanism of pyrite and plagioclase. Pyrite and plagioclase are dissolved in an acidic environment to provide cations such as Fe2+ and Al3+ at temperatures exceeding 120 °C, which combine with OH in pore fluid to form chlorite (Figure 9 [61]). The second is the dissolution-precipitation mechanism of the I/S mixed layer. I/S mixed layer is dissolved and combined with Fe2+, Mg2+, Si4+, Al3+, and OH in pore fluid to form chlorite-smectite (C/S) mixed layer intermediate product, and then transformed into chlorite (Figure 10 [58]). Well A shows that the chlorite content increases after 125 °C, accompanied by a decreasing trend of I/S (Figure 9).
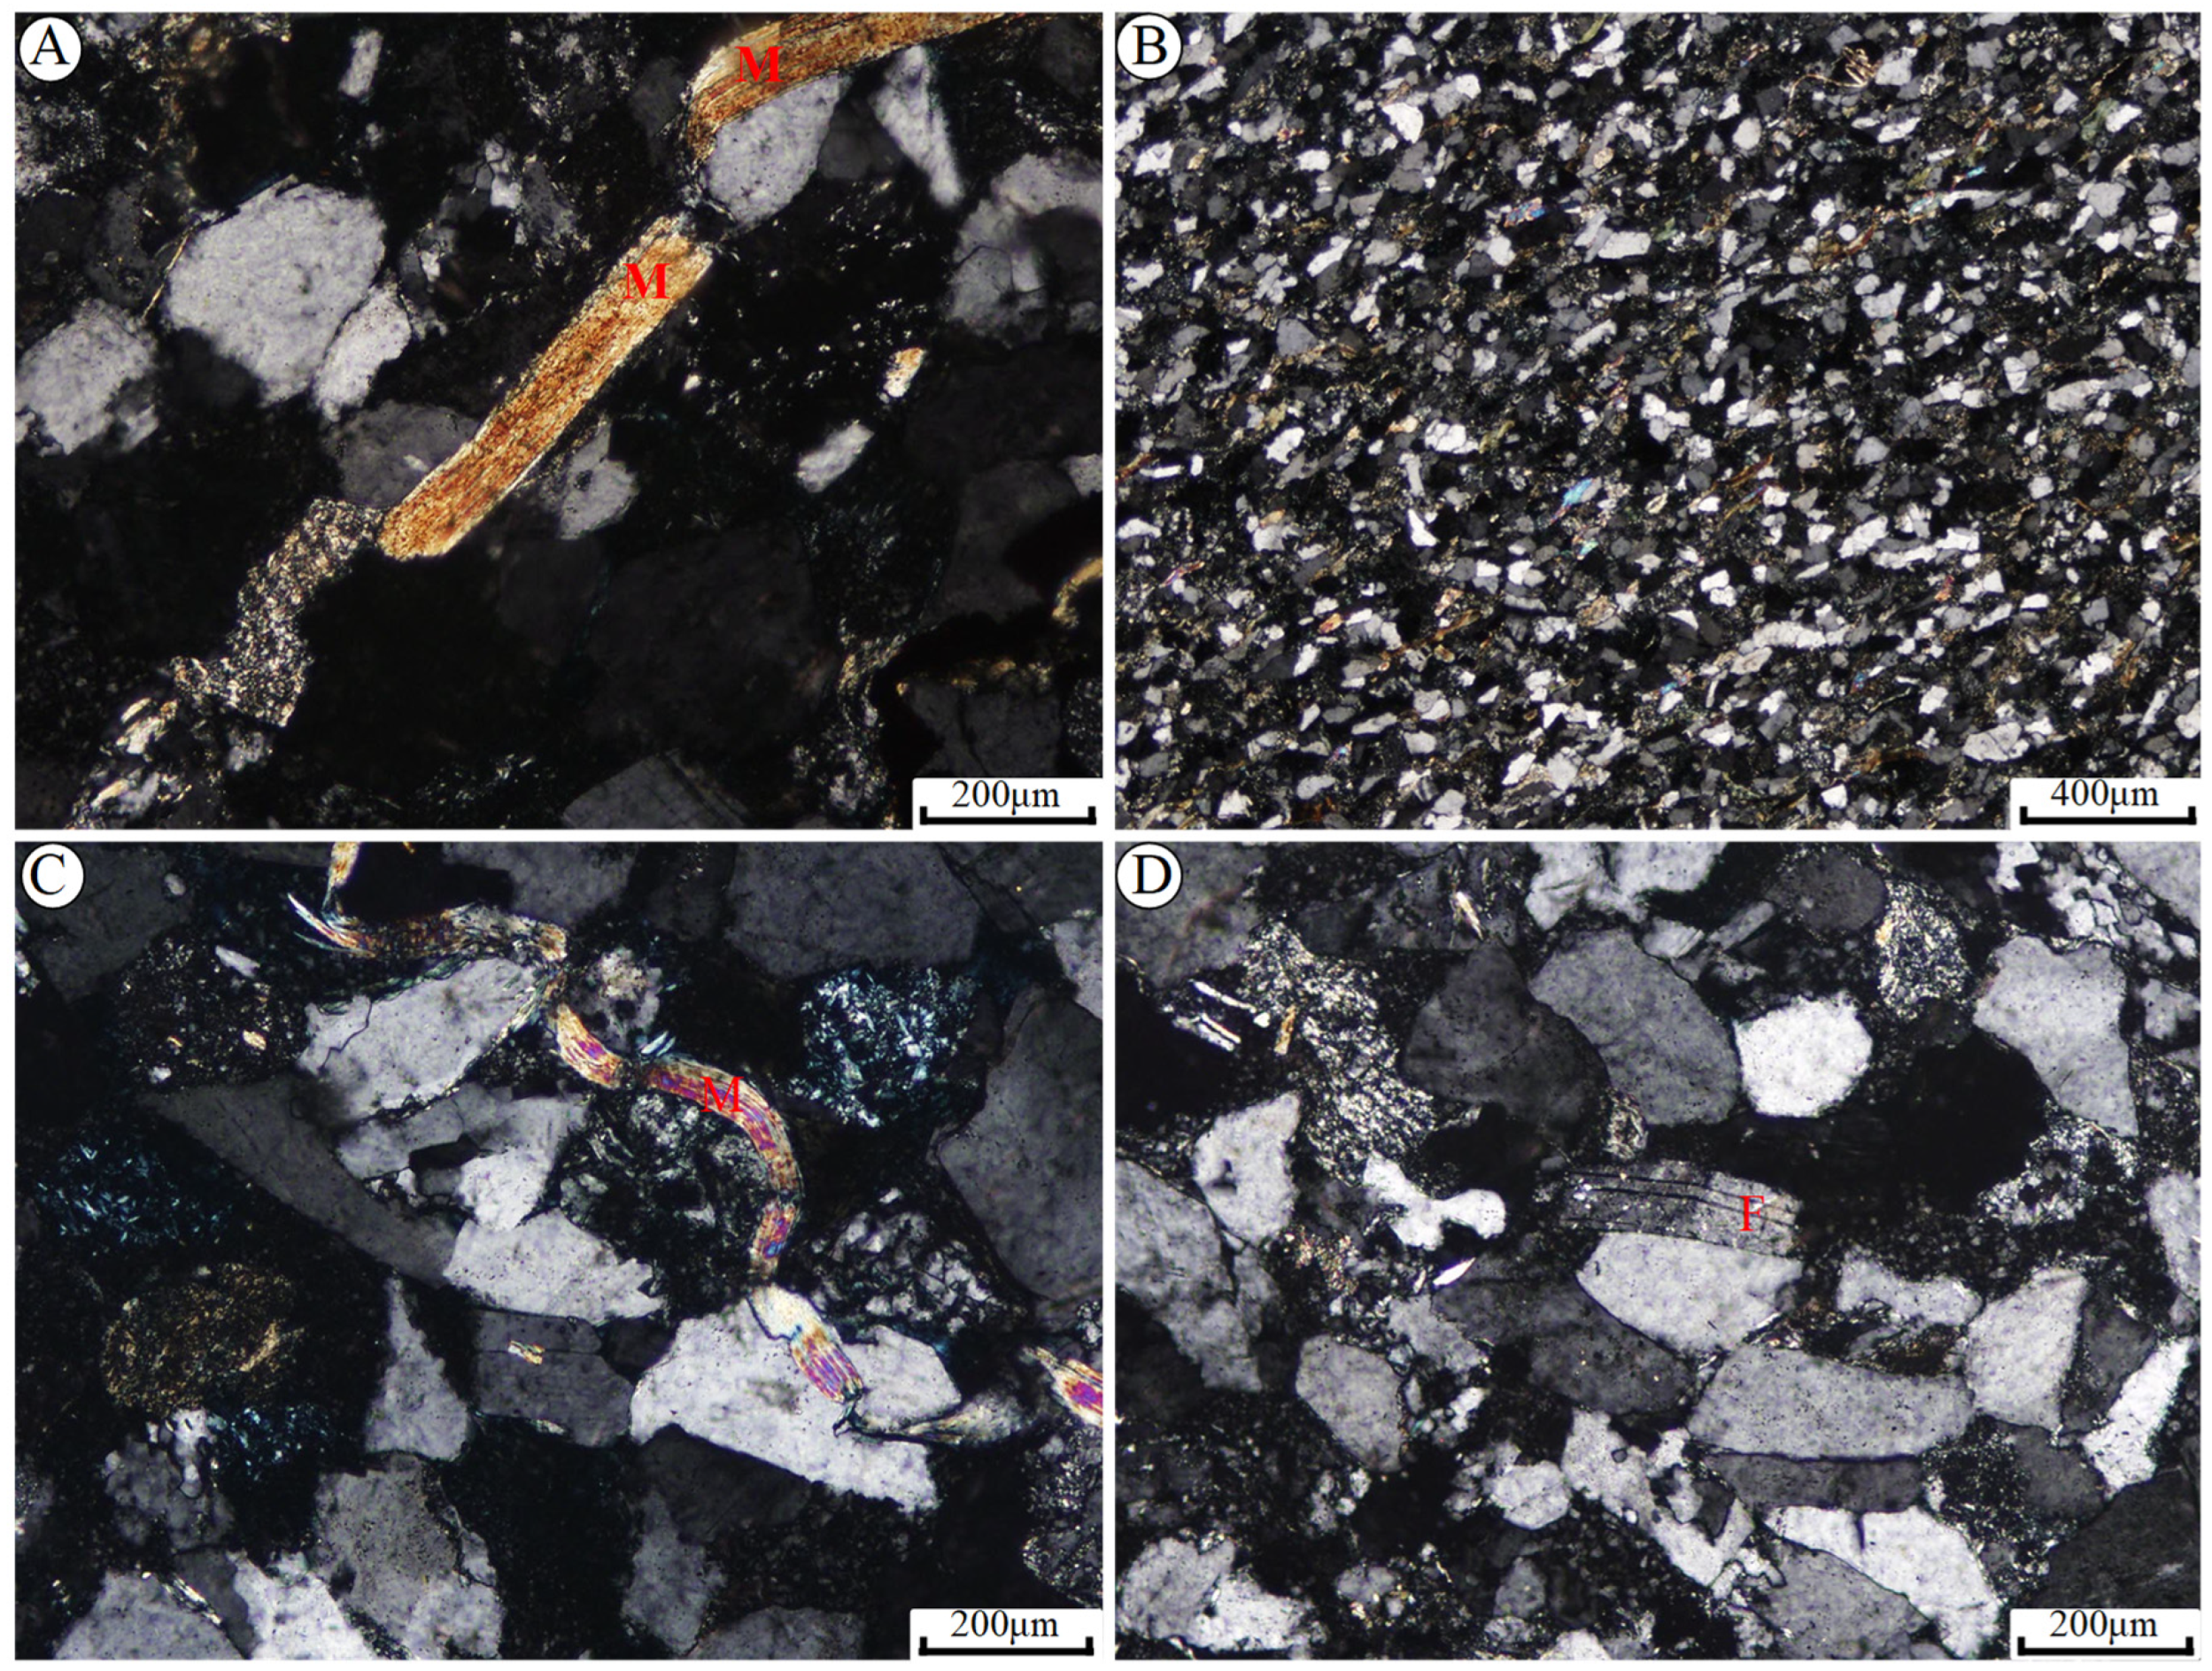
  • Plagioclase. The formation mechanism of plagioclase is mainly the diagenetic transformation of smectite [62], kaolinite [63,64], and chlorite [50]. Well D shows that the increase in plagioclase content is accompanied by decreased kaolinite and chlorite contents in the range of 75–100 °C (Figure 10). In the same temperature range, the content of plagioclase in Well A has no relationship with the content of kaolinite and chlorite, showing a consistent decrease among the three (Figure 9). Another genesis of plagioclase in Well D might be in situ neogenesis under the supply conditions of specific external sources, which are related to the relevant background of deep fault development and deep fluid activity [50,65,66,67,68]. Deep and large fault activities lead to fracture intrusion or eruption of deep fluids along faults and fractures. The deep fluids passing through matrix pores are rich in Si4+, Al3+, Mg2+, and Na+, and the substances from the high-temperature and high-pressure environment of crust and mantle precipitate in the diagenetic stage, including albite, kaolinite, chlorite, dolomite and calcite recrystallization and pyrite combination (Figure 11B,C).
  • Dolomite and ankerite. Dolomite precipitation generally occurs after calcite dissolution-precipitation and pyrite dissolution, which is mainly controlled by the pore water Mg2+/Ca2+ ratio [67]. Calcite dissolution-precipitation and partial pyrite dissolution occurred during the diagenetic period at 125 °C, thus forming dolomite and causing ankerite precipitation (Figure 9 and Figure 10). The deepening of burial depth and increase in temperature further promote the recrystallization of dolomite and form a more stable carbonate diagenetic facies (Figure 9 [67]). Meanwhile, Mg2+ is released into pore water, accelerating the formation of late chlorite minerals (Figure 9 and Figure 10 [50]).
  • Pyrite. Pyrite occurs at about 70 °C, an early diagenetic product, and the diagenesis time is slightly later than or synchronous with the early calcite precipitation [68]. The anaerobic oxidation of organic matter in mudstones reduces sulfate in pore water, releases H2S and S, and combines with Fe2+ to form pyrite in this stage [69]. During subsequent diagenesis at 70–105 °C and 120–135 °C, pyrite is dissolved, Fe2+ is consumed to form an I/S mixed layer, and the released S2− accelerated calcite dissolution (Figure 9). Chlorite dissolution or local sulfate thermochemical reduction reaction occurs at 135 °C (Figure 9 [70]), part of Fe2+ is released, pyrite is crystallized, and the content is increased (Figure 9 and Figure 10). The subsequent charging of organic acid causes the dissolution of pyrite in local intervals to form dissolution pores (Figure 11B,C), resulting in abnormal enlargement of pores after chemical compaction (Figure 9 and Figure 10).
  • Calcite. Calcite precipitation occurs before diagenetic replacement other than pyrite crystal precipitation and early glass argillization [50]. With the dissolution of early calcite, mudstone pores have been locally increased intervals under the background of mechanical and chemical compaction. In Hg2 Fm interval, where the content of early calcite disappears, it is further found that natural gas is locally enriched in this interval [49]. The second diagenetic calcite is formed in the later stage of diagenesis (100–125 °C) after CO2 release and the combination of methane produced by organic matter of source rock and dissolved calcium (Figure 9 and Figure 10 [51]). The source of Ca2+ is mainly plagioclase dissolution in the temperature range of 105–120 °C, followed by calcite precipitation (Figure 10). Carbonate precipitation with chemical compaction is the main cause of the reduction of pores.
The transformation process of clay minerals of Well A can be summarized as follows: the diagenesis at the 65–115 °C thermal window results in the dissolution of K-feldspar particles, early formation of calcite cement, and production of pyrite cement. Illite, plagioclase, and pyrite are dissolved at 115–125 °C, and the content of the I/S mixed layer increases. At 125–135 °C, the diagenesis reversed, and the I/S mixed layer dissolved and transformed into illite and feldspar. The I/S mixed layer has a low amplitude increase at 135 °C, while calcite dissolution and dolomite begin to show a downward trend, chlorite and kaolinite contents increase. The dissolution of late dolomite and iron dolomite and the intermittent increase and decrease in calcite “reverse” the porosity at a burial depth of approximately 4460 m. The pores in the inversion interval are abnormally enlarged locally (Figure 9).
The transformation process of clay minerals of Well D can be summarized as follows: diagenesis at the 65–105 °C thermal window leads to the dissolution of chlorite, early formation of quartz cement, formation of the I/S mixed layer, and an increase in the local porosity. The charging of deep fluids may lead to the development of in situ plagioclase. Plagioclase and pyrite are dissolved at 105–125 °C, and the content of K-feldspar increases. Diagenesis is reversed at 125 °C, and the I/S mixed layer and chlorite increased slightly. The dissolution of late dolomite with ankerite and intermittent dissolution of calcite increased the porosity locally after 3300 m (Figure 10).
Compared with Well A, the porosity of Well D shows a faster-decreasing trend and higher compaction degree with the increase in burial depth. On the one hand, its genesis is determined by the transformation of clay minerals (Figure 9 and Figure 10). On the other hand, the geothermal gradient of the Well D area is high, the mudstones begin to enter chemical compaction, and the burial depth of inversion is relatively shallow. The difference in geothermal gradient depends on the distribution of formation temperature and the comprehensive influence of deep fluids [2,3,64,66].

5.3. Temperature Distribution

Figure 12 shows that the geothermal gradient in key well areas of the Xihu Depression in the East China Sea Shelf Basin changes with burial depth and gradually increases from deep and shallow geothermal gradients. Within the depth range from 5000 m to 2000 m, the geothermal gradient changes from 3.0 °C/100 m to 3.8 °C/100 m (Figure 12). Below 2000 m, the geothermal gradient in the Well D area deviates from the variation trend of a geothermal gradient in the Xihu Depression (Figure 12). This phenomenon shows that the Well D area in the Xihu Depression is most likely to undergo deep fluid activity and the positive transformation of deep fluids on the formation temperature in the Well D area [65,66].
The diagenetic temperature of illite is higher than the current formation temperature (130–150 °C), which further confirms that the mudstones in Well D of the Xihu Depression have experienced the transformation of abnormally high temperature [65,71]. The deep fluid activity might be derived from the deep materials of crust and mantle, and the wide-area eruption activity occurs with the help of a deep and large fault–fracture system [66].
Deep fault refers to the fault connecting the basement downward and the stratum above T17 upward in this paper. Figure 13 shows the different evolution processes of the prototype basin of the Xihu Depression in the East China Sea Shelf Basin, indicating that the Xihu Depression has experienced three main stages of evolution since the late Eocene (Figure 13). Though the tectonic evolution of the East China Sea basin is not the focus of this paper, the basin evolution model indicates the following important points:
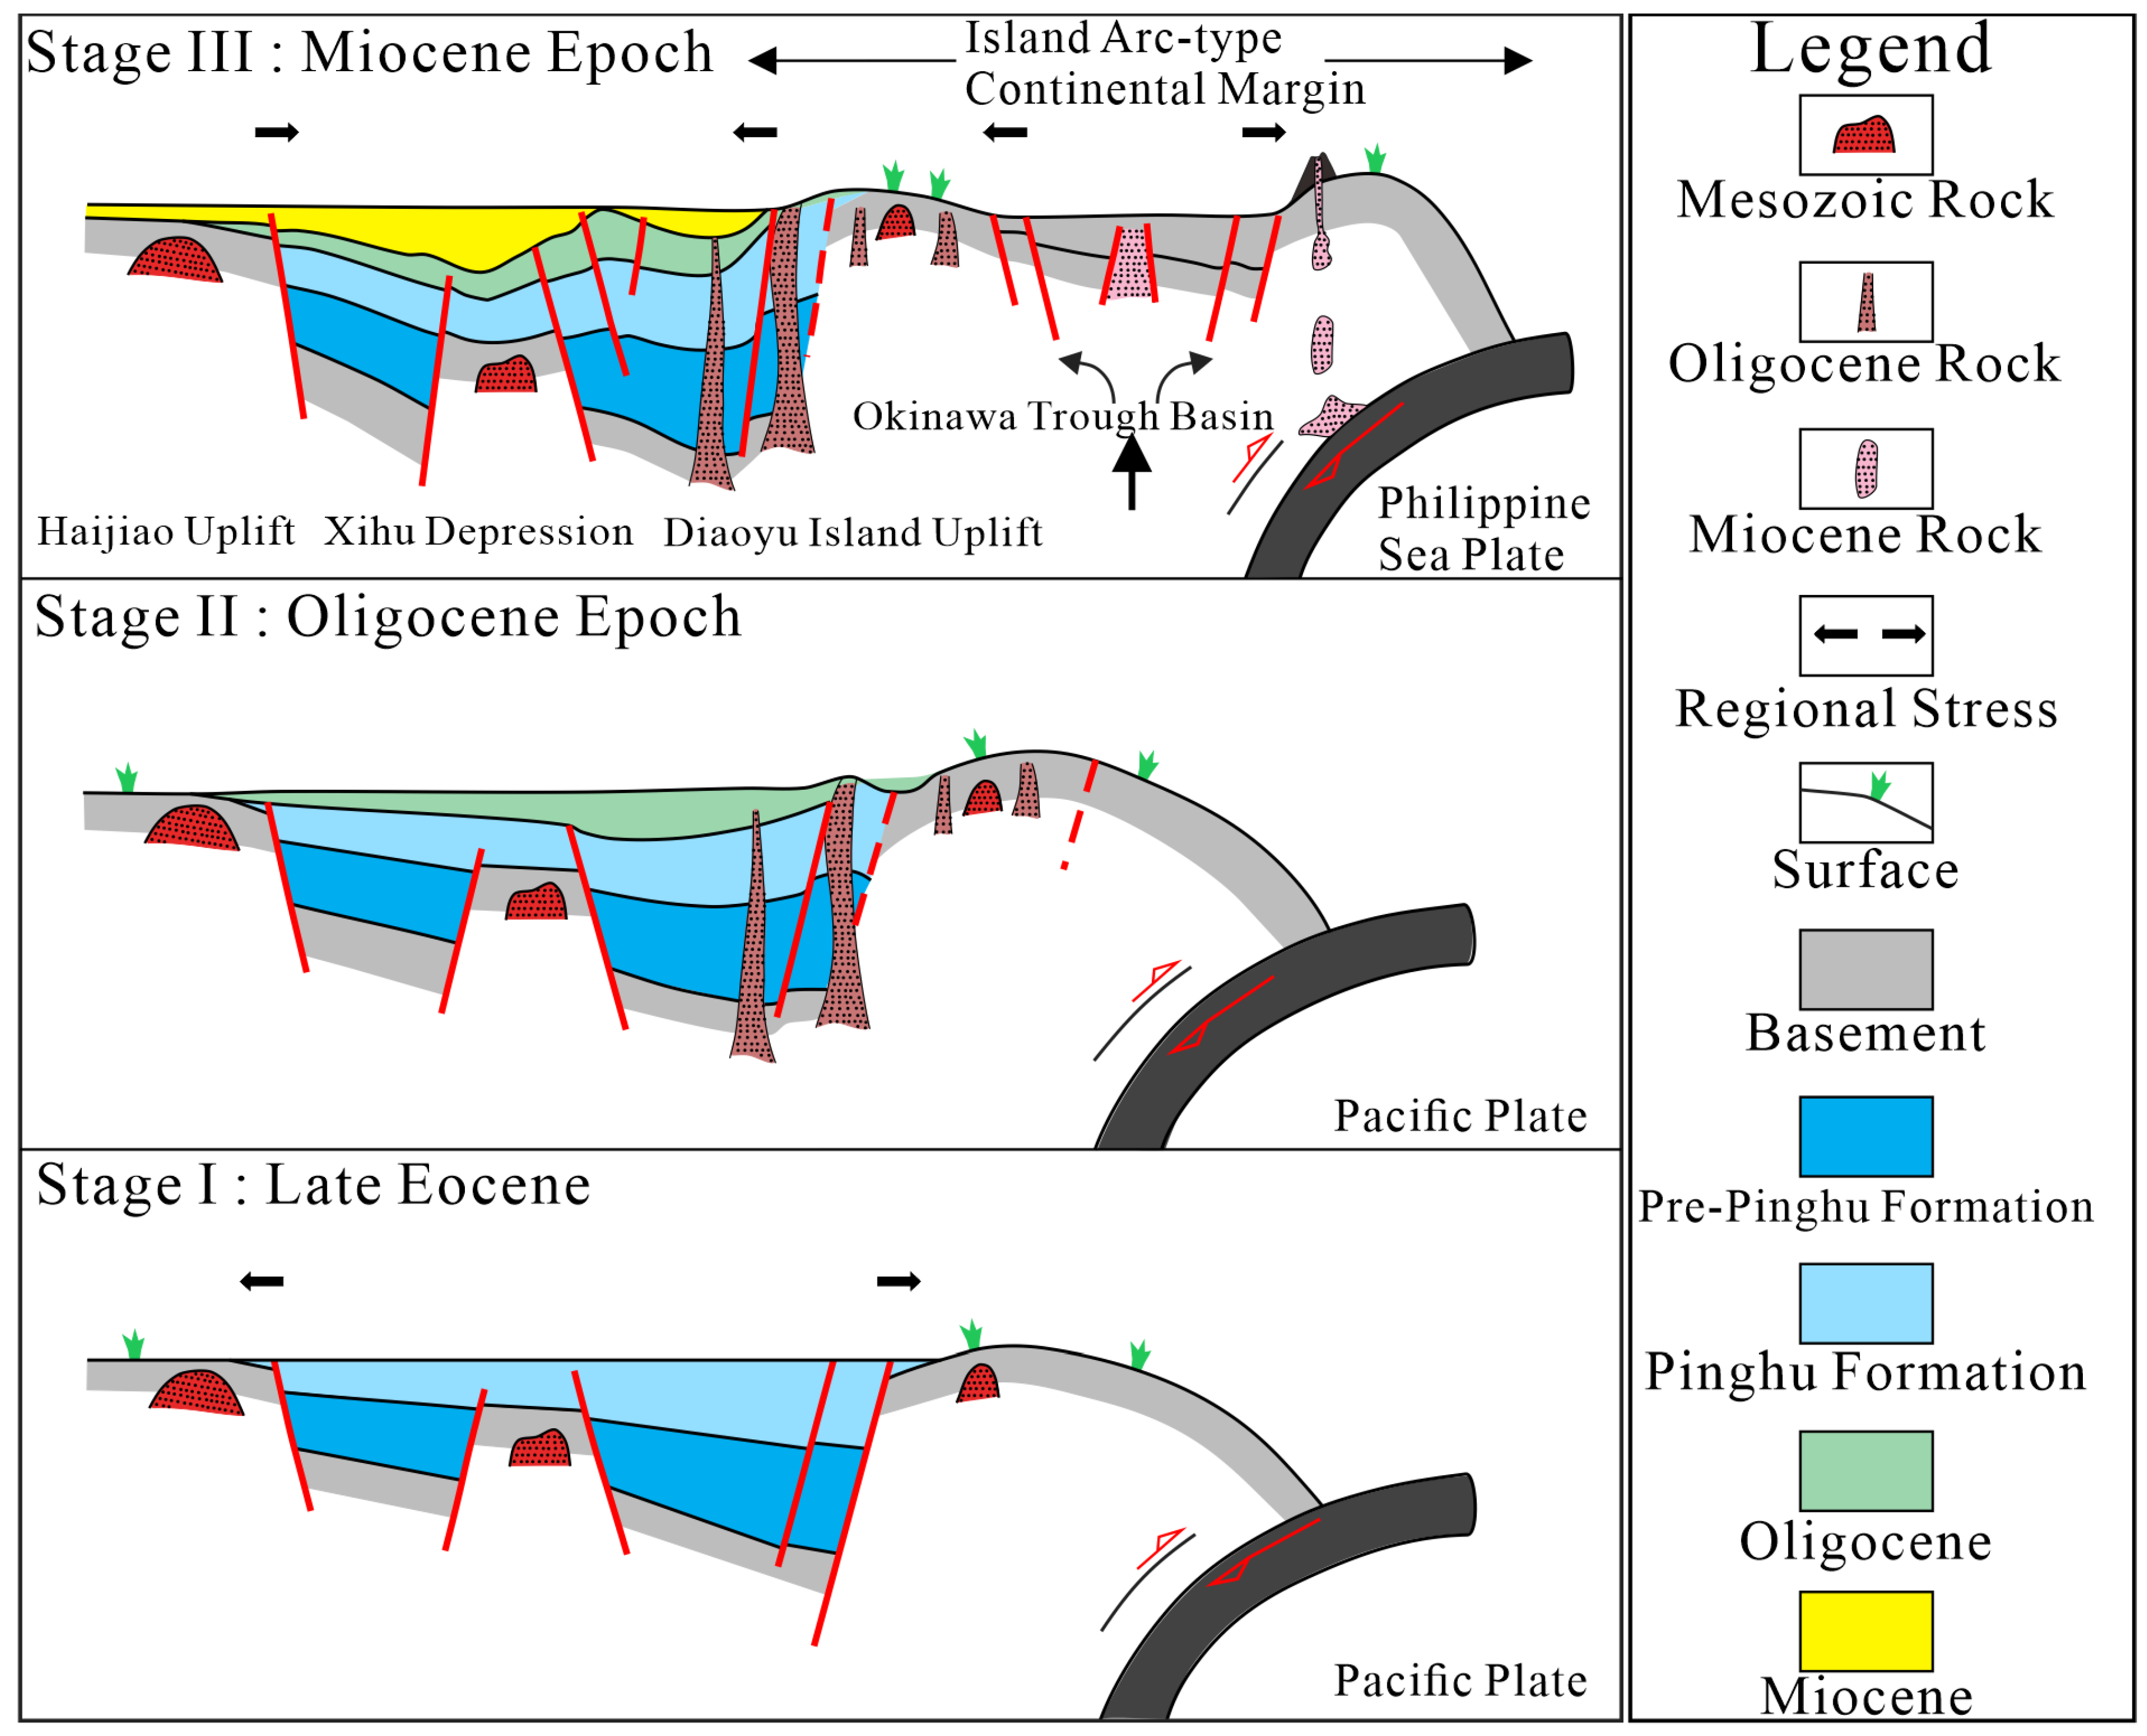
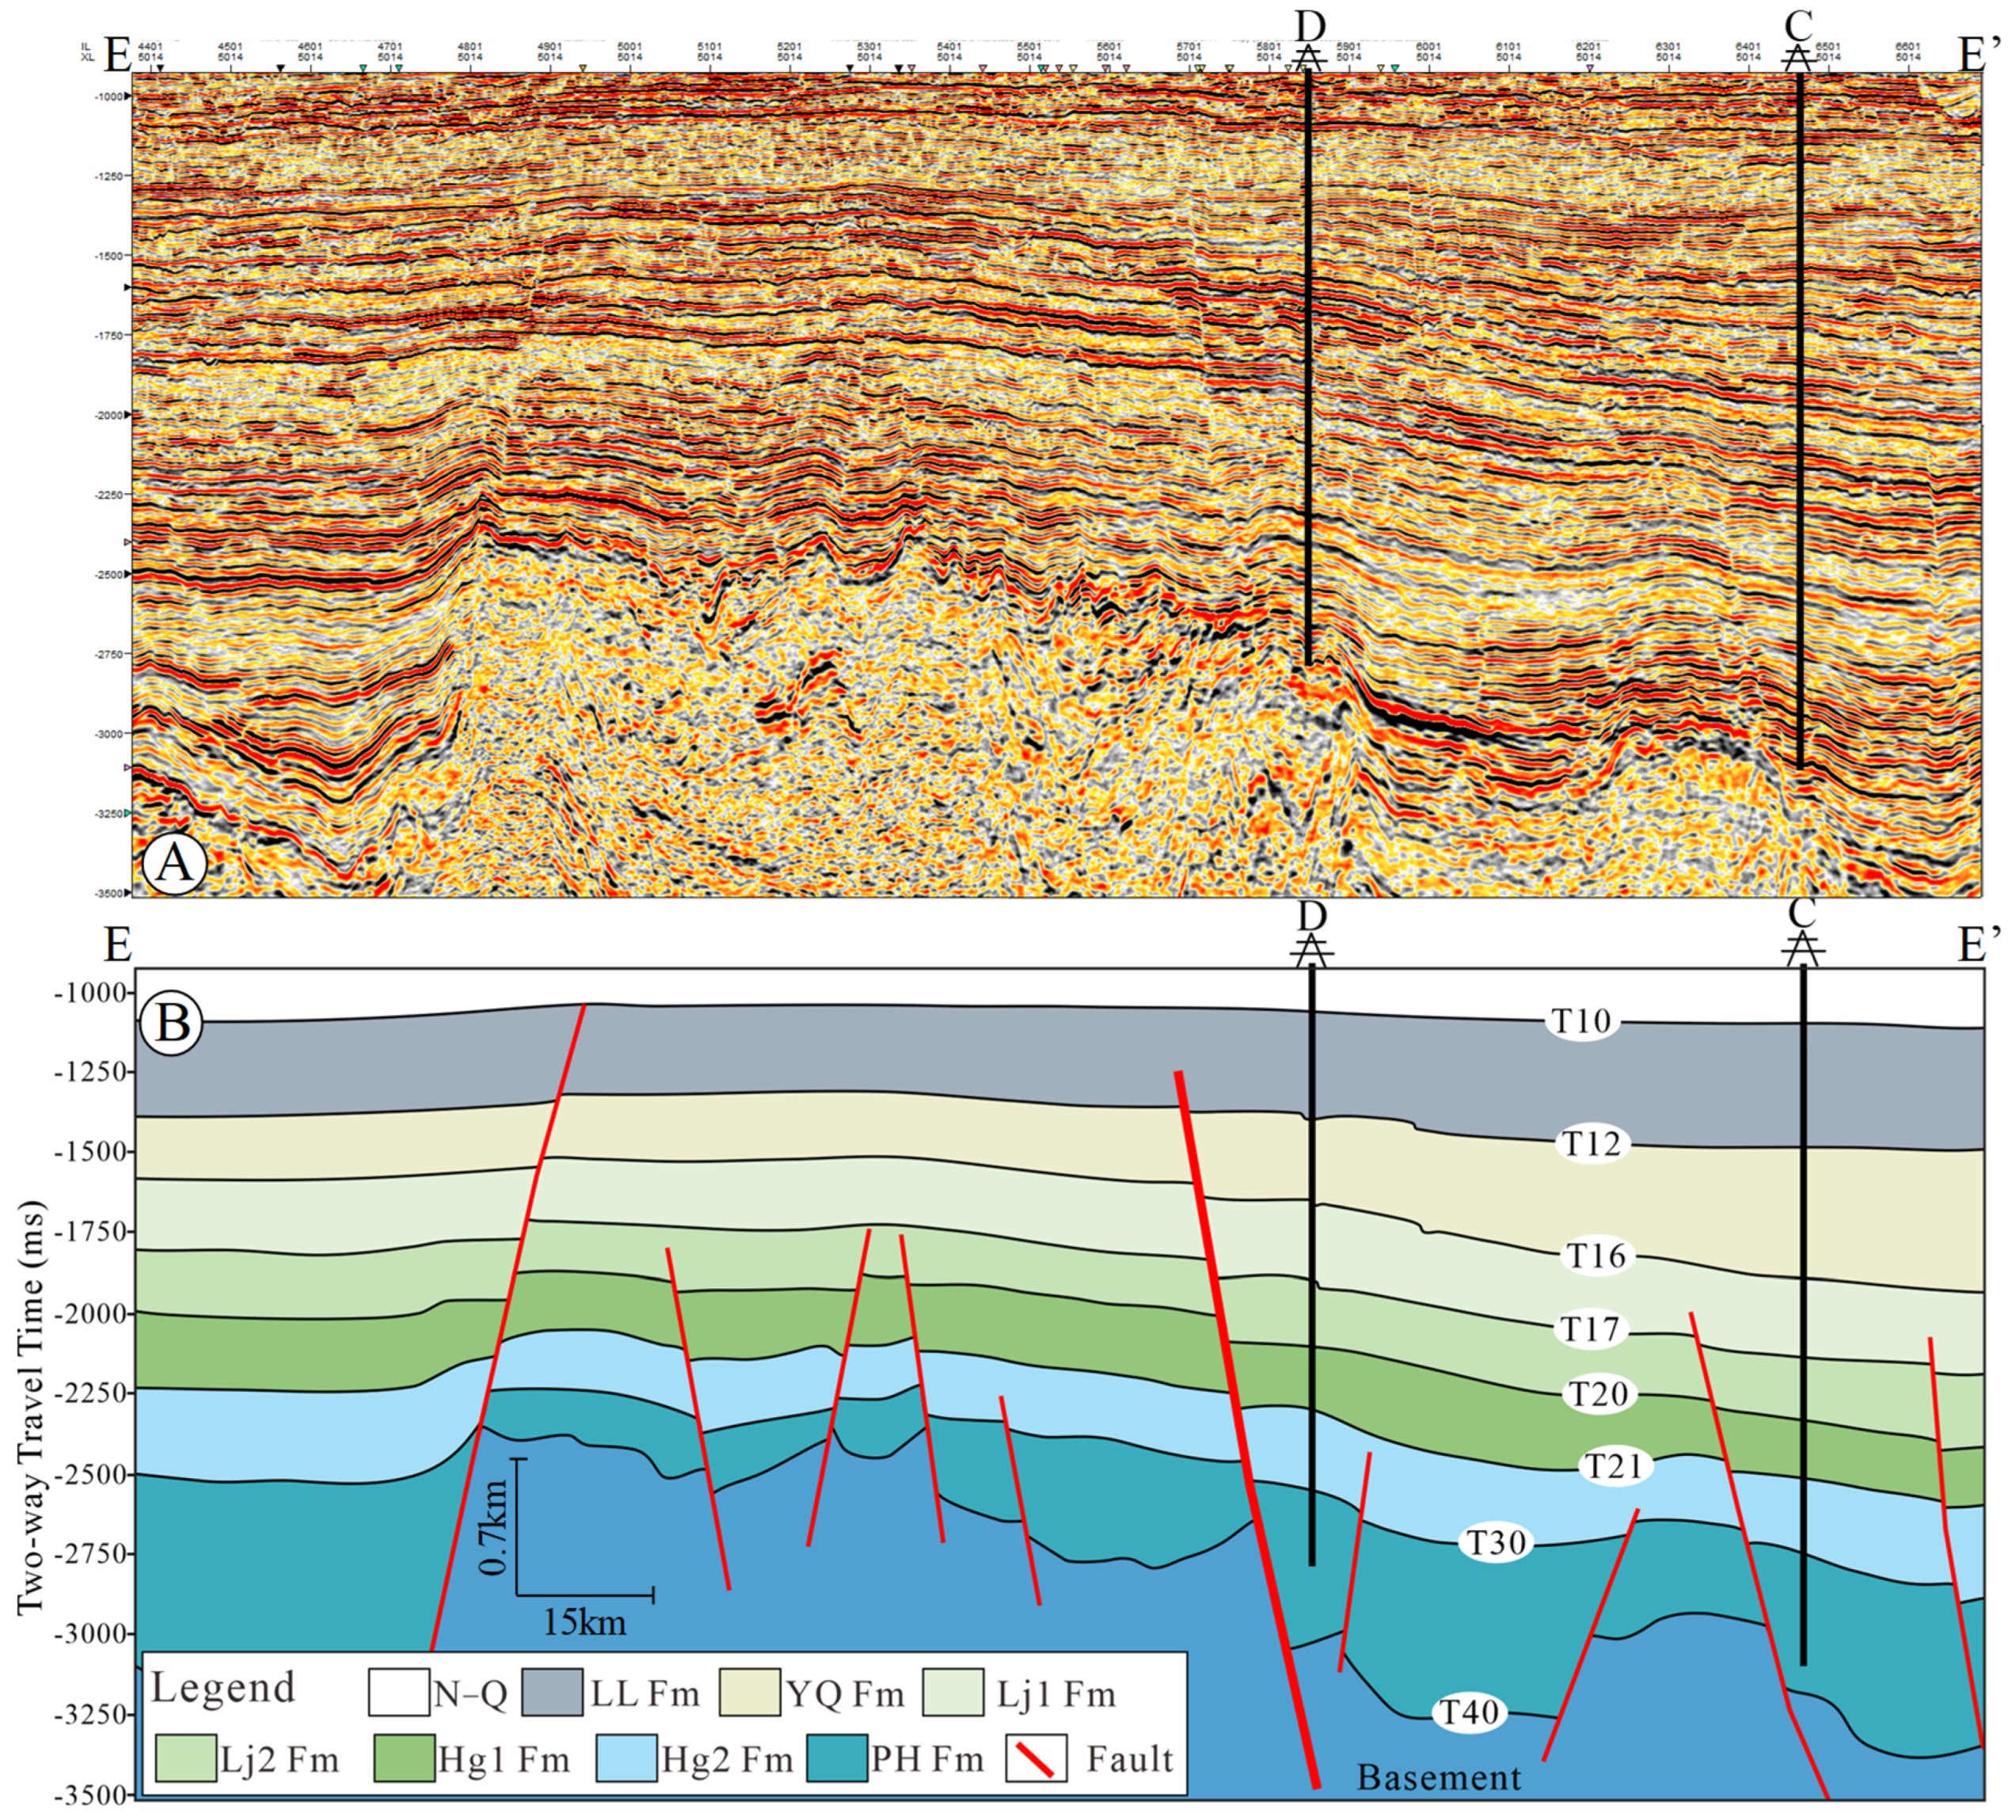
  • The multi-stage rock mass development in Mesozoic, Oligocene, and Miocene has built a solid material foundation for the deep fluids in the East China Sea Shelf Basin, which can provide different scale material sources for the deep fluid activities in different regions and multi-stage development. Rock mass gradually changed from west to east during the formation period, along with the deep fault activity. Given this, it can be seen that the deep fluids in the Xihu Depression are mainly Mesozoic magma, which intrudes or erupts upward along the deep fault (Figure 13).
  • Deep and large faults have been active frequently since the Oligocene (Figure 13). The increase or change of regional stress intensifies the intensity of deep magmatism. Since the Cenozoic, magmatism has mainly developed three main activity periods: early Himalayan (Paleocene–Eocene), middle Himalayan (Oligocene–Miocene), and late Himalayan (Pliocene–quaternary). The East China Sea Shelf Basin has formed an eruption model of intrusive and volcanic rocks dominated by intermediate acid rocks [65,72].
Figure 14 shows the typical seismic profile (A) and corresponding geological profile (B) passing through wells D and C in the Xihu Depression, East China Sea Shelf Basin. The profile reveals that many deep and large faults are developed around well block D in the Xihu Depression. Deep and large faults marked in coarse red are mainly distributed in the south of Well D in Figure 14B. Several deep faults are also developed around Well A and B (Figure 1). The deep fault in Well D connects the basement downward, connects the Mesozoic deep rock mass below T40, and breaks up to the T12 stratum. The active faults in different periods could efficiently transport the deep fluids to the shallow layer, and the formation temperature in Well D increases after the deep fluid transformation. The increase in the geothermal gradient (Figure 12) further leads to the upward movement of formation depth at the beginning of chemical compaction in Well D (Figure 10).
Paleo-fault throw, fault activity rate, and growth index are important parameters to evaluate the activity and intensity of growth faults [72]. The reflection time of the coarse red-marked deep fault cutting through each layer at an interval of 20 gathers (~500 m) is read along the plane strike of the fault (Figure 14B). The time-depth conversion relationship provided by the CNOOC Shanghai branch is used to convert the seismic reflection time and burial depth (Figure 15). The specific calculations of paleo-fault throw, fault activity rate, and growth index can be obtained from [72] and other literature. Figure 15 shows that the deep and large fault exhibited multi-stage strong activity since the sedimentary period of the Pinghu Formation, which lasted until the YQ1 Fm period. The multi-stage activity of deep faults confirms that deep fluid materials could be passed through deep faults, and large-scale intrusion or eruption occurs at multiple points and stages.
The material basis of deep fluids in the Xihu Depression is constructed by Mesozoic rock mass (Figure 13). The deep and large faults developed in the key well areas of the Xihu Depression provide an advantageous transportation background for the efficient activity of deep fluids (Figure 1 and Figure 14). The deep fault activity intensified large-scale intrusion or eruption of deep fluids since the sedimentary period of the Pinghu Formation along the deep fault system in multiple stages and locations (Figure 13 and Figure 15). The multi-stage high-temperature activity of deep fluids leads to an abnormal increase in formation temperature in key well areas of the Xihu Depression in varying degrees (Figure 12). An abnormal high temperature accelerates the process of smectite–illitization and the cementation rate of quartz. Meanwhile, the content of discrete and independent illite increases, and the crystallinity of illite in the I/S mixed layer is high (Figure 6). As a result, the depth limit of chemical compaction in Well D is shallower than that in Well A, and the decreasing trend of porosity becomes “steeper” (Figure 9 and Figure 10).

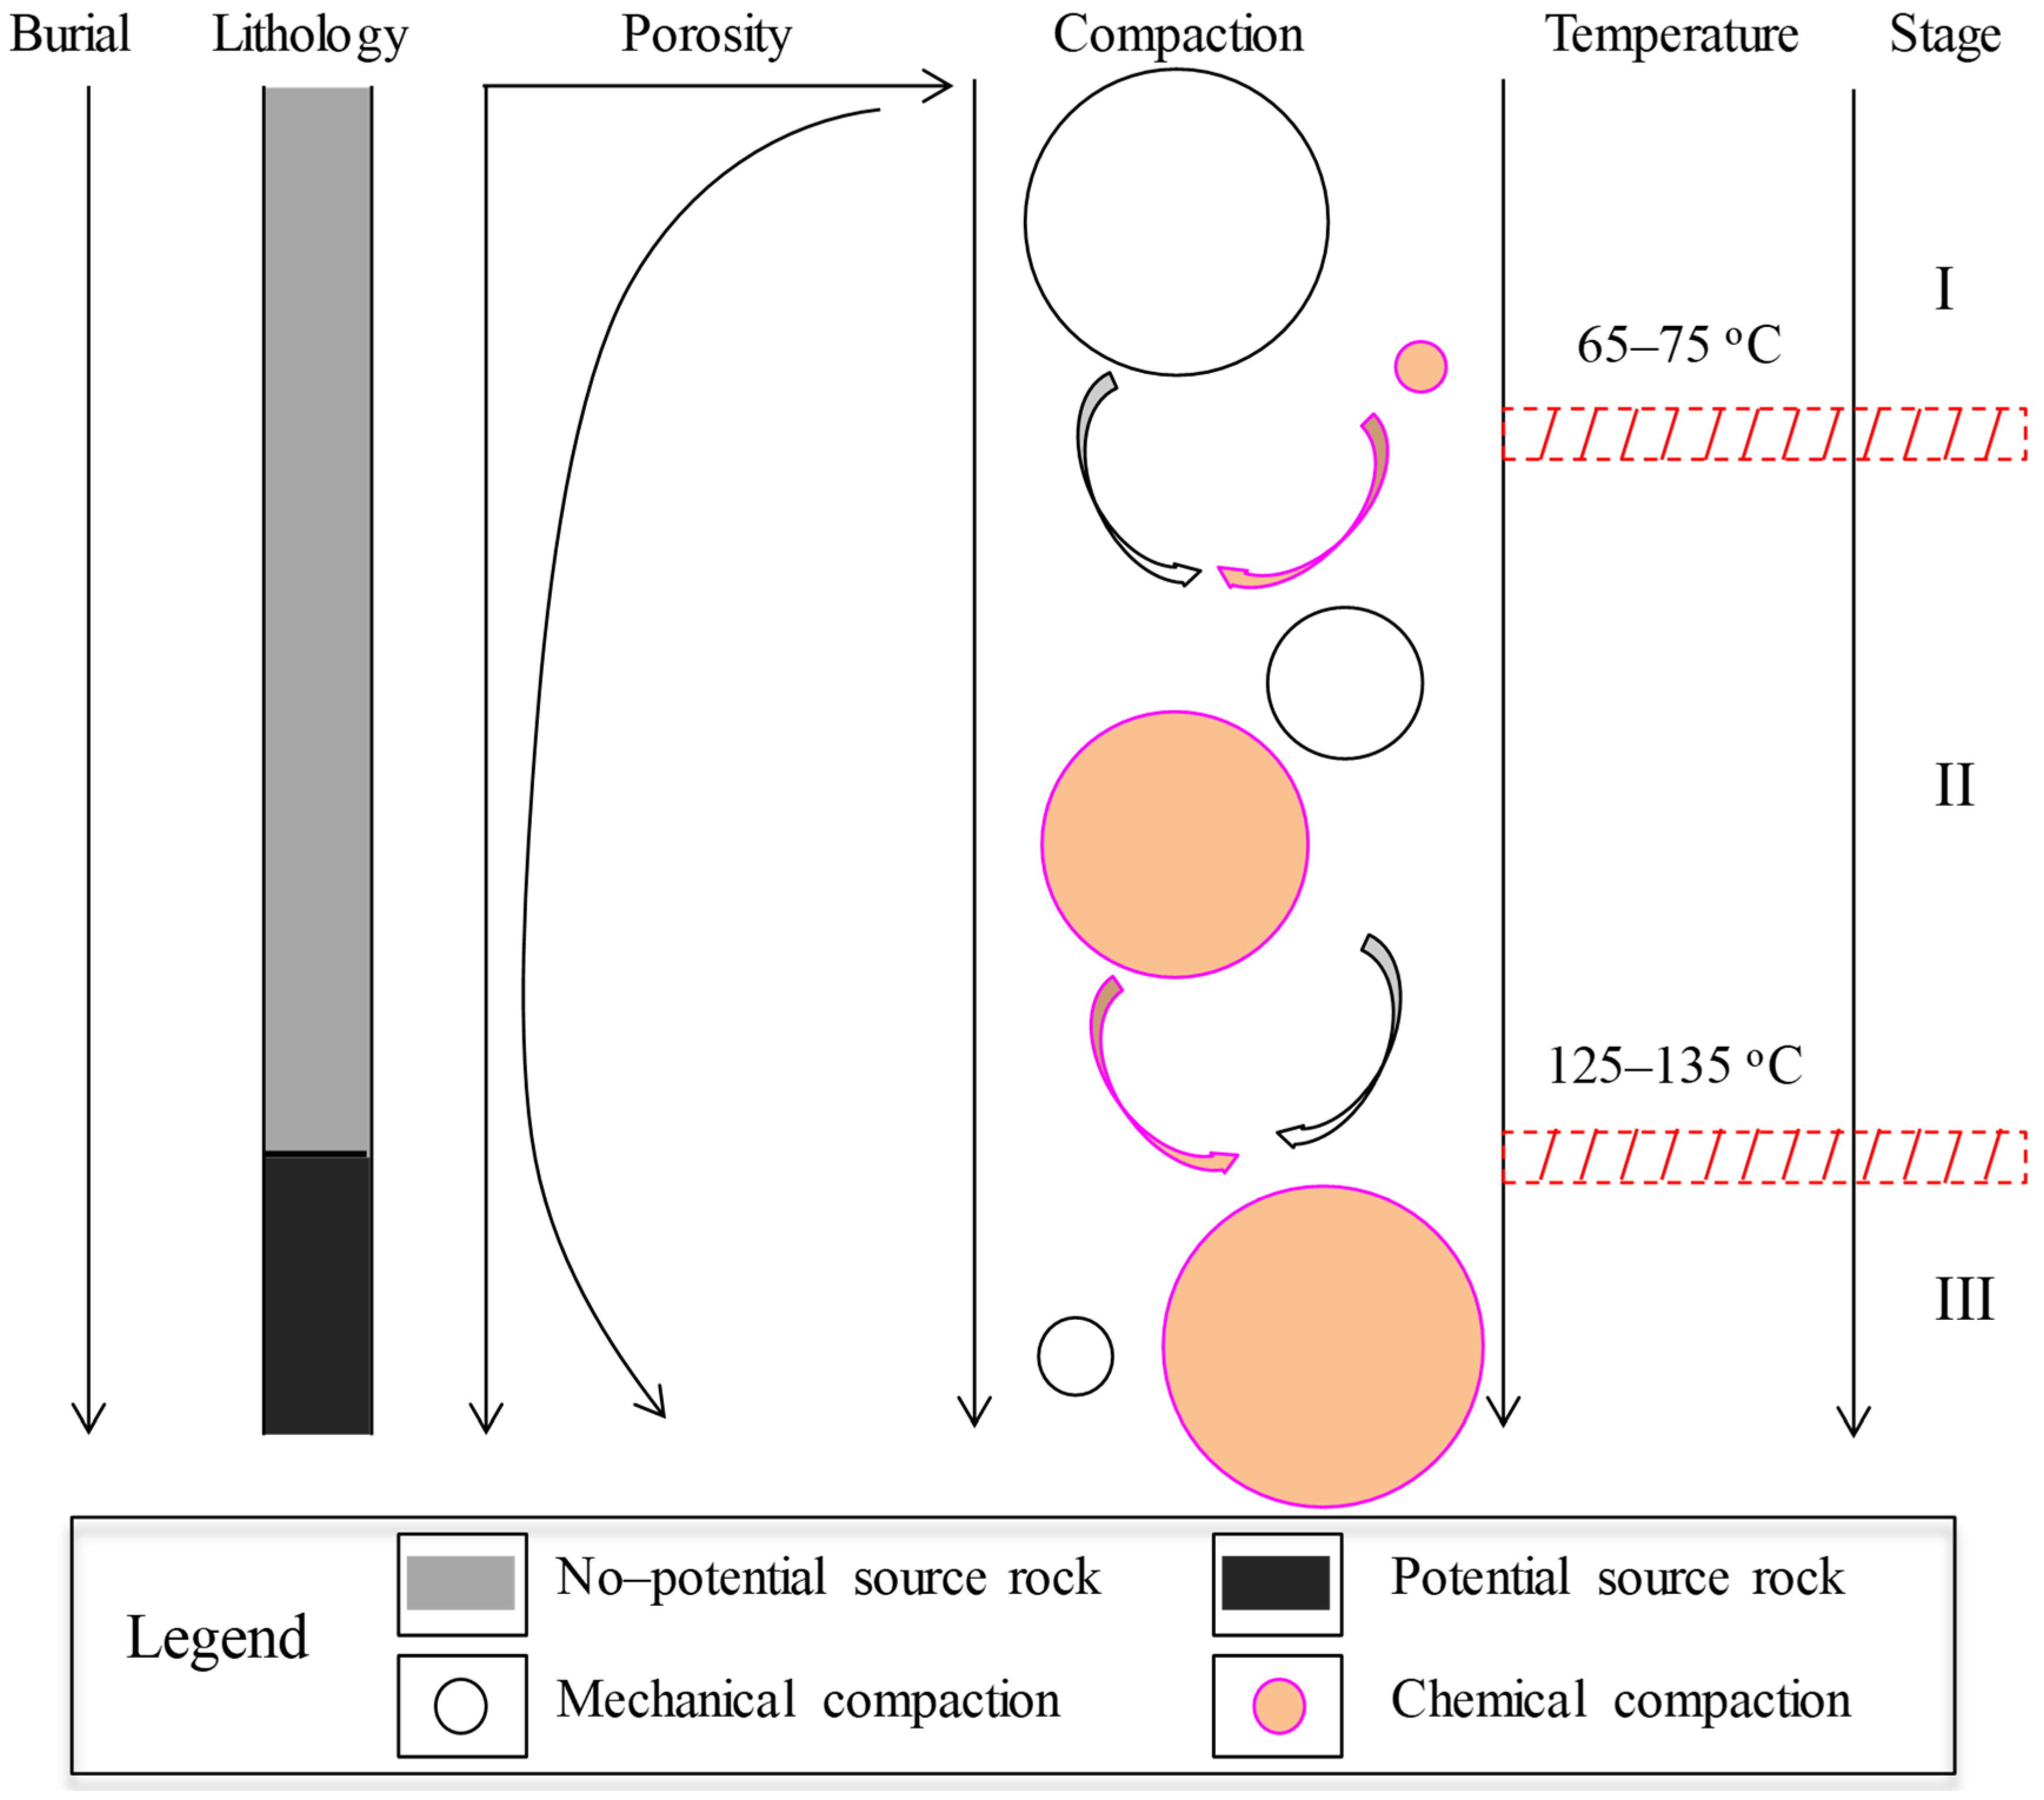
5.4. Compaction Stage and Model

Bjørlykke and Høeg [18] compaction model shows that compaction is of mechanical origin when the formation temperature is than 70 °C. When >70 °C, compaction is in the transitional stage of mechanical and chemical compaction. When >100 °C, compaction is mainly chemical compaction independent of effective stress. The porosity of deep overpressured mudstone should not be higher than that in the normal pressure mechanical compaction stage.
The conceptual model of diagenetically altered compaction proposed by Dutta [20] shows that mechanical compaction is mainly used when the formation temperature is less than 70 °C. When >70 °C, compaction is in the coexistence stage of mechanical and chemical compaction.
Goulty [21] believes that siliciclastic mudstones are mainly characterized by mechanical compaction at low temperatures. Between 70 and 130 °C, the compaction is not only chemical but also the particle contact is still between clay particles after the illitization of smectite, which proves that there is partial mechanical compaction in the compaction process at a higher temperature.
The above scholars unanimously believe that the formation temperature threshold is ~70 °C, and the compaction at a lower threshold temperature occurs due to mechanical causes. Above this threshold, the compaction mechanism changes from mechanical compaction to chemical compaction or into a compaction process dominated by chemical compaction. Nevertheless, there are still discrepancies between the above understanding and the compaction model regarding whether mechanical compaction exists at temperatures exceeding 100 or 130 °C.
Theoretically, it is difficult for the skeleton to completely retain all pores generated by soluble mineral particles (such as the dissolution of the I/S mixed layer and K-feldspar). The compaction behavior of deep high-temperature mudstones is not completely dominated by chemical compaction but also has some mechanical compaction [10]. The reasons are as follows: (1) chemical compaction changes the mineralogy, volume, and direction of the bearing skeleton and the volume of bound water, which shapes a more compact particle skeleton, and the skeleton is partially shortened [25]. (2) During the illitization of smectite and kaolinite [55] and plagioclase albitization, some load-bearing skeleton particles are dissolved and replaced, and the resulting large feldspar secondary dissolution pores are generally not preserved [48]. In other words, while chemical compaction occurs in deep mudstones, mechanical compaction also negatively impacts pore reduction to varying degrees. (3) During the transformation of clay minerals, some clastic particles are dissolved, causing a pore collapse and leading to the formation of new minerals [25,73]. Among them, the precipitation of illite would have been an obvious preferred orientation [15] because it constructs directional mudstones better than pure mechanical compaction (Figure 11E [42]), resulting in partial mechanical compaction of illite. (4) When the organic-rich mudstones produce hydrocarbons after thermal maturation, the kerogen mass decreases according to mass conservation. The kerogen under constant vertical effective stress will shorten after thermal maturation [74]. Further studies have confirmed that mechanical compaction causes the weakening of some rock skeletons after the changes in mudstone load-bearing, hydrocarbon generation from source rocks, and chemical compaction [25].
Empirically, the sandstone in the Ph2 Fm of Well A shows the mineralogical characteristics after mechanical compaction. Such as, mica has been oriented and bent after mechanical compaction (Figure 16A,C); the long axis of mica and drilling cuttings has certain directionality after mechanical compaction (Figure 16B); the feldspar has been bent and deformed after mechanical compaction (Figure 16D). Unfortunately, considering the differences in offshore drilling cost, sidewall sampling process, and production research purposes, mudstone has generally not been considered for sidewall coring. CNOOC Shanghai Branch provides sandstone thin-section data. Although there is no direct mechanical compaction information feedback from mudstone at present and differences in the time of sandstone compaction, the mineralogical mechanical compaction characteristics of the sandstone indicate that the mechanical compaction process might exist and have taken place in the deep layer (Figure 16).
Based on the composition of mudstones, the transformation process of clay minerals, temperature distribution, and genesis, the compaction process is divided into the following three stages:
Stage I: mechanical compaction stage. The cause of mechanical compaction is dominant when the temperature is greater than 65–75 °C. The mechanical rearrangement of argillaceous particles and the deformation strengthening of mudstone toughness are mainly manifested at this stage [12,13,43]. Porosity decreases rapidly with an increase in burial depth. From 50 to 60 °C, the discrete smectite disappears rapidly, and the diagenetic transformation process is illitization, which results in a quartz-enlarged edge and calcite cement [75]. At shallow burial places, the deep fluids could be invaded or erupted upward along the fault–fracture transport system (Figure 14 and Figure 15). On the one hand, the deep fluid activity increases the formation temperature around the fault and accelerates the reaction speed of chemical compaction at the shallow buried place (Figure 10). On the other hand, the acidic substances carried by the deep fluids and the organic acids released by the thermal evolution of the source rocks would cause diagenesis with the mudstones at the shallow burial place (Figure 10 [65,66]), which comprehensively leads to the local chemical compaction at the shallow burial place (Figure 17).
Stage II: coexistence of chemical compaction and mechanical compaction. The temperature of this stage is between 65 and 75 °C and 125 and 135 °C (Figure 17). Illitization of the I/S mixed layer and part of kaolinite mainly occurs at this stage, where illite with smaller porosity replaces kaolinite and I/S mixed layer with larger porosity (Figure 9 and Figure 10 [10]). The newly formed quartz crystal significantly reduces the pore throat size and greatly affects [52]. The reaction rate of illitization and quartz crystal cementation is due to the continuous dissolution of K-feldspar to supply K+ (Figure 9 and Figure 10). Pores are abnormally increased locally in Figure 9 and Figure 10, proving that chemical compaction does not always have a negative effect on the pore. The local activity of organic acids generated and discharged from deep fluids and source rocks along the faults, the intermittent dissolution of pyrite, and the dissolution of early calcite increase the content of I/S mixed layer and plagioclase with large pore size, increasing local pores. The compaction porosity is partially within the range of porosity caused by mechanical compaction (Figure 7 and Figure 8), where mechanical compaction may exist and occur to some extent (Figure 16). The combination of chemical and mechanical compaction with a general negative pore reduction effect leads to the continuous downward trend of pores (Figure 9 and Figure 10).
Stage III: chemical compaction stage. The formation temperature in this stage is more than 125–135 °C. Kaolinite is dissolved, and no obvious increase in illite content after the dissolution of K-feldspar (Figure 9 and Figure 10). Calcite and dolomite are dissolved, and the content decreases due to the overall decrease in porosity; the numerical value increases and reverses. Organic acids have been generated and expelled by the source rocks [29,76], where local dissolution occurs due to an increase in the pyrite content and the abnormal increase in porosity (Figure 7 and Figure 8). Illite dissolution is also one of the reasons for the abnormal increase in porosity (Figure 11A,F). In addition, organic acids partially dissolve the previously developed carbonate cementation, and slight changes in carbonate content would significantly change the AC and RT [10]. The local dissolution of pyrite, illite, and carbonate comprehensively led to the numerical increase and inversion of porosity in this temperature interval under the background of low porosity. Chemical compaction causes an abnormal increase in porosity; however, overall, no abnormal increase occurs in the porosity of deep-scale mudstones due to the following reasons: (1) the longitudinal section shows that the increase in porosity caused by the diagenetic transformation of clay minerals still occurs locally, which could not affect the downward trend of porosity as a whole (Figure 9 and Figure 10). (2) During the generation and expulsion of organic acids and hydrocarbons from source rocks, the argillaceous source rocks are shortened, and the skeleton is weakened by the generation and expulsion of organic acids [25]. In addition, due to the mechanical compaction in the deep layer (Figure 16 [11]), the newly formed abnormally high pores could not be preserved on a large scale; therefore, abnormally high pores with large-scale development have not been observed in the pores (Figure 17).

5.5. Indicative Significance of Chemical Compaction

The complex interaction between mechanical and chemical compaction in sedimentary basins leads to irreversible diagenetic changes to a large extent, characterized by low total porosity and high bulk density [43]. Chemical compaction plays an important role in pore evolution, especially in the stage of chemical compaction. Specifically, (1) the dissolution part of plagioclase and illite increases the pore size (Figure 9, Figure 10 and Figure 11B,C). (2) Local dissolution of calcite and dolomite + iron dolomite increases porosity (Figure 9 and Figure 10). (3) The organic matter pores produced by the transformation of mudstone kerogen to hydrocarbons increase the total pore volume to a certain extent (Figure 11E). The combination of the above factors increases pores and the occurrence of “inversion” characteristics (Figure 9 and Figure 10). However, the mechanical and chemical compaction leads to the low-value background of pores. Additional abnormally enlarged pores have become an important reservoir space for underground fluids, including hydrocarbons, and a comprehensive evaluation of favorable target areas.

6. Conclusions

Mudstones in the Xihu Depression of the East China Sea Shelf Basin mainly include clay minerals, quartz, and carbonate. The sedimentary environment and burial denudation environment in Well A and Well D in the key area of the Xihu Depression are similar, and the composition of clay minerals is nearly the same. On this basis, the chemical compaction characteristics and corresponding genetic mechanisms of the Xihu Depression are studied. Observations and research results are summarized as follows.
The boundaries of chemical compaction depth in Well A and Well D are (for Well A, it is 2200 m and for Well D, it is 1750 m). The porosity shows the following trend: normal decrease → sharp decrease → initial increase; the burial depths are different (4400 m for Well A and 3300 m for Well D). Compared with those of Well A, the pores of Well D show a faster reduction trend and higher compaction degree with the increase in burial depth. The mudstones in the Xihu Depression are chemically compacted.
The compaction process is controlled by the clay mineral transformation and temperature. At 65–105 °C, local dissolution of quartz and pyrite occurred along with the precipitation of plagioclase in Well D. The quartz, pyrite, and plagioclase contents in Well A did not change significantly, and the mudstone clay minerals is corroded by K-feldspar and illitization of the I/S mixed layer. At 125–135 °C, diagenesis reversed; that is, the I/S mixed layer increases in a low range, chlorite and kaolinite contents increase, dissolution of dolomite + iron dolomite occurs, and intermittent dissolution of calcite leads to a local pore increase at 4460 m and 3300 m of Well A and Well D, respectively.
The geothermal gradient in Well D deviates from the geothermal gradient change trend in the Xihu Depression, which has been confirmed that the deep fluid activity leads to an abnormal increase in the formation temperature in the key well areas of the Xihu Depression. The high geothermal gradient makes the depth limit of chemical compaction in Well D shallower than that in Well A, while accelerating the illitization and cementation rate of quartz; therefore, it becomes the main cause of the “steep” decreasing trend of porosity in Well D compared to that in Well A.
The compaction process in the Xihu Depression of the East China Sea Shelf Basin can be divided into three stages: mechanical compaction, the coexistence of chemical compaction and mechanical compaction, and chemical compaction. Chemical diagenetic compaction locally shows a positive pore-increasing effect in the third compaction stage. Additional abnormally enlarged pore sizes have become an important reservoir space for underground fluids including hydrocarbons, and there is a comprehensive evaluation of favorable target areas.

Author Contributions

Conceptualization, Z.Z.; methodology, J.Z. and H.Z.; software, C.E. and Z.Z.; validation, Z.Z., J.Z., H.Z. and J.W.; formal analysis, Z.Z.; investigation, Z.Z. and J.Z.; resources, J.Z.; data curation, H.Z., J.W., Z.L. and S.W.; writing—original draft preparation, Z.Z.; writing—review and editing, Z.Z.; visualization, J.Z.; supervision, H.Z. and C.E.; project administration, J.Z.; funding acquisition, Z.Z. All authors have read and agreed to the published version of the manuscript.

Funding

This research was funded by the Natural Science Basic Research Project of Shaanxi, China, grant number 2023-JC-QN-0302, and the Key Laboratory of Petroleum Resources Research, Gansu Province, grant number SZDKFJJ2023003.

Data Availability Statement

The data presented in this study are available on request from the corresponding author due to restrictions (privacy).

Acknowledgments

Thanks for the constructive suggestions and comments from reviewers that greatly improved the quality of the paper.

Conflicts of Interest

Authors Hong Zhao and Jun Wang were employed by Shanghai Branch of CNOOC Ltd. The remaining authors declare that the research was conducted in the absence of any commercial or financial relationships that could be construed as a potential conflict of interest.

References

  1. Zadeh, M.K.; Mondol, N.H.; Jahren, J. Experimental mechanical compaction of sands and sand-clay mixtures: A study to investigate evolution of rock properties with full control on mineralogy and rock texture. Geophys. Prospect. 2016, 64, 915–941. [Google Scholar] [CrossRef]
  2. Bjørlykke, K. Clay mineral diagenesis in sedimentary basins e a key to the prediction of rock properties: Examples from the North Sea Basin. Clay Miner. 1998, 33, 15–34. [Google Scholar] [CrossRef]
  3. Dutta, N.C. Effect of chemical diagenesis on pore pressure in argillaceous sediment. Lead. Edge 2016, 35, 523–527. [Google Scholar] [CrossRef]
  4. Marcussen, Ø.; Thyberg, B.I.; Peltonen, C.; Jahren, J.; Bjørlykke, K.; Faleide, J.I. Physical properties of Cenozoic mudstones from the northern North Sea: Impact of clay mineralogy on compaction trends. AAPG Bull. 2009, 93, 127–150. [Google Scholar] [CrossRef]
  5. Luo, X.R.; Zhang, L.K.; Lei, Y.H.; Yang, W. Petroleum migration and accumulation: Modeling and applications. AAPG Bull. 2020, 104, 2247–2265. [Google Scholar] [CrossRef]
  6. Zhao, J.Z.; Li, J.; Xu, Z.Y. Advances in the origin of overpressures in sedimentary basins. Acta Pet. Sin. 2017, 38, 973–998. [Google Scholar] [CrossRef]
  7. Li, J.; Zhao, J.Z.; Hou, Z.Q.; Zhang, S.P.; Chen, M.N. Origins of overpressure in the central Xihu depression of the East China Sea shelf basin. AAPG Bull. 2021, 105, 1627–1659. [Google Scholar] [CrossRef]
  8. Ewy, R.; Dirkzwager, J.; Bovberg, C. Claystone porosity and mechanical behavior vs. geologic burial stress. Mar. Pet. Geol. 2020, 121, 104563. [Google Scholar] [CrossRef]
  9. Issler, D.R. A new approach to shale compaction and stratigraphic restoration, Beaufort-Mackenzie Basin and Mackenzie Corridor, northern Canada. AAPG Bull. 1992, 76, 1170–1189. [Google Scholar]
  10. Kalani, M.; Zadeh, M.K.; Jahren, J.; Mondol, N.H.; Faleide, J.I. Effect of diagenesis on pore pressures in fine-grained rocks in the Egersund Basin, Central North Sea. Nor. J. Geol. 2015, 95, 171–189. [Google Scholar] [CrossRef]
  11. Fan, C.Y.; Wang, G. The significance of a piecemeal geometric model of mudstone compaction: Pinghu Slope, Xihu Depression, Eastern China. Mar. Pet. Geol. 2021, 131, 105138. [Google Scholar] [CrossRef]
  12. Mondol, N.H.; Bjørlykke, K.; Jahren, J.; Høeg, K. Experimental mechanical compaction of clay mineral aggregates-changes in physical properties of mudstones during burial. Mar. Pet. Geol. 2007, 24, 289–311. [Google Scholar] [CrossRef]
  13. Mondol, N.H. Porosity and Permeability Development in Mechanically Compacted Silt-Kaolinite Mixtures. In Proceedings of the SEG Houston 2009 International Exposition and Annual Meeting, Houston, TX, USA, 25–30 October 2009; pp. 2139–2143. [Google Scholar]
  14. Li, S.J.; Jin, Z.J.; Yuan, Y.S.; Zhou, Y.; Sun, D.S. Triaxial stress experiment of mudstone under simulated geological conditions and its petroleum significance. Oil Gas Geol. 2016, 37, 598–605. [Google Scholar]
  15. Bjorkum, P.A.; Nadeau, P.H. Temperature controlled porosity/permeability reduction, fluid migration, and petroleum exploration in sedimentary basins. APPEA J. 1998, 38, 453–464. [Google Scholar] [CrossRef]
  16. Ogebulea, O.Y.; Jahrena, J.; Mondol, N.H. Compaction, rock physics and rock properties of sandstones of the Stø Formation: Case study of five wells from the south-western Barents Sea, Norway. Mar. Pet. Geol. 2020, 119, 104448. [Google Scholar] [CrossRef]
  17. Aldega, L.; Carminati, E.; Scharf, A.; Mattern, F. Thermal maturity of the Hawasina units and origin of the Batinah Mélange (Oman Mountains): Insights from clay minerals. Mar. Pet. Geol. 2021, 133, 105316. [Google Scholar] [CrossRef]
  18. Bjørlykke, K.; Høeg, K. Effects of burial diagenesis on stress, compaction and fluid flow in sedimentary basins. Mar. Pet. Geol. 1997, 14, 267–276. [Google Scholar] [CrossRef]
  19. Lahann, R. Impact of smectite diagenesis on compaction modelling and compaction equilibrium. In Pressure Regimes in Sedimentary Basins and Their Prediction; Huffman, A.R., Bowers, G.L., Eds.; AAPG Memoir: Tulsa, OK, USA, 2002; Volume 76, pp. 61–72. [Google Scholar]
  20. Dutta, N.C. Deepwater geohazard prediction using prestack inversion of large offset P-wave data and rock model. Lead. Edge 2002, 21, 193–198. [Google Scholar] [CrossRef]
  21. Goulty, N.R.; Sargent, C.; Andras, P.; Aplin, A.C. Compaction of diagenetically altered mudstones e Part 1: Mechanical and chemical contributions. Mar. Pet. Geol. 2016, 77, 703–713. [Google Scholar] [CrossRef]
  22. Chen, H.L.; Wang, Z.L. A study of mudstone compaction in the west margin of Shaanxi-Gansu-Ningxia Basin. Oil Gas Geol. 1992, 13, 263–271. [Google Scholar]
  23. Colten-bradley, V.A. Role of pressure in smectite dehydration-effects on geopressure and smectite-to-illite transformation. AAPG Bull. 1987, 71, 1414–1427. [Google Scholar]
  24. Zhang, Z.X.; Yang, J.; Ou, Q.B.; Zhang, Y.C.; Qu, X.M.; Guo, Y.F. Formation Pressure Estimation Method for High Temperature and High Pressure Wells in Ledong Area of South China Sea. Nat. Resour. Res. 2021, 30, 4807–4824. [Google Scholar] [CrossRef]
  25. Johnson, J.R.; Hansen, J.A.; Rahman Jamilur, M.D.; Renard, F.; Mondol, N.H. Mapping the maturity of organic-rich shale with combined geochemical and geophysical data, Draupne Formation, Norwegian Continental Shelf. Mar. Pet. Geol. 2022, 138, 105525. [Google Scholar] [CrossRef]
  26. Balestra, M.; Corrado, S.; Aldega, L.; Gasparo Morticelli, M.; Sulli, A.; Rudkiewicz, J.-L.; Sassi, W. Thermal and structural modeling of the Scillato wedge-top basin source-to-sink system: Insights into the Sicilian fold-and-thrust belt evolution (Italy). Geol. Soc. Am. Bull. 2019, 131, 1763–1782. [Google Scholar] [CrossRef]
  27. Schito, A.; Andreucci, B.; Aldega, L.; Corrado, S.; Di Paolo, L.; Zattin, M.; Szaniawski, R.; Jankowski, L.; Mazzoli, S. Burial and exhumation of the western border of the Ukrainian Shield (Podolia): A multi-disciplinary approach. Basin Res. 2018, 30, 532–549. [Google Scholar] [CrossRef]
  28. Lahann, R.W.; Swarbrick, R.E. Overpressure generation by load transfer following shale framework weakening due to smectite diagenesis. Geofluids 2011, 11, 362–375. [Google Scholar] [CrossRef]
  29. Xu, C.J.; Ye, J.R.; Liu, J.S.; Cao, Q.; Sheng, Y.Y.; Yu, H.W. Simulation of hydrocarbon generation and expulsion for the dark mudstone with Type-III kerogen in the Pinghu Formation of Xihu Sag in East China Sea Shelf Basin. Oil Gas Geol. 2020, 41, 359–366. [Google Scholar]
  30. Zhao, Z.L.; Zhao, J.Z.; Zhao, H.; Wang, J.; Er, C.; Wang, S.X.; Li, Z. Re-evaluation of the genetic mechanism of overpressure: Western slope zone of the Xihu Depression, East China Sea Shelf Basin. Mar. Pet. Geol. 2024, 160, 106599. [Google Scholar] [CrossRef]
  31. Duan, F.F.; Zhang, H.S.; Qiu, K.; Wang, X.S.; Wang, H.M. Study on the mechanism of abnormal pressure and pressure detection method after drilling for Xihu Depression in the East China sea. Offshore Oil 2016, 36, 42–47. [Google Scholar]
  32. Shen, Y.L.; Qin, Y.; Guo, Y.H.; Zhao, Z.G.; Yuan, X.X.; Qu, Z.H.; Xie, G.L. Development characteristics of coal-measure source rocks divided on the basis of Milankovich coal accumulation cycle in Pinghu Formation, Xihu sag. Acta Pet. Sin. 2016, 37, 706–714. [Google Scholar]
  33. Liu, J.S.; Cao, B.; Xu, Z.X.; Qin, L.Z.; Xu, F.H.; Tang, J.C. Sedimentary facies and the characteristics of tight sandstone reservoirs of Huagang Formation in Xihu Depression, East China Sea Basin. J. Chengdu Univ. Technol. 2012, 39, 130–136. [Google Scholar]
  34. Zhu, Y.X.; Huang, D.W.; Wang, H.; He, X.K.; Shi, Y.; She, Y.M. Sedimentary setting of thick sandstone in the 3rd member of the Oligocene Huagang Formation in A gas field in the Xihu Sag, East China Sea Basin. Oil Gas Geol. 2019, 40, 1226–1235. [Google Scholar]
  35. Lian, X.C. A model of hydrocarbon accumulation in deeply buried low permeability-high density sandstone gas reservoirs in Xihu Sag, east China sea. Mar. Geol. Front. 2018, 34, 23–30. [Google Scholar]
  36. Zhang, J.Y.; Lu, Y.C.; Krijgsman, W.; Liu, J.S.; Li, X.Q.; Du, X.B.; Wang, C.; Liu, X.C.; Feng, L.; Wei, W.; et al. Source to sink transport in the Oligocene Huagang Formation of the Xihu Depression, East China Sea Shelf Basin. Mar. Pet. Geol. 2018, 98, 733–745. [Google Scholar] [CrossRef]
  37. Zhou, L.H.; Han, G.M.; Dong, Y.Q.; Shi, Q.R.; Ma, J.Y.; Hu, J.N.; Ren, S.C.; Zhou, K.J.; Wang, J.C.; Si, W.L. Fault-sand combination modes and hydrocarbon accumulation in Binhai fault nose of Qikou Sag, Bohai Bay Basin, East China. Pet. Explor. Dev. 2019, 46, 869–882. [Google Scholar] [CrossRef]
  38. Wyllie, M.R.J.; Gregory, A.R.; Gardner, L.W. Elastic wave velocities in heterogeneous and porous media. Geophys. XXI 1956, 21, 41–70. [Google Scholar] [CrossRef]
  39. Dasgupta, S.; Chatterjee, R.; Mohanty, S.P. Magnitude, mechanisms, and prediction of abnormal pore pressure using well data in the Krishna-Godavari Basin, east coast of India. AAPG Bull. 2016, 100, 1833–1855. [Google Scholar] [CrossRef]
  40. Li, L. The method for purifying clay minerals of sedimentary rocks. Sci. Geol. Sin. 1982, 1, 117–120. [Google Scholar]
  41. Gan, Z.Y.; Li, W.P.; Zeng, K.; Jin, Y.R.; Feng, T.C. Application of stokes sedimentation law to granular size classification of radioactive polluted soils. Radiat. Prot. 2014, 34, 240–243. [Google Scholar]
  42. Aplin, A.C.; Matenaar, I.F.; McCarty, D.; van der Pluijm, B.A. Influence of mechanical compaction and clay mineral diagenesis on the microfabric and pore-scale properties of deep-water Gulf of Mexico mudstones. Clays Clay Miner. 2006, 54, 500–514. [Google Scholar] [CrossRef]
  43. Nooraiepour, M.; Mondol, N.H.; Hellevang, H.; Bjørlykke, K. Experimental mechanical compaction of reconstituted shale and mudstone aggregates: Investigation of petrophysical and acoustic properties of SW Barents Sea cap rock sequences. Mar. Pet. Geol. 2017, 80, 265–292. [Google Scholar] [CrossRef]
  44. Jarvie, D.M.; Hill, R.J.; Ruble, T.E.; Pollastro, R.M. Unconventional shale-gas systems: Mississippian Barnett Shale of north-central Texas as one model for thermogenic shale-gas assessment. AAPG Bull. 2007, 91, 475–499. [Google Scholar] [CrossRef]
  45. Asala, H.; Ahmadi, M.; Taleghani, A.D. Why re-fracturing works and under what conditions, SPE-181516-MS. In Proceedings of the SPE Annual Technical Conference & Exhibition 2016, Dubai, United Arab Emirates, 26–28 September 2016. [Google Scholar] [CrossRef]
  46. Schicker, A.; Gier, S.; Schicker, J.; Krois, P. Diagenesis of the Malmian Mikulov Formation source rock, Vienna Basin: Focus on matrix and pores. Mar. Pet. Geol. 2021, 129, 105082. [Google Scholar] [CrossRef]
  47. Rask, J.H.; Bryndzia, L.T.; Braunsdorf, N.R.; Murray, T.E. Smectite illitization in Pliocene-age Gulf of Mexico mudrocks. Clays Clay Miner. 1997, 45, 99–109. [Google Scholar] [CrossRef]
  48. Milliken, K.L.; Olson, T. Silica Diagenesis, Porosity Evolution, and Mechanical Behavior in Siliceous Mudstones, Mowry Shale (Cretaceous), Rocky Mountains, U.S.A. J. Sediment. Res. 2017, 87, 366–387. [Google Scholar] [CrossRef]
  49. Capelli, I.A.; Scasso, R.A.; Kietzmann, D.A.; Cravero, F.; Minisini, D.; Catalano, J.P. Mineralogical and geochemical trends of the Vaca muerta-quintuco system in the Puerta Curaco section, Neuquén Basin. Rev. Asoc. Geol. Argent. 2018, 75, 210–228. [Google Scholar]
  50. Capelli, I.A.; Scasso, R.A.; Cravero, F.; Kietzmann, D.A.; Vallejo, D.; Adatte, T. Late-diagenetic clay mineral assemblages in carbonatized ash beds of the Vaca Muerta Formation (Neuquén Basin, Argentina): Insights into the diagenetic formation of chlorite. Mar. Pet. Geol. 2021, 132, 105207. [Google Scholar] [CrossRef]
  51. Lanz, M.d.R.; Azmy, K.; Cesaretti, N.N.; Fortunatti, N.B. Diagenesis of the Vaca Muerta Formation, Neuquén Basin: Evidence from petrography, microthermometry and geochemistry. Mar. Pet. Geol. 2021, 124, 104769. [Google Scholar] [CrossRef]
  52. Thyberg, B.; Jahren, J. Quartz cementation in mudstones: Sheet-like quartz cement from clay mineral reactions during burial. Pet. Geosci. 2011, 17, 53–63. [Google Scholar] [CrossRef]
  53. Środoń, J. Nature of mixed-layer clays and mechanisms of their formation and alteration. Annu. Rev. 1999, 27, 19–53. [Google Scholar] [CrossRef]
  54. Pollastro, R.M. Considerations and applications of the illite/smectite geothermometer in hydrocarbon-bearing rocks of Miocene to Mississippian age. Clays Clay Miner. 1993, 41, 119–133. [Google Scholar] [CrossRef]
  55. Hower, J.; Eslinger, E.V.; Hower, M.E.; Perry, E.A. Mechanism of burial metamorphism of argillaceos sediment. Geol. Soc. Am. Bull. 1976, 87, 725–737. [Google Scholar] [CrossRef]
  56. Bjørlykke, K.; Jahren, J. Open or closed geochemical systems during diagenesis in sedimentary basins: Constraints on mass transfer during diagenesis and the prediction of porosity in sandstone and carbonate reservoirs. AAPG Bull. 2012, 96, 2193–2214. [Google Scholar] [CrossRef]
  57. Xu, G.S.; Xu, F.G.; Yuan, H.F.; Ding, S.B.; Bai, C.G.; Zhou, R.Q. Evolution of pore and diagenetic environment for the tight sandstone reservoir of Paleogene Huagang Formation in the central reversal structural belt in Xihu sag, East China Sea. J. Chengdu Univ. Technol. 2016, 43, 385–395. [Google Scholar]
  58. Murakami, T.; Sato, T.; Inoue, A. HRTEM evidence for the process and mechanism of saponite-to-chlorite conversion through corrensite. Am. Mineral. 1999, 84, 1080–1087. [Google Scholar] [CrossRef]
  59. Liu, X.H.; Wang, W.W.; Feng, M.Y.; Zhuo, Y.Q.; Yue, H.H. Hydrothermal Process and Duration of the Carboniferous Altered Tuff Reservoir in the Well Dixi 14 Area of Kelameili Gas Field (Jungar Basin), NW China. Earth Science 2021. Available online: https://kns.cnki.net/kcms/detail/42.1874.P.20211126.0922.002.html (accessed on 26 November 2021).
  60. Ye, Y.; Tang, S.; Xi, Z.; Jiang, D.; Duan, Y. Quartz types in the Wufeng-Longmaxi Formations in southern China: Implications for porosity evolution and shale brittleness. Mar. Pet. Geol. 2022, 137, 105479. [Google Scholar] [CrossRef]
  61. Robinson, D.; Schmidt, S.T.; De Zamora, A.S. Reaction pathways and reaction progress for the smectite-to-chlorite transformation: Evidence from hydrothermally altered metabasites. J. Metamorph. Geol. 2002, 20, 167–174. [Google Scholar] [CrossRef]
  62. Biernacka, J. Pore-lining sudoite in rotliegend sandstones from the eastern part of the southern permian basin. Clay Miner. 2014, 49, 635–655. [Google Scholar] [CrossRef]
  63. Daniels, E.J.; Altaner, S.P. Clay mineral authigenesis in coal and shale from the anthracite region, Pennsylvania. Am. Mineral. 1990, 75, 825–839. [Google Scholar]
  64. Beaufort, D.; Rigault, C.; Billon, S.; Billault, V.; Inoue, A.; Inoue, S.; Patrier, P. Chlorite and chloritization processes through mixed-layer mineral series in low temperature geological systems—A review. Clay Miner. 2015, 50, 497–523. [Google Scholar] [CrossRef]
  65. Gao, W.Z.; Yang, C.H.; Zhao, H. Reservoir formation and modification controlled by thermal events in the Xihu Sag, East China Sea Basin. Pet. Geol. Exp. 2015, 37, 548–554. [Google Scholar]
  66. Zhao, Z.L.; Wang, Z.L.; Wang, D.Y.; Wang, F.L.; Xiao, S.D.; Zhu, L.W.; Gao, X.H. Tracing deep fluids in the Bozhong Sag: Evidence from integrated petrography and geochemistry data. Mar. Pet. Geol. 2020, 113, 104154. [Google Scholar] [CrossRef]
  67. Morse, J.; Mackenzie, F. Geochemestry of Sedimentary Carbonates. Dev. Sedimentol. 1990, 48, 707. [Google Scholar]
  68. Hesse, R. Early diagenetic pore water/sediment interaction: Modern offshore basins. In Diagenesis. Geoscience Canada (Reprint Series 4); McIlreath, I., Morrow, D., Eds.; Geological Association of Canada: St. John’s, NL, Canada, 1990; pp. 277–316. [Google Scholar]
  69. Berner, R.A. Sedimentary pyrite formation: An update. Geochem. Cosmochim. Acta 1984, 48, 605–615. [Google Scholar] [CrossRef]
  70. Machel, H.G. Bacterial and thermochemical sulfate reduction in diagenetic settings-old and new insights. Sediment. Geol. 2001, 140, 143–175. [Google Scholar] [CrossRef]
  71. Safaricz, M.; Davison, I. Pressure solution in chalk. AAPG Bull. 2005, 89, 383–401. [Google Scholar] [CrossRef]
  72. Zhou, X.H.; Jiang, Y.M.; Tang, X.J. Tectonic setting, prototype basin evolution and exploration enlightenment of Xihu sag in East China Sea Basin. China Offshore Oil Gas 2019, 31, 1–10. [Google Scholar]
  73. Ho, N.; Peacor, D.R.; van der Pluijm, B.A. Preferred orientation of phyllosilicates in Gulf Coast mudstones and relation to the smectite-illite transition. Clays Clay Miner. 1999, 47, 495–504. [Google Scholar] [CrossRef]
  74. Hansen, J.A.; Mondol, N.H.; Tsikalas, F.; Faleide, J.I. Caprock characterization of Upper Jurassic organic-rich shales using acoustic properties, Norwegian Continental Shelf. Mar. Pet. Geol. 2020, 121, 104603. [Google Scholar] [CrossRef]
  75. Boles, J.R.; Franks, S.G. Clay diagenesis in Wilcox sandstones of southwest Tsxas: Implications of smectite diagenesis on sandstone cementation. J. Sediment. Petrol. 1979, 49, 55–70. [Google Scholar]
  76. Li, X.Q.; Zhong, N.N.; Xiong, B.; Wang, T.G. A study on thermal evolution of organic matter in coal-bearing source rocks of Xihu sag. Coal Geol. China 1997, 9, 33–36. [Google Scholar]
Figure 1. Subfigure (A) shows the geographical location of the Xihu Depression in China. Four studied wells are located in the western slope zone of the Xihu Depression in subfigure (B). The straight-line distance between Well A and D shall not exceed 100 km. The Shanghai Branch of China National Offshore Oil Corporation (CNOOC) Ltd. provided the fault interpretation data (Fault interpretation were supported by Petrel software 2.1 (France)).
Minerals 14 00413 g001
Figure 2. Stratigraphic subdivision of the Xihu Depression in east China (stratigraphic ages from [30,36]). The mudstone in the column is the focus of this study, which comprises source rock and caprock. The source rocks are mainly developed in Ph2 Fm and Ph3 Fm, and partially contributed by Hg2 Fm. The reservoirs are mainly PH Fm and HG Fm. Longjing and Yuquan Formation reservoirs are also developed in the Middle East of the Xihu Depression. Therefore, the caprock is developed longitudinally from YQ Fm to PH Fm. LL = Liulang; YQ = Yuquan; LJ = Longjing; HG = Huagang; PH = Pinghu; Fm = Formation.
Minerals 14 00413 g002
Figure 3. Detailed mudstone compaction profile of Well A in the Xihu Depression, East China Sea Shelf Basin. The lithology is further constrained by the GR data based on the calibration of cuttings logging. Caliper logging is used to identify the availability of logging data, which clearly shows that the drilling bit is replaced with an 8.5-inch bit shortly after the Hg2 Fm is drilled. GR = Gamma ray, RT = resistivity, AC = acoustic time difference, CNL = compensated neutron logging, DEN = density, CAL = caliper logging.
Minerals 14 00413 g003
Figure 4. Comprehensive mudstone compaction profile of Well D in the Xihu Depression, East China Sea Shelf Basin. GR data further constrain the lithology, and caliper logging is used to identify the availability of logging data. GR = Gamma ray, RT = resistivity, AC = acoustic time difference, CNL = compensated neutron logging, DEN = density, CAL = caliper logging.
Minerals 14 00413 g004
Figure 5. Distribution of quartz + feldspar, carbonate, and clay minerals from XRD data in the LJ Fm, HG Fm, and PH Fm. Data from Barnett [44] and Eagle Ford [45], and Mikulov [46] for comparison. The mudstones of Well A and D are mainly composed of quartz, feldspar, and clay minerals, and carbonate constitutes the remaining mineral assemblages of mudstones. Compared with Barnett, Eagle Ford, and Mikulov mudstone, the latter is mainly composed of carbonate.
Minerals 14 00413 g005
Figure 6. XRD patterns of ethylene-glycol saturated samples (1911 m, 1940 m, 2906 m, 3442 m, and 4008 m) in Well A. I-S = illite–smectite, I = illite, K = kaolinite, C = chlorite, Q = quartz. The fraction < 0.2 μm after ethylene glycol saturation and two types of illite are shown in the XRD patterns: illite in the I/S and independent and dispersed illite. With an increase in depth, the intensity of the spectral peak of the I/S decreases. The angle between incoming and diffracted rays two-theta (2θ).
Minerals 14 00413 g006
Figure 7. Variation in the porosity calculated using acoustic time difference (A) and density (B) with burial depth in Well A. The porosity calculated using acoustic time difference and density logging shows a decreasing trend with the increase in burial depth before 4400 m. After 4400 m, the porosity change curve of mudstones deviates from the normal compaction trend. AC = acoustic time difference, DEN = density. 100% Smectite (Mondol et al., 2007) [12] and 50%:50% kaolinite–silt (Mondol, 2009) [13].
Minerals 14 00413 g007
Figure 8. Variation in the porosity calculated using acoustic time difference (A) and density (B) with burial depth in Well D. The porosity calculated using AC and DEN logging shows a decreasing trend with an increase in burial depth before 3300 m. After 3300 m, the porosity change curve of mudstones deviates from the normal compaction trend. 100% Smectite (Mondol et al., 2007) [12] and 50%:50% kaolinite–silt (Mondol, 2009) [13].
Minerals 14 00413 g008
Figure 9. Calculated porosity of acoustic time difference (AC), density (DEN), temperature (T, °C), and quantitative mineralogy for experimental data analysis in Well A. The labels a and b represent the onset of mechanical compaction (a) and chemical compaction (b), respectively. Multi-stage illitization occurred in the mixed layer of I/S and kaolinite at 90–145 °C. After 135 °C, pyrite and plagioclase are dissolved, and calcite, dolomite, and ankerite are all dissolved and precipitated in multiple stages. ΦAC = porosity calculated by AC; ΦDEN = porosity calculated by DEN. 100% Smectite (Mondol et al., 2007) [12] and 50%:50% kaolinite–silt (Mondol, 2009) [13].
Minerals 14 00413 g009
Figure 10. Calculated porosity of acoustic time difference (AC), density (DEN), compensated neutron logging (CNL), temperature (°C), and quantitative mineralogy for experimental data analysis in Well D. The labels a and b represent the level of onset of mechanical compaction (a) chemical compaction (b), respectively. The increase in plagioclase content is accompanied by decreased kaolinite and chlorite content in the range of 75–100 °C. At 125 °C, pyrite and plagioclase are dissolved, and calcite, dolomite, and ankerite are all dissolved and precipitated in multiple stages. The illitization of the I/S mixed layer has no obvious change to the quartz content, which means that the diagenetic environment is relatively open, and the SiO2 generated by illitization and kaolinite dissolution rapidly migrates to the adjacent sandstones. ΦAC = porosity calculated by AC; ΦDEN = porosity calculated by DEN. 100% Smectite (Mondol et al., 2007) [12] and 50%:50% kaolinite–silt (Mondol, 2009) [13].
Minerals 14 00413 g010
Figure 11. Characteristics of illite and pyrite in mudstone of Well A, 4837 m, Ph3 Fm. (A) Serrated dissolution and locally dissolution pores are observed in illite. (B,C) Dissolution pores are developed in pyrite. (D) The organic matter dissolves K-feldspar, and one of the causes is the generation and discharge of organic acids in organic-rich kerogen. (E) Gray-black long-strip kerogen is directionally distributed, and organic matter pores are widely developed. (F) is the spectrum of (A) illite, (G) is the spectrum of (D) K- feldspar. The black and white circles in Figures (A,D) represent the analysis point positions.
Minerals 14 00413 g011
Figure 12. Variation trend of the geothermal gradient with depth from key well areas of the Xihu Depression. The solid black line indicates the variation trend of temperature gradient in the range of 2100–5000 m of burial depth of the Xihu Depression. The black dotted line shows the inferred trend of the geothermal gradient before 2100 m. At a depth of less than 2100 m, the geothermal gradient (within the envelope of the black dotted line) in the Well D area is significantly higher than the normal geothermal gradient, which indicates that the Well D area may have experienced the thermal baking effect of deep fluids. The black arrow in the figure represents the trend extension direction of the geothermal gradient data, and the red dashed circle indicates that some geothermal gradients in Well site D deviate from the extension direction.
Minerals 14 00413 g012
Figure 13. Prototype basin evolution of the Xihu Depression, East China Sea Shelf Basin (modified from [72]). The extension direction of the basin is adjusted to NWW-SEE, and NNE trending faults were developed based on the original NE trending faults in Stage I. During Stage II, the Oligocene rock mass erupted vertically along the zone controlling faults in the east of the Xihu Depression. At the end of the Oligocene, the eastern margin of the basin is uplifted by uplifting folds, accompanied by strong magma accretion, and the compression is strengthened westward, which induced the Xihu depression to undergo differential lifting movement under the compression background, resulting in the eruption of deep fluids along the weak zone of the rock mass. The extension direction of the red arrow in the figure represents the relative direction of rock mass movement.
Minerals 14 00413 g013
Figure 14. Typical seismic profile (A) and corresponding geological profile (B) passing through Well D and C in the Xihu Depression, East China Sea Shelf Basin. The red-marked coarse fault around Well D enters the basement downward and cuts upward through T12 (YQ Fm). This type of fault cuts through multiple horizons longitudinally. It is presented as NNE distribution on the plane (Figure 1B), where the plane distribution is consistent with the principal stress direction of the basin in the late Eocene and is defined as a deep and large fault. The position of the EE’ profile is shown in Figure 1. T10–T40 represents the seismic interface (Figure 2).
Minerals 14 00413 g014
Figure 15. Paleo-fault throw (A), fault activity rate (B), and fault growth index (C) of the Xihu Depression were statistically analyzed. The activity of the coarse fault adjacent to Well D is studied in Figure 14B. Fault growth index > 1.1, fault activity rate >18 m/Ma, and paleo-fault throw >50 m; these results indicate the intense activity of the fault. YQ = Yuquan; LJ1 = upper Longjing; LJ2 = lower Longjing; HG1 = upper Huagang; HG2 = lower Huagang; PH1 = upper Pinghu; PH2 = middle and upper Pinghu; PH3 = middle and lower Pinghu; PH4 = lower Pinghu; Fm = formation.
Minerals 14 00413 g015
Figure 16. Mechanical compaction characteristics of minerals in sandstone thin sections in the Ph2 Fm of Well A. (A) The mica shows the directional arrangement and bending deformation under mechanical compaction (+), 4054.26 m. (B) The long axes of mica and drilling cuttings are oriented under the orthogonal light, 4054.76 m. (C) The mica shows the directional arrangement and bending deformation under mechanical compaction (+), 4058.26 m. (D) The feldspar is deformed due to the mechanical compaction under the orthogonal light, 4059.26 m. M = mica, F = feldspar.
Minerals 14 00413 g016
Figure 17. Conceptual model for the compaction of mudstone in Xihu Depression, East China Sea Shelf Basin. Stage I is a stage of strong mechanical compaction, where the temperature limit is less than 65–75 °C. The deep fluid activity causes the local temperature to be greater than 65–75 °C, and local chemical compaction could occur in this stage. Stage II is where chemical and mechanical compaction coexist, and the temperature range is between 65–75 °C and 125–135 °C. Stage III is a stage of chemical compaction where the temperature is greater than 125–135 °C; owing to the weakening of the rock mass skeleton and effective stress during the transformation of clay minerals, mechanical compaction occurs locally. The size of the circle represents the relative compaction ratio at a different stage.
Minerals 14 00413 g017
Disclaimer/Publisher’s Note: The statements, opinions and data contained in all publications are solely those of the individual author(s) and contributor(s) and not of MDPI and/or the editor(s). MDPI and/or the editor(s) disclaim responsibility for any injury to people or property resulting from any ideas, methods, instructions or products referred to in the content.

