Article

Accelerated Carbonation of High-Calcite Wollastonite Tailings

Materials Science and Environmental Engineering, Tampere University, 33720 Tampere, Finland
*
Author to whom correspondence should be addressed.
Minerals 2024, 14(4), 415; https://doi.org/10.3390/min14040415
Submission received: 19 March 2024 / Revised: 7 April 2024 / Accepted: 11 April 2024 / Published: 18 April 2024
(This article belongs to the Special Issue CO2 Mineralization and Utilization)

Abstract

:
Wollastonite (CaSiO3) is the most researched and well-defined mineral in the field of CO2 mineralization, but it is also a sought-after process mineral and thus, not easily justified for large scale ex situ carbon sequestration, which requires an energy-intensive step of comminution to increase reactivity. Wollastonite-rich mine tailings are a side stream with an already fine particle size resulting from the extractive process, but their effective utilization is problematic due to legislation, logistics, a high number of impurities, and chemical inconsistency. In this study, the accelerated weathering (aqueous carbonation) of high-calcite (CaCO3) wollastonite tailings was studied under elevated temperatures and high partial pressures of CO2 to determine the carbon sequestration potential of those tailings compared to those of pure reference wollastonite originating from the same quarry. The main process variables were pressure (20–100 bar), temperature (40 °C–60 °C), and time (10 min–24 h). Despite consisting largely of non-reactive silicates and primary calcite, very fine tailings showed promise in closed-chamber batch-type aqueous carbonation, achieving a conversion extent of over 28% in one hour at 100 bar and 60 °C.

Graphical Abstract

1. Introduction

Large amounts of wollastonite (CaSiO3 or Ca3(Si3O9))-rich tailings have been produced and stored on-site annually as a side stream of limestone mining operations in Lappeenranta, Finland [1]. Extensive successful efforts have recently been expended to minimizing the accumulation of this valuable side stream into spoil tips [2], but while the utilization of extracted material can currently be above 90%, tailings containing notable amounts of wollastonite are still produced, and large amounts of pre-existing fractions are available. Thus, evaluating the tailings’ potential for processes like mineral carbonation is as pertinent as ever. As they are already very finely ground by the extractive process, tailings offer an appealing option to primary sources where a large amount of energy is expended on comminution to ensure adequate surface area for carbonation. However, the main challenge of utilizing tailings as a raw material feedstock for materials processing or chemical reactions is their impurity and mixed mineralogy, i.e., there are several minerals competing for aqueous reactivity, and the wollastonite content can be very low.
Wollastonite is among the silicates that have garnered much attention in research as possible carbon capture minerals for CCS (carbon capture and storage) processes. While the current focus is emphasizes Mg-based silicates due to their capacity to immobilize more CO2 per ton of rock [3], due to its high reactivity in CO2 environment compared to most other silicates, wollastonite is frequently used as a model mineral to study basic phenomena in the field [4,5,6,7].
The general reaction for direct carbonation is:
MSiO3 (s) + CO2 (g) → MCO3 (s) + SiO2 (s)
where M is a divalent cation, such as magnesium (Mg2+), iron (Fe2+), or in the case of wollastonite, calcium (Ca2+). The direct gas–solid carbonation depicted by reaction (1) is currently restricted to systems with flue gas flow, and it is not commonly viewed as a viable route for large-scale processes entailing natural minerals. Instead, the more versatile aqueous route, consisting of three main steps, is commonly suggested [4]:
The formation of carbonic acid and bicarbonates, lowering the pH of the aqueous phase:
CO2 (g) + H2O (l) → H2CO3 (aq) → HCO3 (aq) + H+ (aq)
The dissolution of calcium from wollastonite into the low-pH solution:
CaSiO3 (s) + 2H+ (aq) → Ca2+ (aq) + H2O (l) + SiO2 (s)
The precipitation of calcium carbonate:
Ca2+ (aq) + HCO3 (aq) → CaCO3 (s) + H+ (aq)
Mineral carbonation, including aqueous reactions (2)–(4), is a slow natural weathering process that occurs in a geological timescale, making it impractical as a carbon capture method for process environments or atmospheric CO2 immobilization [8]. Overpressure or supercritical CO2 allows for subjecting reactive minerals to conditions where the otherwise very slow carbonation occurs in minutes [9,10]. This also means that the positive or deleterious effects of different process parameters and material variables on the carbonation rate can be studied within a reasonable timescale.
Particle size is an important factor in mineral carbonation, since the reaction depth towards bulk and thus, the amount of unreacted mineral, is determined by the parameters that dictate the overall carbonation starting conditions (pressure, temperature, time, water to solid ratio) [10]. This means that the volume ratio of carbonate to unreacted wollastonite increases as particle size decreases, effectively improving carbonation yield. However, while calcination or grinding to finer size could significantly increase the CO2 intake of suitably reactive mineral matter, the focus of this paper is on identifying the inherent potential or limitations for ex situ carbonation of select tailings, with as little pre-treatment as possible. Thus, dry but otherwise as-received fractions were tested under various combinations of time, pressure, and temperature to accurately represent the potential of already existing high-calcite wollastonite tailings feedstock.

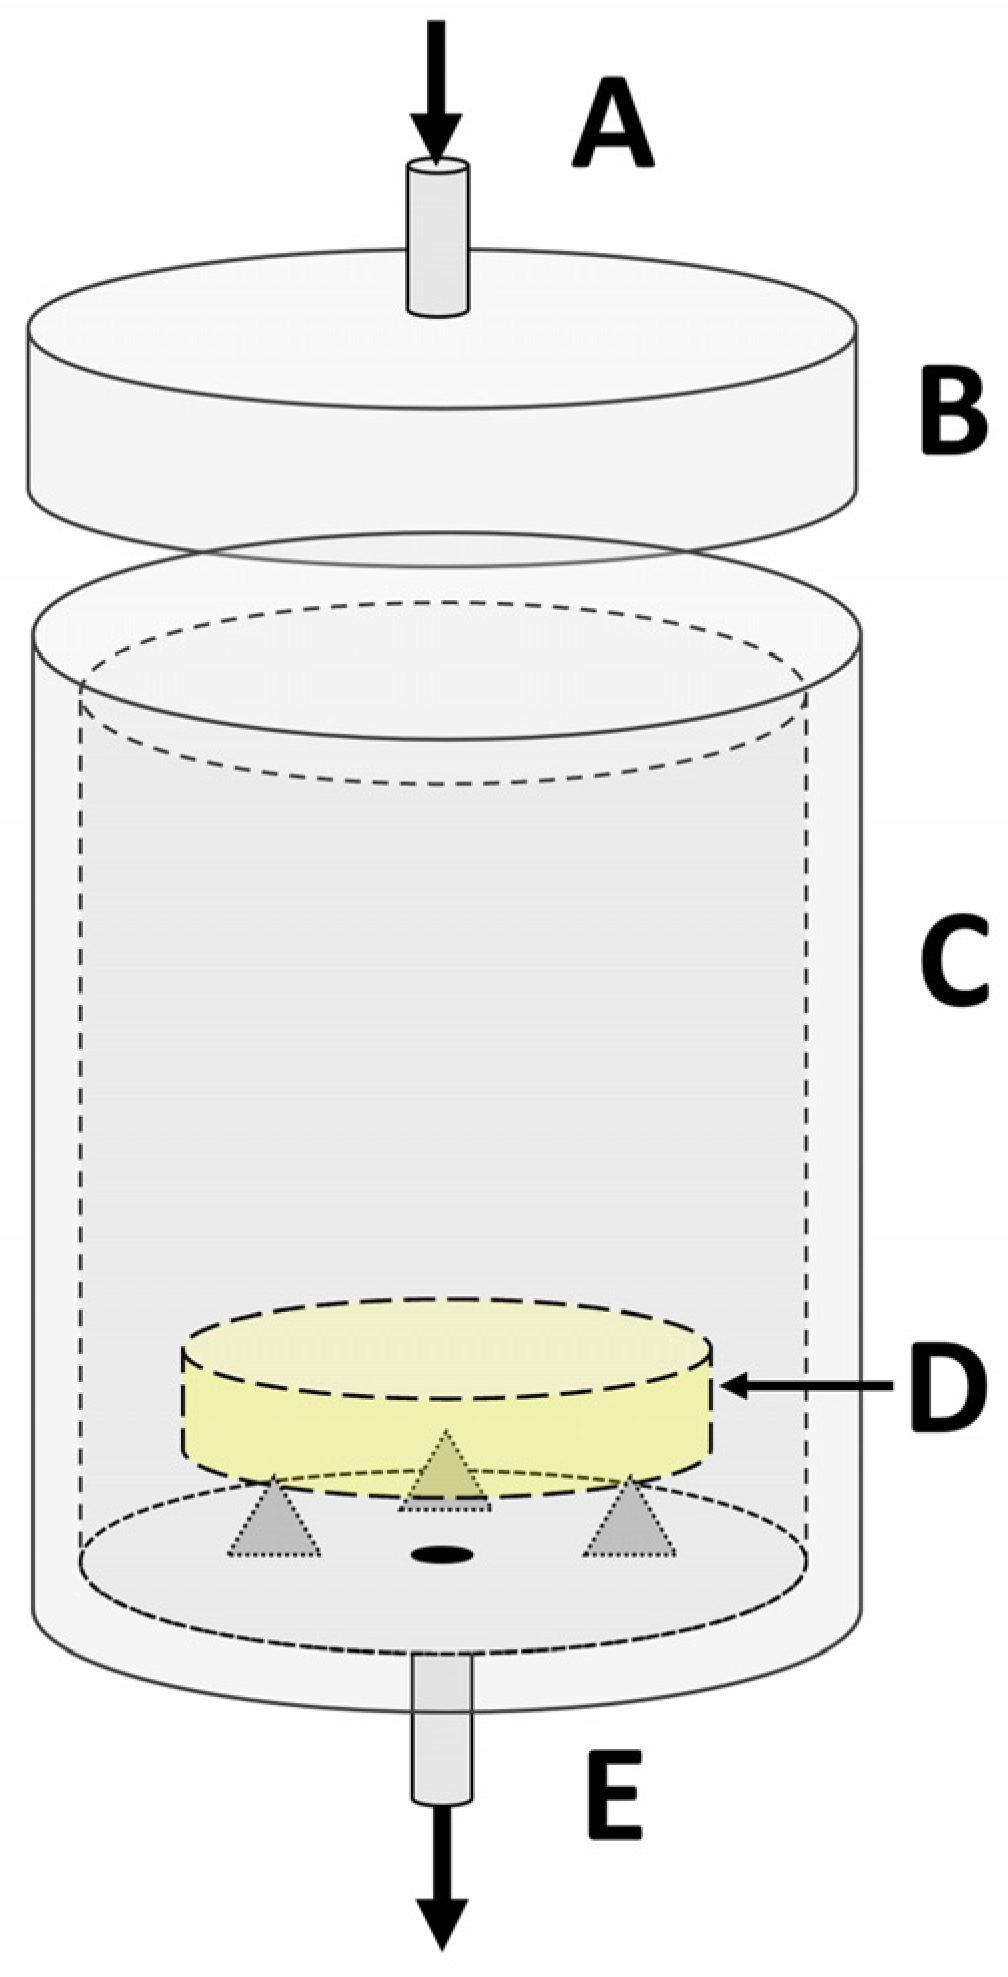
2. Materials and Methods

The two wollastonite-rich side stream tailing fractions (Table 1) studied herein were obtained from a limestone mining operation (Ihalainen, Lappeenranta, Finland). The tailing fractions were in an as-received state, with no additional comminution or sieving performed. The as-received state of the tailings meant that a large number of minerals other than wollastonite also occurred. Tailing mineralogy (determined in our previous work [1]) was compartmentalized in a way that best suited the framework of this study, dividing non-wollastonite minerals into reactive Ca-silicates, inherent carbonates, and other. Inherent carbonates include calcite (calcium carbonate, CaCO3), which is also the main reaction product of wollastonite carbonation. To distinguish between inherent calcite and the reaction product, for the remainder of this paper, these will be referred to as “primary calcite” and “secondary calcite”, respectively.
Two commercial grades of low aspect ratio wollastonite (length-to-diameter ratio L/D < 5, Nordkalk) originating from the same quarry were used as a reference (see Table 2). As the tailing samples originated from an outdoor storage facility, the fractions were stored in a 40 °C heat cabin before carbonation and subsequent characterization to eliminate excess moisture.
SEM (scanning electron microscopy) imaging and EDS mapping were performed with an IT-500 (Jeol, Tokyo, Japan). Carbon was excluded from the SEM analysis due to a large inaccuracy caused by carbon tape and carbon evaporation being used in sample preparation. Specific surface areas (SSA) were measured with a 3Flex 3500 micropore gas adsorption analyzer (Micromeritics, Northcross, GA, USA, 2017), using nitrogen as the probe gas.
The carbonations were performed as batch-type aqueous carbonations in a sealed 1.57 L pressure vessel of a purpose-built supercritical carbon dioxide (scCO2) reactor (details in Appendix A). A total of 10 mL of deionized water was mixed with 3.0 g of mineral matter in an uncovered glass Petri dish, producing a water-to-mineral ratio of 3.3, which is roughly in the range used by others [11,12,13] to ensure that water is not a rate-limiting factor. The overpressures of CO2 used in this study ranged from 20 to 100 bar, and temperatures varied between 40 °C to 60 °C. Carbonation times ranged from 10 min to 24 h.
Pre- and post-carbonation XRD patterns were measured using an Empyrean Multipurpose Diffractometer (Pananalytical, The Netherlands, 2013) with a Cu anode. Measurements were performed from 5 to 100 °2θ, with a step size of 0.026 °2θ, but for the sake of improved readability, the spectra provided in this paper are presented at 5–60 °2θ.
Mass loss related to carbonate decomposition was measured using a thermogravimetric analyzer (Netzsch TG 209 F3 Farsus). Approximately 15 mg of mineral matter was used for the TG measurements. The samples were heated up to 1000 °C, with a heating rate of 10 °C/min under an N2 flow of 40 mL/min.

3. Results

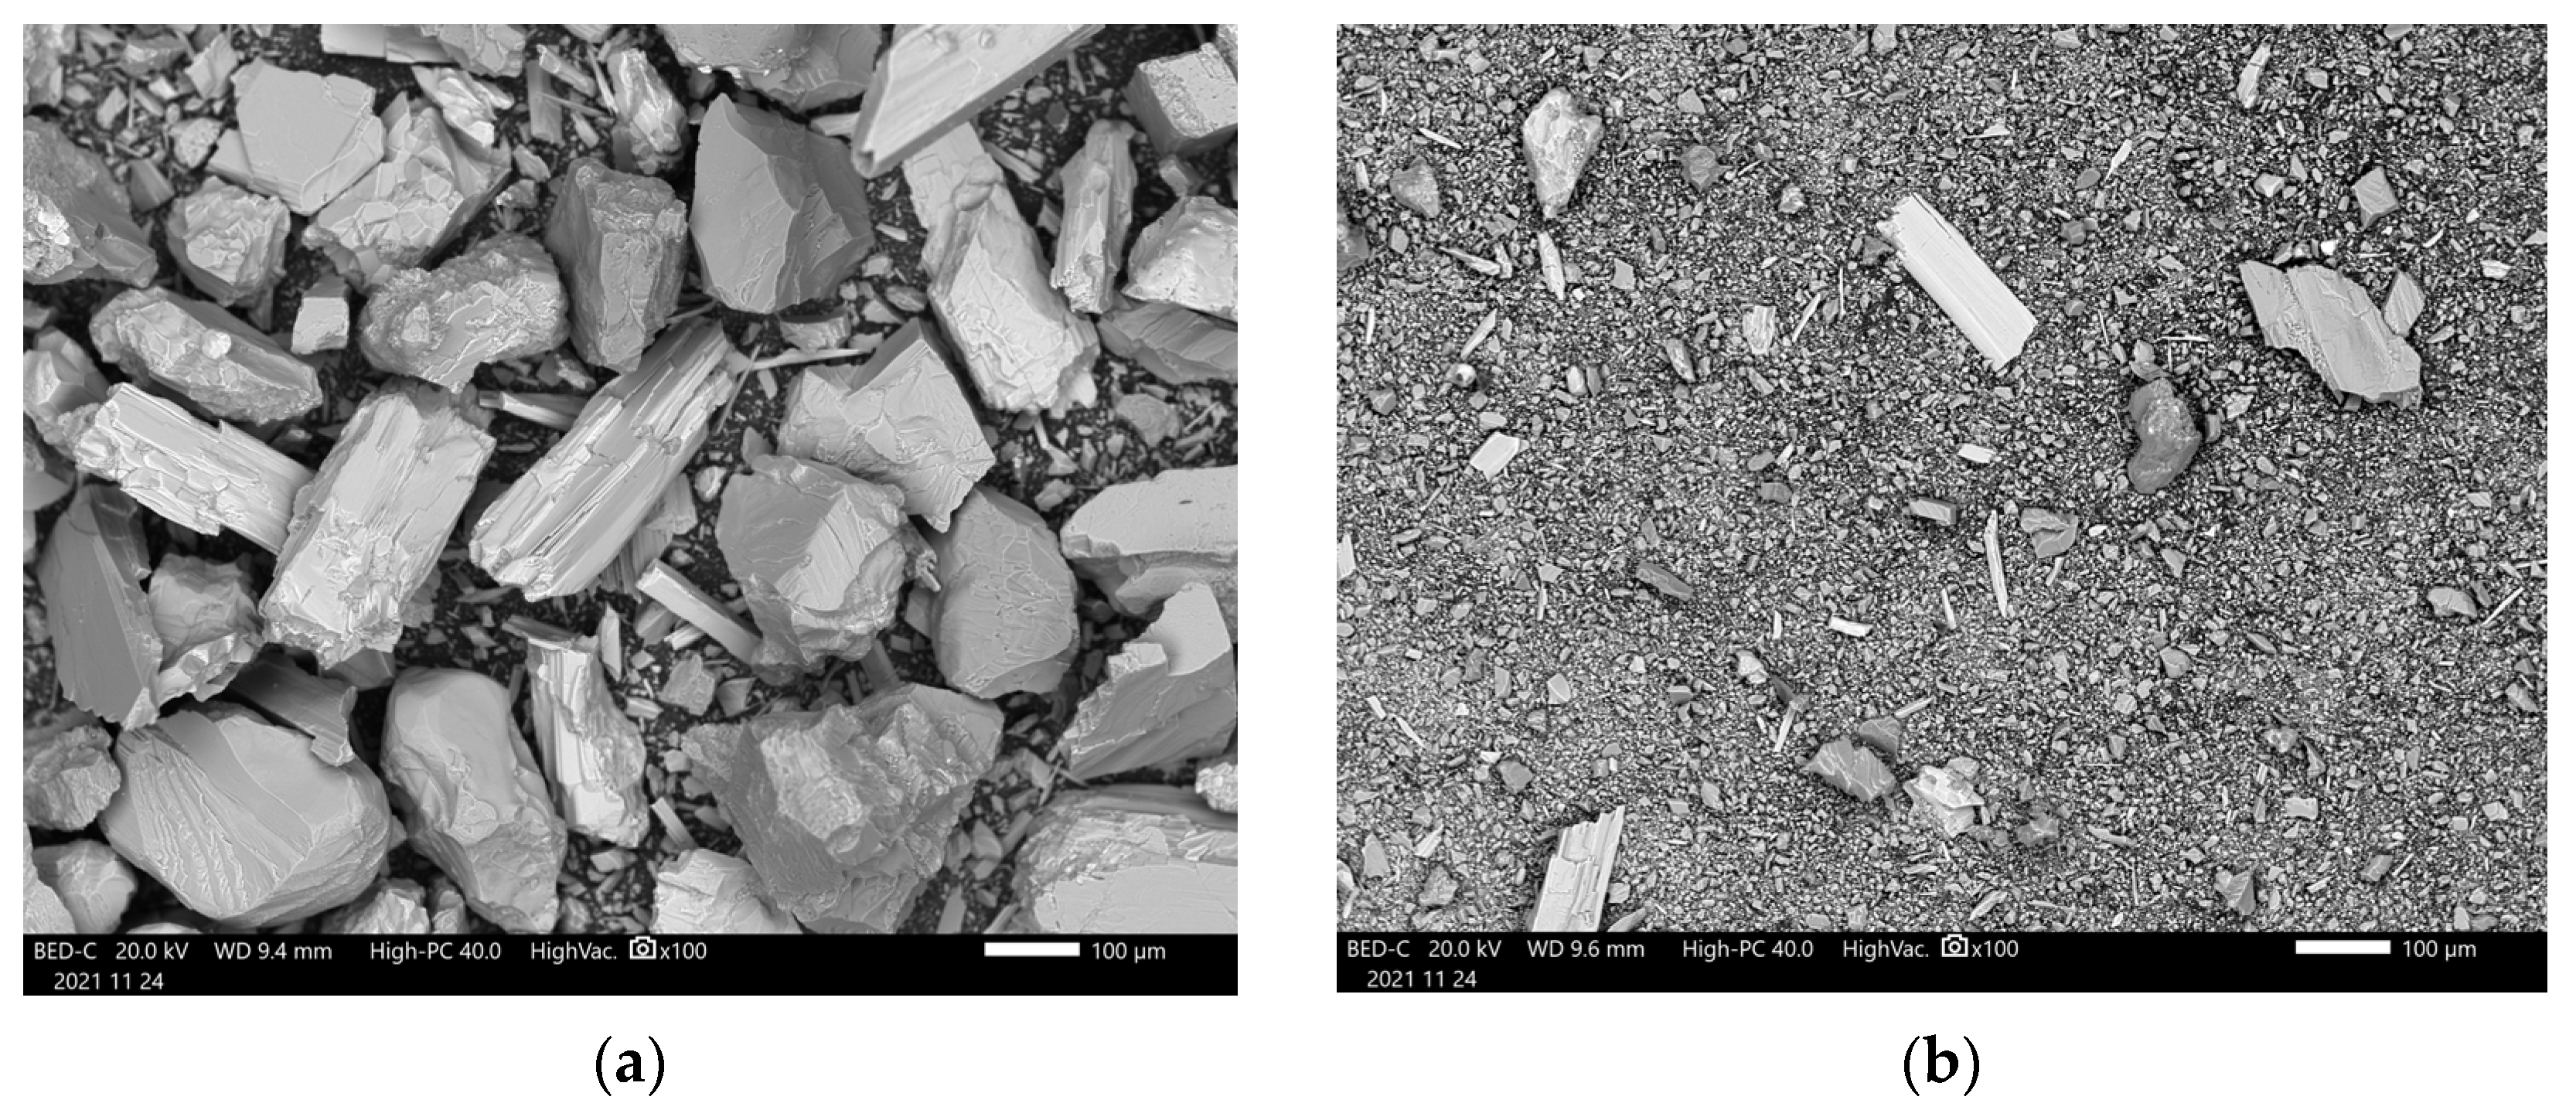
3.1. Pre-Carbonation Characterization

The SEM analysis of the four fractions (Figure 1) highlights the particle size differences in the two tailings and reference wollastonites. W635 and B1 have a similar particle size, the latter possessing some larger (>100 µm) grains of wollastonite, quartz, diopside, and calcite. The W325 is a coarser variant of W635, both of which consist of wollastonite (>87 wt%) and a small amount of impurity quartz, and as indicated by LOI (loss on ignition, Table 2) and a stepwise feature between 600 °C and 800 °C in Figure 2, a small amount of carbonates.
Table 2. Main properties of the studied wollastonite materials.
SampleWollastonite Content [wt%]Particle Size (D50) [µm]SSA [m2/g]LOI [%]
A1 (coarse tailing)30.32000.2710.8
B1 (fine tailing)21.152.2533.7
W325>87 *12.5 *1.35 *0.33
W635>87 *3.5 *3.25 *3.26
* As reported in the manufacturer’s product brochures and safety data sheets.
The EDS analysis of the tailings (Table 3) is in line with modal mineralogy (Table 1): the coarse fraction A1, with an average particle size of well over 100 µm, was significantly more varied in its silicate content and had a lower carbonate content than B1, consisting of coarse grains of wollastonite, calcite, diopside, quartz, and feldspar.
This study first required a pre-carbonation thermogravimetric (TG) analysis to be performed on the dry as-received samples. The step-like TG mass loss of untreated fractions between 600 °C and 800 °C (Figure 2) was attributed to inherent calcite, both for tailings A1 and B1, as well as for reference wollastonites W325 and W635. These values, ranging from 0.33% for W325 to 33.7% for B1, were used as the baseline reference to determine the carbonation extent of wollastonite, where any additional TG mass loss between 600 °C and 800 °C after carbonation was interpreted as the decomposition of wollastonite-derived calcite. Unreacted wollastonite was considered inert under the TG measurement conditions. The wollastonite powders W325 and W635 both showed a small but repeatable mass reduction between 600 °C and 800 °C, which is explained by residual calcite and a slight weathering effect due to storage under atmospheric conditions.
For the coarse tailing A1, there was a slight but repeatable weight loss between 380 °C and 450 °C that suggests the presence of either a hydrated silicate mineral, like talc (Mg3Si4O10(OH)2), or a hydrated carbonate of Ca or Mg. If talc is assumed, the second step of talc decomposition would occur at 800–840 °C [14], potentially adding to the overall observed ΔTG at the temperature window in which calcite decomposes. Thus, if a 1% mass reduction around 400 °C is attributed to talc dehydration, an additional step will follow, producing an additional 4% ΔTG above 800 °C. This adjustment needed to be made per-measurement, since the effect varied between measurement batches, manifesting in some and not in others. This highlights the non-homogenous nature of mine tailings and the resulting difficulty regarding accurate characterization.
The starting pH of the 4 pre-carbonation slurries was universally well above neutral (see Table 4) due to the significantly basic nature of wollastonite, with a natural pH in the region of 10.7, as reported by Huijgen et al. [4]. There was little variation between the four feedstocks, and only one (W635) showed a slight increase in pH at one hour after mixing under atmospheric conditions. In situ pH measurements were not possible using the scCO2 equipment, and the post-carbonation pH was not measured due to the fact that water completely evaporated or dissolved into scCO2 and was subsequently deposited as droplets on the reactor walls.

3.2. Post-Carbonation Characterization

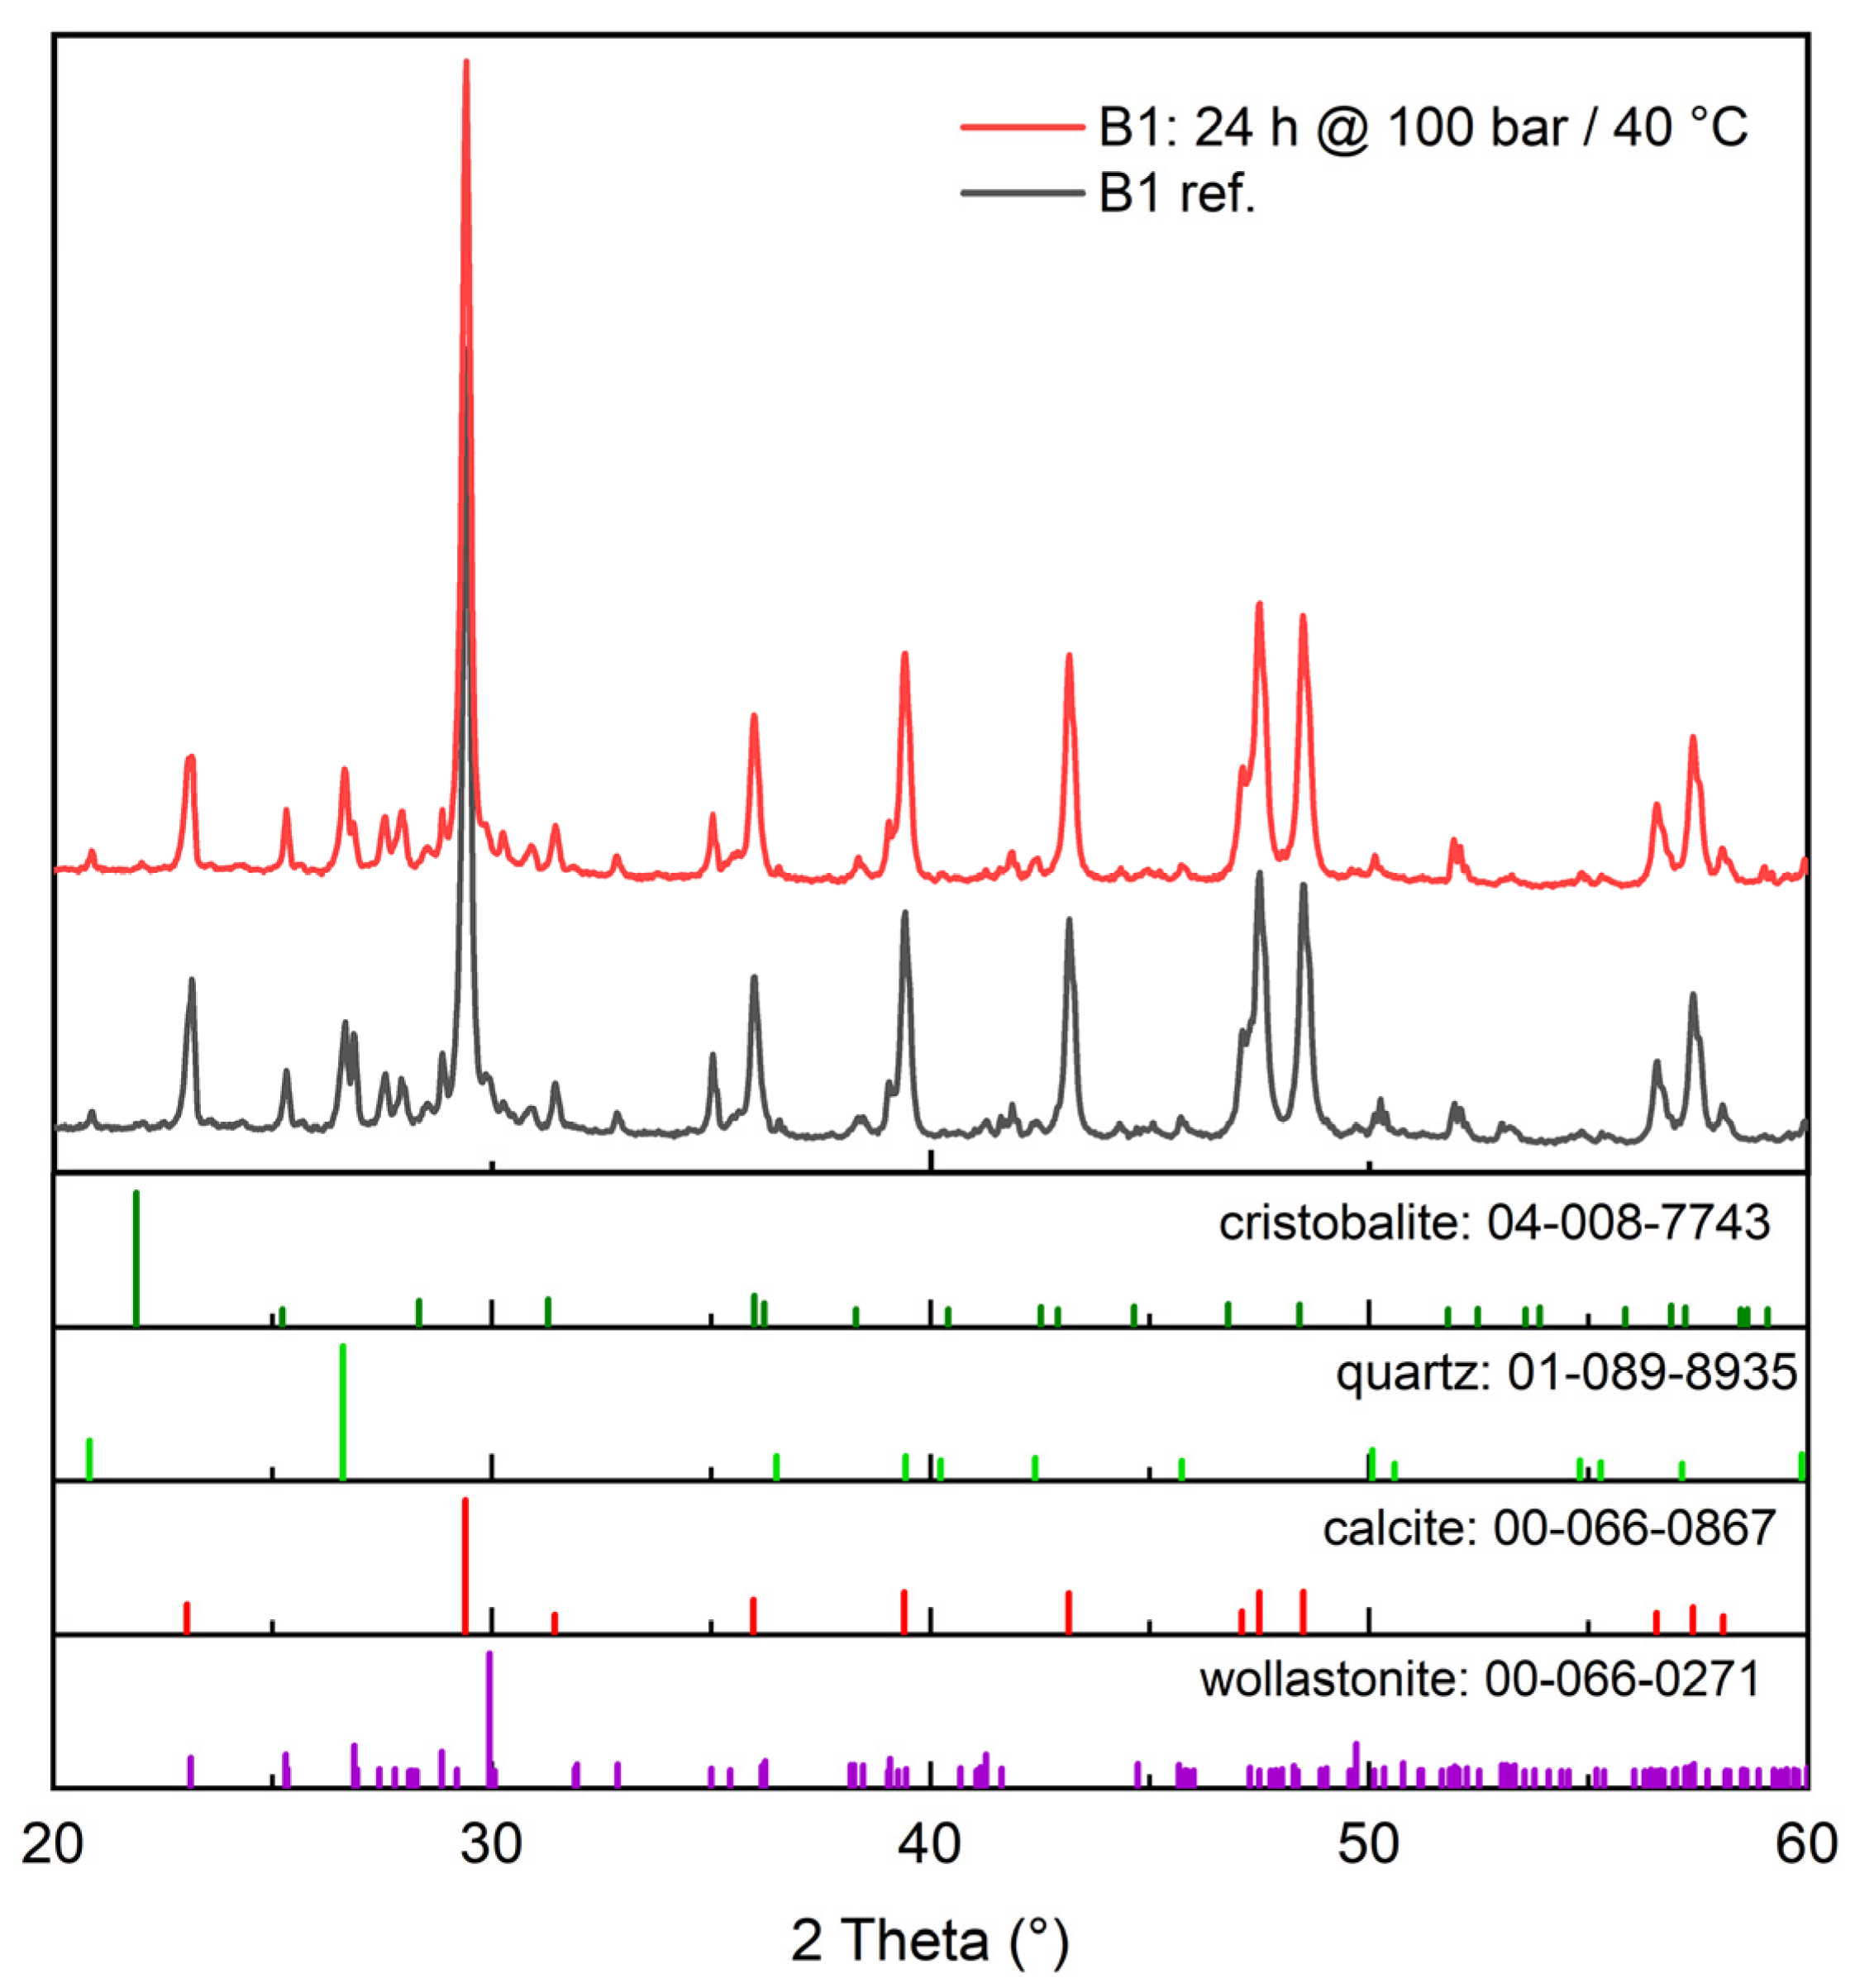
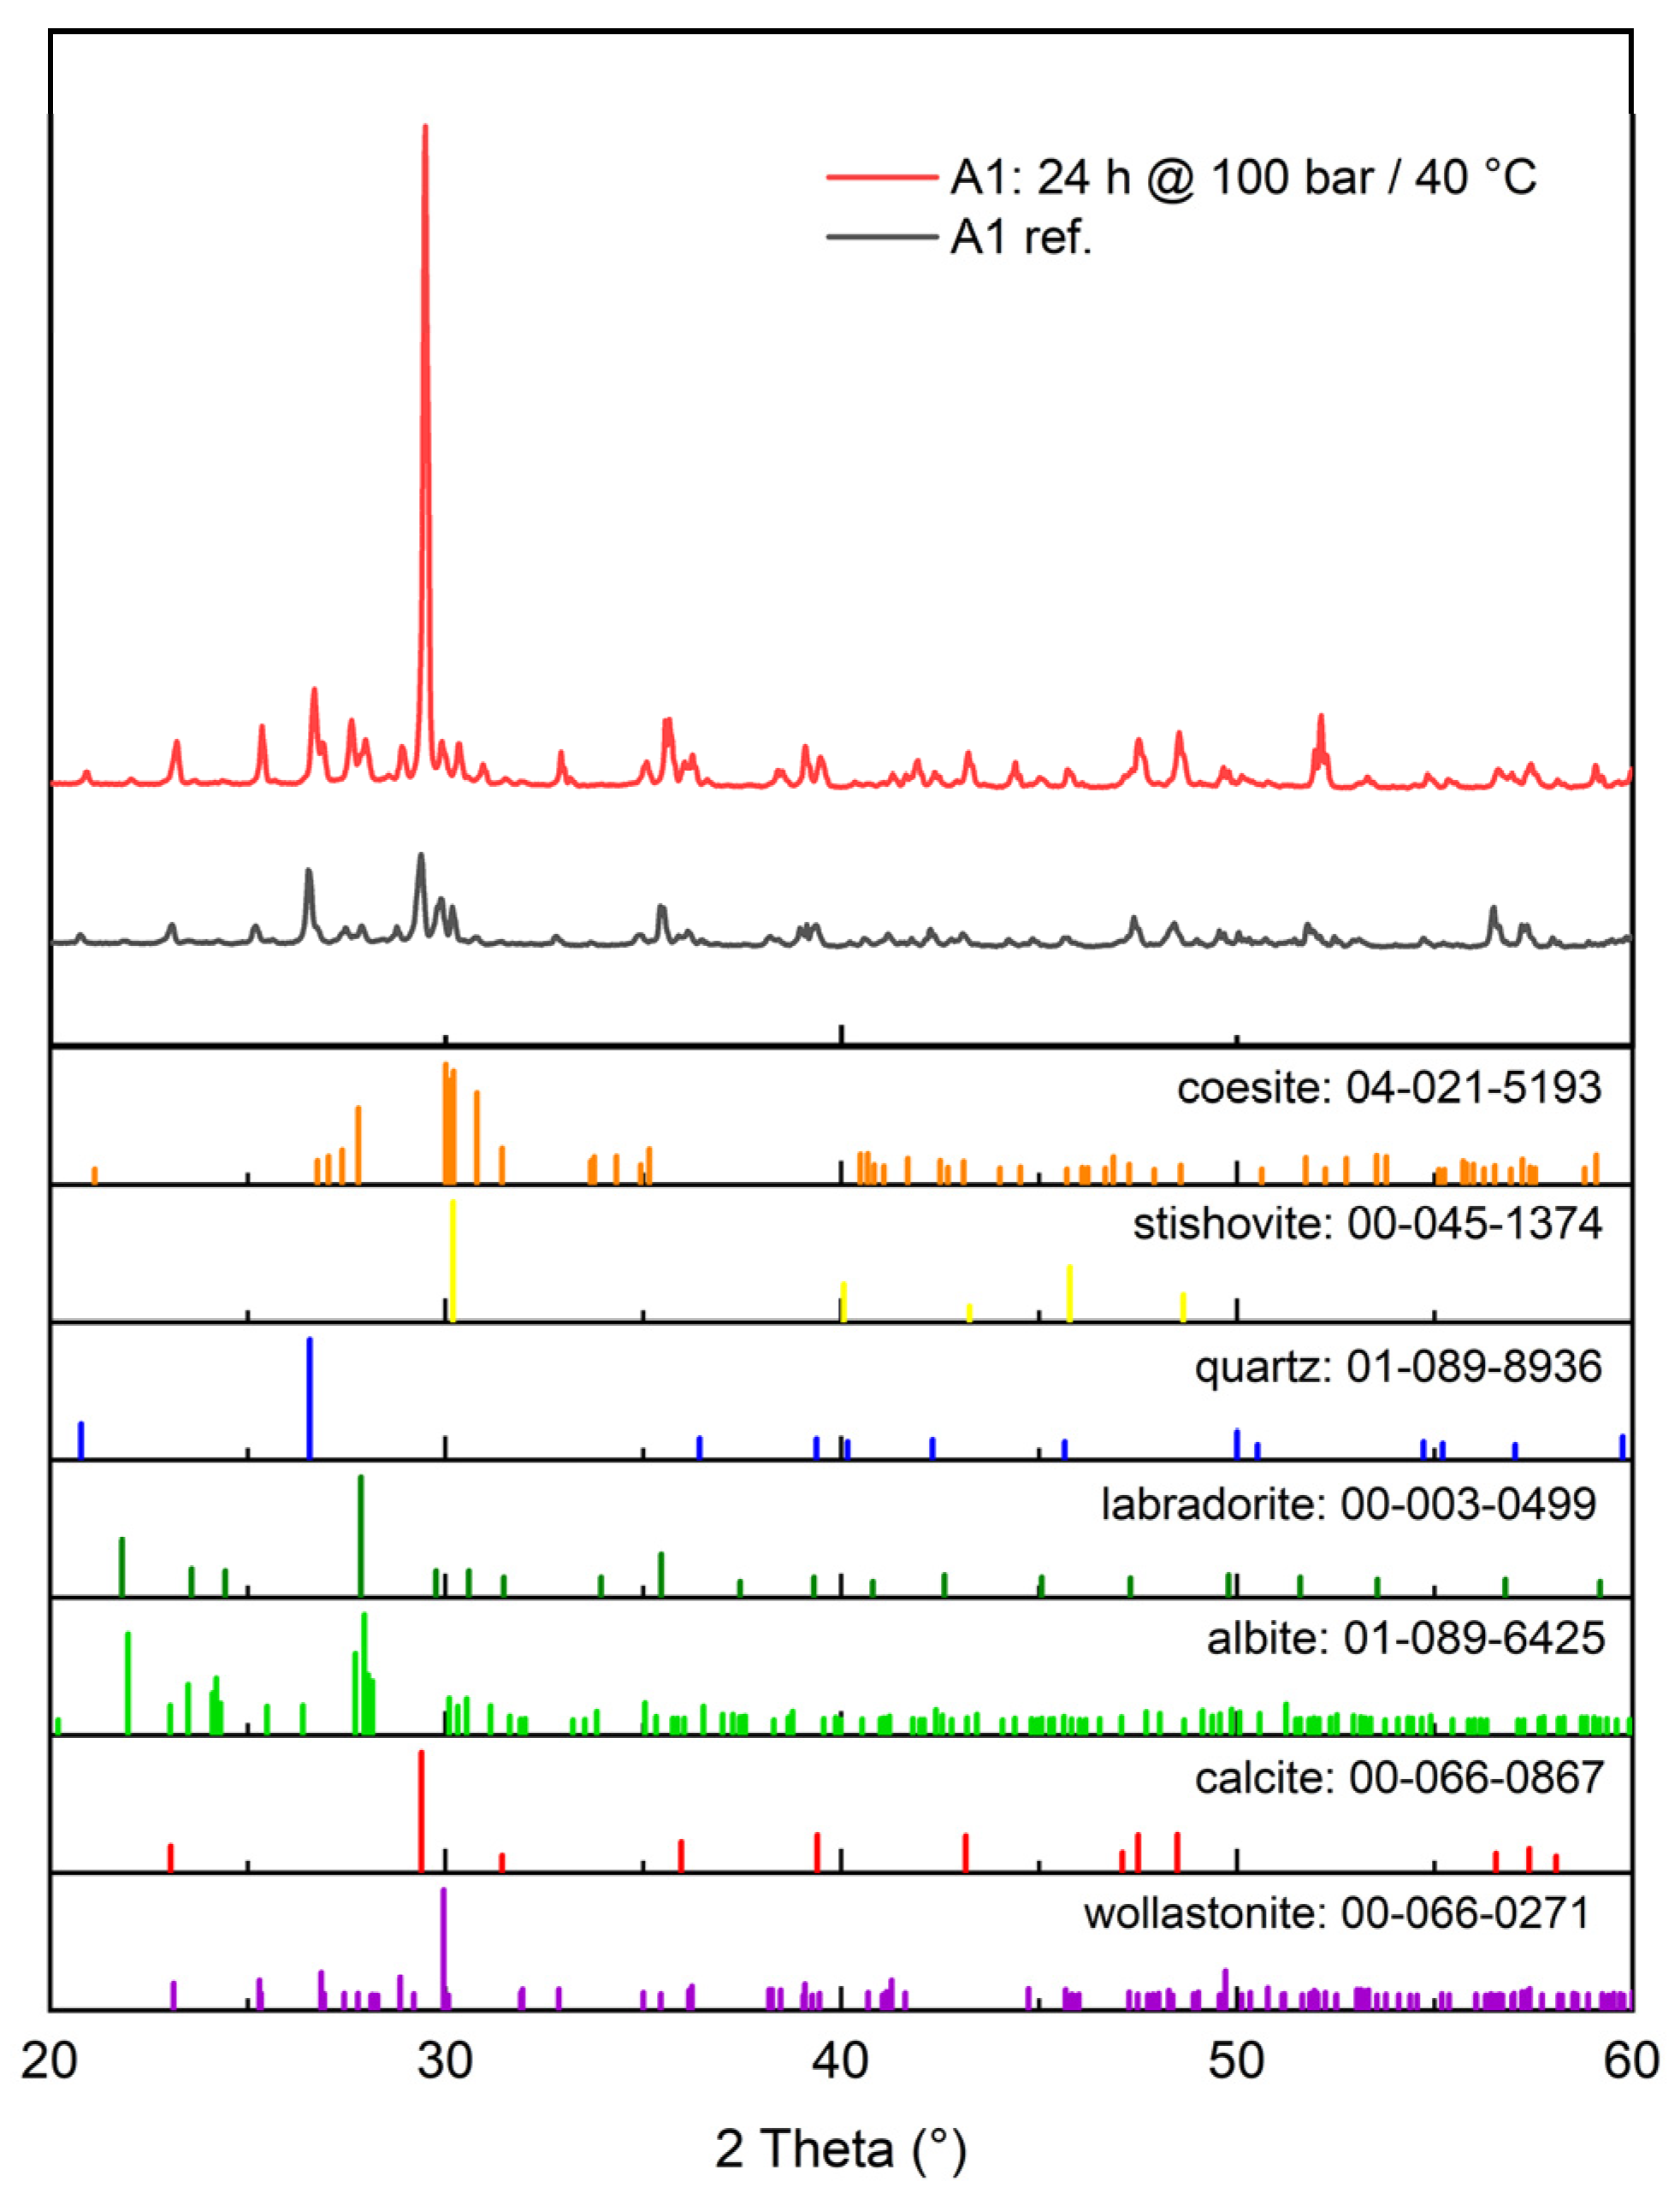
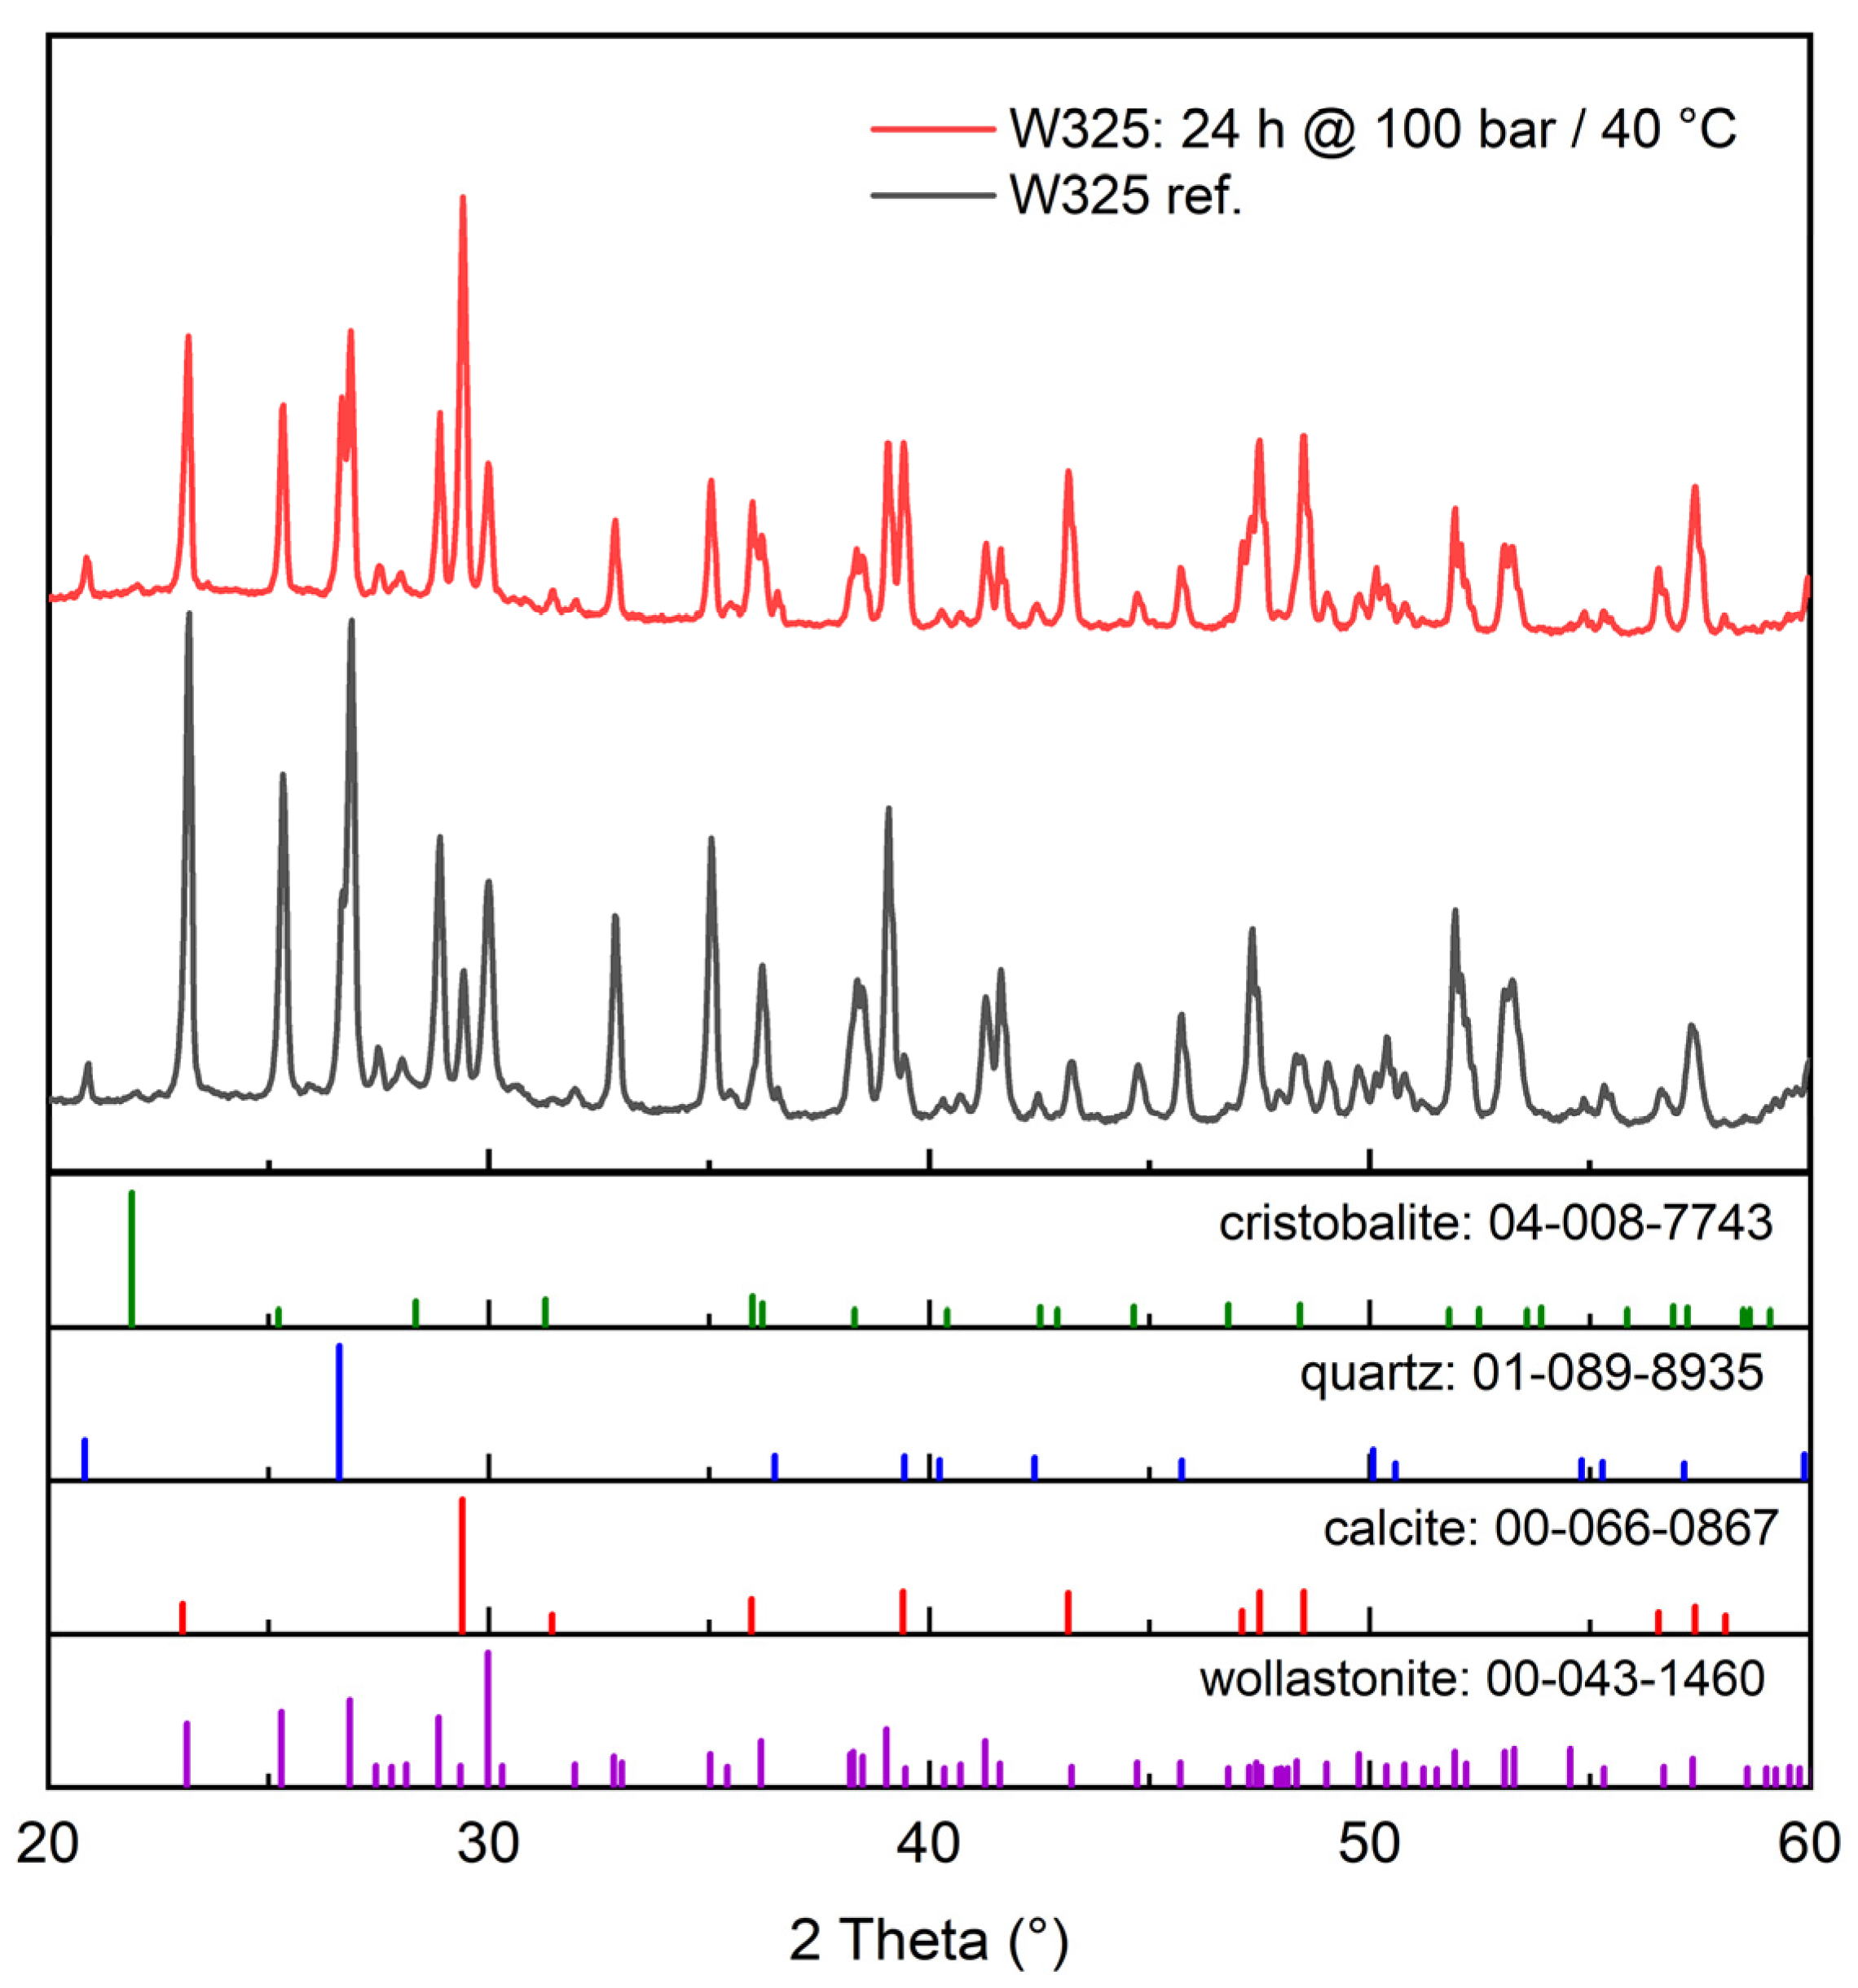
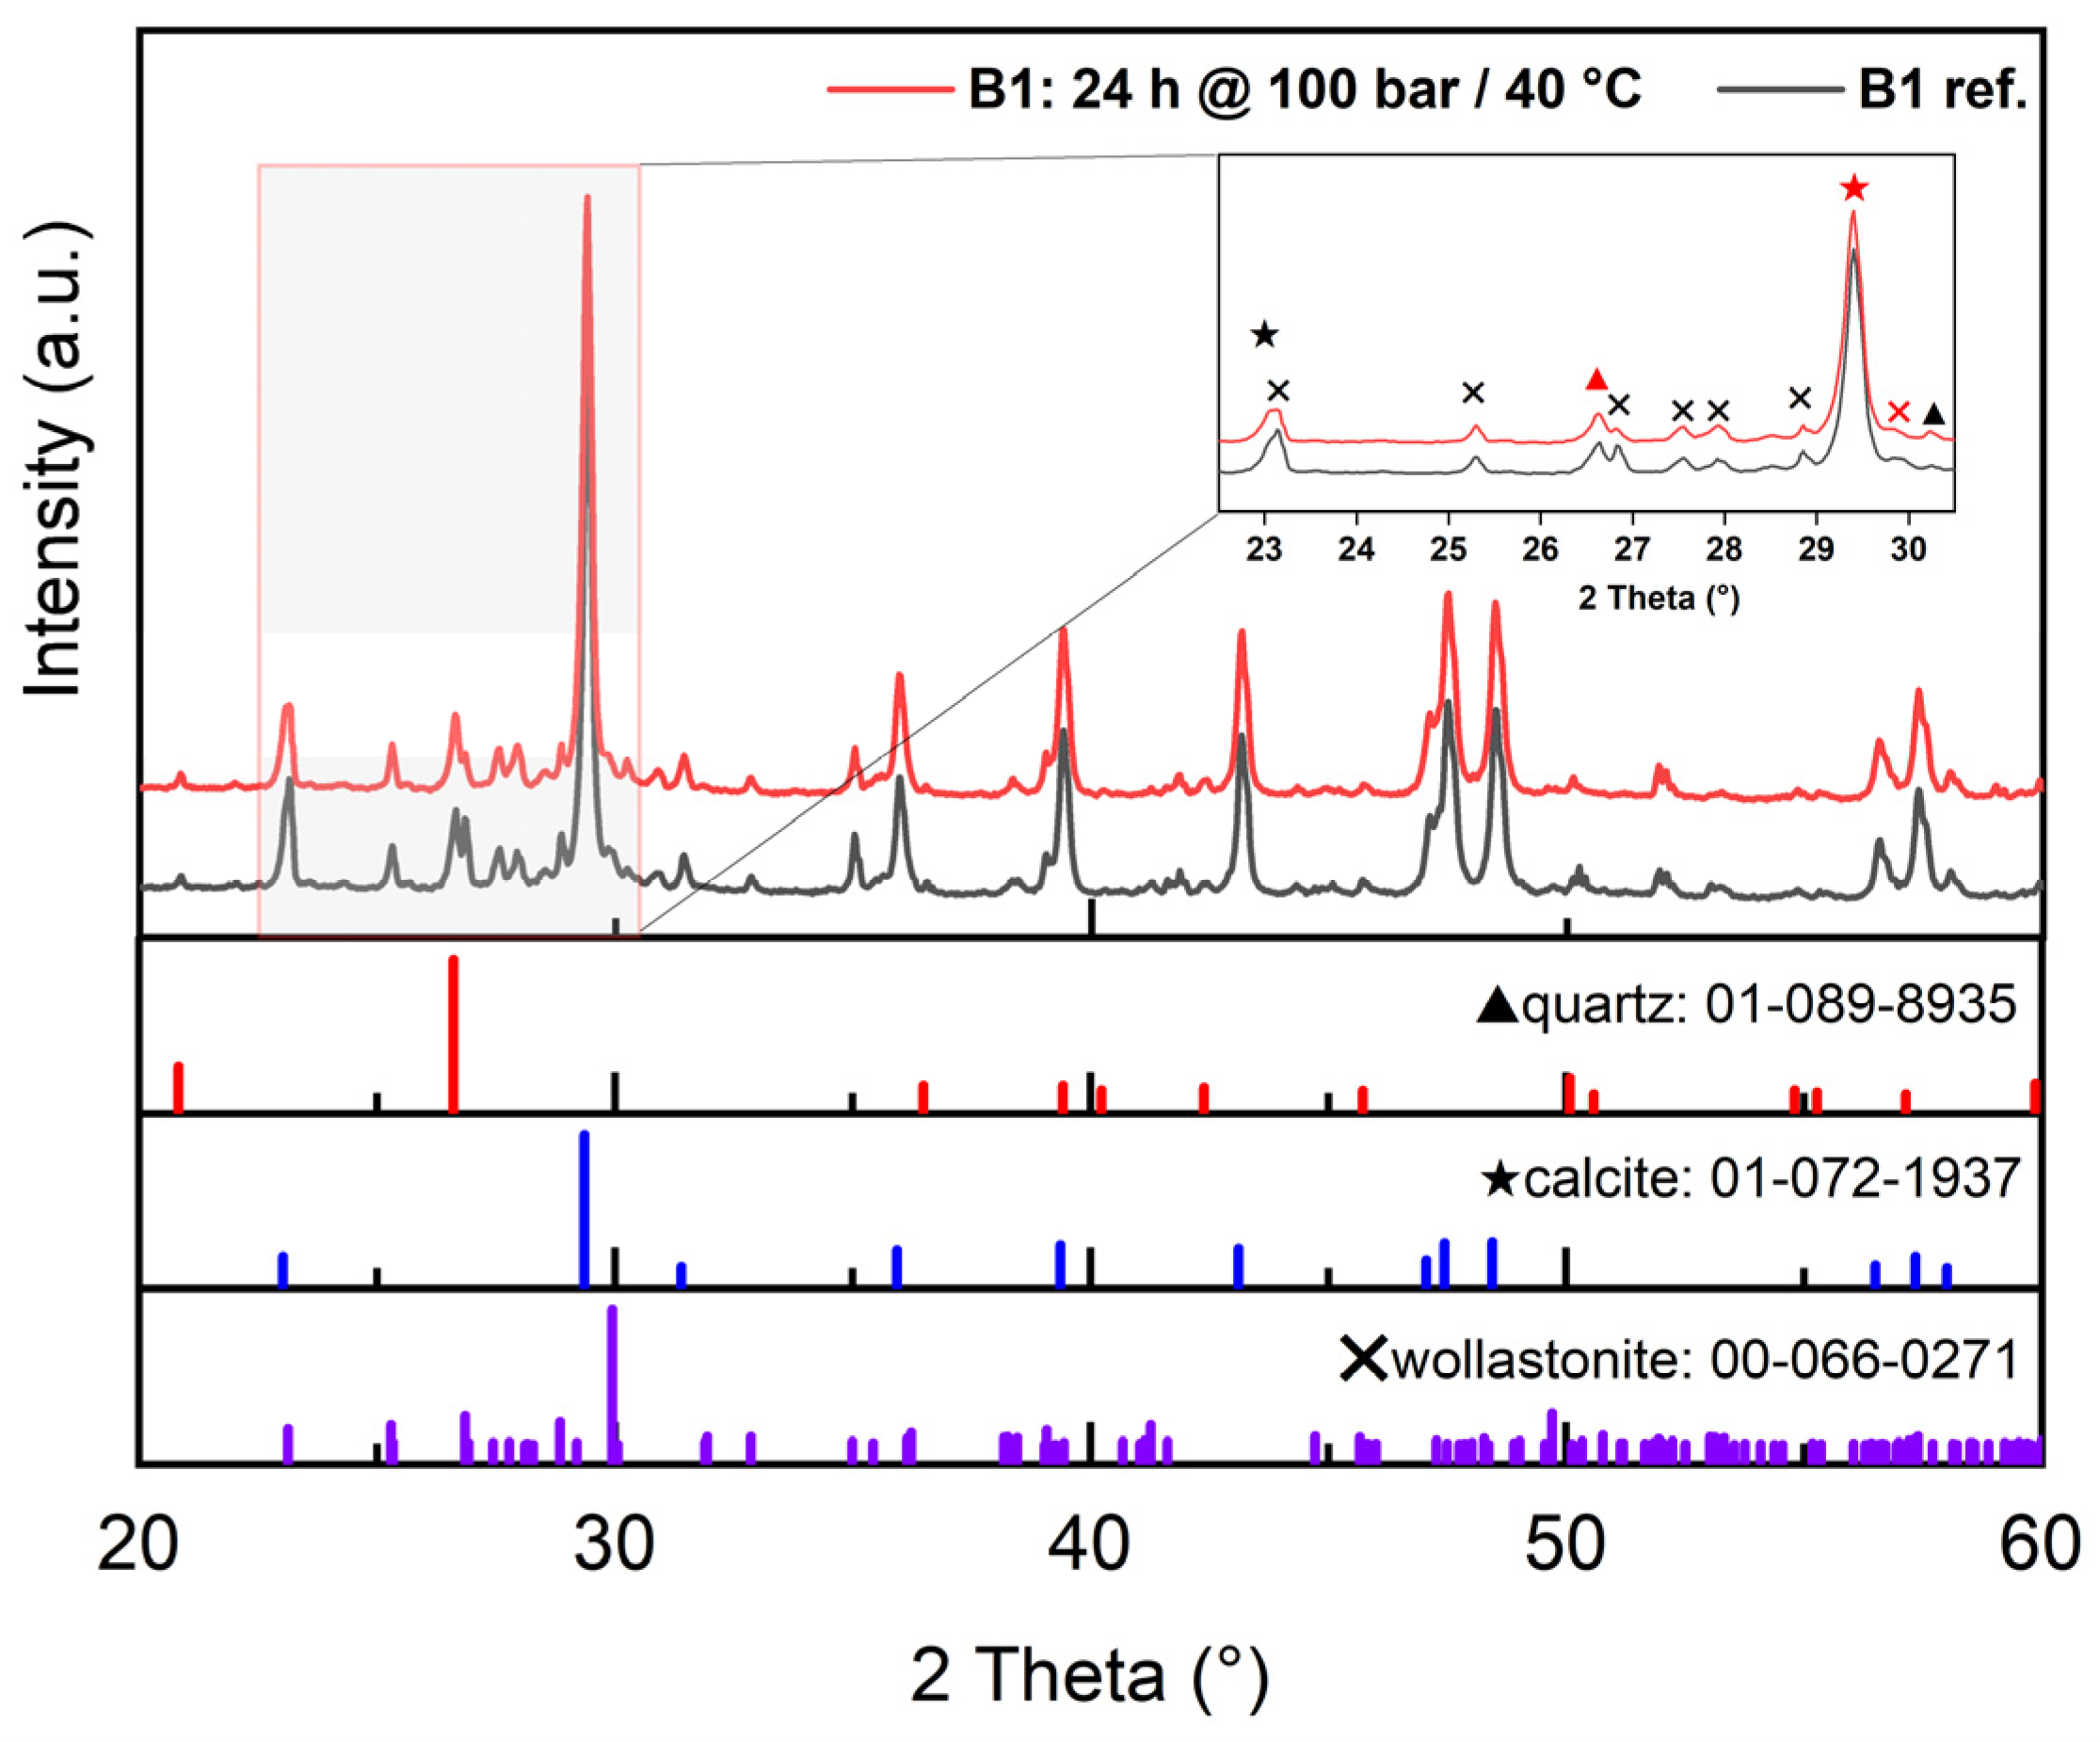
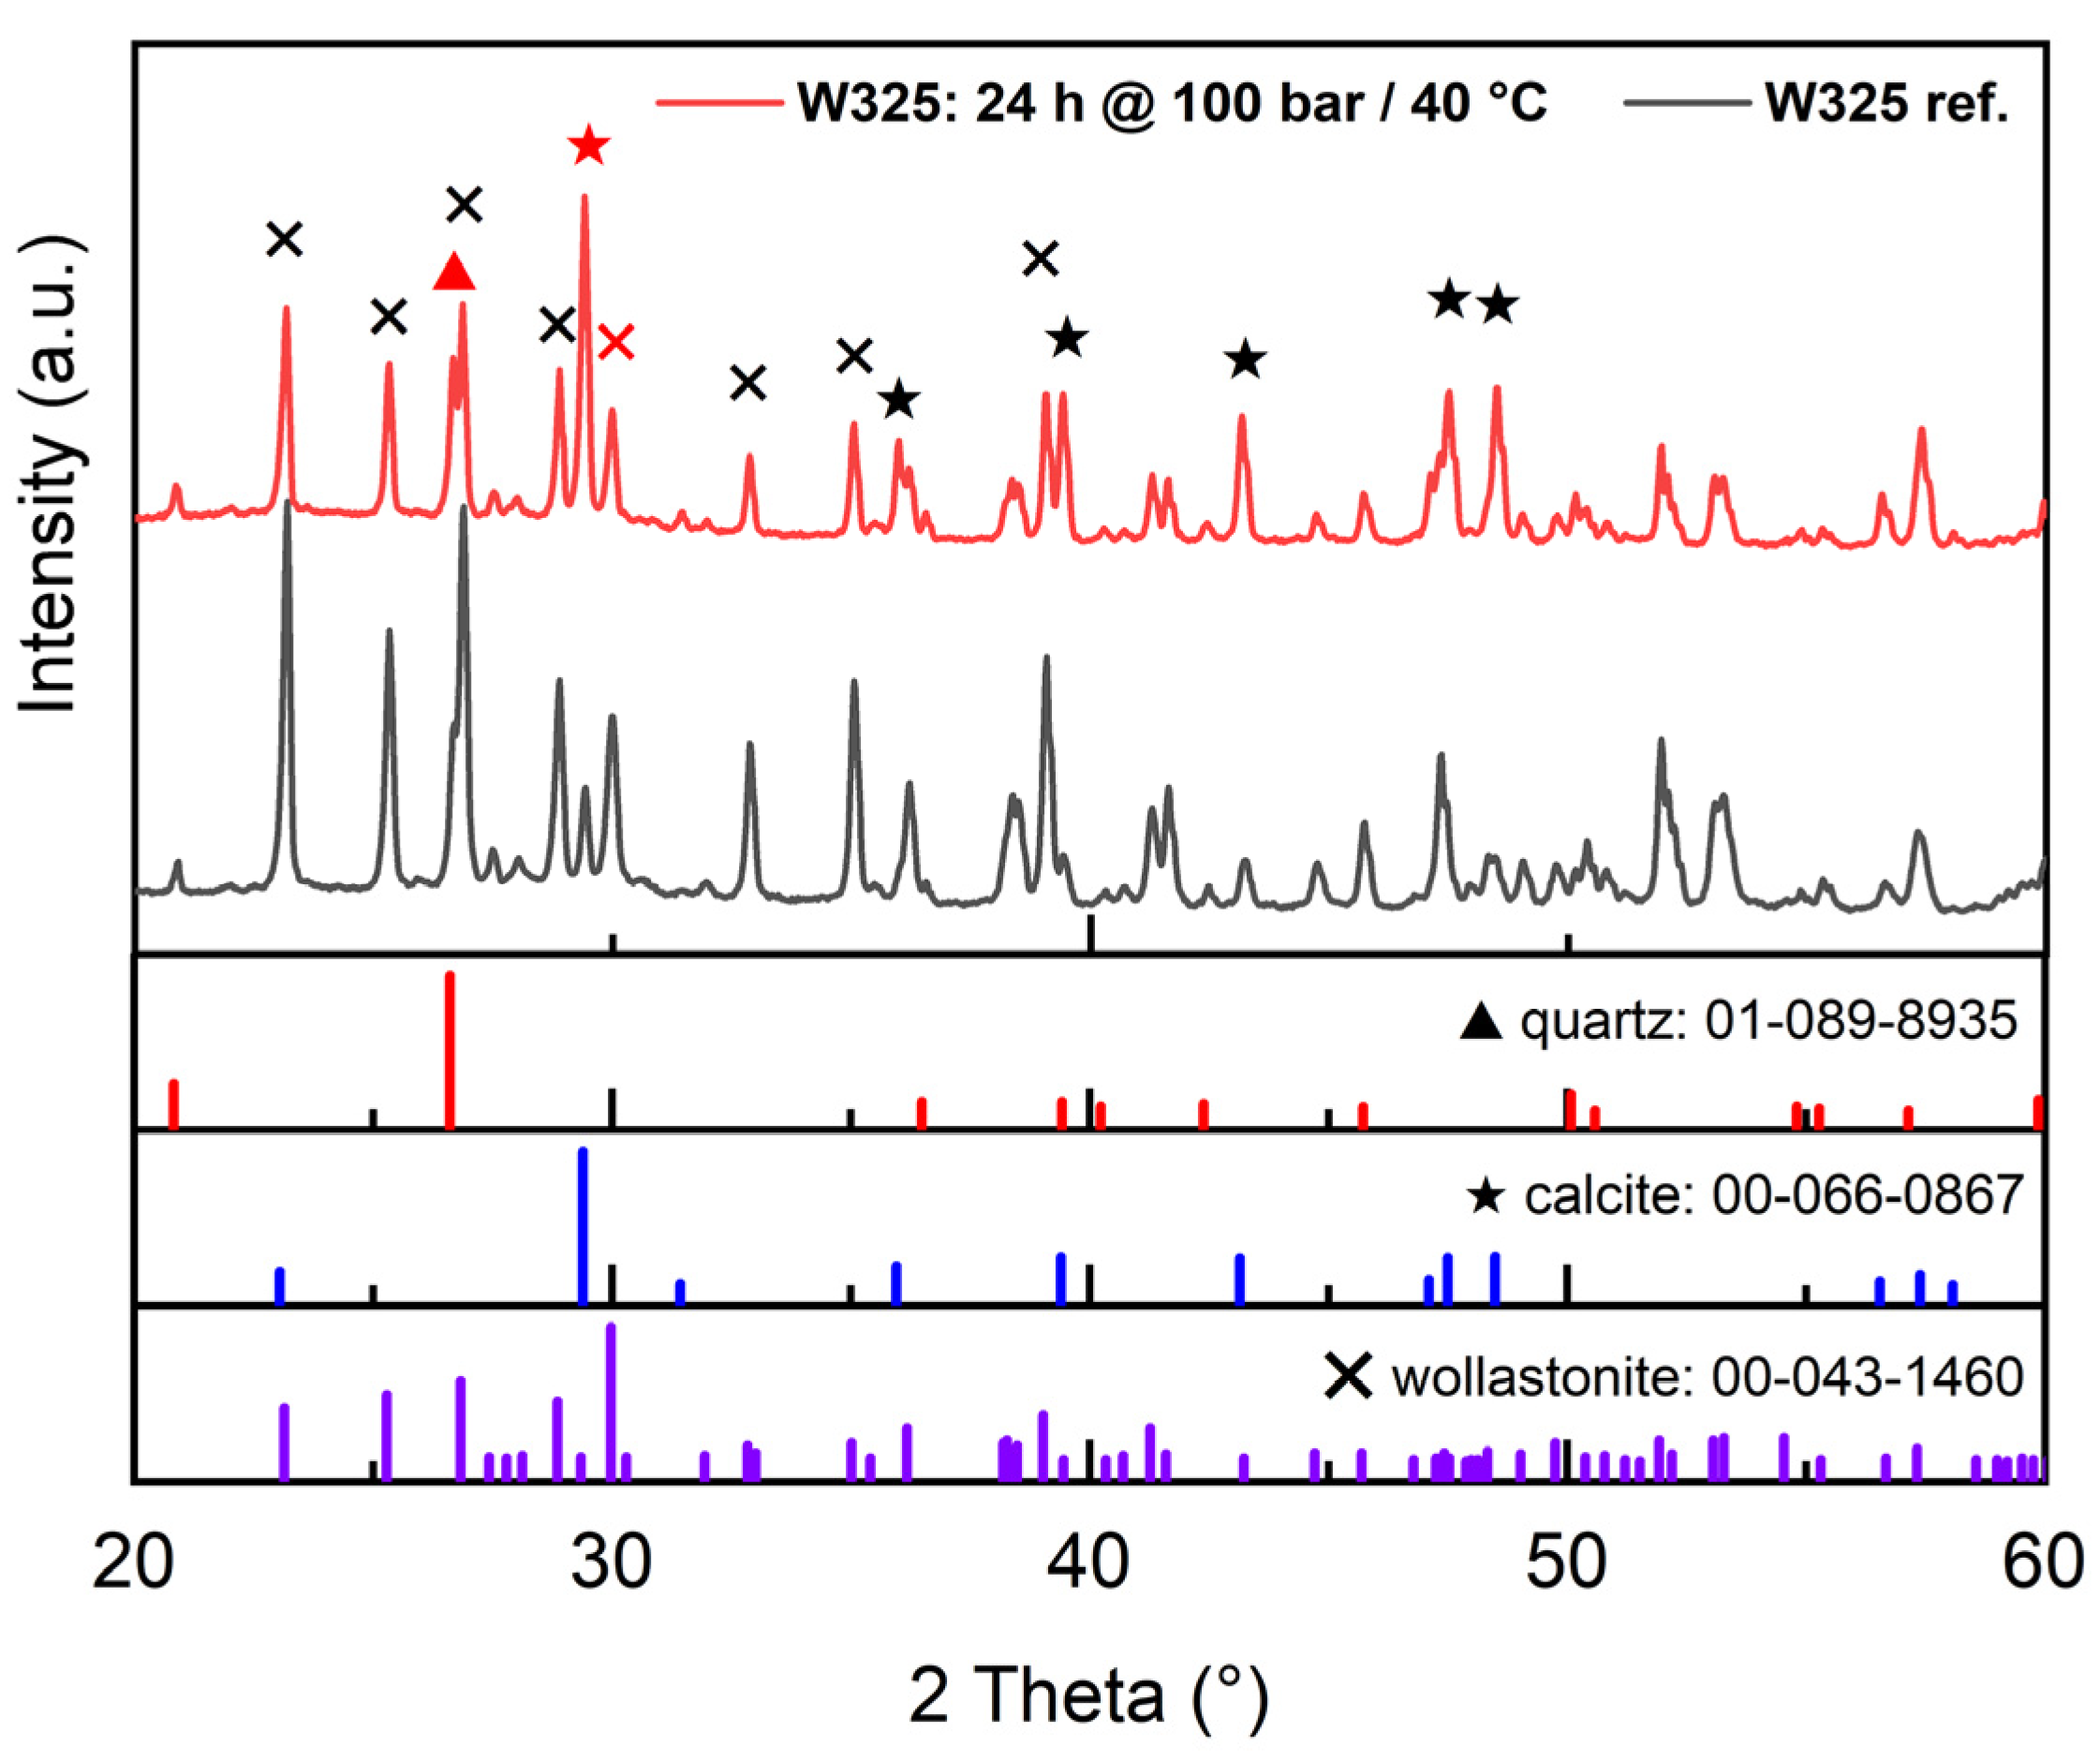
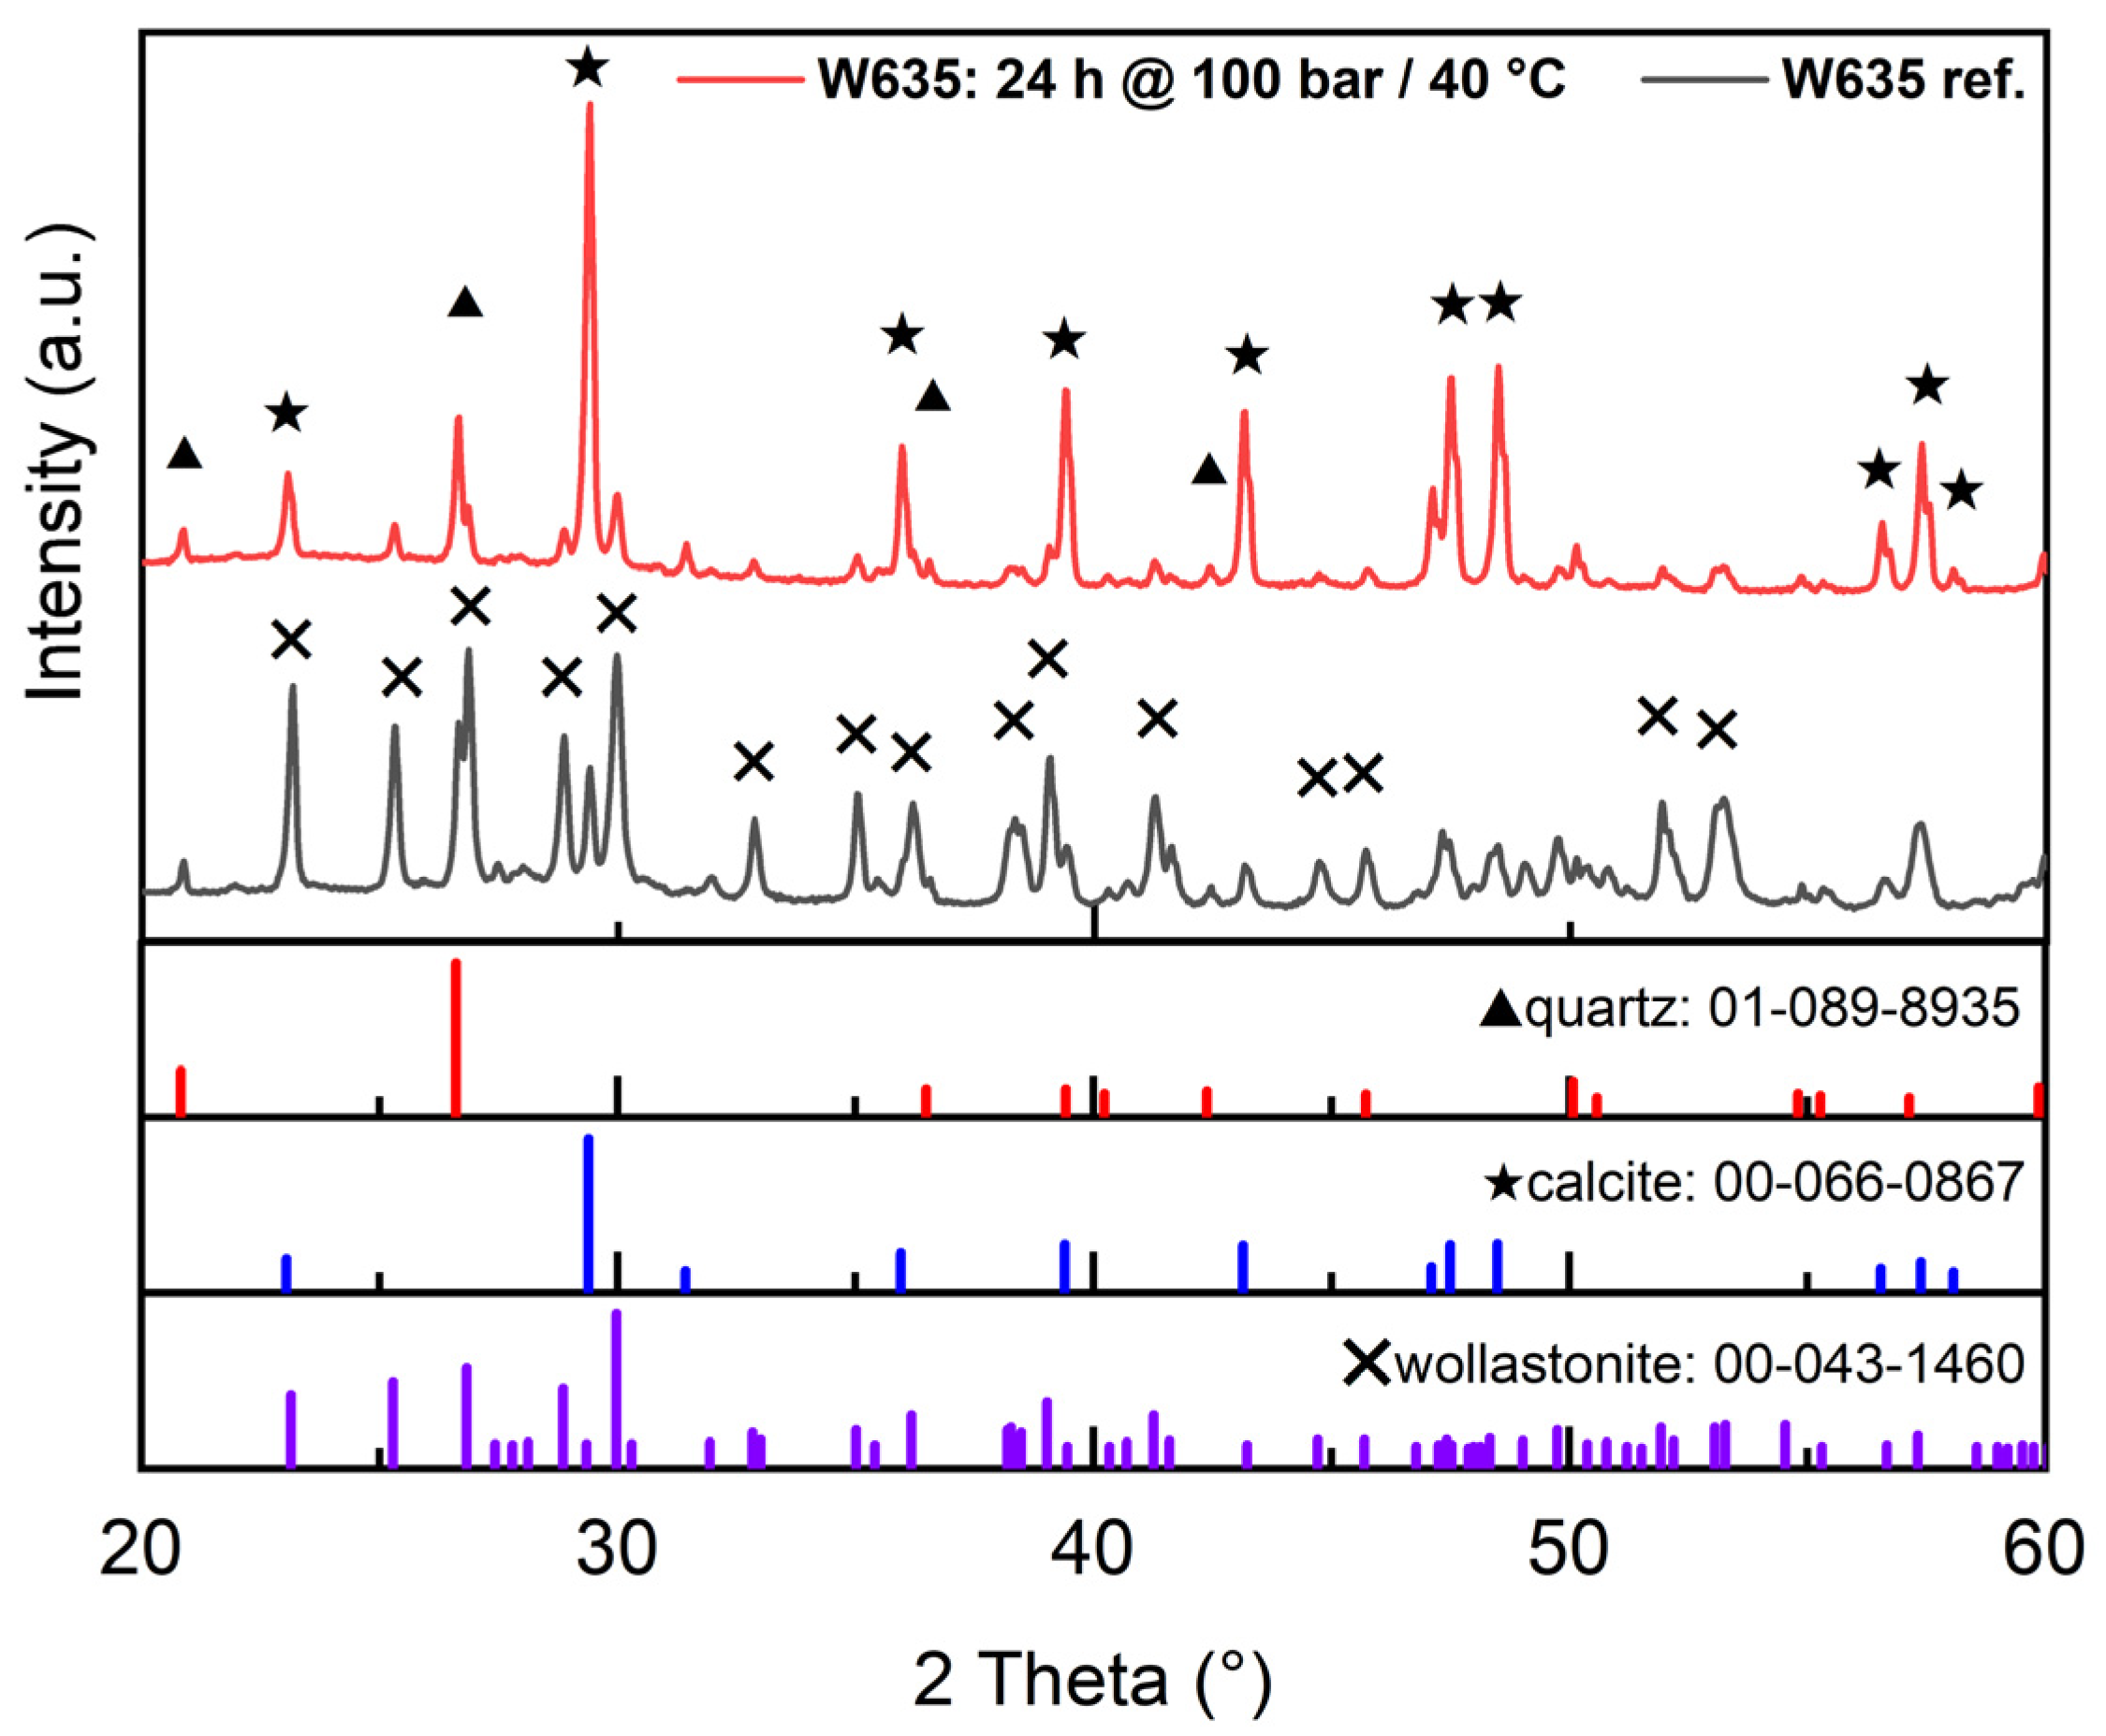
3.2.1. XRD (X-ray Diffraction)

Qualitative X-ray diffraction analysis allowed for the identification of crystalline phases and confirmed the formation of crystalline carbonates. A clear increase in the relative intensity of calcite after the prolonged overpressure of CO2 was clearly observable in the XRD spectra for A1 (Figure 3), but not for B1 (Figure 4), where the amount of inherent calcite was so high that an increase in calcite by a few percentage points or a reduction in wollastonite were not reliably observable by XRD.
The wollastonite powders W325 and W635 both showed a very clear increase in the relative intensity of calcite (Figure 5 and Figure 6, respectively), the latter showing a more pronounced effect by virtue of a smaller particle size. These commercial wollastonite grades also possessed a strong presence of residual quartz, a useful reference point for relative intensities of other minerals, since it is inert in the conditions discussed herein.
While XRD was only used to obtain qualitative information on mineralogy, a clear consensus across all spectra exists regarding the output of prolonged carbonation. Where changes in the relative intensity of the characteristic peaks of the minerals could be observed, the amount of calcite increased in relation to that of wollastonite, directly portraying the process of the accelerated weathering of wollastonite into calcite.

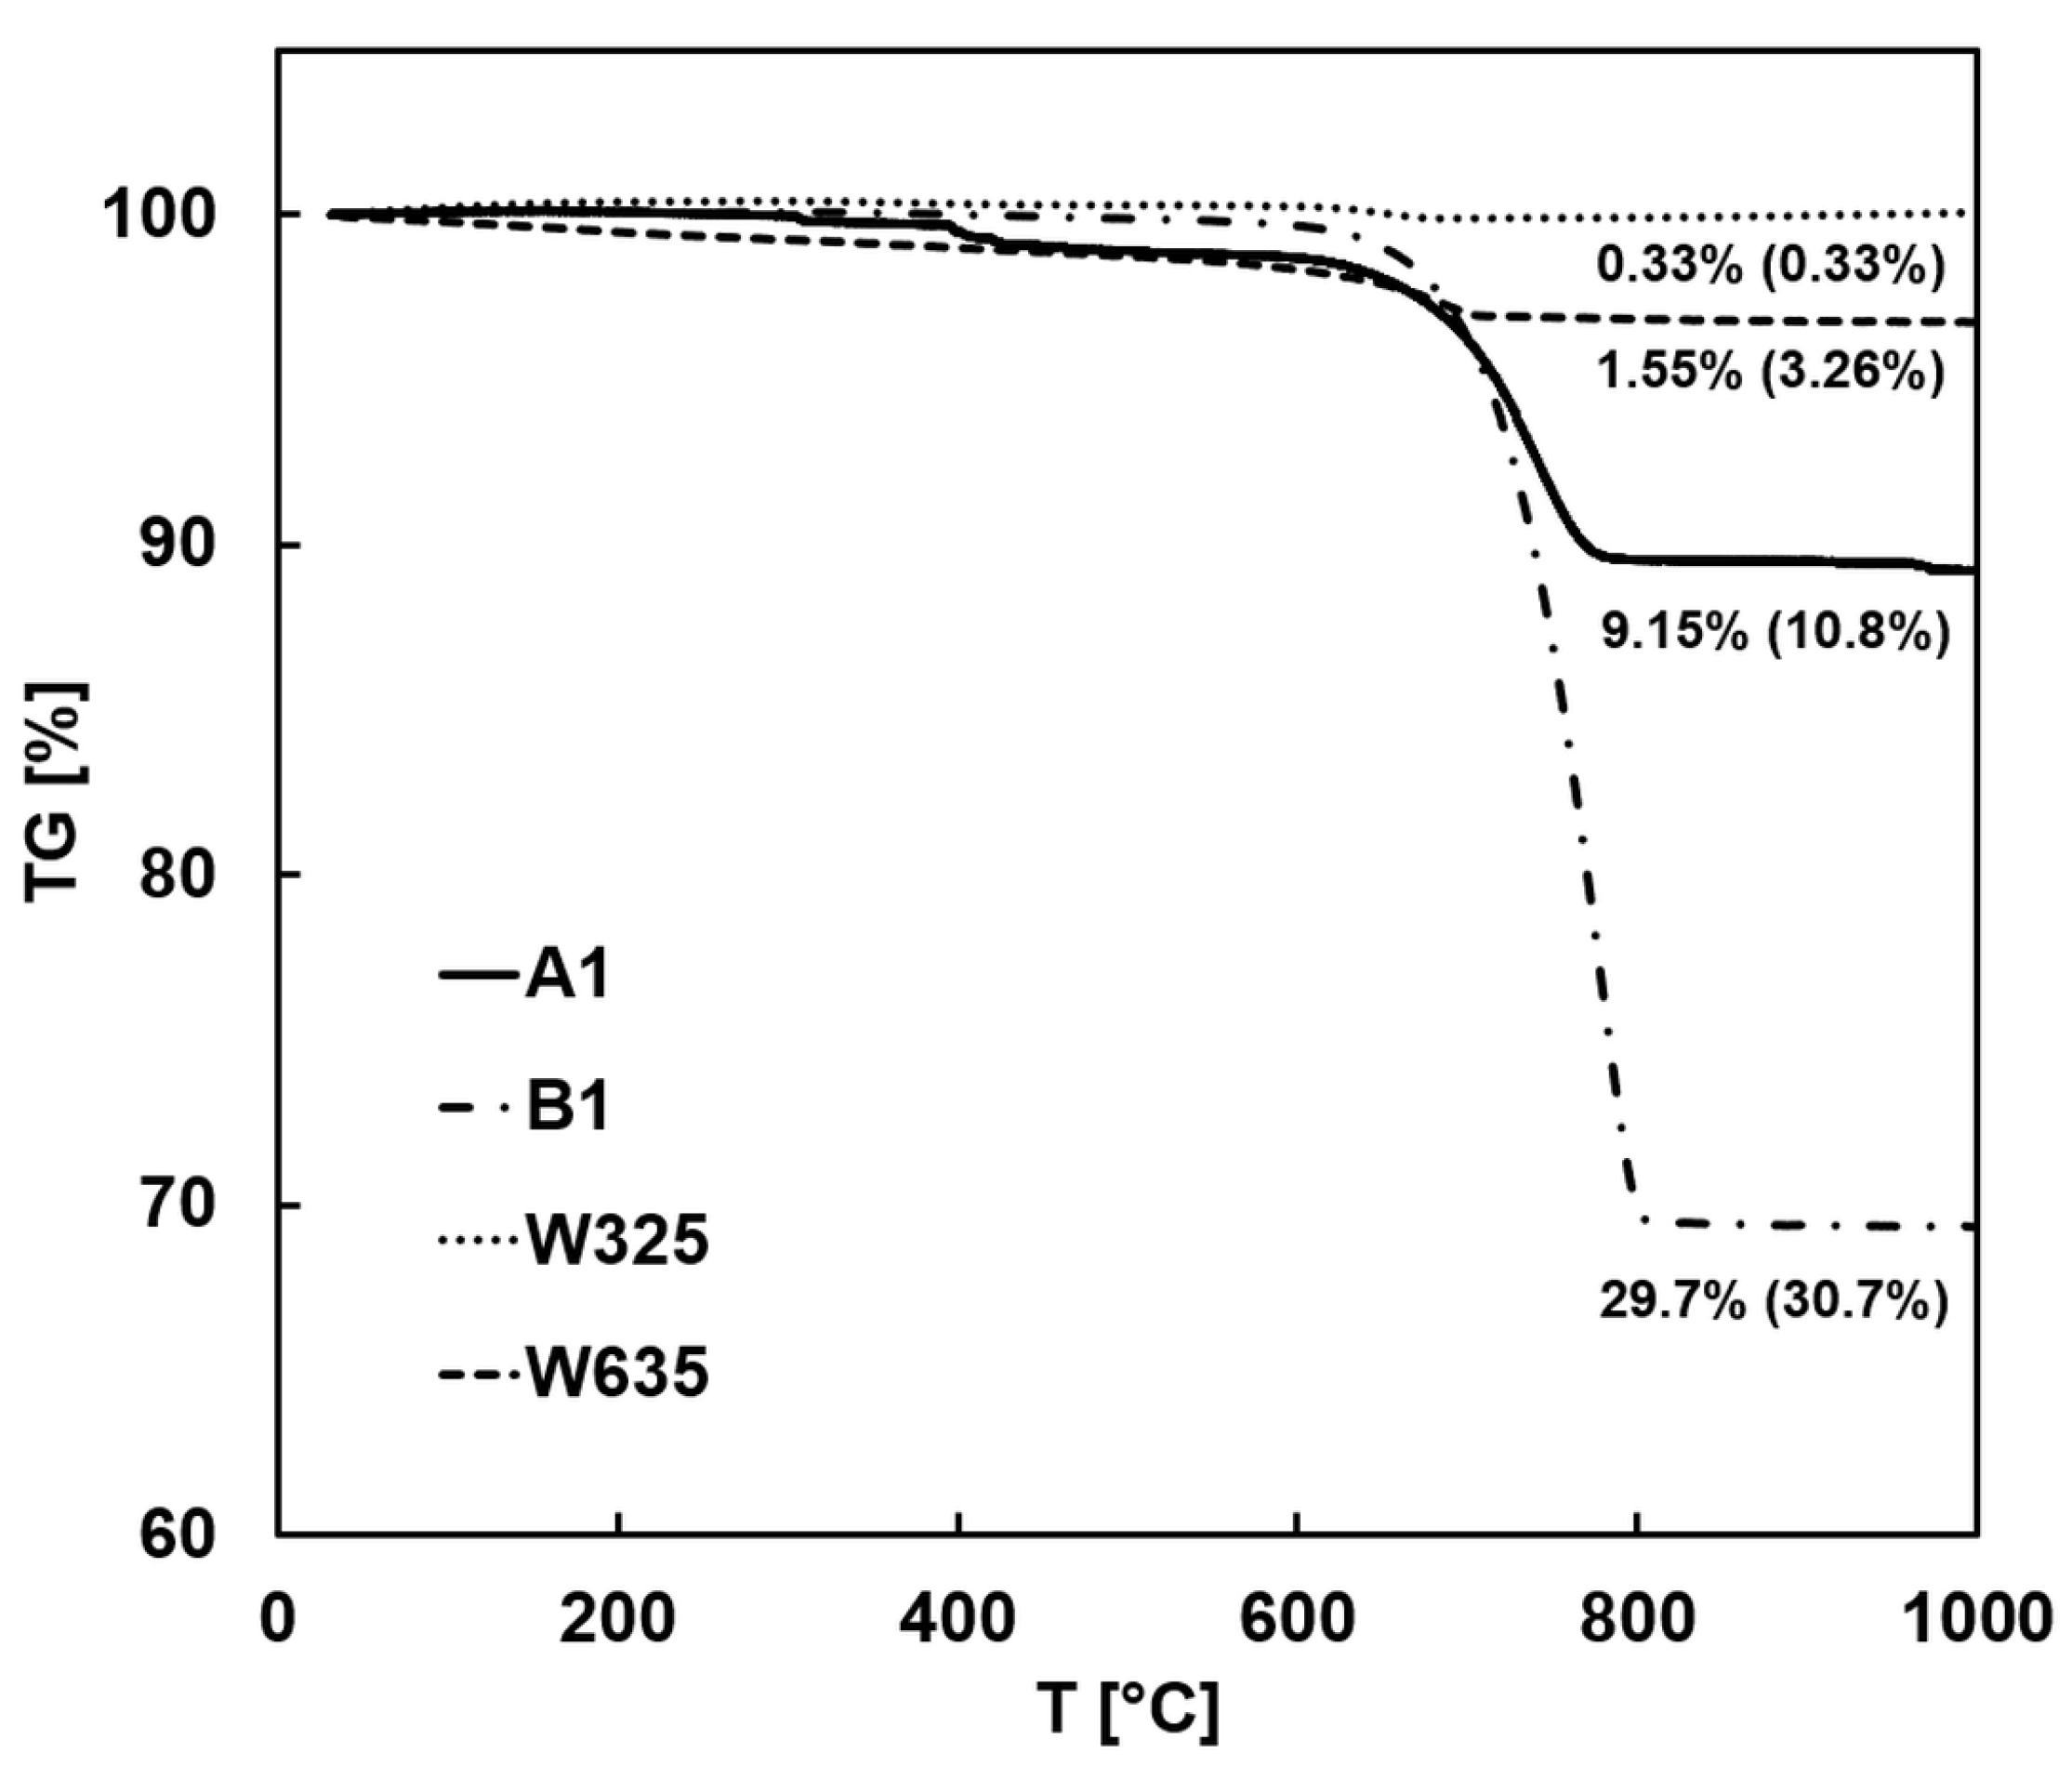
3.2.2. TGA (Thermogravimetric Analysis)

A quantitative analysis of carbonation extent was performed using TG measurements, where the mass loss delta compared to the reference was directly attributed to newly formed calcite achieved by carbonation, resulting in a percentage value of conversion against the initial amount of available wollastonite (see Equation (5)). The equation to determine carbonation extent F was modified from Min et al.’s work [10]:
F = m a s s   o f   r e a c t e d   w o l l a s t o n i t e m a s s   o f   o r i g i n a l   w o l l a s t o n i t e = ( m L 2 m L 1 ) × M C a S i O 3 M C O 2 m 0 ( m L 2 m L 1 )
where mL1 is the ΔTG% of the dry as-received mineral matter (see Figure 2); mL2 is the ΔTG% of carbonated matter, where the additional loss is attributed to increase in the amount of carbonate due to wollastonite weathering; m0 is the original mass percentage of wollastonite; and M denotes molecular masses of wollastonite and carbon dioxide. The mL1 for A1 and B1 were 20.8 wt% and 67.9 wt%, respectively. This means that there was a large discrepancy regarding the carbonate percentage predicted by our earlier SEM-EDS-based mineralogy determination (Table 1) compared to these later measured TG-based mL1 for the untreated tailings. Some level of inaccuracy of microscopy-based mineralogy determination is to be expected with a heterogenous mixed-mineralogy feedstock such as the tailings discussed herein, making TGA the preferred method of quantitative analysis.
The effects of different device parameters on carbonation extent were first mapped using the two reference wollastonite powders W325 and W635 (Figure 7). An increase in carbonation time produced a higher carbonate conversion, increasing the yield even when the time was extended from 4 h to 24 h. At 40 °C for one hour, conversion remained relatively similar at all pressures, from 20 bar to 100 bar. At 60 °C for one hour, however, an increase in pressure clearly improved the carbonate conversion rate. The finer particle size of W635 compared to W325 also quite predictably resulted in universally increased conversion as well.
The effects of the carbonation parameters on tailings A1 and B1 (Figure 8) showed only partial adherence to the trends seen with the reference wollastonite powders. The conversion analysis of A1 appear inconclusive at best, most likely being affected by the large particle size and the resulting inconsistency of the small (10 mg) TG sample size. The effect of temperature compared to carbonation time was pronounced with B1, showing a higher conversion extent at 1 h/60 °C than at 24 h/40 °C.

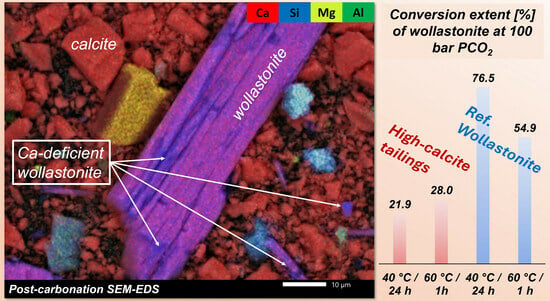
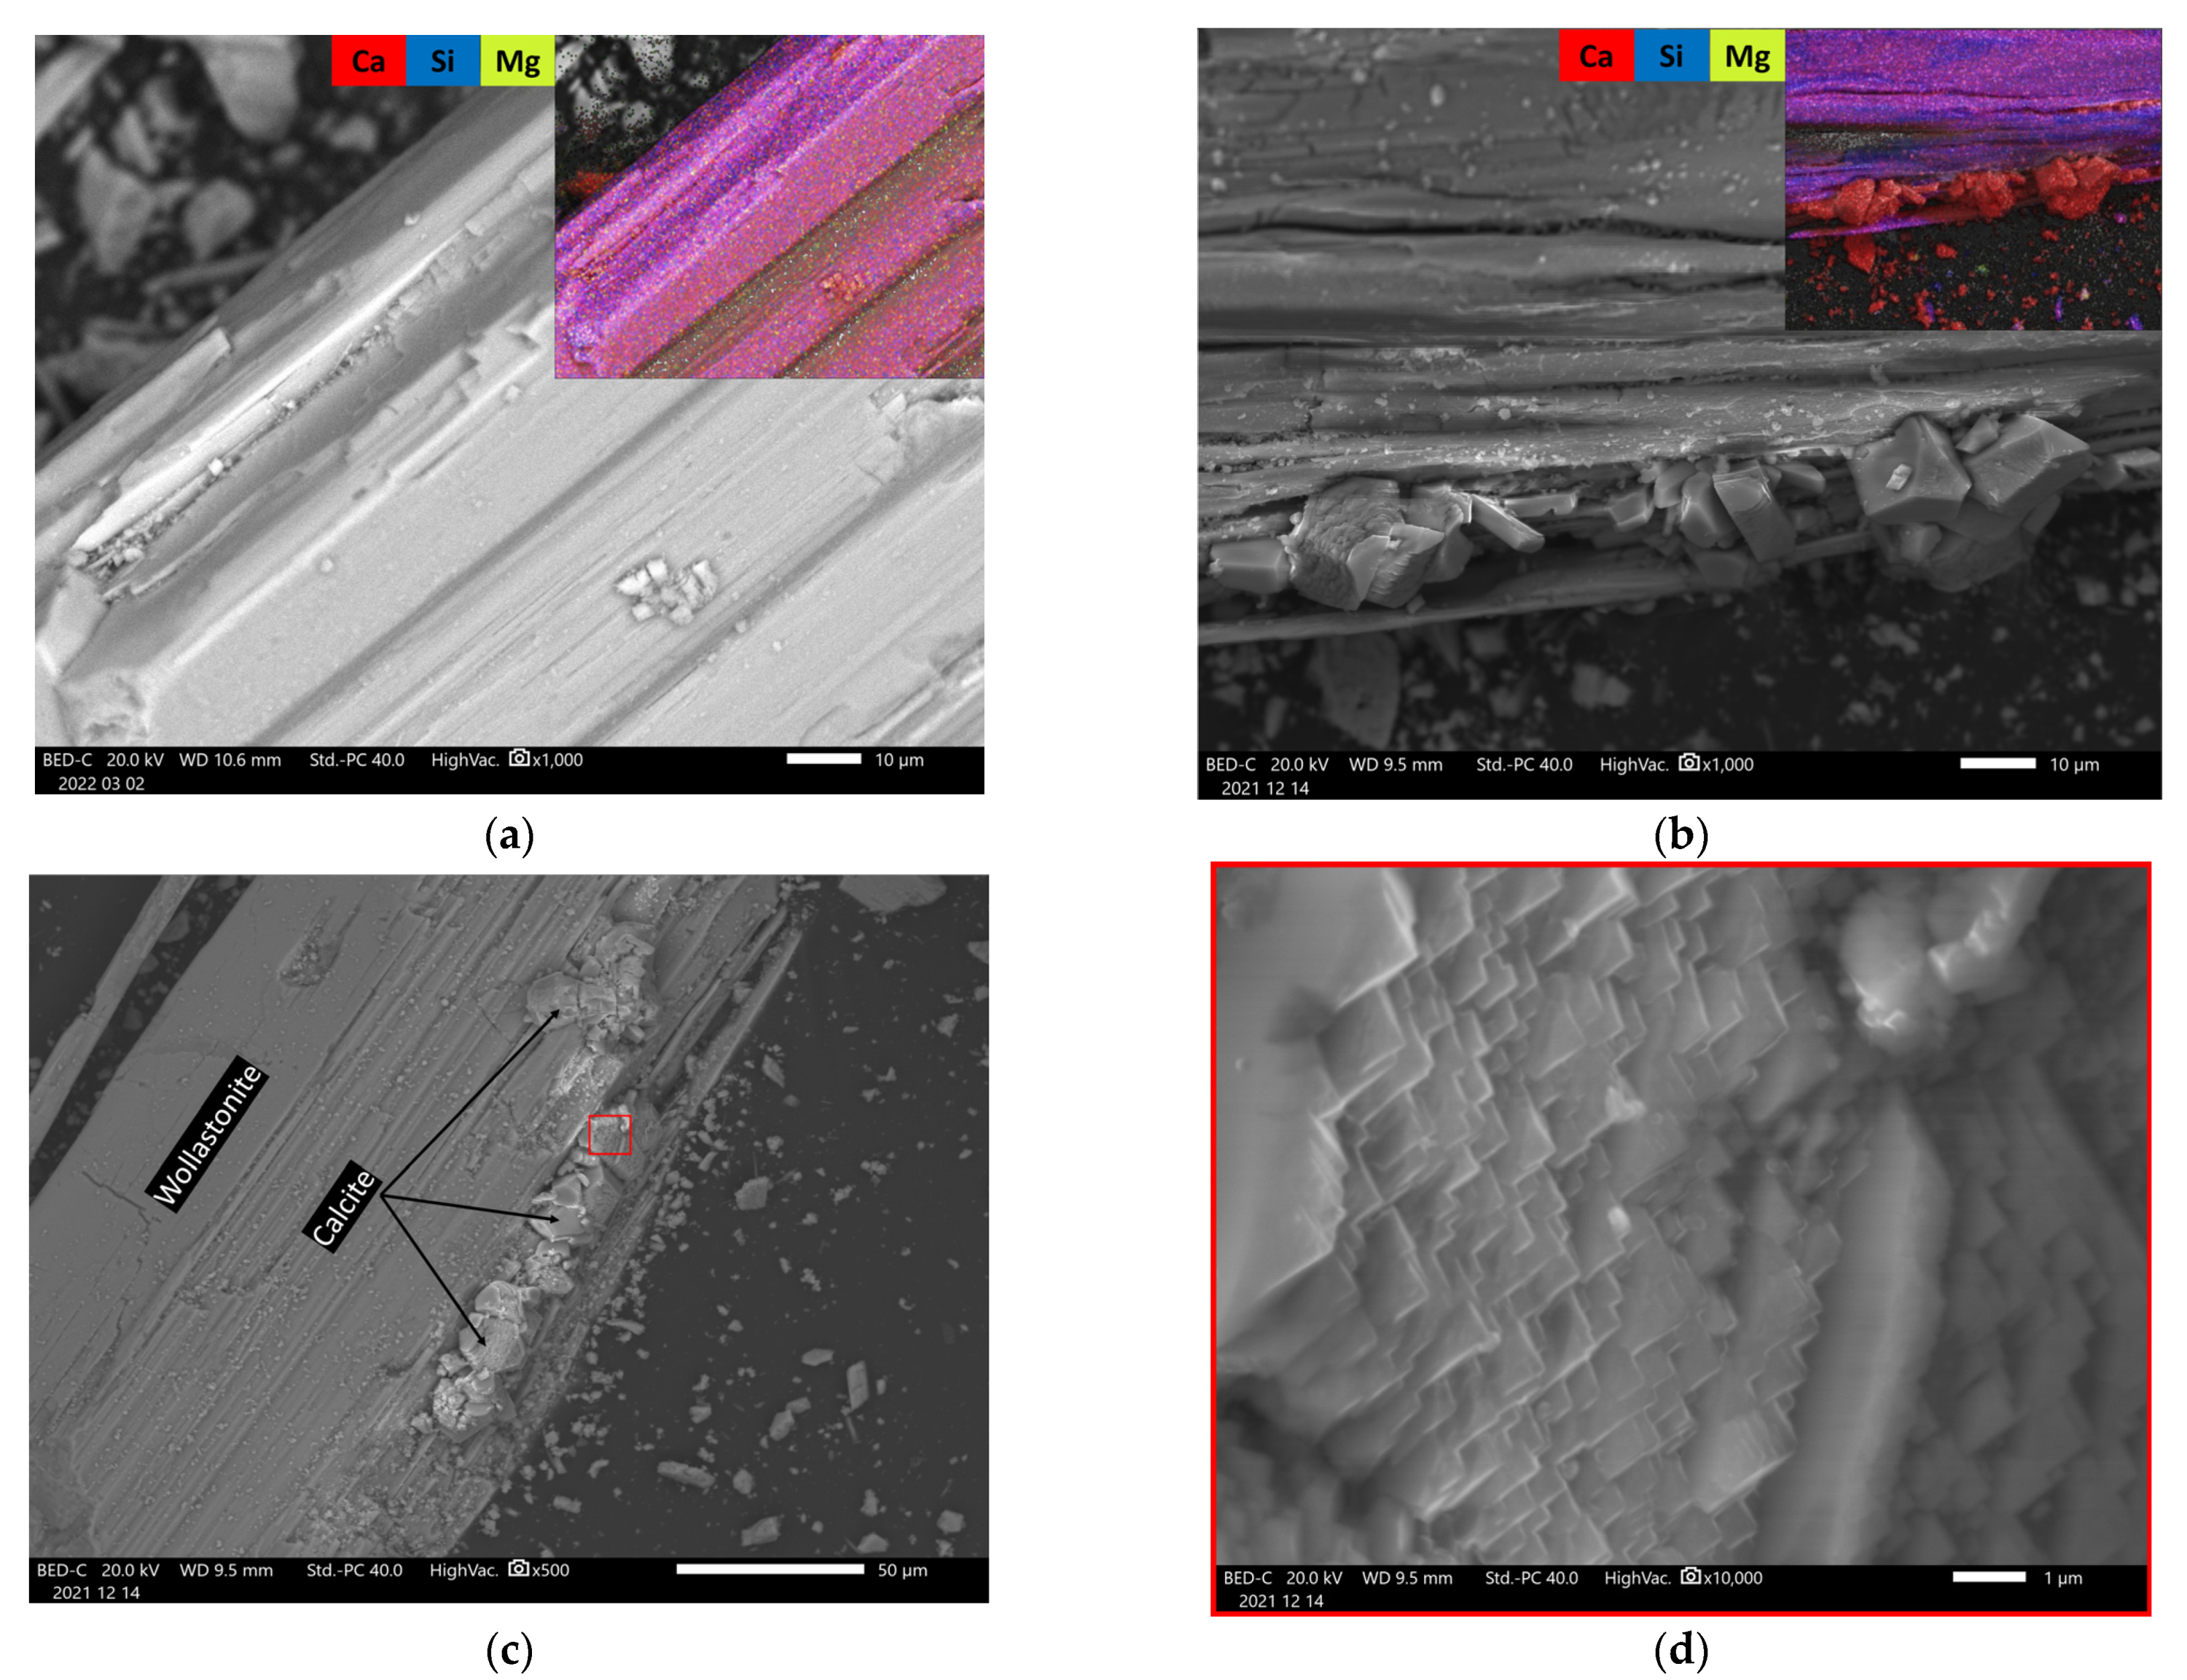
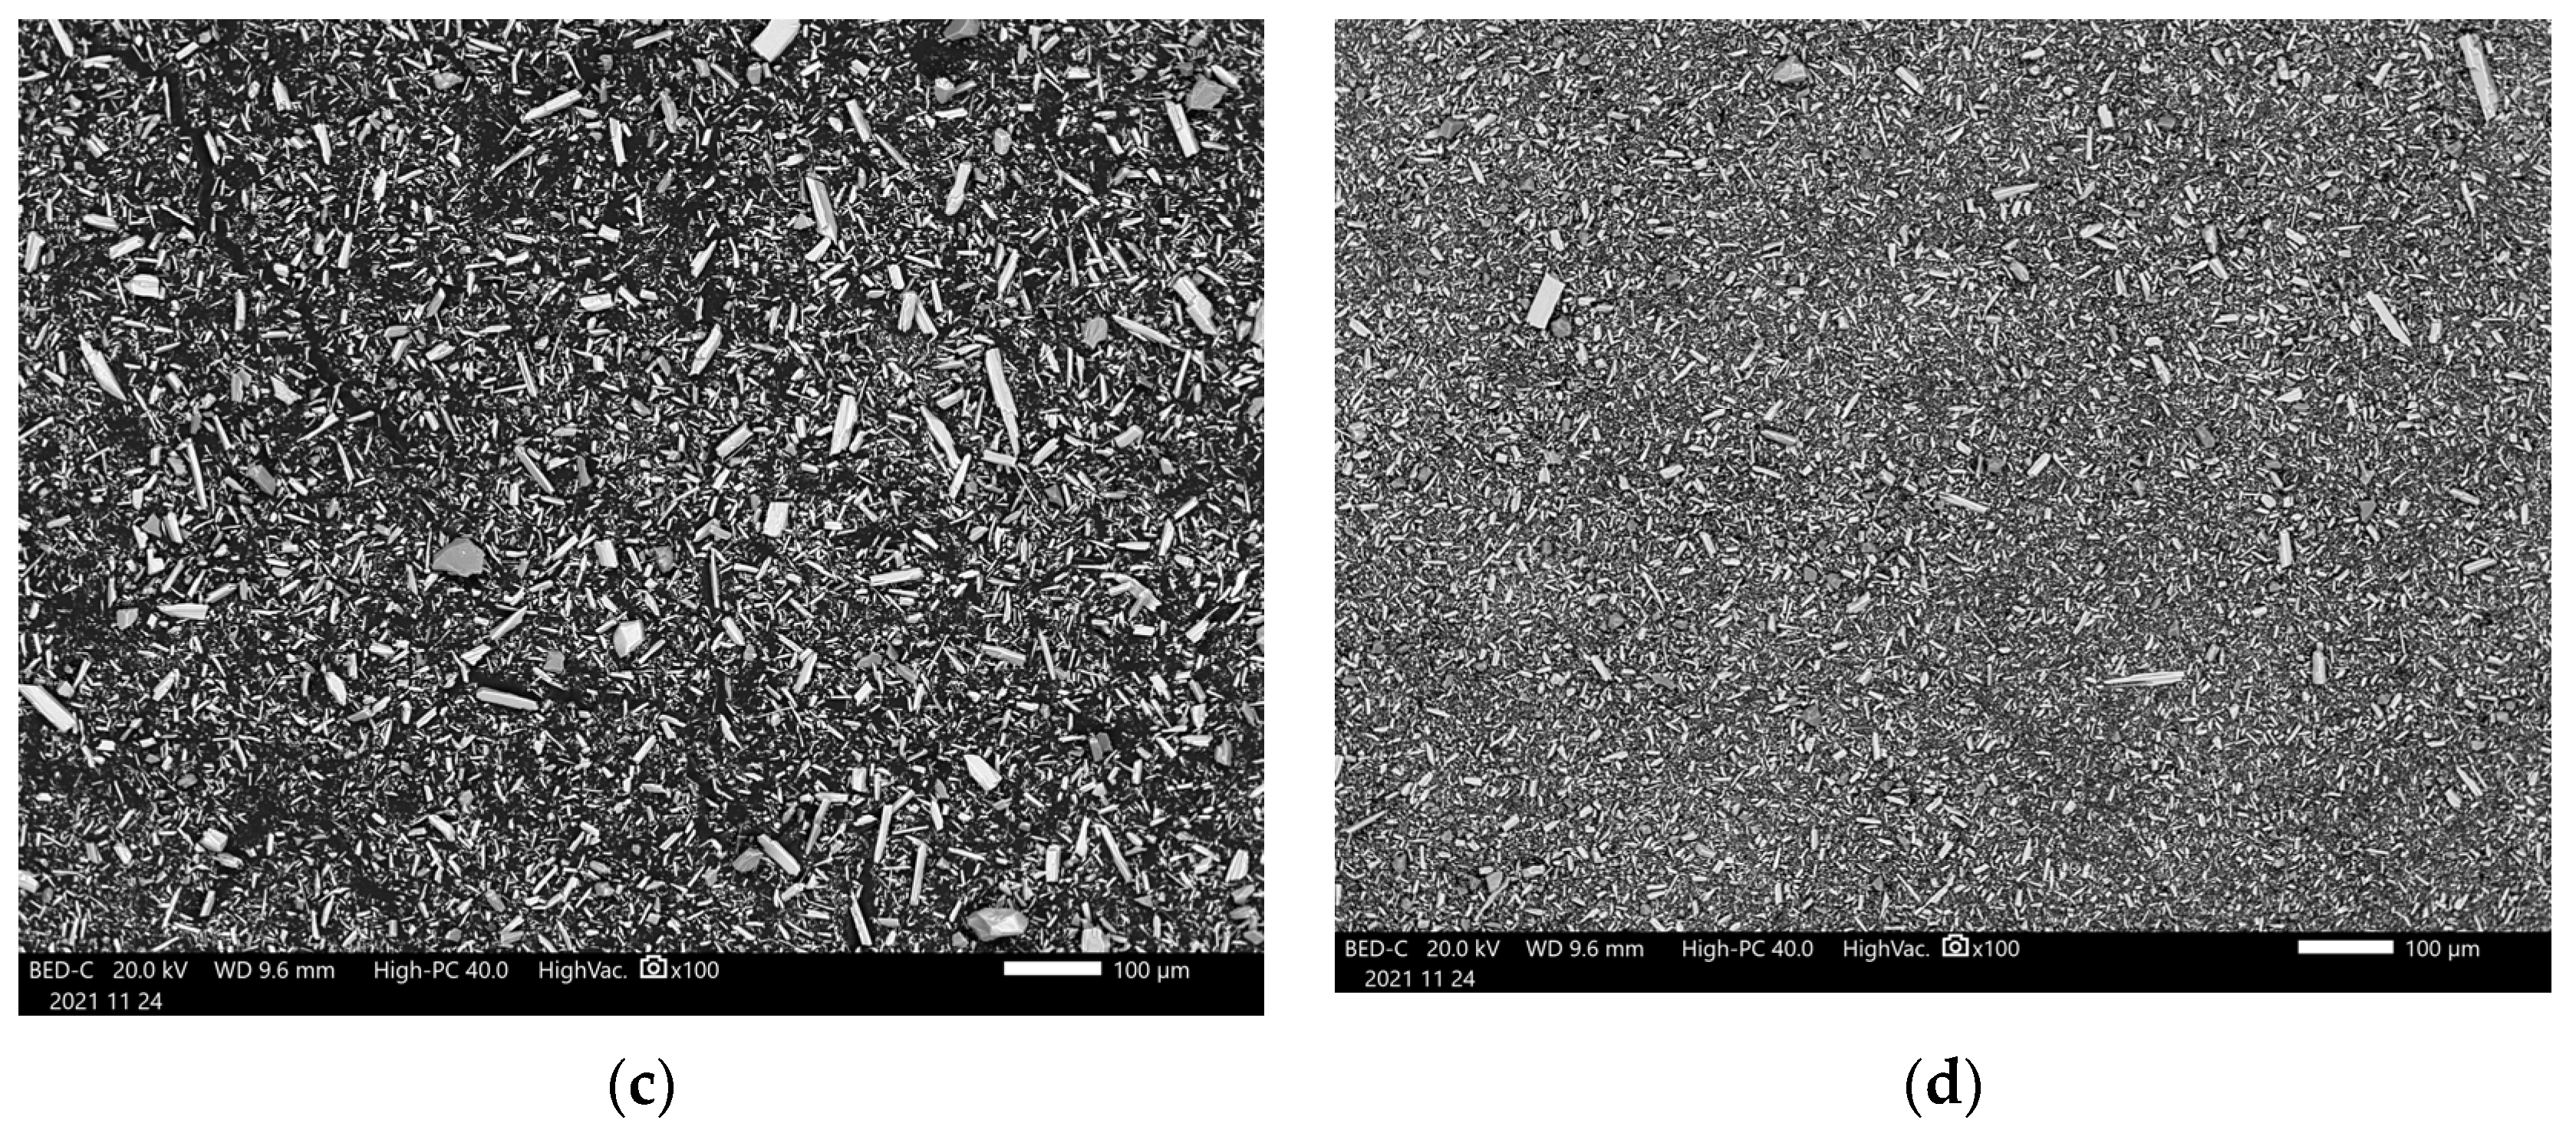
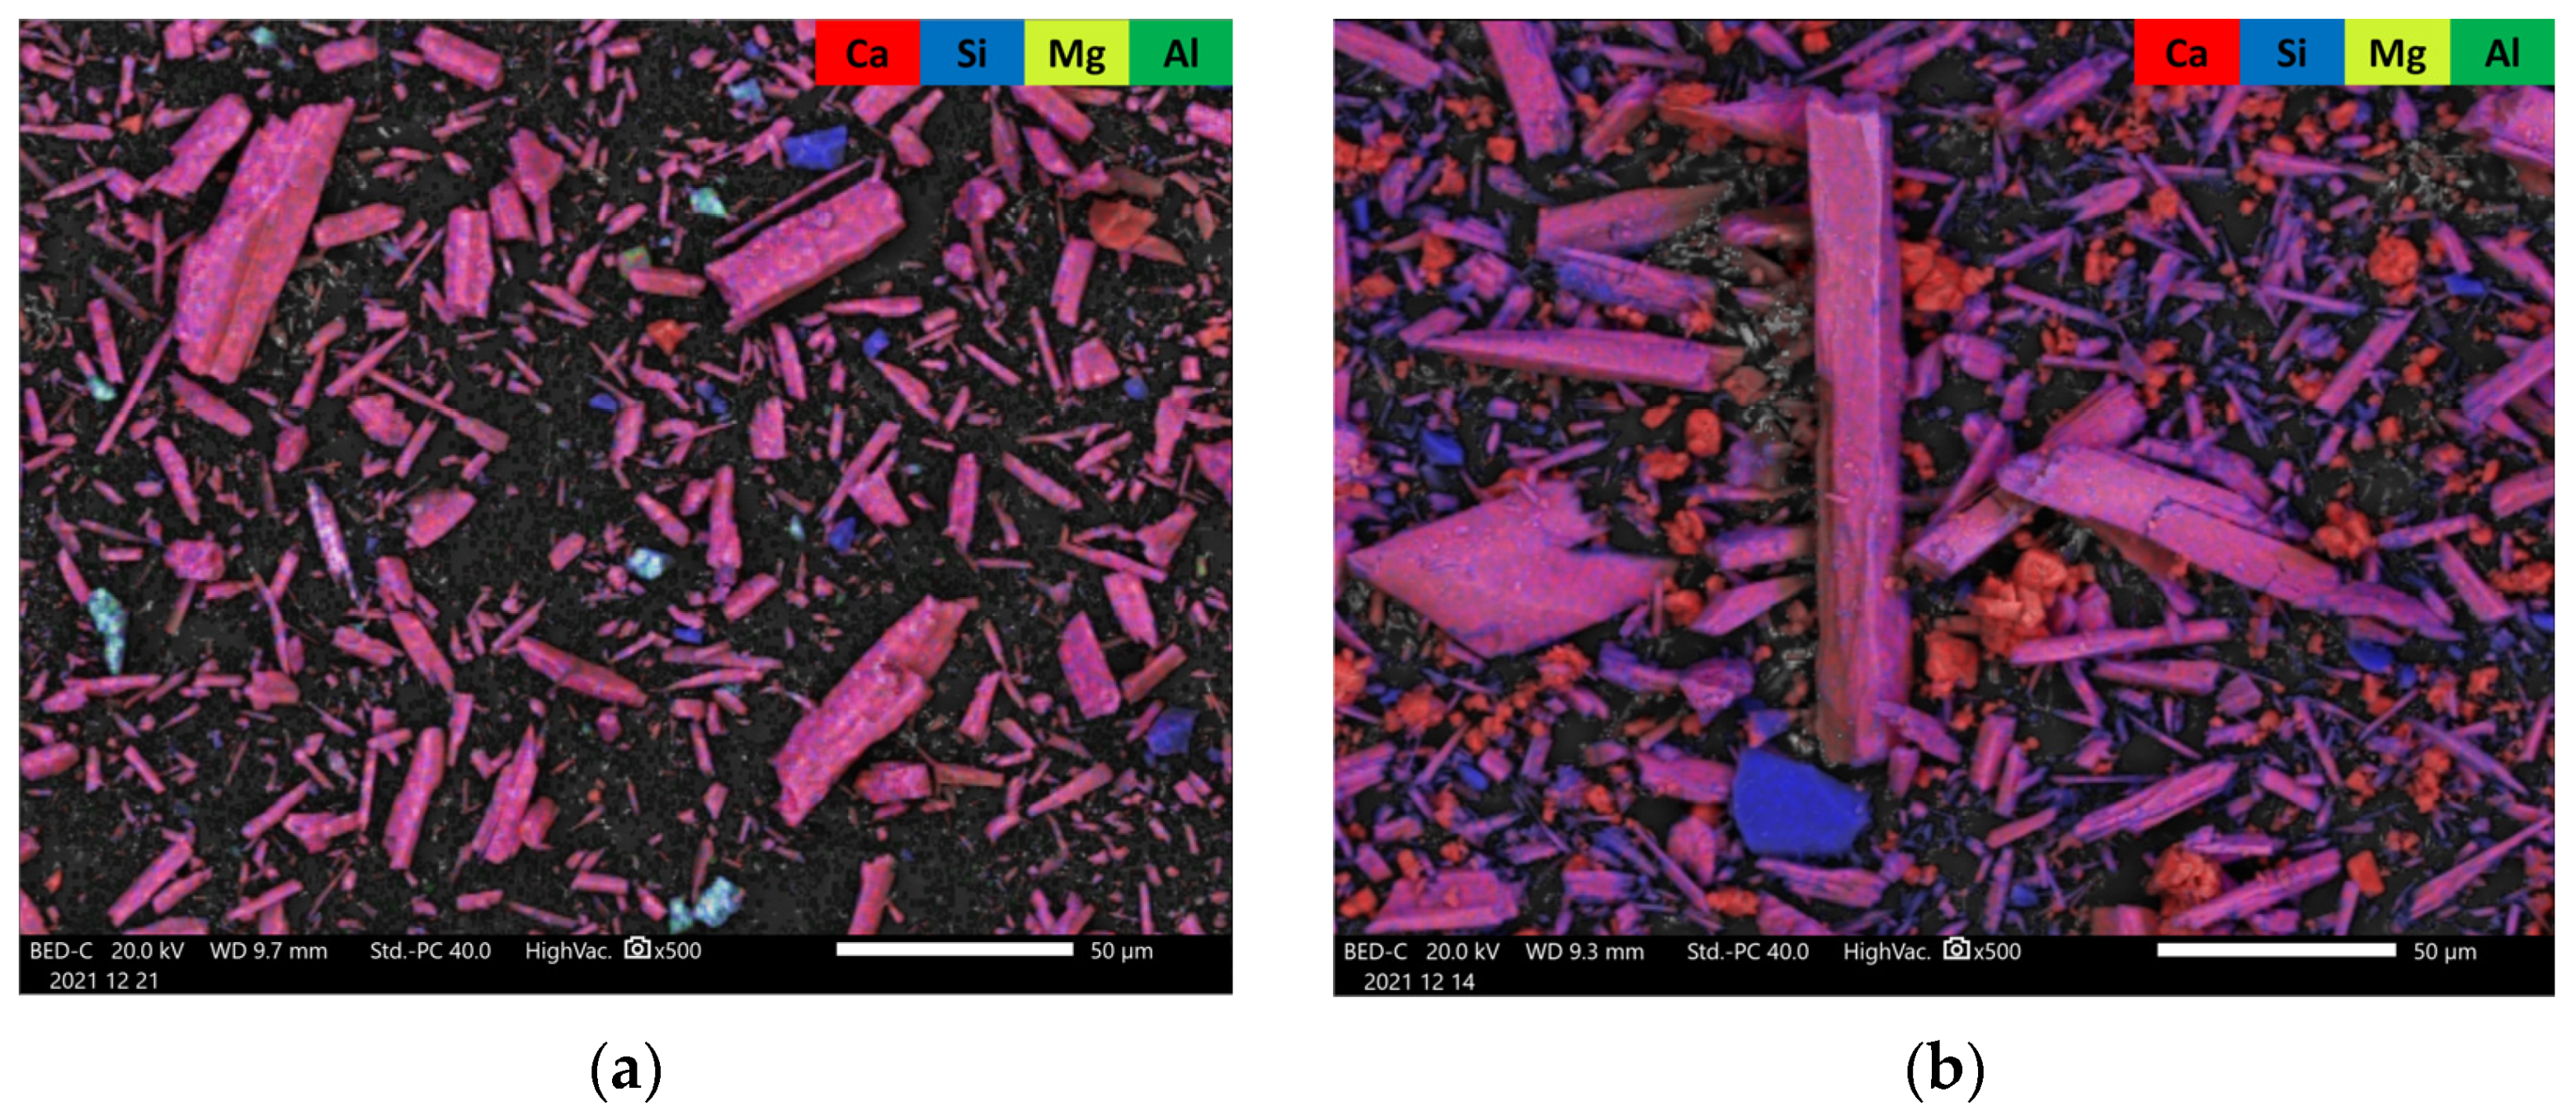
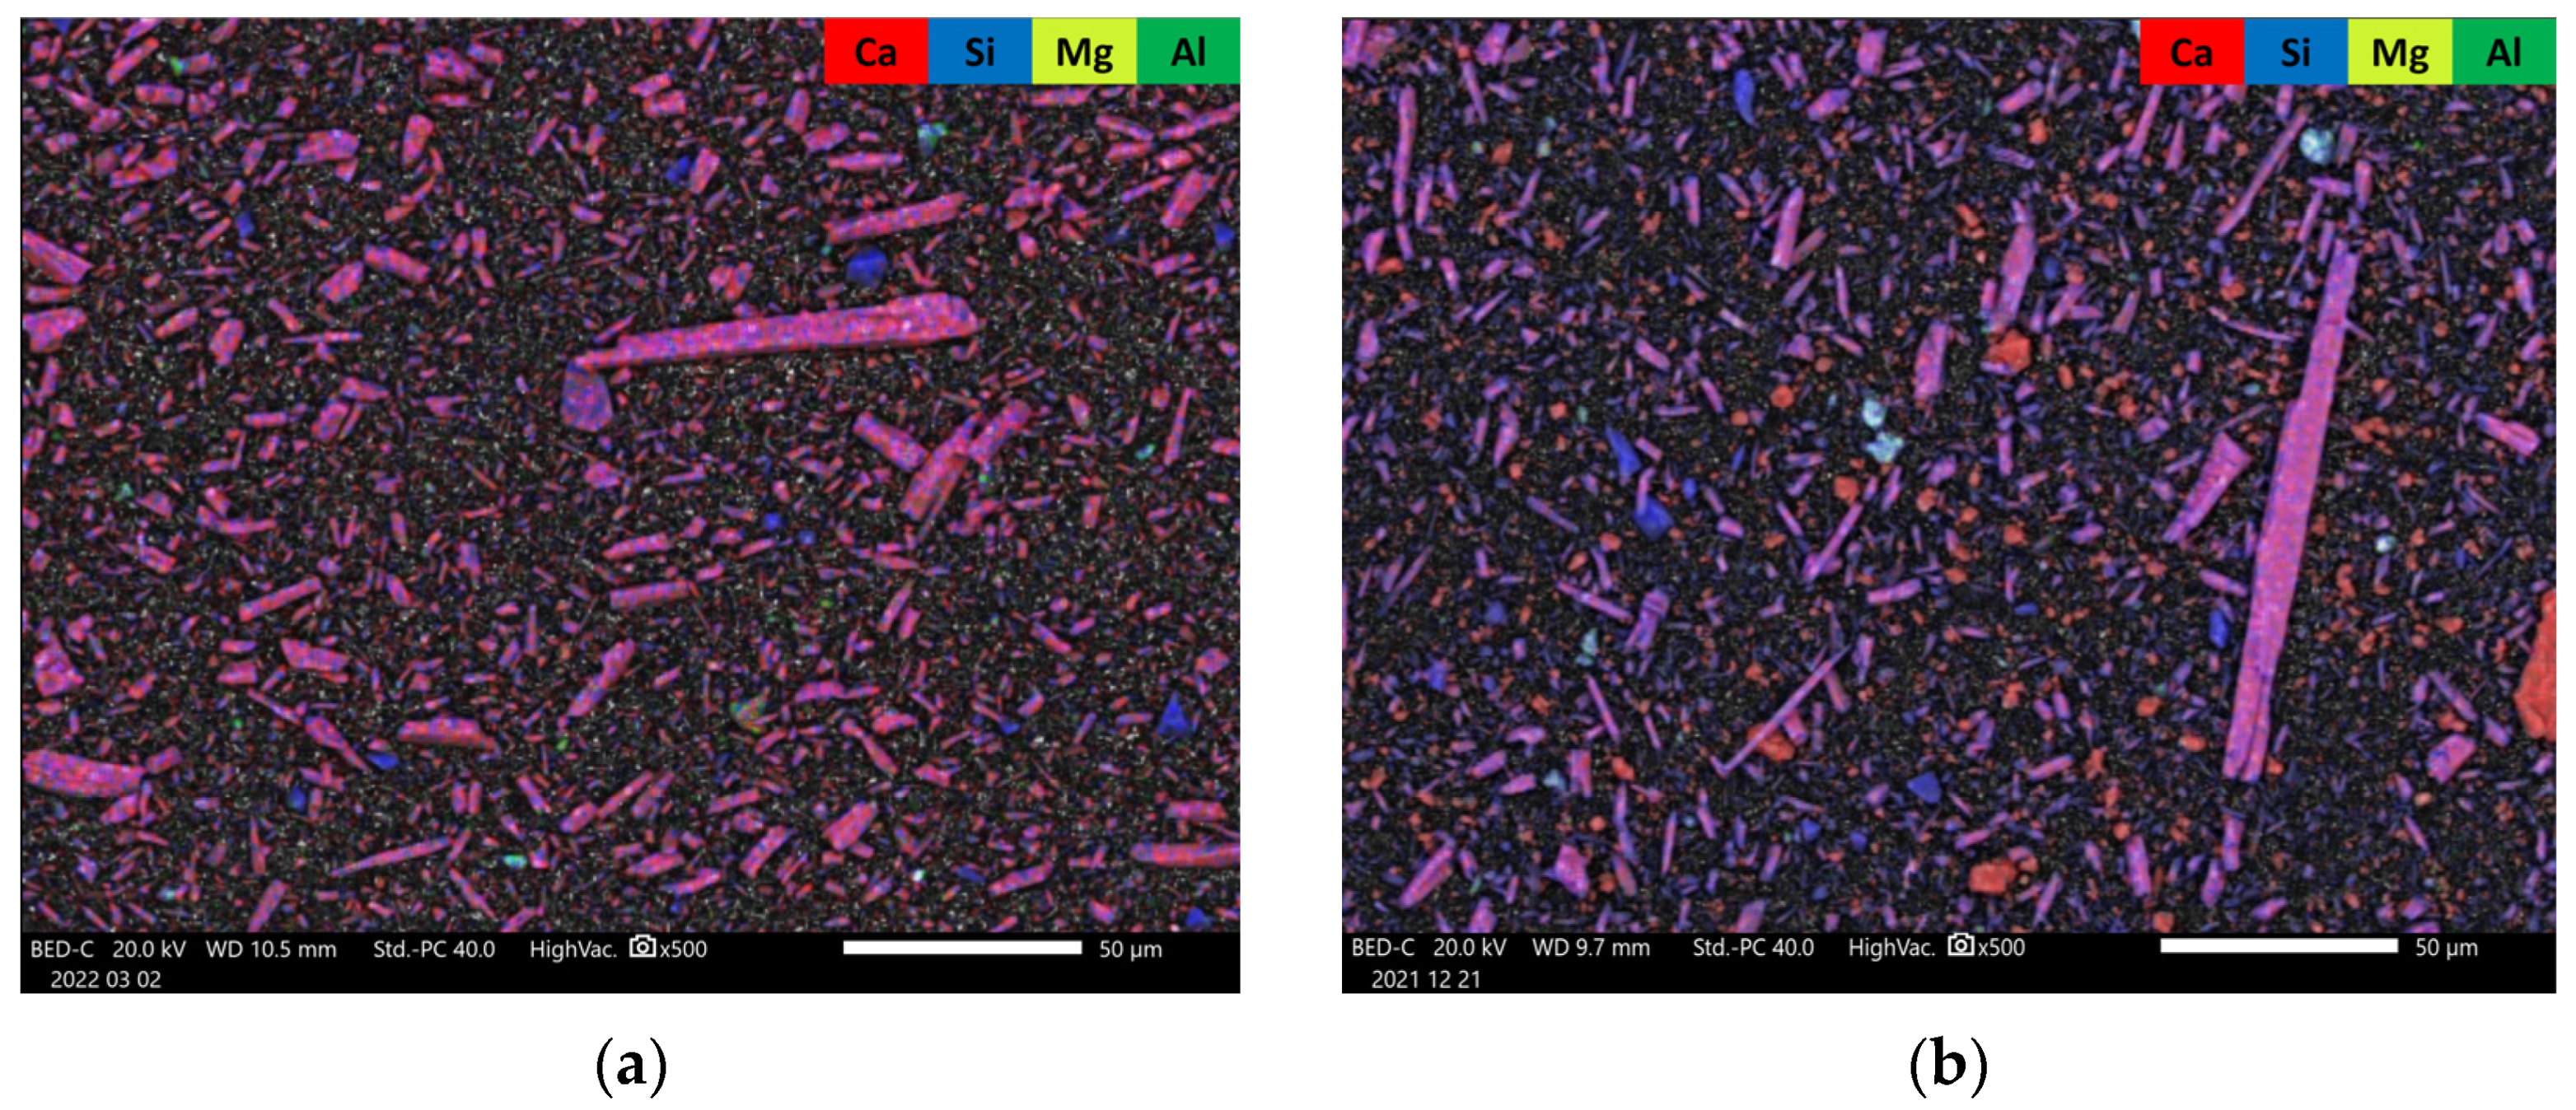
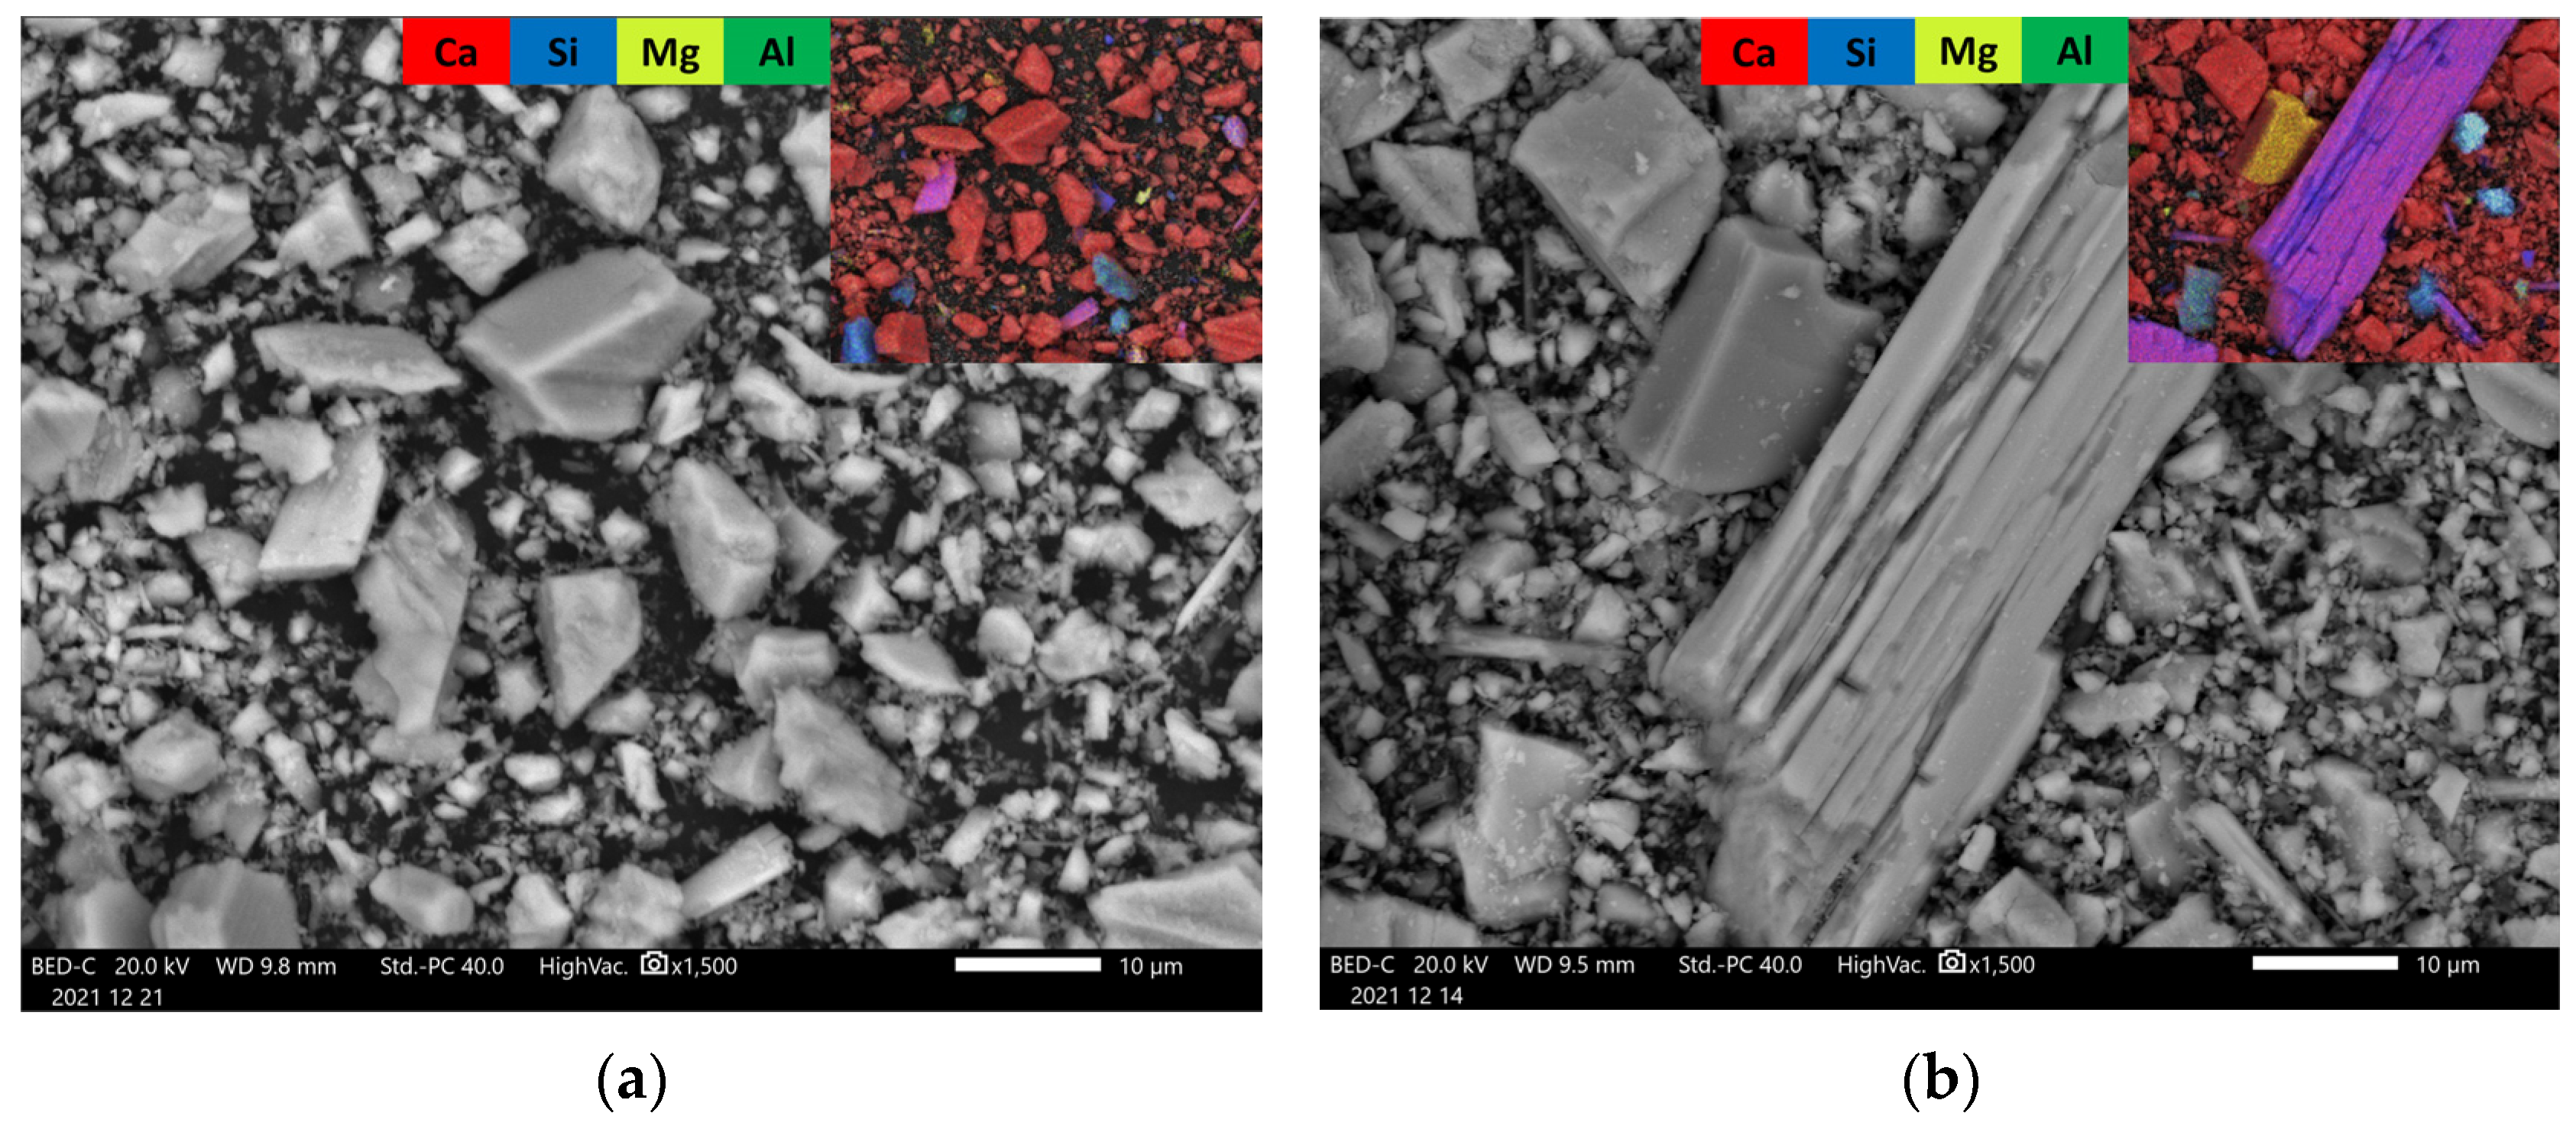
3.2.3. SEM (Scanning Electron Microscopy)

SEM-EDS analysis confirmed carbonate formation and wollastonite weathering. A size range of roughly 5 to 20 µm for secondary calcite applied for all samples, regardless of the original wollastonite feedstock, as is demonstrated in Figure 9, where the coarsest and finest fraction of this study are presented after identical test conditions. Additional images of post-carbonation A1 and secondary calcite are presented in Appendix C (Figure A6).
Figure 10 presents a typical post-carbonation element map for wollastonite, where there are not only primary wollastonite particles and newly formed calcite crystals, but also clearly visible Ca-deficient areas on wollastonite that appear to concentrate around the sharp features.
In the case of reference materials W325 (Figure 11) and W635 (Figure 12), EDS element maps showed a clear increase in Ca-dominant particles post-carbonation, but in the case of W635, there is also an apparent increase in particles consisting predominantly of Si, implying both the formation of calcium carbonates and the resulting residual silica, as predicted by reactions (4) and (3), respectively. Pre-existing blue, green, and teal particles are residues from the main ore, mostly quartz (SiO2), also appearing in XRD, as well as a minor amount of diopside (CaMgSi2O6) and albite (NaAlSi3O8).
The tailings, especially B1, consisted largely of primary calcite, which makes the analysis of carbonation extent less clear-cut. However, while not clearly detected by XRD (Figure 4), indications of carbonation of even B1 were observed both in an SEM element map (Figure 13b), where there were calcium-deficient areas on wollastonite, and in the post-carbonation TGA (Figure 8), where there was a measurable increase in TG mass reduction compared to reference B1.

4. Discussion and Conclusions

Following the XRD, SEM, and TGA data above, the main differences in TG mass loss between carbonated and untreated mineral samples where confidently attributed to the formation of calcite. While some minor impurity minerals belonging to the serpentine and feldspar groups theoretically have a measurable reactivity under the overpressure of CO2 [15,16], the larger effect of wollastonite and its inherent carbonates is assumed to mask those minute contributions. This was especially true in the case of XRD, where the strong features of majority minerals and newly formed calcite overpower any potential minor reaction products.
The observed results for the reference wollastonites W325 and W635 were in very good agreement with those from other reported research:
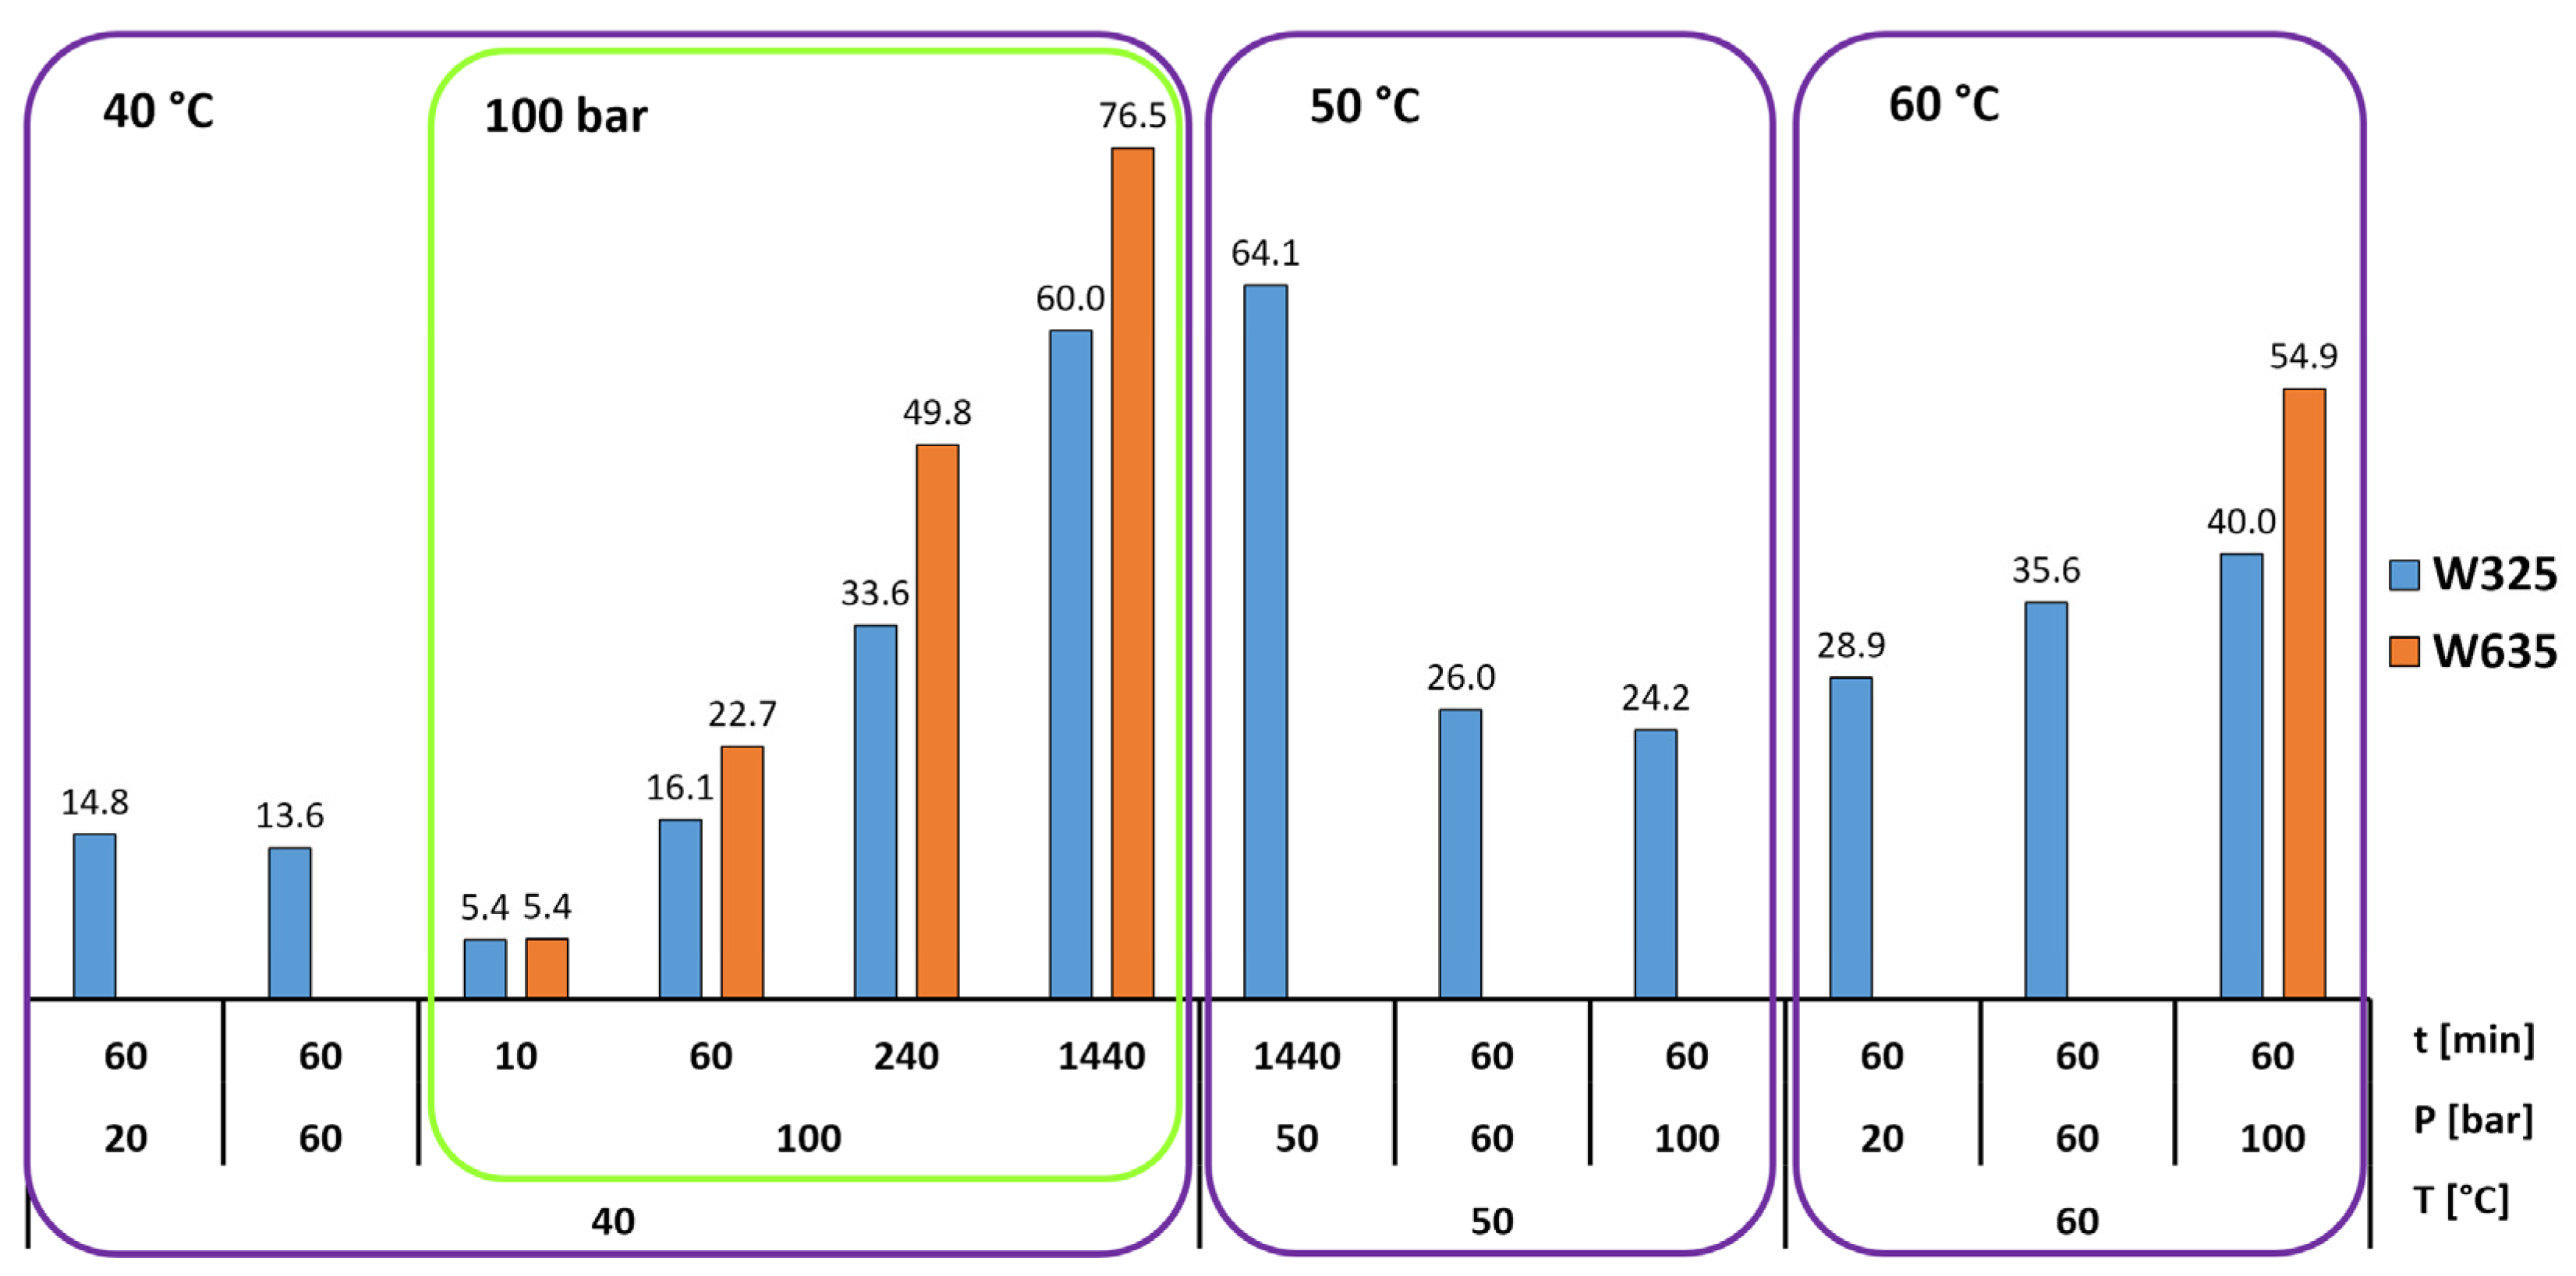
  • Increasing the carbonation time at 40 °C and 100 bar increased the conversion extent, and it appears that in that case, 24 h was not enough time to reach the inevitable plateau dictated either by the formation of a passivating layer of calcite grains and residual silica or the simple depletion of the feedstock. This plateau was found by Min et al. [10] to occur at roughly 10 h under 100 bar pressure and 60 °C temperature, but at up to 10 days, according to Daval et al. [6], when using pCO2 = 25 MPa and 90 °C with several mild solutions.
  • A finer particle size increased the carbonation extent in all tested cases. This is intuitively logical based on differences in surface area, and it is supported by the observations of Min et al. [10], where reacted layer thickness produced in certain conditions was proven to be independent of particle size. This of course assumes that the wollastonite component of the mineral feedstock is chemically the same, which is the case in our study, where both the tailings and the commercial wollastonites originated from the same quarry.
  • An increase in temperature appears to be generally more beneficial for increasing the carbonation rate than an increase in pressure. This is in line with the findings of Gerdemann et al. [13], who observed that wollastonite carbonation had almost no sensitivity to pressure increase above ~40 atm, but exhibited almost linear scaling with a temperature increase between 25 °C and 100 °C. In our research, however, a pressure increase under elevated temperature (60 °C) quite clearly appears to increase the conversion extent. The positive effect of temperature is explained by the assumed increase in reaction and mass transfer rates [4], meaning the increased leaching of Ca-ions, which is almost universally agreed to be the rate-limiting step in wollastonite carbonation [4,6,17].
Different combinations of parameters produced comparable results. The carbonation extent for W325 was similar in 24 h at 100 bar/40 °C and 24 h at 50 bar/50 °C. Similarly, the carbonation extent for W635 in 1 h at 100 bar/60 °C was comparable to that in 4 h at 100 bar/40 °C. Results like these underline that for a biphasic system like ours, in which mineral matter is mixed with water, carbonation reactions do not particularly benefit from a supercritical state of CO2, but rather from the increased enthalpy produced by elevated temperature and the added overpressure of CO2.
A more detailed analysis was required for the mixed mineralogy tailings A1 and B1, however. The effects of the carbonation parameters on tailings (Figure 8) showed only partial adherence to the trends seen with the reference wollastonite powders. Firstly, the conversion analysis of A1 appears to be inconclusive at best, most likely being somehow affected by the large particle size and the resulting inconsistency of the roughly 10 milligram TG samples. The analysis in the context of TG thus only focuses on the finer tailing B1. Secondly, the effect of temperature was even more pronounced with B1 than with W325 and W635, showing a higher conversion extent at elevated temperatures (60 °C) compared to that at extended exposures (1440 min = 24 h). This is not a case of W325 and W635 providing lower results under high temperatures, but of tailings not continuing the conversion with a slope similar to the W-powders as exposure time is increased. In other words, a plateau in reaction extent as a function of carbonation duration could be manifesting earlier with tailings than with W-powders. In our interpretation, Ca dissolution from wollastonite slows down more rapidly for tailings due to the fact that they quickly reach a saturation of Ca-ions from other sources, namely calcite and possibly other minor carbonates like dolomite (CaMg(CO3)2). Since B1 consists mostly of pre-existing calcite, the saturation for calcium ions under the test conditions could be reached quite rapidly, effectively increasing the pH and subsequently hindering the further dissolution of Ca (and the precipitation of carbonates) by the neutralization of bicarbonate formation proposed by reaction (2). This could produce a difference in the morphology and deposition pattern of the newly formed calcite particles and the residual silica layer. Daval et al. [18] described that a less rapid dissolution of silicate allows for the Si to explore the potential reactive sites, forming and breaking bonds before being trapped in the most irreversible site (meaning the largest number of neighboring molecules). This in turn results in a denser, more passivating silicate layer [10].
The undisputable benefit of using tailings instead of primary wollastonite for carbon sequestration is the inherently high surface area produced in the primary extractive process, as comminution is very energy intensive and is considered as one of the main limiting factors in cost-effective ex situ carbonation. The already fine particle size of tailings, such as the ones studied in this paper, is a major motivation for using them as carbonation feedstock. The uniform particle size of secondary calcite demonstrated in Figure 9 would suggest that even though particle size directly affected the absolute extent of carbonation, the conditions for carbonate precipitation were comparable for all four mineral fractions, again underscoring the role of silicate dissolution as the main source of major differences. Daval et al. [18] pointed out face-specific Ca dissolution rates at sharp features and cleavage directions that explain the selective calcium dissolution from wollastonite observed in our samples (Figure 10). This, in turn, points towards an incomplete conversion, where some of the carbonation potential of reference wollastonites was still untapped using the presented process parameters.
In conclusion, using wollastonite tailings consisting largely of carbonate minerals as a feedstock for CO2 mineralization showed great promise, despite the highly inhomogeneous mixed mineralogy and relatively low (~20–30 wt%) wollastonite content of said fractions. The added value in the results presented here is that, beside drying in a heat cabin, the studied tailing fractions were not pre-treated in any way after the extractive processing cycle at the mining site. The combination of relatively small particle size and medium wollastonite content of fine tailings provided measurable carbonation yields (up to 28.7% of wollastonite) in a one-pot batch-type aqueous carbonation. The planned continuation of this work will entail an in-depth characterization of the post-carbonation calcite and silica layers on individual wollastonite grains to determine the passivation effect those may have and determine whether these effects are different for tailings and primary wollastonite. Additional research is also required to map the possibilities for overcoming the inherent limitations of tailings described herein to make an even more compelling case for the large scale ex situ carbonation of these wollastonite-containing secondary mineral fractions.

Author Contributions

Conceptualization, A.I.; methodology, A.I. and N.M.; validation, A.I. and N.M.; formal analysis, A.I.; investigation, A.I.; resources, E.L.; data curation, A.I., E.L. and N.M.; writing—original draft preparation, A.I. and N.M.; writing—review and editing, A.I.; visualization, A.I.; supervision, E.L.; project administration, E.L.; funding acquisition, A.I and E.L. All authors have read and agreed to the published version of the manuscript.

Funding

This research was funded by the K. H. Renlund Foundation and the Academy of Finland (decision number 347184). The APC was funded by Tampere University Library.

Data Availability Statement

The data presented in this study are available on request from the corresponding author.

Acknowledgments

We thank Nordkalk for providing the mineral samples for this study. This study made use of the Tampere Microscopy Center facilities at Tampere University. The authors wish to acknowledge the CSC—IT Center for Science, Finland, for providing computational resources. Finally, we gratefully acknowledge the help from Ron Zevenhoven in improving the early version of this manuscript.

Conflicts of Interest

The authors declare no conflicts of interest.

Appendix A

The carbonations were performed as batch-type aqueous carbonation in a sealed 1.57 L pressure vessel (Figure A1) of a purpose-built supercritical carbon dioxide (scCO2) reactor. First, 10 mL of deionized water was mixed with 3.0 g of mineral matter in an uncovered glass Petri dish, producing a water-to-mineral ratio of 3.3, which is roughly in the range used by others [11,12,13] to ensure that water is not a rate-limiting factor. To produce the desired overpressure carbon dioxide conditions, the temperature of the pressure vessel was first raised to a value within 3 °C or less below the target, after which the dish was put in, the chamber was closed, and the pumping of CO2 to reach the target pressure was initiated, similarly to the method described by Huijgen et al. [4]. The open Petri dish was propped up by tin foil stands on the bottom of the pressure vessel to avoid blocking the outlet during pressure release. The overpressures used in this study ranged from 20 to 100 bar, and the temperatures ranged from 40 °C to 60 °C. Approaching the set overpressure of CO2 always slightly increased the temperature, so there was a ±2 °C inaccuracy in the initial starting temperatures. Additionally, there was an increase in both temperature and pressure during the timed exposure tests in the sealed pressure vessel. This was most noticeable with longer exposures, namely the 24 h periods, where the temperature could rise upwards of 5 °C and the pressure could increase by up to 20 bar from a starting values of 40 °C and 100 bar, respectively. Due to this condition, quite coarse 10 °C increments were used in the final experiment, and the pressure was varied in 40 bar steps (20, 60, and 100 bar). Finer granularity than this would potentially produce an overlap in data points, making observed differences inconclusive as a result. In a typical test run, the first 1–55 bar were achieved by gas bottle pressure, manually set to a flow rate of 100 mL/min or less. The remainder of the target pressure was produced by pumping at a 100 mL/min flow rate. While the scCO2 equipment allows for pressure control by ABPR (adjustable back pressure regulator), the sealed condition was chosen instead due to the amount of reactants (minerals, water, and CO2) included. The intermittent release of back pressure would expel some amount of water and dissolved species along with CO2, making the analysis less accurate. The runaway behavior of the temperature and pressure described earlier is largely the result of the sealed conditions chosen for the tests.
Figure A1. Pressure vessel (C) is sealed by a threaded lid (B). CO2 is fed into the vessel from the top (A) and released after exposure time from the bottom (E). The open Petri dish (D) is propped up by pieces of aluminium foil to ensure access to bottom outlet.
Minerals 14 00415 g0a1

Appendix B

Figure A2. XRD spectra of pre- and post-carbonation tailing A1. Identified minerals listed for post-carbonation sample.
Minerals 14 00415 g0a2
Figure A3. XRD spectra of pre- and post-carbonation tailing B1. Identified minerals listed for post-carbonation sample.
Minerals 14 00415 g0a3
Figure A4. XRD spectra of pre- and post-carbonation wollastonite W325. Identified minerals listed for post-carbonation sample.
Minerals 14 00415 g0a4
Figure A5. XRD spectra of pre- and post-carbonation wollastonite W635. Identified minerals listed for post-carbonation sample.
Minerals 14 00415 g0a5

Appendix C

SEM images of a singular wollastonite grain (Figure A3) show substantial, block-like calcite crystallized on a wollastonite grain after carbonation (1 h at 100 bar/60 °C). There were signs of some calcite blocks either in the process of forming or dissolving (Figure A3d).
Figure A6. Large wollastonite grains in tailing A1 untreated (a) and carbonated 1 h at 100 bar/60 °C (b). Partially intact calcite crystals (d) could be observed in some clusters that deposited on large wollastonite grains (c).
Minerals 14 00415 g0a6

References

  1. Solismaa, S.; Ismailov, A.; Karhu, M.; Sreenivasan, H.; Lehtonen, M.; Kinnunen, P.; Illikainen, M.; Räisänen, M.L. Valorization of Finnish Mining Tailings for Use in the Ceramics Industry. Bull. Geol. Soc. Finl. 2018, 90, 33–54. [Google Scholar] [CrossRef]
  2. Lindfors, A.; Hakala, J. MEDIA RELEASE: Putting Nordkalk’s Circular Economy Strategy into Practice The Recovery of the Valuable Mineral Wollastonite Is Increasing in Lappeenranta. 2022. Available online: https://www.nordkalk.com/wp-content/uploads/2022/03/MEDIA-RELEASE_Recovery-of-wollastonite-increases.pdf (accessed on 10 April 2024).
  3. Yadav, S.; Mehra, A. A Review on Ex Situ Mineral Carbonation. Environ. Sci. Pollut. Res. 2021, 28, 12202–12231. [Google Scholar] [CrossRef] [PubMed]
  4. Huijgen, W.J.J.; Witkamp, G.J.; Comans, R.N.J. Mechanisms of Aqueous Wollastonite Carbonation as a Possible CO2 Sequestration Process. Chem. Eng. Sci. 2006, 61, 4242–4251. [Google Scholar] [CrossRef]
  5. Di Lorenzo, F.; Prieto, M. Dissolution-Recrystallization of (Mg,Fe)CO3 during Hydrothermal Cycles: FeII/FeIII Conundrums in the Carbonation of Ferromagnesian Minerals. Cryst. Growth Des. 2017, 17, 4170–4182. [Google Scholar] [CrossRef]
  6. Daval, D.; Martinez, I.; Corvisier, J.; Findling, N.; Goffé, B.; Guyot, F. Carbonation of Ca-Bearing Silicates, the Case of Wollastonite: Experimental Investigations and Kinetic Modeling. Chem. Geol. 2009, 265, 63–78. [Google Scholar] [CrossRef]
  7. Monasterio-Guillot, L.; Di Lorenzo, F.; Ruiz-Agudo, E.; Rodriguez-Navarro, C. Reaction of Pseudowollastonite with Carbonate-Bearing Fluids: Implications for CO2 Mineral Sequestration. Chem. Geol. 2019, 524, 158–173. [Google Scholar] [CrossRef]
  8. Wu, J.C.S.; Sheen, J.D.; Chen, S.Y.; Fan, Y.C. Feasibility of CO2 Fixation via Artificial Rock Weathering. Ind. Eng. Chem. Res. 2001, 40, 3902–3905. [Google Scholar] [CrossRef]
  9. Saarimaa, V.; Kaleva, A.; Ismailov, A.; Laihinen, T.; Virtanen, M.; Levänen, E.; Väisänen, P. Corrosion Product Formation on Zinc-Coated Steel in Wet Supercritical Carbon Dioxide. Arab. J. Chem. 2022, 15, 103636. [Google Scholar] [CrossRef]
  10. Min, Y.; Li, Q.; Voltolini, M.; Kneafsey, T.; Jun, Y.S. Wollastonite Carbonation in Water-Bearing Supercritical CO2: Effects of Particle Size. Environ. Sci. Technol. 2017, 51, 13044–13053. [Google Scholar] [CrossRef] [PubMed]
  11. Huijgen, W.J.J. Carbon Dioxide Sequestration by Mineral Carbonation—Feasibility of Enhanced Natural Weathering as a CO2 Emission Reduction Technology; Wageningen University and Research: Wageningen, The Netherlands, 2007; ISBN 9085045738. [Google Scholar]
  12. O’Connor, W.K.; Dahlin, D.C.; Rush, G.E.; Dahlin, C.L.; Collins, W.K. Carbon Dioxide Sequestration by Direct Mineral Carbonation: Process Mineralogy of Feed and Products. Miner. Metall. Process. 2002, 19, 95–101. [Google Scholar] [CrossRef]
  13. Gerdemann, S.J.; O’Connor, W.K.; Dahlin, D.C.; Penner, L.R.; Rush, H. Ex Situ Aqueous Mineral Carbonation. Environ. Sci. Technol. 2007, 41, 2587–2593. [Google Scholar] [CrossRef] [PubMed]
  14. Ewell, R.H.; Bunting, E.N.; Geller, R.F. Thermal Decomposition of Talc. J. Res. Natl. Bur. Stand. 1935, 15, 551–556. [Google Scholar] [CrossRef]
  15. Kojima, T.; Nagamine, A.; Ueno, N.; Uemiya, S. Absorption and Fixation of Carbon Dioxide by Rock Weathering. Energy Convers. Manag. 1997, 38, S461–S466. [Google Scholar] [CrossRef]
  16. Penner, L.; O’Connor, W.K.; Dahlin, D.C.; Gerdemann, S.; Rush, G.E. Mineral Carbonation: Energy Costs of Pretreatment Options and Insights Gained from Flow Loop Reaction Studies. In Proceedings of the 3rd Annual Conference on Carbon Capture & Sequestration, Alexandria, VA, USA, 3–6 May 2004; Volume 5, pp. 1–18. [Google Scholar]
  17. Di Lorenzo, F.; Ruiz-Agudo, C.; Ibañez-Velasco, A.; Gil-San Millán, R.; Navarro, J.A.R.; Ruiz-Agudo, E.; Rodriguez-Navarro, C. The Carbonation of Wollastonite: A Model Reaction to Test Natural and Biomimetic Catalysts for Enhanced CO2 Sequestration. Minerals 2018, 8, 209. [Google Scholar] [CrossRef]
  18. Daval, D.; Bernard, S.; Rémusat, L.; Wild, B.; Guyot, F.; Micha, J.S.; Rieutord, F.; Magnin, V.; Fernandez-Martinez, A. Dynamics of Altered Surface Layer Formation on Dissolving Silicates. Geochim. Cosmochim. Acta 2017, 209, 51–69. [Google Scholar] [CrossRef]
Figure 1. SEM images of the dry as-received tailing fractions: (a) A1; (b) B1; and wollastonite powders (c) W325; (d) W635.
Minerals 14 00415 g001aMinerals 14 00415 g001b
Figure 2. TG measurements of as-received dry mineral fractions (coarse tailing A1, fine tailing B1, and reference wollastonites W325 and W635). Percentages represent the mass loss delta at 600–800 °C and LOI (in brackets).
Minerals 14 00415 g002
Figure 3. XRD analysis of tailing A1, pre- and post-carbonation. Red symbols denote the main (100% relative intensity) peak of presented powder diffraction files for quartz (triangle), calcite (star) and wollastonite (cross). See Appendix B for a complete list of identified XRD spectra.
Minerals 14 00415 g003
Figure 4. XRD analysis of tailing B1, pre-and post-carbonation. Red symbols denote the main (100% relative intensity) peak of presented powder diffraction files for quartz (triangle), calcite (star) and wollastonite (cross). See Appendix B for a complete list of identified XRD spectra.
Minerals 14 00415 g004
Figure 5. XRD analysis of wollastonite powder W325, pre- and post-carbonation. Red symbols denote the main (100% relative intensity) peak of presented powder diffraction files for quartz (triangle), calcite (star) and wollastonite (cross). See Appendix B for a complete list of identified XRD spectra.
Minerals 14 00415 g005
Figure 6. XRD analysis of wollastonite powder W635, pre- and post-carbonation. Major peaks of powder diffraction files for quartz (triangle), calcite (star) and wollastonite (cross) are shown for reference. See Appendix B for a complete list of identified XRD spectra.
Minerals 14 00415 g006
Figure 7. Carbonate conversion (%) of wollastonite powders W325 (D50 = 12.5 µm) and W635 (D50 = 3.5 µm) as a function of time (min), pressure (bar) and temperature (°C).
Minerals 14 00415 g007
Figure 8. The effect of carbonation time (min) and temperature (°C) on conversion (%) at 100 bar.
Minerals 14 00415 g008
Figure 9. Secondary calcite particles (red) clustered on wollastonite (purple) after 1 h at 100 bar/40 °C in tailing A1 (coarse) (a) and W635 reference wollastonite (D50 = 3.5 µm) (b).
Minerals 14 00415 g009
Figure 10. BSE-SEM (a) and EDS (b) of W325 post-carbonation for 1 h at 100 bar/40 °C shows a typical manner of calcite (red) deposition on fine wollastonite (purple). Silicate-heavy (calcium-deficient) areas lean more towards blue on this color spectrum.
Minerals 14 00415 g010
Figure 11. Reference wollastonite W325 untreated (a) and carbonated for 1 h at 100 bar/60 °C (b).
Minerals 14 00415 g011
Figure 12. Reference wollastonite W635 untreated (a) and carbonated for 1 h at 100 bar/60 °C (b).
Minerals 14 00415 g012
Figure 13. Tailing B1 untreated (a) and carbonated for 1 h at 100 bar/60 °C (b).
Minerals 14 00415 g013
Table 1. Modal mineralogy (wt%) of the two wollastonite-rich limestone tailing fractions [1].
Tailing FractionsWollastoniteOther
Ca-Silicates *
Carbonate MineralsPlagioclase, Feldspar, Quartz, and Other
A1 (coarse)30.333.817.120.7
B1 (fine)21.17.154.017.8
* Mostly diopside (CaMgSi2O6).
Table 3. Area EDS spectra (at%) of the two tailings.
SampleONaMgAlSiCaFeSTotal
A166.40.54.71.115.311.9--100
B175.2-1.00.74.718.20.20.2100
Table 4. pH immediately after mixing and at 1 h under atmospheric conditions.
SlurrypH: InitialpH: 1 hpH: Δ
W3259.379.28−0.09
W6359.6610.21+0.55
A19.189.02−0.16
B19.869.59−0.27
Disclaimer/Publisher’s Note: The statements, opinions and data contained in all publications are solely those of the individual author(s) and contributor(s) and not of MDPI and/or the editor(s). MDPI and/or the editor(s) disclaim responsibility for any injury to people or property resulting from any ideas, methods, instructions or products referred to in the content.

