Article

Numerical Simulation Analysis of Control Factors on Acoustic Velocity in Carbonate Reservoirs

1
PetroChina, Southwest Oil and Gas Field Company, Exploration and Development Research Institute, Chengdu 610213, China
2
School of Aerospace Engineering, Tsinghua University, Beijing 100084, China
3
National Graduate College for Engineers, Tsinghua University, Beijing 100084, China
4
State Energy Key Laboratory for Carbonate Oil and Gas, Hangzhou 310023, China
5
PetroChina, Southwest Oil and Gas Field Company, Petrophysics Key Laboratory, Chengdu 610213, China
6
Sichuan Kelite Oil and Gas Technology Service Limited Company, Chengdu 610041, China
7
iCORE Group Inc., Shenzhen 518057, China
8
Research Institute of Tsinghua University in Shenzhen, Shenzhen 518057, China
*
Author to whom correspondence should be addressed.
Minerals 2024, 14(4), 421; https://doi.org/10.3390/min14040421
Submission received: 27 February 2024 / Revised: 7 April 2024 / Accepted: 15 April 2024 / Published: 19 April 2024

Abstract

:
The conventional Archie formula struggles with the interpretation of water saturation from resistivity well log data due to the increasing complexity of exploration targets. This challenge has prompted researchers to explore alternative physical parameters, such as acoustic characteristics, for breakthroughs. Clarifying the influencing factors of porous media acoustic characteristics is one of the most important approaches to help understanding the mechanism of acoustic characteristics of carbonate reservoirs. The article uses digital rock technology to characterize the pore structure, quantitatively identify fractures and pore structures in carbonate rocks, and establish digital models. Through conventional acoustic testing, the pressure wave (P-wave) and shear wave (S-wave) velocities of rock samples at different water saturations are obtained, and the dynamic elastic modulus is calculated. A finite element calculation model is established using the digital rock computational model to provide a basis for fluid saturation calculation methods. Based on real digital rock models, different combinations of virtual fractures are constructed, and factors affecting acoustic parameters are analyzed. The study finds that as porosity increases, the velocity difference between porous cores and fractured cores also increases. These findings provide important technical support and a theoretical basis for interpreting acoustic well logging data and evaluating carbonate reservoirs with different pore and fracture types.

1. Introduction

As the complexity of oil and gas field development increases, the variety of reservoir types extends beyond conventional porous reservoirs. Practical experience in oil and gas field production has highlighted challenges in interpreting water saturation using the Archie formula from resistivity well log data [1,2,3]. Conventional resistivity well logging interpretation principles often fail to accurately predict water saturation in fractured-vuggy carbonate reservoirs [4,5,6,7]. Faced with the limitations of electrical theories in non-porous reservoirs, researchers have begun exploring acoustic methods as a potential breakthrough.
Since the 1940s, the study of acoustic characteristics in porous media has captured the attention of geophysicists. Biot [8] laid the groundwork with his basic elastic theory for rocks and soils. Later, while at Shell Corporation [9], he expanded on this foundation with his theory of acoustic propagation in saturated fluid porous media, providing a significant theoretical basis for applications in physical exploration and seismic wave propagation [10,11,12]. Berryman from Bell Laboratories [13] introduced a self-consistent theory for the elastic moduli (Kb and μb) of porous media in a vacuum. Ogushwitz [14] conducted experimental analysis on both artificial porous media and natural sedimentary rocks, taking into account factors such as porosity, permeability, pore size, skeleton, and fluid properties, to compare theoretical analyses with experimental outcomes and to identify key influencing factors. Their studies [15] explored the relationship between water saturation and the characteristics of P-wave and S-wave using sandstone samples. Zhang et al. [16] conducted experiments on sandstone samples from the Ordos Basin and observed that the P-wave velocity remained relatively constant when the water saturation was below 90%, but increased significantly above this threshold. Wang et al. [17] found in his studies on the Sulige Gas Field’s sandstone samples that while S-wave velocity was unaffected by pore fluid content, P-wave velocity gradually rises with increasing water saturation, peaking at full saturation. The assumptions of the Biot theory are based on the uniform distribution of pores and isotropy, and most experimental studies on the relationship between water saturation and the characteristics of P-waves and S-waves have focused on sandstone samples with uniformly distributed pores. The qualitative analysis suggests that for all rocks, the S-wave velocity becomes independent of water saturation once it exceeds 2%. Increasing water saturation increases density, and when fully saturated, the incompressibility of water contributes to increased rigidity in P-waves, resulting in increased velocity.
Carbonate reservoirs with karst development are prevalent in regions such as the Sichuan Basin, Ordos Basin, Tarim Basin, and North China region [18]. The existence of fractures and vugs challenges Biot’s theory of uniformly distributed pores. The acoustic characteristics of reservoirs are greatly influenced by the framework and pore structure. Conventional analysis methods often construct effective medium models, but excessive abstraction of pores and conduits leads to inaccurate acoustic results [19,20]. Numerical simulation is a high-precision research technique, and numerical methods for studying rock acoustic characteristics and elastic microstructure mainly include the rotating staggered grid finite difference method, acoustic lattice method, and finite element method [21]. Saenger used the rotating staggered grid finite difference method to simulate wave propagation in anisotropic and viscoelastic media [22]. The lattice solid model (PLS) is a cellular automaton model proposed by French scholar Mora [23], which introduces variable-speed particles based on the lattice gas model to simulate wave phenomena in complex media and reveal the inherent connection between particle motion and wave propagation. Lattice methods were used to simulate the propagation of stress waves in rocks [24]. Sandstone samples with different saturation degrees were simulated using lattice and Boltzmann models to determine the rules of P-wave and S-wave and attenuation [25]. The internal acoustic field characteristics of fluid-saturated rocks with random distribution characteristics were simulated using a high-order staggered grid finite difference algorithm based on the Biot theory of porous elastic media [26]. The acoustic lattice method discretizes the porous rock into a series of lattice cells in space [23], and then numerically simulates the acoustic field using the principle of minimum energy. Although this method can accurately simulate the propagation of sound waves in porous media, it is currently limited to two-dimensional numerical simulation studies due to its enormous computational cost. The finite element method is a commonly used numerical calculation method, and the pixel units of three-dimensional digital cores meet the requirements of element mesh division [27,28,29,30]. Therefore, the finite element method can be used to directly solve the linear elastic equations and obtain the elastic and acoustic parameters of rocks based on their microscopic structure using a digital model. In this study, by constructing a three-dimensional digital core model of vuggy carbonate reservoirs, we explore the simulation and calculation methods for the elastic wave characteristics, analyze the correlation of acoustic velocities in carbonate reservoir rocks, and create different virtual pore models for sensitivity analysis of influencing factors. The research findings will provide technical support for the evaluation of vuggy or fractured carbonate reservoirs.

2. Extraction of Pore Structure and Rock Mineral Characteristic Parameters

Three representative samples were selected from the Dengying Formation in the Sichuan Basin, as shown in Figure 1, representing three types of rock: vuggy-fractured type, vuggy-filled-fractured type, and matrix-porosity type. The basic information of the three samples is presented in Table 1. The samples exhibit significant surface fractures, with the highest permeability observed in the fractured samples that are either mineral-filled or lack visible fractures, while the samples with lower permeability show developed fractures. XRD analysis was conducted using the X-ray diffraction technique to identify the mineral composition of the Dengying Formation carbonate rock samples [31]. The results indicate that the carbonate rock samples are predominantly composed of dolomite and quartz, with dolomite mineral content exceeding 90% in most samples.
The analysis of pore structure and rock mineral characteristic parameters in representative carbonate samples from the Dengying Formation in the Sichuan Basin was conducted through the following steps:
Pore structure characteristic parameters of the reservoir rock are extracted using micro-CT scanning, as shown in Figure 1. Given the development of fractures and vugs in carbonate reservoirs, representative samples can be classified into three types: vuggy-fractured, vuggy-filled-fractured, and matrix-porosity types.
The micro-CT scan images are processed and analyzed using DNA-Viz software 1.0, developed by iCORE Group Inc. (Shenzhen, China), to obtain characteristics of the rock pore structure. The statistical distribution of pore throats is depicted in Figure 2.
Centrifuge nuclear magnetic resonance experiments are conducted to analyze the fluid distribution by observing the T2 distribution of rocks under different water saturation conditions, as illustrated in Figure 3.
The CT image characterizes the skeleton and pore structure of the rock, and the X-ray diffraction results characterize the mineral composition of the rock. Based on the micro-CT images, mineral proportions interpreted by X-ray diffraction (XRD) are matched according to grayscale values. The rock skeleton and mineral phases are reconstructed to provide a basis for establishing a numerical rock physics model for acoustic calculations. The representation is illustrated in Figure 4, where red indicates pore structure, blue signifies dolomite, and light blue represents quartz. Capturing high-resolution micro-CT images of carbonate rock samples from a broad perspective is crucial for accurately modeling the fluid flow at the pore scale. If the resolution of the captured images is limited by the scanner, it may not be sufficient for detailed modeling of pore-scale features [32,33]. The presence of pores, whether saturated with fluid or isolated, can reduce the velocity of P-waves to varying degrees [34]. Previous studies have also investigated the influence of storage space morphology on the P- and S-wave velocities in carbonate reservoirs, indicating that the geometric shape of pores has a greater impact on the P-wave velocity compared to the S-wave velocity. Flattened pores or fractures have a more significant effect on the P- and S-wave velocities in the reservoir [35]. However, the authors combined three classical rock physics models (the Wyllie time-average equation, the Gassmann equation, and the Kuster–Toksöz model) for their analysis. While these models are suitable for mechanistic analysis, they cannot adequately simulate and calculate using pore structures that are more complex and realistically representative.

3. Numerical Simulation Method for Vuggy Reservoirs

The study of physical properties of porous media benefits greatly from insights gained in materials science research. Rocks, considered as composite materials, are composed of rock matrix and pore-saturating fluids [36,37,38]. The P-wave and S-wave velocities within these rocks are indicative of their elasticity, which is influenced by the rock matrix, pore structure, and the fluids saturating these pores. Given the complex structure of rocks, obtaining analytical solutions that accurately mirror the characteristics of actual reservoirs proves challenging. As a result, numerical simulation has emerged as a favored approach in research. The elastic theory lays down the fundamental principles for understanding how sound waves propagate through media. However, the development of a wave equation for the pore network model of porous media and its subsequent numerical simulation demands significant computational resources. In contrast, the acoustic properties of rocks can be seen as specific expressions of elastic mechanics [39,40]. Thus, by integrating elastic mechanical parameters with experimental data, it is possible to deduce the acoustic characteristics of rocks. This approach is favored for its simplicity and practical applicability. In this study, the theory of elastic mechanics was used to select an appropriate calculation model to restore and characterize the fine characteristics of complex rock media, and the sound wave velocity was calculated by numerical methods. Based on real mineral skeletons and pore structure models in Figure 4, the finite element numerical simulation is used to calculate the key elastic characteristics of the rock sample, such as bulk modulus (K), and shear modulus (G). Therefore, by correlating stress, strain, and elastic parameters within the framework of elastic mechanics, and by fitting the relationship between static and dynamic elastic parameters, we can compute the P-wave and S-wave velocities of the rocks. This methodology provides a robust framework for understanding the acoustic properties of vuggy reservoirs, offering valuable insights into their elastic characteristics.

3.1. Basics of Elastic Mechanics

In the study of porous media, when external loads are applied, the strain induced within the rock is quantified by a tensor, as is the resulting stress. The relationship between stress and strain in rocks adheres to Hooke’s Law, which establishes a foundational concept in elastic mechanics.
σ = C ε
σ = ( σ xx σ xy σ xz σ yx σ y y σ y z σ z x σ z y σ zz )
ε = ( ε xx ε xy ε xz ε yx ε y y ε y z ε z x ε z y ε zz )
where σ is the stress tensor, ε is the strain tensor, and C is the stiffness tensor. Both stress tensor σ and strain tensor ε are represented by 9-component matrices. To facilitate simpler calculations, we can assume that the rock is an isotropic elastic medium, and the bulk modulus K can be defined using the following equation.
σ = 1 3 ( σ xx + σ yy + σ yy ) = K ( ε xx + ε y y + ε zz )
The shear modulus G is defined as the ratio of shear stress to the corresponding shear strain, given by
σ i j = 2 G ε i j , i j

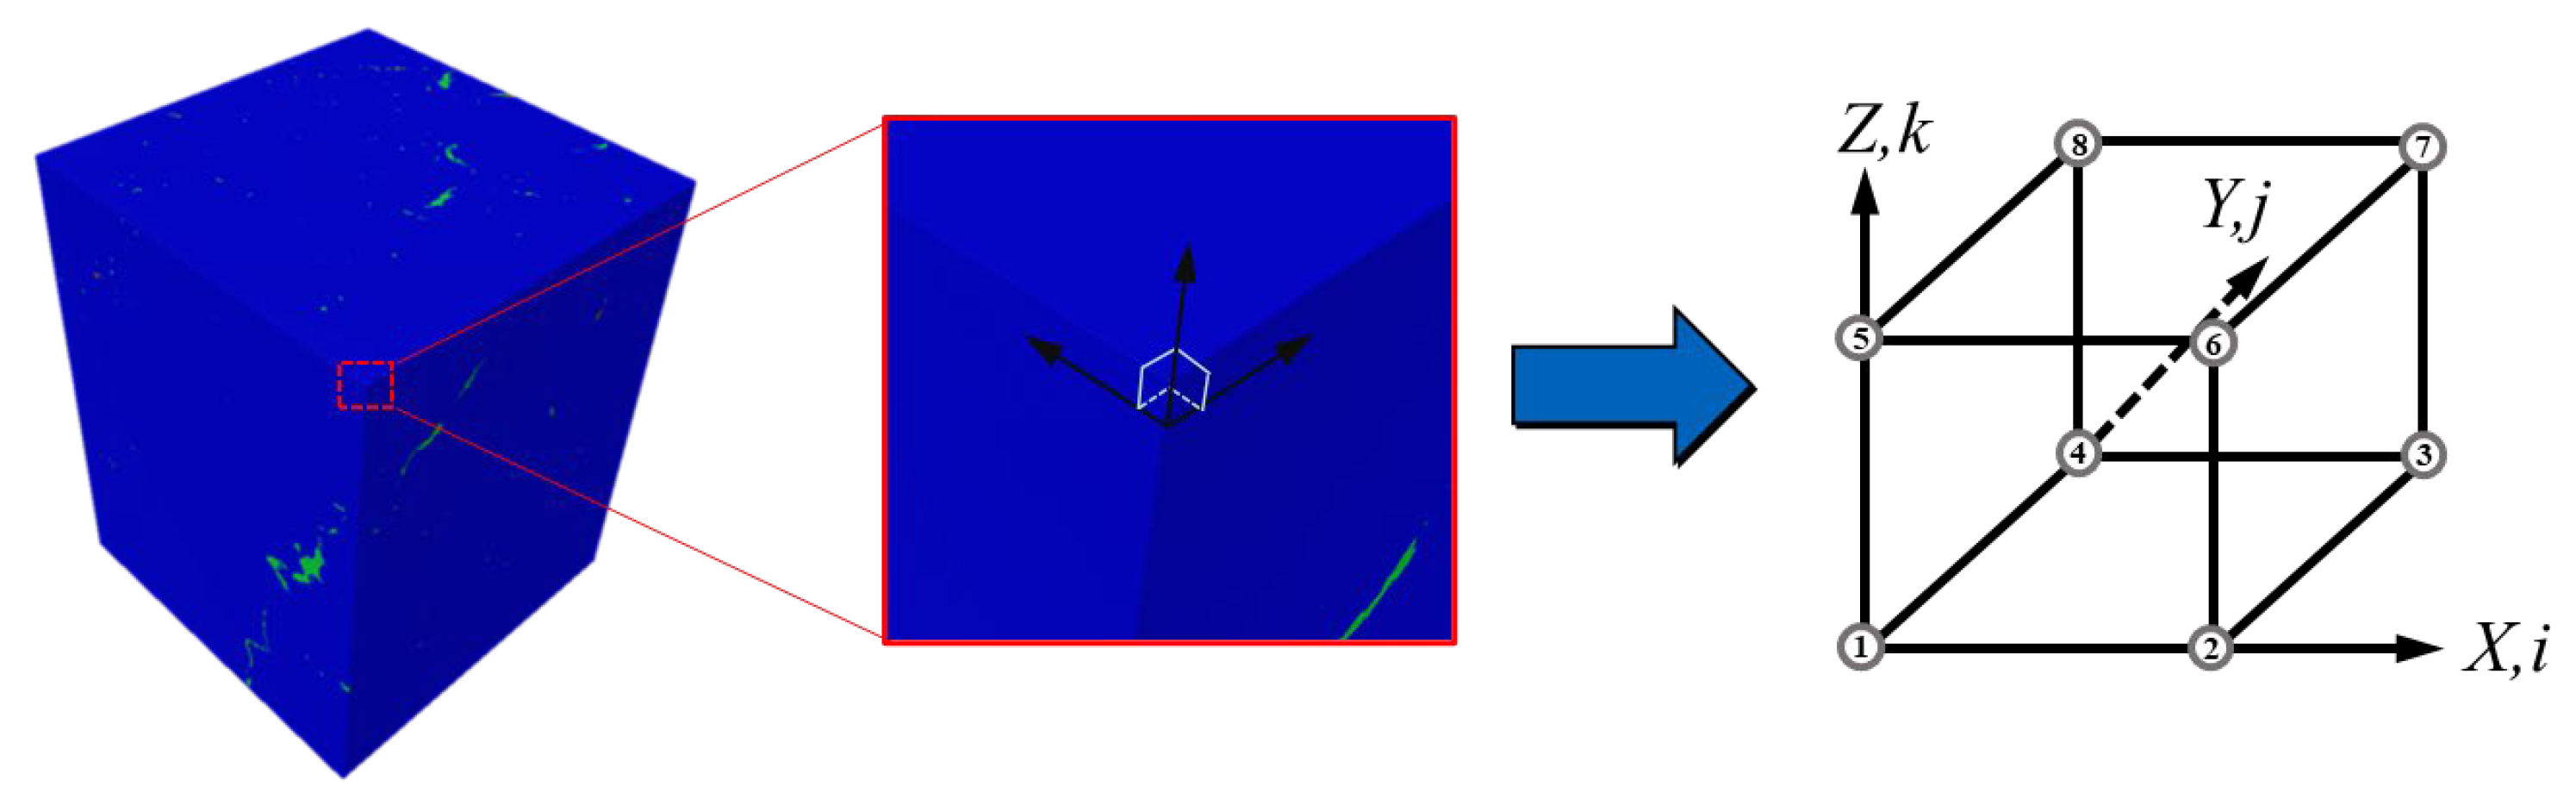
3.2. The Finite Element Numerical Simulation Methods

The finite element method (FEM) simplifies complex problem domains by dividing them into a finite number of elements. By constructing the core, solving equations for each element, the problem parameters of the entire domain can be computed. In the context of three-dimensional finite element analysis, these elements can be subdivided into cubes with eight nodes. The realistic model of the digital rock constructed in Section 2 of this manuscript is made up of cube pixels, the sides of which are the scan resolution. The equivalence of the finite element and pixel body three-dimensional structure simplifies the processing of the full-volume finite element section of rock samples, where pixels are treated as elements within the finite element framework, allowing for the discretization of the pixelated digital rock into multiple small elements. The digital core model can be constructed as a 1:1 rock sample finite element model without loss, and the fine characteristics of the digital core are retained, as shown in Figure 5, with the number of finite elements in the model being no less than 500 million.
This transition from a microscopic to a macroscopic perspective in the finite element model treats each pixel in the digital rock as a single material characterized by precise elastic moduli, such as K and G. The overall elastic modulus of the rock is then determined by averaging the elastic mechanical parameters of its constituents, with the aim of achieving a state of minimum energy where elastic potential energy is minimized. To compute the stress and strain of the digital rock in this minimum potential energy state, the FEM first calculates these parameters. Then, leveraging the foundational relationships between stress, strain, and the elastic parameters in elastic mechanics theory, the elastic parameters are obtained.
Taking the k-th element as an example, its known elastic modulus is C α β k ( α , β = 1 , 2 , 3 , 4 , 5 , 6 ) . The corresponding strain for the unit body is ε α k ( α = 1 , 2 , 3 , 4 , 5 , 6 ) . The elastic potential energy of the unit body is given by
E n = 1 2 V ε α C α β ε β d V , ( α , β = 1 , 2 , 3 , 4 , 5 , 6 )
In Equation (8), ε α k , ε β k represents the strain of each small element within the elastic body V. After discretization, the overall elastic potential energy of the rock is represented as
E = 1 2 k ε α k C α β k ε β k
The strain function is constructed using the FEM, incorporating nodal displacements. This allows the transformation of the total elastic potential energy into an expression in terms of nodal displacement. Considering the k-th element as a cubic element, the displacement function within the element is derived from linear interpolation of displacements (x, y, z) at the eight vertices. Therefore,
u k ( r ) = l p ( r ) u p k , ( r = 1 , 2 , 3 , 4 , 5 , 6 , 7 , 8 ; p = 1 , 2 , 3 )
ε α k ( r ) = L a u k ( r ) = L a l p ( r ) u p k
L a = ( 𝜕 𝜕 x 0 0 𝜕 𝜕 z 0 𝜕 𝜕 y 0 𝜕 𝜕 y 0 0 𝜕 𝜕 z 𝜕 𝜕 x 0 0 𝜕 𝜕 z 𝜕 𝜕 x 𝜕 𝜕 y 0 ) T
Let’s denote D p q = V ( L a l p ) C α β ( L β l q ) d V . The elastic potential energy of the rock can be expressed as follows:
E = 1 2 V ε α C α β ε β d V = 1 2 V u p D p q u q d V
After discretization, we obtain the following expression:
E = 1 2 k ε α k C α β k ε β k = 1 2 k u p k D p q k u q k
If a constant strain ε0 is applied to the rock, the displacement vector of the rock can be transformed into a periodic boundary condition. The total elastic potential energy can be rewritten as:
E = 1 2 k u p k D p q k u q k + 2 δ p k D p q k u q k + δ p k D p q k δ q k
where δ p k represents a function of ε0. By applying the principle of minimum energy, under a constant strain ε0, the displacements throughout the rock eventually relax to minimize its total elastic potential energy, which can be expressed as:
k u p k D p q k + δ p k D p q k = 0
Once the equation is solved to obtain the displacements u p k at each node, they can be substituted into the expression:
{ ε ¯ α = 1 k k L a l p ( r ) u p k σ ¯ α = 1 k k C α β k u p k L β l p ( r )
By obtaining the average strain ε ¯ α and average stress σ ¯ α , and then utilizing the constitutive relationship σ ¯ α = C ¯ α β ε ¯ α , the elastic modulus tensor C ¯ α β is calculated, from which key parameters such as the Young’s modulus, the Poisson’s ratio, the bulk modulus, and the shear modulus can be derived, offering insights into the material’s elastic properties.

3.3. Numerical Simulation Parameter Settings and Wave Velocity Calculations

In the numerical simulation of rock’s acoustic characteristics, assigning accurate values to the elastic mechanical model is crucial. These values are based on the mineralogical composition of the rock, as detailed in Table 2. The samples in this study are mainly composed of dolomite. The content of other carbonate minerals, such as calcite and magnesite, was extremely low as indicated by the X-ray diffraction tests, which had little impact on the calculation of the mechanical properties of the rock. On the other hand, it is generally believed that the shear modulus of the gas components in the pores is zero, and the bulk modulus is negligible compared to the mineral skeleton. Thus, only three components are constructed in the finite element model, which are quartz, dolomite, and formation water.
The elastic mechanical parameters of each component in Table 2 are input into the finite element model, and the static elastic modulus of the entire rock sample was calculated and output by the iterative method to achieve the minimum strain energy. This step involves using a combination of elastic mechanical parameters and experimental data to deduce the acoustic properties of rocks. However, it is important to note that this simulation approach does not consider the frequency of sound waves. The Young’s modulus and bulk modulus, as determined through the simulation using elastic mechanical parameters, are considered static parameters. These static parameters provide a baseline for understanding the rock’s response under static conditions but may not fully capture the rock’s behavior under dynamic conditions, such as those experienced during seismic wave propagation. To more accurately calculate the P-wave and S-wave velocities in core samples with varying water saturation levels, it is essential to measure the dynamic elastic parameters of the core samples during water displacement processes. It involves fitting these dynamic measurements with the previously obtained static parameters to refine the simulation’s accuracy. With the rock density known, the P-wave and S-wave velocities can be calculated as in Equations (16) and (17). This process ensures that the simulated wave velocities reflect both the static and dynamic behavior of the rock, providing a more comprehensive understanding of its acoustic properties.
V p = K + 4 3 G ρ
V S = G ρ

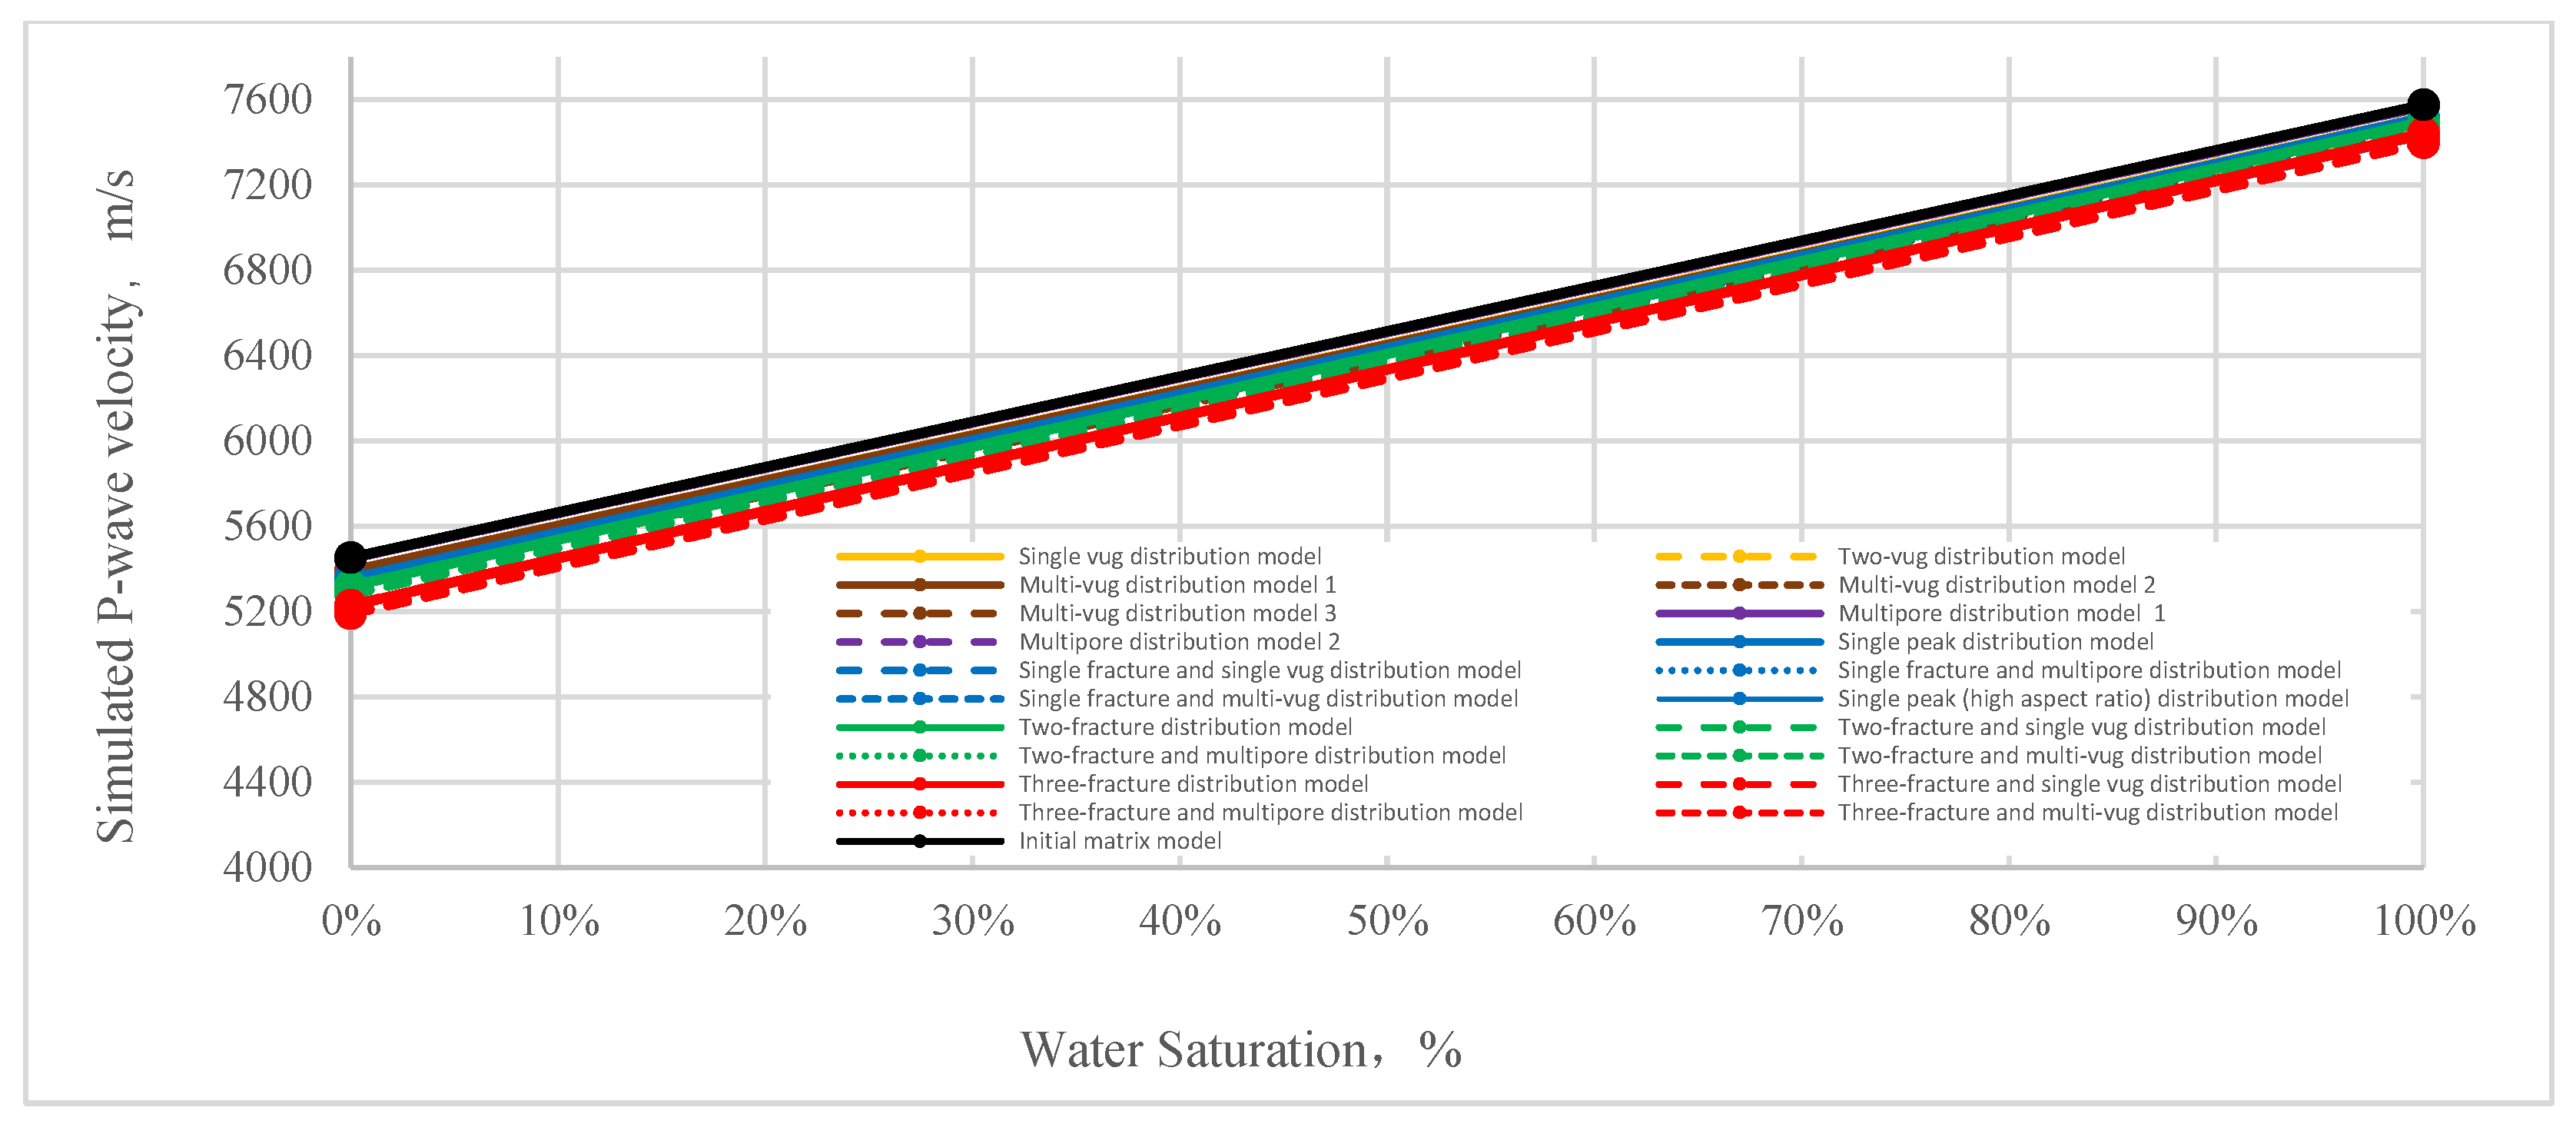
4. Analysis of Numerical Simulation Results

To validate the accuracy of our numerical simulations, we conducted a detailed comparison between the simulated P-wave velocities and their experimentally measured counter-parts, as illustrated in Figure 6. Similarly, we compared the ratios of numerically simulated P-wave to S-wave velocities against measured data, presented in Figure 7. These comparisons revealed a high degree of consistency between our simulation results and the experimental data across different types of pore structures in carbonate rocks. Specifically, the correlation coefficients for P-wave velocities and the P-wave/S-wave velocity ratios were found to be 0.93 and 0.95, respectively.

5. Discussion

To analyze the impact of virtual fractures on the acoustic properties of core samples, we selected the initial pore structure model of sample 201402320123, a matrix pore model detailed in Table 2. The method for reconstructing the digital rock core fracture and pore model is described as follows: First, locate the centers of any two pores and determine their normal to create two parallel circular planes with a radius of r. Connect the centers of the circles to form an axis, which becomes the length of a rectangle. The diameter of the circular planes represents the width of the rectangle, which corresponds to the fracture surface determined by the two pores. Extend the rectangle along the normal direction, both above and below, by a specified thickness w of the fracture surface. As shown in Figure 8, the virtual pore is represented by a sphere with a radius of r. In order to isolate the effects of fractures on the P- and S-wave velocities of the rock, the numerical simulation assumes that the artificially set thickness and width remain constant. This is to eliminate other influencing factors, and the settings are adopted as described in Table 3.
For this sample, we constructed 20 sets of models with varying complex pore structures, including combinations of pore structures, fracture structures, and fracture-pore structures. Additionally, an initial matrix model preserving the mineral skeleton but eliminating the pore structure was created, resulting in a total of 21 models.
The specific virtual fracture structures for each model, illustrated in the Supplementary Materials, correspond to the model numbers listed in Table 3.
Upon integrating virtual pores, cavities, and fractures, we observed varying degrees of reduction in Young’s modulus, bulk modulus, shear modulus, and acoustic velocity. These changes are attributable to the introduction of pores and fractures of different shapes and sizes, as well as the increased complexity of the structural configuration. Our analysis, primarily focused on bulk modulus and P-wave velocity changes, is presented in Figure 9 and Figure 10.
The following key insights were derived:
In models with approximately shaped pore structures, an increase in porosity leads to a more significant decrease in both bulk modulus and P-wave velocity. Smaller pore sizes within the same porosity level result in greater reductions in both modulus and acoustic wave velocity. Compared to pores and cavities, fractures cause a more pronounced decrease in these values, which is further exacerbated as the number of fractures increases.
Fractures are identified as the primary contributors to the reduction in modulus and acoustic wave velocity. In contrast, small-sized cavities have only a minor effect. However, the presence of multiple large-sized cavities leads to significant reductions in both modulus and acoustic wave velocity.
With regard to the volume and morphology of fractures: The modulus reduction is significantly influenced by the distribution volume and morphology of fractures. Models with a larger volume ratio, greater aspect ratio, and more complex combination morphologies experience more substantial reductions in modulus.
As shown in Figure 9, the simulated bulk modulus of the initial matrix model increases from 24.94 GPa to 31.01 GPa as the water saturation changes from 0% to 100%. With an increase in porosity, the slope of the simulated bulk modulus corresponding to the increase in water saturation from 0% to 100% continuously increases. The contribution of water saturation in the pores to the simulated bulk modulus is significantly larger than that of saturated air. The curve in Figure 10 also confirms that the simulated P-wave velocity increases from 5454 m/s to 7576 m/s as the water saturation changes from 0% to 100%. With an increase in porosity, the slope of the simulated P-wave velocity, corresponding to the increase in water saturation, also continuously increases. This is consistent with the common knowledge that the propagation velocity of sound waves in water is greater than in gases.
We also found that core samples with larger pore sizes exhibit greater P-wave and S-wave velocities than those with smaller pore sizes. This phenomenon can be attributed to acoustic principles where, at a given testing frequency, larger pore sizes result in a smaller wavelength-to-pore size ratio. Elastic waves preferentially navigate faster paths, effectively bypassing slower pore spaces, thereby shortening propagation times. This behavior is consistent with the simulation results. Moreover, under identical porosity conditions, cavity-type core samples demonstrate higher acoustic wave velocities than fracture-type cores. As the porosity increases, the velocity difference between cavity-type and fracture-type core samples also increases. This velocity difference amplifies with increasing porosity due to the propensity of fractures to deform under stress, which diminishes elastic performance. Compared to cavities, fractures induce a more significant “softening” effect on the rock skeleton under the same matrix and porosity conditions.
Fractures and vugs play a significant role in reducing the P-wave velocity in carbonate rocks. Our results are presented in Figure 10. For example, when the P-wave test result is 5600 m/s, we can see from the graph that this velocity corresponds to different scenarios such as a single vug distribution model with a water saturation of 6.9% and a three-fracture and multipore distribution model with a water saturation of 16.8%. Although these scenarios have different saturations and pore spaces, they represent the same ability of acoustic wave transmission. A lower longitudinal wave velocity indicates that the sample has more pore spaces that are not occupied by water. Regions with lower longitudinal wave velocities signify more developed vugs, fractures, and cavities. Under the same lithology, these areas should receive more attention during oil and gas exploration.
The quantitative impact of compaction on the porosity of carbonate rocks has been extensively discussed in the paper by Lee [41]. The influence of matrix porosity on rock acoustics will not be reiterated in this study. The focus of this study is primarily on discussing the influence of pore structures such as vugs and fractures on the P-wave velocity in carbonate rocks. As mentioned in previous studies [35,41], carbonate texture contributes to porosity distribution and compaction trends. Fractures oriented parallel to the flow direction have a greater impact on the sample’s permeability. We have identified three distinct types of pore structures in carbonate rocks, exhibiting low porosity ranging from 1.28% to 5.98%. Carbonate rocks developing fractures showed increased permeability, which markedly decreased when fractures were filled with mineral deposits. The presence or absence of fillings in fractures also determines the magnitude of permeability. Although fractures oriented along the direction of acoustic wave propagation have a minimal impact on the sample, fractures oriented perpendicular to the direction of acoustic propagation act as obstacles to the longitudinal wave velocity.

6. Conclusions

After conducting the study, we conclude this paper with the following points:
(1)
The consistency between results from multi-scale fusion calculations of porosity using digital core technology and conventional detection analyses, and nuclear magnetic resonance testing, validates the use of digital cores for pore structure classification and confirms the reliability of quantitative characterization methods.
(2)
The study demonstrates that the acoustic parameters of carbonate rocks are primarily influenced by mineral composition and, to a lesser extent, pore structure. We have established a comprehensive digital analysis workflow for characterizing and simulating the acoustic parameters of fracture and cavity-type carbonate reservoir cores, using the FEM based on digital cores.
(3)
The presence of fractures and cavities significantly reduces the P-wave velocity of carbonate rocks, with fractures having a more substantial impact. The reduction in velocity increases with the volume ratio and aspect ratio of fracture cavity combinations and is more pronounced in more complex morphologies.
(4)
The developed digital analysis workflow offers valuable technical support and a theoretical foundation for evaluating cavity-type or fracture-type carbonate reservoirs. It enhances the interpretation of acoustic well log data, providing a thorough understanding of subsurface carbonate reservoir characteristics.

Supplementary Materials

The following supporting information can be downloaded at: https://www.mdpi.com/article/10.3390/min14040421/s1, Figure S1. Different combinations of fracture and cavity distribution models. The numbers correspond one-to-one with Table 3.

Author Contributions

Conceptualization, J.H. and W.Z.; methodology, J.H.; software, W.Z.; validation, D.Z.; formal analysis, N.L.; investigation, Q.K. and K.C.; resources, L.W. and X.Y.; data curation, H.C.; writing—original draft preparation, J.H.; writing—review and editing, W.Z.; visualization, G.W.; supervision, B.D.; project administration, W.L. (Wei Li); funding acquisition, W.L. (Wei Long). All authors have read and agreed to the published version of the manuscript.

Funding

This work was supported by Research project of Southwest Oil and Gas Field Company, PetroChina [20230301-13] and the Central Government Guided Local Science and Technology Development Special Fund [2020ZYD062].

Data Availability Statement

Data are available from the corresponding author upon reasonable request.

Acknowledgments

The authors would like to thank Wen Long, Luo Bing, Ran Qi, Xie Bing, Zhou Keming, Zhang Qingxiu, Pu Zhijin and Tang Zhijuan for their experiments, guidance, and suggestions. Without their assistance, this paper would not have been possible.

Conflicts of Interest

All authors are employed by the companies PetroChina and iCORE Group Inc. All authors declare that the research was conducted in the absence of any commercial or financial relationships that could be construed as a potential conflict of interest.

References

  1. Yang, X.B.; Yao, M.L.; Wang, S.J.; Zhou, H.; Tong, K.L.; Chen, W.M.; Ma, S.G. Shale gas logging, geology and engineering technologies: New requirements and solutions. Nat. Gas Ind. 2022, 42, 20–27. (In Chinese) [Google Scholar]
  2. Xiong, J.; Zhu, M.Y.; Li, W.M.; Wei, J.F.; Liu, X.J.; Liang, L.X.; Lin, S.Y. Evolution law of physical properties of rocks with different lithologies under high temperature. Nat. Gas Ind. 2023, 43, 14–24. (In Chinese) [Google Scholar]
  3. Zhao, A.; Huang, H.; Xie, B.; Yu, G.; Peng, X.; Tan, J. Well-logging evaluation and productivity prediction of Maokou 2 reservoirs in central Sichuan Basin. Nat. Gas Explor. Dev. 2023, 46, 116–122. (In Chinese) [Google Scholar]
  4. He, J.H.; Li, M.; Zhou, K.M.; Yang, Y.; Xie, B.; Li, N.; Dang, L.R.; Tang, Y.B. Effects of vugs on resistivity of vuggy carbonate reservoirs. Pet. Explor. Dev. 2020, 47, 527–535. [Google Scholar] [CrossRef]
  5. Wang, Y.X.; Xie, B.; Lai, Q.; He, X.Q.; Yang, M.; Zhao, A.L.; Peng, X.; Han, B.; Bai, L. Petrophysical characteristics of deep dolomite reservoirs with bitumen and well-logging evaluation methods. Nat. Gas Explor. Dev. 2021, 46, 116–122. (In Chinese) [Google Scholar]
  6. Xie, J.; He, J.; Zhou, K.; Tang, Z.; Chen, M.; He, T.; Zou, M.; Luo, T.; Li, N.; Wang, L. Mechanism of Forming Low Resistivity in Shale Reservoirs. Geofluids 2022, 2022, 5175577. [Google Scholar] [CrossRef]
  7. Lai, J.; Pan, X.J.; Zhao, X.; Wang, G.W.; Huang, Y.Y.; Li, H.B.; Li, Y.H. Typical misunderstandings and scientific ideas in well logging geology research. Nat. Gas Ind. 2022, 42, 31–44. (In Chinese) [Google Scholar]
  8. Biot, M.A. General Theory of Three Dimensional Consolidation. J. Appl. Phys. 1941, 12, 154–165. [Google Scholar] [CrossRef]
  9. Biot, M.A. Theory of Propagation of Elastic Waves in a Fluid-Saturated Porous Solid II. Higher Frequency Range. J. Acoust. Soc. Am. 1956, 28, 179–191. [Google Scholar] [CrossRef]
  10. Qiao, W.X. Acoustic wave propagation in fluid-saturated porous media. J. Univ. Pet. 1989, 13, 119–125. (In Chinese) [Google Scholar]
  11. Qian, Z.W. Sound propagation in porous media and its research progress. Physics 1995, 24, 534–538. (In Chinese) [Google Scholar]
  12. Ma, C.; Gao, Y.; Lu, C. Numerical modeling of elastic wave in frequency-domain by using staggered grid fourth-order finite-difference scheme. Adv. Geo-Energy Res. 2019, 3, 410–423. [Google Scholar] [CrossRef]
  13. Berryman, J.G. Long-wavelength propagation in composite elastic media Ellipsoidal inclusions. J. Acoust. Soc. Am. 1980, 68, 1820–1831. [Google Scholar] [CrossRef]
  14. Ogushwitz, P.R. Applicability of the Biot Theory. I. Low-porosity materials. J. Acoust. Soc. Am. 1985, 77, 429–440. [Google Scholar] [CrossRef]
  15. Wei, Q.; Wang, Y.; Han, D.-H.; Sun, M.; Huang, Q. Combined effects of permeability and fluid saturation on seismic wave dispersion and attenuation in partially-saturated sandstone. Adv. Geo-Energy Res. 2021, 5, 181–190. [Google Scholar] [CrossRef]
  16. Zhang, Y.H.; Li, C.W. Experimental Study of the Relation between Specific Property of P-wave and Water Saturation in Rock. Well Logging Technol. 1995, 19, 6–10. (In Chinese) [Google Scholar]
  17. Wang, D.X.; Xin, K.F.; Li, Y.M.; Gao, J.H. An experimental study of influence of water saturation on velocity and attenuation in sandstone under stratum conditions. Chin. J. Geophys. 2006, 49, 908–914. (In Chinese) [Google Scholar]
  18. Long, T.; Zhao, J.G.; Liu, X.Z. Cross-band rock physics measurement and theoretical modeling of carbonate rocks--Study on the effect of different pore structures on the dispersion and attenuation of carbonate rocks. Chin. J. Geophys. 2020, 62, 4502–4516. (In Chinese) [Google Scholar]
  19. Zhao, J.P. Digital Rock Reconstruction of Complex Reservoir and Numerical Simulation of Acoustic and Electrical Properties. Ph.D. Thesis, China University of Petroleum (East China), Qingdao, China, 2015. [Google Scholar]
  20. Song, X.D. Numerical Simulation of Elastic Properties of Rock Based on Digital Cores. Doctoral Dissertation, China University of Geosciences, Beijing, China, 2016. [Google Scholar]
  21. Jiang, L.M. Numerical Simulation of Acoustic and Electrical Properties of Natural Gas Reservoir Rocks Based on Digital Cores. Doctoral Dissertation, China University of Petroleum (Eas t China), Qingdao, China, 2012. [Google Scholar]
  22. Saenger, E.H.; Bohlen, T. Finite-difference modeling of viscoelastic and anisotropic wave propagation using the rotated staggered grid. Geophysics 2004, 69, 583–591. [Google Scholar] [CrossRef]
  23. Mora, P. The lattice Boltzmann phononic lattice solid. J. Stat. Phys. 1992, 68, 591–609. [Google Scholar] [CrossRef]
  24. Zhao, G. Modeling stress wave propagation in rocks by distinct lattice spring model. J. Rock Mech. Geotech. Eng. 2014, 6, 348–355. [Google Scholar] [CrossRef]
  25. Anh Nguyen, T.; Pazdniakou, A.; Adler, P.M. Acoustic Properties of Fontainebleau Samples by Lattice Models. Transp. Porous Media 2021, 137, 683–706. [Google Scholar] [CrossRef]
  26. Wang, D.; Zhang, H.-L.; Wang, X.-M. A numerical study of acoustic wave propagation in partially saturated poroelastic rock. Chin. J. Geophys. 2006, 49, 524–532. (In Chinese) [Google Scholar] [CrossRef]
  27. Yan, G.; Sun, J.; Liu, X.; Zhang, L. Accuracy Evaluation on 3D Digital Cores Reconstruction by Process-based Method. J. Southwest Pet. Univ. (Sci. Technol. Ed.) 2013, 35, 71–76. (In Chinese) [Google Scholar]
  28. Jiang, F. A research on Three-Dimensional Reconstruction Method of Three-Dimensional Digital Core. Master’s Dissertation, Yangtze University, Jingzhou, China, 2019. [Google Scholar]
  29. Zhu, Y.H.; Tao, G.; Fang, W. Application of Image Processing Technique in Digital Core Modeling. J. Oil Gas Technol. 2007, 29, 54–57. (In Chinese) [Google Scholar] [CrossRef]
  30. Xu, M. Method of Digital Core Construction and Pore Network Extraction; Southwest Petroleum University: Chengdu, China, 2017. [Google Scholar]
  31. Yu, H.J. Identification of Carbonate Rocks in the Ancient City Region using XRD Diffraction Analyzer. West. Prospect. Eng. 2018, 30, 65–66. (In Chinese) [Google Scholar]
  32. Soltanmohammadi, R.; Faroughi, S.A. A comparative analysis of super-resolution techniques for enhancing micro-CT images of carbonate rocks. Appl. Comput. Geosci. 2023, 20, 1–17. [Google Scholar] [CrossRef]
  33. Soltanmohammadi, R.; Iraji, S.; de Almeida, T.R.; Basso, M.; Munoz, E.R.; Vidal, A.C. Investigation of pore geometry influence on fluid flow in heterogeneous porous media: A pore-scale study. Energy Geosci. 2024, 5, 100222. [Google Scholar] [CrossRef]
  34. Zhang, S.X.; Zou, C.C.; Peng, C. Numerical simulation study of anisotropic velocities in fractured-vuggy carbonate reservoirs. J. Geophys. Eng. 2018, 15, 1851–1863. [Google Scholar] [CrossRef]
  35. Wang, H.; Sun, S.Z.; Yang, H.; Gao, H.; Xiao, Y.; Hu, H. The influence of pore structure on P- & S-wave velocities in complex carbonate reservoirs with secondary storage space. Pet. Sci. 2011, 8, 394–405. [Google Scholar] [CrossRef]
  36. Hu, J.; Xiao, Z.; Ni, H.; Liu, X. Construction of multi-mineral digital rocks for upscaling the numerical simulation of tight rock physical properties. Adv. Geo-Energy Res. 2023, 9, 68–70. [Google Scholar] [CrossRef]
  37. Du, G.H.; Zhu, Z.M.; Gong, X.F. Fundamentals of Acoustics, 3rd ed.; Nanjing University Press: Nanjing, China, 2018; pp. 110–118, 332–340. [Google Scholar]
  38. Liu, X.J.; Liu, S.Q. Petroleum Engineering Logging; Southwest Petroleum Institute Press: Chengdu, China, 2018; pp. 39–40. [Google Scholar]
  39. Ji, X.H.; Shang, F.; Qu, J.F. Research and Application of the Fracturing Technologies Used In Cambrian Dolomite Reservoir with Gypsum In Eastern Tazhong Area. Drill. Prod. Technol. 2016, 39, 64–66. (In Chinese) [Google Scholar]
  40. Han, Y.Q.; Wang, N.H. Discussing on the Dolostone Grading of Surrounding Rock in Railway Tunnel. Railw. Investig. Surv. 2017, 5, 5–7. (In Chinese) [Google Scholar]
  41. Lee, E.Y.; Kominz, M.; Reuning, L.; Gallagher, S.J.; Takayanagi, H.; Ishiwa, T.; Knierzinger, W.; Wagreich, M. Quantitative compaction trends of Miocene to Holocene carbonates off the west coast of Australia. Aust. J. Earth Sci. 2021, 68, 1149–1161. [Google Scholar] [CrossRef]
Figure 1. Representative carbonate samples and corresponding identification numbers: (a) vuggy-fractured type, sample number: 201402320031; (b) vuggy-filled-fractured type, sample number: 202103150006; (c) matrix-porosity type, sample number: 201402320019.
Minerals 14 00421 g001
Figure 2. Statistical distribution of pore throat in representative carbonate samples: (a) vuggy-fractured type, sample number: 201402320031; (b) vuggy-filled-fractured type, sample number: 202103150006; (c) matrix-porosity type, sample number: 201402320019.
Minerals 14 00421 g002
Figure 3. T2 spectrum distribution of representative carbonate samples: (a) vuggy-fractured type, sample number: 201402320031; (b) vuggy-filled-fractured type, sample number: 202103150006; (c) matrix-porosity type, sample number: 201402320019.
Minerals 14 00421 g003
Figure 4. Detailed model of representative carbonate sample: (a) 3D grayscale data; (b) mineral skeleton and pore structure; (c) pore structure.
Minerals 14 00421 g004
Figure 5. Schematic representation of the equivalence between the pixelated digital rock computational model and the finite elements.
Minerals 14 00421 g005
Figure 6. Comparison between simulated and measured P-wave velocities.
Minerals 14 00421 g006
Figure 7. Comparison between simulated and measured P-wave/S-wave velocity ratio.
Minerals 14 00421 g007
Figure 8. Schematic diagram of virtual fracture construction.
Minerals 14 00421 g008
Figure 9. Bulk modulus of various virtual fracture network models.
Minerals 14 00421 g009
Figure 10. P-wave velocity of various virtual fracture network models.
Minerals 14 00421 g010
Table 1. Basic information on the samples and gas permeability test results.
NODiameter
mm
Length
mm
Density
g/cm3
Porosity
%
Permeability
mD
20140232003125.0743.582.703.088.13
20210315000625.6245.832.723.890.258
20140232001925.1243.482.631.360.0742
Table 2. Elastic mechanical parameters and formation water parameters for different mineral components of carbonate rocks.
Mineral
Component
Density,
g/cm3
Elastic
Modulus,
GPa
Poisson’s
Ratio
Bulk
Modulus,
GPa
Shear
Modulus,
GPa
Quartz2.65380.0714.818.6
Dolomite2.87720.3058.226.5
Formation Water1.00/0.452.20
Table 3. Statistical table of virtual fracture models.
NO.Model NameVug ShapeFracture ShapePorosity,
%
Central
Coordinates
Radius,
μm
Width,
μm
Thickness,
μm
1Single vug distribution model470,490,340120//2.48
2Two-vug distribution model470,490,340
495,330,780
120//3.61
3Multipore distribution model 1Random20//1.41
4Multipore distribution model 2Random20//1.63
5Multi-vug distribution model 1Random65//2.50
6Multi-vug distribution model 2Random65//3.66
7Multi-vug distribution model 3Random38//2.50
8Single peak distribution model//240121.86
9Single peak (high aspect ratio) distribution model//480121.85
10Single fracture and single vug distribution model470,490,340120240122.99
11Single fracture and multipore distribution modelRandom20240122.31
12Single fracture and multi-vug distribution modelRandom65240123.02
13Two-fracture distribution model//240122.28
14Two-fracture and single vug distribution model470,490,340120240123.43
15Two-fracture and multipore distribution modelRandom20240122.31
16Two-fracture and multi-vug distribution modelRandom65240123.47
17Three-fracture distribution model//240122.75
18Three-fracture and single vug distribution model470,490,340120240123.88
19Three-fracture and multipore distribution modelRandom20240122.78
20Three-fracture and multi-vug distribution modelRandom65240123.90
21Initial matrix model////0
Disclaimer/Publisher’s Note: The statements, opinions and data contained in all publications are solely those of the individual author(s) and contributor(s) and not of MDPI and/or the editor(s). MDPI and/or the editor(s) disclaim responsibility for any injury to people or property resulting from any ideas, methods, instructions or products referred to in the content.

