Article

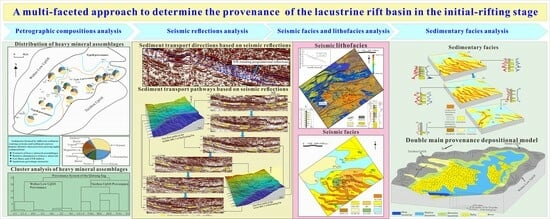
A Multi-Faceted Approach to Determining the Provenance of the Lacustrine Rift Basin in the Initial Rifting Stage: A Case Study of the Paleocene Qintong Sag, Subei Basin, East China

1
State Key Laboratory of Petroleum Resources and Prospecting, China University of Petroleum (Beijing), Beijing 102249, China
2
College of Geosciences, China University of Petroleum (Beijing), Beijing 102249, China
3
College of Mining Engineering, North China University of Science and Technology, Tangshan 063210, China
4
Research Institute of Petroleum Exploration and Development, SINOPEC East China Oil & Gas Company, Nanjing 210011, China
5
Exploration Management Department of Taizhou Oilfield, SINOPEC, Taizhou 225300, China
*
Author to whom correspondence should be addressed.
Minerals 2024, 14(4), 420; https://doi.org/10.3390/min14040420
Submission received: 12 March 2024 / Revised: 2 April 2024 / Accepted: 16 April 2024 / Published: 18 April 2024
(This article belongs to the Topic Petroleum Geology and Geochemistry of Sedimentary Basins)

Abstract

:
Research on the provenance of sedimentary systems is key to better understanding the sedimentary framework and improving exploration-associated decision-making and deployment. With regard to the provenance of sedimentary systems, there is still poor understanding in the initial rifting stage due to imbalanced and insufficient exploration and a common lack of seismic data, which have seriously hindered oil exploration in the Qintong Sag, Subei Basin. This study aimed at investigating the provenance in the direction of the fault-terrace zone in the southeast part of the Qintong Sag and aimed to examine whether large-scale sedimentary systems are formed by these sediment sources. Integrated analysis of heavy minerals, sandstone petrologic maturity, drilling cutting dates, 3D seismic data, and well logs was employed to identify the provenance. This study is the first time that large-scale provenance from the direction of the fault-terrace zone has been discovered in the third member of the Paleocene Funing Formation (referred to as the third Mbr of the Funing Fm in this paper) in the Subei Basin, east China. The documentation shows that sediments from the northwest Wubao Low Uplift and the southeast Taizhou Uplift can be distinguished in the Qintong Sag, with the large-scale delta system in the central and eastern part of the Qintong Sag comprising sediments from the Taizhou Uplift, improving upon previous understanding of the sedimentary framework. The deposition formed by the Taizhou Uplift provenance system was characterized by gradual weakening of the hydrodynamic forces, a decreasing sediment supply, and shrinking of the retrogradational delta depositional systems with good reservoir qualities, which are characterized by high-quality source–reservoir–cap combinations and are likely to develop into a hydrocarbon-rich belt. The discovery of the Taizhou Uplift provenance proves that there may be major provenance and large-scale sedimentary systems from the fault-terrace zone of the rift basins in the initial rifting stage. The experience of rapid retrogradation showed that these large-scale delta systems are likely to only flourish in the initial rifting stage. This study is helpful for improving the understanding of sediment provenance and the sedimentary framework of lacustrine rift basins in the initial rifting stage.

Graphical Abstract

1. Introduction

Lacustrine rift basins are characterized by small-scale and complicated tectonic evolution, thin-bedded reservoirs, rich hydrocarbon potential, and deep burial depths [1,2,3,4,5]. They have become popular locations for hydrocarbon exploration and development owing to their complex geological conditions and potential economic benefits. Recently, research on lacustrine rift basins with respect to their tectonic evolution and sedimentary facies has received increased attention [6,7,8,9], and most studies have focused on the gentle slope zone [10,11]. However, studies on the provenance of lacustrine rift basins in different evolution stages have rarely been reported, particularly in the initial rifting stage of such basins [12,13,14]. The tectonic evolution of lacustrine rift basins is a dynamic process involving the gradual changing of the provenance and sedimentary system [15]. Previous provenance studies have rarely been conducted according to the evolution stages of the basin, resulting in contradictory conclusions, such as the provenance from the direction of the gentle slope zone and fault-terrace zone serving as the major and minor sediment sources, respectively; fault-terrace zones with minor sediment sources only deposit small-scale and short-axis turbidite fans, alluvial fans, and fan deltas, which hardly provide favorable reservoirs [16,17], and the provenance from the direction of both gentle slope zones and fault-terrace zones serves as a major sediment source and forms large-scale sedimentary systems with potential reservoirs [18,19]. Provenance analysis results substantially affect the classification of sedimentary systems and the reconstruction of the sedimentary history, further facilitating petroleum exploration.
The different source rocks and transport processes are of considerable importance with respect to the particle size, sorting, grain roundness, properties, and geometrical morphology of reservoirs. Conventional geochemistry-, geochronology-, and thermochronology-based provenance analysis methods majorly rely on core samples and are therefore limited by the scarcity of drilled cores [20,21,22]; nevertheless, combining these methods with seismic investigation and sedimentology can mitigate these shortcomings, allowing for the accurate reconstruction of provenance systems.
The Qintong Sag is one of the most hydrocarbon-rich regions in China, contributing approximately 30% of the oil and gas reserves in the Subei Basin [23,24]. The common lack of potential provenance and sedimentary facies analysis has seriously hindered oil exploration. Exploration is sporadic in this region [25,26], and the current study is focused on the western slope region of this sag; investigations on the central and eastern parts of this sag have rarely been conducted because of limited seismic and well data [27,28]. A previous study indicated that the Wubao Low Uplift, located to the northwest of the gentle slope zone, serves as the only major sediment source, and investigations into any possible major provenance from the Taizhou Uplift, located to the southeast of the fault-terrace zone, and the large-scale sedimentary systems formed by this provenance have yet to be put into effort.
The newly acquired seismic and well data from the eastern and central parts of the Qintong Sag provide an opportunity to investigate the potential provenance of the central and eastern sag. The purpose of this study was to investigate whether any sediments were provided by other potential provenances and whether large-scale sedimentary systems were formed via those provenances in the central and eastern parts of the Qintong Sag. Information regarding the heavy mineral composition, the ZTR index, and sandstone compositional maturity was combined with sedimentology and seismic sedimentology methods to trace the sedimentary transport directions and pathways, distinguish the provenance, and reconstruct the sedimentary model in the study area. The results of this study are expected to enhance our understanding of provenance systems in lacustrine rift basins.

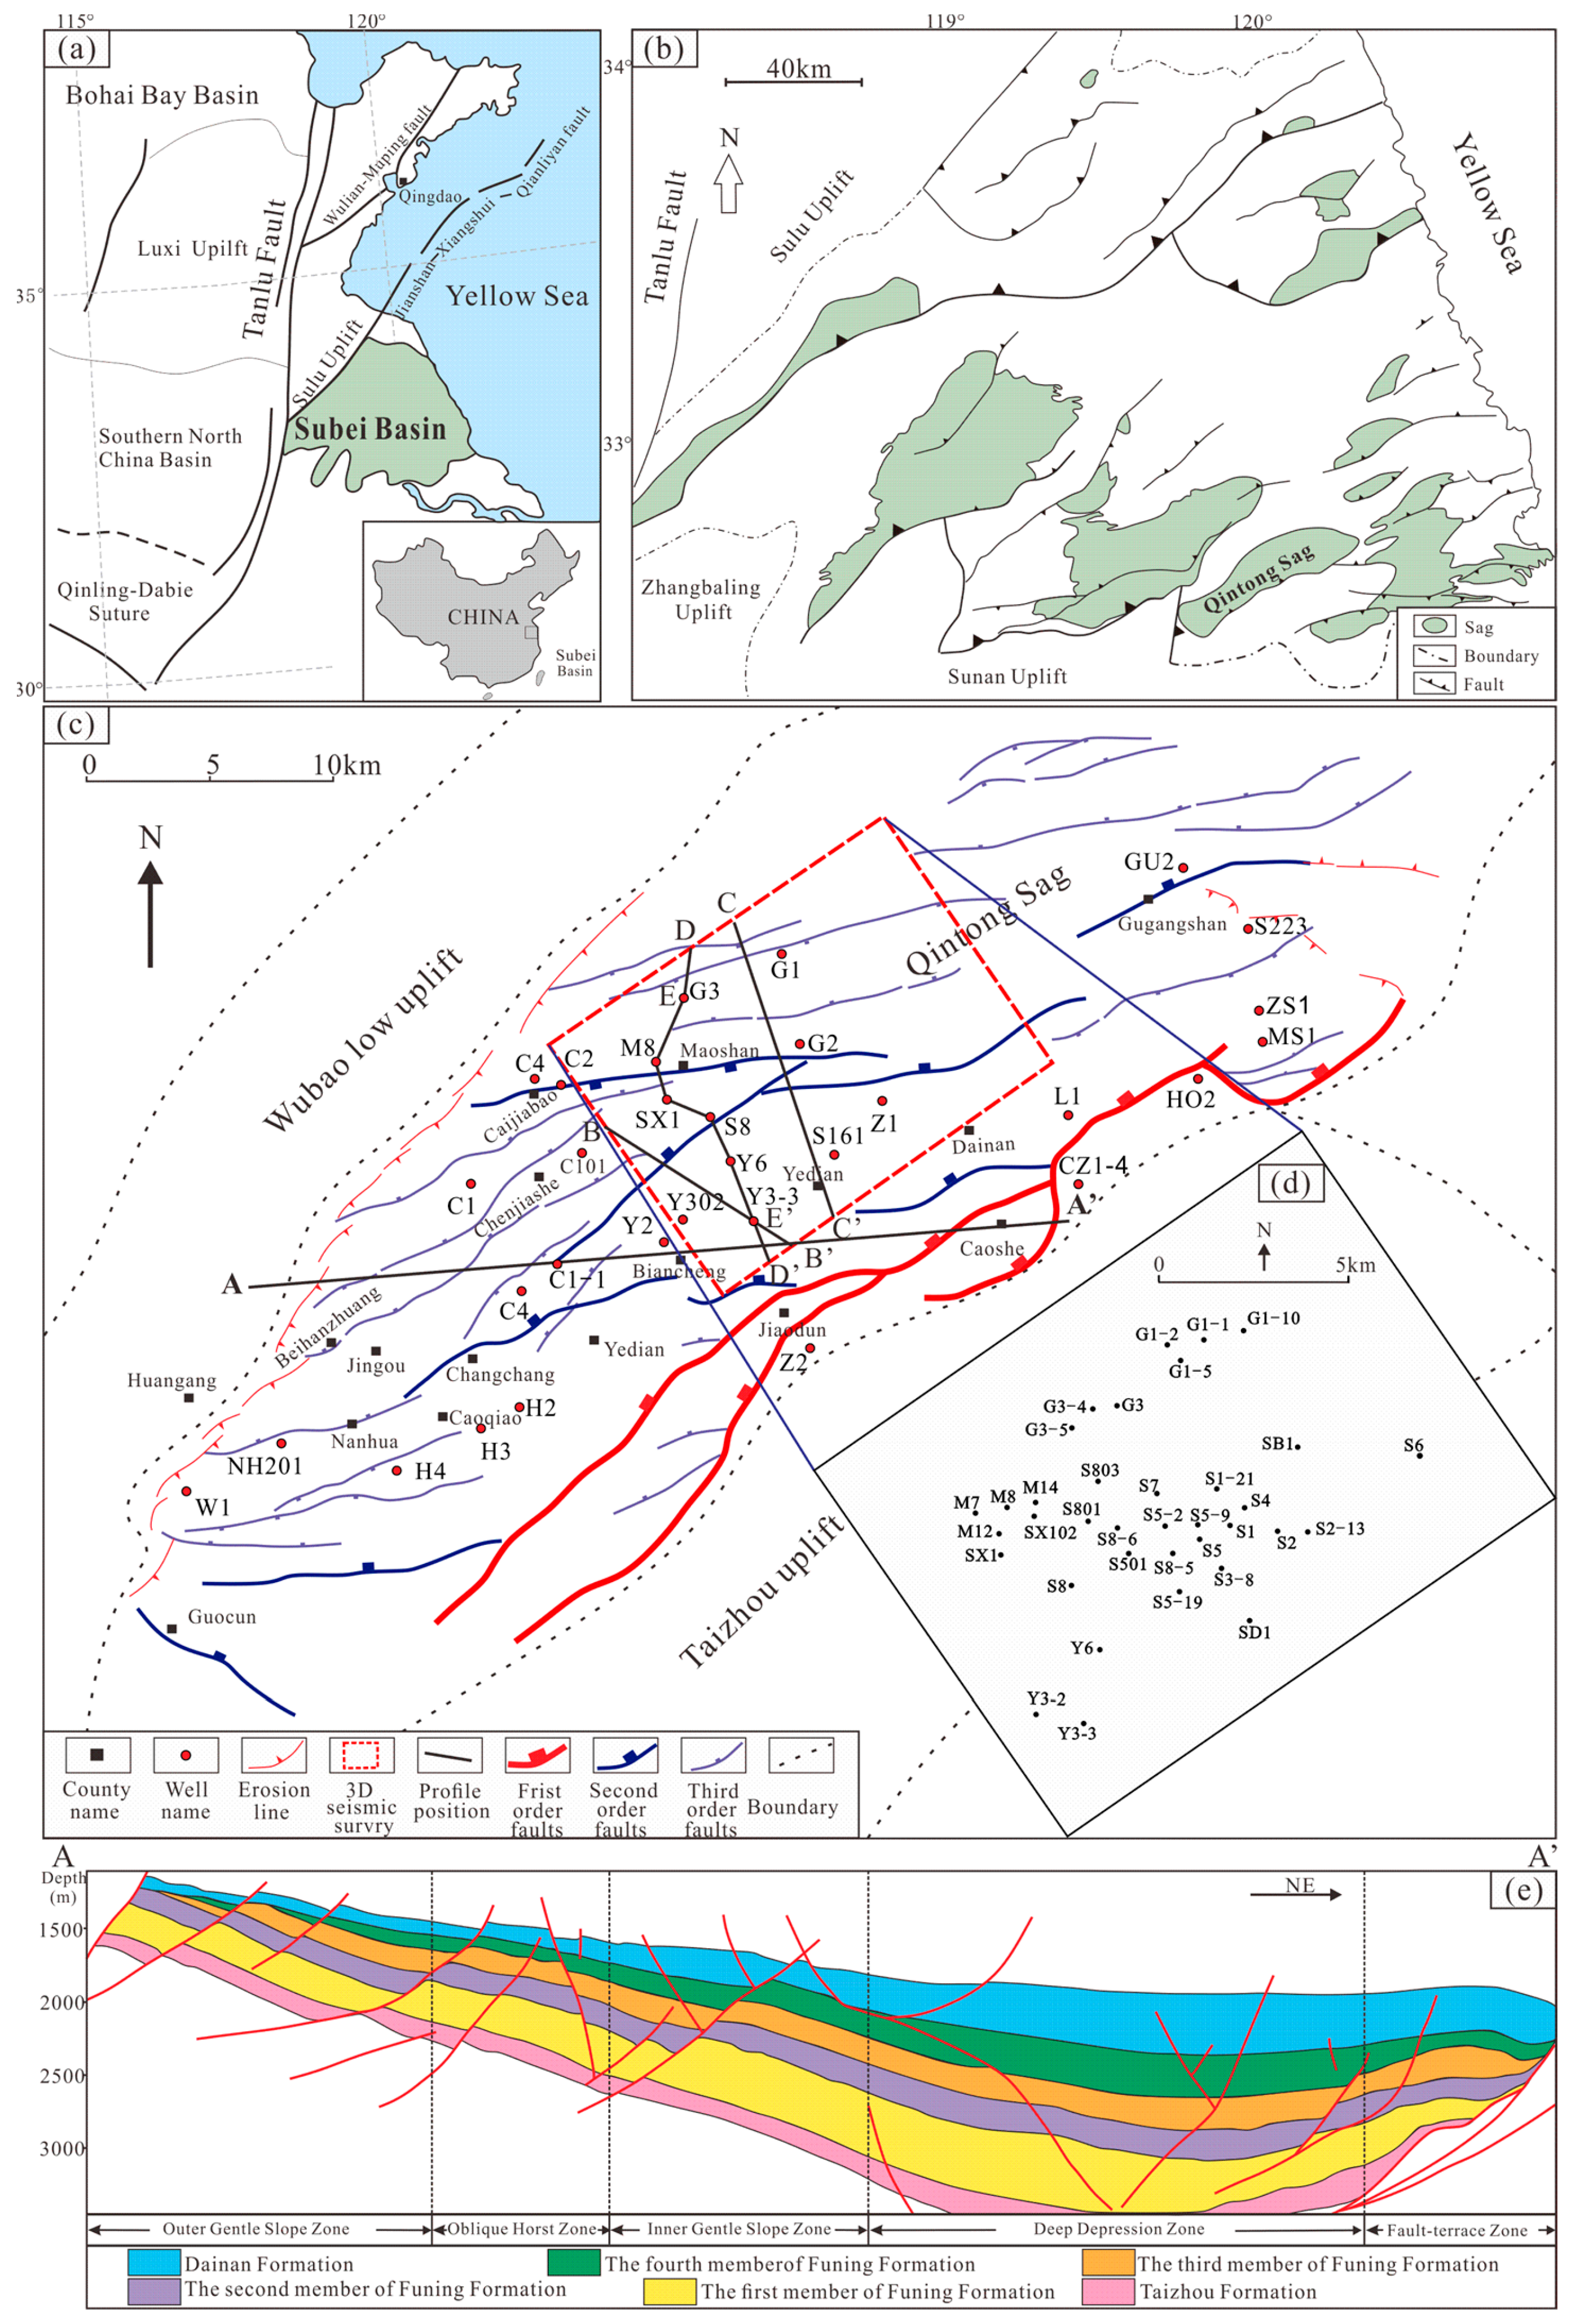
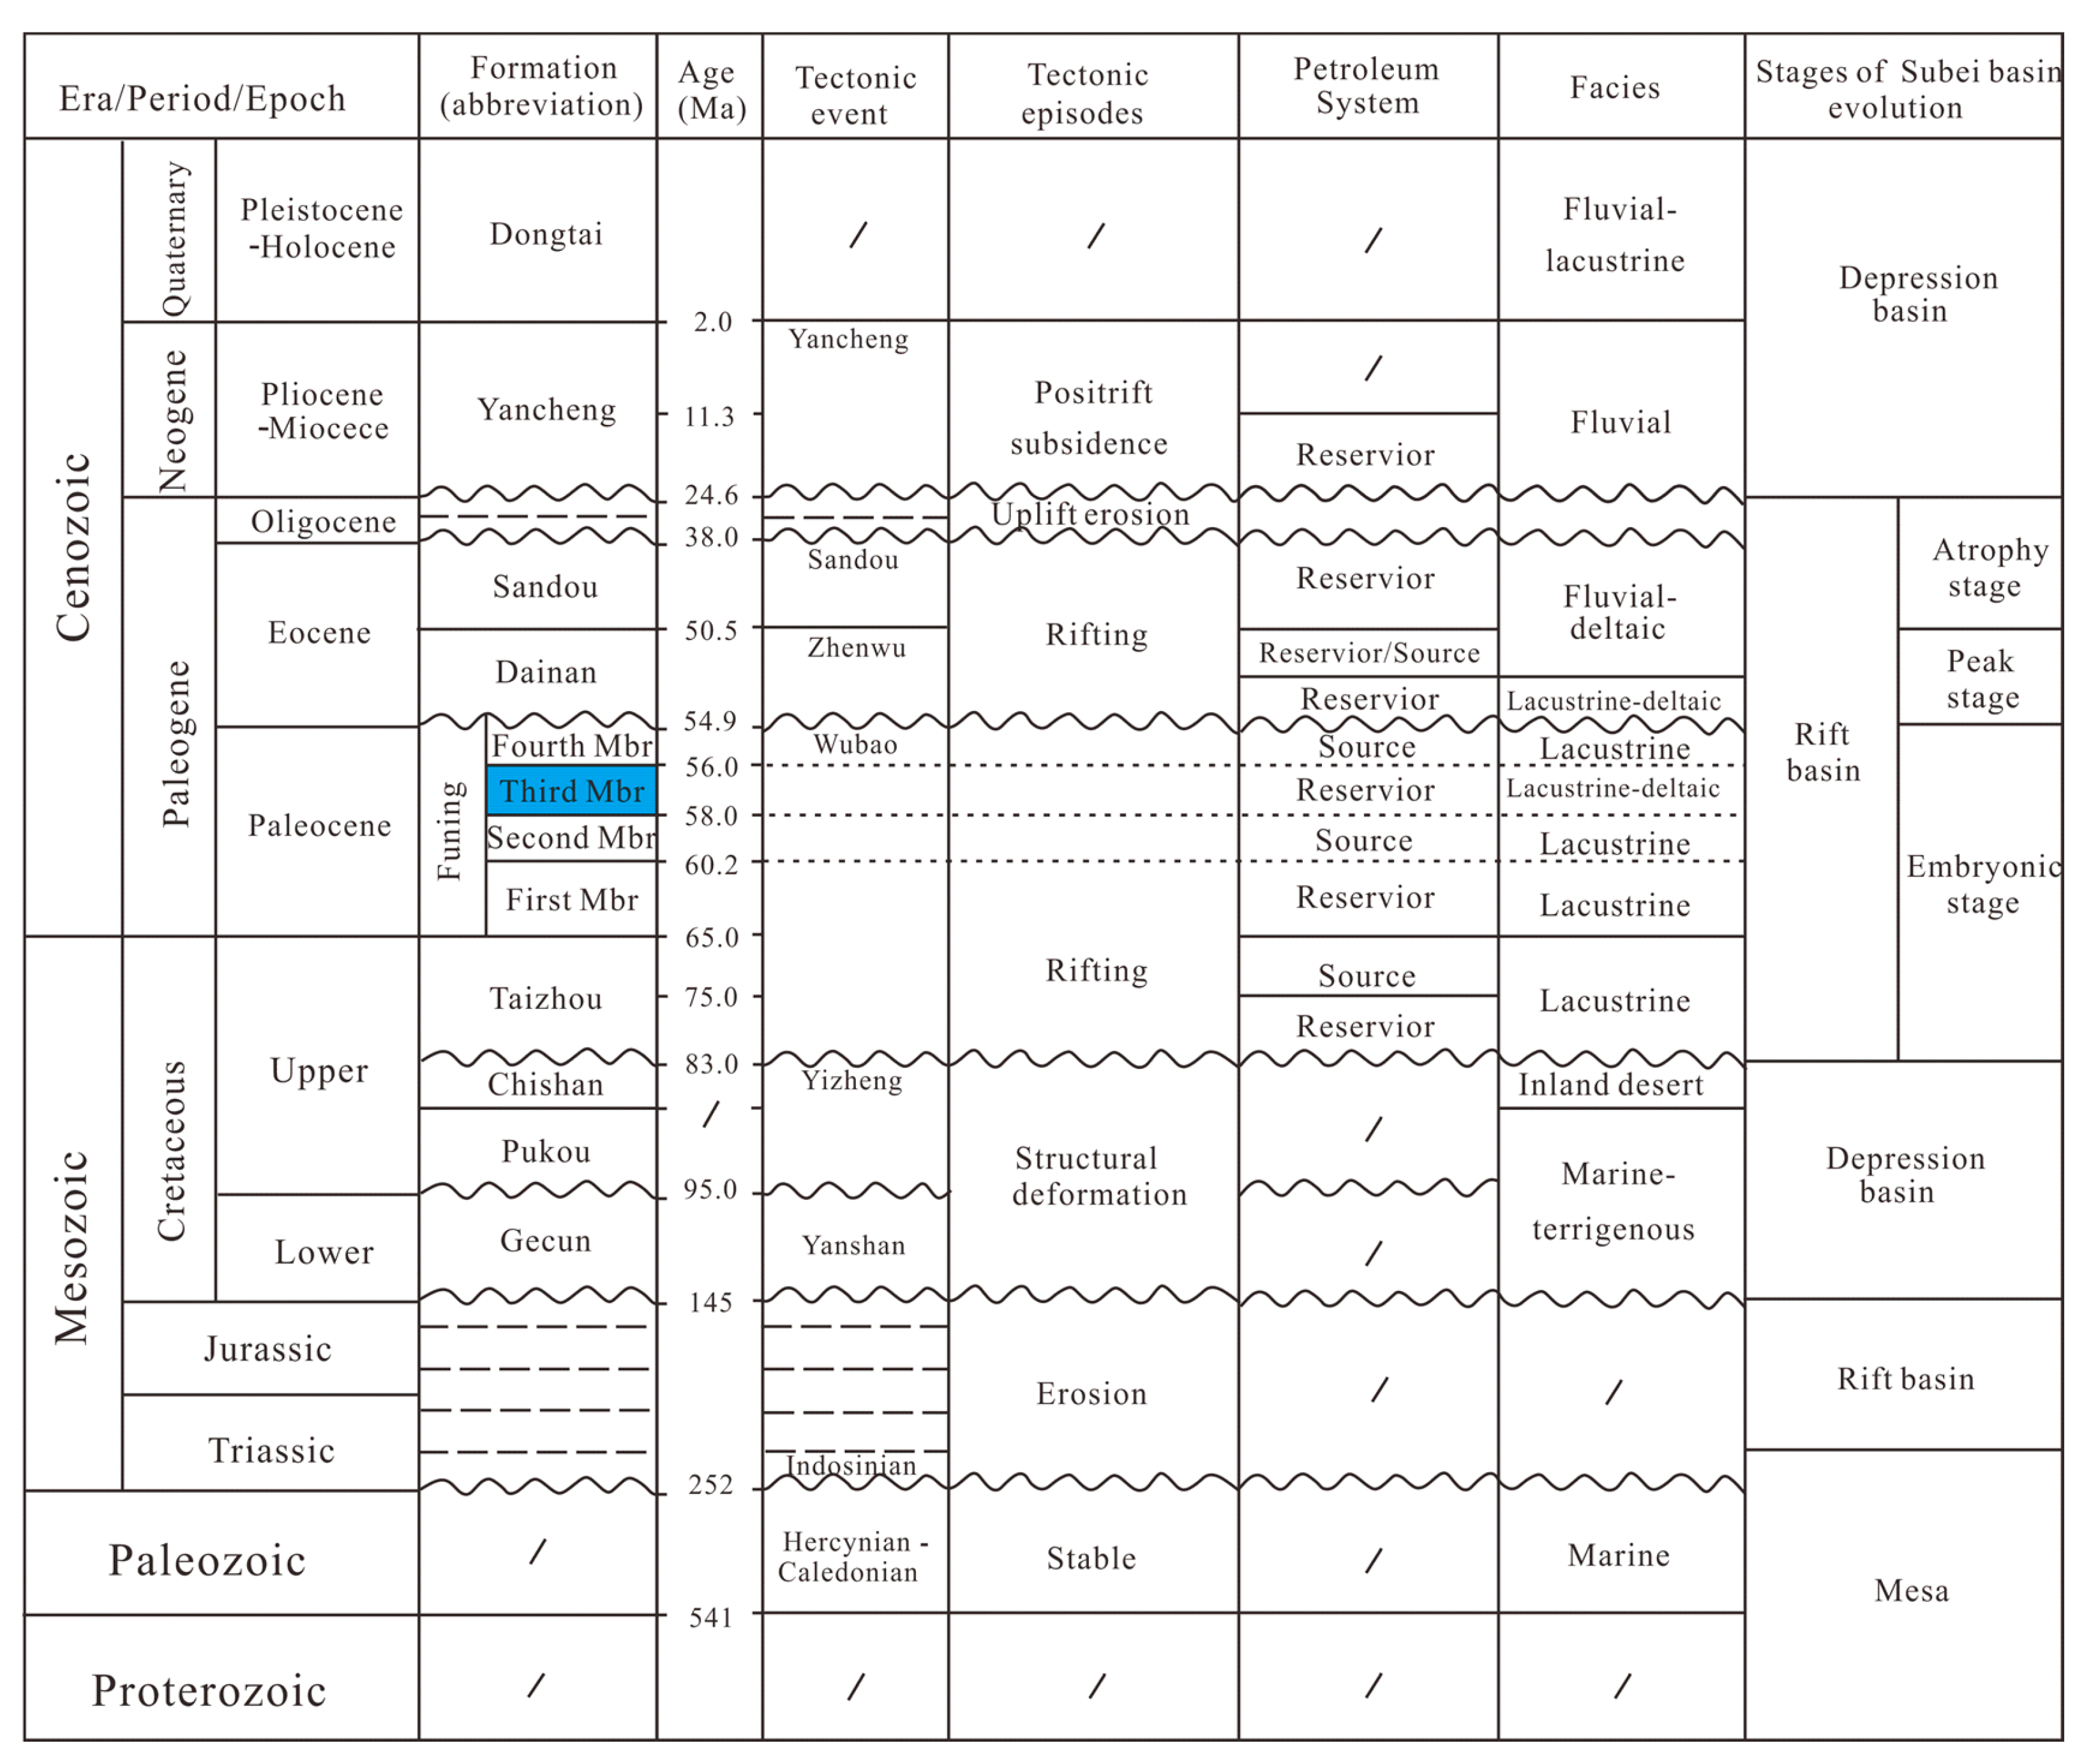
2. Geological Setting

The Subei Basin, which evolved from a highly complex basement [29], is the largest Cenozoic offshore extensional petroliferous rift basin in East China (Figure 1a) [30]. The formation and evolution of the Subei Basin occurred over four stages: thrust and nappe during the Early and Middle Triassic, back-arc expansion in the Early Cretaceous, regional extension and strong rifting in the Late Cretaceous, and overall subsidence and sedimentation since the Neogene [31,32,33,34]. The Subei Basin comprises the Yanfu Depression in the north and the Dongtai Depression in the south, which are separated by the Jinhu Uplift. The Dongtai Depression, which is the most important hydrocarbon-bearing area in the basin, can be divided into five sags from west to east: the Jinhu Sag, Gaoyou Sag, Qintong Sag, Haian Sag, and Baiju Sag [35].
The Qintong Sag, located on the south edge of the Dongtai Depression, is a southwest-to-northeast-extending rift lacustrine sag that encompasses an area of approximately 1200 km2 (Figure 1b). The sag is bounded by the Wubao Low Uplift to the northwest and the Taizhou Uplift to the southeast (Figure 1c) and comprises several secondary structural units from north to south: the outer gentle slope zone, the oblique horst zone, the inner gentle slope zone, the deep depression zone, and the fault-terrace zone (Figure 1e). The strata in the Qintong Sag comprise five formations (formation referred to as Fm in this paper) in the following ascending order: the Paleogene Taizhou Fm, Funing Fm, Dainan Fm, Sanduo Fm, Neogene Yancheng Fm, and Quaternary Dongtai Fm (Figure 2). Tectonic activities such as strike-slip and extension during the Funing Fm deposition changed the basin from a depression basin to a rift basin, with the deposition reaching a thickness of approximately 1850 m. The Funing Fm, the most important hydrocarbon-bearing strata in the depression, can be further subdivided into four strata. The third Mbr of the Funing Fm, which was deposited during the early stages of the Qintong rift basin formation [36,37,38,39], is the most important target layer. The deposits of the second, third, and fourth members of the Funing Fm include the most important source rocks, reservoirs, and caprocks, respectively, which reserve more than 67.9% of the total hydrocarbon traps in Subei Basin [40,41].
Previous studies have focused on the reservoir characteristics and sedimentary facies of this layer [43,44,45]. Moreover, basin-scale provenance analysis has been frequently conducted in the Subei Basin; however, sag-scale analysis has been rarely conducted, particularly in the Qintong Sag [46,47]. Previous studies investigating the sedimentary facies and sand body thickness distribution on the western slope of the Qintong Sag have suggested that sediments are only from the Wubao Low Uplift in the west, and the possibility that some sediments comprising large-scale sedimentary systems are derived from the Taizhou Uplift located to the southeast of the sag remains unknown [28,42,48].

3. Data Collection and Analytical Methods

Sedimentary transport is often accompanied by changes in mineral abundance, sandstone composition, erosion, landscape, and evolution of sedimentary facies, which constitute extremely powerful tools that can be used to decipher and predict complicated provenance characteristics [49,50,51]. In this integrated study, several approaches were employed to comprehensively identify the source; these approaches involved the use of the ZTR, Gzi, and Ruzi indices (ratios of tourmaline to rutile zircon, garnet to zircon, and TiO2 minerals (rutile and leucoxene) to zircon, respectively), sandstone compositional maturity, seismic reflection characteristics, and seismic and sedimentary facies.

3.1. Data

The provenance of the third Mbr of the Funing Fm in the Qintong Sag was analyzed based on the datasets, including heavy minerals, sandstone petrographic maturity, framework grain (quartz, feldspar, and lithic fragments), drilling cutting dates, well logs, and lithologic and three-dimensional (3D) seismic data. Furthermore, drilling cutting dates, sandstone petrographic maturity data, and framework grain data related to the Qintong Sag were obtained from the East China Oil and Gas Company, SINOPEC (Nanjing, China). Well logs and lithologic and 3D seismic data were provided by Taizhou Oilfield, SINOPEC.
Heavy mineral assemblages in sandstones from the Qintong Sag were analyzed based on samples collected from 13 wells, with one sandstone sample being collected from each well, including zircon, tourmaline, garnet, mica, epidote, sphene, rutile, leucite, magnetite, limonite, barite, and pyrite. Sandstone petrographic maturity data and framework grain data (quartz, feldspar, and lithic fragments) were obtained from 17 and 10 wells, respectively. The well locations of the petrographic composition samples are shown in Figure 1c. Well logs (gamma ray (GR) and resistivity (RT) logs were employed in this paper) and lithologic data were collected from 49 wells, and the locations of the wells are shown in Figure 1d, and the data were collected by drilling teams of the Jiangsu Oilfield in cooperation with the Geological Research Institute of the East China Oil and Gas Company and Taizhou Oilfield, SINOPEC, from 2016 to 2022. The sampling interval of the logging curves was 0.125 m, and the third Mbr of the Funing Fm was generally drilled completely. Full-coverage 3D post-stack seismic data indicate an effective frequency range of 0–59.5 Hz with a dominant frequency of approximately 29.5 Hz covering an area of 150 km2 and with an imaging depth of 4.7–5 s, and the maximum time depth of the Funing Fm was approximately 2.2 s, all within the available imaging range, with clear seismic reflections and good data quality. Three-dimensional post-stack seismic data were collected by the Geological Research Institute of the East China Oil and Gas Company, SINOPEC, from 2019 to 2020.

3.2. Analytical Methods

Sediments formed by different sediment routing systems and sediment sources display distinct characteristic petrographic compositions and textural features, and although the mechanism of sediment formation is not yet completely clear, these distinct characteristics can still be useful in provenance analysis [51].
Provenance analysis includes the identification and classification of sediment sources and sediment transport directions and pathways. The identification and classification of provenances are dependent on the compositions and relative abundances of heavy minerals, which can be assessed by using the ZTR, Gzi, and Ruzi indices together with magnetite, limonite, and garnet, whose contents are sensitive to spatial location; moreover, cluster analyses are employed for validating the identification and classification of provenances [13,52]. Sediment transport directions are determined by using ZTR indices, sandstone petrologic maturity, the directions of seismic progradational reflections, and the distribution characteristics of lithofacies, seismic, and sedimentary facies. ZTR indices are employed to assess the comprehensive effects of mechanical and chemical weathering and to further infer a rough direction and distance for the transport of sediment from the source area to the sag and identify sources of provenance [53,54]; additionally, sandstone compositional maturity provides important constraints regarding the direction and distance of sediment transport and potential sedimentary provenance [55,56,57].
Sediments, from their formation to final deposition, are affected by erosion and modification, resulting in different depositional textures and seismic reflection characteristics [58,59]. Therefore, 3D seismic data processing was employed to investigate the seismic reflection characteristics, facilitating the accurate identification of the sediment transport directions and migration pathways in the study area. The spatial distribution of seismic facies, seismic attributes, and sedimentary facies can provide important information that can lead to a better understanding of the distribution and dynamics of sediment provenance, verifying the results obtained from heavy mineral and petrographic maturity data and allowing provenance analysis to be performed from the perspectives of hydrodynamic force, lithological distribution, and transfer deposition. Progradational seismic reflections can be used to directly show palaeo-flow directions and infer provenance directions [60]; additionally, sediment transport pathways are interpreted to represent palaeo-flow channels, which can be depicted according to the connections of concave seismic reflections. Lithofacies, seismic, and sedimentary facies from orogens and uplifts to basins show a certain sequence of distribution, where delta facies gradually evolve into lacustrine facies and lithofacies change from sand-rich to mud-rich toward basins. The mean instantaneous amplitude was extracted based on the good relationship between the seismic attributes and lithologies, thus providing a method for predicting the lithology [60,61]. The classification of seismic facies was conducted based on the seismic reflection of the amplitude, frequency, external form, internal configuration, continuity, smoothness, and sandstone content. Despite being the oldest analytical method, the comprehensive analysis of drilling cuttings, well log signatures, and seismic facies remains the most valuable tool to identify sedimentary facies [62,63,64]. Combining the seismic attributes with the distribution of seismic facies allowed us to extend the sedimentary facies study to the entire block based on sedimentology and seismic sedimentology.

4. Provenance Analysis

4.1. Provenance Identification

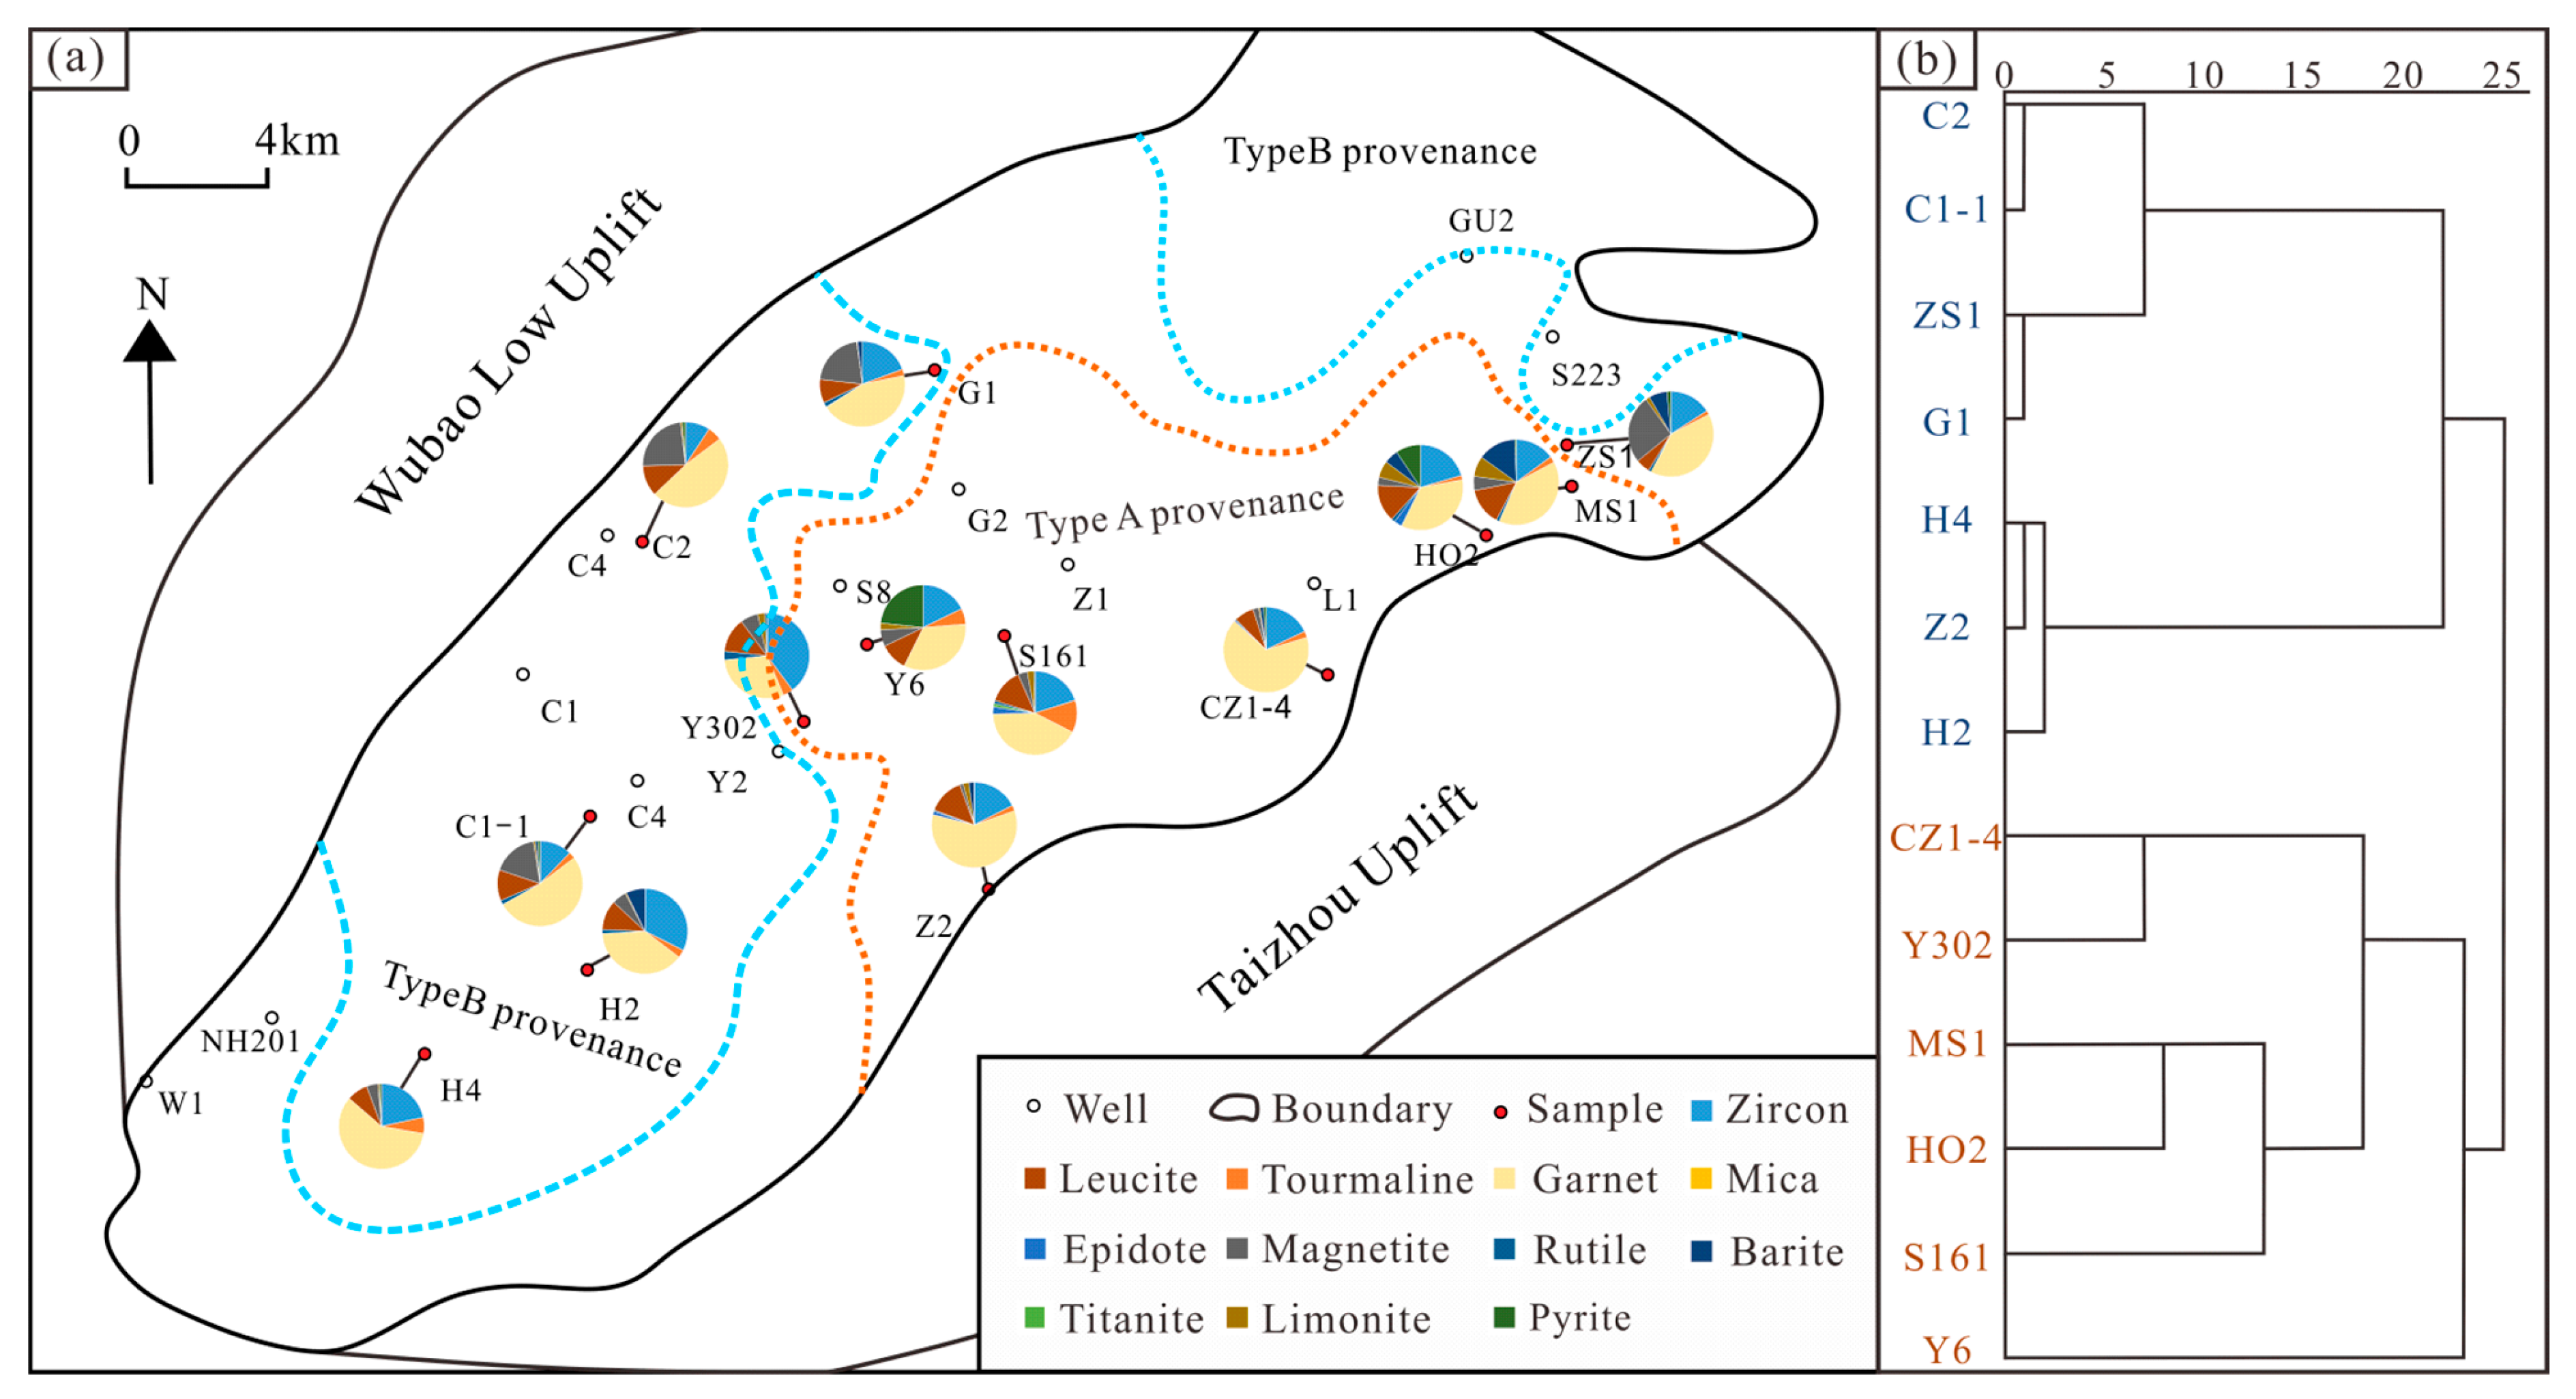
4.1.1. Features of Heavy Mineral Assemblages

The heavy minerals employed in the third Mbr of the Funing Fm samples included zircon, tourmaline, garnet, mica, epidote, titanite, rutile, leucoxene, magnetite, limonite, pyrite, ilmenite, barite, and pyrite (Table 1). Based on the compositions and relative abundances of heavy minerals in the Qintong Depression, the samples were divided into three categories, namely, main heavy minerals, minor heavy minerals, and possible heavy minerals. The main heavy minerals included zircon, garnet, leucoxene, and magnetite and accounted for approximately 83.4% of the average total heavy mineral content, with zircon content ranging from 1.7% to 80% (average = 20.0%), garnet ranging from 29.8% to 66.5% (average = 45.2%), leucoxene ranging from 7.4% to 14.1% (average = 11.1%), and magnetite ranging from 1.3% to 25.3% (average = 11.1%). The minor heavy minerals included tourmaline, rutile, limonite, barite, and pyrite, which were characterized by a relatively lower content with average percentages of less than 5%. Possible heavy minerals such as mica, epidote, and titanite were observed only in some wells. The collected samples indicated significant differences in the heavy mineral content in the different samples, and such differences were used to analyze the features of the heavy mineral suites and to subsequently identify provenances.

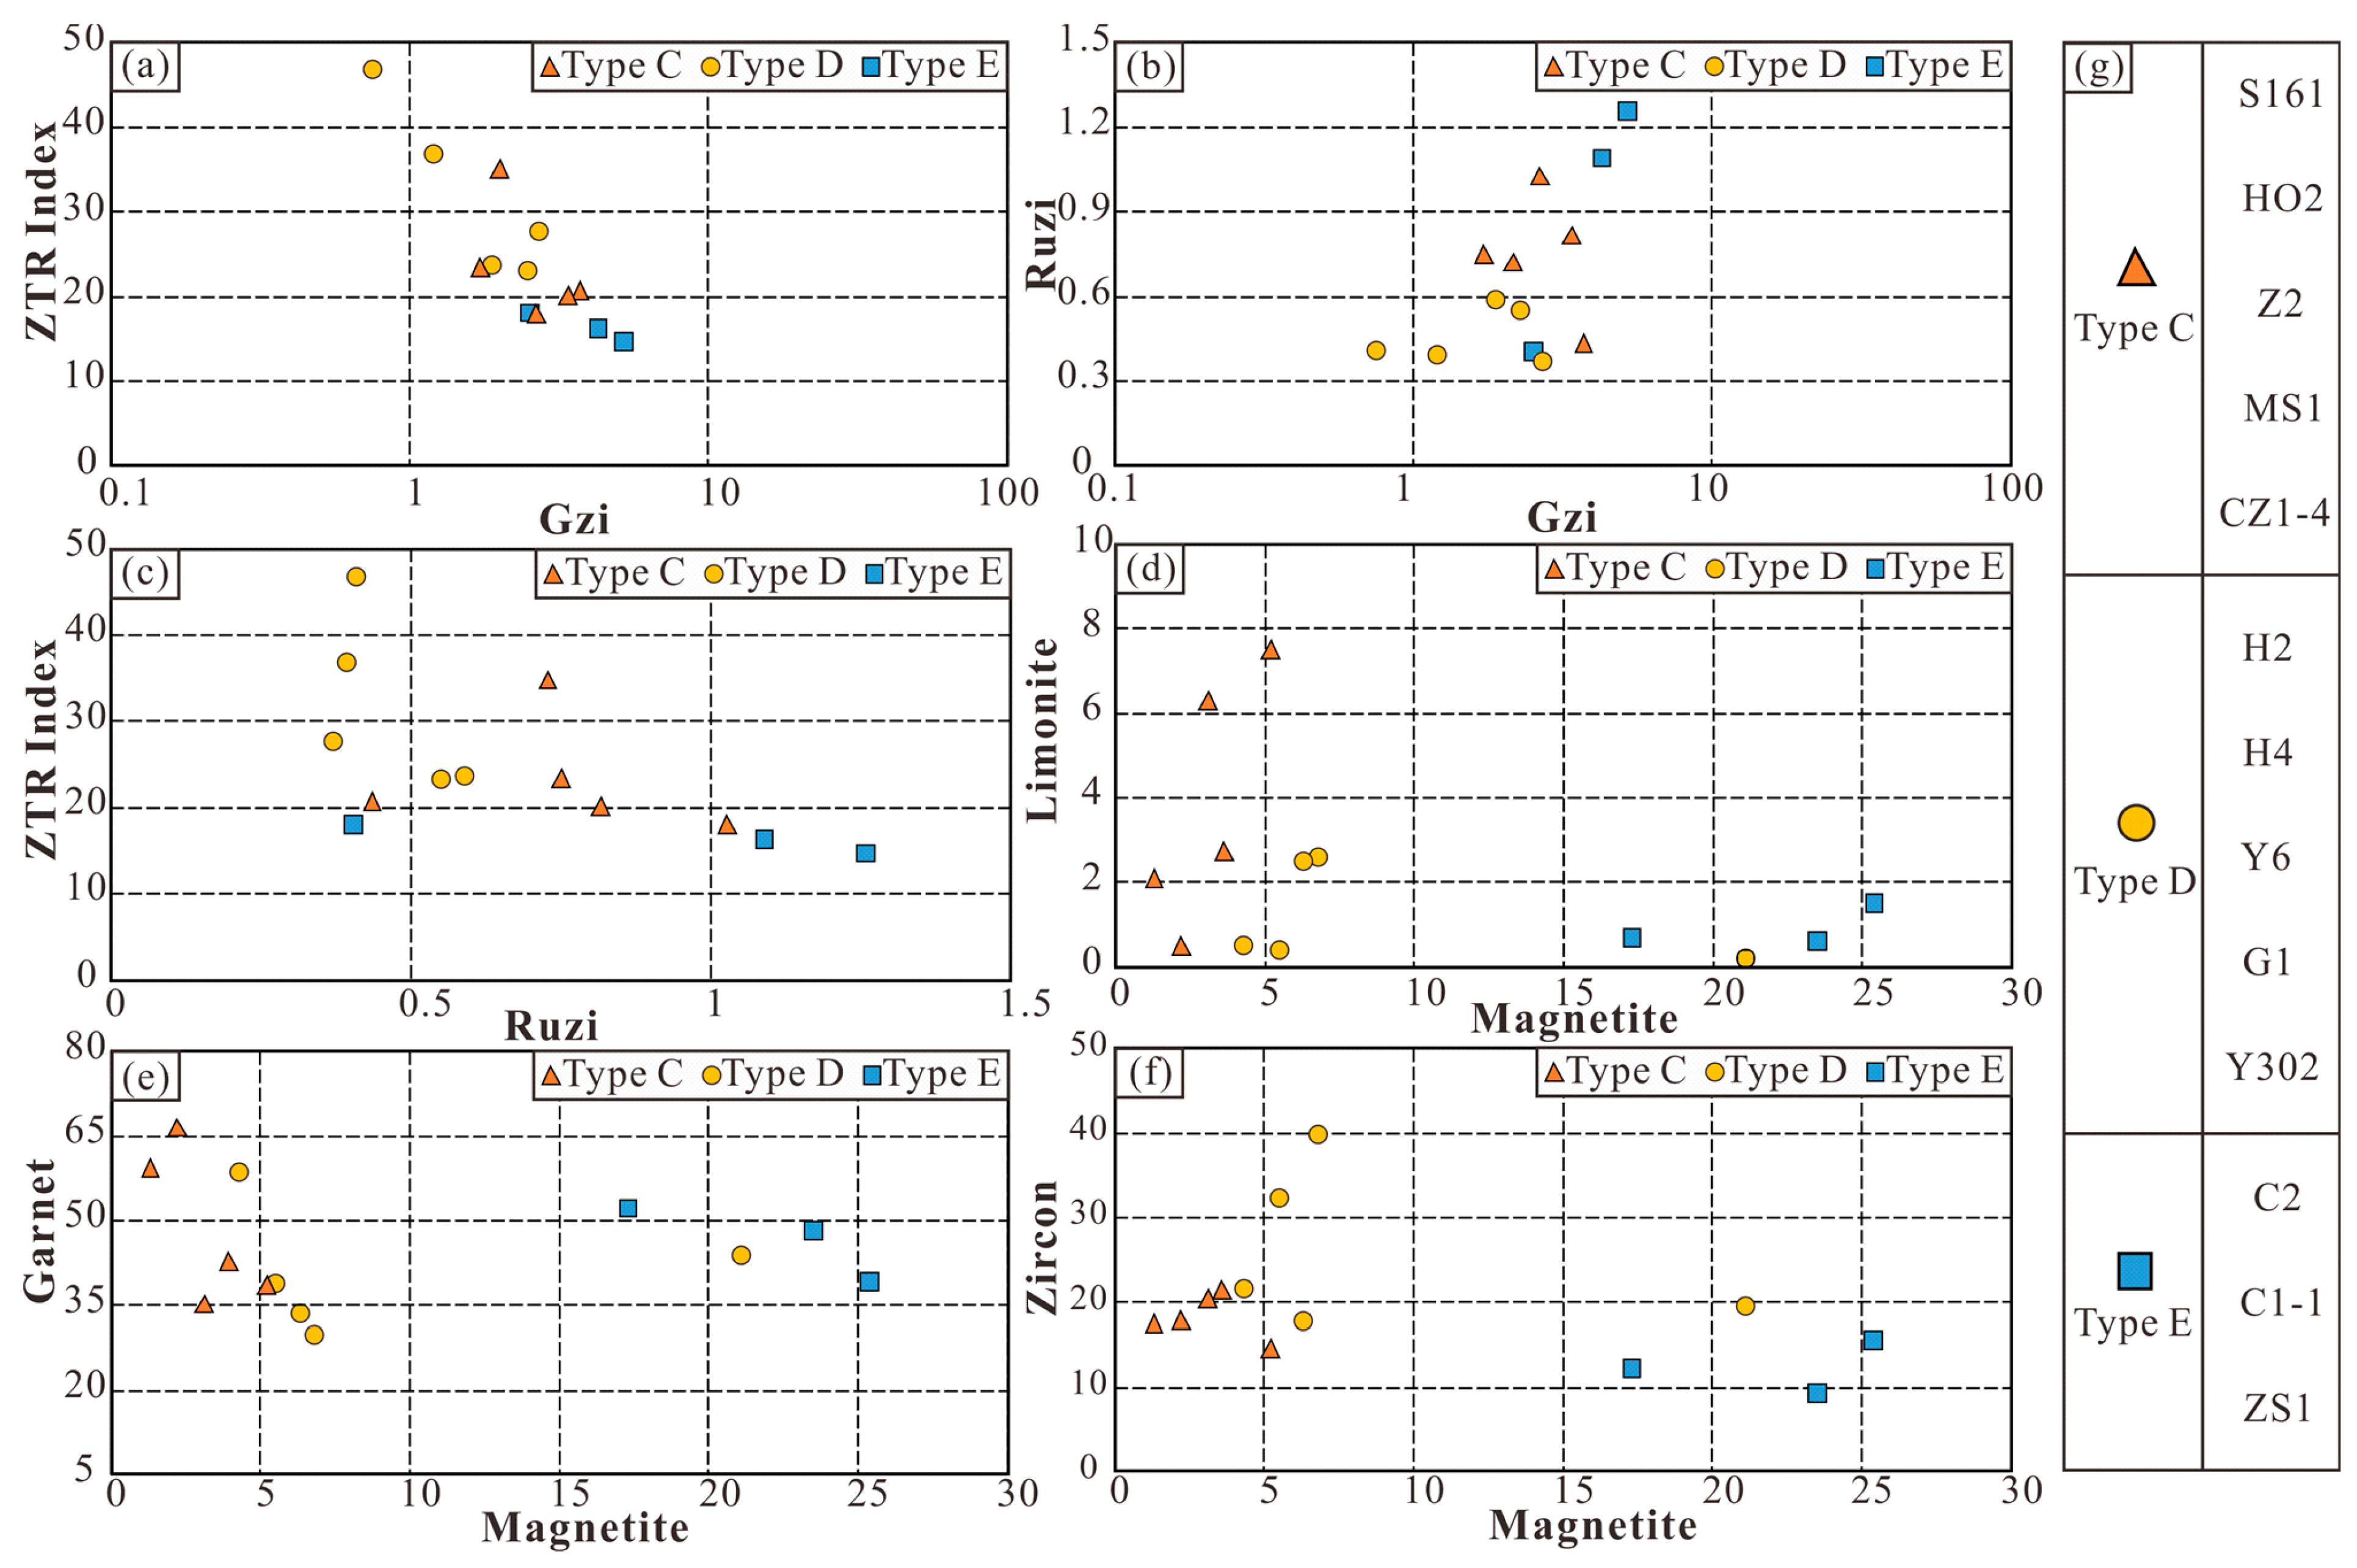
4.1.2. Provenance Identification Based on Heavy Mineral Compositions

Heavy mineral compositions of sandstone are majorly influenced by the inheritance of the source area and processes that occur during transport, deposition, and diagenesis, rendering the composition a satisfactory reflection of the source rock characteristics.
The investigation of the heavy mineral assemblages in this study suggested that the provenance locations could be categorized into two compositional types (A and B), which reflect compositionally distinct source regions (Figure 3a) with marked differences in their heavy mineral suites and contents. In terms of the relative mineral content, type A deposits were characterized by lower magnetite and garnet contents, averaging 4.6% and 41.2%, respectively, and higher limonite, pyrite, and leucoxene contents, averaging 3.6%, 5.8%, and 12.2%, respectively. In terms of mineral components, type A deposits contained epidote and sphene and did not contain mica, whereas type B deposits were characterized by higher magnetite and garnet contents, averaging 14.0% and 48.6%, respectively, with lower limonite, pyrite, and leucoxene contents, averaging 0.65%, 0.85%, and 10.2%, respectively. In terms of mineral components, type B deposits contained mica; however, no epidote or sphene was observed in these samples. Marginal differences were observed between type A and type B deposits with respect to their zircon and tourmaline contents. Additionally, cluster analysis, a statistical analysis technique that allows for the grouping of samples with similar properties, is often used in the analysis of the composition of mineral assemblages. In this study, the cluster analysis technique was used to analyze the heavy mineral assemblages of the samples. The cluster analysis indicated that the compositions of the heavy-mineral assemblages in the inferred two provenances of heavy minerals were statistically significant (Figure 3b). Sediment is mainly provided by the surrounding uplift or orogenic belt. The type A deposits were close in composition to the Taizhou Uplift in the eastern part of the Qintong Sag, thus suggesting that they originated from the Taizhou Uplift. Similarly, the type B deposits may have originated from the Wubao Low Uplift, as they were found adjacent to this uplift.

4.1.3. Provenance Identification Based on Relative Abundances of Heavy Minerals

The relative abundances of certain minerals, such as Gzi and Ruzi, are not considerably affected by processes occurring during transport, deposition, and diagenesis and are thus relatively immune to modification during the sedimentary cycle [54]. Therefore, these ratios are considered a reliable guide to sediment provenance. In this study, the Gzi, Ruzi, and ZTR indices and heavy minerals with marked abundance differences suggested that the heavy mineral samples from the Qintong Sag could be classified into three compositional types, i.e., C, D, and E (Figure 4a–g).
The type C samples were characterized by relatively medium Gzi, Ruzi, and ZTR indices, with average values of 2.71, 0.75, and 23.3, respectively. The type D samples were characterized by lower Gzi and Ruzi indices and higher ZTR indices, with average values of 1.76, 0.46, and 31.7, respectively. The type E samples were characterized by higher Gzi and Ruzi indices and lower ZTR indices, with average values of 3.94, 0.92, and 16.7, respectively. The relative heavy mineral abundances also differed (Figure 4d–f), with the type C samples being characterized by higher abundances of garnet and limonite and lower abundances of magnetite; the type D samples being characterized by medium abundances of garnet, limonite, and magnetite; and the type E samples being characterized by lower abundances of garnet and limonite and higher abundances of magnetite. These results suggest that the type D samples were characteristic of the integrated features of the type C and type E samples; this conclusion can also be confirmed by the spatial distribution of the different types of samples. The different sample types varied based on their location (Figure 5), with the type D samples observed in the central part of the Qintong Sag, showing a zonal distribution, the type C samples observed in the southeastern Qintong Sag, and the type E samples in the western and northern parts of the sag, showing a sheet distribution. The relative abundances and spatial distributions of the heavy minerals indicated that the type C and type E deposits may be from the Taizhou Uplift and Wubao Low Uplift, respectively, while the type D deposits were probably accumulated as part of a system of converging sediment derived from both east and west source regions.

4.2. Provenance Analysis Based on Sediment Transport Directions and Pathways

Sediment dispersal pathways are generally used to infer the journey from the source to the sink, with transferred sediments showing mineralogical and sedimentary structural differences that provide information from which the transfer direction and source regions can be identified. The ZTR index and sandstone petrologic maturity gradually increase with increasing sediment transport distance, indicating that the variation tendency in the ZTR index and sandstone petrologic maturity can be used to indicate the sediment transfer directions and provenance of the sediment. Furthermore, the response in relation to the sedimentary record that forms during sediment transport has indicative structural features on the seismic section. Progradational seismic reflections are parallel to the sediment transport direction, thus providing a distinct and direct method to elucidate sediment sources.

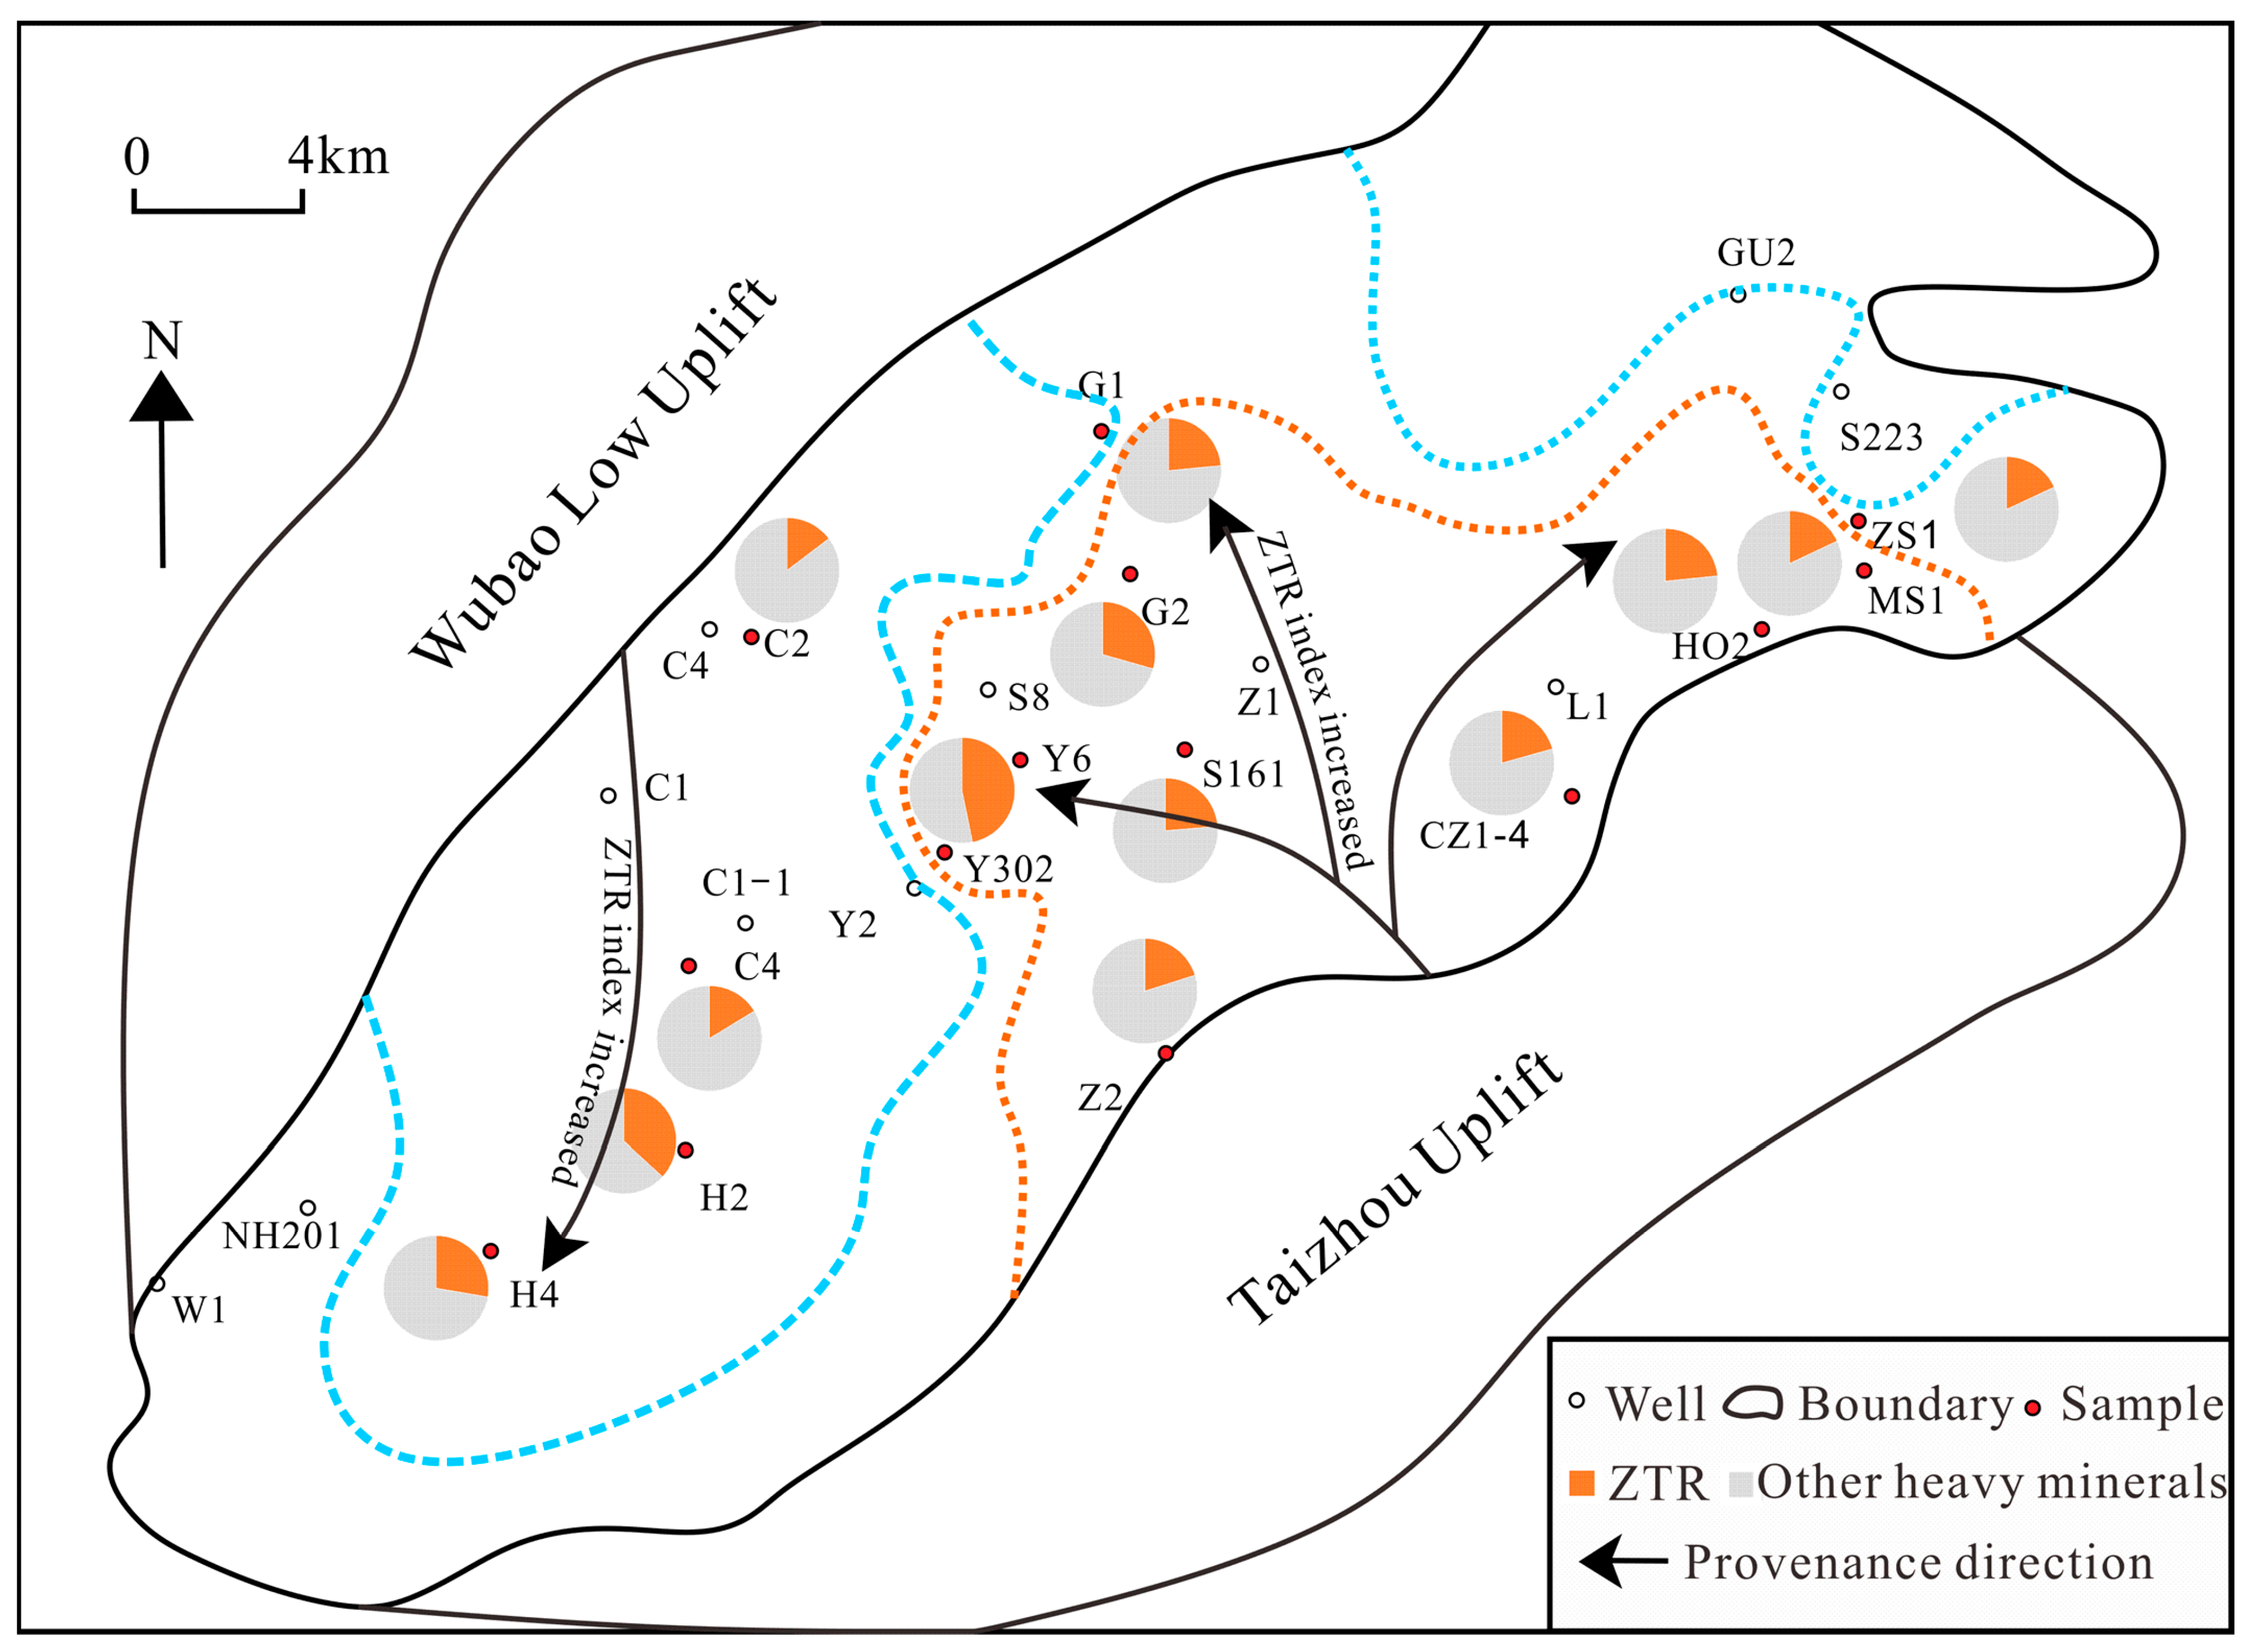
4.2.1. Sediment Transport Directions Based on ZTR Index

The spatial distribution of the ZTR index is presented in Figure 6. The trends show a gradual increase in the ZTR values of the third Mbr of the Funing Fm sandstone samples, from 18.0% to 45.8% for the Taizhou Uplift to the central and northeastern parts of the Qintong Sag and from 14.7% to 36.8% for the Wubao Low Uplift to the southern and southwestern parts of the Qintong Sag. Analysis of these trends suggests that the west sediments were transported from the Wubao Low Uplift to the southwestern part of the Qintong Sag and that the east sediments were transported from the Taizhou Uplift to the central and northeastern parts of the sag.

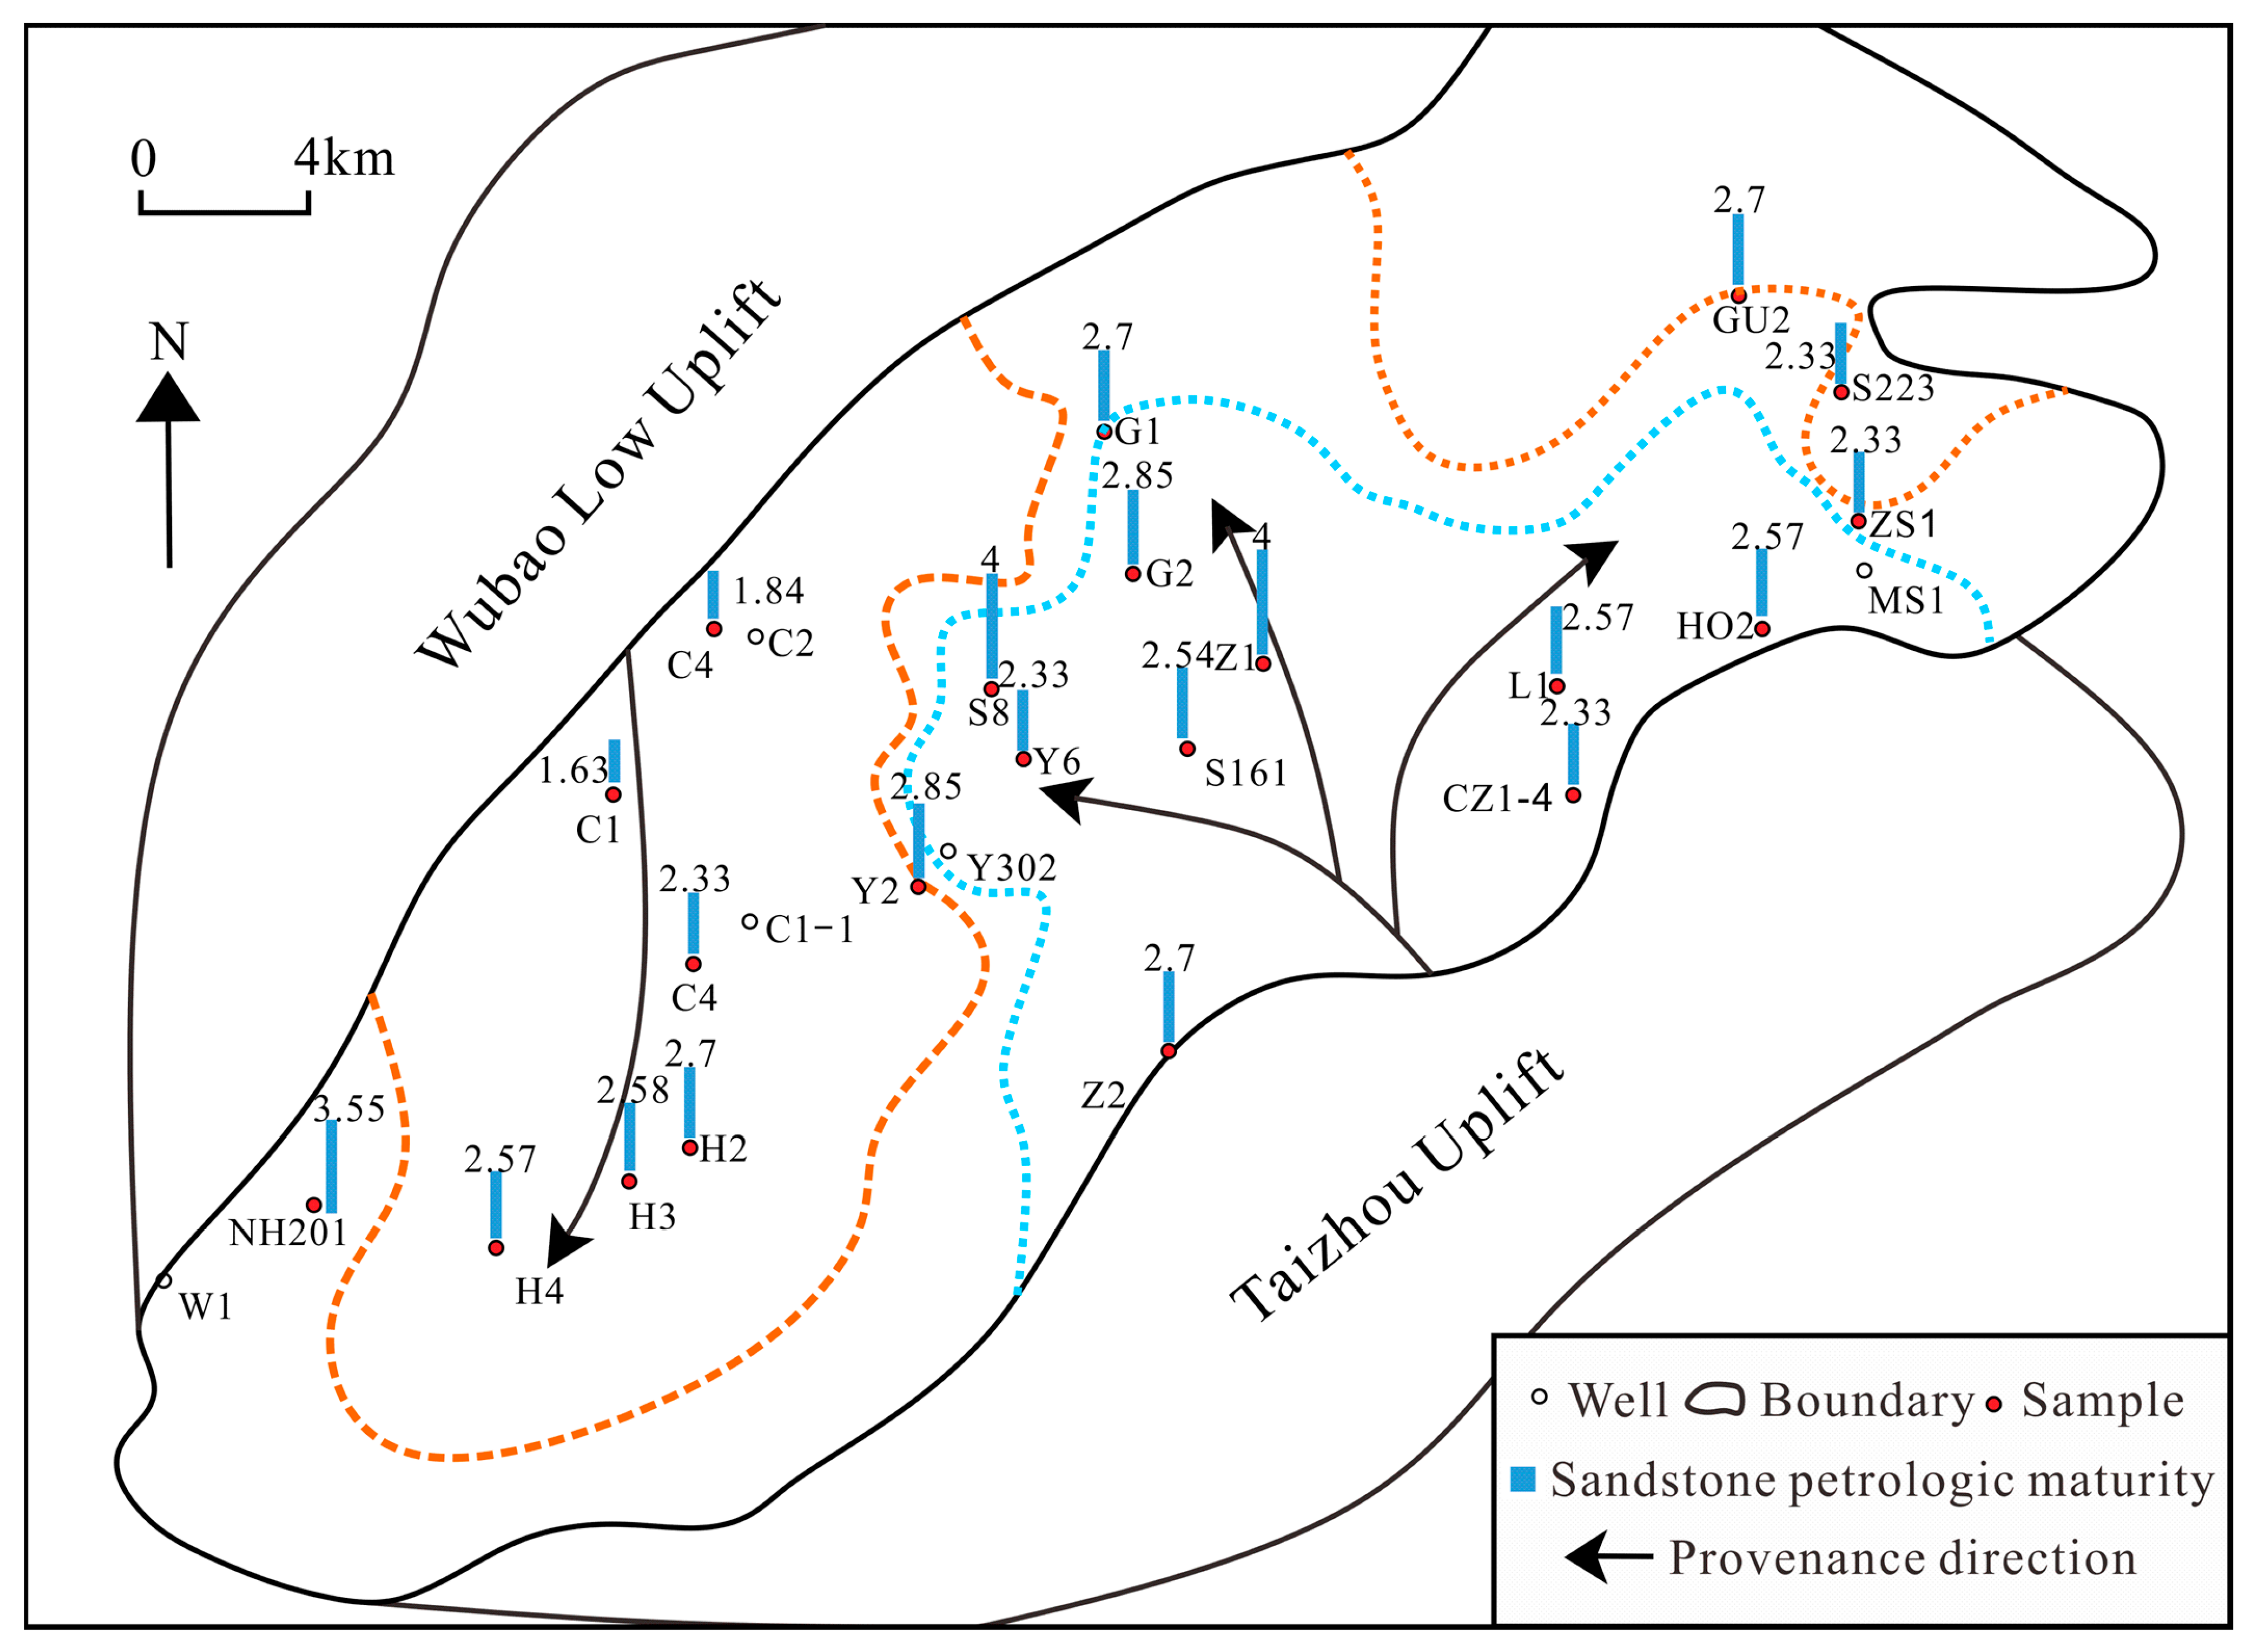
4.2.2. Sediment Transport Directions Based on Sandstone Petrologic Maturity

The different areas of the Qintong Sag showed different sandstone petrologic maturity levels, which ranged from 1.6% to 4% with an average of 2.7% (Figure 7); this difference in sandstone petrologic maturity can also be used to determine the sediment transport direction.
The sandstone petrologic maturity gradually increased from 2.33% in the Taizhou Uplift to 4% in the central part of the Qintong Sag; additionally, the sandstone petrologic maturity of the material increased from 1.63% to 3.55% for the Wubao Low Uplift to the southern and southwestern parts of the sag (Table 2). The trends of the sandstone petrologic maturity indicate that the sediments in the eastern, central, and northeastern parts of the sag originated in the Taizhou Uplift and were transported from the Taizhou Uplift to those regions, whereas the sediments in other regions originated in the Wubao Low Uplift.

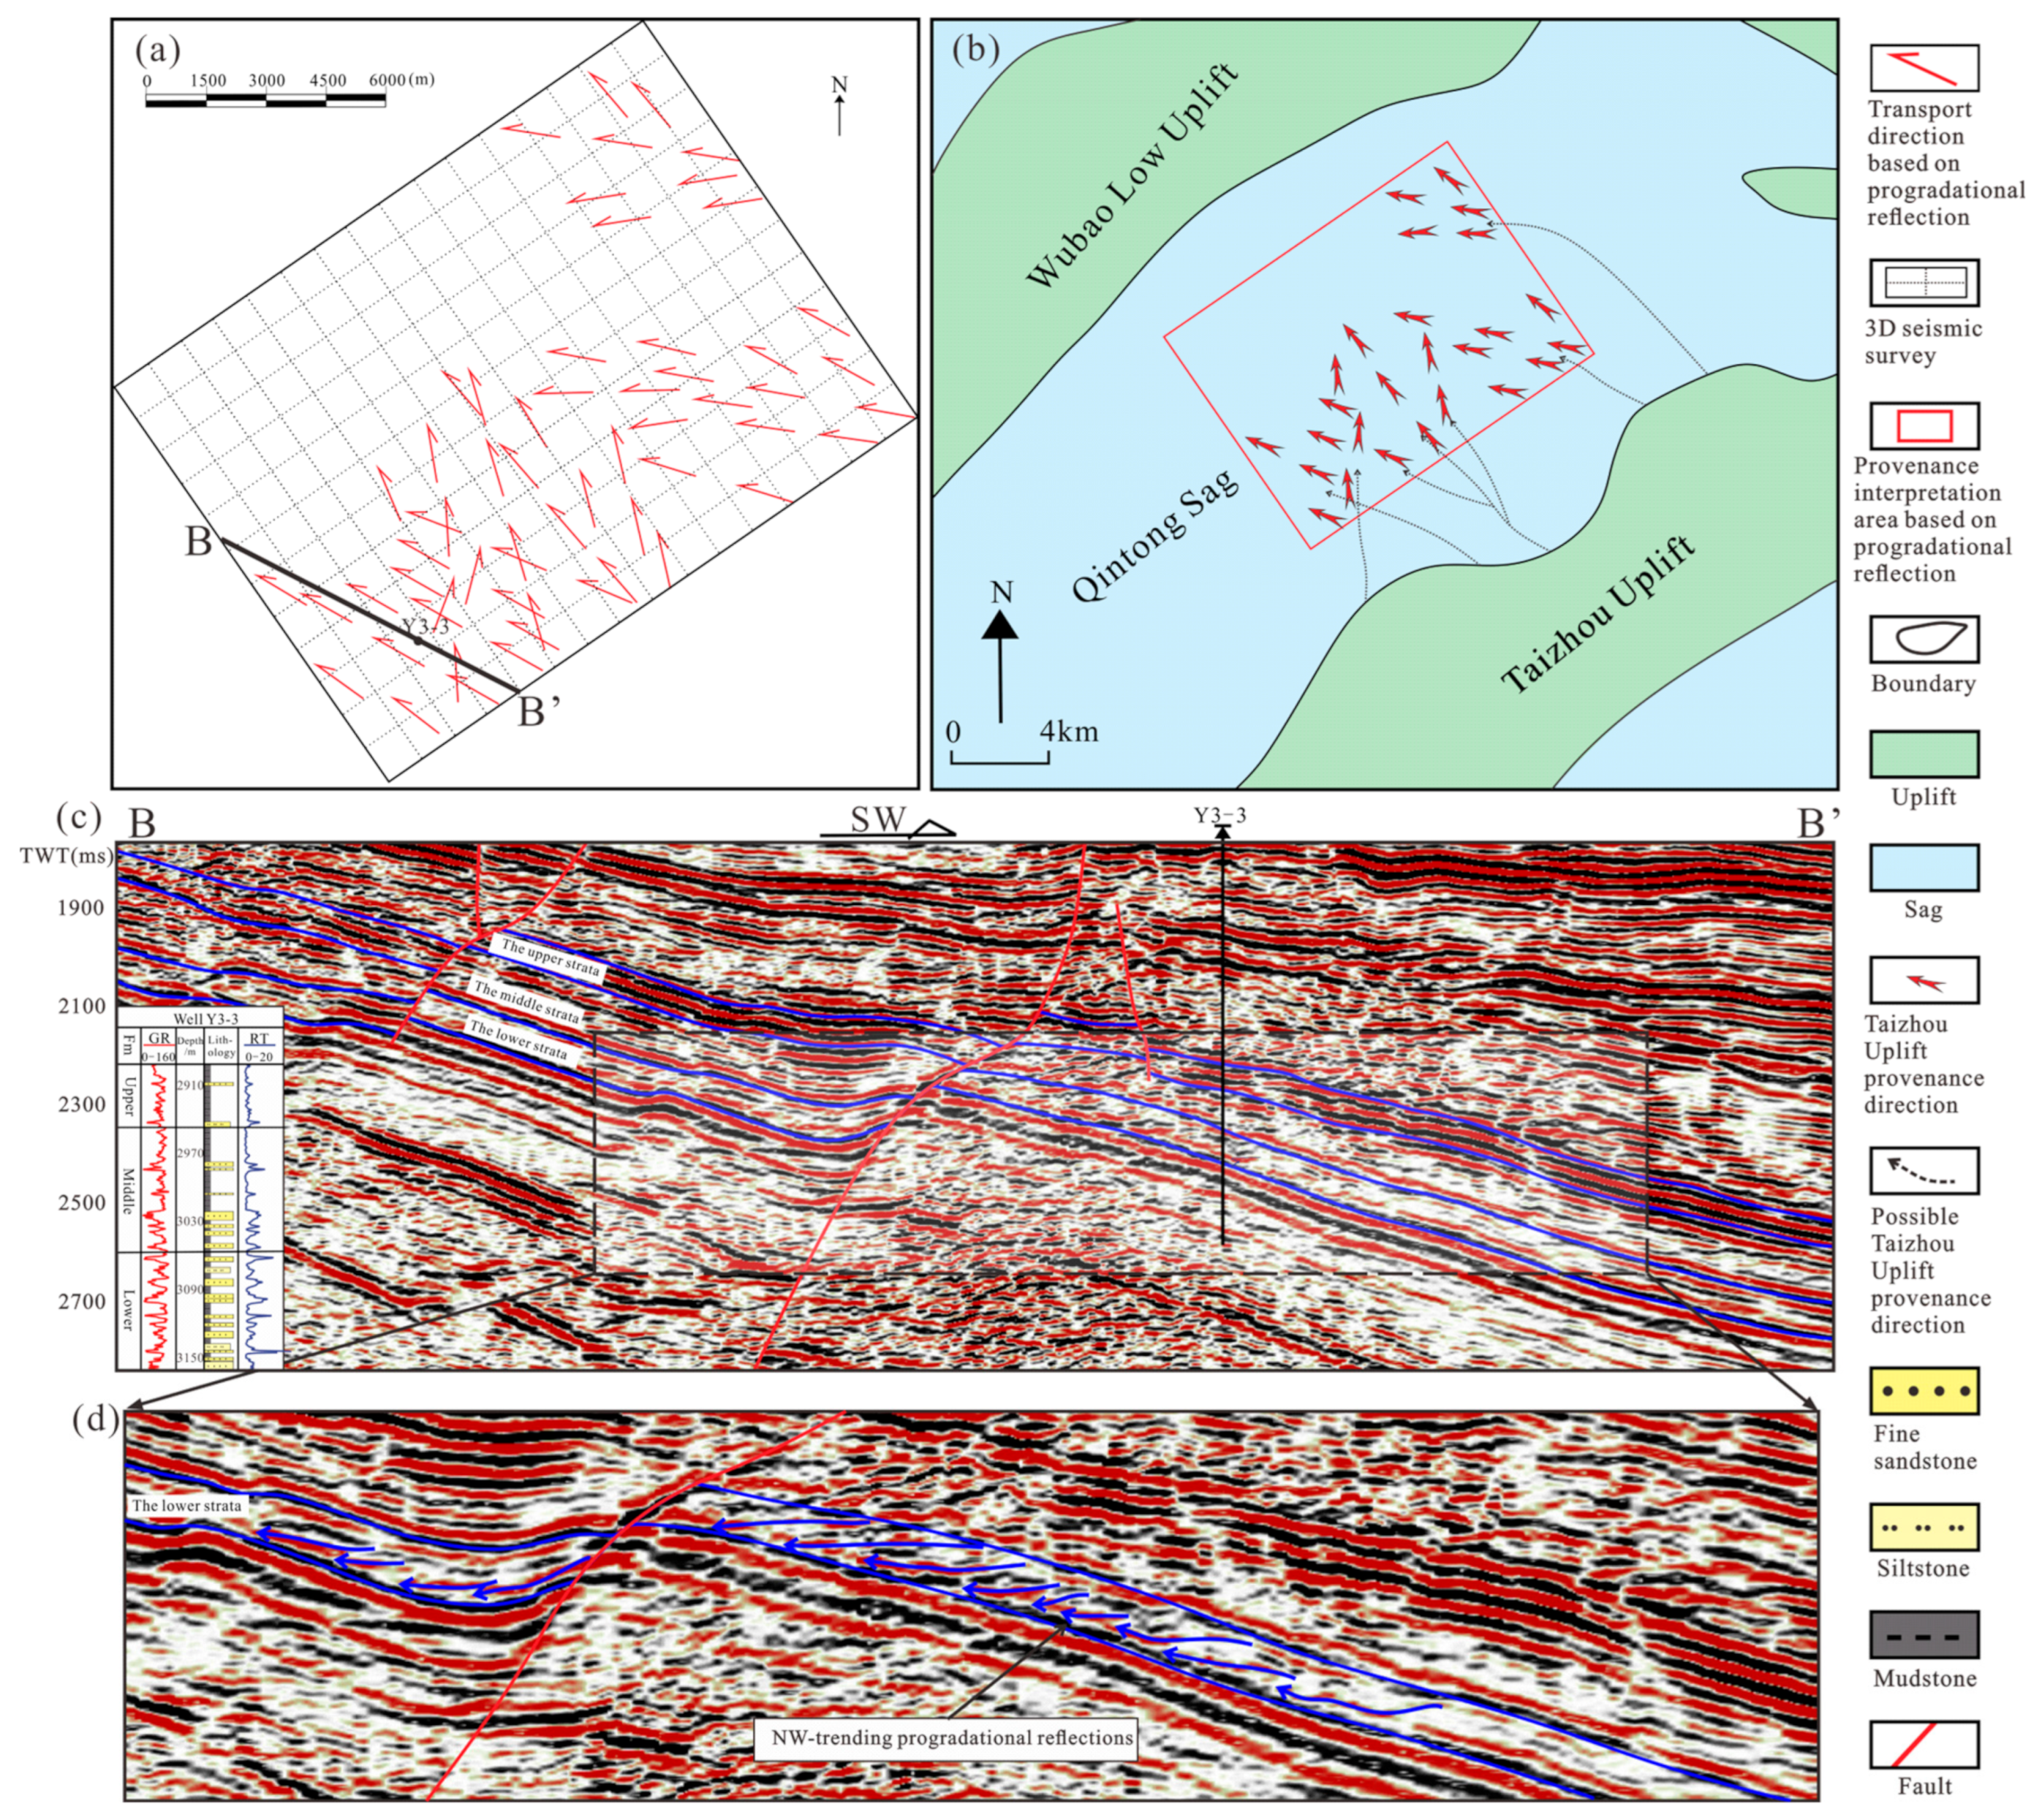
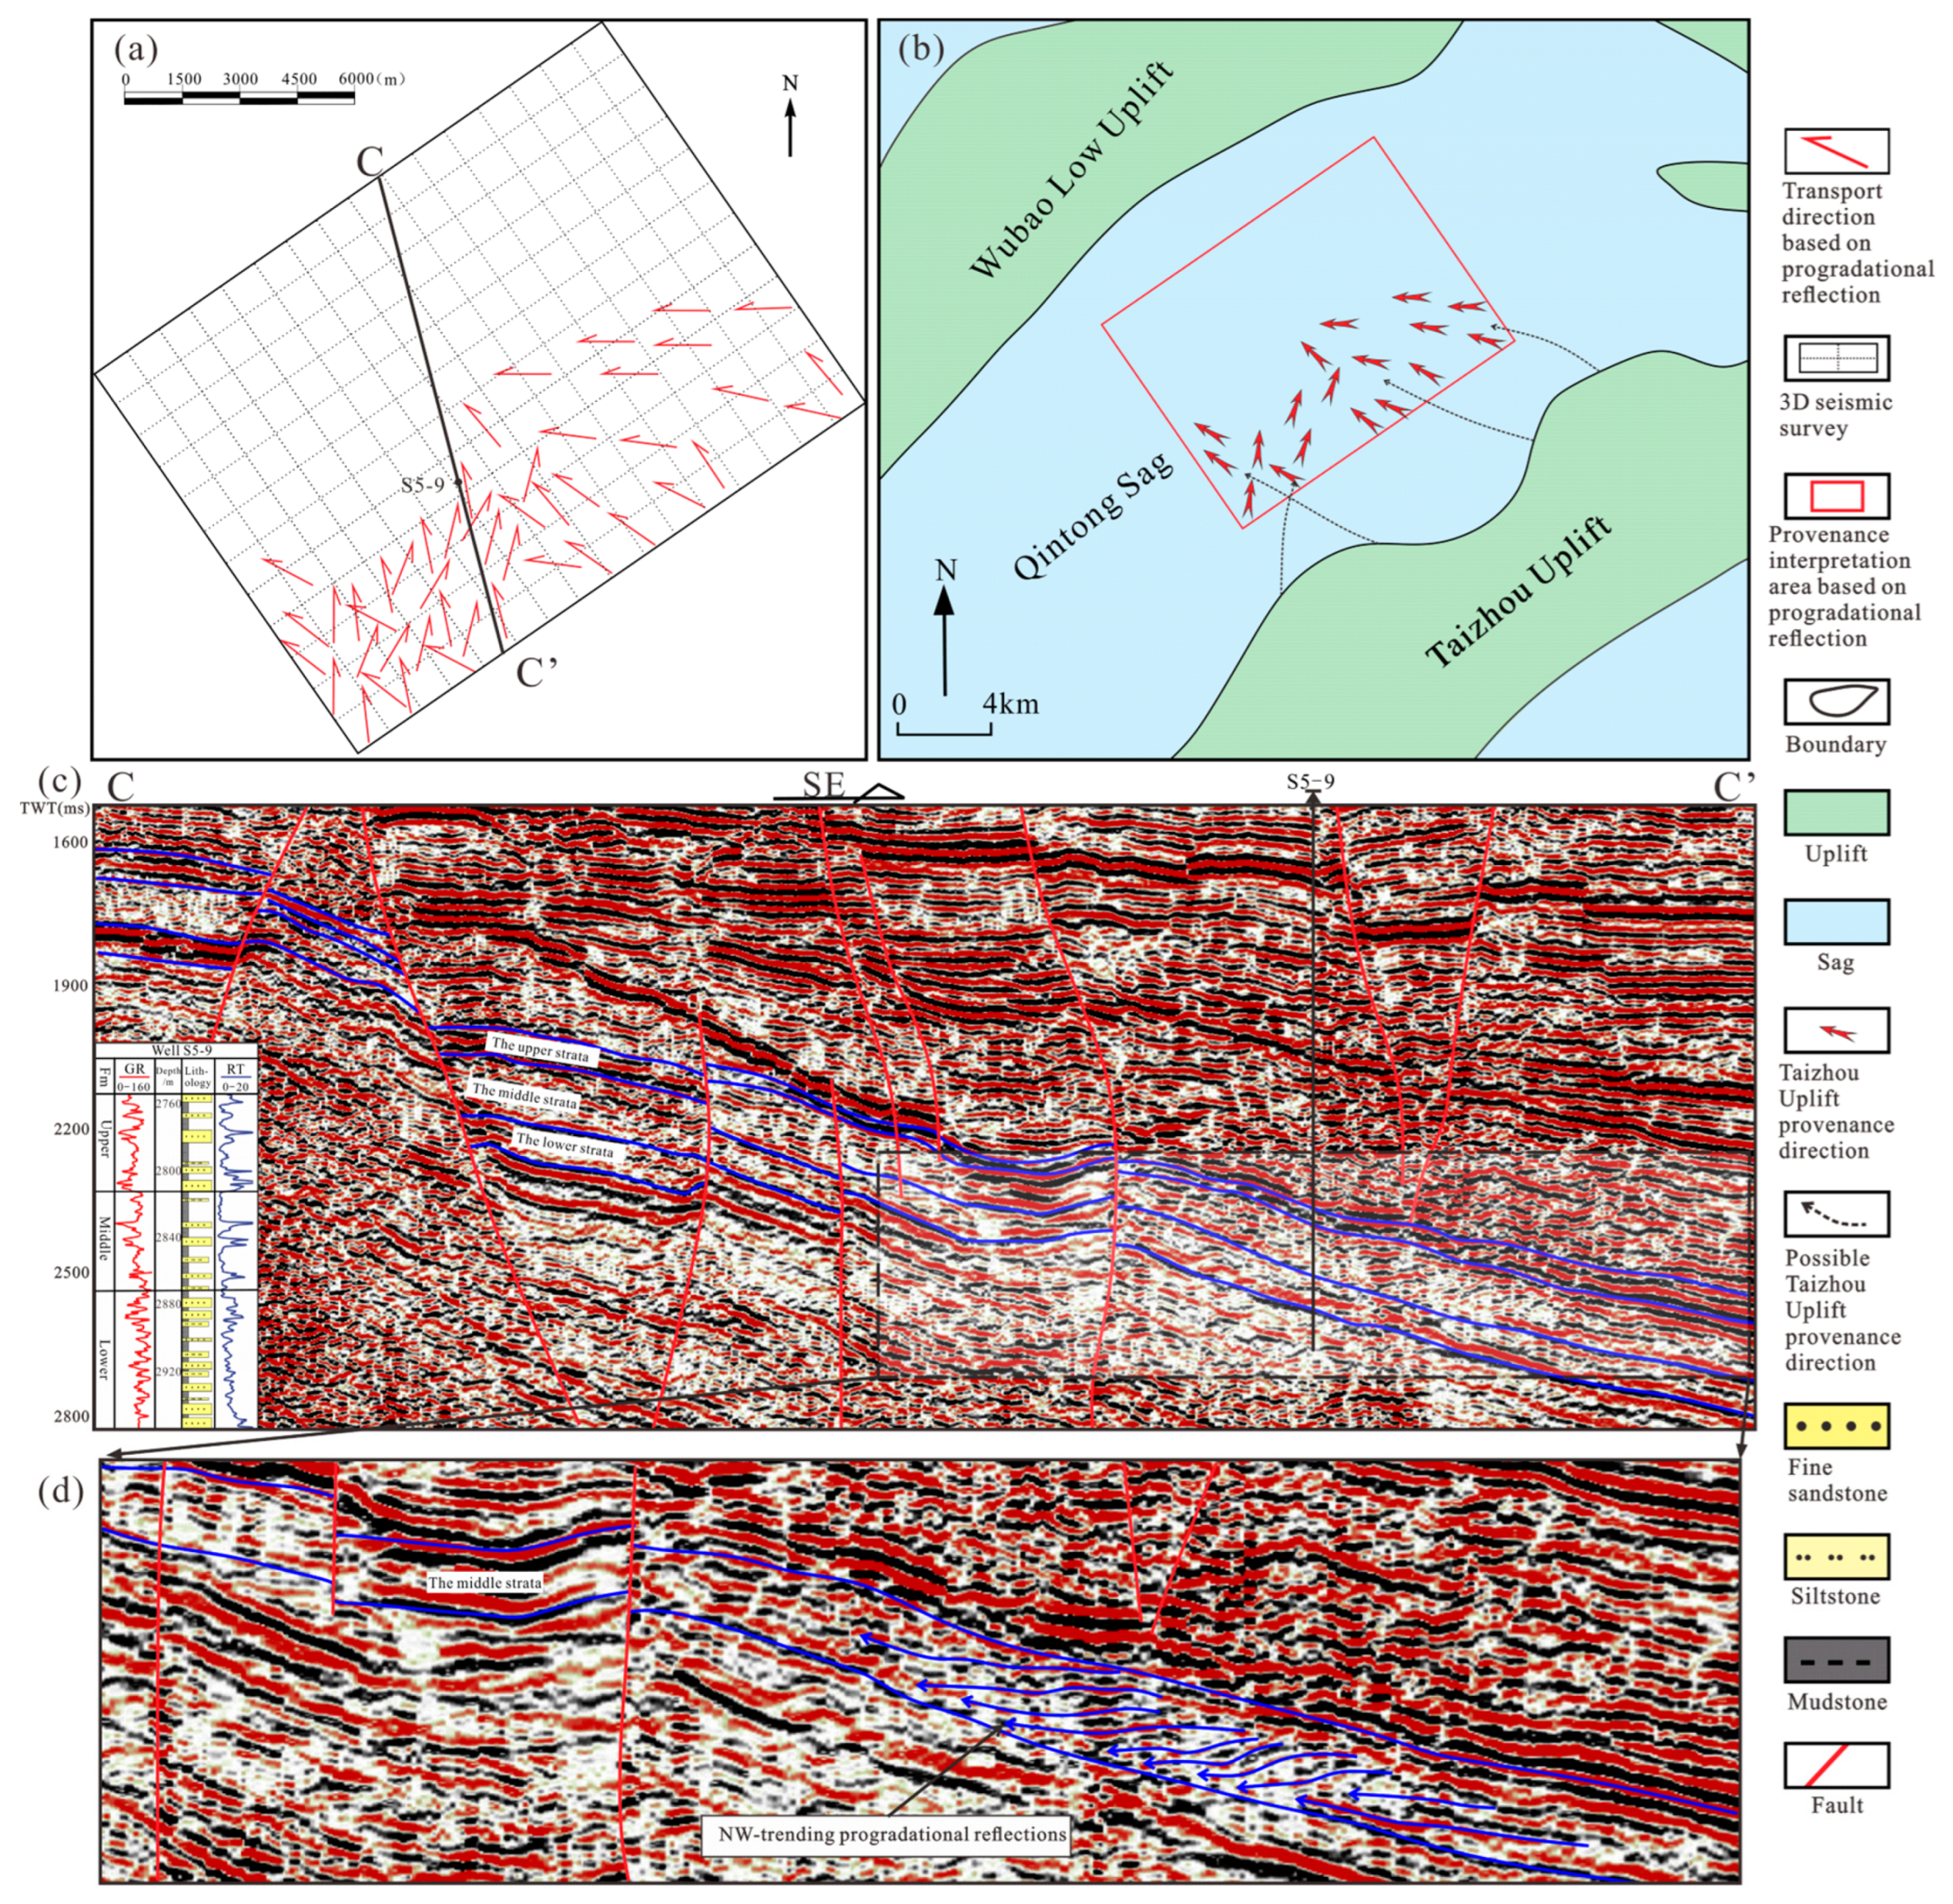
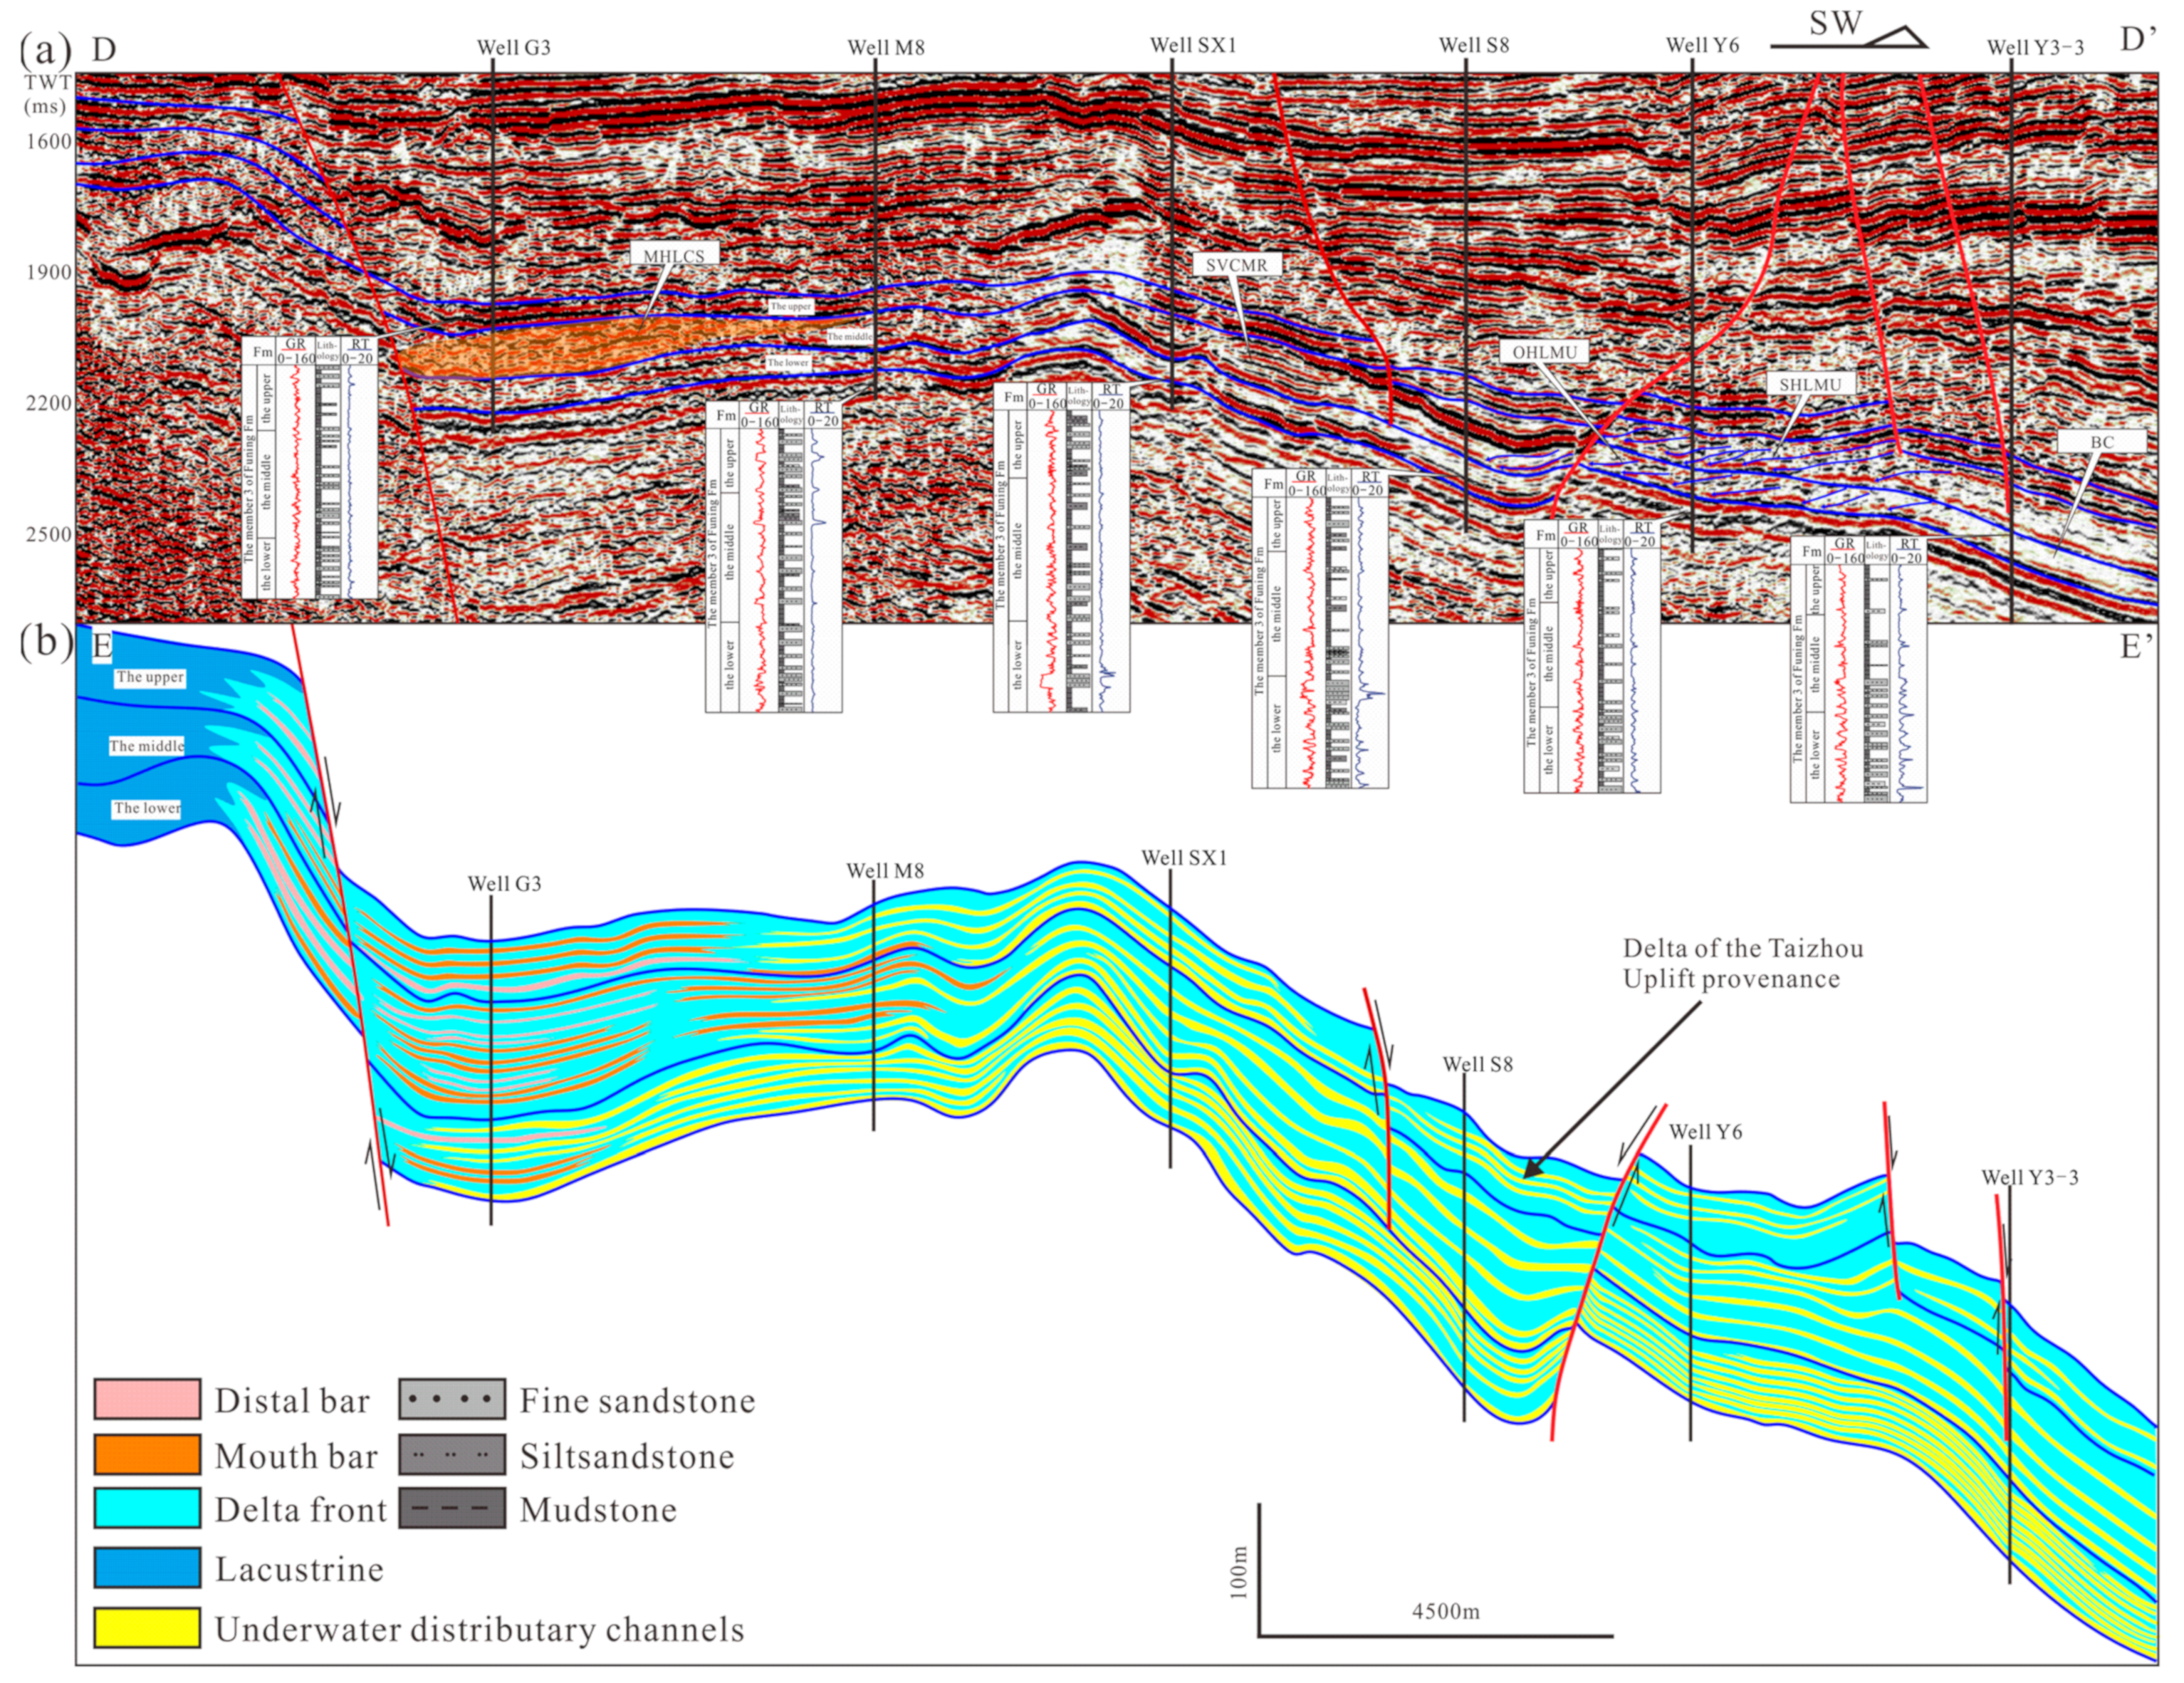
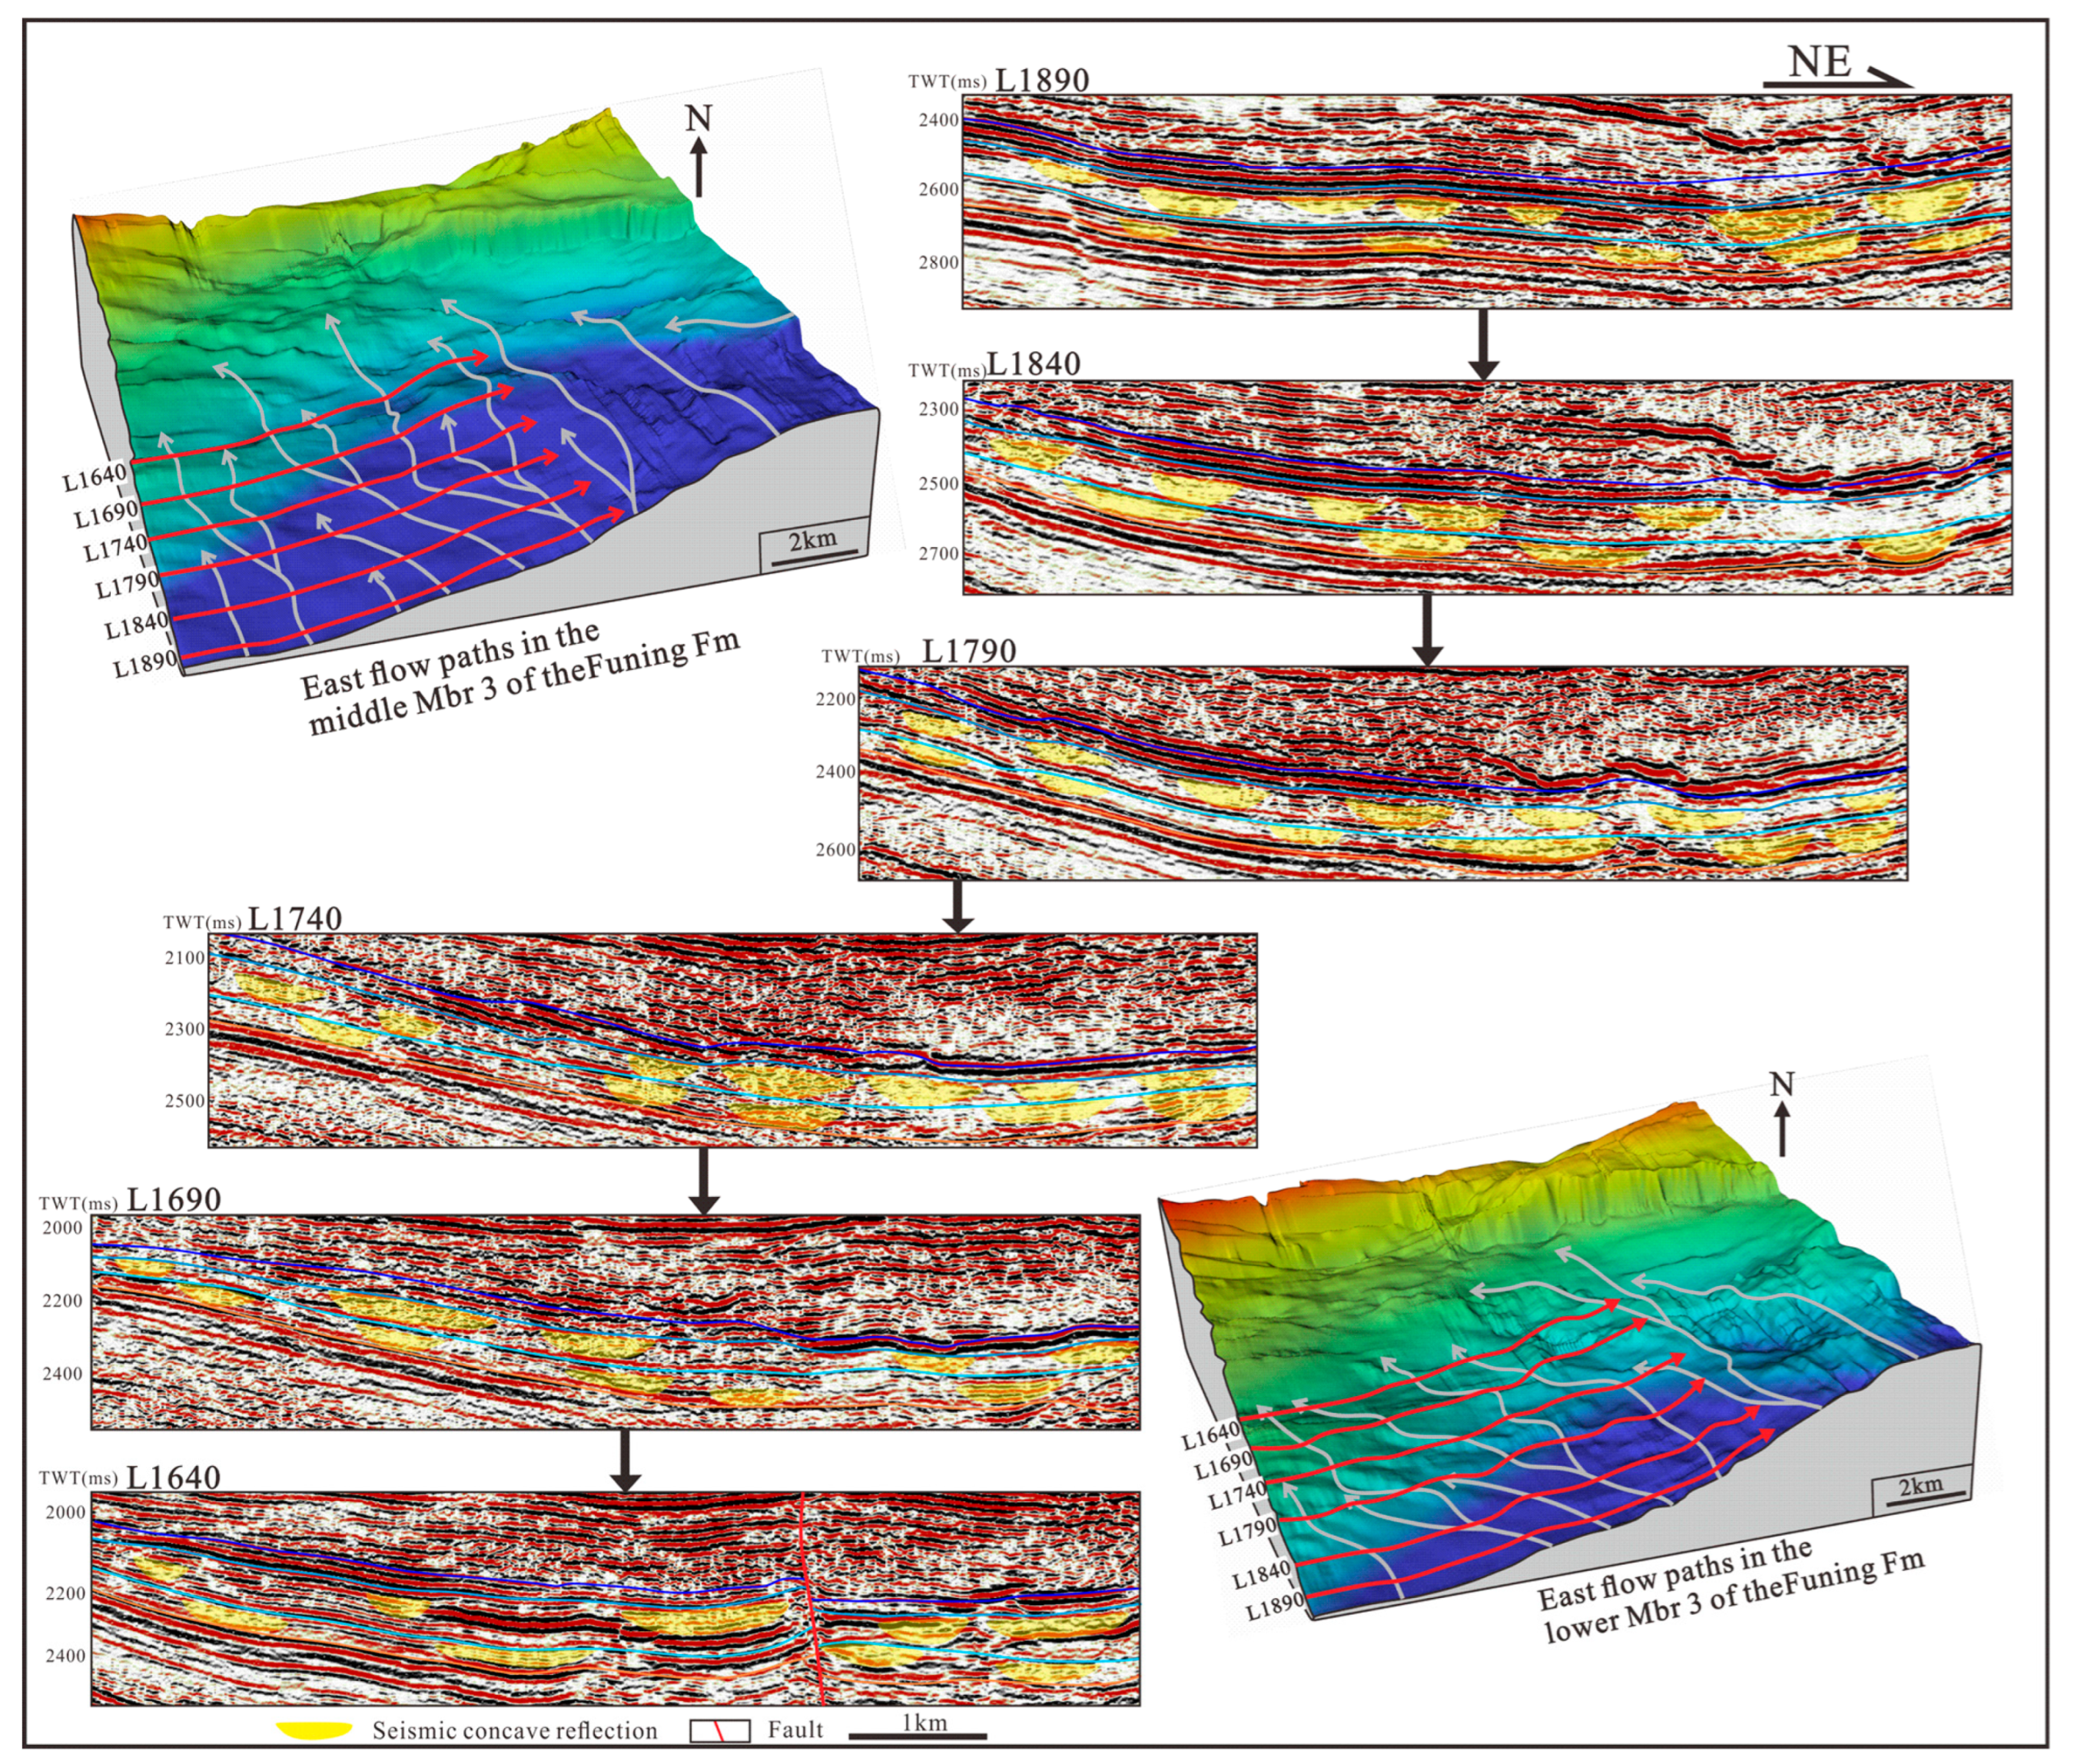
4.2.3. Sediment Transport Directions Based on Seismic Progradational Reflections

As an important indicator of the paleo-current direction, progradational seismic reflections provide evidence from which the sediment transport direction, sediment transport pathways, provenance locations, sedimentary geometry, spatial distribution of sedimentary facies, and reverse inference of the details of sedimentary evolution can be determined, which is particularly useful when there is a poor availability or lack of cores [64,65]. The structure and distribution of seismic reflections are dominantly controlled by the direction of sediment transport and hydrodynamic forces during sediment deposition and are less affected by diagenesis or sampling strategy.
The seismic interpretation in this study revealed identifiable progradational seismic reflections that developed mainly in the southeast, northeast, and east of the study area (Figure 8a and Figure 9a) and vertically in the middle and lower third member (Figure 8d and Figure 9d). Furthermore, the progradational seismic reflections show that the sediment was transported from the east to northwest, east to northeast, and east to west, and they directly reveal that large-scale sedimentary systems covered the east and central Qintong Sag. The sediment transport directions and pathways based on the progradational seismic reflections suggest that the sediment of the central sag was provided by the Taizhou Uplift.

4.2.4. Provenance Analysis Based on Sediment Transport Pathways

Sediment transport pathways are of great significance for the quantitative determination of sediment provenance. In the lacustrine depositional environment, sediment sources are mainly transported from the orogenic belt or around the uplifts to the lake by channel systems or alluvial fans, and sediments are mainly transported by (underwater) distributary channels in the Qintong Sag. The seismic facies of the (underwater) distributary channel was characterized by a concave external reflection form and an obvious boundary with the surrounding seismic reflections caused by a strong change in the hydrodynamic force between channels and interchannel regions. In the central part of the Qintong Sag, the obvious concave reflections were widely distributed in the middle and lower of the third Mbr of the Funing Fm, while the upper was mainly dominated by parallel reflections, and obvious concave reflections could not be observed. Based on the spatial distribution of the concave reflections and a set of seismic sections from east to west (Figure 10), we supposed that there were only east-flowing systems in the study area, as geometrically inferred based on the seismic interpretation, and the channel of east-flowing systems gradually bifurcated from southeast to northwest and disappeared in the central and western parts of the study area. These phenomena indicated that only the east-flowing systems deposited in the study area, and the sediments in the central part of the sag were controlled by the east Taizhou Uplift provenance.

5. Distribution Characteristics of Sedimentary Facies Controlled by Provenance

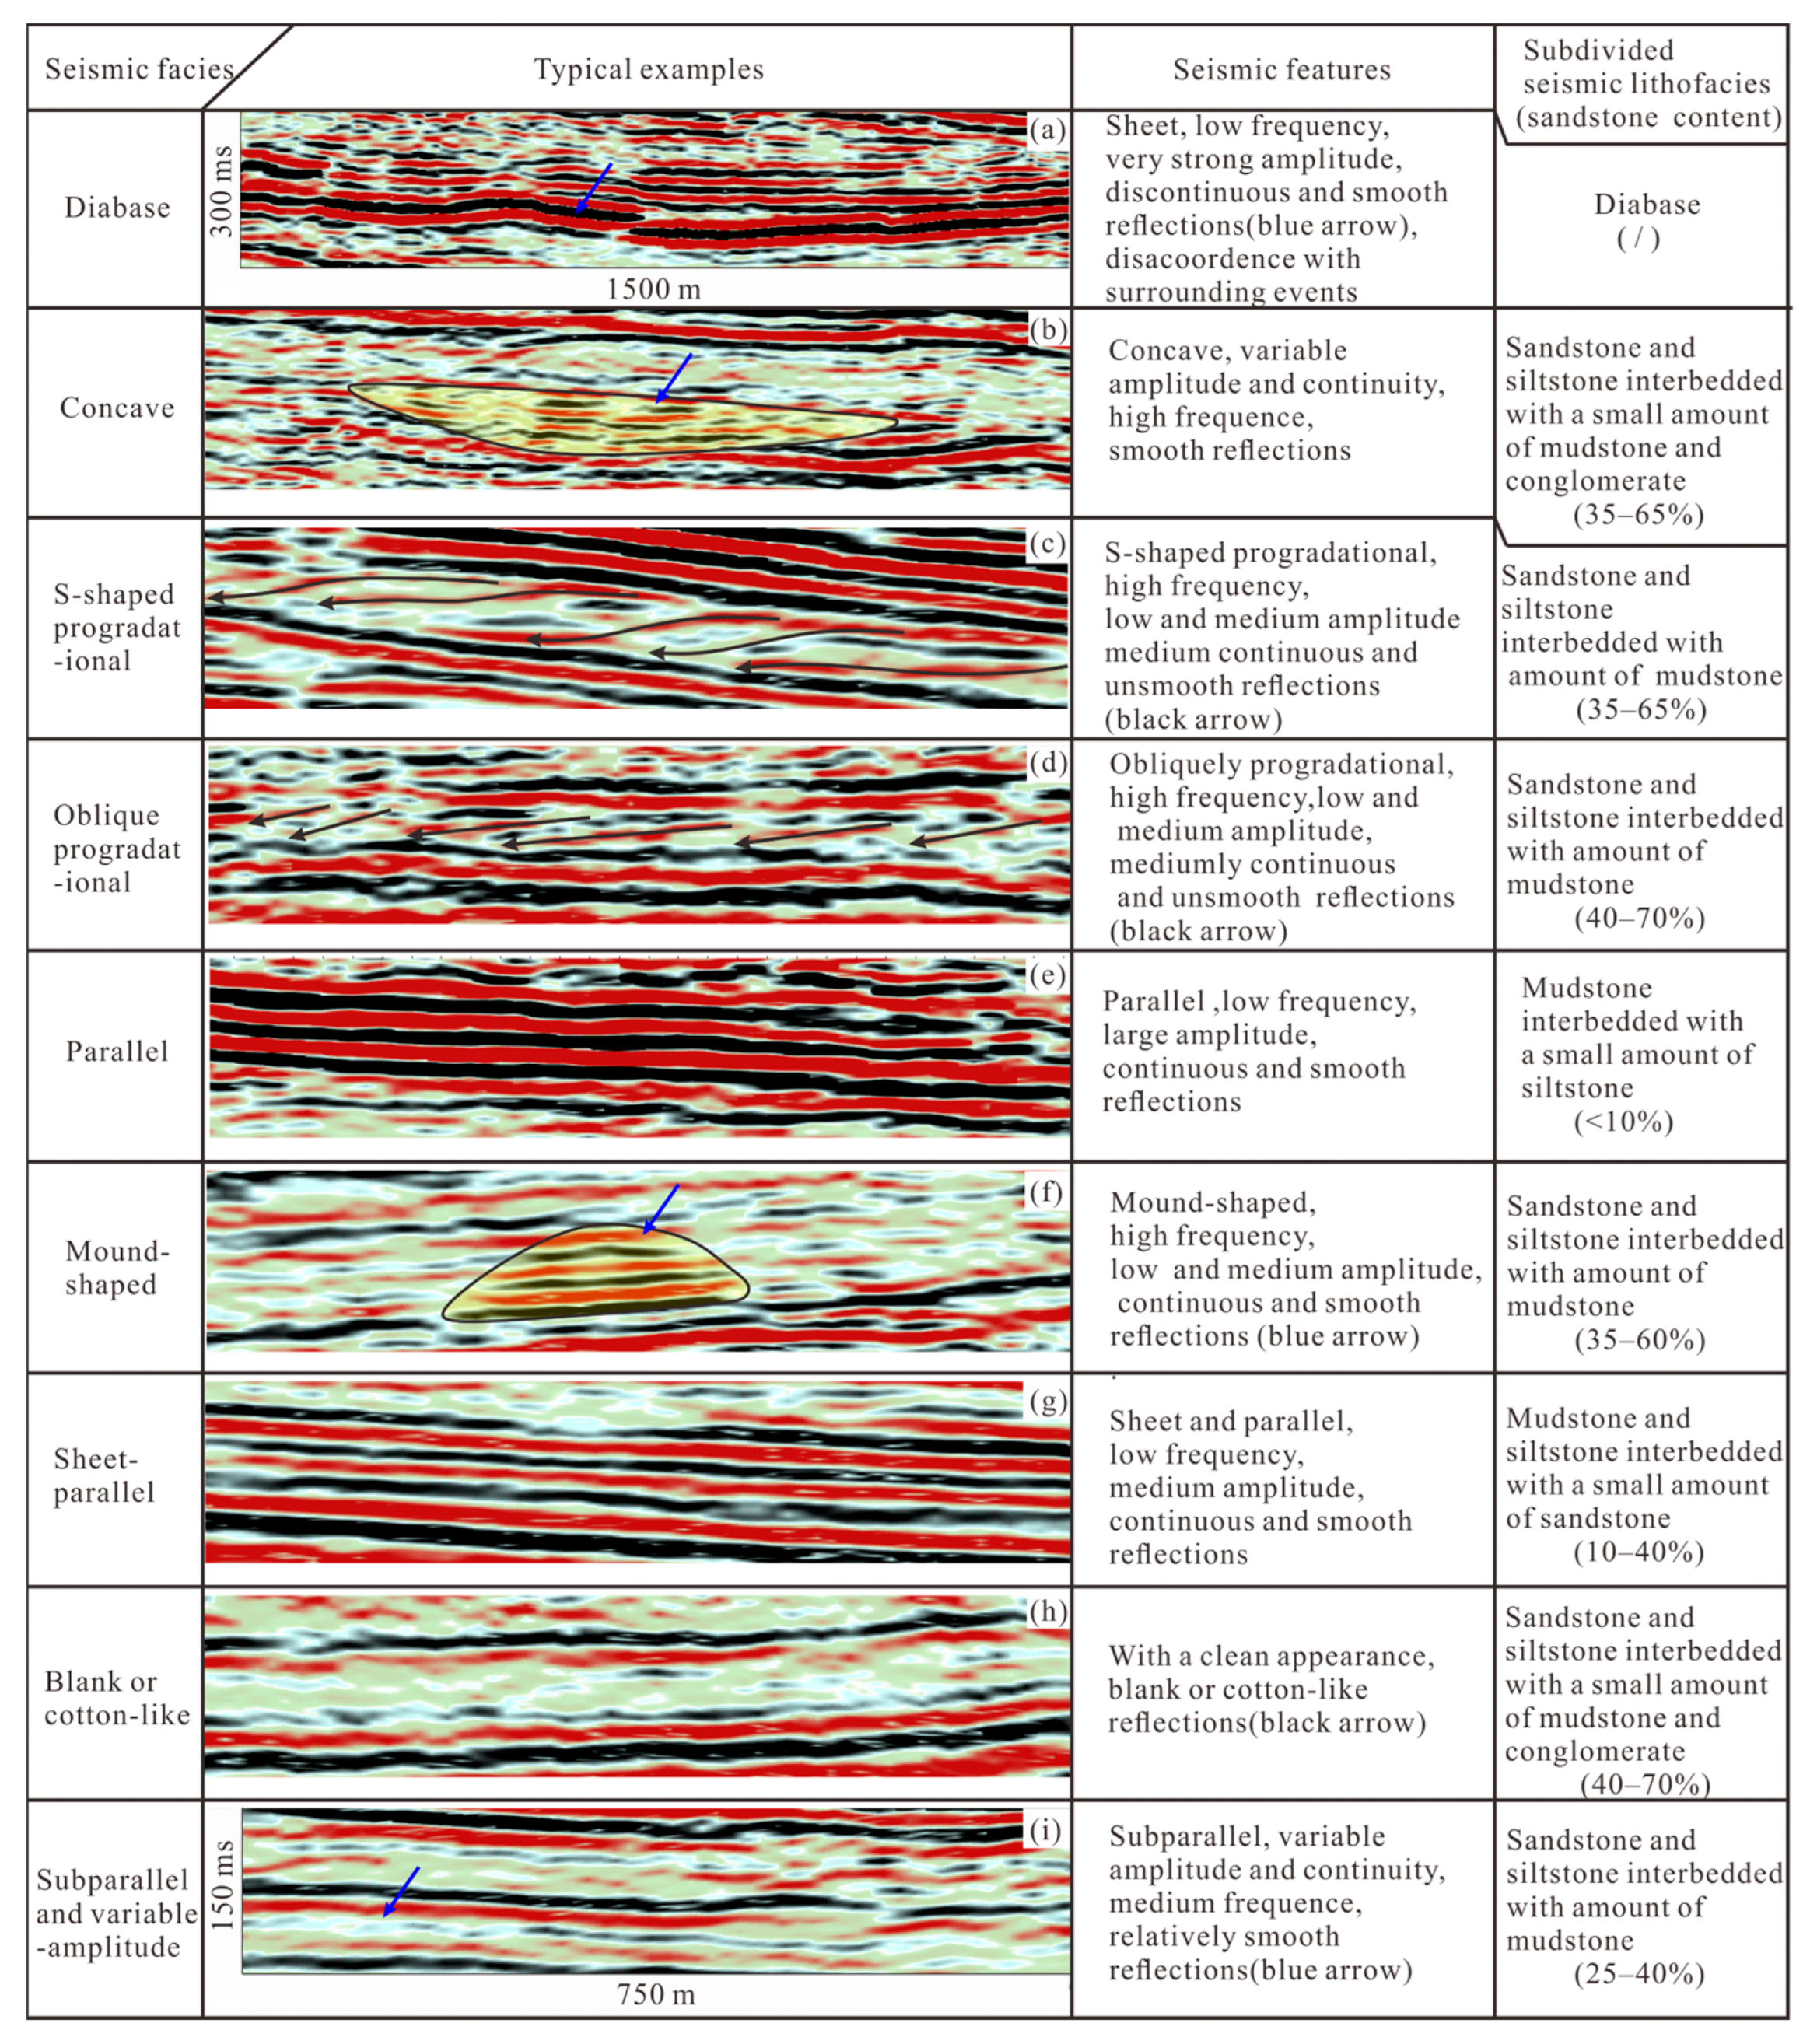
5.1. Interpretation of Seismic Facies and Lithofacies

Seismic attributes and seismic facies provide information about the hydrodynamic history, sedimentary structure, and rock type combinations, enabling researchers to infer provenance and reconstruct sedimentary systems [65]. In this study, the seismic facies were accurately divided into nine types based on eight parameters, namely, external reflection form, internal structure, dip direction, amplitude, frequency, continuity, external reflection smoothness and lithology (Figure 11), and these nine seismic facies types could well correspond to different sedimentary facies.
The seismic reflection amplitude is one of the most used attributes for interpreting lithology because it reflects the acoustic impedance at the interface, which depends on lithological differences [66,67,68]. The diabase seismic facies in this study were characterized by sheets, a very strong amplitude, a low frequency, were discontinuous, and had smooth reflections and they were discordant with the surrounding events (Figure 11a). The intrusion of the diabase can cause abnormal seismic amplitude attributes; therefore, the well samples that included a diabase were removed from the relationship study of the amplitude and sand thickness. The average instantaneous amplitude attribute exhibited a negative correlation with the sand body thickness in the study area (Figure 12a–c), with an weak average instantaneous amplitude being associated with relatively sand-rich areas and a strong average instantaneous amplitude corresponding to relatively mud-rich zones. Thus, the average instantaneous amplitude can effectively indicate the distribution of the sand body.

5.2. Sedimentary Facies Analysis Using Well Logs and Seismic Facies

The comprehensive analysis of logging cuttings, RT curve values, GR log curve signatures, and seismic facies showed that delta front and littoral-shallow lacustrine subfacies were deposited in the central part of the Qintong Sag (Figure 13) [24,69].

5.2.1. Delta Front Subfacies

Delta front deposits are characterized by dark gray and gray medium sandstone, fine sandstone, and siltstone and comprise underwater distributary channels, underwater distributary interchannels, the mouth bars of underwater distributary channels, sand sheets, and distal bar deposits.
The underwater distributary channels in this study were dominated by fine and medium sandstones, and the seismic facies of the underwater distributary channels were characterized by being concave with a variable amplitude and continuity and high-frequency and smooth reflections that exhibited strong erosion and channel filling under high-energy hydrodynamic conditions along the channel direction (Figure 11b). Moreover, the seismic facies display S-shaped or obliquely progradational, variable-amplitude and -continuity, high-frequency, low- and medium-amplitude, medium-continuous, and unsmooth reflections along the transverse channel direction (Figure 11c,d). The GR curve pattern showed a bell shape, a serrated-box shape, and a bell-box shape, suggesting multistage overlapping sand bodies with distributary channels, and the RT log signatures showed medium and high peak values and were similar to the GR log (Figure 13). The underwater distributary interchannel deposits mainly comprised thin-bedding siltstone and mudstone; furthermore, the seismic facies of the underwater distributary interchannels was characterized by parallel, low-frequency, large amplitude, continuous, and smooth reflections (Figure 11e). The GR curve exhibited a microserrated finger and irregular shape, and the RT curve showed low values (Figure 13). The mouth bars of the underwater distributary channels were dominated by siltstone, fine sandstone, and thin-bedding mudstone, and the seismic facies of the mouth bars was characterized by either mound-shaped, high-frequency, low- and medium-amplitude, continuous, and smooth (MHLCS) reflections (Figure 11f) or sheet and parallel, low-frequency, medium-amplitude, continuous, and smooth reflections in a small range (Figure 11g). Additionally, the GR curve pattern showed a funnel shape, and the RT curve showed relatively high values (Figure 13). The sand sheet deposits mainly comprised siltstone, fine sandstone, and interbedded mudstone, and the GR curve displayed a microserrated finger and funnel shape. Additionally, the seismic facies was characterized by blank or cotton-like reflections with a clean appearance (Figure 11h), that were subparallel, had a variable amplitude and continuity, a medium frequency, relatively smooth reflections (Figure 11i), and S-shaped and obliquely progradational reflections, and the RT values show relatively high values. The distal bar deposits mainly comprised siltstone, fine sandstone, and thin-bedding mudstone with sheet and parallel seismic facies. The GR curve displayed a mircroserrated funnel shape and finger shape, and the RT values showed relatively low responses.

5.2.2. Littoral-Shallow Lacustrine Subfacies

The littoral-shallow lacustrine deposits mainly comprised mudstone and siltstone with parallel seismic facies (Figure 11e). Additionally, the GR curve exhibited a flat and serrated shape, and the RT values showed low responses (Figure 13).

5.3. Provenance Analysis Based on Seismic Facies and Lithofacies

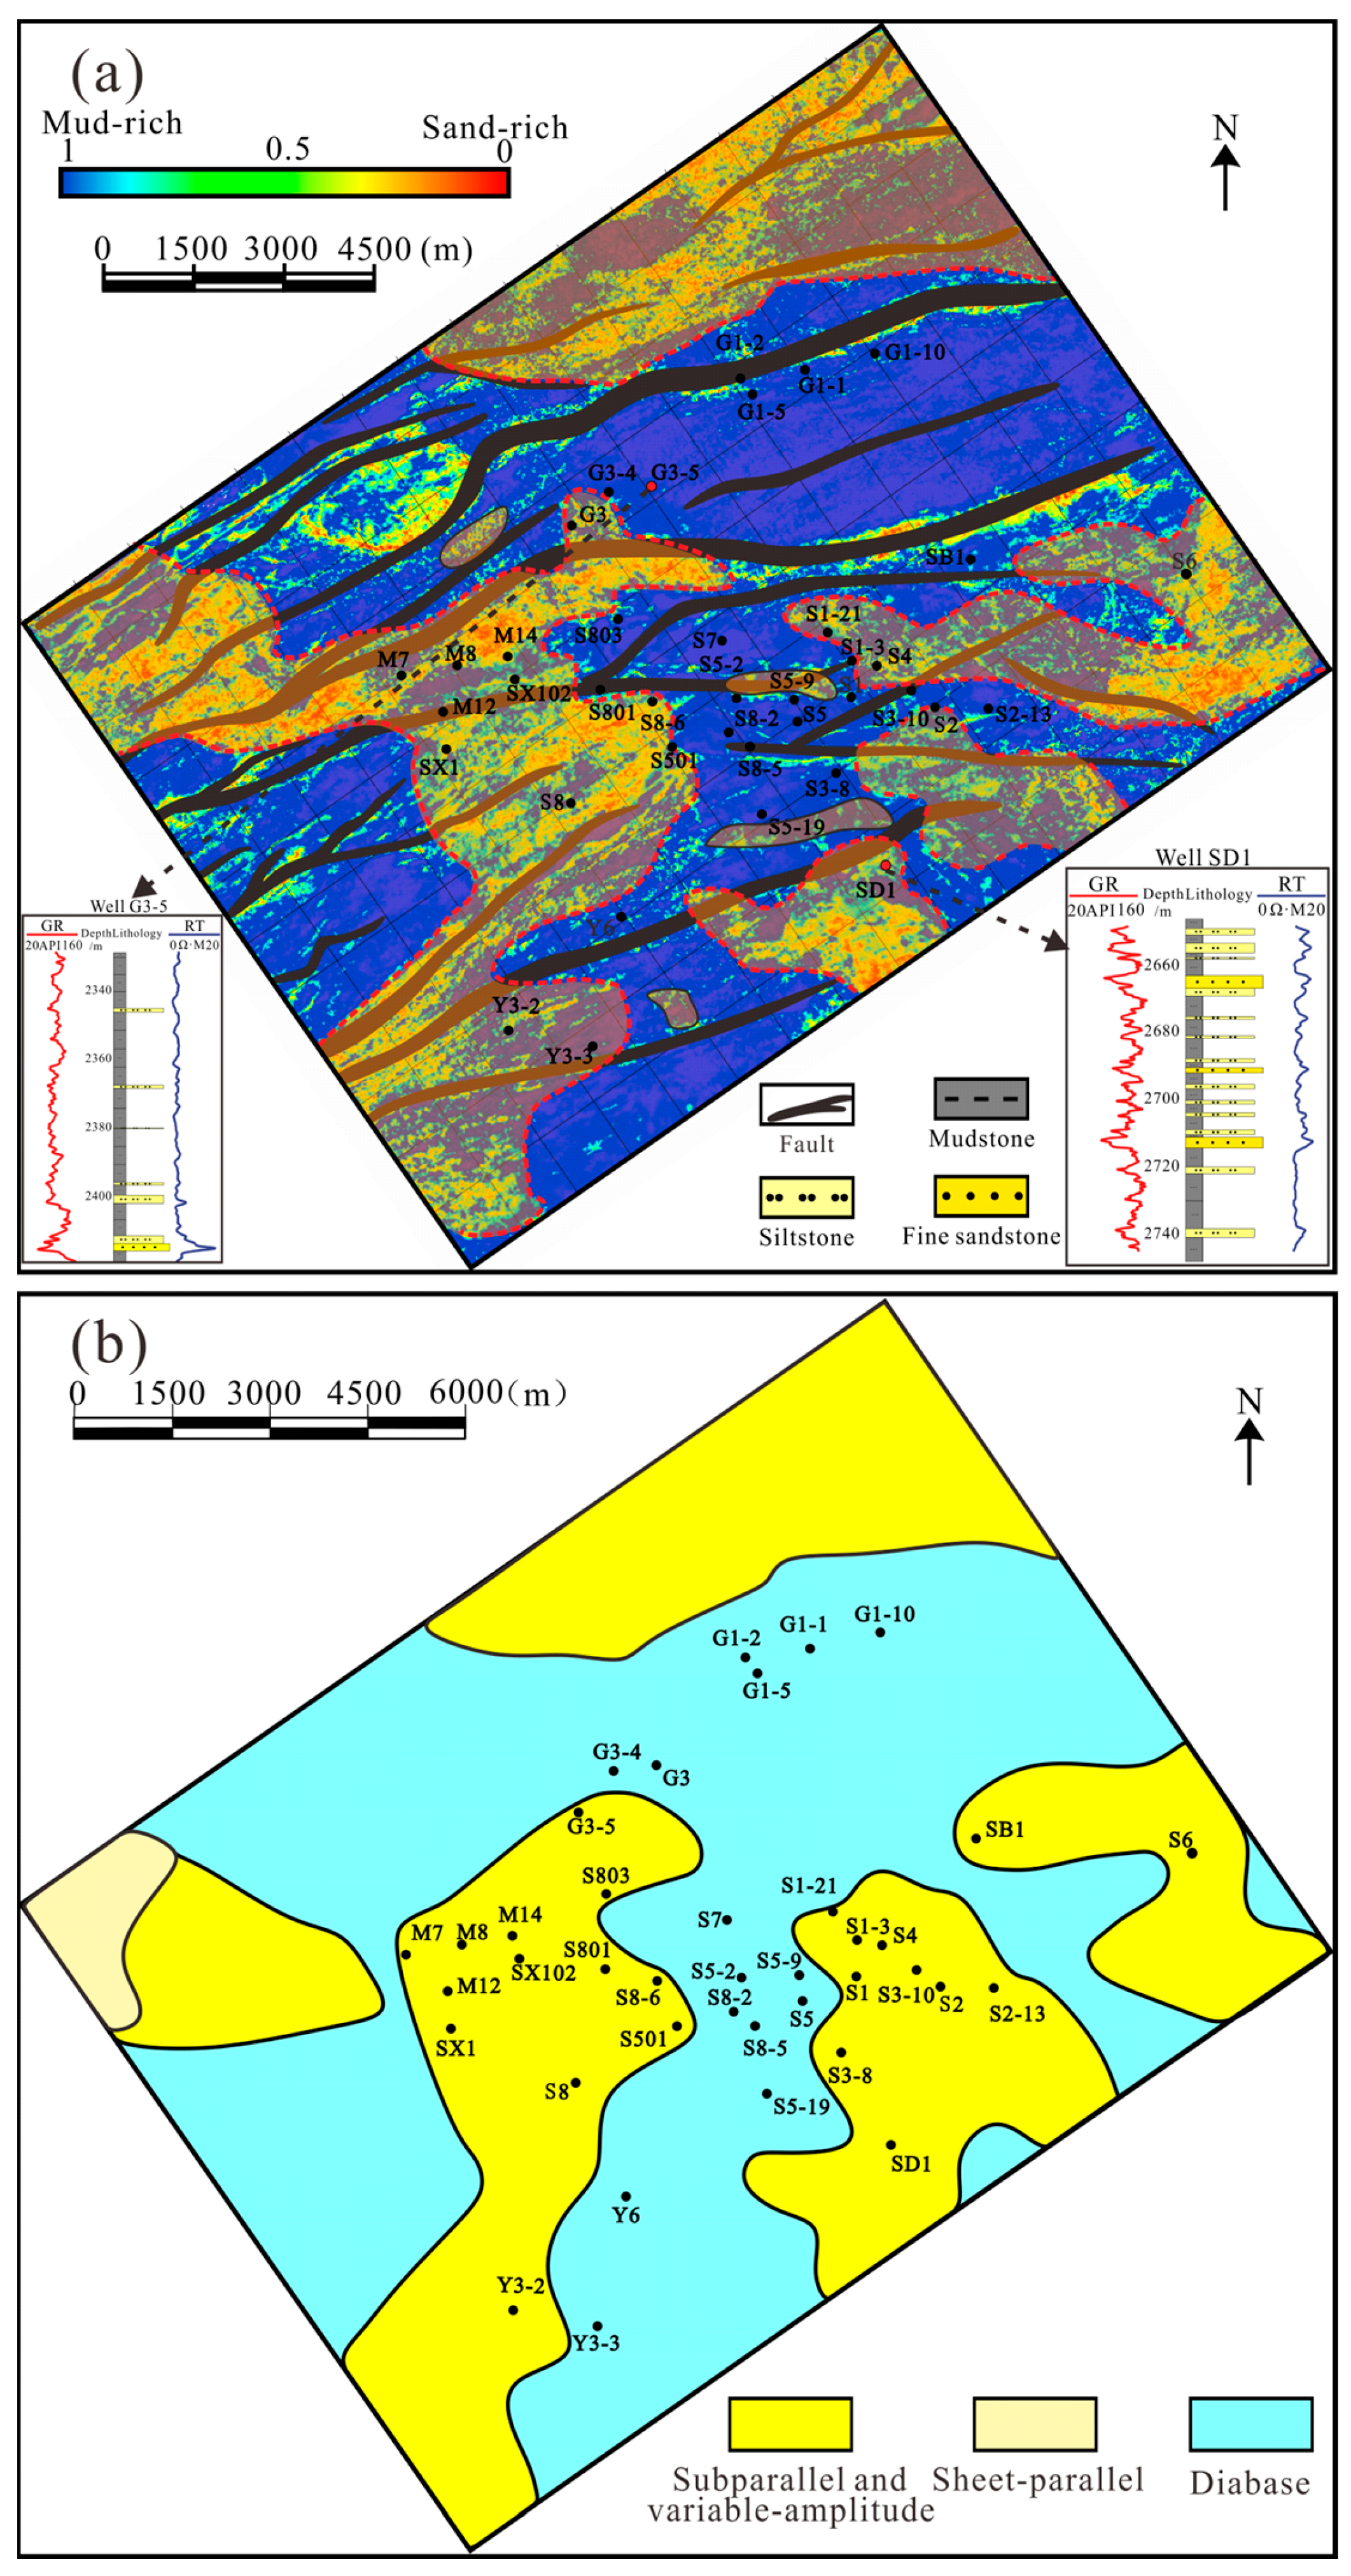
5.3.1. Distribution Characteristics of Seismic Facies and Lithofacies Controlled by Provenance in the Lower Third Member

The average seismic instantaneous amplitude of the lower third member indicated relatively sand-rich characteristics with a fan-shaped zonal distribution covering most of the study area in the southeast, south, and east and a mud-rich zone covering a small area in the shape of point or dam embedded in the sand-rich zone (Figure 14a). Additionally, the lithofacies distribution showed opposite characteristics in the north and northwest, with a relatively developed mud-rich zone that was zonal in distribution and covered most of the area and a sand-rich zone covering a small area in a series of kidney-shaped formations, indicating a lack of sediments. The lithologic distribution indicated that the scale and thickness of the sand bodies gradually decreased and that the sand-rich zone evolved into a mud-rich zone from east to west.
Regarding the seismic facies, obliquely progradational and several trending nearly west bands of concave seismic facies indicated sediment transport pathways in the southeast, south, and east of the study area (Figure 14b), while the reflection characteristics and distribution of these seismic facies suggested that the sediments were transported from east to west with the erosion and construction of the palaeogeomorphology and the formation of sedimentary structures by strong hydrodynamic forces. Parallel and sheet-parallel seismic facies with parallel seismic sedimentary structures, which are formed via weak hydrodynamic forces, developed only in the west, southwest, and north of the study area. The spatial distribution of the seismic facies showed that the hydrodynamic forces gradually decreased from east to west in the study area. The analysis of the hydrodynamic forces, sediment transport direction, and tracks indicated that the sediment source rocks in the study area came from the southern part of the Qintong Sag.

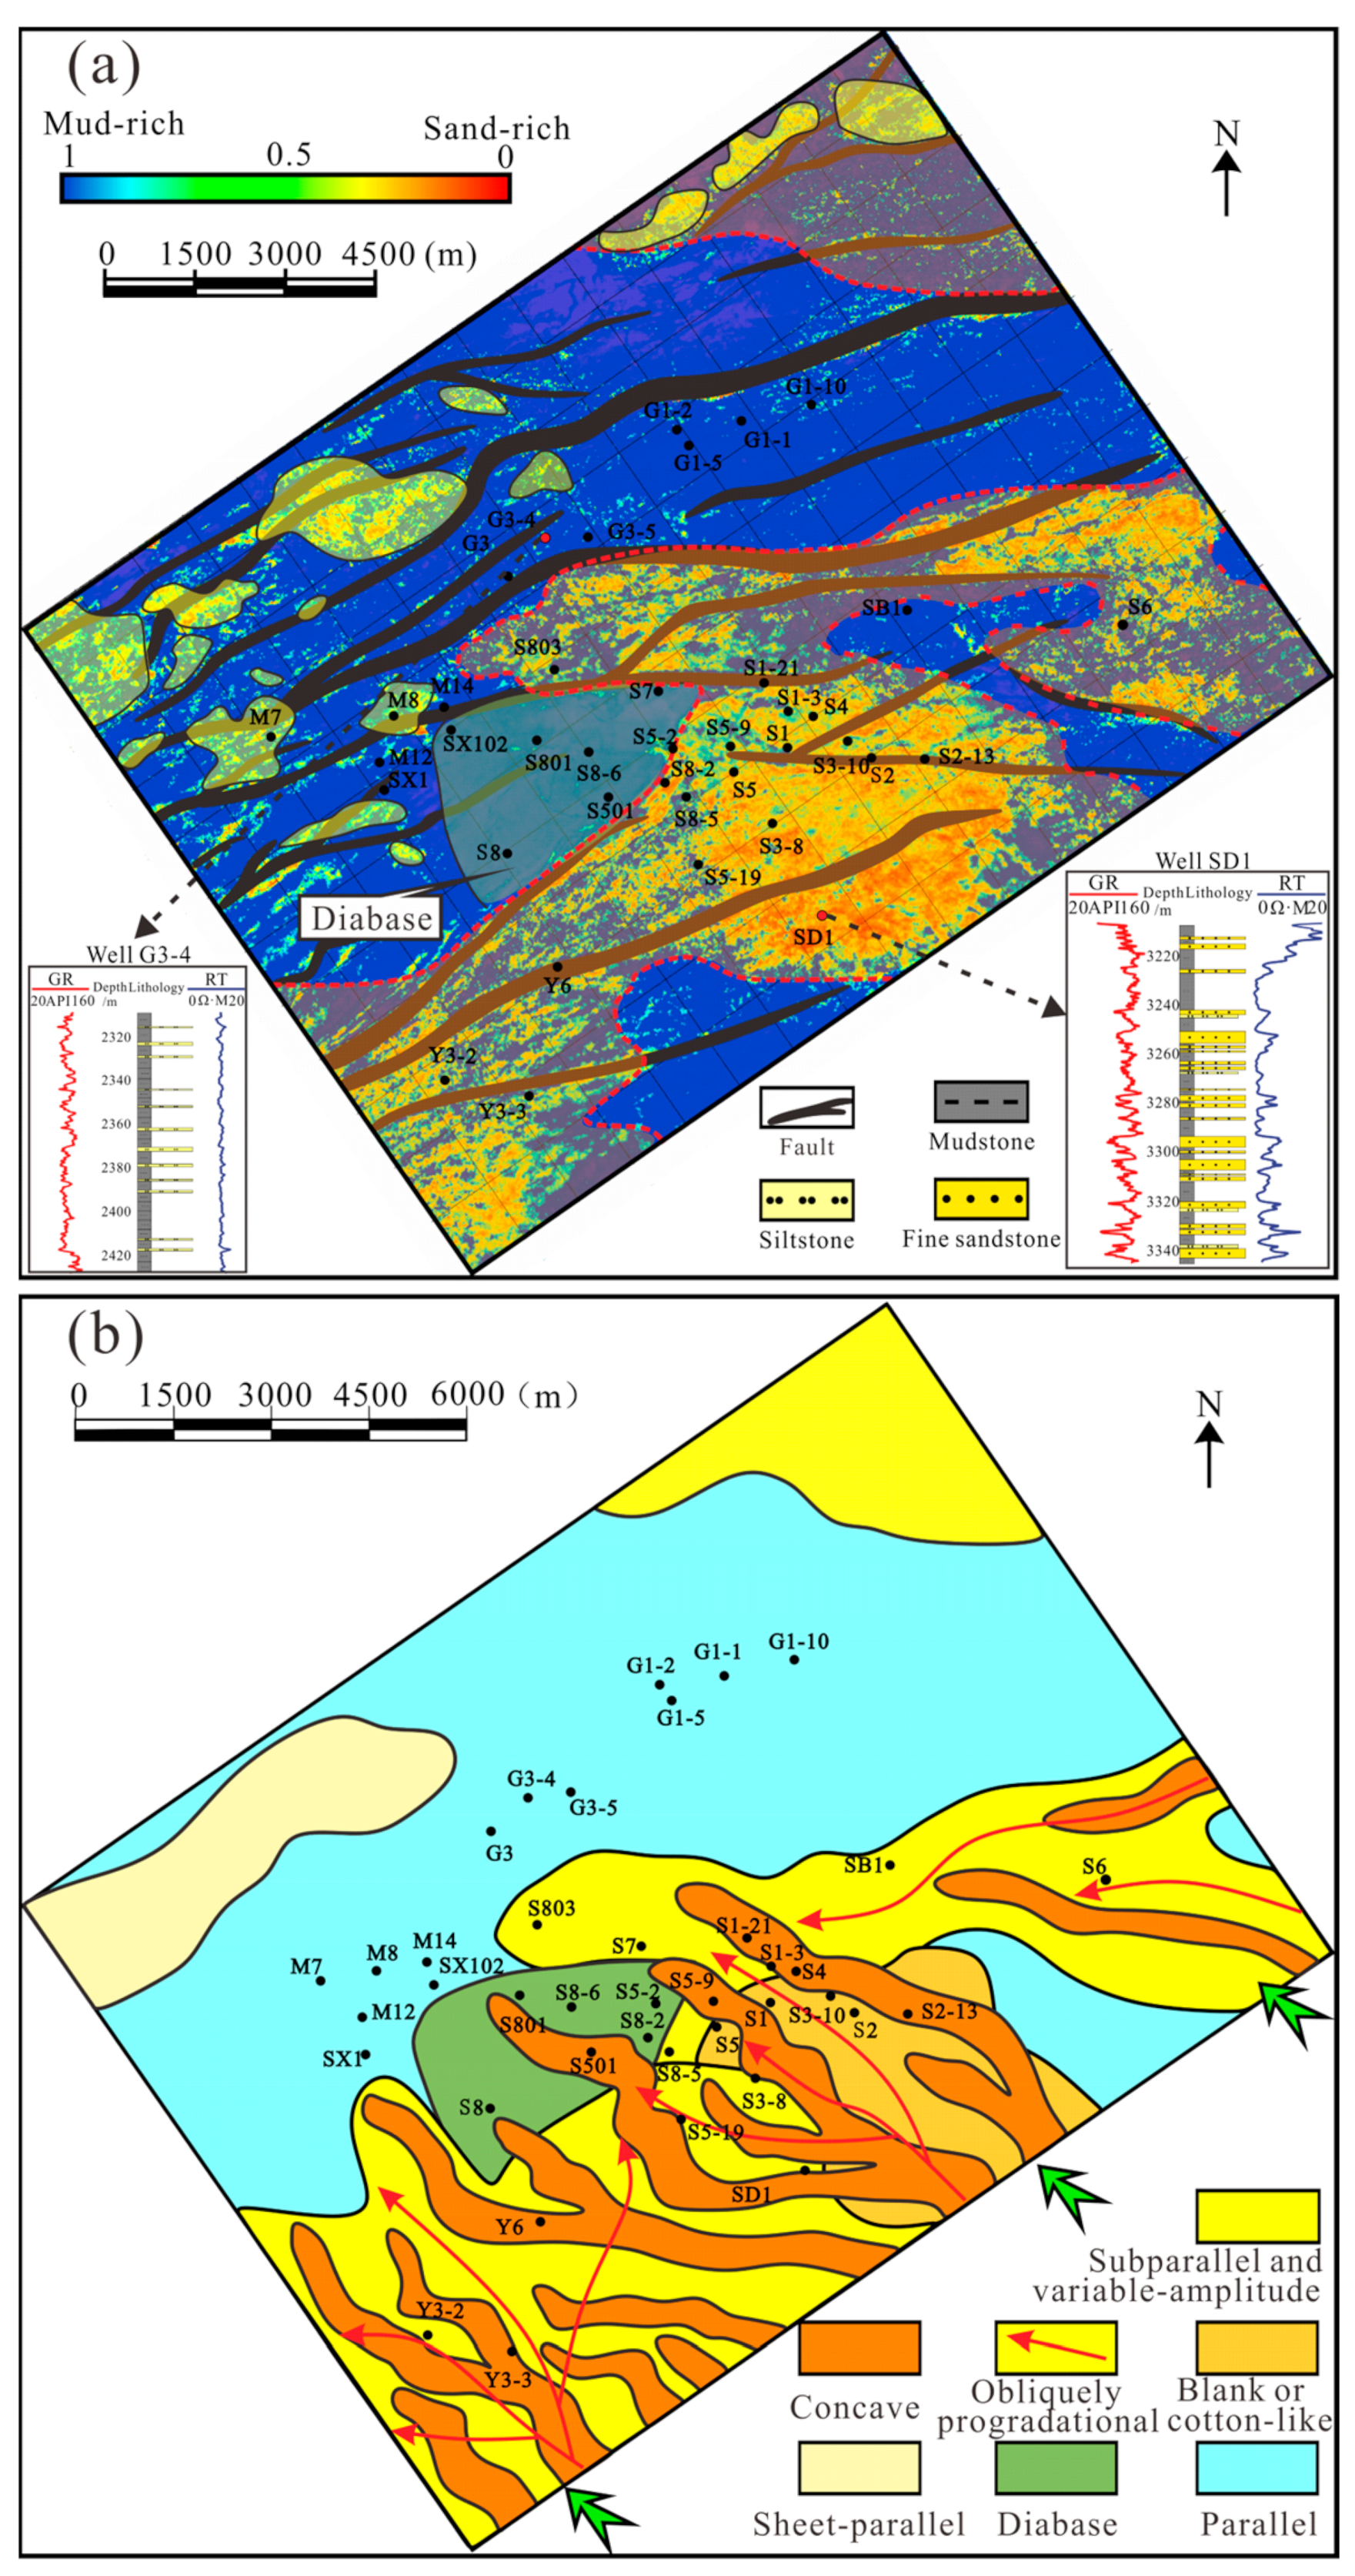
5.3.2. Distribution Characteristics of Seismic Facies and Lithofacies Controlled by Provenance in the Middle Third Member

The distribution of the seismic instantaneous amplitude attributes obtained for the middle third member showed characteristics that were roughly similar to those observed during the early deposition (Figure 15a); however, the scale and thickness of the sand bodies were relatively decreased, and the mud-rich zone was relatively increased. The mud-rich zone in the east of the study area changed from point-shaped or dam-shaped to a zonal distribution. In terms of the seismic facies, the reflection characteristics of the S-shaped progradational seismic facies and the distribution of the concave seismic facies indicated that the source rocks in study area came from the southern part of the Qintong Sag (Figure 15b). According to the potential location of provenance areas, we speculate that the sediments in the depression are controlled by the Taizhou Uplift. Additionally, compared with the seismic facies in the lower third member, the width and length of the identifiable concave seismic facies and the range of the S-shaped progradational seismic facies decreased by a noticeable extent, with the shrinking trend of the sedimentary systems suggesting that the hydrodynamic forces gradually decreased and that the lake of sediment supply formed large-scale retrogradational sedimentary systems.

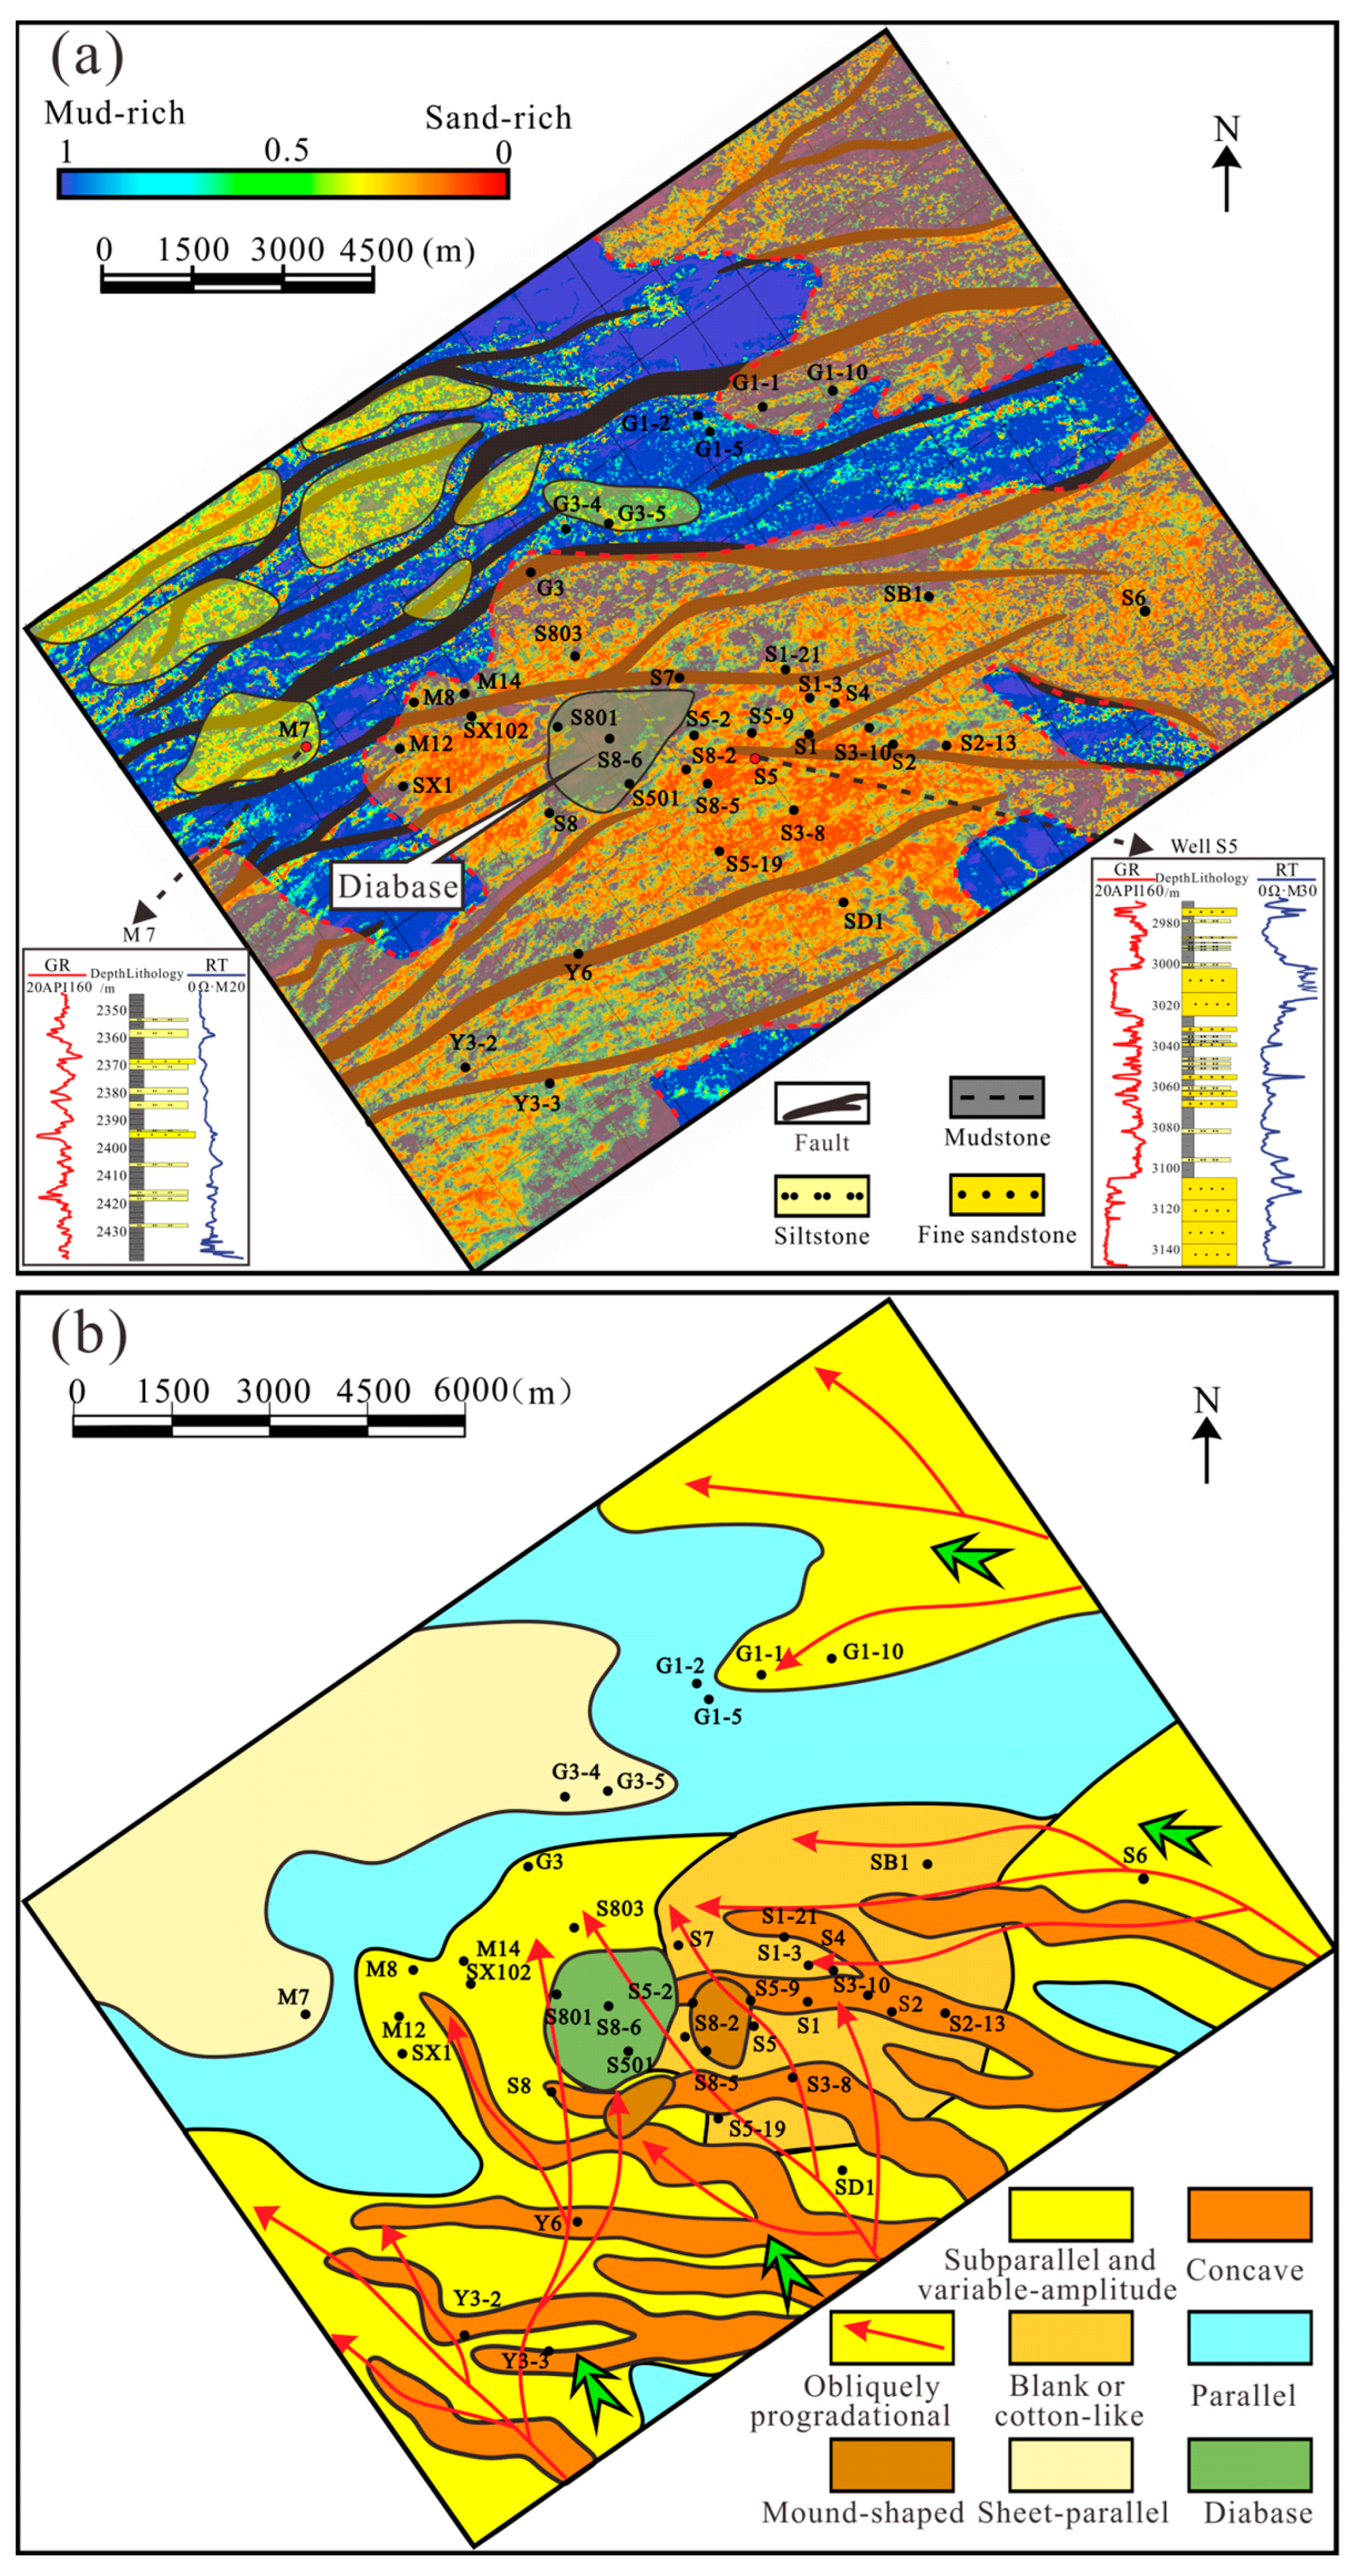
5.3.3. Distribution Characteristics of Seismic Facies and Lithofacies Controlled by Provenance in the Upper Third Member

The sand-rich zone in the study area further decreased, and the early sand-rich zone in the eastern part of the study area was divided into several secondary sand-rich belts by a mud-rich zone during the deposition of the upper third member (Figure 16a). Furthermore, the scale and thickness of the sand bodies were generally further reduced. Regarding the seismic facies, any identifiable concave, S-shaped, and oblique progradational seismic facies disappeared, and subparallel and variable-amplitude, sheet-parallel, and parallel seismic facies with parallel seismic reflections developed (Figure 16b), indicating a lower sediment supply, decreased hydrodynamic forces, and a sedimentary system that was further retrograded to the east of the Qintong Sag.

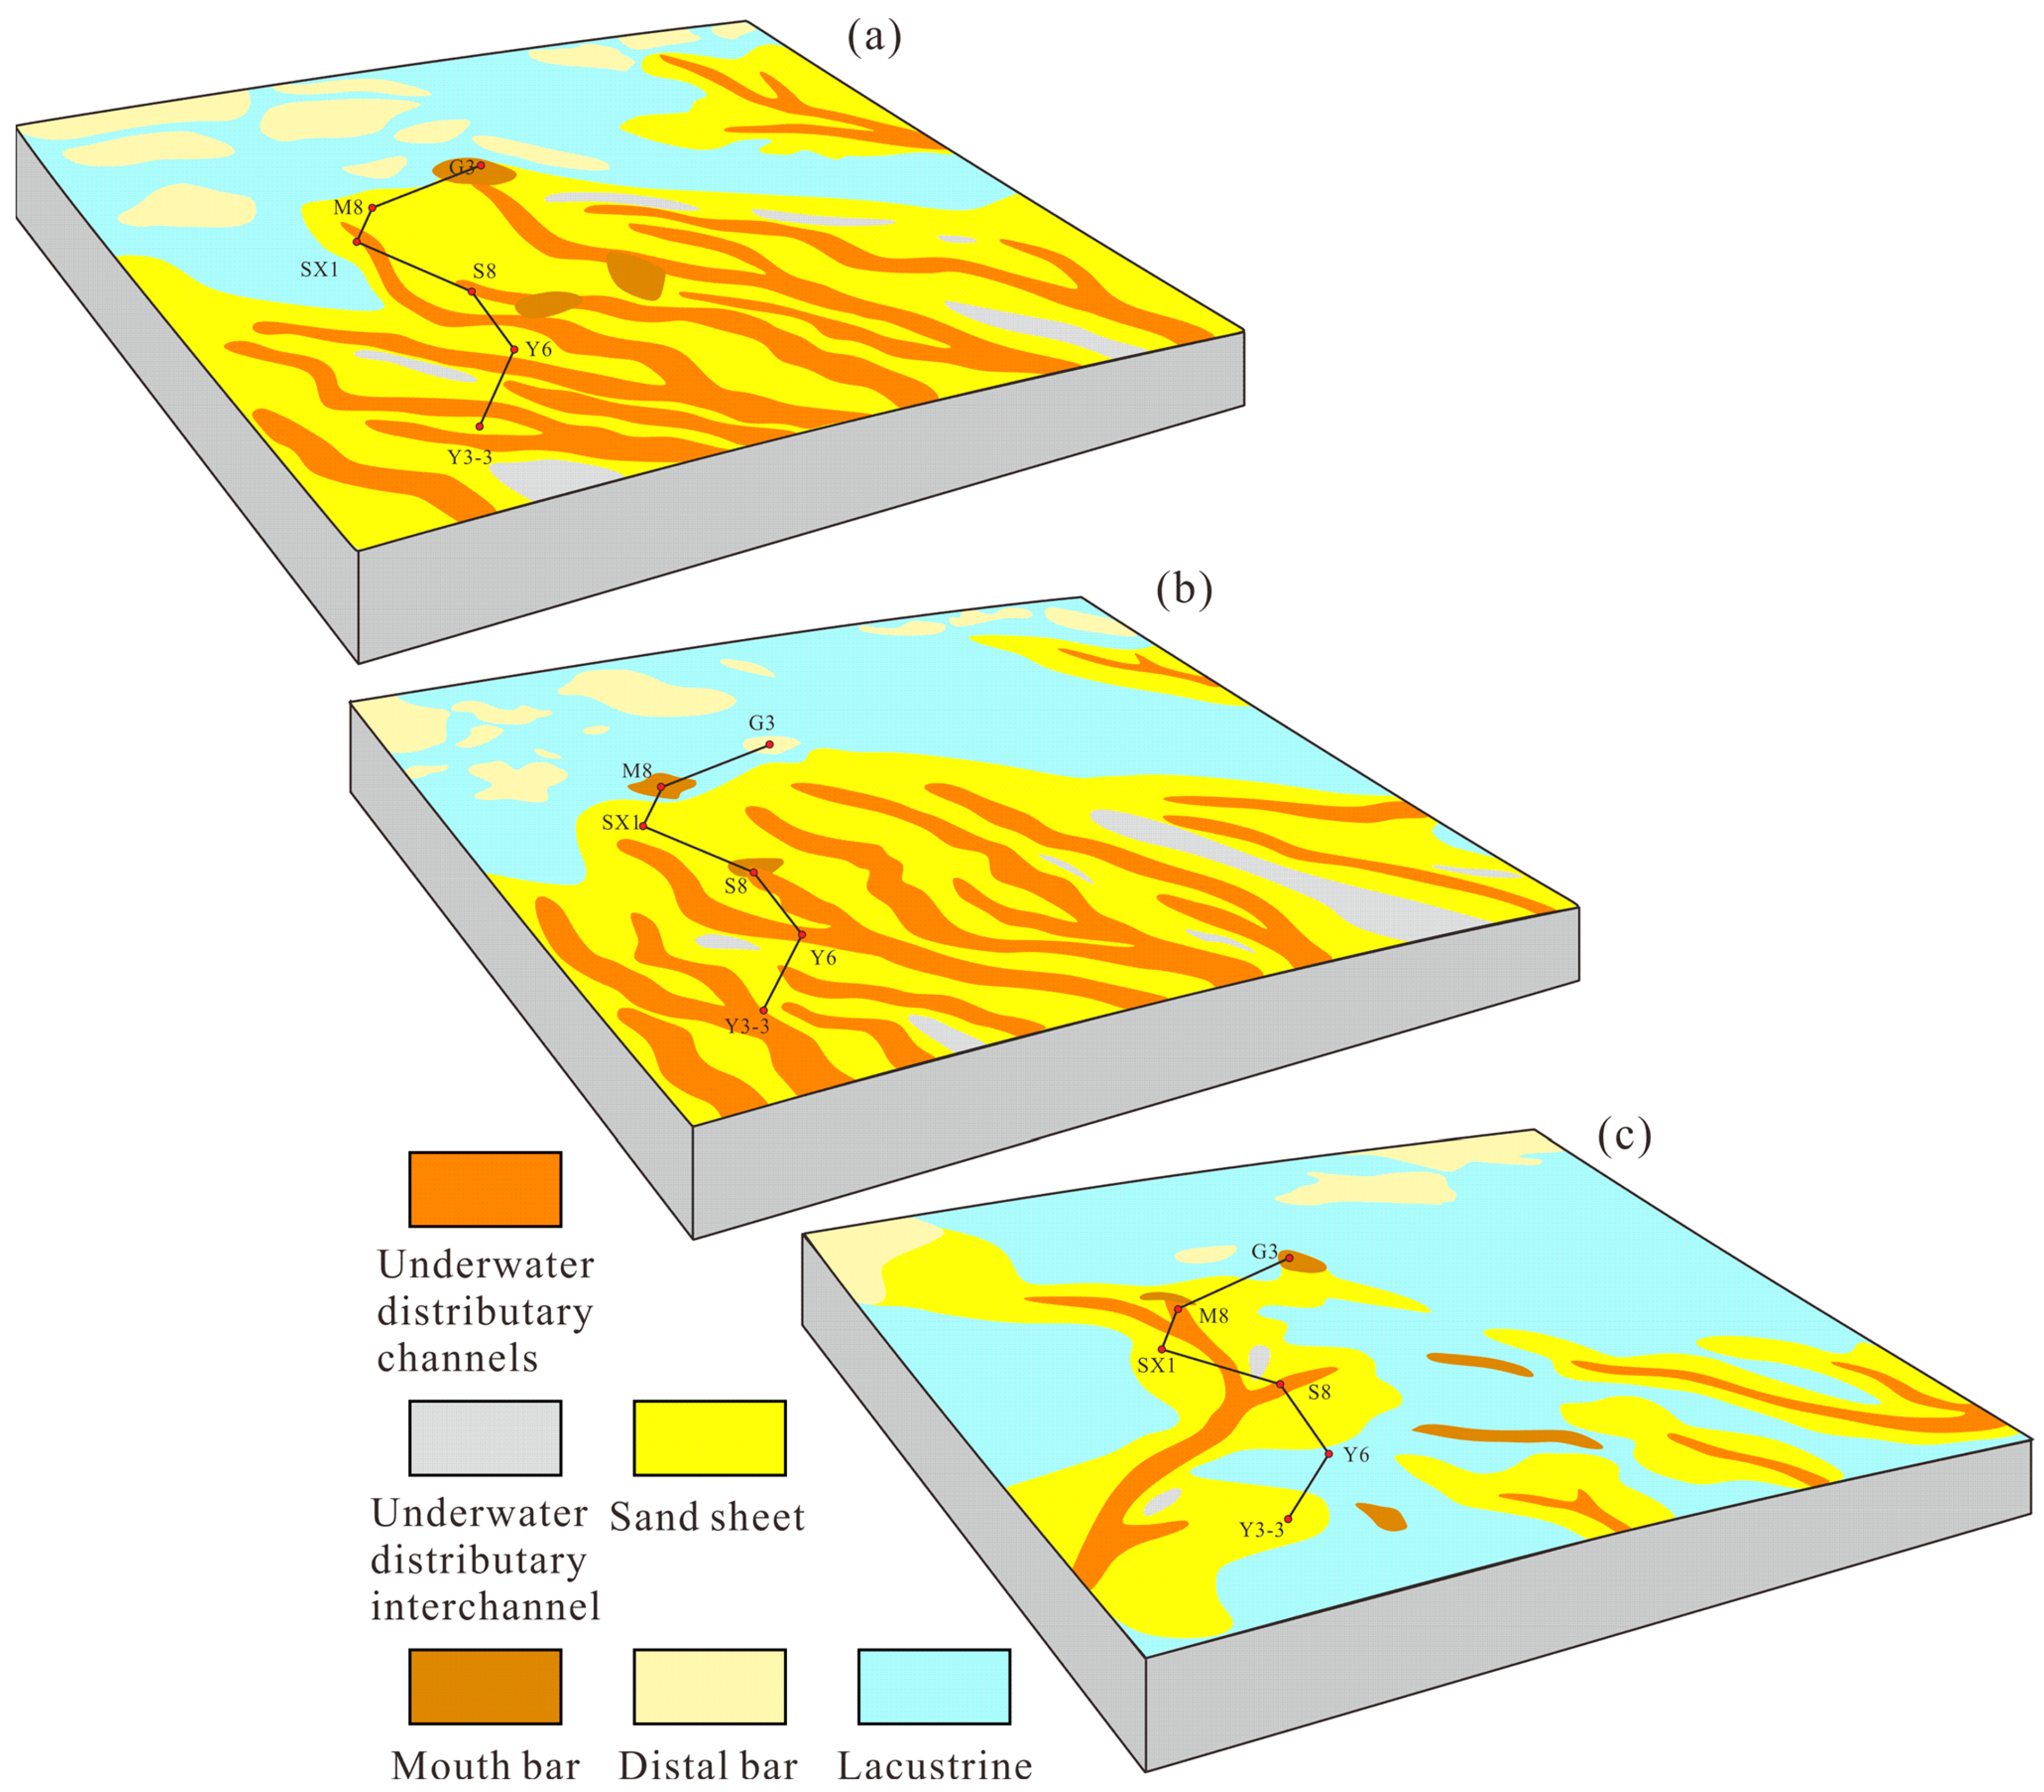
5.4. Provenance Analysis Based on Sedimentary Facies

Sedimentological principles and a comprehensive analysis of the sedimentary facies, seismic facies, and seismic instantaneous attributes were applied to ascertain the details of the distribution of the sedimentary facies. The distribution characteristics of the sedimentary facies during the deposition of the third Mbr of the Funing Fm were evidently controlled by Taizhou Uplift provenance, which is located in the eastern part of the Qintong Sag. According to the locations and sedimentary facies, the sedimentary systems in the study area could be divided into a short-axis delta in the east and littoral-shallow lacustrine in the west. Although the scale of the sedimentary facies differed for each depositional stage, the distribution law was similar, with underwater distributary channels, a mouth bar, and a sand sheet mainly located in the east and a littoral-shallow lacustrine and a distal bar located in the west (Figure 17a–c). Sediments migrated from the southeast to the west, northwest, and northeast of the study area via underwater distributary channels; then, the sediments unloaded and formed thick-bedded delta sand bodies in the east and littoral-shallow lacustrine mudstone and thin distal bar sand bodies in the west. Underwater distributary channels facies extensively developed in the eastern study area and gradually disappeared in central study area with the decrease in the sand body thickness and due to a lack of sediment supply.
The seismic reflections changed from progradational to parallel (Figure 18a), while the sedimentary facies changed from an underwater distributary channel, sand sheet, and mouth bar to a distal bar and lacustrine from east to west (Figure 18b), showing the transition between delta and lacustrine and suggesting decreased hydrodynamic forces. Collectively, these results indicate that the sedimentary systems in the study area are controlled by the Taizhou Uplift provenance.
The depositional history of the third Mbr of the Funing Fm showed the process of delta retrogradation and decrease in the sedimentary transport rate followed by a gradual shrinking of the delta systems. Thick-bedded sand bodies and lacustrine mudstones formed via strong hydrodynamic forces and retrogradation are good reservoirs and direct caprocks, respectively, which are crucial for the storage and sealing of oil.

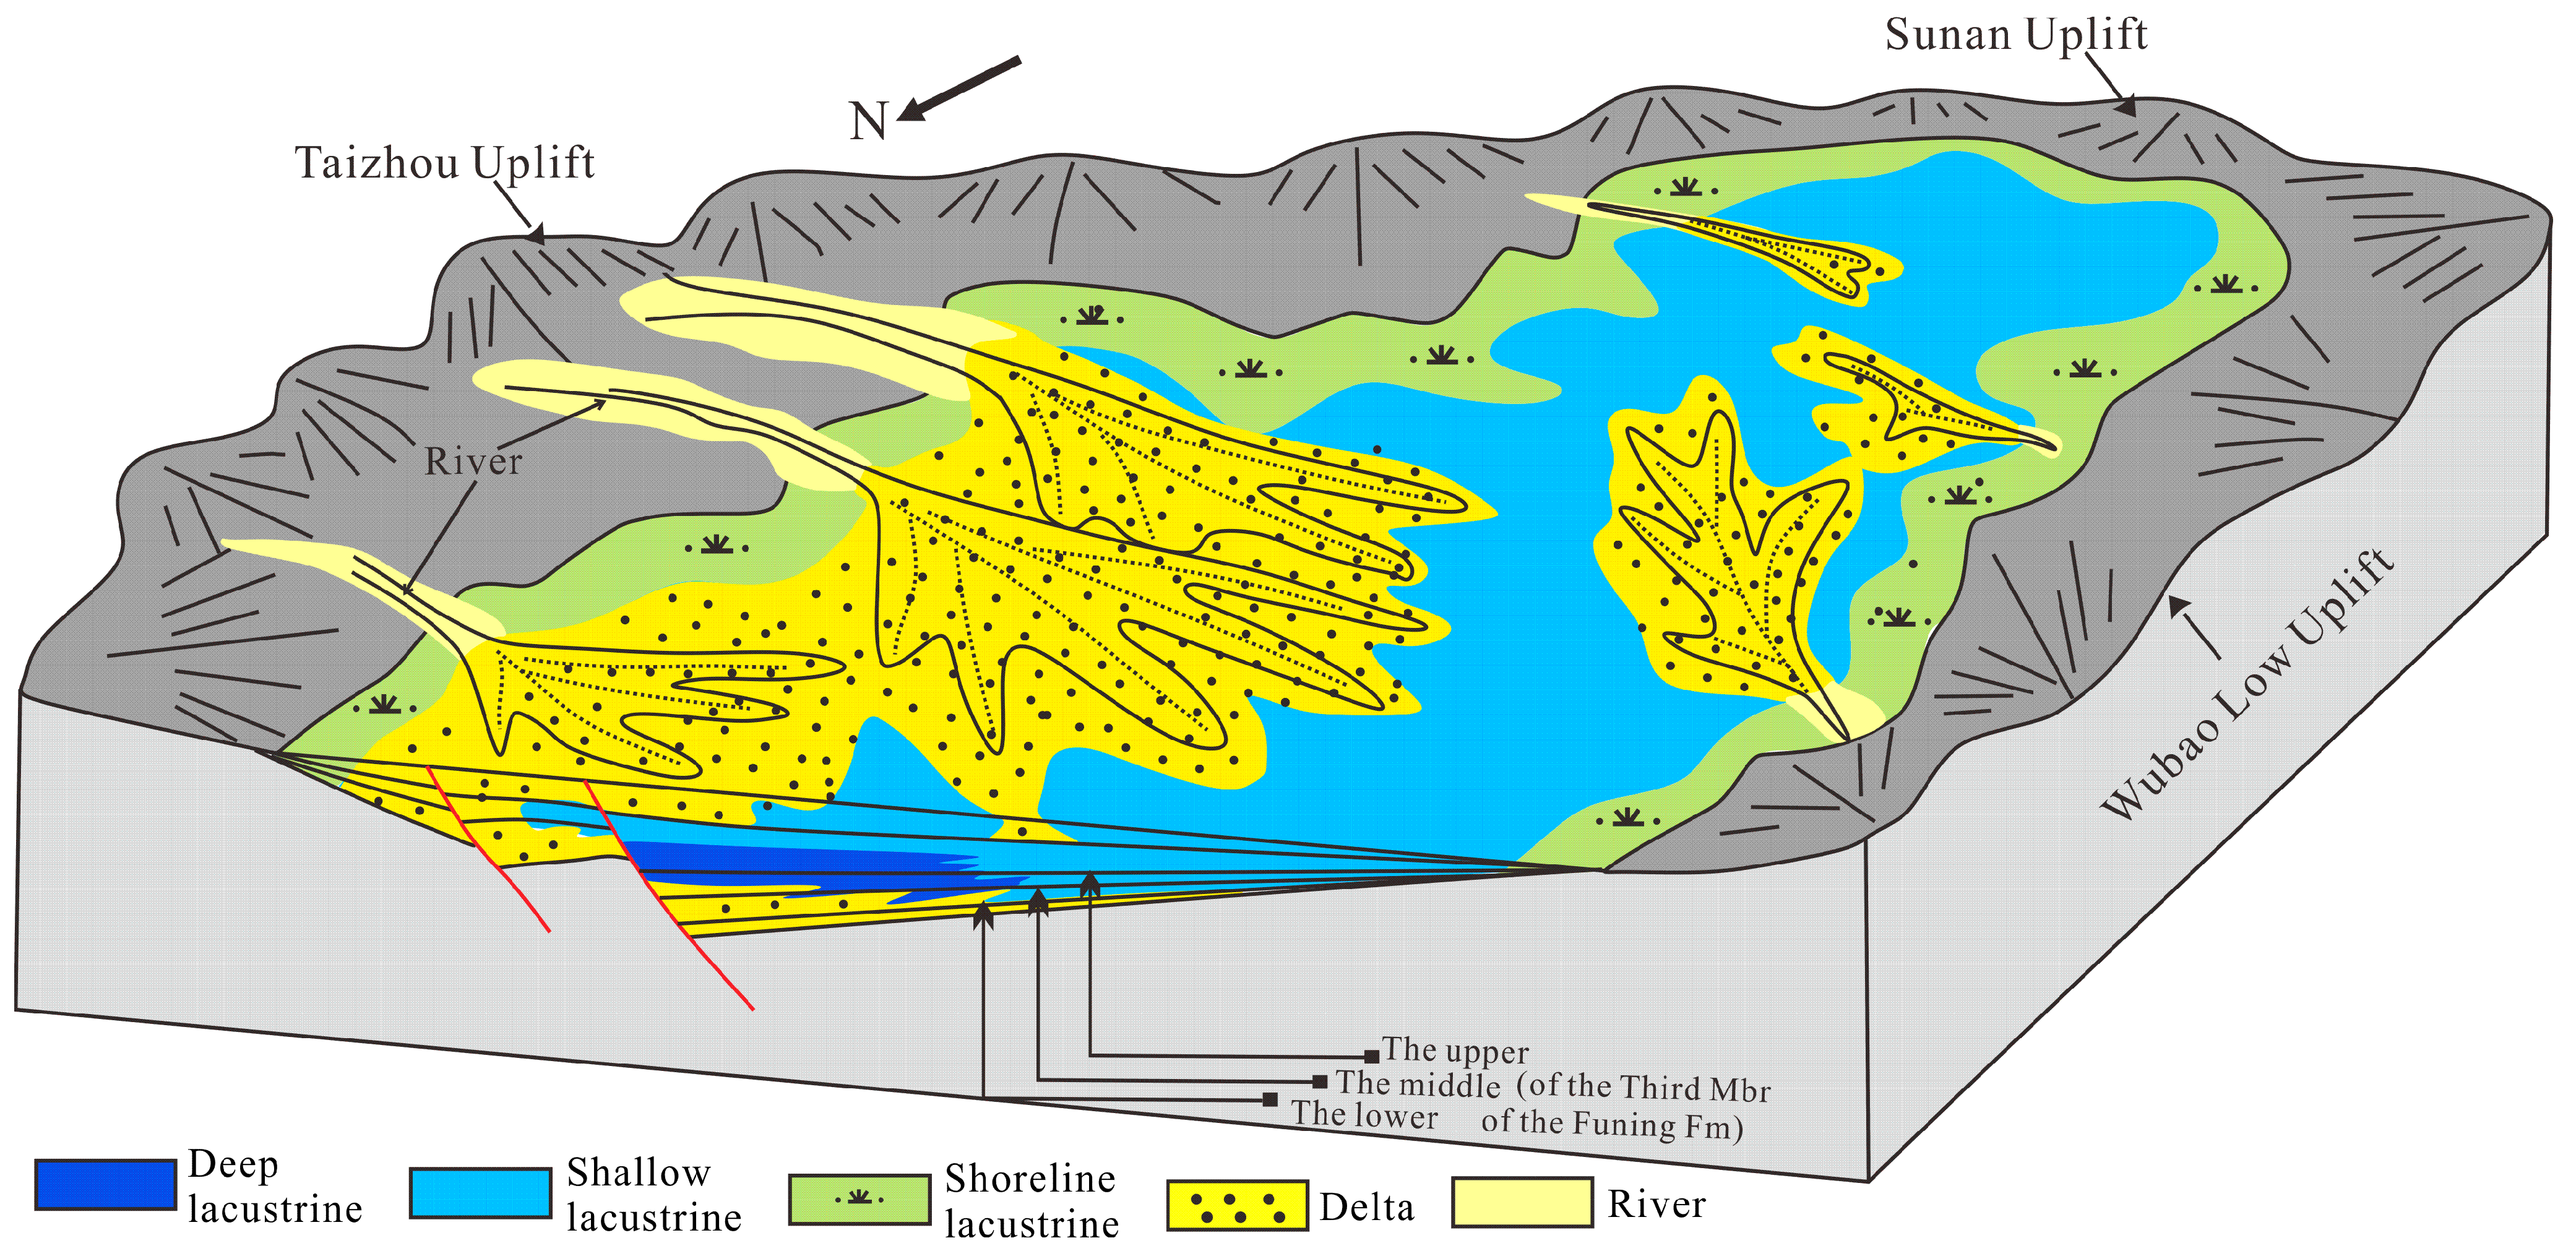
6. Double Main Provenance Depositional Model

The aforementioned discussion confirmed that the Qintong Sag deposits were supplied by both the southeastern Taizhou Uplift and the northwestern Wubao Low Uplift. According to the analysis of the provenance, sedimentary facies, and previous studies [27,69], the sedimentary systems could be divided into southeastern and northwestern short-axis deltas, which are controlled by the Taizhou Uplift and Wubao Low Uplift provenance, respectively. The southeastern short-axis delta sedimentary systems developed on the inner gentle slope zone, deep depression zone, and fault-terrace zone in the central and eastern Qintong Sag, while the northwestern delta sedimentary systems developed on the outer gentle slope zone, slope barrier zone, and inner gentle slope zone in the southwestern and western Qintong Sag. (Figure 19).
During the depositional period of the third Mbr of the Funing Fm, the hydrodynamic forces weakened continually. The delta front sand bodies formed in the early and middle depositional period and located in the east part of the study area with thick and good continuous characteristics could be high-quality reservoirs (Figure 18b). In addition, the mudstones that formed via delta retrogradation in the late depositional stage serve as direct caprocks for underlying reservoirs; therefore, they are crucial for hydrocarbon accumulation. With the excellent and direct-contact source rock in the second member of the Funing Fm, the delta sand bodies in the central and eastern part of the Qintong Sag are likely to become important targets for future oil exploration.

7. Conclusions

According to the analysis of heavy mineral compositions, sandstone petrologic maturity, lithofacies, and seismic and sedimentary facies, the Qintong Sag was served by the Taizhou Uplift provenance in the east of the sag, and large delta sedimentary systems formed via this provenance were found in the central part of the sag. Additionally, this study has documented that sediments of a large delta could also be derived from sediment sources in the direction of the fault-terrace zone during the initial rifting stage of lacustrine rift basins.
The thick-bedded retrogradational delta sand bodies formed by the Taizhou Uplift in the initial rifting stage and the lacustrine mudstones could be high-quality reservoirs and direct caprocks, respectively, which are crucial for the accumulation and sealing of oil. Additionally, the sedimentary systems formed by the provenance from the fault-terrace zone experienced robust retrogradation; this process showed that these large-scale delta systems formed by the fault-terrace zone are likely to only flourish in the initial rifting stage.
Our findings are helpful for investigations into sedimentary frameworks in the lacustrine initial rifting stage and the exploration of rift basins; therefore, except for gentle slope zones, deep lake and fault-terrace zones may serve as important hydrocarbon exploration targets in the future.

Author Contributions

Conceptualization, Z.L., S.X. and M.Z.; methodology, Z.L., S.X. and J.T.; software, R.J., G.W. and W.W.; validation, R.J., Z.L. and S.X.; investigation, R.J.; resources, Z.L., J.T., G.W. and W.W.; data curation, R.J., G.W. and W.W.; writing—original draft preparation, R.J. and M.Z.; writing—review and editing, R.J. and M.Z.; supervision, Z.L., S.X. and M.Z.; project administration, Z.L. All authors have read and agreed to the published version of the manuscript.

Funding

This research received no external funding.

Data Availability Statement

The original contributions presented in the study are included in the article, further inquiries can be directed to the corresponding authors.

Acknowledgments

We thank the East China Oil and Gas Company and Taizhou Oilfield, SINOPEC, for their data support and assistance during the project.

Conflicts of Interest

Jianxin Tang, Gongyi Wu and Wei Wu are employed by the company SINOPEC. The remaining authors declare that the research was conducted in the absence of any commercial or financial relationships that could be construed as a potential conflict of interest.

References

  1. Zou, C.N.; Zhai, G.M.; Zhang, G.Y.; Wang, H.J.; Zhang, G.S.; Li, J.Z.; Wang, Z.M.; Zhang, G.S.; Li, J.Z.; Wang, Z.M.; et al. Formation, distribution, potential and prediction of global conventional and unconventional hydrcarbon resources. Petrol. Explor. Dev. 2015, 42, 14–28. [Google Scholar] [CrossRef]
  2. Dong, G.Y.; He, Y.B.; Leng, C.P.; Gao, F.L. Mechanism of sand body prediction in a continental rift basin by coupling paleogeomorphic elements under the control of base level. Petrol. Explor. Dev. 2016, 43, 579–590. [Google Scholar] [CrossRef]
  3. Li, Y.; Zhao, Y.N.; Lin, Z.L.; Ma, Q.L. Tectonic characteristics and structural styles of a continental rifted basin: Revelation from deep seismic reflection profiles. Geod. Geodyn. 2016, 7, 329–339. [Google Scholar] [CrossRef]
  4. Zheng, M.; Li, J.Z.; Wu, X.Z.; Wang, S.J.; Guo, Q.L.; Yu, J.D.; Zheng, M.; Chen, N.S.; Yi, Q. China’s conventional and unconventional natural gas resources: Potential and exploration targets. J. Nat. Gas Geosci. 2018, 3, 295–309. [Google Scholar] [CrossRef]
  5. Li, Y.; Fan, A.P.; Yang, R.C.; Lash, G.; Bilal, A.; Chen, J. A multi-faceted approach to determine the provenance of Eocene converging deltas, Dongying Depression, Bohai Bay Basin (E China). Mar. Petrol. Geol. 2022, 14, 105692. [Google Scholar] [CrossRef]
  6. Lagabrielle, Y.; Asti, R.; Duretz, T.; Clerc, C.; Fourcade, S.; Teixell, A.; Labaume, P.; Corre, B.; Saspiturry, N. A review of cretaceous smooth-slopes extensional basins along the Iberia-Eurasia plate boundary: How pre-rift salt controls the modes of continental rifting and mantle exhumation. Earth-Sci. Rev. 2020, 201, 103071. [Google Scholar] [CrossRef]
  7. Goswami, S.; Ghosh, P. Evolution of sedimentation pattern in a continental rift basin of India, between the Late Triassic and the early Middle Jurassic: Tectonic and climatic controls. Sediment. Geol. 2020, 405, 105679. [Google Scholar] [CrossRef]
  8. Yang, X.B.; Wang, H.Y.; Li, Z.Y.; Guan, C.; Wang, X. Tectonic-sedimentary evolution of a continental rift basin: A case study of the Early Cretaceous Changling and Lishu fault depressions, southern Songliao Basin, China. Mar. Petrol. Geol. 2021, 128, 105068. [Google Scholar] [CrossRef]
  9. Li, Y.A.; Lin, S.K.; Wang, S.; Wang, Y.M.; Xie, S.X. Depositional cycles in a rift lacustrine basin linked with tectonics, climate, and source rocks and reservoirs development: Lower Cretaceous in Naiman sag, Songliao Basin, Inner Monglia, Northeast China. Mar. Petrol. Geol. 2023, 155, 106348. [Google Scholar] [CrossRef]
  10. Bárbara, M.N.; Ricardo, A.; Fernando, J.; Norberto, M.; Márcio, M.; Pimentel, M.M. Source-to-sink analysis of continental rift sedimentation: Triassic Cuyo basin, Precordillera Argentina. Sediment. Geol. 2018, 376, 164–184. [Google Scholar] [CrossRef]
  11. Xie, Z.K. Sequence boundaries and regularities in the oil–gas distribution of the low swelling slope belt in the continental rift basin. Min. Sci. Technol. 2011, 21, 419–425. [Google Scholar] [CrossRef]
  12. Yu, N.T.; Teng, L.S.; Chen, W.S.; Yue, L.F.; Chen, M.M. Early post-rift sequence stratigraphy of a Mid-Tertiary rift basin in Taiwan: Insights into a siliciclastic fill-up wedge. Sediment. Geol. 2013, 286–287, 39–57. [Google Scholar] [CrossRef]
  13. Li, Q.; Zhang, Z.L.; Zhang, J. Characteristics of sedimentary differential response for multi-episode rifting cycles in lacustrine rift basin: A case study of the Palaeogene Baxian sag in the Bohai Bay Basin. Mar. Petrol. Geol. 2022, 136, 2022–105426. [Google Scholar] [CrossRef]
  14. Wang, R.; Ji, Y.L.; Colombera, L.; Mountney, N.P.; Yuan, B.; Li, D.J.; Song, H.Y.; Zhou, S. Axial and transverse depositional systems of a syn-rift basin fill (Bohai Bay Basin, China). Mar. Petrol. Geol. 2021, 128, 105045. [Google Scholar] [CrossRef]
  15. Almeida, R.P.; Liliane, J.; Fragoso-Cesar, A.R.S.; Marconato, A. Evolution of a rift basin dominated by subaerial deposits: The Guaritas Rift, Early Cambrian, Southern Brazil. Sediment. Geol. 2009, 217, 30–51. [Google Scholar] [CrossRef]
  16. Li, C.X.; Liu, Z.; Wang, S.C.; Xu, Z.Y.; Chen, S.G.; You, X.L.; Wang, B. Prediction of major source rocks distribution in the transition from depressed to rifted basin using seismic and geological data: The Guyang to Linhe Formations in the Linhe Depression, Hetao Basin, China. J. Petrol. Sci. Eng. 2022, 214, 110472. [Google Scholar] [CrossRef]
  17. Yang, K.; Zhu, X.M.; Colombera, L.; McArthur, A.; Mountney, M.P.; Zhu, S.F.; Jin, L.; Shen, T.T.; Yang, H.Y.; Chen, H.K.; et al. Sediment provenance and dispersal in the early Eocene Dongying Depression, Bohai Bay Basin, Eastern China: Evidence from detrital zircon geochronology, geochemistry and petrology. Sediment. Geol. 2023, 454, 106453. [Google Scholar] [CrossRef]
  18. Song, Y.; Ren, J.Y.; Liu, K.Y.; Lyu, D.W.; Feng, X.J.; Liu, Y.; Stepashko, A. Syn-rift to post-rift tectonic transition and drainage reorganization in continental rifting basins: Detrital zircon analysis from the Songliao Basin, NE China. Geosci. Front. 2022, 13, 101377. [Google Scholar] [CrossRef]
  19. Rukavina, D.; Saftić, B.; Matoš, B.; Močilac, I.K.; Fuček, V.P.; Cvetković, M. Tectonostratigraphic analysis of the syn-rift infill in the Drava Basin, southwestern Pannonian Basin System. Mar. Petrol. Geol. 2023, 152, 106235. [Google Scholar] [CrossRef]
  20. Andersen, T. Detrital zircons as tracers of sedimentary provenance: Limiting conditions from statistics and numerical simulation. Chem. Geol. 2005, 216, 249–270. [Google Scholar] [CrossRef]
  21. Triebold, S.; Eynatten, V.H.; Zack, T. A recipe for the use of rutile in sedimentary provenance analysis. Sediment. Geol. 2012, 282, 268–275. [Google Scholar] [CrossRef]
  22. O’Sullivan, G.; Chew, D.; Kenny, G.; Henrichs, I.; Mulligan, D. The trace element composition of apatite and its application to detrital provenance studies. Earth-Sci. Rev. 2020, 201, 103044. [Google Scholar] [CrossRef]
  23. Wu, Q.; Yu, W.R.; Luo, W.F.; Zang, S.H.; Zang, L.; Wu, W. Achievements and recognitions of exploration in lithologic reservoirs in Qintong sag, North Jiangsu Basin. China. Petrol. Explor. 2016, 21, 99–107, (In Chinese with English Abstract). [Google Scholar] [CrossRef]
  24. Zhang, P.F.; Yin, Y.J.; Lu, S.F.; Wang, J.J.; Zhang, J.J.; Zhi, Q.; Huang, H.S. Key factors controlling oil contents in different lithofacies shales from the Funing Formation, Subei Basin: Evidence from scanning electron microscopy. Geoenergy Sci. Eng. 2023, 229, 212115. [Google Scholar] [CrossRef]
  25. Chen, J.W.; Xu, M.; Lei, B.H.; Liang, J.; Zhang, Y.G.; Wu, S.Y.; Shi, J.; Yuan, Y.; Wang, J.Q.; Zhang, Y.X.; et al. Prospective prediction and exploration situation of marine Mesozoic-Paleozoic oil and gas in the South Yellow Sea. China Geol. 2019, 2, 67–84. [Google Scholar] [CrossRef]
  26. Cai, L.X.; Zhang, X.H.; Guo, X.W.; Zeng, Z.G.; Xiao, G.L.; Pang, Y.M.; Wang, S.P. Effective hydrocarbon-bearing geological conditions of the Permian strata in the South Yellow Sea Basin, China: Evidence from borehole CSDP-2. J. Petrol. Sci. Eng. 2021, 196, 107815. [Google Scholar] [CrossRef]
  27. Zhang, G.H.; Zan, N. The rules of hydrocarbon enrichment in the 3(rd) member of Funing formation on the west steep slope of Qintong depression of Subei basin. J. Yangtze Univ. Nat. Sci. Ed. 2016, 13, 13–17, (In Chinese with English Abstract). [Google Scholar] [CrossRef]
  28. Zhao, S.J.; Fu, Q.; Lou, W.F.; Huang, J.L.; Teng, J. The hydrocarbon accumulation regularity and the model of hydrocarbon accumulation along the fault ridges in the slope zone of the continental fault basin. J. Petrol. Sci. Eng. 2022, 208, 109188. [Google Scholar] [CrossRef]
  29. Fan, Z.Y.; Zhao, J.R.; Pan, S.Z.; Ma, C.J.; Qu, M.X.; Hai, Y.; Deng, X.G. Study on the basement structure in the southeastern North China by blasting seismic. Geod. Geodyn. 2018, 9, 312–319. [Google Scholar] [CrossRef]
  30. Liu, X.P.; Lai, J.; Fan, X.C.; Shu, H.L.; Wang, G.C.; Ma, X.Q.; Liu, M.C.; Guan, M.; Luo, Y.F. Insights in the pore structure, fluid mobility and oiliness in oil shales of Paleogene Funing Formation in Subei Basin, China. Mar. Petrol. Geol. 2020, 114, 104228. [Google Scholar] [CrossRef]
  31. Zhang, F.Q.; Dilek, Y.; Chen, H.L.; Yang, S.F.; Meng, Q.A. Structural architecture and stratigraphic record of Late Mesozoic sedimentary basins in NE China: Tectonic archives of the Late Cretaceous continental margin evolution in East Asia. Earth-Sci. Rev. 2017, 171, 598–620. [Google Scholar] [CrossRef]
  32. Liu, J.S.; Ding, W.L.; Gu, Y.; Xiao, Z.K.; Dai, J.S.; Dai, P.; Chen, X.S.; Gang Zhao, G. Methodology for predicting reservoir breakdown pressure and fracture opening pressure in low-permeability reservoirs based on an in situ stress simulation. Eng. Geol. 2018, 246, 222–232. [Google Scholar] [CrossRef]
  33. Luo, H.; Xu, X.W.; Gao, Z.W.; Liu, X.L.; Yu, H.M.; Wu, X.Y. Spatial and temporal distribution of earthquake ruptures in the eastern segment of the Altyn Tagh fault, China. J. Asian Earth Sci. 2019, 173, 263–274. [Google Scholar] [CrossRef]
  34. Cheng, Y.J.; Wu, Z.P.; Xu, B.; Dai, Y.N.; Chu, Y.C.; Zhang, J.; Chen, M.M.; Ma, S.T.; Sun, W.J.; Xu, L.L. The Mesozoic tectonic evolution of the East China Sea Basin: New insights from 3D seismic reflection data. Tectonophysics 2023, 848, 229717. [Google Scholar] [CrossRef]
  35. Han, Z.H.; Cheng, X.C.; Guo, H.H.; Pang, L.Y. Accumulation and Mixing of Oils in Jinghu Sag of Subei Basin: Constraints from Thermal Maturity Parameters. J. China Univ. Min. Technol. 2007, 17, 53–57. [Google Scholar] [CrossRef]
  36. Zhou, X.W.; Jiang, Z.X.; Quaye, J.A.; Duan, Y.; Hu, C.L.; Liu, C.; Han, C. Ichnology and sedimentology of the trace fossil-bearing fluvial red beds from the lowermost member of the Paleocene Funing Formation in the Jinhu Depression, Subei Basin, East China. Mar. Petrol. Geol. 2019, 99, 393–415. [Google Scholar] [CrossRef]
  37. Zhang, R.Y.; Yang, F.Y.; Hu, P.P.; Yang, X.D.; Peng, Y.X. Cenozoic tectonic inversion in the Northern Depression, South Yellow Sea Basin, East Asia: Structural styles and driving mechanism. Tectonophysics 2021, 798, 228687. [Google Scholar] [CrossRef]
  38. Zhao, L.Q.; Qin, H.M.; Yu, C.Q.; Si, C.N.; Jiang, W.; Cao, A.F. A new understanding of Jurassic provenance and sedimentary framework in northwestern Sikeshu Sag, Junggar Basin, China. Energy Geosci. 2022, 3, 372–380. [Google Scholar] [CrossRef]
  39. Sun, Y.J.; Wang, H.B.; Huang, Y.; Wang, J.F.; Jiang, H.L.; He, Y.C.; Huang, Z.C. Insight into seismotectonics of the central-south Tanlu Fault in East China from P-wave tomography. J. Asian Earth Sci. 2023, 258, 105722. [Google Scholar] [CrossRef]
  40. Liang, J.; Zhang, P.H.; Chen, J.W.; Gong, J.N.; Yuan, Y. Hydrocarbon preservation conditions in Mesozoic–Paleozoic marine strata in the South Yellow Sea Basin. Nat. Gas Ind. B 2017, 4, 432–441. [Google Scholar] [CrossRef]
  41. Hu, S.Z.; Song, Y.; Su, P.; Mahlstedt, N.; Mangelsdorf, K.; Shen, C.B.; Li, S.F.; Zhu, K. Impact of marine incursions on lacustrine source rocks: Organic matter quantity, quality, and kinetics in the Paleocene South Yellow Sea Basin, offshore eastern China. Org. Geochem. 2020, 148, 104084. [Google Scholar] [CrossRef]
  42. Liu, C.; Jiang, Z.X.; Zhou, X.W.; Duan, Y.; Huarui, L.; Xu, Y.; Wang, X.Y.; Quaye, J.A. Paleocene storm-related event beds in the Gaoyou Sag of the Subei Basin, eastern China: A new interpretation for these deep lacustrine sandstones. Mar. Petrol. Geol. 2021, 124, 104850. [Google Scholar] [CrossRef]
  43. Wu, Z. Depositional characteristics and sand bodies distribution of thrid member of Funing formation in Yinzhuang-Taixing Block, Qintong sag in the north Jiangsu. J. Geol. 2011, 35, 29–32, (In Chinese with English Abstract). [Google Scholar] [CrossRef]
  44. Cai, L.X.; Guo, X.W.; Zhang, X.H.; Zeng, Z.G.; Xiao, G.L.; Pang, Y.M.; Wang, S.P. Pore-throat structures of the Permian Longtan Formation tight sandstones in the South Yellow Sea Basin, China: A case study from borehole CSDP-2. J. Petrol. Sci. Eng. 2020, 186, 106733. [Google Scholar] [CrossRef]
  45. Pang, Y.M.; Guo, X.W.; Chang, X.C.; Zhang, J.J.; Zhou, J.Q.; Cai, L.X. Characteristics and classification of paleozoic tight reservoirs in the central uplift of the South Yellow Sea Basin. Energy. Geosci. 2020, 3, 383–393. [Google Scholar] [CrossRef]
  46. Wang, K.S.; Shi, X.F.; Yao, Z.Q.; Liu, J.X.; Liu, J.; Xu, T.X. Heavy-mineral-based provenance and environment analysis of a Pliocene series marking a prominent transgression in the south Yellow Sea. Sediment. Geol. 2019, 382, 25–35. [Google Scholar] [CrossRef]
  47. Zhu, X.F.; Shen, C.B.; Zhou, R.J.; Xu, J.Y.; Zhao, J.X.; Wang, L.; Ge, X. Paleogene sediment provenance and paleogeographic reconstruction of the South Yellow Sea Basin, East China: Constraints from detrital zircon U-Pb geochronology and heavy mineral assemblages. Palaeogeogr. Palaeocl. 2020, 553, 109776. [Google Scholar] [CrossRef]
  48. Zhao, S.J.; FU, Q.; Luo, W.F.; Huang, J.L.; Teng, J. Sedimentary characteristics of sandy beach-bar in faulted-lacustrine-basin, Ef3 in west slope of Qintong Sag. Reserv. Eval. Dev. 2021, 11, 248–255, (In Chinese with English Abstract). [Google Scholar] [CrossRef]
  49. Nesbitt, H.W.; Young, G.M.; McLennan, S.M.; Keays, R.R. Effects of Chemical Weathering and Sorting on the Petrogenesis of Siliciclastic Sediments, with Implications for Provenance Studies. J. Geol. 1996, 104, 525–542. [Google Scholar] [CrossRef]
  50. Weltje, G.J.; Eynatten, H.V. Quantitative provenance analysis of sediments: Review and outlook. Sediment. Geol. 2004, 171, 1–11. [Google Scholar] [CrossRef]
  51. Caracciolo, L. Sediment generation and sediment routing systems from a quantitative provenance analysis perspective: Review, application and future development. Earth-Sci. Rev. 2020, 209, 103226. [Google Scholar] [CrossRef]
  52. Morton, A.C.; Hallsworth, C.R. Identifying provenance-specific features of detrital heavy mineral assemblages in sandstones. Sediment. Geol. 1994, 90, 241–256. [Google Scholar] [CrossRef]
  53. Hubert, J.F. A zircon-tourmaline-rutile maturity index and the interdependence of the composition of heavy minerals assemblages with the gross composition and texture of sandstones. J. Sediment. Res. 1962, 32, 440–450. [Google Scholar] [CrossRef]
  54. Morton, A.C.; Hallsworth, C.R. Processes controlling the composition of heavy mineral assemblages in sandstones. Sediment. Geol. 1999, 124, 3–29. [Google Scholar] [CrossRef]
  55. Blatt, H. Provenance determinations and recycling of sediments. J. Sediment. Petrol. 1967, 37, 1031–1044. [Google Scholar] [CrossRef]
  56. Ferree, R.A.; Jordan, D.W.; Kertes, R.S.; Savage, M.; Potter, P.E. Comparative petrographic maturity of river and beach sand, and origin of quartz arenites. J. Geol. Educ. 1988, 36, 79–87. [Google Scholar] [CrossRef]
  57. Garzanti, E. The maturity myth in sedimentology and provenance analysis. J. Sediment. Res. 2017, 87, 353–365. [Google Scholar] [CrossRef]
  58. Yao, Z.Q.; Yang, F.; Jianatayi, D.N.T.Y.; Wang, W.; Gao, Y.; Sun, L.; Wang, W.F.; Mu, B.Y.; Pin, B.P. Application of multi-attribute matching technology based on geological models for sedimentary facies: A case study of the 3rd member in the Lower Jurassic Badaowan Formation, Hongshanzui area, Junggar Basin, China. Petrol. Sci. 2022, 19, 116–127. [Google Scholar] [CrossRef]
  59. Liu, Q.H.; Zhu, H.T.; Shu, Y.; Zhu, X.M.; Yang, X.H.; Chen, L.; Tan, M.X.; Geng, M.Y. Provenance identification and sedimentary analysis of the beach and bar systems in the Palaeogene of the Enping Sag, Pearl River Mouth Basin, South China Sea. Mar. Petrol. Geol. 2016, 70, 251–272. [Google Scholar] [CrossRef]
  60. Liu, Z. Reservoir Seismic Stratigraphy; Geological Press: Baijing, China, 1997; pp. 1–257, (In Chinese with English Abstract). [Google Scholar]
  61. Luo, L.M. Three Dimensional High Resolution Sequence Stratigraphy of River and Lake Sedimentary Systems; Geological Press: Beijing, China, 1999; pp. 1–187, (In Chinese with English Abstract). [Google Scholar]
  62. Brown, A.R. Interpretation of three-dimensional seismic data. AAPG Mem. 2011, 42, 1–309. [Google Scholar] [CrossRef]
  63. Abbas, A.; Zhu, H.T.; Zeng, Z.W.; Zhou, X.H. Sedimentary facies analysis using sequence stratigraphy and seismic sedimentology in the Paleogene Pinghu Formation, Xihu Depression, East China Sea Shelf Basin. Mar. Petrol. Geol. 2018, 93, 287–297. [Google Scholar] [CrossRef]
  64. Xu, G.Q.; Zhang, L.; Pang, X.; Chen, M.; Xu, S.H.; Liu, B.J.; Zuo, Y.H.; Luo, S.B.; Hu, L.; Chen, H.; et al. New method for the reconstruction of sedimentary systems including lithofacies, environments, and flow paths: A case study of the Xisha Trough Basin, South China Sea. Mar. Petrol. Geol. 2021, 133, 105268. [Google Scholar] [CrossRef]
  65. Xu, G.Q.; Haq, B.U. Seismic facies analysis: Past, present and future. Earth-Sci. Rev. 2022, 224, 103876. [Google Scholar] [CrossRef]
  66. Su, Z.; Liu, Y.F.; Han, J.F.; Han, J.F.; Lou, H.N.; Yang, F.Y.; Cui, Y.Z.; Peng, P.; Zhang, H.F.; Du, L.; et al. Application of ultra-deep sandstone reservoirs prediction technology under controlled seismic facies in Yudong block of Tabei Uplift, Tarim Basin, China. J. Nat. Gas Geosci. 2020, 5, 157–167. [Google Scholar] [CrossRef]
  67. Wu, W.; Li, Q.; Pei, J.X.; Ning, S.Y.; Tong, L.Q.; Liu, W.Q.; Feng, Z.D. Seismic sedimentology, facies analyses, and high-quality reservoir predictions in fan deltas: A case study of the Triassic Baikouquan Formation on the western slope of the Mahu Sag in China’s Junggar Basin. Mar. Petrol. Geol. 2020, 120, 104546. [Google Scholar] [CrossRef]
  68. Yao, G.S.; Yuan, S.Q.; Wu, S.G.; Zhong, C. Double provenance depositional model and exploration prospect in the deep-water area of Qiongdongnan Basin. Petrol. Exp. Dev. 2008, 35, 685–691. [Google Scholar] [CrossRef]
  69. Sun, W. Log interpretation method and application for 3rd member of Funing formation in west slope of Qintong sag. Pet. Reserv. Eval. Dev. 2020, 10, 121–125, (In Chinese with English Abstract). [Google Scholar] [CrossRef]
Figure 1. Regional geological survey of the Qintong Sag. (a) Location and structure of the Subei Basin, China; (b) location of the Qintong Sag in the Subei Basin; (c) map showing details of the study area, including well location (wells with red dots were used for the analysis of heavy minerals and sandstone petrologic maturity), faults, profile lines (line A-A’ represents geological lines used in Figure 1d, lines B-B’, C-C’, and D-D’ represent seismic section lines used in Figure 8, Figure 9, and Figure 18a, respectively, and line E-E’ represents sedimentary facies profile lines used in Figure 18b), and location of 3D seismic survey shown in Figures 9 and 14–17; (d) the magnification of the 3D seismic survey (wells with black dots were used for the analysis of lithofacies and sedimentary facies); (e) geological profile A-A’ across the Qintong Sag [27] (see profile line location in Figure 1c).
Minerals 14 00420 g001
Figure 2. Stratigraphic column of the Qintong Sag, including chronostratigraphic ages, tectonic events, petroleum system elements, sedimentary facies, and stages of Subei Basin evolution [42].
Minerals 14 00420 g002
Figure 3. (a) Map of heavy mineral composition in the Qintong Sag showing inferred type A and type B provenances; (b) cluster analysis of heavy mineral compositions of the third Mbr of the Funing Fm samples, showing that the inferred two provenances of heavy minerals were statistically significant.
Minerals 14 00420 g003
Figure 4. Scatter plots of (a) ZTR versus Gzi; (b) Ruzi versus Ruzi; (c) ZTR versus Ruzi; (d) limonite versus magnetite; (e) magnetite versus garnet; (f) magnetite versus zircon. (g) Samples of type C, type D, and type E.
Minerals 14 00420 g004
Figure 5. Map of samples of type C, type D, and type E based on the classification of samples in Figure 4.
Minerals 14 00420 g005
Figure 6. Map of ZTR index values of the third Mbr of the Funing Fm samples in the Qintong Sag, showing inferred sediment transport directions and based on heavy minerals in Table 1.
Minerals 14 00420 g006
Figure 7. Map of sandstone petrologic maturity values of the third Mbr of the Funing Fm samples in the Qintong Sag, showing inferred sediment transport directions and, based on quartz, feldspar, and lithic fragment contents shown in Table 2 and other sandstone petrologic maturity values.
Minerals 14 00420 g007
Figure 8. The progradational seismic reflections showing sediment transport directions in the middle third member, (a) the spatial distribution of directions of the typical progradational seismic reflections; (b) possible provenance directions based on progradational seismic reflections; (c) the uninterpreted typical progradational seismic sections; (d) the local amplification and detailed interpretation of Figure 8c, where blue arrows show progradational seismic reflections; see Figure 1c for the location of the seismic section B-B’.
Minerals 14 00420 g008
Figure 9. The progradational seismic reflections showing sediment transport directions in the lower third member, (a) the spatial distribution of directions of the typical progradational seismic reflections; (b) possible provenance directions based on progradational seismic reflections; (c) the uninterpreted typical progradational seismic section; (d) the local amplification and detailed interpretation of Figure 9c, were blue arrows show progradational seismic reflections; see Figure 1c for the location of the seismic section D-D’.
Minerals 14 00420 g009
Figure 10. Sediment transport paths in the Qintong Sag, where the gray arrows show sediment transport paths and red arrows show the location of L1980, L1840, L1790, L1740, L1690, and L1640 seismic sections that have the same direction and scale; sediment transport pathways and seismic sections from east to west show that channels gradually bifurcate and disappear towards northwest.
Minerals 14 00420 g010
Figure 11. Seismic facies in the central part of the Qintong Sag, including typical seismic sections (except for Figure 11a, the seismic section scales are consistent with Figure 11i), seismic reflection features (namely, external reflection form, internal structure, dip direction, amplitude, frequency, continuity, and external reflection smoothness), and seismic lithofacies.
Minerals 14 00420 g011
Figure 12. Scatter plot of sand body thickness and mean instantaneous amplitude attribute (a) in the lower third member; (b) in the middle third member; and (c) in the upper third member. The location of the well is shown in 3D seismic survey (Figure 1c); scatter plot does not include well locations with diabase.
Minerals 14 00420 g012
Figure 13. Division marks of the depositional environment based on the lithological characteristics, well log patterns, and seismic facies.
Minerals 14 00420 g013
Figure 14. Map of (a) average seismic instantaneous amplitude attribute and (b) seismic facies of the lower third member.
Minerals 14 00420 g014
Figure 15. Map of (a) average seismic instantaneous amplitude attribute and (b) seismic facies of the middle third member.
Minerals 14 00420 g015
Figure 16. Map of (a) average seismic instantaneous amplitude attribute and (b) seismic facies of the upper third member.
Minerals 14 00420 g016
Figure 17. Map of sedimentary facies of (a) the lower, (b) middle, and (c) upper third member.
Minerals 14 00420 g017
Figure 18. Seismic and sedimentary facies profiles of the study area displaying the change in sedimentary facies characteristics from east to west. (a) seismic sections across the study area displayed the change in seismic reflections; (b) the comparison profile of the sedimentary facies the connected wells in study area displayed the change in sedimentary facies, see Figure 1c for the location of seismic and sedimentary facies profiles.
Minerals 14 00420 g018
Figure 19. Depositional model of the third Mbr of the Funing Fm of the Qintong Sag.
Minerals 14 00420 g019
Table 1. Heavy mineral content (%, by volume) of the third Mbr of the Funing Fm sample; locations of samples are shown in Figure 1c.
SampleZirconTourmalineGarnetMicaEpidoteTitaniteRutileLeuciteMagnetiteLimoniteBaritePyriteZTRRuziGzi
C29.35.448.20.100011.623.50.601.314.71.25.2
C1-112.22.552.20.1001.611.717.20.70.90.914.71.14.3
ZS116.61.539.20.50016.125.31.56.81.518.10.42.4
H232.3338.80.1001.511.25.50.47.2035.30.41.2
H421.66.158.5000084.30.500.827.70.42.7
G119.42.444.1000.21.7921.10.21.9021.80.62.3
Z217.52.159.301.30.20.513.81.32.12.1019.60.83.4
Y617.85.933.6000010.56.32.5023.323.70.61.9
Y30239.83.829.80003.213.16.82.60.8043.60.40.7
MS114.62.338.60001.113.95.27.514.30.516.912.6
CZ1-417.92.466.500.400.47.42.20.51.40.920.30.43.7
HO220.51.635.203.10.11.314.13.16.35.49.422.10.81.7
S16120.712.643.202.81.31.114.13.72.500.533.30.72.1
Table 2. Framework grain content (%, by volume) of the third Mbr of the Funing Fm samples; locations of samples are shown in Figure 1c.
WellQuartzFeldsparLithic FragmentsSandstone Petrologic Maturity
NH20178.520.11.43.55
H470.924.84.22.57
H272.320.96.82.7
C469.325.55.22.33
Y272.824.81.82.85
Z271.924.22.42.7
C161.518.321.21.63
Y67027.22.82.33
C46514.520.51.84
Disclaimer/Publisher’s Note: The statements, opinions and data contained in all publications are solely those of the individual author(s) and contributor(s) and not of MDPI and/or the editor(s). MDPI and/or the editor(s) disclaim responsibility for any injury to people or property resulting from any ideas, methods, instructions or products referred to in the content.

