Article

Dynamic Loading Characteristics of Cemented Paste Backfill with Recycled Rubber

1
Research Institute of Economies and Technology of National Energy Group, Beijing 102211, China
2
National Energy Research and Development Center of Carbon Capture, Utilization and Storage (CCUS) Technology for Coal-Based Energy, Beijing 102211, China
3
School of Management, China University of Mining and Technology (Beijing), Beijing 100083, China
4
Coal Industry Planning and Design Institute Co., Ltd., Beijing 100120, China
5
Institutes of Science and Development, Chinese Academy of Sciences, Beijing 100190, China
*
Author to whom correspondence should be addressed.
Minerals 2024, 14(6), 553; https://doi.org/10.3390/min14060553
Submission received: 29 March 2024 / Revised: 30 April 2024 / Accepted: 23 May 2024 / Published: 27 May 2024
(This article belongs to the Special Issue Mechanical and Rheological Properties of Cemented Tailings Backfill)

Abstract

:
The purpose of this study was to investigate the effect of the use of rubber powder from tire recovery on the dynamic loading performance of CPB. Finally, it is concluded that using recycled rubber material to backfill mine paste is helpful in reducing waste tire pollution and improving the impact resistance of the backfill body. The dynamic compressive strength, Dynamic Increase Factor (DIF), peak dynamic load strain, and dynamic load elastic modulus of the samples composed of slag, Portland cement, wastewater, and rubber powder were determined. Through the analysis of the experimental data, it can be seen that the recycled rubber reduces the dynamic compressive strength and DIF of the specimen but increases the peak dynamic load strain and dynamic load elastic modulus and other characteristics, and enhances the ability of the filled body to absorb elastic strain energy. The results show that recycled rubber can increase the deformation ability of the filler and improve the impact resistance of the filler. The results of this study provide valuable information and industrial applications for the effective management of solid waste based on sustainable development and the circular economy.

1. Introduction

Dynamiting is the main method for exploitation in metal mines [1]. In the process of exploiting metal ore by using the two-step open stoping method with subsequent filling, the shock generated by blasting in the second step has a great impact on the filling body of the first step [2]. Once the energy transmitted by the shock exceeds the limit of the energy that the filling body can absorb and conditions for release are present, the filling body is destroyed. This not only results in the filling body losing its original designed support and protection function, but the destroyed filling body collapses with the ore, which increases the ore dilution rate and thus increases the cost of ore dressing. Therefore, improving the impact resistance of filling bodies has always been a hot topic in the study of cemented paste backfill (CPB) [3,4,5].
The use of CPB provides benefits in dealing with solid waste and protecting the mining area environment. CPB utilizes solid waste generated by mines, mainly tailings in metal mines, and a certain amount of cementitious material, generally cement, is added to prepare a paste that is pumped into the area that needs to be filled [6]. After it solidifies, CPB plays a supporting role, ensuring the safety of the working environment of practitioners, and it can also effectively control surface subsidence [7].
Chen et al. [8] conducted impact tests on tailings backfill and found that increasing the tailings ratio, solid mass concentration, and curing age could improve the dynamic compressive strength and dynamic elastic modulus of the tailings backfill. Xue et al. [9] analyzed the dynamic mechanical behavior of fiber-reinforced backfill by using the SHPB test and a high-speed camera and determined the influence of fiber content on the DCS of backfill. Libos et al. [10] studied the effects of curing time and temperature on the constitutive behavior and mechanical properties of fiber-reinforced backfill and established a mathematical model to predict a strong correlation between the compressive strength and tensile strength of fiber and backfill. Chakilam et al. [11] evaluated the effects of polypropylene fiber length, content, and curing time on the permeability of fiber-reinforced fillers.
Yu et al. [12] studied the performance of recycled tire polymer fiber (RTPF) to strengthen the cementing paste backfill (CPB). The results showed that the fluidity of CPB enhanced by RTPF decreased with the increase in fiber content. The failure strain, unconfined compressive strength, and toughness values are generally higher than those of ordinary CPB (i.e., CPB without fiber reinforcement). However, with the increase in RTPF content, the mechanical properties of the material did not improve continuously. Guo et al. [13] studied the rheology (i.e., static and dynamic yield stress, structure accumulation), strength (i.e., uniaxial and triaxial compressive, cleavage tensile, and bending strength), microstructure, and life cycle of CTB strengthened by RTPF. They found that adding 0.6 wt% RTPF to a CTB yielded a comparable mobility and strength to an enhanced CTB with 0.3 wt% PPF, while reducing costs and improving sustainability. With the rapid development of the auto industry, the environmental issues caused by discarded automotive tires, known as “black pollution”, urgently need to be addressed [14,15,16]. Recycled rubber is the main means to solve the issue of discarded tires. In the research field of traditional cement-based composites, rubber increases the toughness, ductility, and crack resistance of materials [17]. Adding recycled rubber to the filling body can increase its toughness, deformation resistance, and energy absorption capacity. However, the disadvantage of recycled rubber is that it reduces the strength of the filling body [18,19,20].
There are few direct studies on rubber backfill at present, and there are no studies on the influence of rubber on the mechanical properties of backfill; moreover, research on the influence of rubber particles on the impact resistance of cemented tailing backfill is also scarce. Therefore, in this study, in-depth research into the mechanical properties of the filling body after adding rubber is carried out, with the aiming of contributing to the protection of mine workers and the property safety of relevant practitioners, using the backfilling method for exploitation in metal mines.

2. Materials and Methods

It is necessary to understand the basic properties of the raw materials used to produce backfilling materials, in order to determine the flow properties of filling paste and the mechanical properties of filling bodies [21,22,23]. To study the effect of rubber content on the impact resistance of filling bodies, it is necessary to determine the appropriate paste concentration, rubber particle size, and cement content of the filling paste. Therefore, orthogonal preliminary experiments were designed and conducted, with paste concentration, rubber particle size, and cement content as variables, to test the rheological properties of the filling paste [24,25,26].
It should be confirmed that the flow properties of the filling paste meet the transportation requirements of the filling process before considering its mechanical characteristics [27,28]. Generally speaking, the lower the concentration of paste, the better the flow properties. However, too low a paste concentration may lead to reduced strength due to settlement and stratification. A higher cement content results in higher strength but also poorer flow properties [29,30,31]. Therefore, rheological experiments were used to test the flow properties of filling paste, ultimately determining the appropriate paste concentration, rubber particle size, and cement content, providing a foundation for subsequent research on the effect of rubber content on the mechanical properties of CPB [32,33,34].

2.1. Materials

2.1.1. Rubber

The rubber material used in this study is 100% vulcanized recycled rubber powder, which is mainly derived from discarded tires and is obtained by crushing discarded tire rubber at room temperature [35,36,37]. Since the preparation of rubber powder mainly utilizes mechanical shearing and extrusion, the rubber particles are irregular, with angular dark particles in a torn state. A stereomicroscope image of the rubber powder used in this study is shown in Figure 1.
The particle-size distribution of the rubber powder particles after sieving is shown in Table 1. It can be observed in Table 1 that the particle size of the rubber powder particles is between 0 and 1.65 mm. The bulk density of the rubber powder was also measured, and the results revealed a range from 0.35 to 0.40 kg/dm3.

2.1.2. Tailings

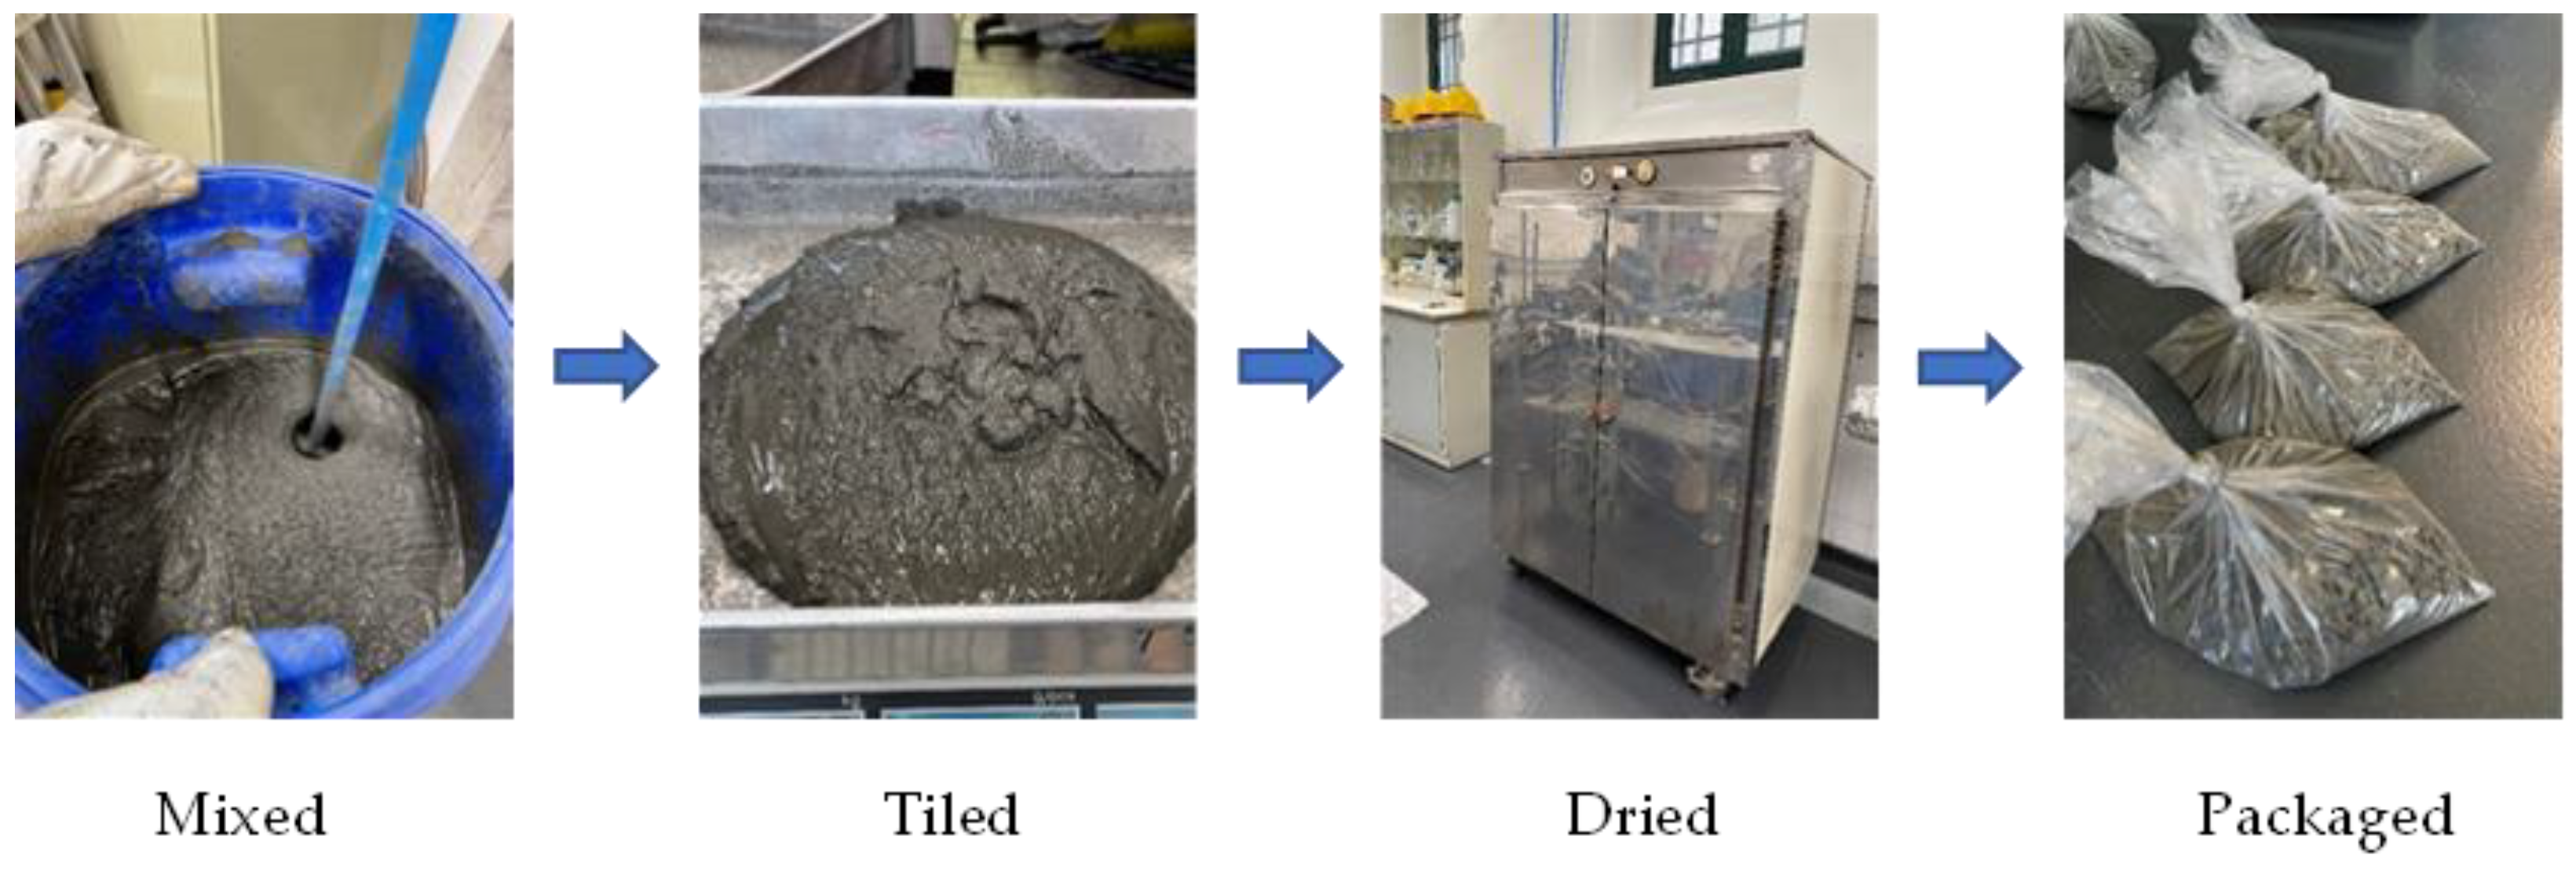
Tailings, as the aggregate in the backfilling paste, have a significant effect on both the flow properties of the paste and the strength of the filling body due to their composition and grading [9,38,39,40]. The tailings used in this study were collected from a copper–zinc mine in southern Portugal. The tailings were unclassified full tailings collected through a disc filter in the ore-washing plant. The tailings were transported to the laboratory in buckets for preprocessing to ensure homogeneity and a uniform particle-size distribution. The tailings were mixed, dried, and packaged in sealed bags for future use. The preprocessing procedure is shown in Figure 2.
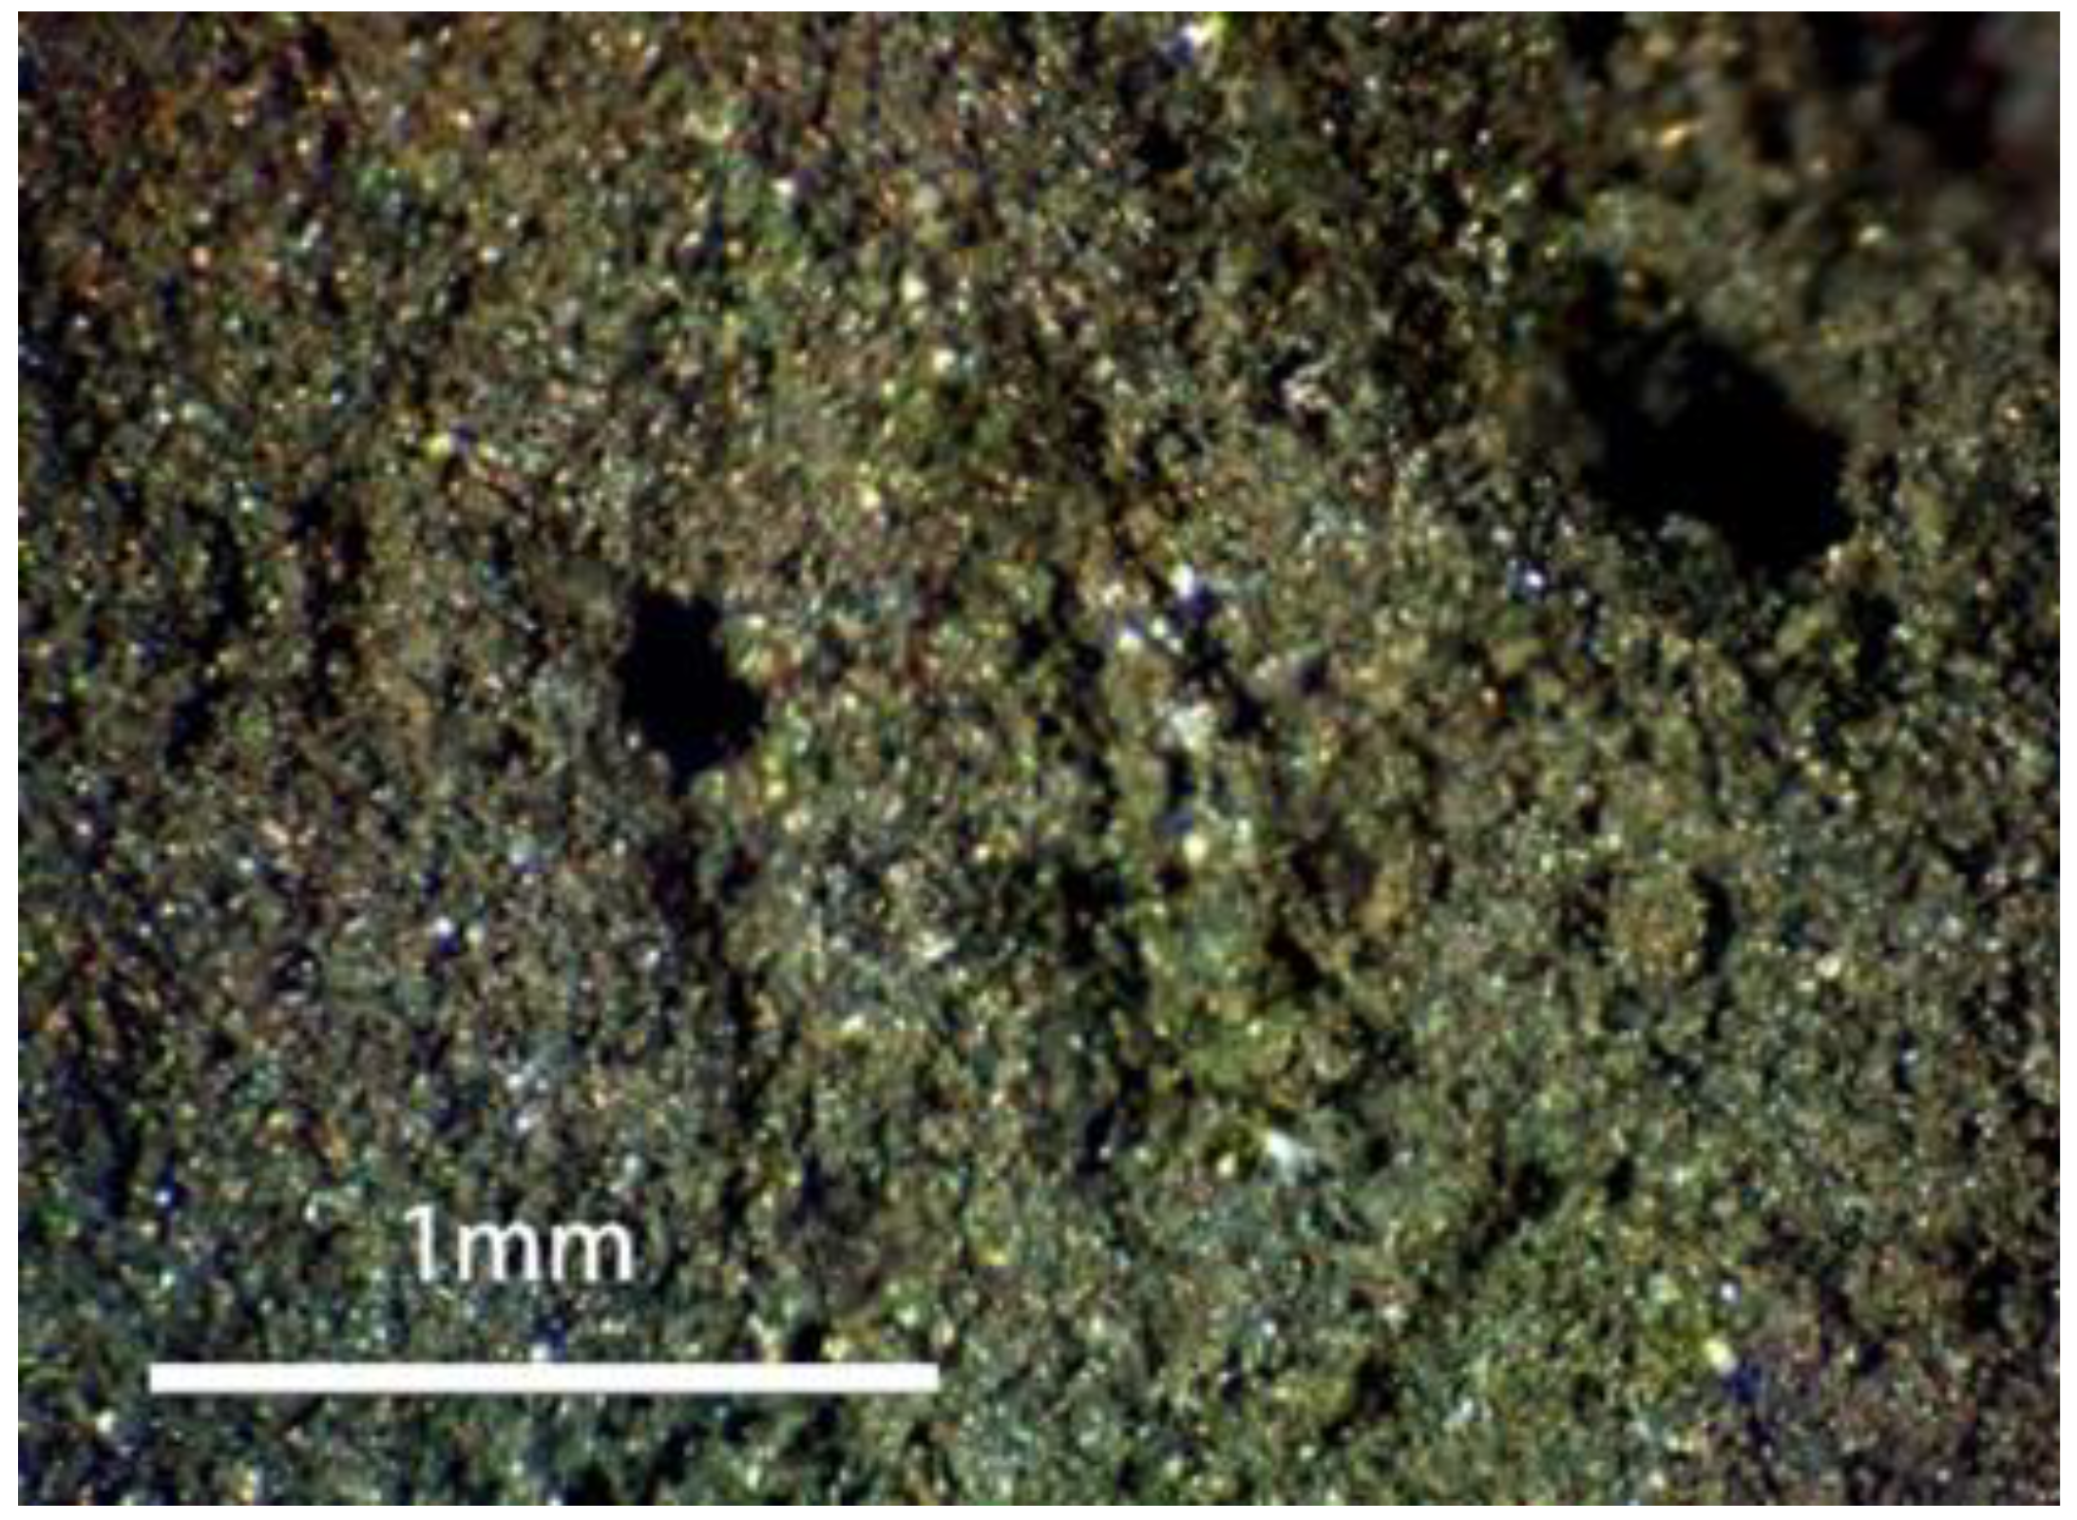
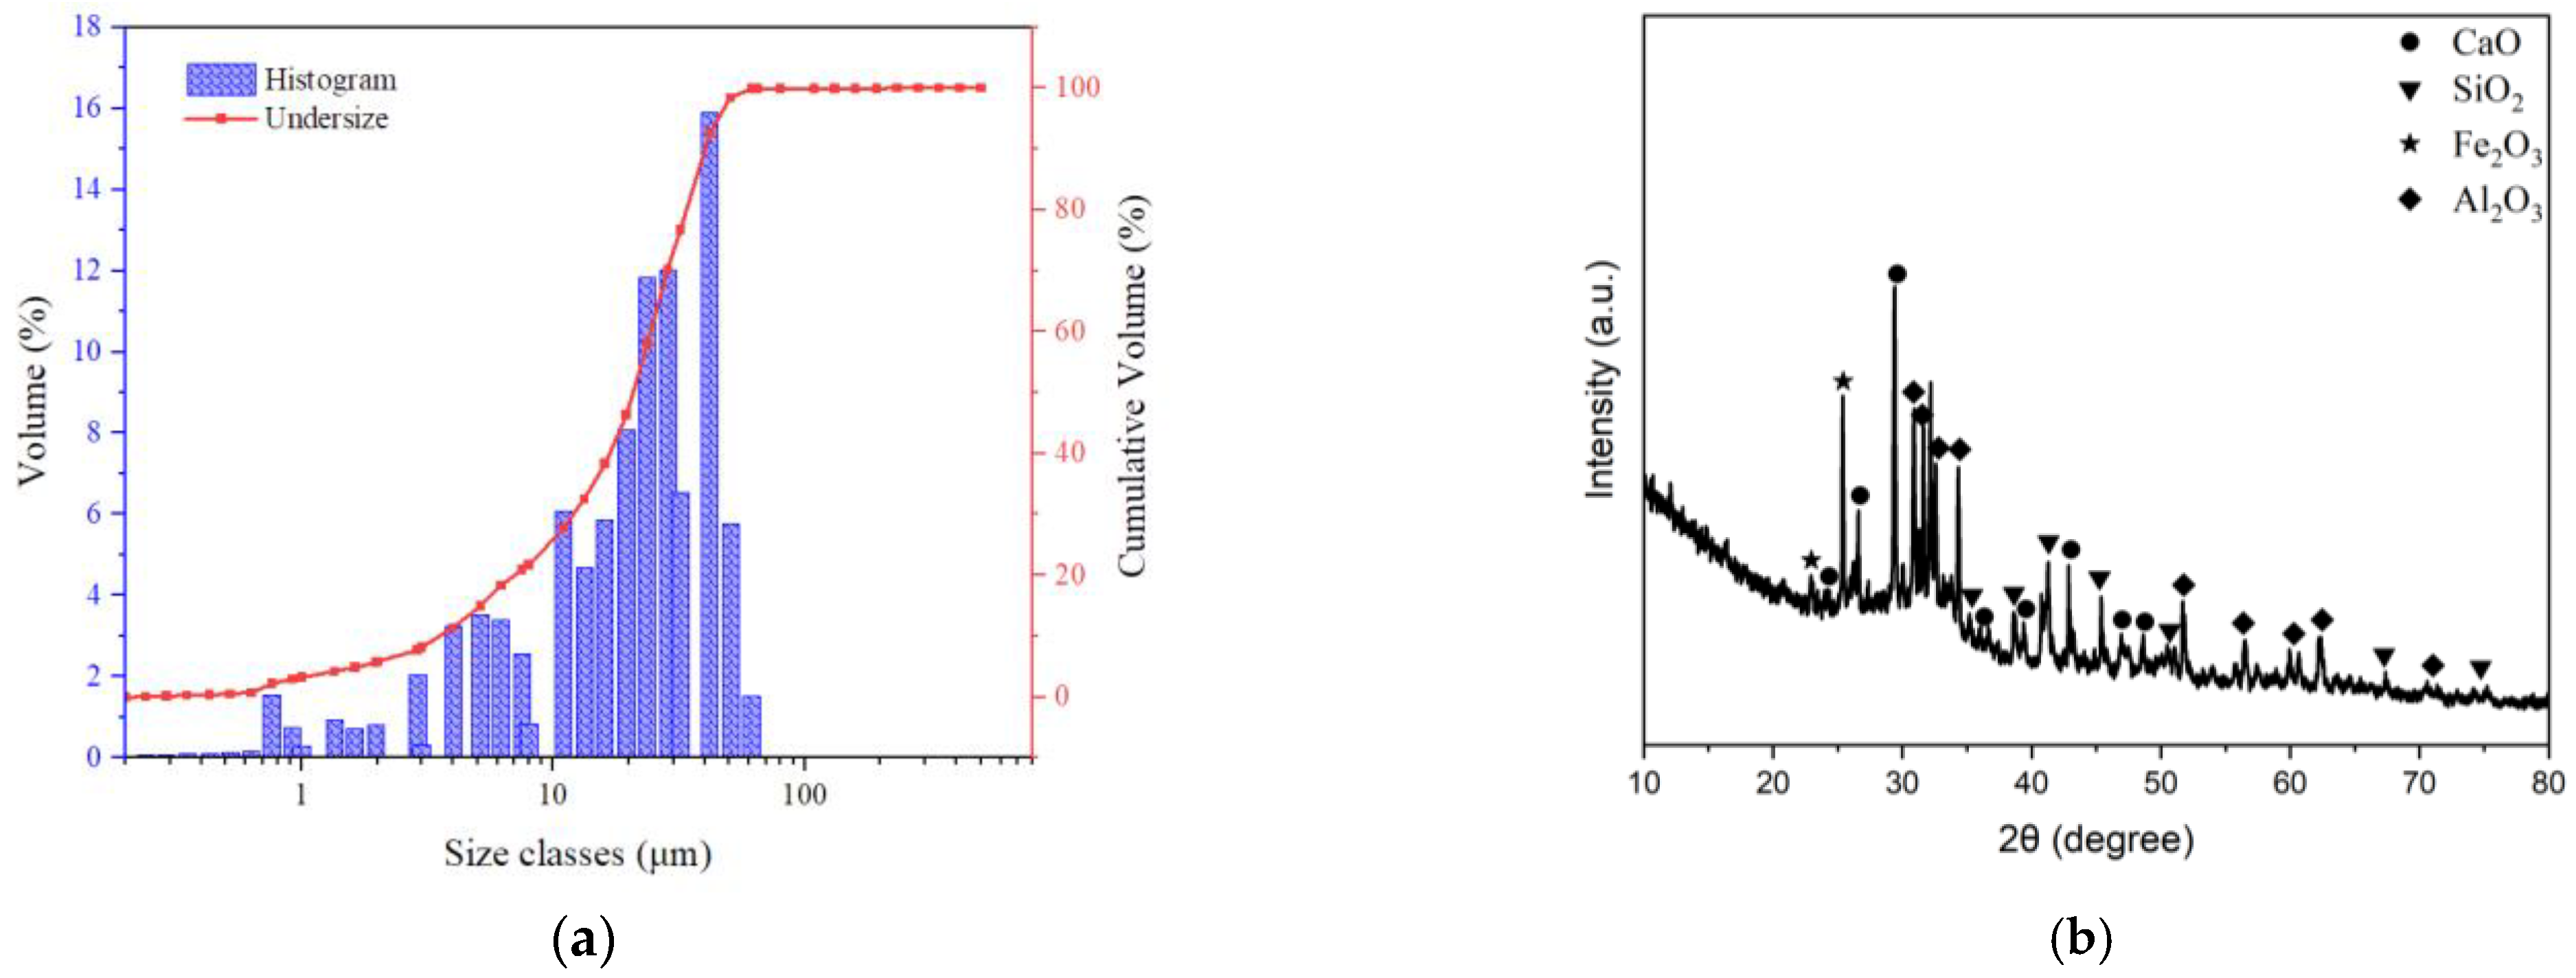
The surface morphology and particle-size distribution of the tailings were analyzed by stereomicroscope (Nikon SMZZ645 with digital camera MOTICAM 10 MP) and laser particle-size analyzer (MS2000). The results are shown in Figure 3 and Figure 4a.
According to the results of the stereomicroscope experiment, the tailings appeared yellowish-brown and contained sheet-like reflective crystals. The laser particle-size analysis revealed that the particle size of the tailings ranged from 0.3 to 355 μm (μm). The specific surface area was 425 m2/kg. The span of the particle size was 3.122, with D[3:2] = 14.1 μm, D[4:3] = 62.2 μm, D10 = 6.63 μm, D30 = 23.8 μm, and D60 = 57.8 μm. Based on the classification of tailings based on particle-size distribution, the tailings used in the experiment belonged to fine tailings.
The mineral composition of the tailings was analyzed using an XRD diffractometer, and the results are shown in Figure 4b. The tailings were mainly composed of pyrite, quartz, chlorite, and dolomite.

2.1.3. Cement

The cementitious material used in this study was #425 high-early-strength cement. The particle-size distribution of the cement is shown in Figure 5a. The particle size of the cement ranged from 0.2 to 233.1 μm (μm), with a specific surface area of 527 m2/kg. The span of the particle size was 1.77, with D[3:2] = 7.12 μm, D[4:3] = 21.2 μm, D10 = 3.52 μm, D30 = 12.09 μm, and D60 = 24.28 μm.
The XRD diffraction pattern of the cement is shown in Figure 5b. The main components of the cement include calcium oxide (CaO), silicon dioxide (SiO2), aluminum oxide (Al2O3), and iron (III) oxide (Fe2O3). The main minerals in Portland cement are tricalcium silicate (C3S), dicalcium silicate (C2S), tricalcium aluminate (C3A), and tetracalcium aluminoferrite (C4AF).

2.2. Methods

2.2.1. Uniaxial Compressive Strength Test

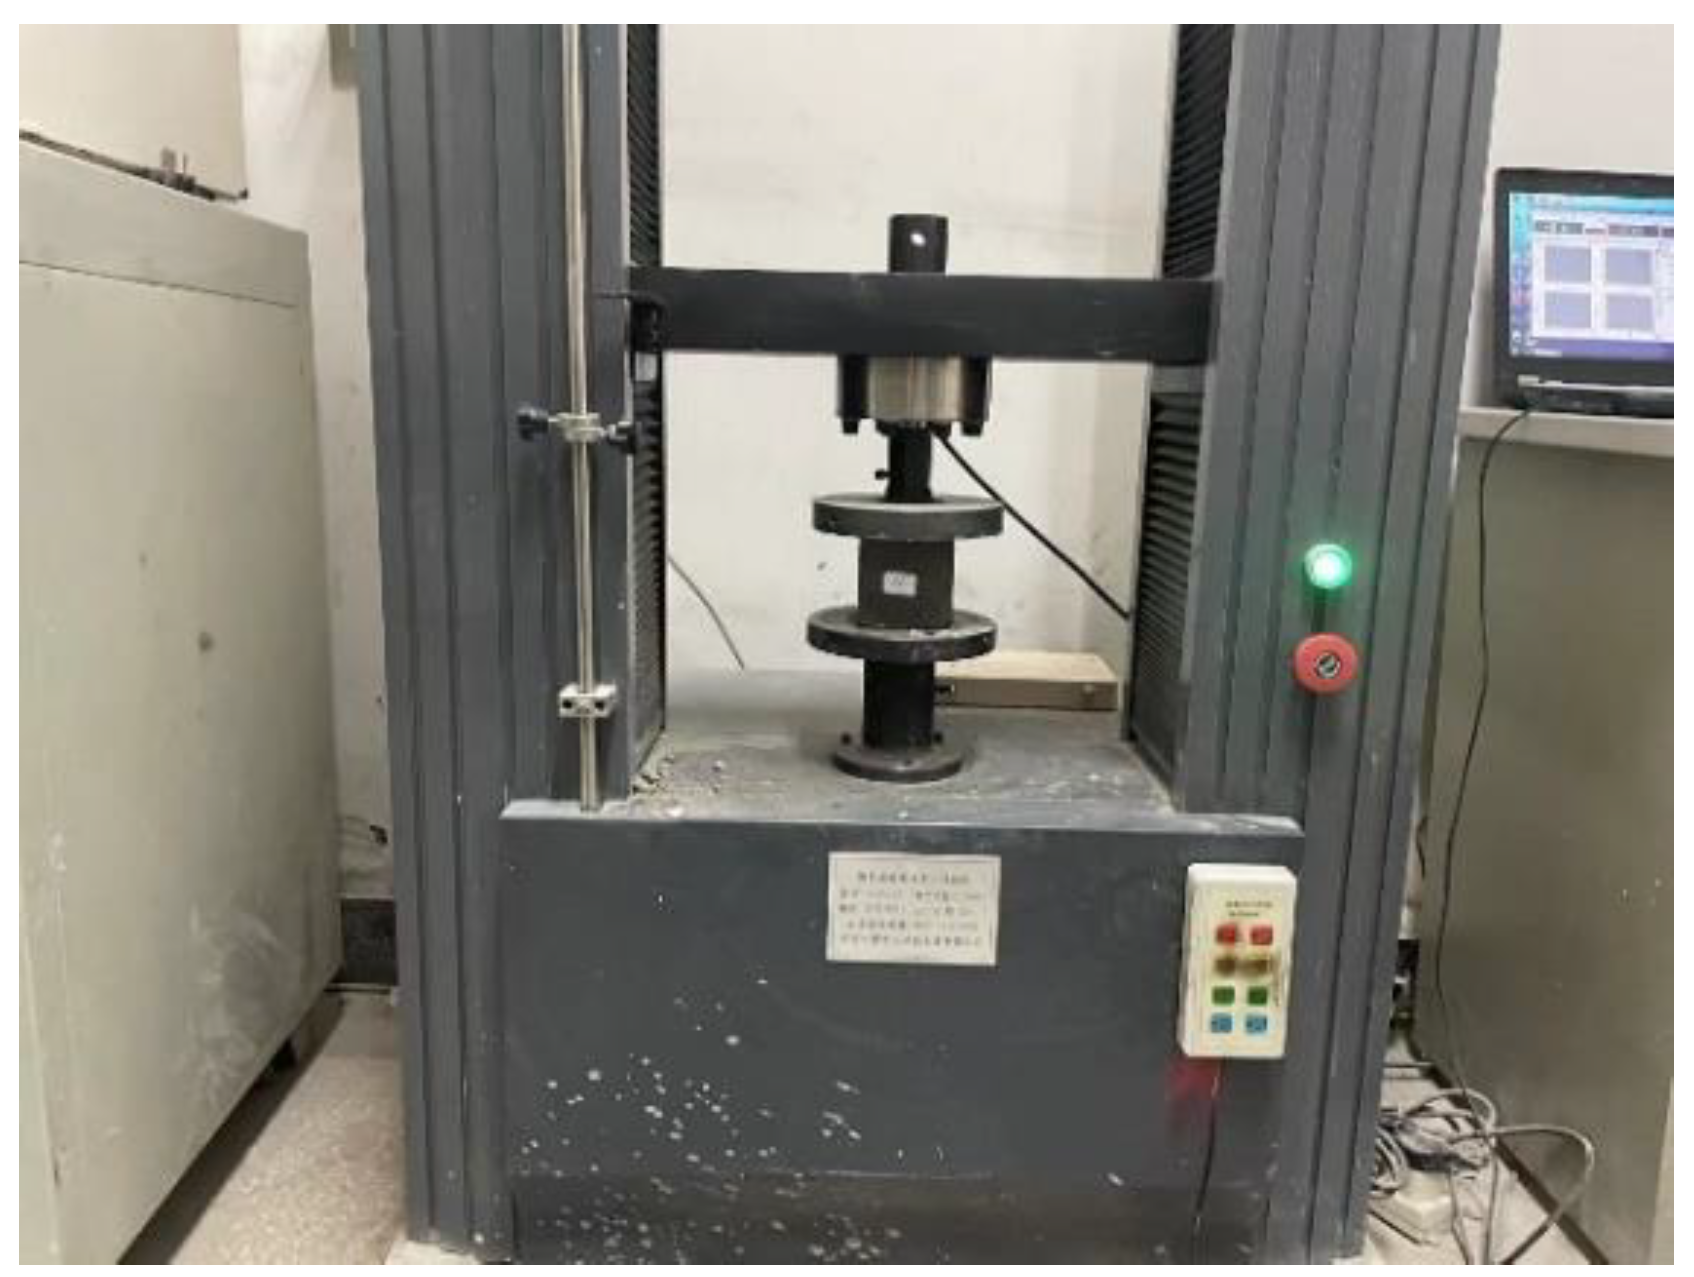
The uniaxial compressive strength (UCS) test machine is one of the most important devices to determine the relevant parameters of the static characteristics of backfill. Figure 6 shows the UCS-testing machine (TYE-50) used in the experiment in this study. The UCS of backfill can be measured using the UCS-testing machine. The UCS of the filling body was obtained by testing according to the Chinese standard GB/T 50081-2019.
The experimental steps of the UCS test are as follows:
(a)
Polish the upper surface of the specimen required for the UCS test so that the upper and lower surfaces are parallel, to ensure that the stress distribution of the specimen is balanced during the process of loading;
(b)
Adjust the bearing head so that the upper part of the specimen and the testing machine are fully fitted, to ensure that the specimen is evenly stressed. Zeroing of the parameters is carried out using the control system;
(c)
Start the experiment and carry out a uniaxial compression test on the specimen at a loading speed of 0.2 mm/min until the specimen is damaged;
(d)
Record the experimental data, draw the stress–strain process curve of the specimen, and calculate the UCS of the specimen. The calculation formula is shown in Equation (1):
P = F R 2
where P is the uniaxial compressive strength of the backfill, kPa; F is the load on the backfill when it is damaged, kN; and R is the side length of the specimen, dm.

2.2.2. Split-Hopkinson Pressure Bar Test

The dynamic testing of CPB was conducted using the Split-Hopkinson Pressure Bar (SHPB) test [41,42,43].
(1)
Experimental Principle
In the SHPB experiment, three basic assumptions need to be satisfied:
(a)
The stress wave in the bar is a one-dimensional stress wave. This condition can be achieved by controlling the dimensions of the bar, and, typically, the bars are designed with the same diameter.
(b)
To minimize wave distortion caused by dispersion, the diameters of the SHPB test bars and the specimen should not be too large compared with the wavelength of the applied load pulse.
(c)
The stress uniformity assumption is satisfied within the specimen, meaning that the stress transmitted within the specimen is uniform in magnitude from the perspective of the specimen’s scale.
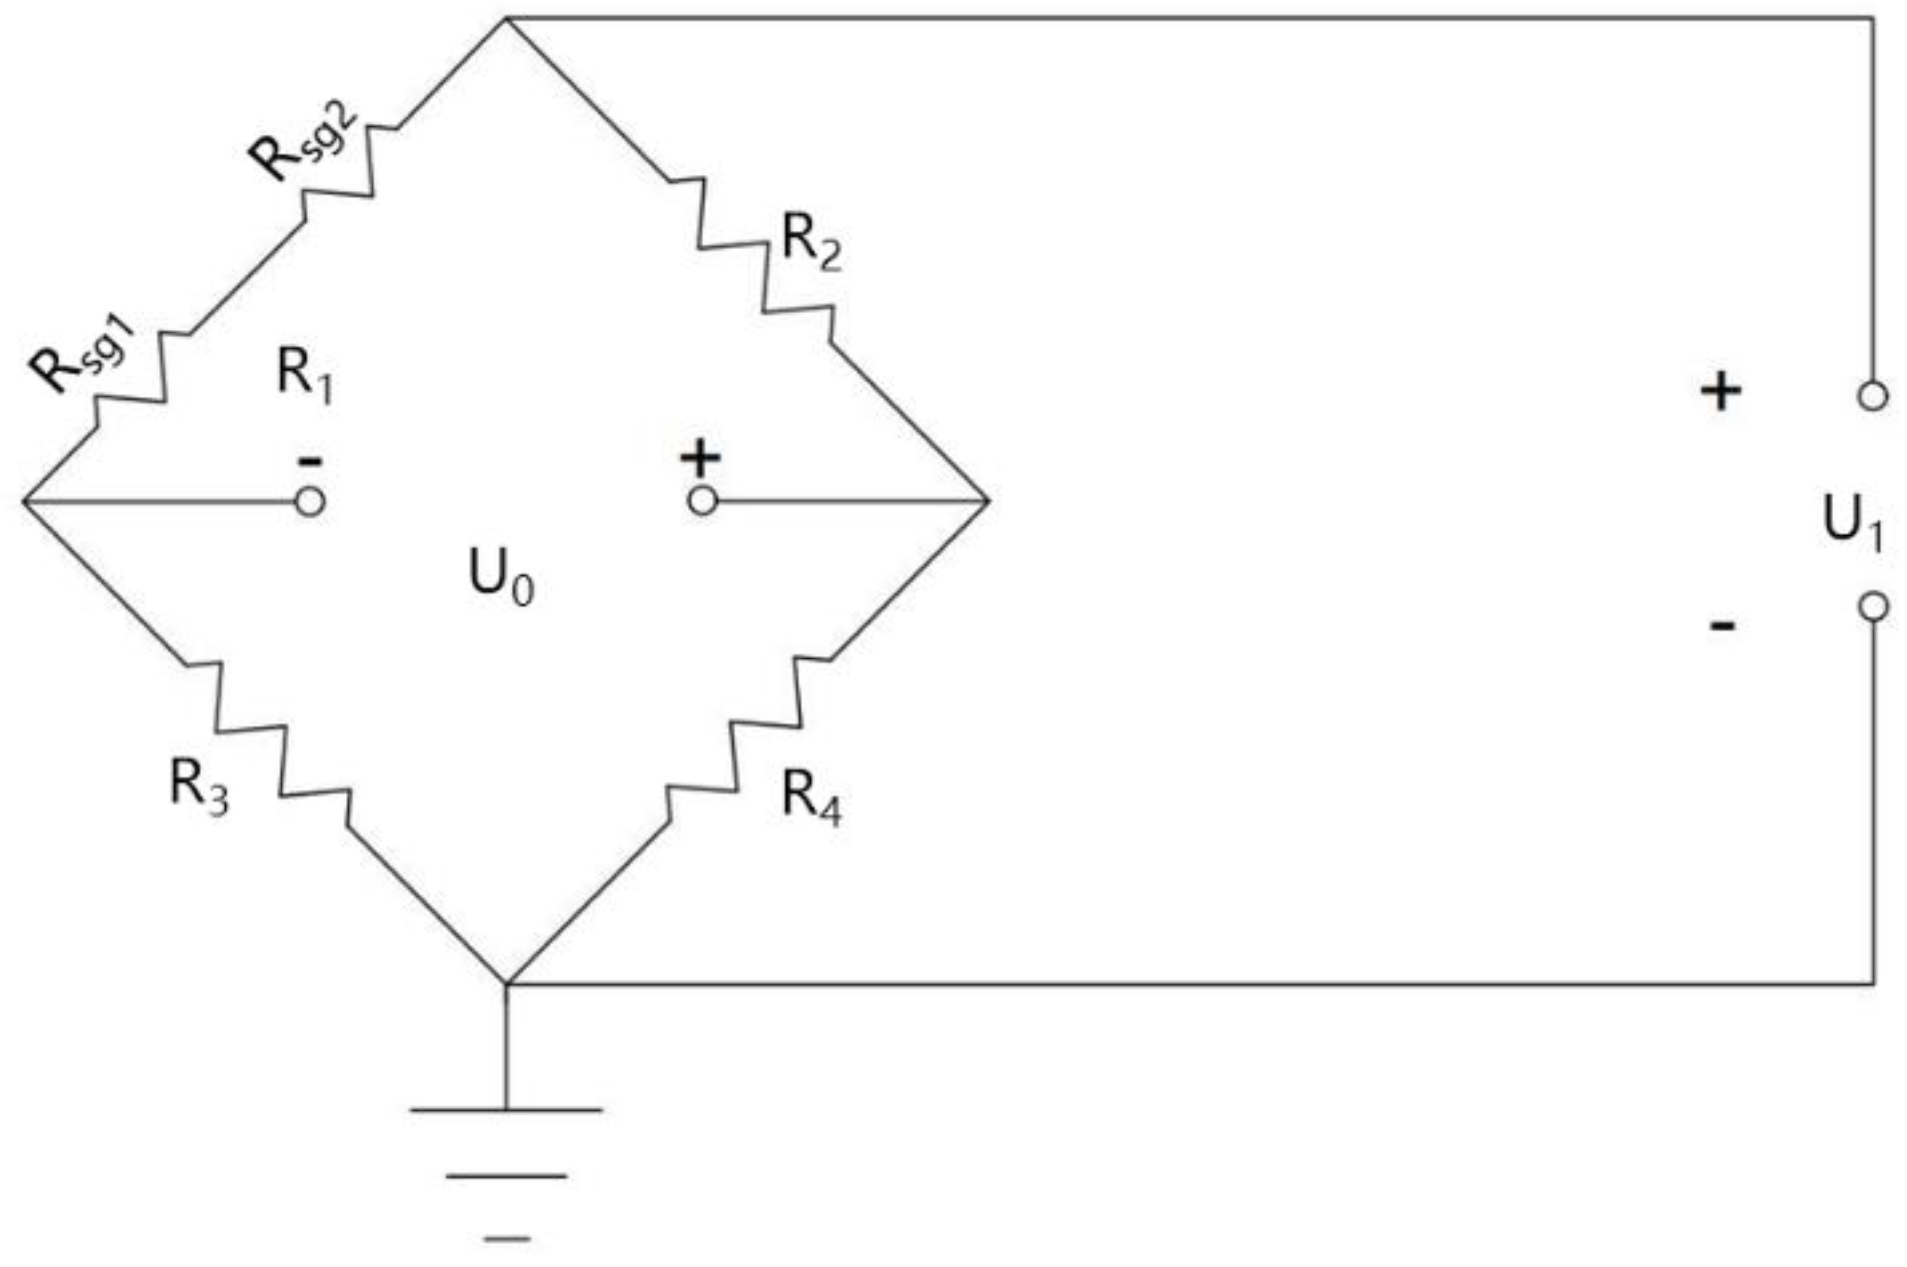
In the SHPB test, the stress inside the rod is measured by a strain gauge, and then the data are recorded and collected by a data collector with a signal amplification function. The signal amplifier amplifies the signal using the Wheatstone 1/4 bridge. Figure 7 shows the schematic diagram of the Wheatstone 1/4 bridge, where R s g 1 = R s g 2 = R s g . Then, the resulting expression is as follows:
R 1 = 2 R s g
R 2 = R 3 = R 4 = R
The sensitivity coefficient of the strain gauge is defined as follows:
G F = Δ R R 1 ε
Then, the resulting expression is as follows:
R = 2 R sg
When impacted, the resistance on each gauge is 0.5   Δ R .
R 1 = R + Δ R
The output voltage of the Wheatstone bridge is calculated using Equation (7).
U 0 = 1 2 1 2 + Δ R R U 1
Substituting Equation (7) for Equation (4), the rod strain is as follows:
ε = 4 U 0 G F U 1
The incident rod used in the test is a pure aluminum rod with an elastic modulus of 72,000 MPa and a longitudinal wave velocity of 5000 m/s. The elastic modulus of the aluminum rod is much smaller than that of the 40Cr alloy steel, which has an elastic modulus of 206,000 MPa.
Based on the one-dimensional elastic stress wave theory, the displacement relationship between the bar and the specimen end face can be obtained as follows:
D 1 = c 0 0 t   ε i ε r d t
D 2 = c 0 0 t     ε t d t
where D 1 is the displacement of the end face between the specimen and the incident bar; D 2 is the displacement of the end face between the specimen and the transmission rod; c 0 is the elastic wave velocity in the pressure rod; ε i is the strain corresponding to the incident wave; ε r is the strain corresponding to the reflected wave; and ε t is the strain corresponding to the transmitted wave.
Assuming that the original length of the sample is l 0 , the average strain in the sample is as follows:
ε t = D 1 D 2 l 0 = c 0 l 0 0 t   ε r ε r ε r d t
The average strain rate obtained using Equation (11) is as follows:
ε = c 0 l 0 ε t ε r ε t
where l 0 is the length of the specimen.
The pressure between the specimen and the contact surfaces of the incident and transmission rod are, respectively, as follows:
F 1 = A E ε r + ε r
F 2 = A E ε 1
where F 1 is the pressure of the contact surface of the incident rod; F 2 is the contact surface pressure of the transmission rod; A is the section area of the member; and E is the elastic modulus of the member.
When the two ends of the specimen are balanced, the result is as follows:
F 1 = F 2
According to Equations (13) and (14), the following expression can be obtained:
ε r + ε r = ε t
Moreover, applying Equation (16) results in the following expression:
σ = A E A 0 ε t
where A 0 is the section area of the specimen.
ε = 2 c 0 l 0 0 t     ε r d t
ε = 2 c 0 l 0 ε r
The stress, strain, and average strain rate of the material can be obtained by combining Equations (17)–(19) according to the recorded data of the strain gauge on the incident rod and transmission rod in the SHPB test.
The strain gauges in the incident bar measure the incident wave and reflected wave, while the strain gauges in the transmitted bar measure the transmitted wave [44,45,46].
The energy calculation formula is as follows:
W I = c B A B E B σ I 2 t d t
W R = c B A B E B σ R 2 t d t
W T = c B A B E B σ T 2 t d t
where W I is the incident energy, J ; W R is the reflection energy, J ;   W T is the transmission energy, J ; t is time, s ;   c B is the wave velocity of the pressure rod, m s ;   A B is the cross-sectional area, m 2 ; E B is elastic modulus, G P a ;   σ I is the incident stress, M P a ;   σ R is the reflection stress, M P a ;   a n d   σ T is the transmission stress, M P a .
According to the law of conservation of energy, the absorbed energy W A during the SHPB test can be calculated using the following formula:
W A = W I W R W T
(2)
Test apparatus
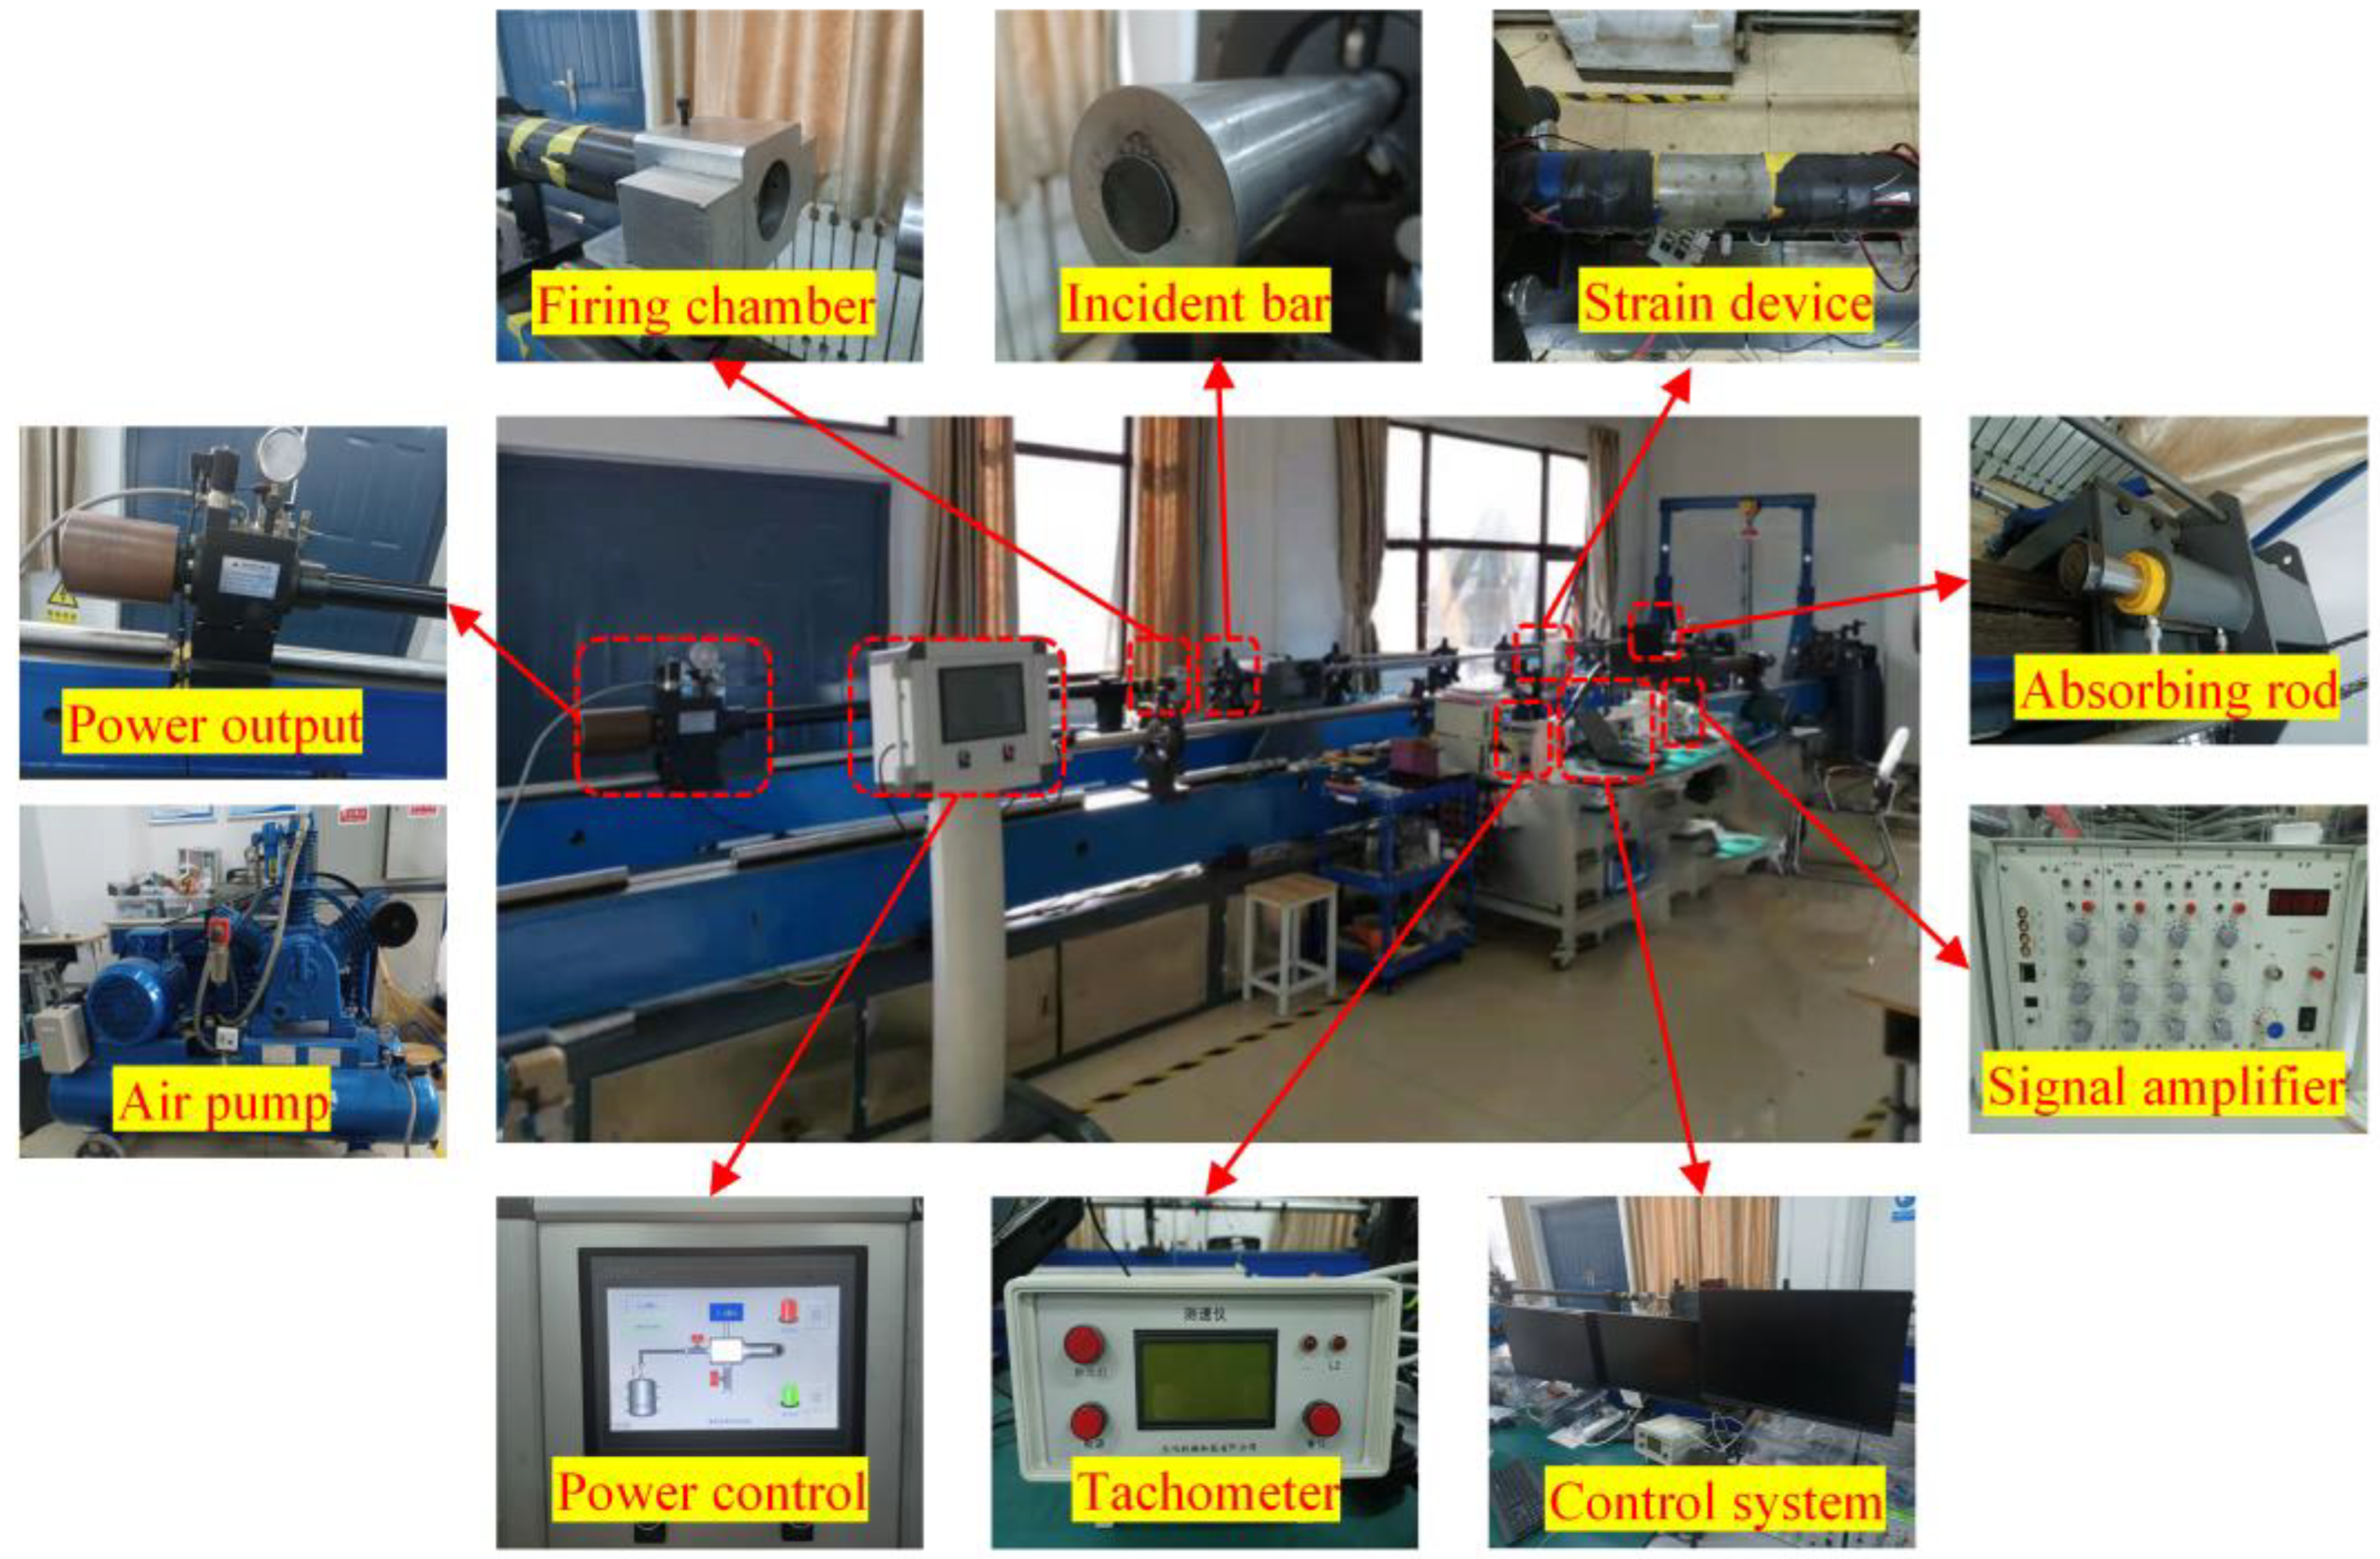
To obtain the dynamic characteristic parameters of the rubberized cemented paste backfill (RCPB), dynamic testing of the RCPB was conducted using the SHPB test setup shown in Figure 8. The SHPB test setup mainly consists of a power system, a bullet-launching system, a bar system, a velocity measurement device, a control system, and a signal acquisition system.
In the power system, compressed air stored in an air pump is used to propel the impact bullet, causing it to collide with the incident bar at a preset speed [47,48,49]. A rubber sheet is placed at the end of the incident bar to adjust the wave shape, and the rubber sheet and incident bar are bonded with Vaseline. The strain gauges are attached to the middle sections of the incident and transmitted bars, at equal distances from the specimen. The strain gauges used are high-sensitivity semiconductor strain gauges (BE120-3AA-P200) with a sensitivity coefficient of 2.22. Due to the relatively high wave impedance of rubber, the strain gauges in the transmitted bar employ ultra-high-sensitivity semiconductor strain gauges (SB3.8-120-P-2) with a sensitivity coefficient of 110.

2.2.3. Preparation of Specimen

To investigate the effect of rubber on the impact resistance of CPB, an experiment was designed to vary the amount of rubber mixed into the paste. Based on a literature review and preliminary experiments, the rubber content was determined to be 0%, 1%, 3%, 4%, 5%, and 7%, with a cement content of 5% and a slurry concentration of 73.8% (with minor adjustments made to the concentration based on specific conditions). In the experiment, the increased mass of rubber was replaced with tailings, and the experimental ratios are shown in Table 2. The paste was prepared according to the experimental ratios, and relevant dynamic loading tests were conducted.
The specimens for impact testing were prepared using a cylindrical mold with a diameter of 50 mm and a height of 10 mm. The preparation process for the slurry was as follows:
(a)
The raw materials were weighed according to the design table, as shown in Table 2.
(b)
The solid materials were poured into a mixing container and stirred at a speed of 75 r/min for 2 min.
(c)
Water was poured into the mixing container and stirred at a speed of 75 r/min for 5 min.
Next, the paste was poured into an oil-coated mold and vibrated during the casting process. The mold and paste were allowed to cure for 24 h until they solidified, and then the specimens were de-molded. To simulate the underground paste environment, the specimens were cured in a curing box (YH-40B) at a temperature of (25 ± 2) °C and a humidity greater than 90%. After reaching the specified curing times (7 and 28 days), the specimens were taken out for testing. Three samples were tested for each batch, and the results were averaged [50,51]. The process of specimen preparation is shown in Figure 9.

3. Results and Analysis

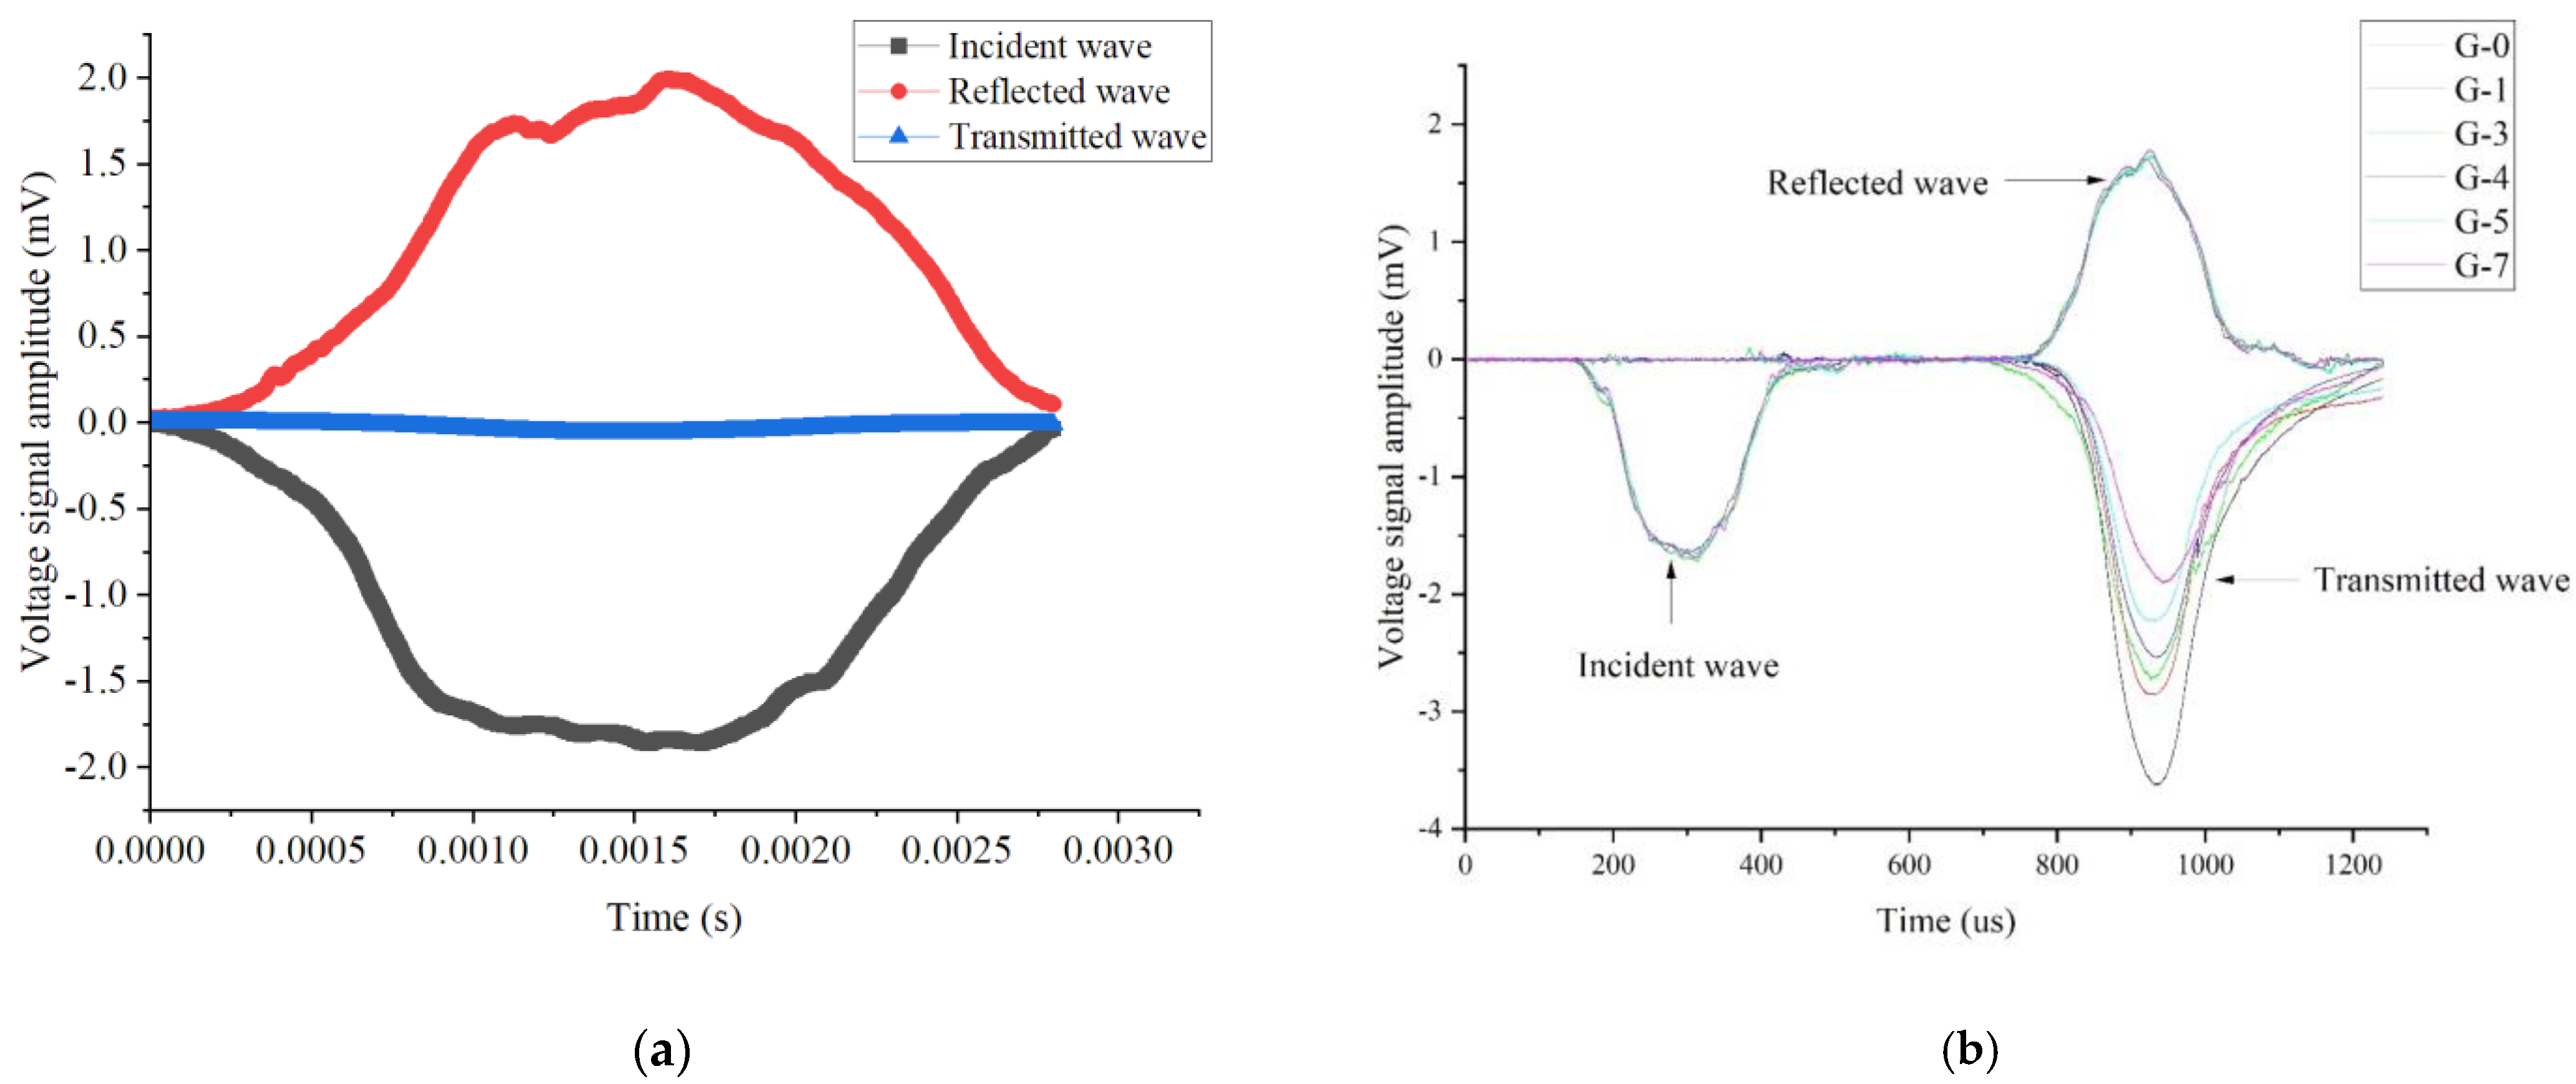
When the SHPB test reaches an ideal dynamic equilibrium, the sum of the incident wave and the reflected wave is equal to the transmitted wave, satisfying the assumptions of the one-dimensional stress wave propagation theory [52]. Figure 10a demonstrates the relationship between the amplitude values of the incident wave, reflected wave, and transmitted wave signals with a rubber content of 4%. Based on the original waveform diagram, it can be observed that the stress wave curve received by the incident bar is the sum of the incident wave and the reflected wave, while the stress wave curve at the end of the transmitted bar is the transmitted wave. The relationship between stress and time in the pressure bars at both ends of the specimen can be obtained by superimposing the incident wave and reflected wave.
In Figure 10a, it can be observed that the amplitudes of the incident wave and reflected wave are approximately equal and in opposite directions. Compared with those of the incident and reflected waves, the amplitude of the transmitted wave is significantly smaller.
Figure 10b shows the original waveform diagrams of rubber-filled specimens under different impact speeds. An analysis of the images revealed that the amplitudes of the incident wave and reflected wave are similar in magnitude but opposite in direction. Due to the small amplitude of the transmitted wave, the transmitted signal is amplified 55 times compared with the incident signal. The small amplitude of the transmitted wave indicates that less stress wave energy is received by the transmission bar after passing through the composite specimen. Only a small portion of the energy penetrates the specimen, while the majority of the stress is reflected. This suggests that, during impact testing, the higher the rubber content of RCPB, the higher the amplitude of the reflected wave and the smaller the amplitude of the transmitted wave. This indicates that less stress and energy penetrate RCPB.

3.1. Dynamic Compressive Strength of RCPB

The dynamic compressive strength of RCPB was calculated based on the principles of impact testing and the amplitude data collected by strain gauges. When the impact speeds were similar, the same aggregate, binder, and rubber type were used, and the results were averaged. Table 3 presents the statistical results of the dynamic compressive strength of RCPB.
To demonstrate the relationship between the dynamic strength of RCPB and the rubber content, as well as the impact speed, the dynamic compressive strength results of the rubber-filled body were plotted and are shown in Figure 11a,b.
Figure 11a shows the change in dynamic compressive strength of RCPB with rubber content at different impact speeds. At the same impact speed, as the rubber content increases, the dynamic compressive strength of RCPB decreases. This result is consistent with the static compressive strength results. This is because the hydrophobic nature of rubber leads to poor bonding between the rubber and the RCPB matrix, resulting in a weak structural interface. This weak interface structure causes the dynamic compressive strength of RCPB to decrease as the rubber content increases.
Figure 11b illustrates the relationship between the dynamic compressive strength and average strain rate of RCPB with different rubber content. It can be observed that, when the rubber content is the same, the higher the average strain rate, the higher the dynamic strength of RCPB. This result also aligns with the strain rate effect of RCPB. As shown in Figure 11b, for CPB without rubber, when the average strain rate increases from 40.16 s−1 to 118.55 s−1, the dynamic strength increases by 108%. By increasing the impact speed, the dynamic compressive strength of RCPB increases. When the rubber content is 4%, the dynamic strength increases by a maximum of 213%. This indicates that the impact of rubber content on the degree of strength first increases and then decreases. When the rubber content is around 4%, it reaches the maximum value, and the degree of increase is the highest.

3.2. Dynamic Strength Enhancement Factor and Strain Rate Effect

Due to the use of pressure-controlled bullet launch speeds in the SHPB test employed by the research institute, it was not possible to ensure complete consistency in impact speeds. Instead, bullet velocities were measured using an infrared speed tester, and strain gauge data were utilized to calculate the average strain rate of the specimen during dynamic impact loading.
In dynamic research, the Dynamic Increase Factor (DIF) is often referenced to reflect the increase in dynamic compressive strength relative to the static compressive strength of RCPB. The formula for calculating the DIF is shown in Equation (24):
D I F = f d P
where f d is the dynamic strength and P is the static strength.
Based on Equation (5), the DIF of RCPB can be calculated. The calculated results are summarized in Table 4.
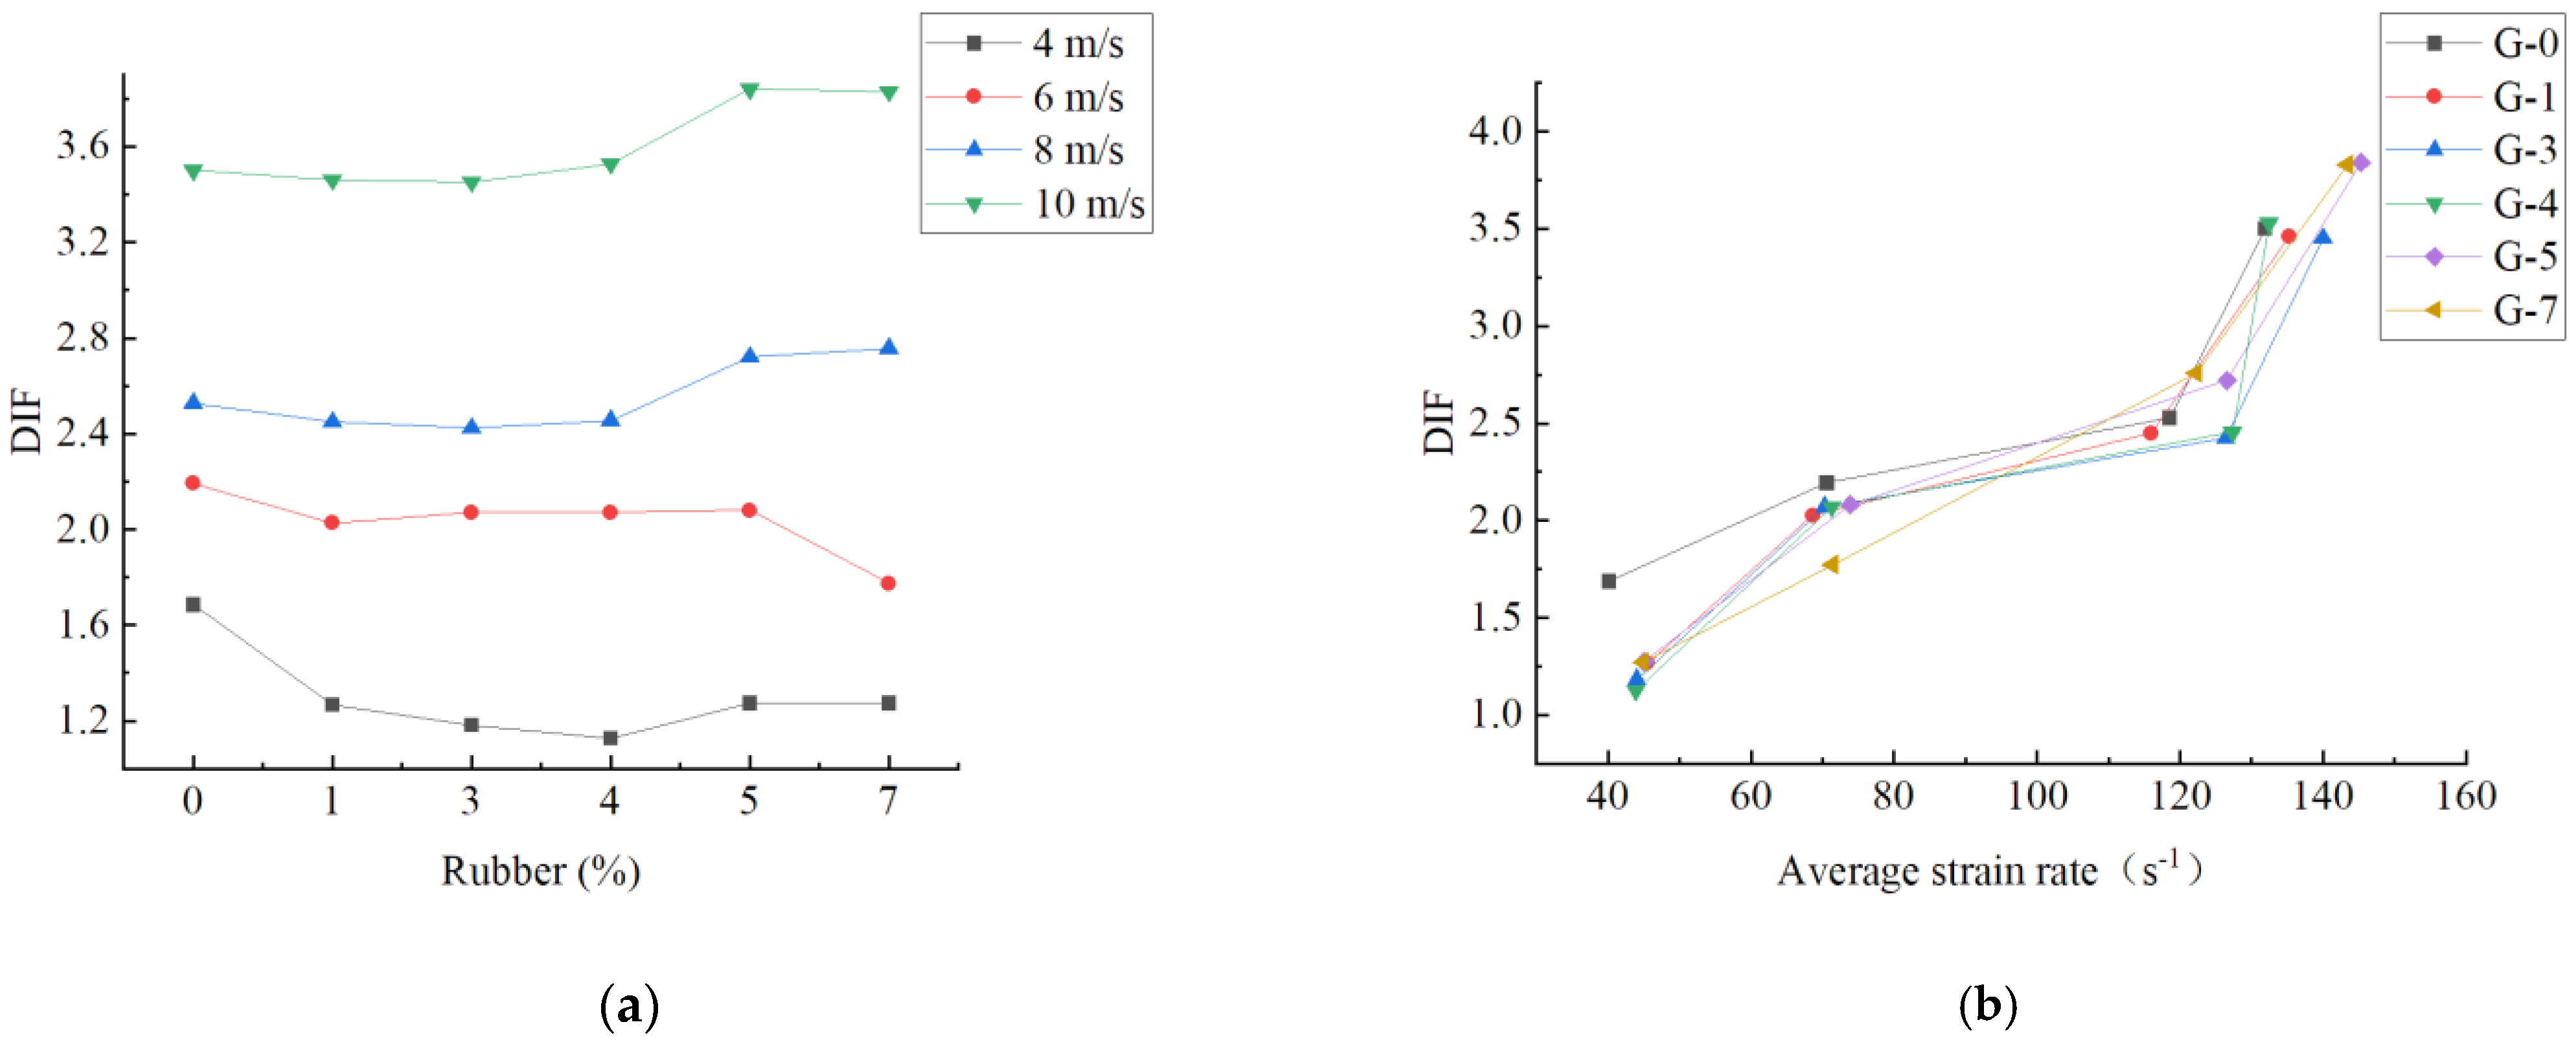
The relationship between the dynamic strength enhancement factor of RCPB and the rubber content and impact speed is plotted in Figure 12a.
It can be observed in Figure 12a that the relationship between the dynamic enhancement factor of RCPB and the rubber content is not completely the same at different impact speeds. At the same impact speed, as the rubber content increases, the dynamic enhancement factor of RCPB generally follows a trend of first decreasing and then slightly increasing. This is because the performance of rubber in dynamic loading differs depending on the rubber content.
Figure 12b shows the curve of the dynamic strength enhancement factor of the cemented filling body when the average strain rate ranges from 40.16 to 148.42 s−1. When the rubber content is constant, as the impact speed increases, the dynamic strength enhancement factor of RCPB also increases, indicating that the growth rate of the dynamic strength increases with the increase in impact speed. When the average strain rate is relatively low at 40.16 s−1, the DIF of RCPB is 1.69. When the average strain rate exceeds 70 s−1, the DIF starts to be greater than 2. As the average strain rate increases, the DIF also increases, reaching a maximum of 3.84. The results indicate that, under dynamic loading, the dynamic strength enhancement factor of the cemented filling body increases with the increase in average strain rate, indicating that the rubber-doped filling body exhibits a significant strain rate effect.

3.3. Peak Dynamic Load Strain of RCPB

By calculating the amplitude signal of the strain gauge during the dynamic loading process of RCPB, the dynamic stress–strain curve of RCPB can be obtained. The dynamic peak strain of RCPB corresponds to the dynamic compressive strength, and the dynamic peak strain of RCPB can be obtained from the dynamic stress–strain curve. Table 5 presents the calculated results of the dynamic peak strain and the dynamic peak strain growth factor of RCPB. The calculation method of the dynamic peak strain growth factor of RCPB is similar to that of the dynamic strength growth factor, and the calculation formula is shown in Equation (25):
D I F ε = ε d ε
where ε d is the dynamic peak strain and ε is the static peak strain.
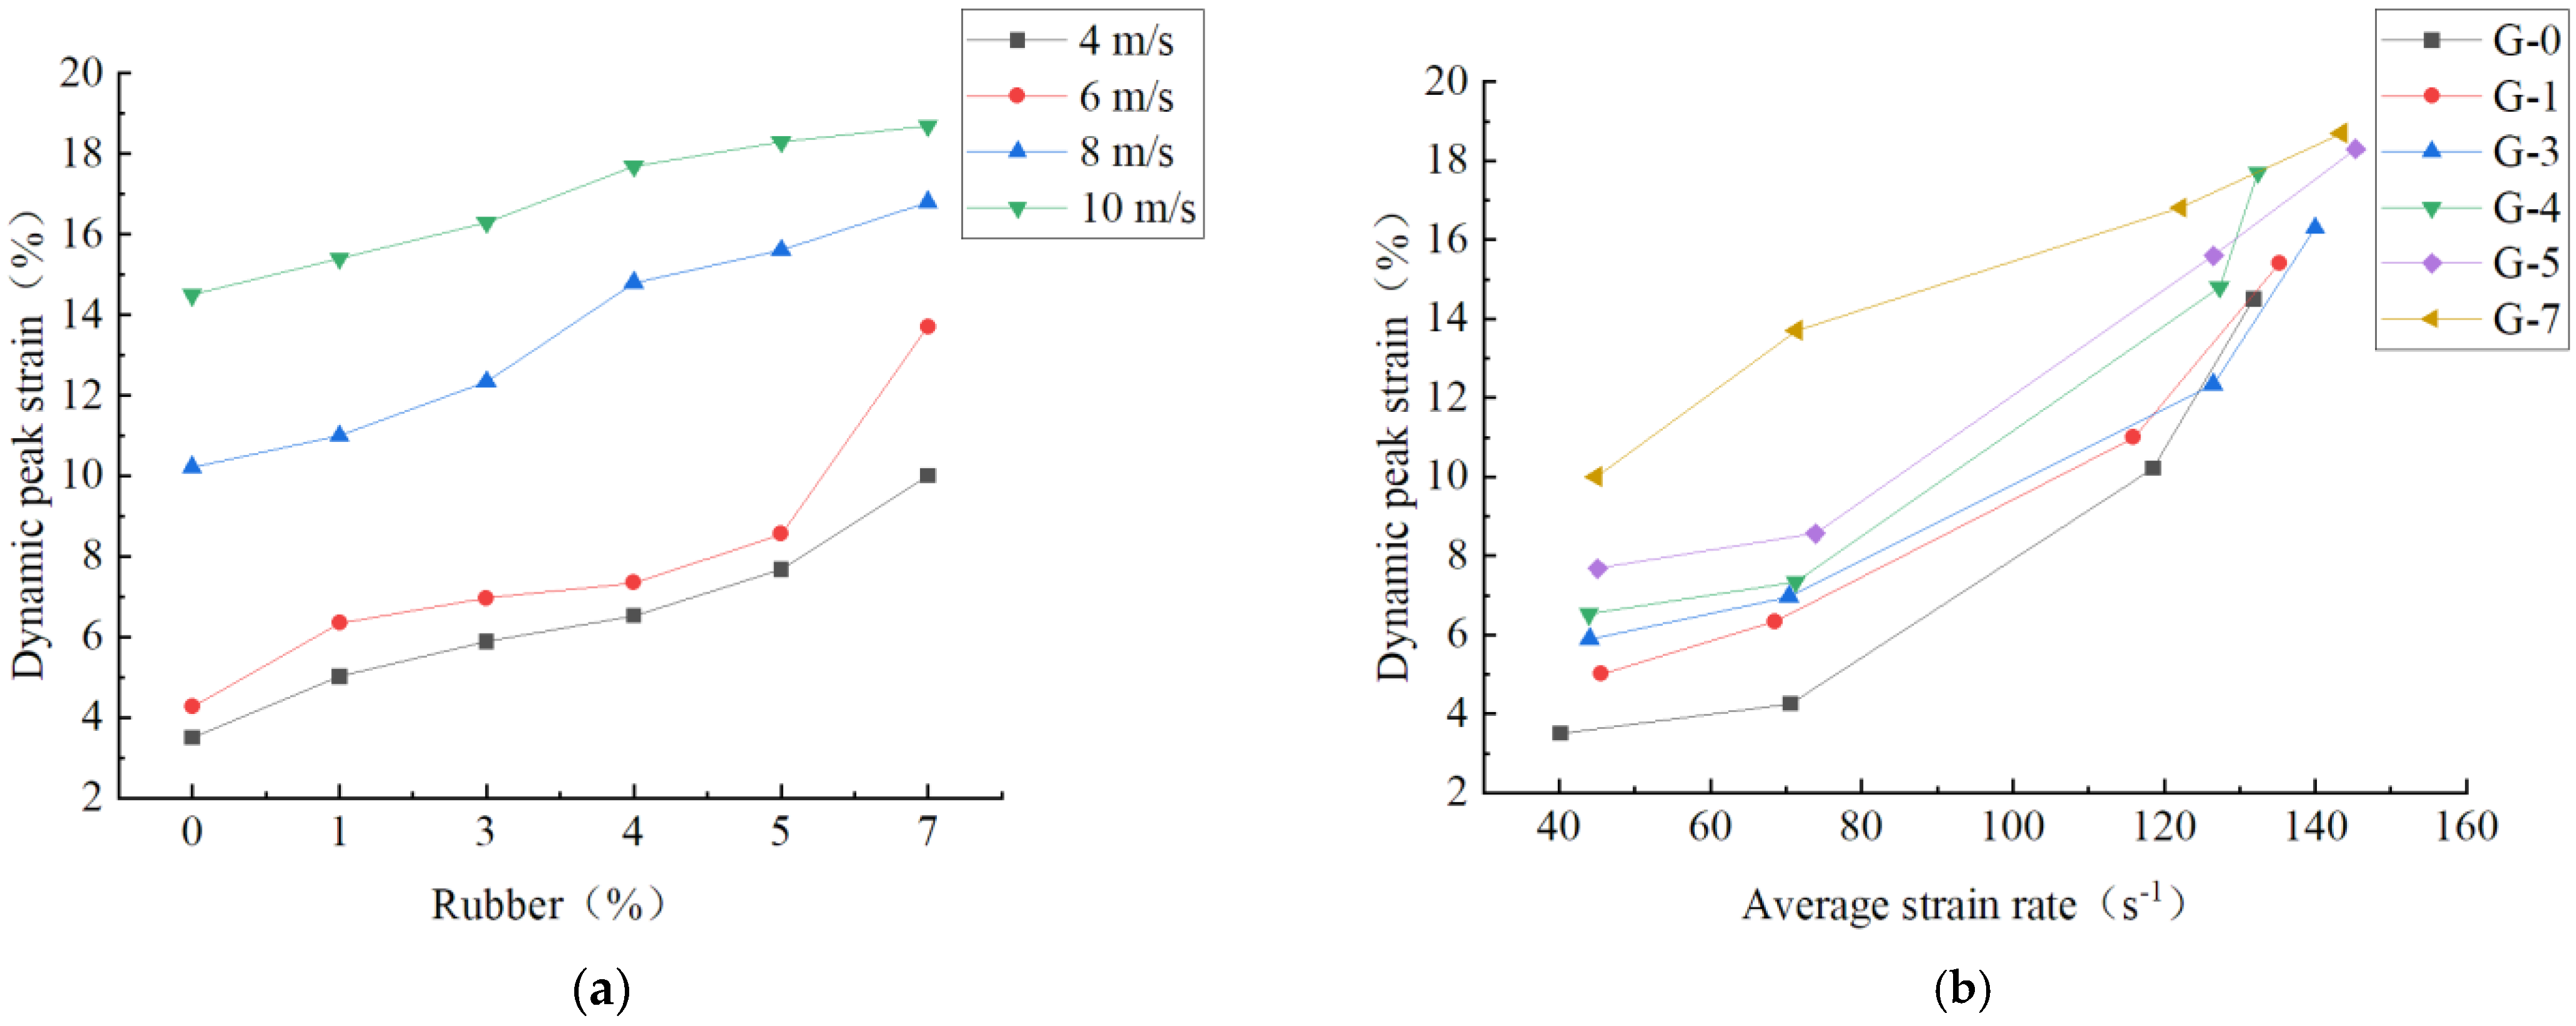
Figure 13a shows the variation in the dynamic peak strain of RCPB with rubber content at different impact speeds. As the rubber content increases, the dynamic compressive strength of RCPB exhibits an increasing trend. Figure 13b presents the variation in the dynamic peak strain of RCPB with an average strain rate at different rubber contents. RCPB exhibits a strain rate strengthening effect under dynamic loading, i.e., as the strain rate increases, the dynamic compressive strength of RCPB also exhibits an increasing trend.
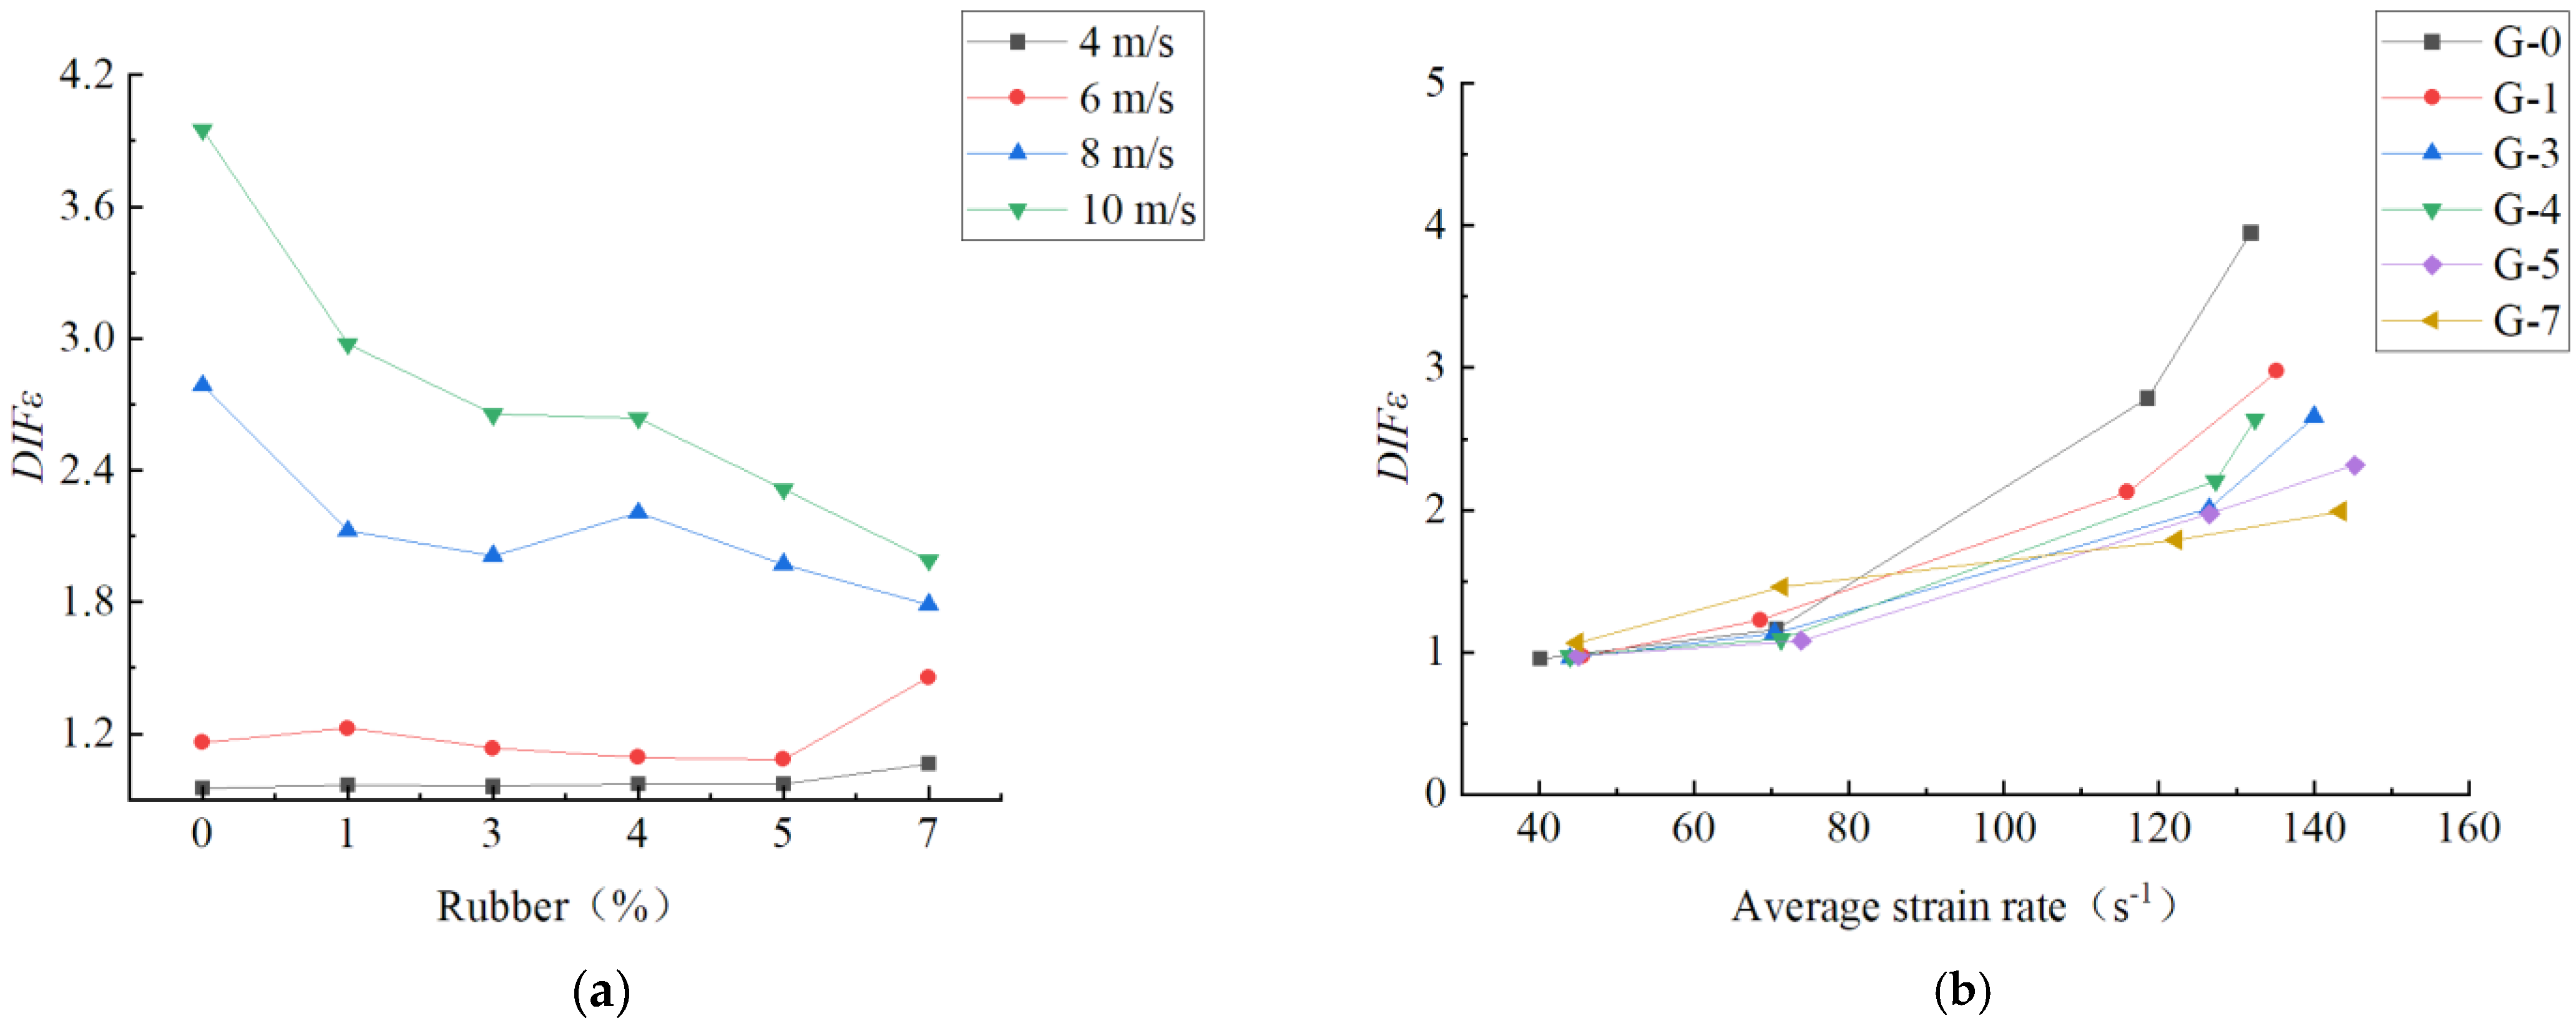
The relationship between the performance of RCPB under dynamic loading and static loading is explored. Figure 14a shows the relationship between the D I F ε of RCPB and rubber content at different average strain rates. As can be seen from Figure 14a, when the speed of the bullet is 4 m/s and 6 m/s, the D I F ε of RCPB slightly increases with the increase in rubber, which means that rubber increases the deformation ability of the filling body at this time. When the bullet velocity is 8 m/s and 10 m/s, the result is opposite, meaning that the rubber reduces the deformation ability of the filling body at this time. The relationship with the average strain rate shown in Figure 14b can be obtained by converting the velocity of the bullet to the average strain rate. It can be found by combining Figure 14a,b that rubber increases the elastic deformation capacity of RCPB, but the degree of this increase is limited. Therefore, it is necessary to reasonably utilize the properties of rubber to increase the deformation capacity of RCPB.

3.4. Dynamic Load Elastic Modulus of RCPB

The dynamic elastic modulus of RCPB characterizes its deformation capacity under dynamic loading. The influence of rubber content and strain rate on the dynamic elastic modulus is characterized by the dynamic elastic modulus enhancement factor, and the sensitivity of the dynamic elastic modulus of RCPB to both factors is studied. Table 6 presents the calculated results of the dynamic elastic modulus and dynamic elastic modulus enhancement factor of RCPB. The calculation method of the dynamic elastic modulus enhancement factor is similar to that of the dynamic strength enhancement factor. The calculation formula is shown in Equation (26):
D I F E = E d E
where E d is the dynamic elastic modulus and E is the static elastic modulus.
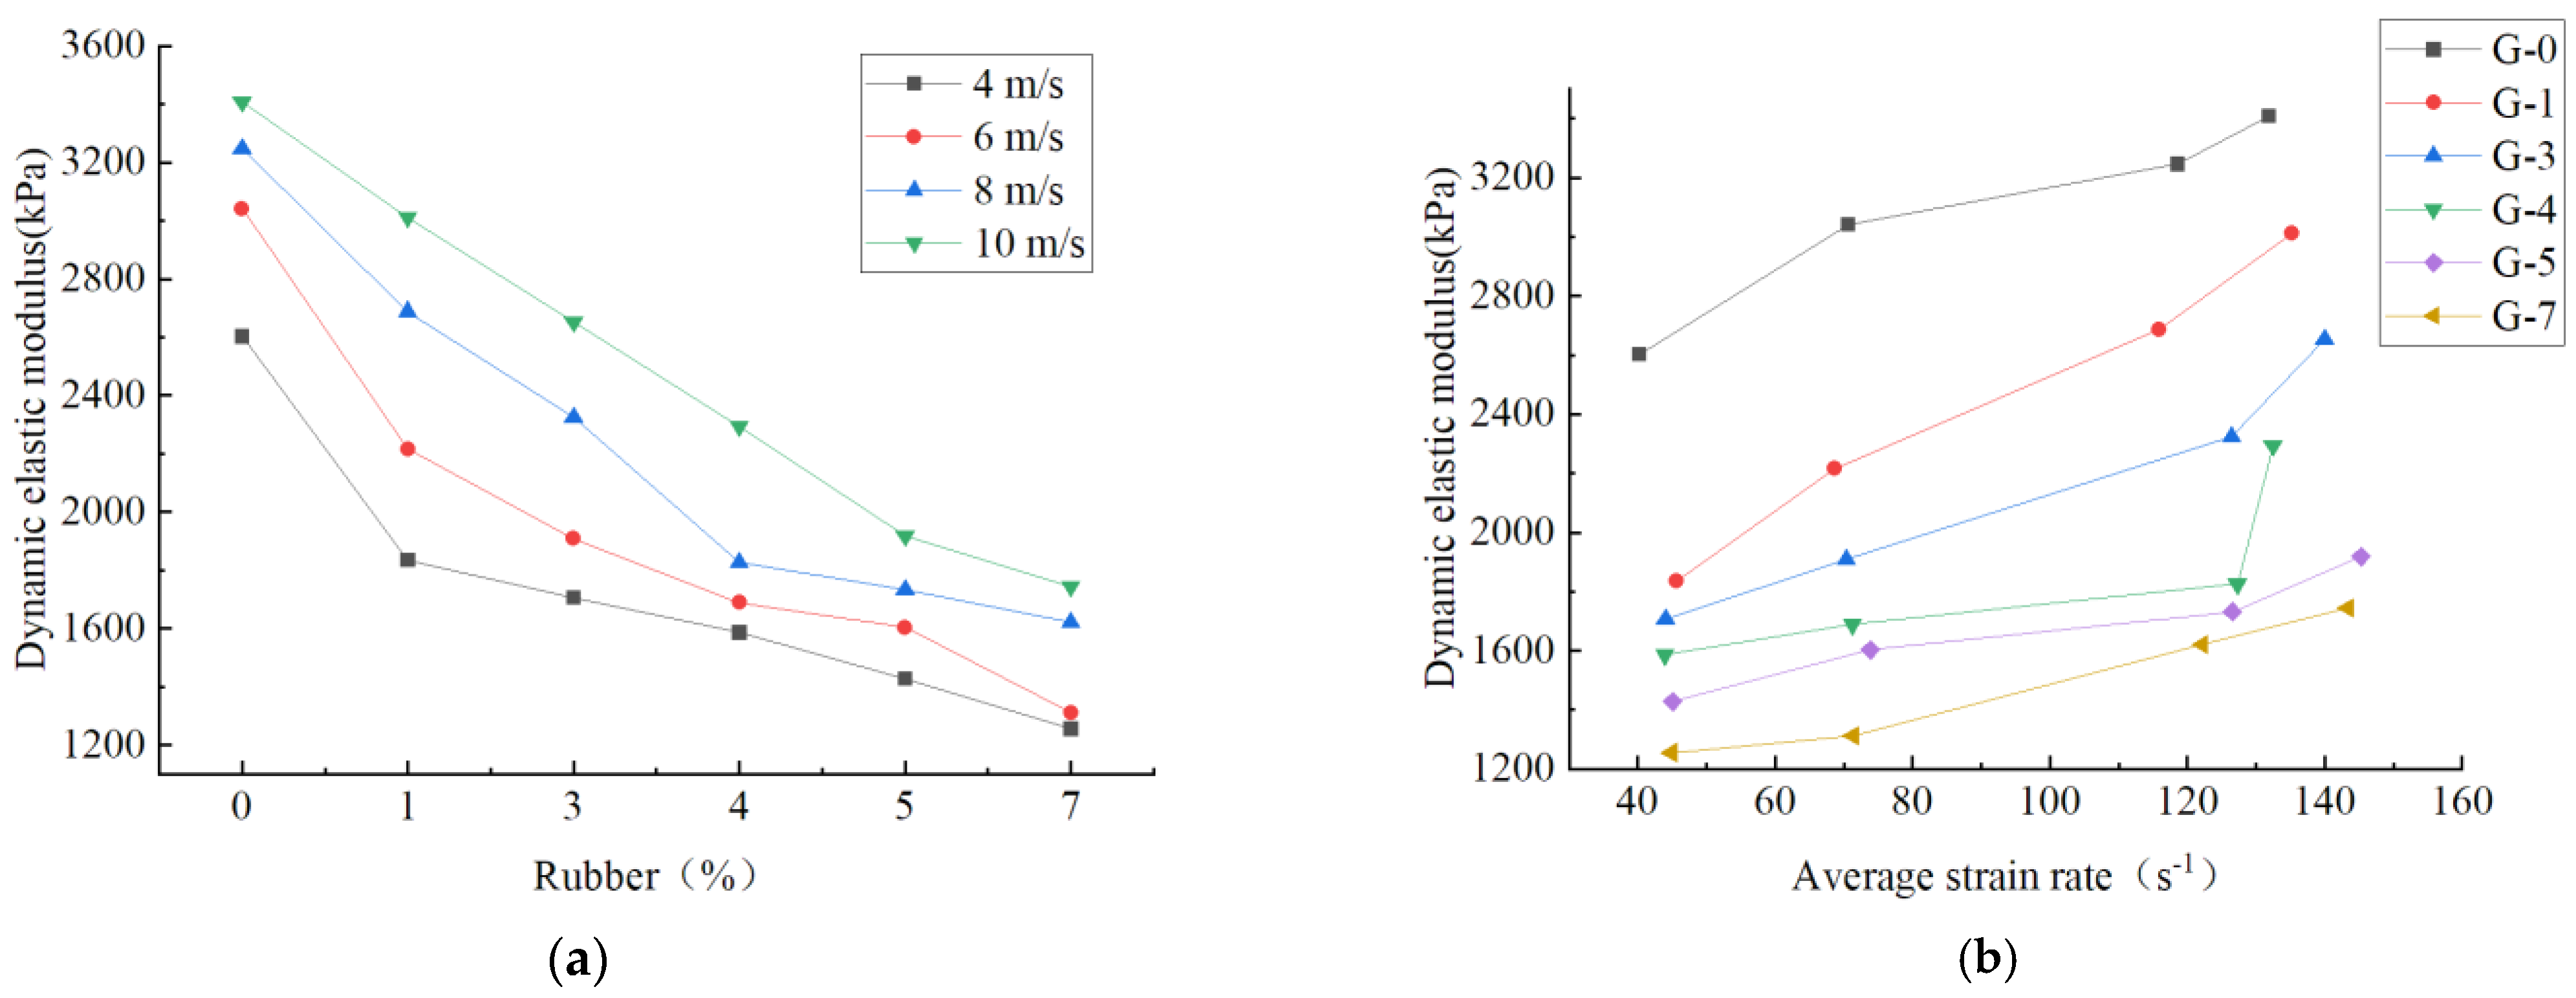
Figure 15a shows the relationship between the dynamic elastic modulus of RCPB and rubber content. It can be observed in Figure 15a that the dynamic elastic modulus of RCPB decreases as the rubber content increases. This is because rubber increases the deformation capacity of RCPB. Under the same strain rate, RCPB with more rubber content has a better deformation capacity. This result is also consistent with the experimental results of static loading.
Meanwhile, Figure 15b shows the relationship between the dynamic elastic modulus of RCPB and the average strain rate. The dynamic elastic modulus of RCPB increases as the average strain rate increases, indicating that during the impact process, the higher the impact energy, the worse the deformation capacity of RCPB. This indicates that, although rubber particles overall improve the deformation capacity of RCPB, there is still a limit to this improvement.
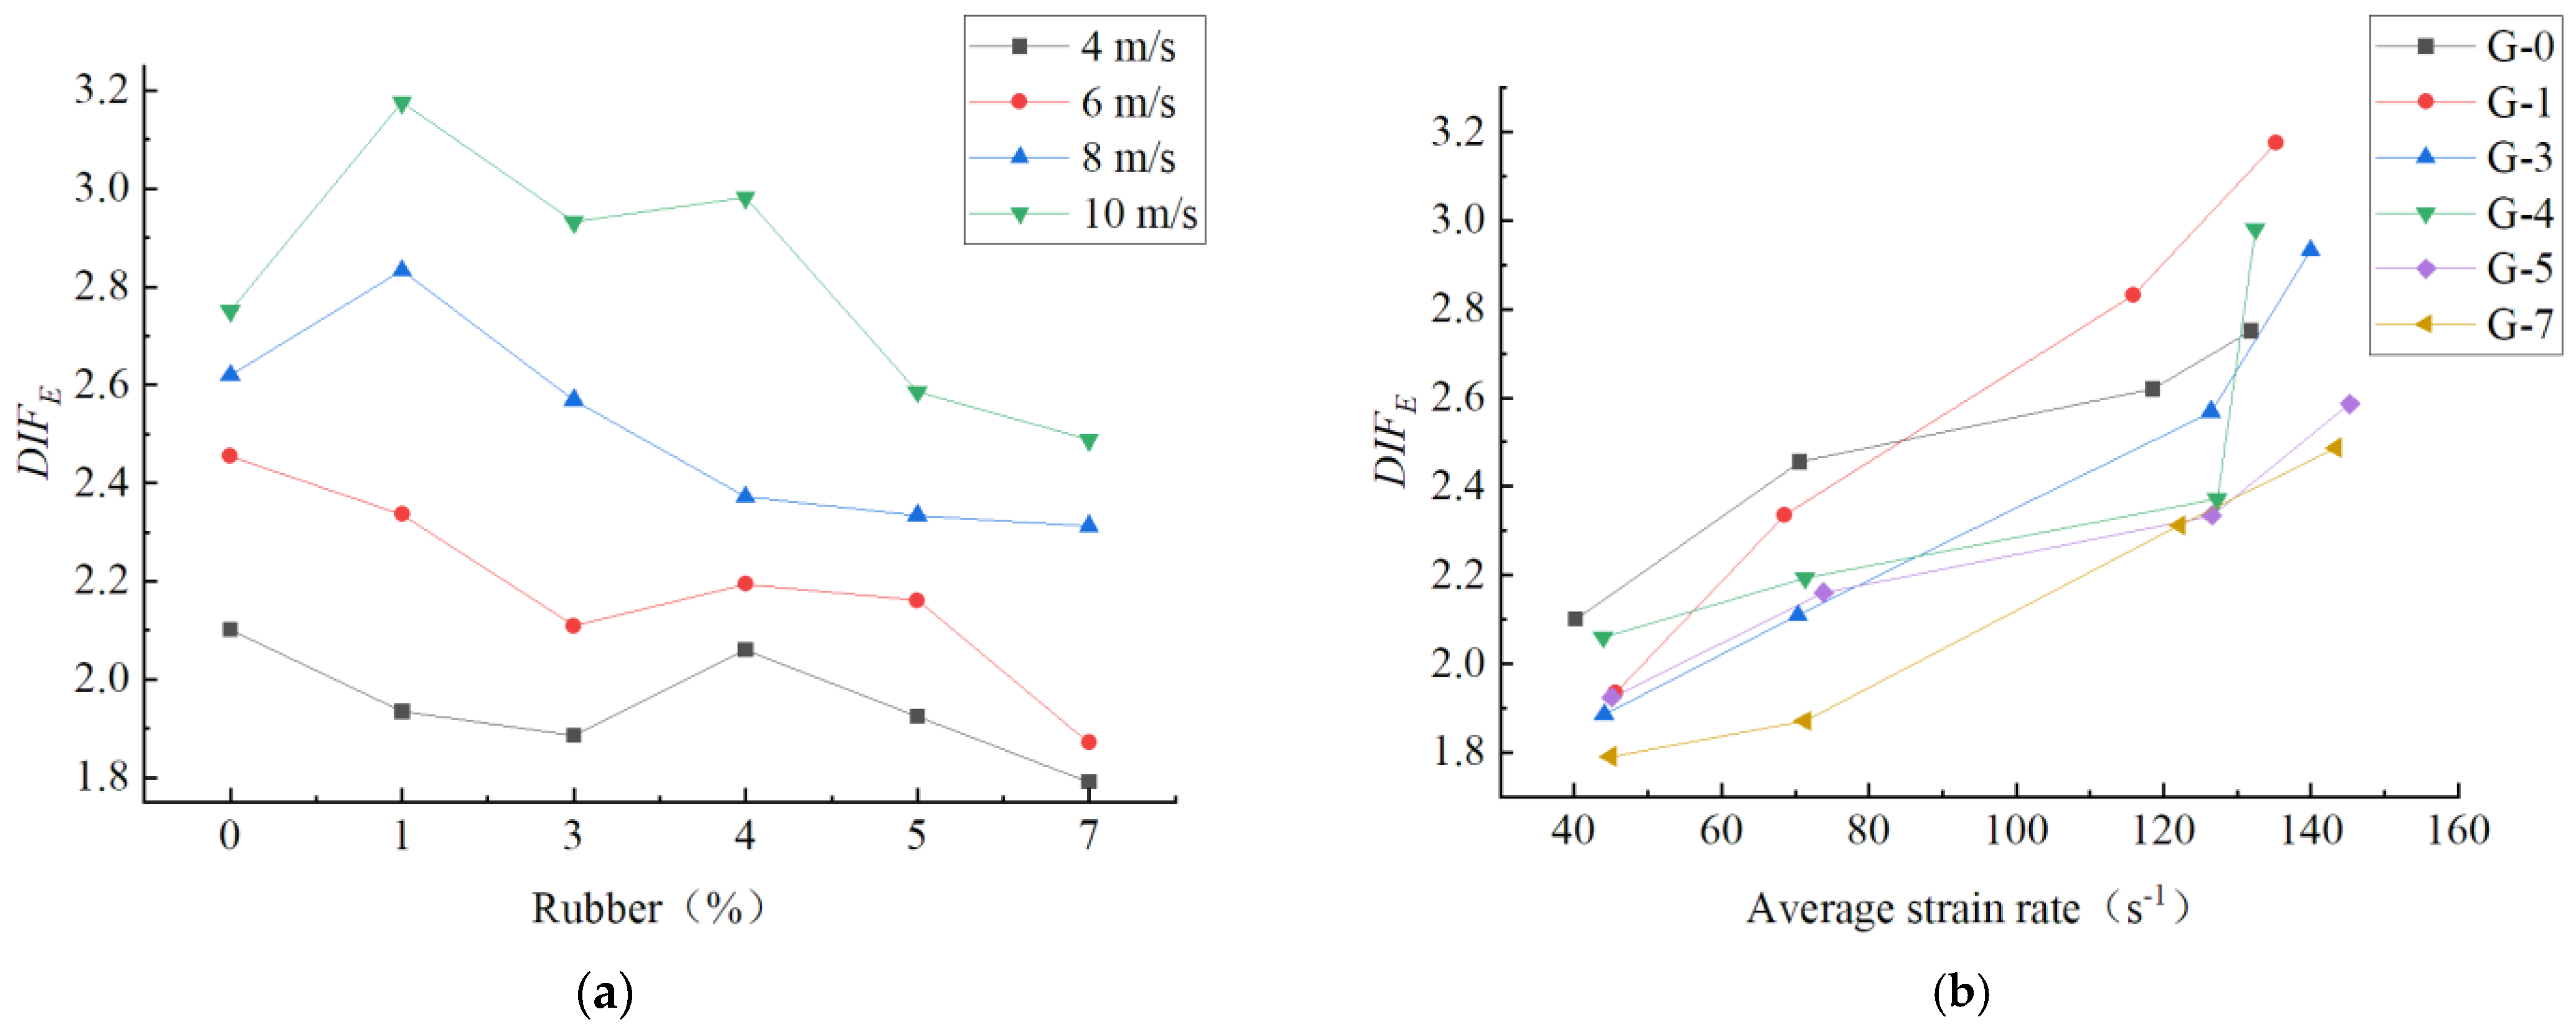
Figure 16a shows the relationship between the D I F E of RCPB and rubber content. It can be observed that as the rubber content increases, the D I F E generally exhibits a decreasing trend. However, careful observation reveals that in some stages there is a trend of first increasing and then decreasing. For example, when the bullet travels at 8m/s, the D I F E of RCPB shows a decreasing trend when the rubber content is between 0% and 3%. When the rubber content increases to 4%, the D I F E increases slightly. When the rubber content increases to 7%, the D I F E again shows a decreasing trend. Overall, there is a decreasing trend, indicating that the rubber content has a high sensitivity to the dynamic elastic modulus of RCPB. Figure 16b shows the relationship between the dynamic elastic modulus enhancement factor of RCPB and the average strain rate. The results of this study show that the D I F E of RCPB increases as the average strain rate increases. Combined with Figure 16a,b, it can be seen that rubber can improve the deformation ability of RCPB to a certain extent, Therefore, it is necessary to reasonably utilize the properties of rubber to increase the deformation capacity of RCPB.

4. Conclusions

Rubber particles have become the main raw material choice to enhance the impact resistance of cement-based composite materials because of their good elasticity and toughness. Adding rubber particles to the backfill body not only improves its mechanical properties but also fully utilizes the residual value of waste rubber, thus solving the problem of “black pollution” caused by waste tires. However, there is a lack of research on the influence of rubber particles on the impact resistance of backfill. This study examined the influence of rubber particles on the impact resistance of backfill through dynamic loading experiments. Based on the results of this study, the following conclusions were reached:
(1)
Under identical impact velocities, the dynamic compressive strength of rubber-doped filling bodies is reduced compared with those without rubber. As the rubber content increases, the rate at which the dynamic compressive strength decreases becomes slower.
(2)
As the rubber content rises, the dynamic strength enhancement factor of RCPB typically follows a trend of first decreasing and then slightly increasing. This is due to the varying performances of rubber content under dynamic loading conditions. Additionally, the dynamic compressive strength of rubber-filled bodies increases with an increase in the average strain rate. For CPB without rubber, when the average strain rate increases from 40.16 s−1 to 118.55 s−1, the dynamic strength increases by 108%. With an increasing impact speed, the dynamic compressive strength of RCPB increases. When the rubber content is 4%, the dynamic strength increases by a maximum of 213%.
(3)
Rubber can increase the elastic deformation capacity of RCPB, which means the inclusion of rubber improves the impact resistance of RCPB. However, this improvement is not infinite, indicating that there is a limit to the deformation capacity achieved through the addition of rubber. The findings of this study provide both invaluable information and industrial applications for the efficient management of solid waste, based on sustainable development and the circular economy.

Author Contributions

Conceptualization, Y.L.; data curation, X.W.; funding acquisition, Y.L.; investigation, J.Y.; methodology, Y.L. and X.S.; project administration, Y.L.; resources, J.Y.; supervision, Y.L. and X.W.; validation, X.S.; visualization, X.W.; writing—original draft, X.W.; writing—review and editing, Y.L. and X.S. All authors have read and agreed to the published version of the manuscript.

Funding

This research received no external funding.

Data Availability Statement

Dataset available on request from the authors.

Conflicts of Interest

The authors declare no conflicts of interest. Author Xiaobo Song were employed by the Coal Industry Planning and Design Institute Co., Ltd. The remaining authors declare that the research was conducted in the absence of any commercial or financial relationships that could be construed as a potential conflict of interest.

References

  1. Feng, X.; Liu, J.; Chen, B.; Xiao, Y.; Feng, G.; Zhang, F. Monitoring, warning, and control of rockburst in deep metal mines. Engineering 2017, 3, 538–545. [Google Scholar] [CrossRef]
  2. Xia, Z.; Yuan, H.; Li, H.; Yu, X.; Fang, X.; Huang, S. Energy Transfer and Damage Evolution Process Research of Ore Rock-Filling Body under the Blasting Load. Minerals 2022, 12, 1362. [Google Scholar] [CrossRef]
  3. Hu, Y.; Li, K.; Zhang, B.; Han, B. Development of Cemented Paste Backfill with Superfine Tailings: Fluidity, Mechanical Properties, and Microstructure Characteristics. Materials 2023, 16, 1951. [Google Scholar] [CrossRef] [PubMed]
  4. Yang, F.; Wu, F.; Yang, B.; Li, L.; Gao, Q. Preparation and performance of composite activated slag-based binder for cemented paste backfill. Chemosphere 2022, 309, 136649. [Google Scholar] [CrossRef] [PubMed]
  5. Song, X.; Hao, Y.; Wang, S.; Zhang, L.; Liu, W.; Li, J. Mechanical properties, crack evolution and damage characteristics of prefabricated fractured cemented paste backfill under uniaxial compression. Constr. Build. Mater. 2022, 330, 127251. [Google Scholar] [CrossRef]
  6. Zhang, F.; Li, Y.; Zhang, J.; Gui, X.; Zhu, X.; Zhao, C. Effects of slag-based cementitious material on the mechanical behavior and heavy metal immobilization of mine tailings based cemented paste backfill. Heliyon 2022, 8, e10695. [Google Scholar] [CrossRef] [PubMed]
  7. Zhao, Y.; Wu, P.; Qiu, J.; Guo, Z.; Tian, Y.; Sun, X.; Gu, X. Recycling hazardous steel slag after thermal treatment to produce a binder for cemented paste backfill. Powder Technol. 2022, 395, 652–662. [Google Scholar] [CrossRef]
  8. Chen, X.; Shi, X.; Zhou, J.; Li, E.; Qiu, P.; Gou, Y. High strain rate compressive strength behavior of cemented paste backfill using split Hopkinson pressure bar. Int. J. Min. Sci. Technol. 2021, 31, 387–399. [Google Scholar] [CrossRef]
  9. Xue, G.; Yilmaz, E.; Feng, G.; Cao, S.; Sun, L. Reinforcement effect of polypropylene fiber on dynamic properties of cemented tailings backfill under SHPB impact loading. Constr. Build. Mater. 2021, 279, 122417. [Google Scholar] [CrossRef]
  10. Libos, I.L.S.; Cui, L.; Liu, X. Effect of curing temperature on time-dependent shear behavior and properties of polypropylene fiber-reinforced cemented paste backfill. Constr. Build. Mater. 2021, 311, 125302. [Google Scholar] [CrossRef]
  11. Chakilam, S.; Cui, L. Effect of polypropylene fiber content and fiber length on the saturated hydraulic conductivity of hydrating cemented paste backfill. Constr. Build. Mater. 2020, 262, 120854. [Google Scholar] [CrossRef]
  12. Yu, Z.; Wang, Y.; Li, J. Performance Investigation and Cost-Benefit Analysis of Recycled Tire Polymer Fiber-Reinforced Cemented Paste Backfill. Polymers 2022, 14, 708. [Google Scholar] [CrossRef]
  13. Guo, Z.; Qiu, J.; Kirichek, A.; Zhou, H.; Liu, C.; Yang, L. Recycling waste tyre polymer for production of fibre reinforced cemented tailings backfill in green mining. Sci. Total Environ. 2024, 908, 168320. [Google Scholar] [CrossRef] [PubMed]
  14. Yang, B.; Wang, X.; Gu, C.; Yang, F.; Liu, H.; Jin, J.; Zhou, Y. The Failure Mechanical Properties of Cemented Paste Backfill with Recycled Rubber. Materials 2023, 16, 3302. [Google Scholar] [CrossRef]
  15. Suddeepong, A.; Buritatum, A.; Hoy, M.; Horpibulsuk, S.; Takaikaew, T.; Horpibulsuk, J.; Arulrajah, A. Natural Rubber Latex–Modified Concrete Pavements: Evaluation and Design Approach. J. Mater. Civ. Eng. 2022, 34, 04022215. [Google Scholar] [CrossRef]
  16. Chu, L.; Wang, S.; Li, D.; Zhao, J.; Ma, X. Cyclic behaviour of beam-column joints made of crumb rubberised concrete (CRC) and traditional concrete (TC). Case Stud. Constr. Mater. 2022, 16, e867. [Google Scholar] [CrossRef]
  17. Su, Q.; Xu, J. Durability and mechanical properties of rubber concrete incorporating basalt and polypropylene fibers: Experimental evaluation at elevated temperatures. Constr. Build. Mater. 2023, 368, 130445. [Google Scholar] [CrossRef]
  18. Zhang, Y.; Zhang, S.; Jiang, X.; Zhao, W.; Wang, Y.; Zhu, P.; Yan, Z.; Zhu, H. Uniaxial tensile properties of multi-scale fiber reinforced rubberized concrete after exposure to elevated temperatures. J. Clean Prod. 2023, 389, 136068. [Google Scholar] [CrossRef]
  19. Yu, Y.; Jin, Z.; Shen, D.; An, J.; Sun, Y.; Li, N. Microstructure evolution and impact resistance of crumb rubber concrete after elevated temperatures. Constr. Build. Mater. 2023, 384, 131340. [Google Scholar] [CrossRef]
  20. Gao, X.; Yang, J.; Zhu, H.; Xu, J. Estimation of rubberized concrete frost resistance using machine learning techniques. Constr. Build. Mater. 2023, 371, 130778. [Google Scholar] [CrossRef]
  21. Zhou, X.; Xie, Y.; Long, G.; Zeng, X.; Li, J.; Li, N.; Wang, F.; Abdullahi Umar, H. Influence of end friction confinement on dynamic mechanical properties and damage evolution of concrete by coupled DEM-FDM method. Eng. Fract. Mech. 2023, 281, 109150. [Google Scholar] [CrossRef]
  22. Chen, J.; Gu, S.; Zhou, X. The effects of weak interlayers on the dynamic mechanical properties and failure behaviours of rocks: A combined numerical and experimental analysis. Int. J. Impact Eng. 2023, 180, 104680. [Google Scholar] [CrossRef]
  23. Faraj, R.H.; Ahmed, H.U.; Rafiq, S.; Sor, N.H.; Ibrahim, D.F.; Qaidi, S.M.A. Performance of Self-Compacting mortars modified with Nanoparticles: A systematic review and modeling. Clean. Mater. 2022, 4, 100086. [Google Scholar] [CrossRef]
  24. Han, Z.; Li, D.; Li, X. Dynamic mechanical properties and wave propagation of composite rock-mortar specimens based on SHPB tests. Int. J. Min. Sci. Technol. 2022, 32, 793–806. [Google Scholar] [CrossRef]
  25. Ali Ahmed, D.; Bahroz Jumaa, G.; Khalighi, M. Mechanical properties and shear strength of rubberized fibrous reinforced concrete beams without stirrups. Constr. Build. Mater. 2022, 350, 128796. [Google Scholar] [CrossRef]
  26. Walid, M.; Abdelrahman, A.; Kohail, M.; Moustafa, A. Stress—Strain behavior of rubberized concrete under compressive and flexural stresses. J. Build. Eng. 2022, 59, 105026. [Google Scholar] [CrossRef]
  27. Feng, G.; Wang, Z.; Qi, T.; Du, X.; Guo, J.; Wang, H.; Shi, X.; Wen, X. Effect of velocity on flow properties and electrical resistivity of cemented coal gangue-fly ash backfill (CGFB) slurry in the pipeline. Powder Technol. 2022, 396, 191–209. [Google Scholar] [CrossRef]
  28. Jiang, H.; Fall, M.; Yilmaz, E.; Li, Y.; Yang, L. Effect of mineral admixtures on flow properties of fresh cemented paste backfill: Assessment of time dependency and thixotropy. Powder Technol. 2020, 372, 258–266. [Google Scholar] [CrossRef]
  29. Carvalho Eugênio, T.M.; Francisco Fagundes, J.; Santos Viana, Q.; Pereira Vilela, A.; Farinassi Mendes, R. Study on the feasibility of using iron ore tailing (iot) on technological properties of concrete roof tiles. Constr. Build. Mater. 2021, 279, 122484. [Google Scholar] [CrossRef]
  30. Qaidi, S.M.A.; Dinkha, Y.Z.; Haido, J.H.; Ali, M.H.; Tayeh, B.A. Engineering properties of sustainable green concrete incorporating eco-friendly aggregate of crumb rubber: A review. J. Clean Prod. 2021, 324, 129251. [Google Scholar] [CrossRef]
  31. Zhang, S.; Yang, L.; Ren, F.; Qiu, J.; Ding, H. Rheological and mechanical properties of cemented foam backfill: Effect of mineral admixture type and dosage. Cem. Concr. Compos. 2020, 112, 103689. [Google Scholar] [CrossRef]
  32. Choobbasti, A.J.; Samakoosh, M.A.; Kutanaei, S.S. Mechanical properties soil stabilized with nano calcium carbonate and reinforced with carpet waste fibers. Constr. Build. Mater. 2019, 211, 1094–1104. [Google Scholar] [CrossRef]
  33. Kutanaei, S.S.; Choobbasti, A.J. Effects of nanosilica particles and randomly distributed fibers on the ultrasonic pulse velocity and mechanical properties of cemented sand. J. Mater. Civ. Eng. 2017, 29, 04016230. [Google Scholar] [CrossRef]
  34. Kolsky, H. An investigation of the mechanical properties of materials at very high rates of loading. Proc. Phys. Soc. Sect. B 1949, 62, 676. [Google Scholar] [CrossRef]
  35. Cao, Y.; Li, L.; Liu, M.; Wu, Y. Mechanical behavior of FRP confined rubber concrete under monotonic and cyclic loading. Compos. Struct. 2021, 272, 114205. [Google Scholar] [CrossRef]
  36. Gravina, R.J.; Xie, T.; Roychand, R.; Zhuge, Y.; Ma, X.; Mills, J.E.; Youssf, O. Bond behaviour between crumb rubberized concrete and deformed steel bars. Structures 2021, 34, 2115–2133. [Google Scholar] [CrossRef]
  37. Nuzaimah, M.; Sapuan, S.M.; Nadlene, R.; Jawaid, M. Recycling of waste rubber as fillers: A review. In IOP Conference Series: Materials Science and Engineering; IOP Publishing: Bristol, UK, 2018; p. 12016. [Google Scholar]
  38. Zhao, K.; He, Z.; Yang, J.; Yan, Y.; Yu, X.; Zhou, Y.; Zhang, X.; Wang, J. Investigation of failure mechanism of cement-fiber-tailings matrix composites using digital image correlation and acoustic emission. Constr. Build. Mater. 2022, 335, 127513. [Google Scholar] [CrossRef]
  39. Cao, S.; Yilmaz, E.; Yin, Z.; Xue, G.; Song, W.; Sun, L. CT scanning of internal crack mechanism and strength behavior of cement-fiber-tailings matrix composites. Cem. Concr. Compos. 2021, 116, 103865. [Google Scholar] [CrossRef]
  40. Zhao, L. Numerical investigation on the mechanical behaviour of combined backfill-rock structure with KCC model. Constr. Build. Mater. 2021, 283, 122782. [Google Scholar] [CrossRef]
  41. Zhou, X.; Xie, Y.; Long, G.; Zeng, X.; Li, N.; Ma, G.; Wang, F.; Yao, L. Multi-scale modeling of the concrete SHPB test based on DEM-FDM coupling method. Constr. Build. Mater. 2022, 356, 129157. [Google Scholar] [CrossRef]
  42. Zhou, Z.; Zhao, Y.; Jiang, Y.; Zou, Y.; Cai, X.; Li, D. Dynamic behavior of rock during its post failure stage in SHPB tests. Trans. Nonferrous Met. Soc. China 2017, 27, 184–196. [Google Scholar] [CrossRef]
  43. Imani, M.; Nejati, H.R.; Goshtasbi, K. Dynamic response and failure mechanism of Brazilian disk specimens at high strain rate. Soil Dyn. Earthq. Eng. 2017, 100, 261–269. [Google Scholar] [CrossRef]
  44. Lu, J.F.; Zhuang, Z.; Shimamura, K.; Shibue, T. Application of numerical simulation to SHPB test to investigate the dynamic compressive behavior of material with failure. Key Eng. Mater. 2003, 243–244, 433–438. [Google Scholar] [CrossRef]
  45. Zuo, L.S.; Zhang, X.Q.; Chen, L.S.; She, J.P.; Li, H.; Chen, W. Simulation of Laser Shock Wave Propagation and Dispersion in SHPB. Adv. Mater. Res. 2013, 681, 105–109. [Google Scholar] [CrossRef]
  46. Fu, Q.; Xie, Y.; Long, G.; Niu, D.; Song, H.; Liu, X. Impact characterization and modelling of cement and asphalt mortar based on SHPB experiments. Int. J. Impact Eng. 2017, 106, 44–52. [Google Scholar] [CrossRef]
  47. Song, X.; Hao, Y.; Wang, S.; Zhang, L.; Liu, H.; Yong, F.; Dong, Z.; Yuan, Q. Dynamic mechanical response and damage evolution of cemented tailings backfill with alkalized rice straw under SHPB cycle impact load. Constr. Build. Mater. 2022, 327, 127009. [Google Scholar] [CrossRef]
  48. Xu, D.; Zhang, Z.; Qin, Y.; Liu, T.; Cheng, Z. Effect of particle size distribution on dynamic properties of cemented coral sand under SHPB impact loading. Soil Dyn. Earthq. Eng. 2022, 162, 107438. [Google Scholar] [CrossRef]
  49. Hou, Y.; Yin, S.; Yang, S.; Chen, X.; Du, H. Mechanical properties, damage evolution and energy dissipation of cemented tailings backfill under impact loading. J. Build. Eng. 2023, 66, 105912. [Google Scholar] [CrossRef]
  50. Alsaif, A.; Alharbi, Y.R. Strength, durability and shrinkage behaviours of steel fiber reinforced rubberized concrete. Constr. Build. Mater. 2022, 345, 128295. [Google Scholar] [CrossRef]
  51. Zhou, X.; Hu, S.; Zhang, G.; Li, J.; Xuan, D.; Gao, W. Experimental investigation and mathematical strength model study on the mechanical properties of cemented paste backfill. Constr. Build. Mater. 2019, 226, 524–533. [Google Scholar] [CrossRef]
  52. Sang, Z.; Deng, Z.; Xi, J.; Yao, H.; Wu, J. Lateral confinement effect in SHPB test of the SAP concrete material. Univ. Politeh. Buchar. Bull. Ser. B-Chem. Mater. Sci. 2018, 80, 3–16. [Google Scholar]
Figure 1. Stereomicrograph of recycled rubber powder.
Minerals 14 00553 g001
Figure 2. Pretreatment of tailings.
Minerals 14 00553 g002
Figure 3. Stereomicrograph of tailings.
Minerals 14 00553 g003
Figure 4. (a) Size distribution of tailings; (b) XRD diffraction pattern of tailings.
Minerals 14 00553 g004
Figure 5. (a) Particle-size distribution of cement; (b) XRD diffraction pattern of cement.
Minerals 14 00553 g005
Figure 6. Single-axis pressure tester.
Minerals 14 00553 g006
Figure 7. Wheatstone 1/4 bridge.
Minerals 14 00553 g007
Figure 8. The SHPB test device.
Minerals 14 00553 g008
Figure 9. Specimen preparation process.
Minerals 14 00553 g009
Figure 10. (a) Original waveform with 4% rubber content; (b) SHPB signal amplitude of RCPB.
Minerals 14 00553 g010
Figure 11. (a) Relationship between dynamic strength and rubber content; (b) relationship between dynamic strength and average strain rate.
Minerals 14 00553 g011
Figure 12. (a) DIF of RCPB; (b) relationship between DIF and mean strain rate.
Minerals 14 00553 g012
Figure 13. (a) Relationship between dynamic peak strain and rubber content; (b) relationship between dynamic peak strain and average strain rate.
Minerals 14 00553 g013
Figure 14. (a) Relationship between dynamic peak strain enhancement factor and rubber content; (b) relationship between dynamic peak strain enhancement factor and average strain rate.
Minerals 14 00553 g014
Figure 15. (a) Relationship between dynamic elastic modulus and rubber content; (b) relationship between dynamic elastic modulus and average strain rate.
Minerals 14 00553 g015
Figure 16. (a) Relationship between D I F E and rubber content; (b) relationship between D I F E and average strain rate.
Minerals 14 00553 g016
Table 1. Sieving particle-size distribution of recycled rubber powder.
Sieve (mm)Minimum Portion of Retained Material (%)Maximum Portion of Retained Material (%)
1.6505
0.53050
0.33050
01047
Table 2. Experimental material proportions.
GroupsRubber (%)Cement (%)Tailings (%)Water (%)
G-00.05.095.026.2
G-11.05.094.026.2
G-33.05.092.026.2
G-44.05.091.026.2
G-55.05.090.026.2
G-77.05.088.026.2
Table 3. Dynamic compressive strength of RCPB.
Rubber (%)Velocity of the Bullet (m∙s−1)Average Strain Rate (s−1)Dynamic Strength (MPa)
04.06240.161.43
6.12270.611.87
7.921118.552.15
9.451131.892.98
14.35045.551.01
5.80468.591.61
7.822115.961.95
9.673135.232.75
34.21944.030.90
5.89470.361.57
7.831126.451.84
9.961140.012.62
44.10143.940.81
6.02071.291.49
7.974127.321.76
9.602132.432.53
54.21645.060.76
6.15773.861.25
7.928126.561.63
9.996145.322.30
74.01044.890.73
5.89171.361.02
7.898122.21.58
9.928143.422.19
Table 4. Statistical results of DIF for RCPB.
Rubber (%) P (MPa)Velocity of the Bullet (m/s)Average Strain Rate (s−1) f d (MPa)DIF
00.8514.06240.161.431.69
6.12270.611.872.19
7.921118.552.152.53
9.451131.892.983.50
10.7964.35045.551.011.27
5.80468.591.612.03
7.822115.961.952.45
9.673135.232.753.46
30.7594.21944.030.901.18
5.89470.361.572.07
7.831126.451.842.42
9.961140.012.623.45
40.7174.10143.940.811.13
6.02071.291.492.07
7.974127.321.762.45
9.602132.432.533.53
50.5994.21645.060.761.27
6.15773.861.252.08
7.928126.561.632.72
9.996145.322.303.84
70.5734.01044.890.731.27
5.89171.361.021.77
7.898122.21.582.76
9.928143.422.193.83
Table 5. Dynamic peak strain of RCPB.
Rubber (%)Velocity of the Bullet (m/s)Average Strain Rate (s−1)Dynamic Peak Strain (%) D I F ε
04.06240.163.50.953494011
6.12270.614.261.160538424
7.921118.5510.222.784202511
9.451131.8914.53.950189473
14.35045.555.010.968222587
5.80468.596.341.225255729
7.822115.9610.992.123905435
9.673135.2315.42.976173221
34.21944.035.890.95937245
5.89470.366.971.135284546
7.831126.4512.342.009958579
9.961140.0116.32.654969598
44.10143.946.530.973484837
6.02071.297.341.094238699
7.974127.3214.82.206366859
9.602132.4317.72.638695501
54.21645.067.680.971326886
6.15773.868.561.082624758
7.928126.5615.61.973007736
9.996145.3218.32.314489845
74.01044.89101.064573856
5.89171.3613.71.458466183
7.898122.216.81.788484079
9.928143.4218.71.990753111
Table 6. Dynamic elastic modulus of RCPB.
Rubber (%)Velocity of the Bullet (m/s)Average Strain Rate (s−1)Dynamic Elastic Modulus (kPa) D I F E
04.06240.1626032.100887813
6.12270.6130422.455205811
7.921118.5532462.619854722
9.451131.8934092.751412429
14.35045.5518351.934445676
5.80468.5922162.336093525
7.822115.9626872.832618818
9.673135.2330123.175231812
34.21944.0317061.885476672
5.89470.3619082.10872772
7.831126.4523242.568492254
9.961140.0126532.93210411
44.10143.9415862.060208216
6.02071.2916892.19400484
7.974127.3218262.371967341
9.602132.4322952.98119663
54.21645.0614281.924551077
6.15773.8616032.160402925
7.928126.5617322.33425943
9.996145.3219192.586283976
74.01044.8912551.790408602
5.89171.3613111.870299345
7.898122.216212.312551669
9.928143.4217442.488025978
Disclaimer/Publisher’s Note: The statements, opinions and data contained in all publications are solely those of the individual author(s) and contributor(s) and not of MDPI and/or the editor(s). MDPI and/or the editor(s) disclaim responsibility for any injury to people or property resulting from any ideas, methods, instructions or products referred to in the content.