
Historical Pigments and Paint Layers: Raman Spectral Library with 852 nm Excitation Laser

 , ,
, , 
Abstract

1. Introduction
2. Materials and Methods
2.1. Samples
2.2. Mock-Up Panel Painting
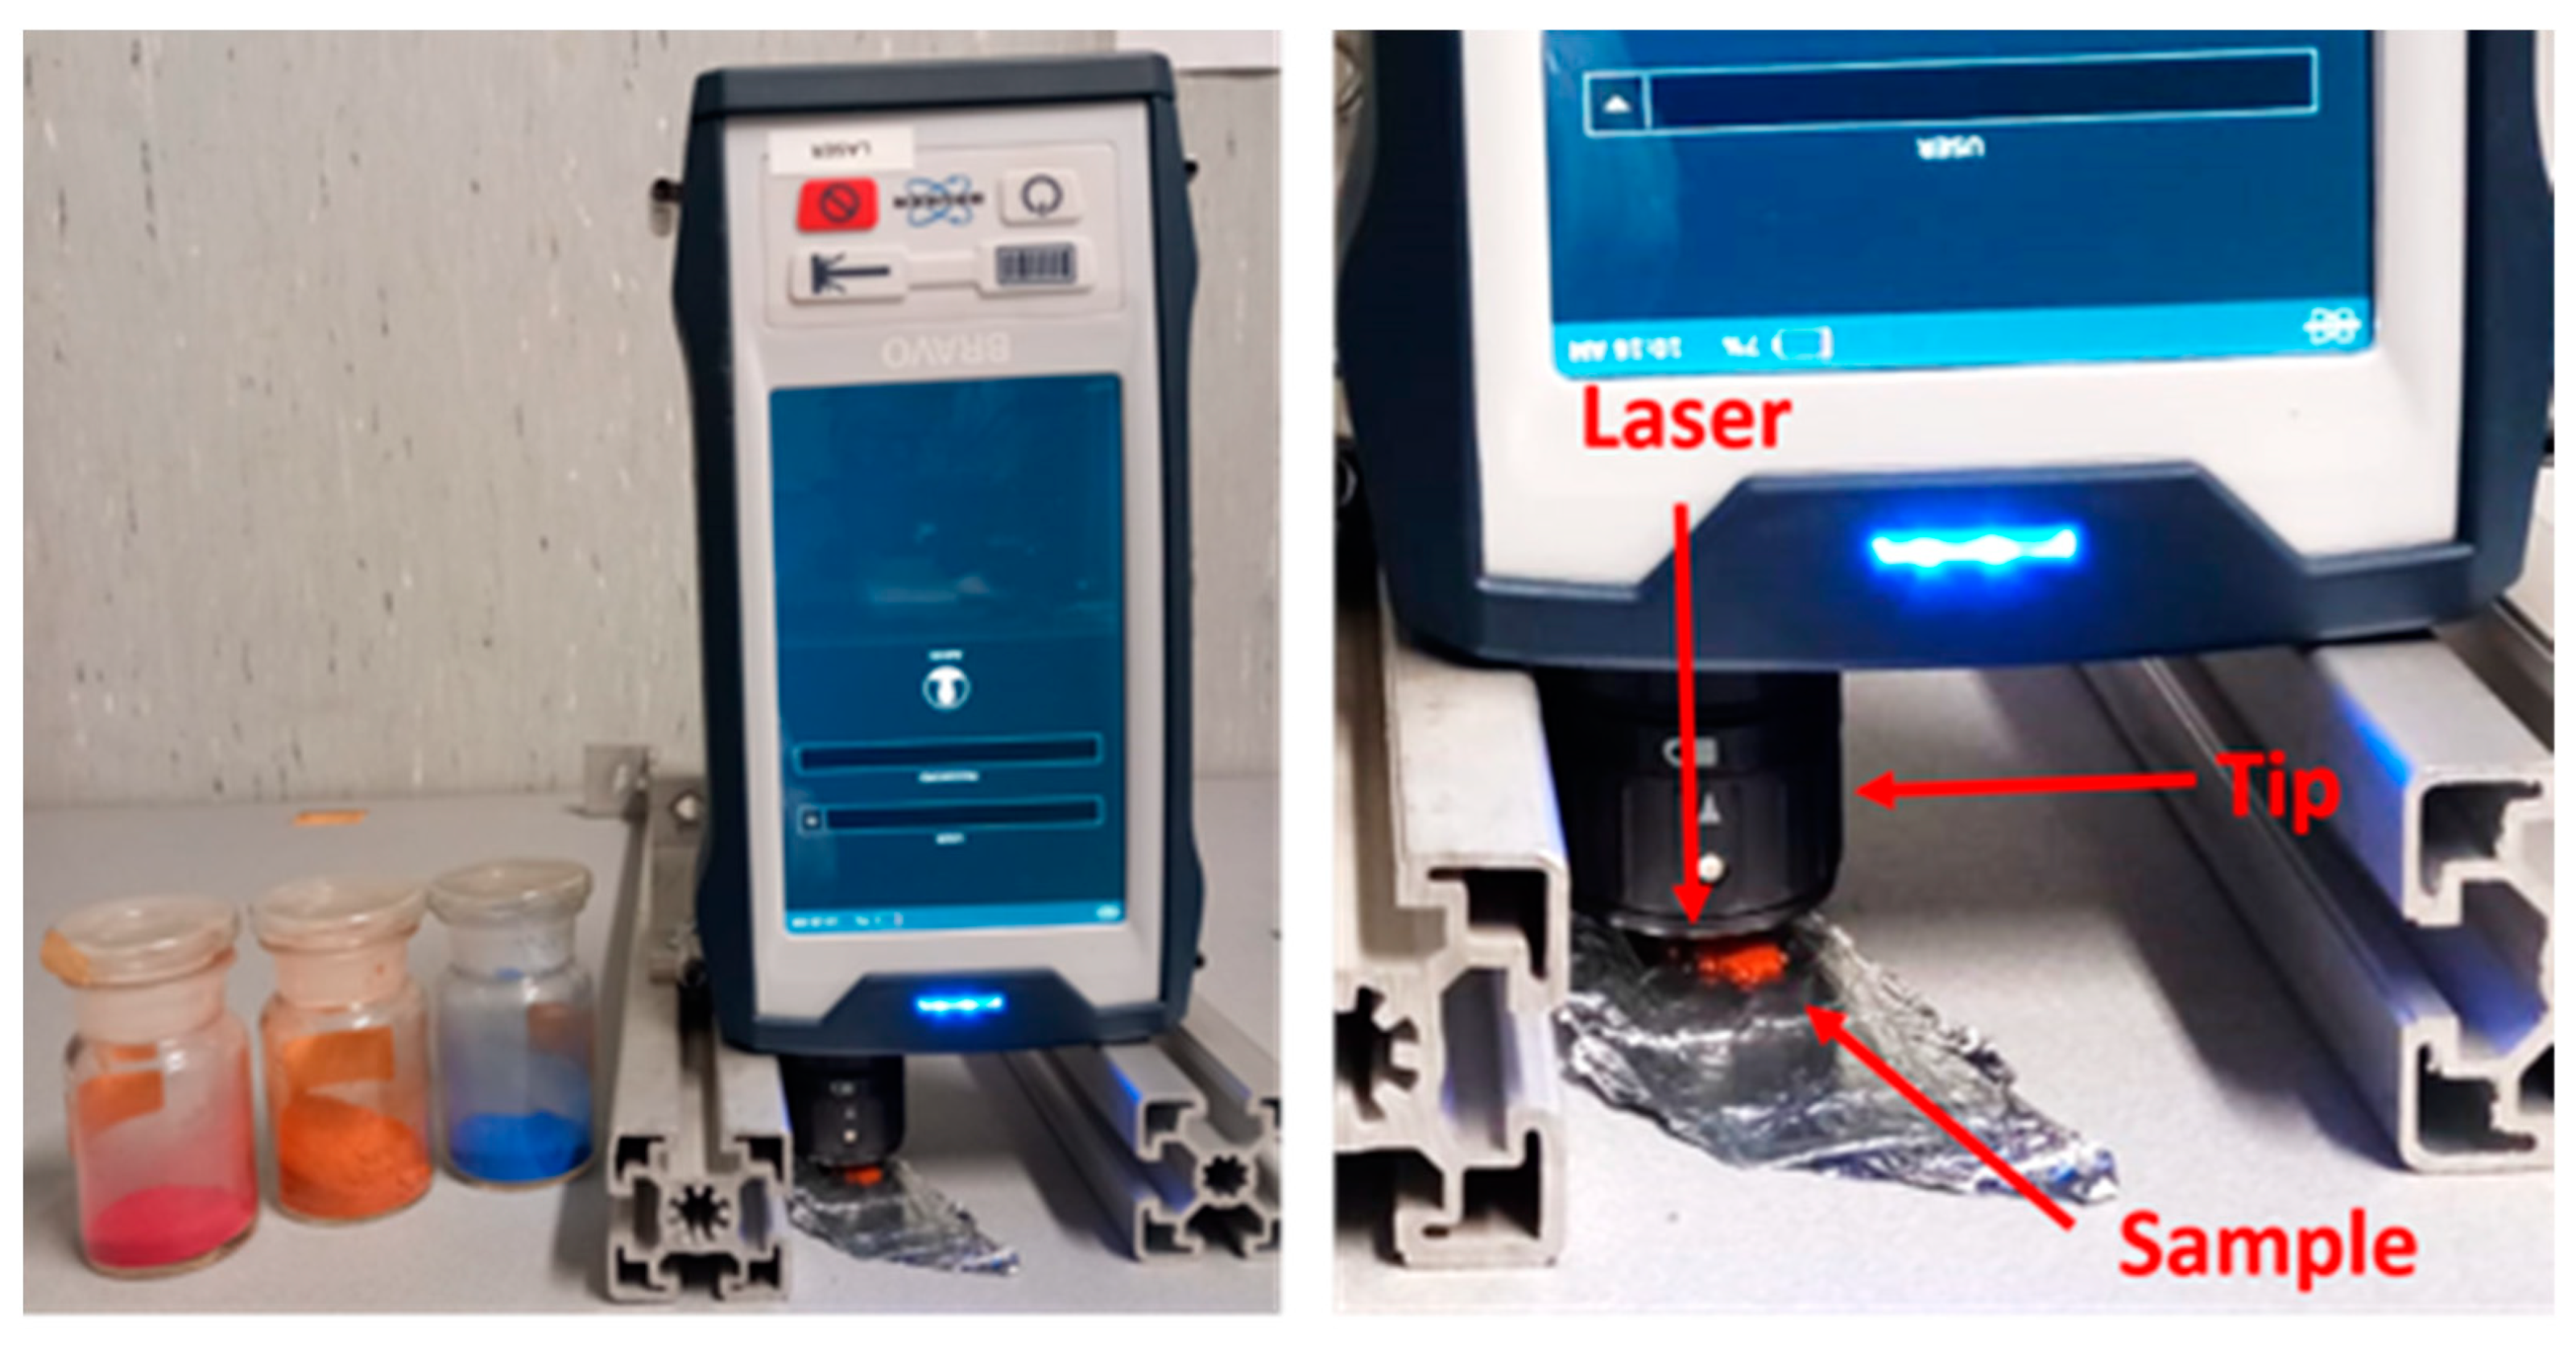
2.3. Sequentially Shifted Excitation (SSE) Raman Spectroscopy
2.4. Micro-Raman Renishaw (785 nm)
2.5. Stereomicroscopy
3. Results
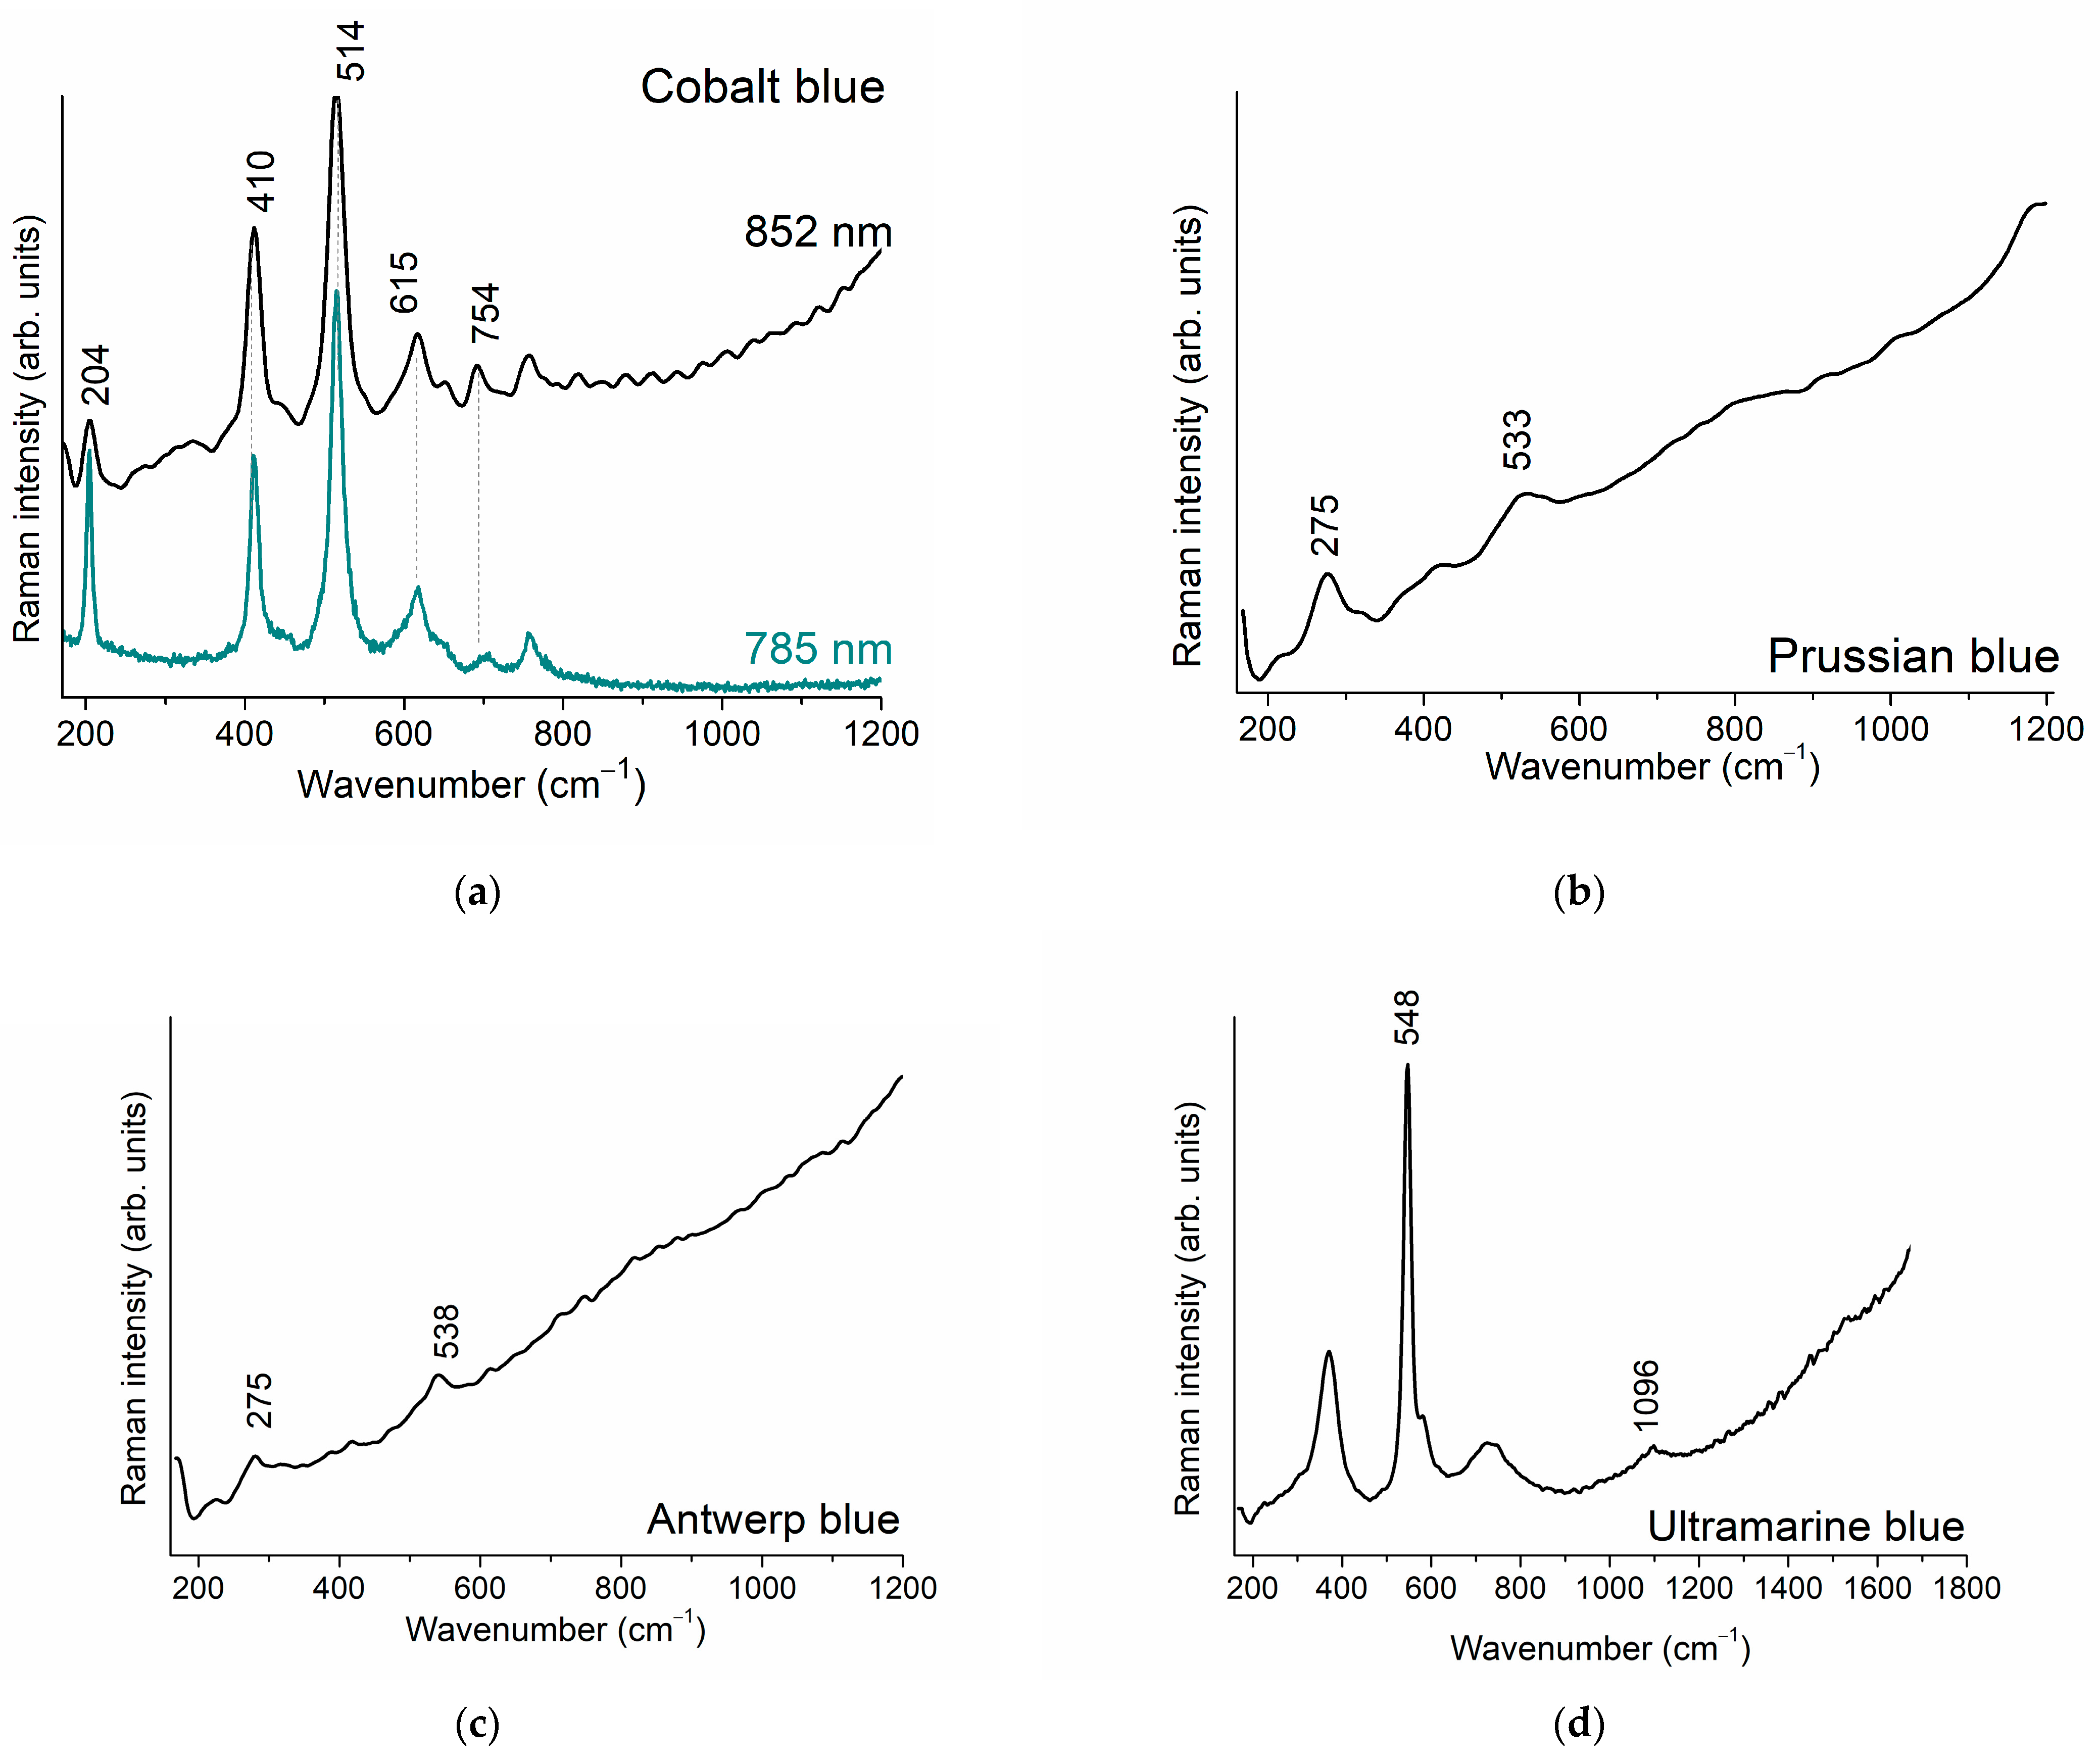
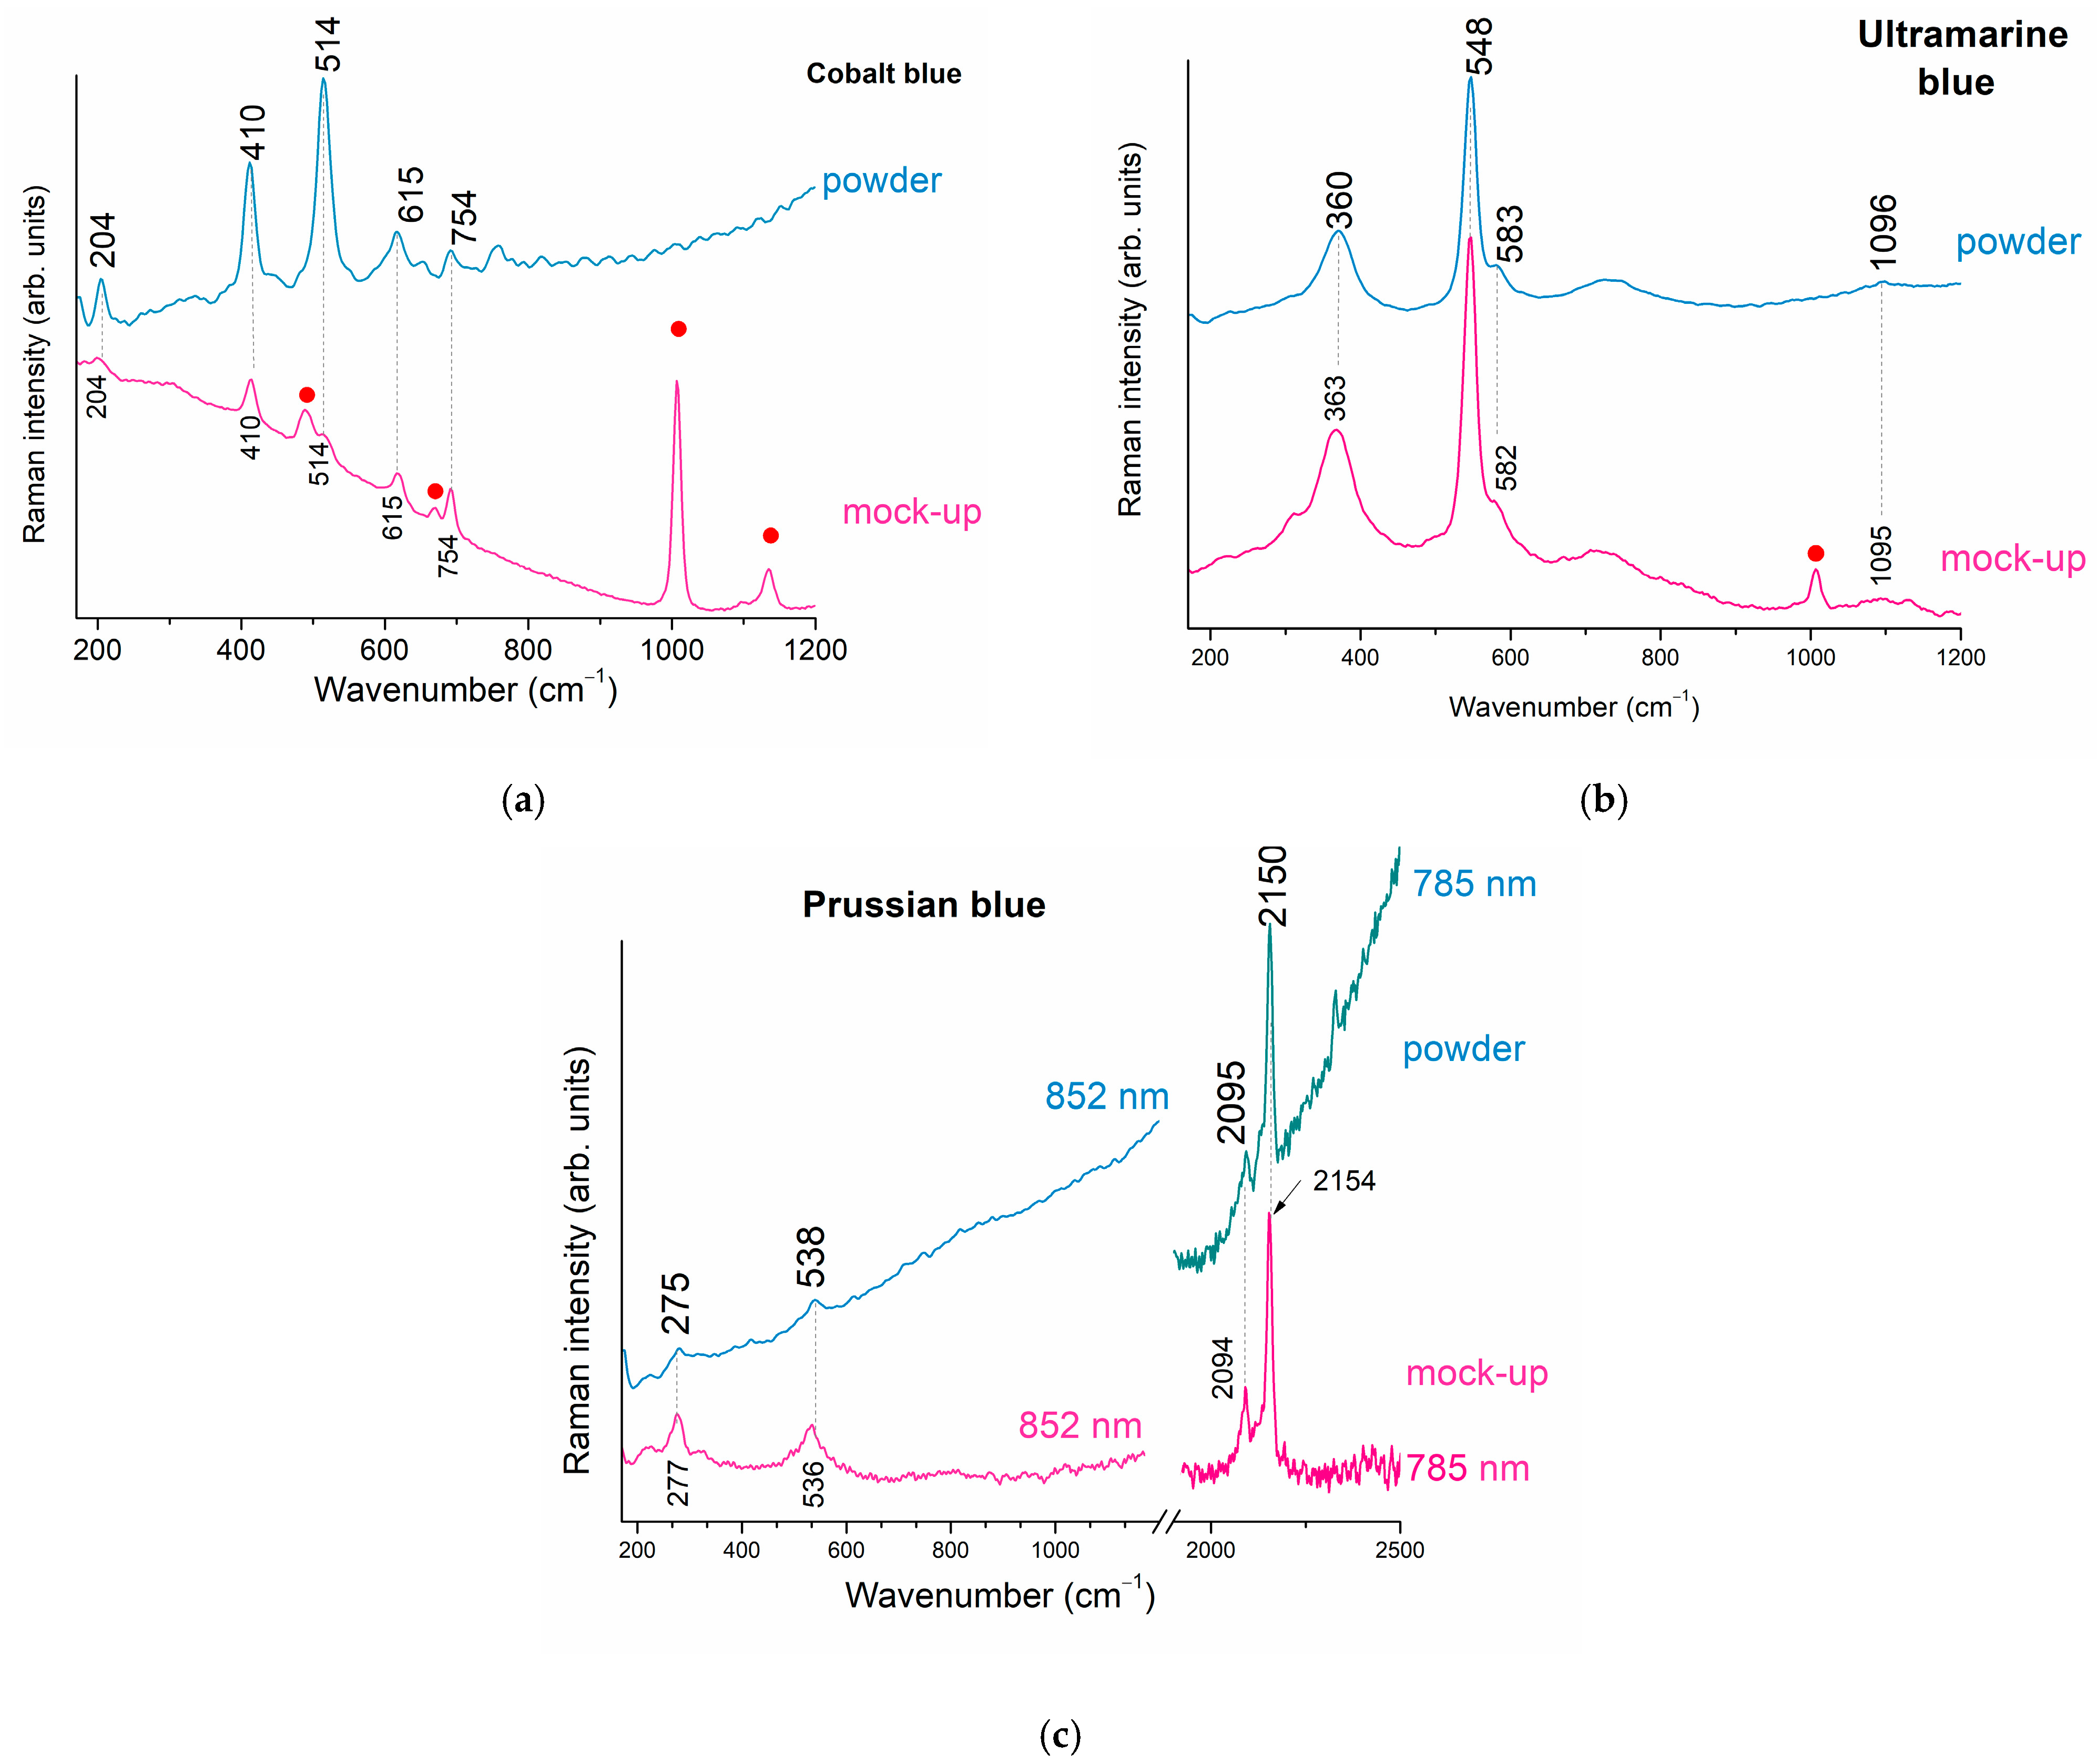
3.1. Blue Pigments
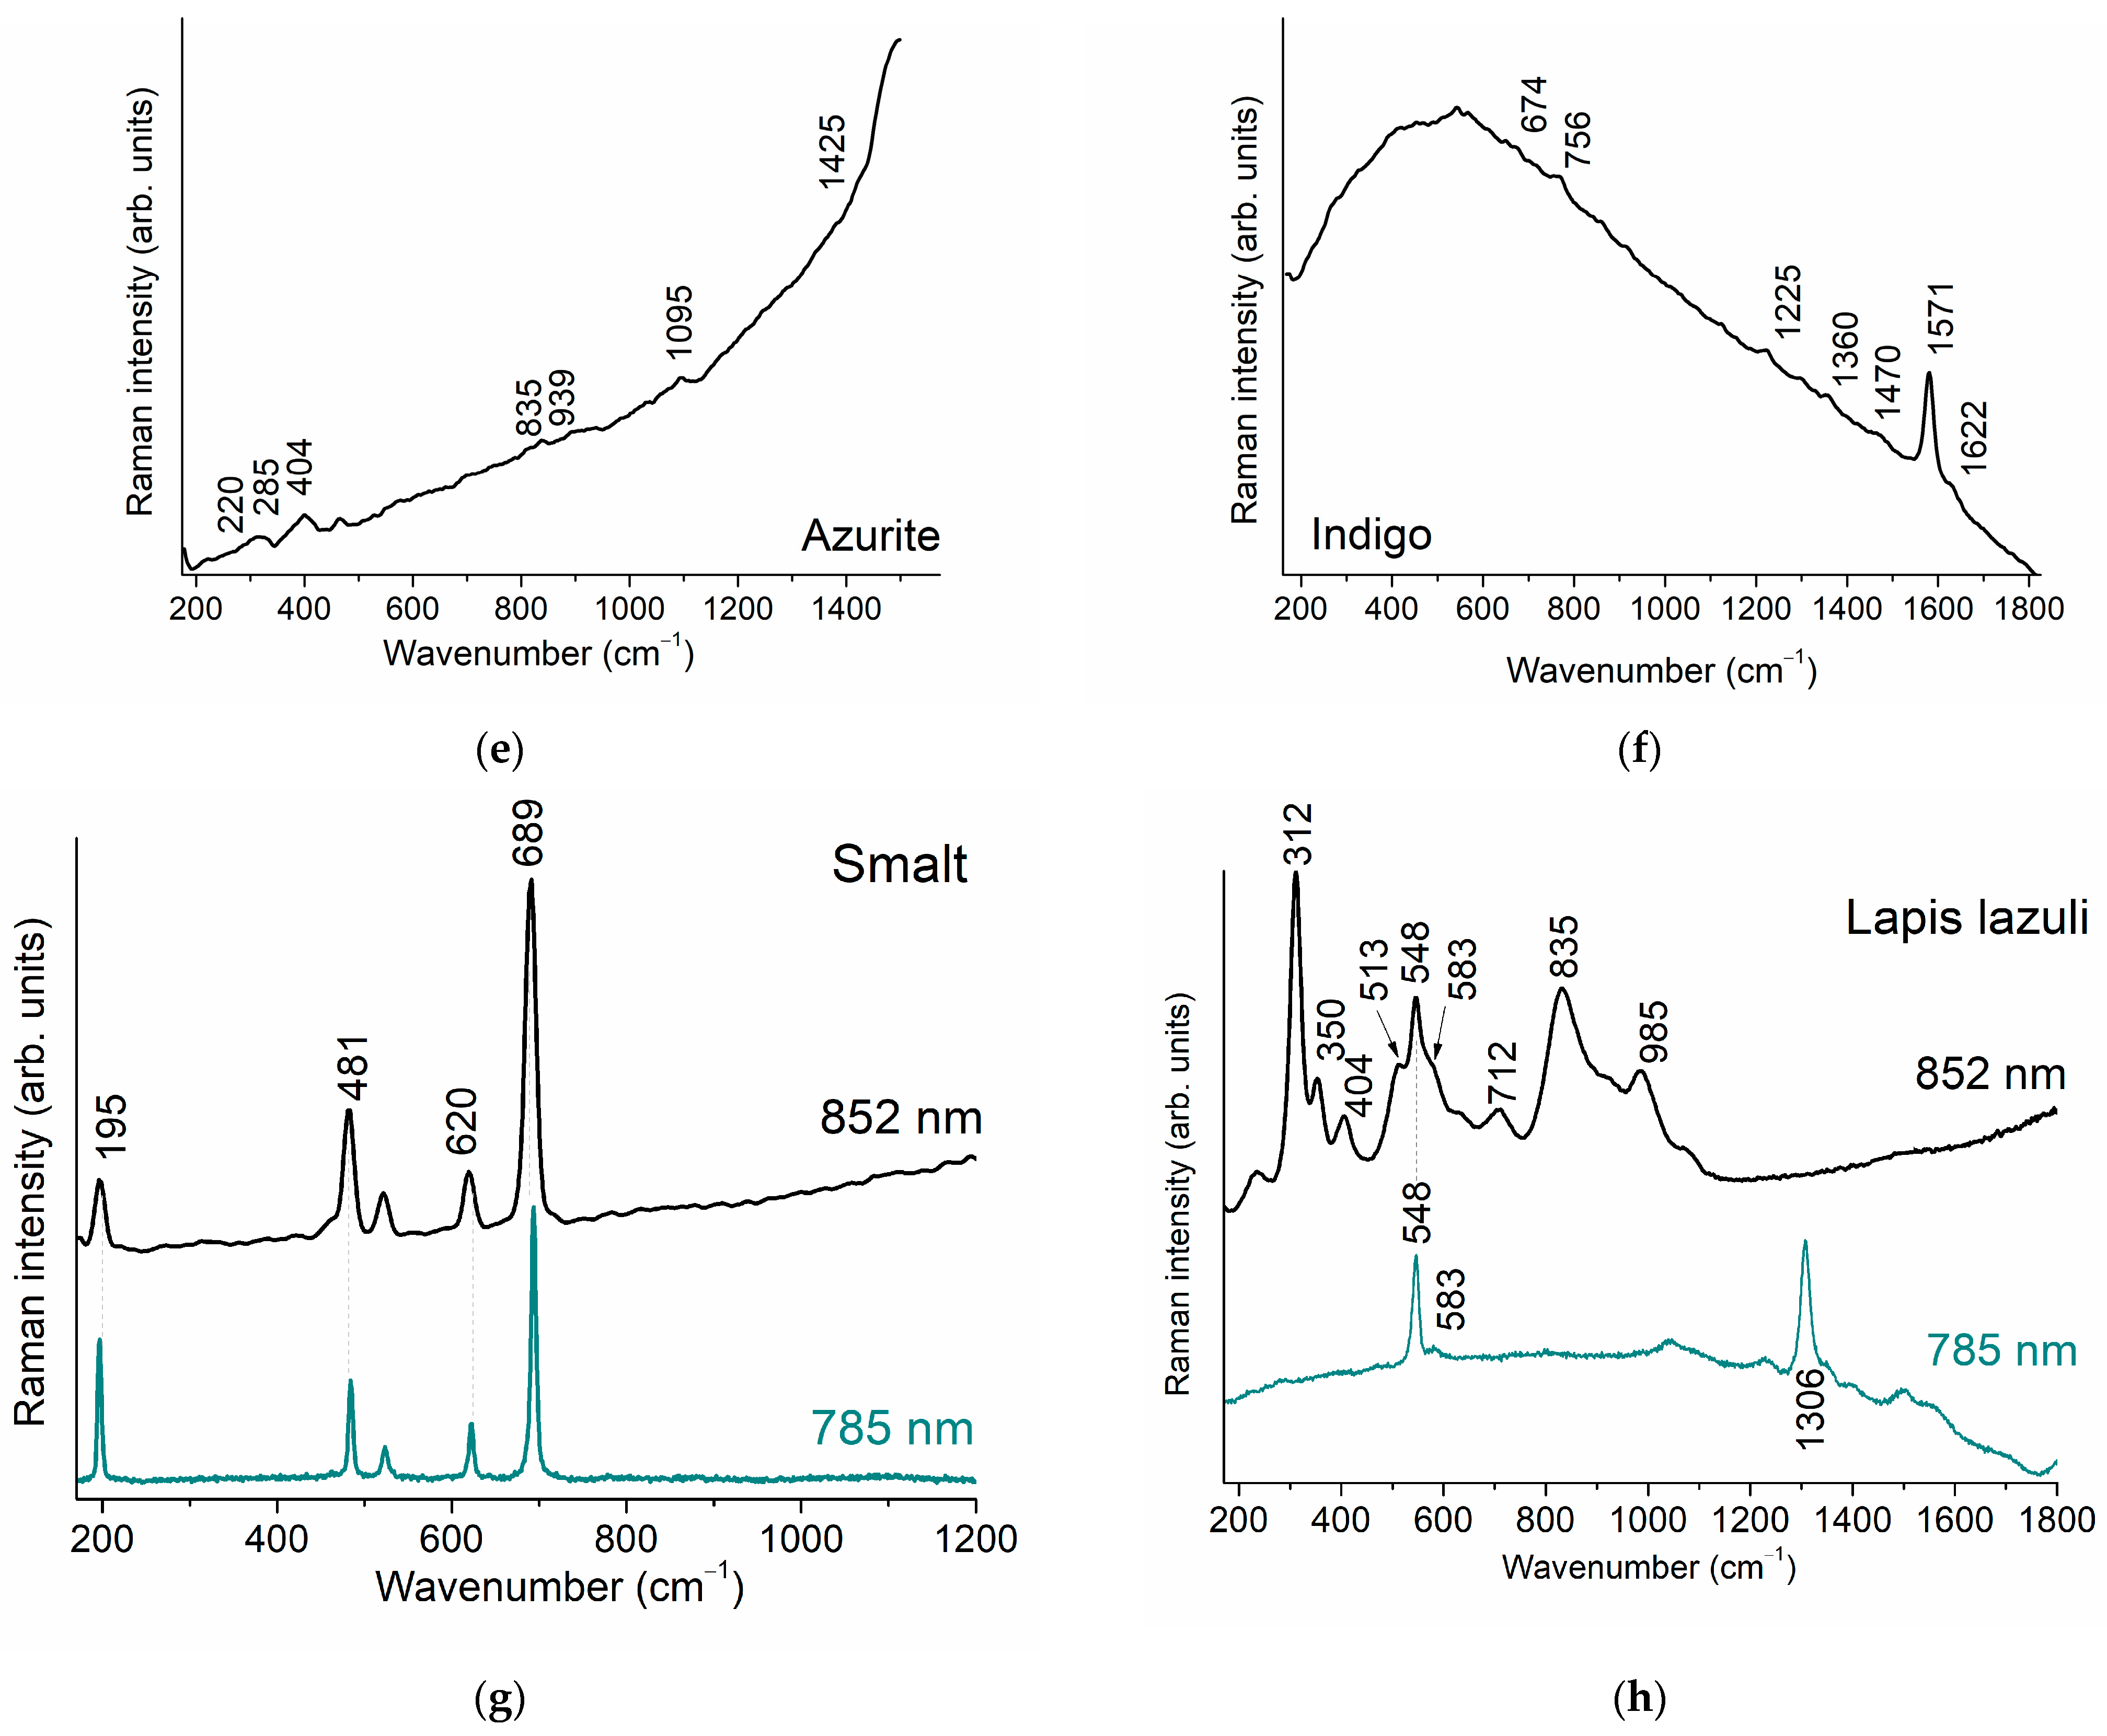
3.2. Green Pigments
3.3. Yellow Pigments
3.4. Red Pigments
3.5. White and Black Pigments
4. Mock-Up Panel Painting
5. Conclusions
Author Contributions
Funding
Data Availability Statement
Conflicts of Interest
Appendix A

| Name | Band Wavenumber (cm−1) and Relative Intensity at 852 nm of Laser Excitation | Raman Assignments | Figure |
|---|---|---|---|
| Cobalt blue [64] | 204 | Complete transition of AO4 | Figure 4a |
| 410 | δs AO4 | ||
| 514, 615 | νas AO4 | ||
| 754 | νs AO4 | ||
| Prussian blue [65] | 275, 538 | Fe-CN-Fe deformation vibration and νs Fe-C | Figure 4b |
| Antwerp blue | 275, 533 | * See Prussian blue | Figure 4c |
| Ultramarine blue [67] | 258 | δS3− | Figure 4d |
| 375 | - | ||
| 548 | νsS3- | ||
| 1096 | 3νsS3− | ||
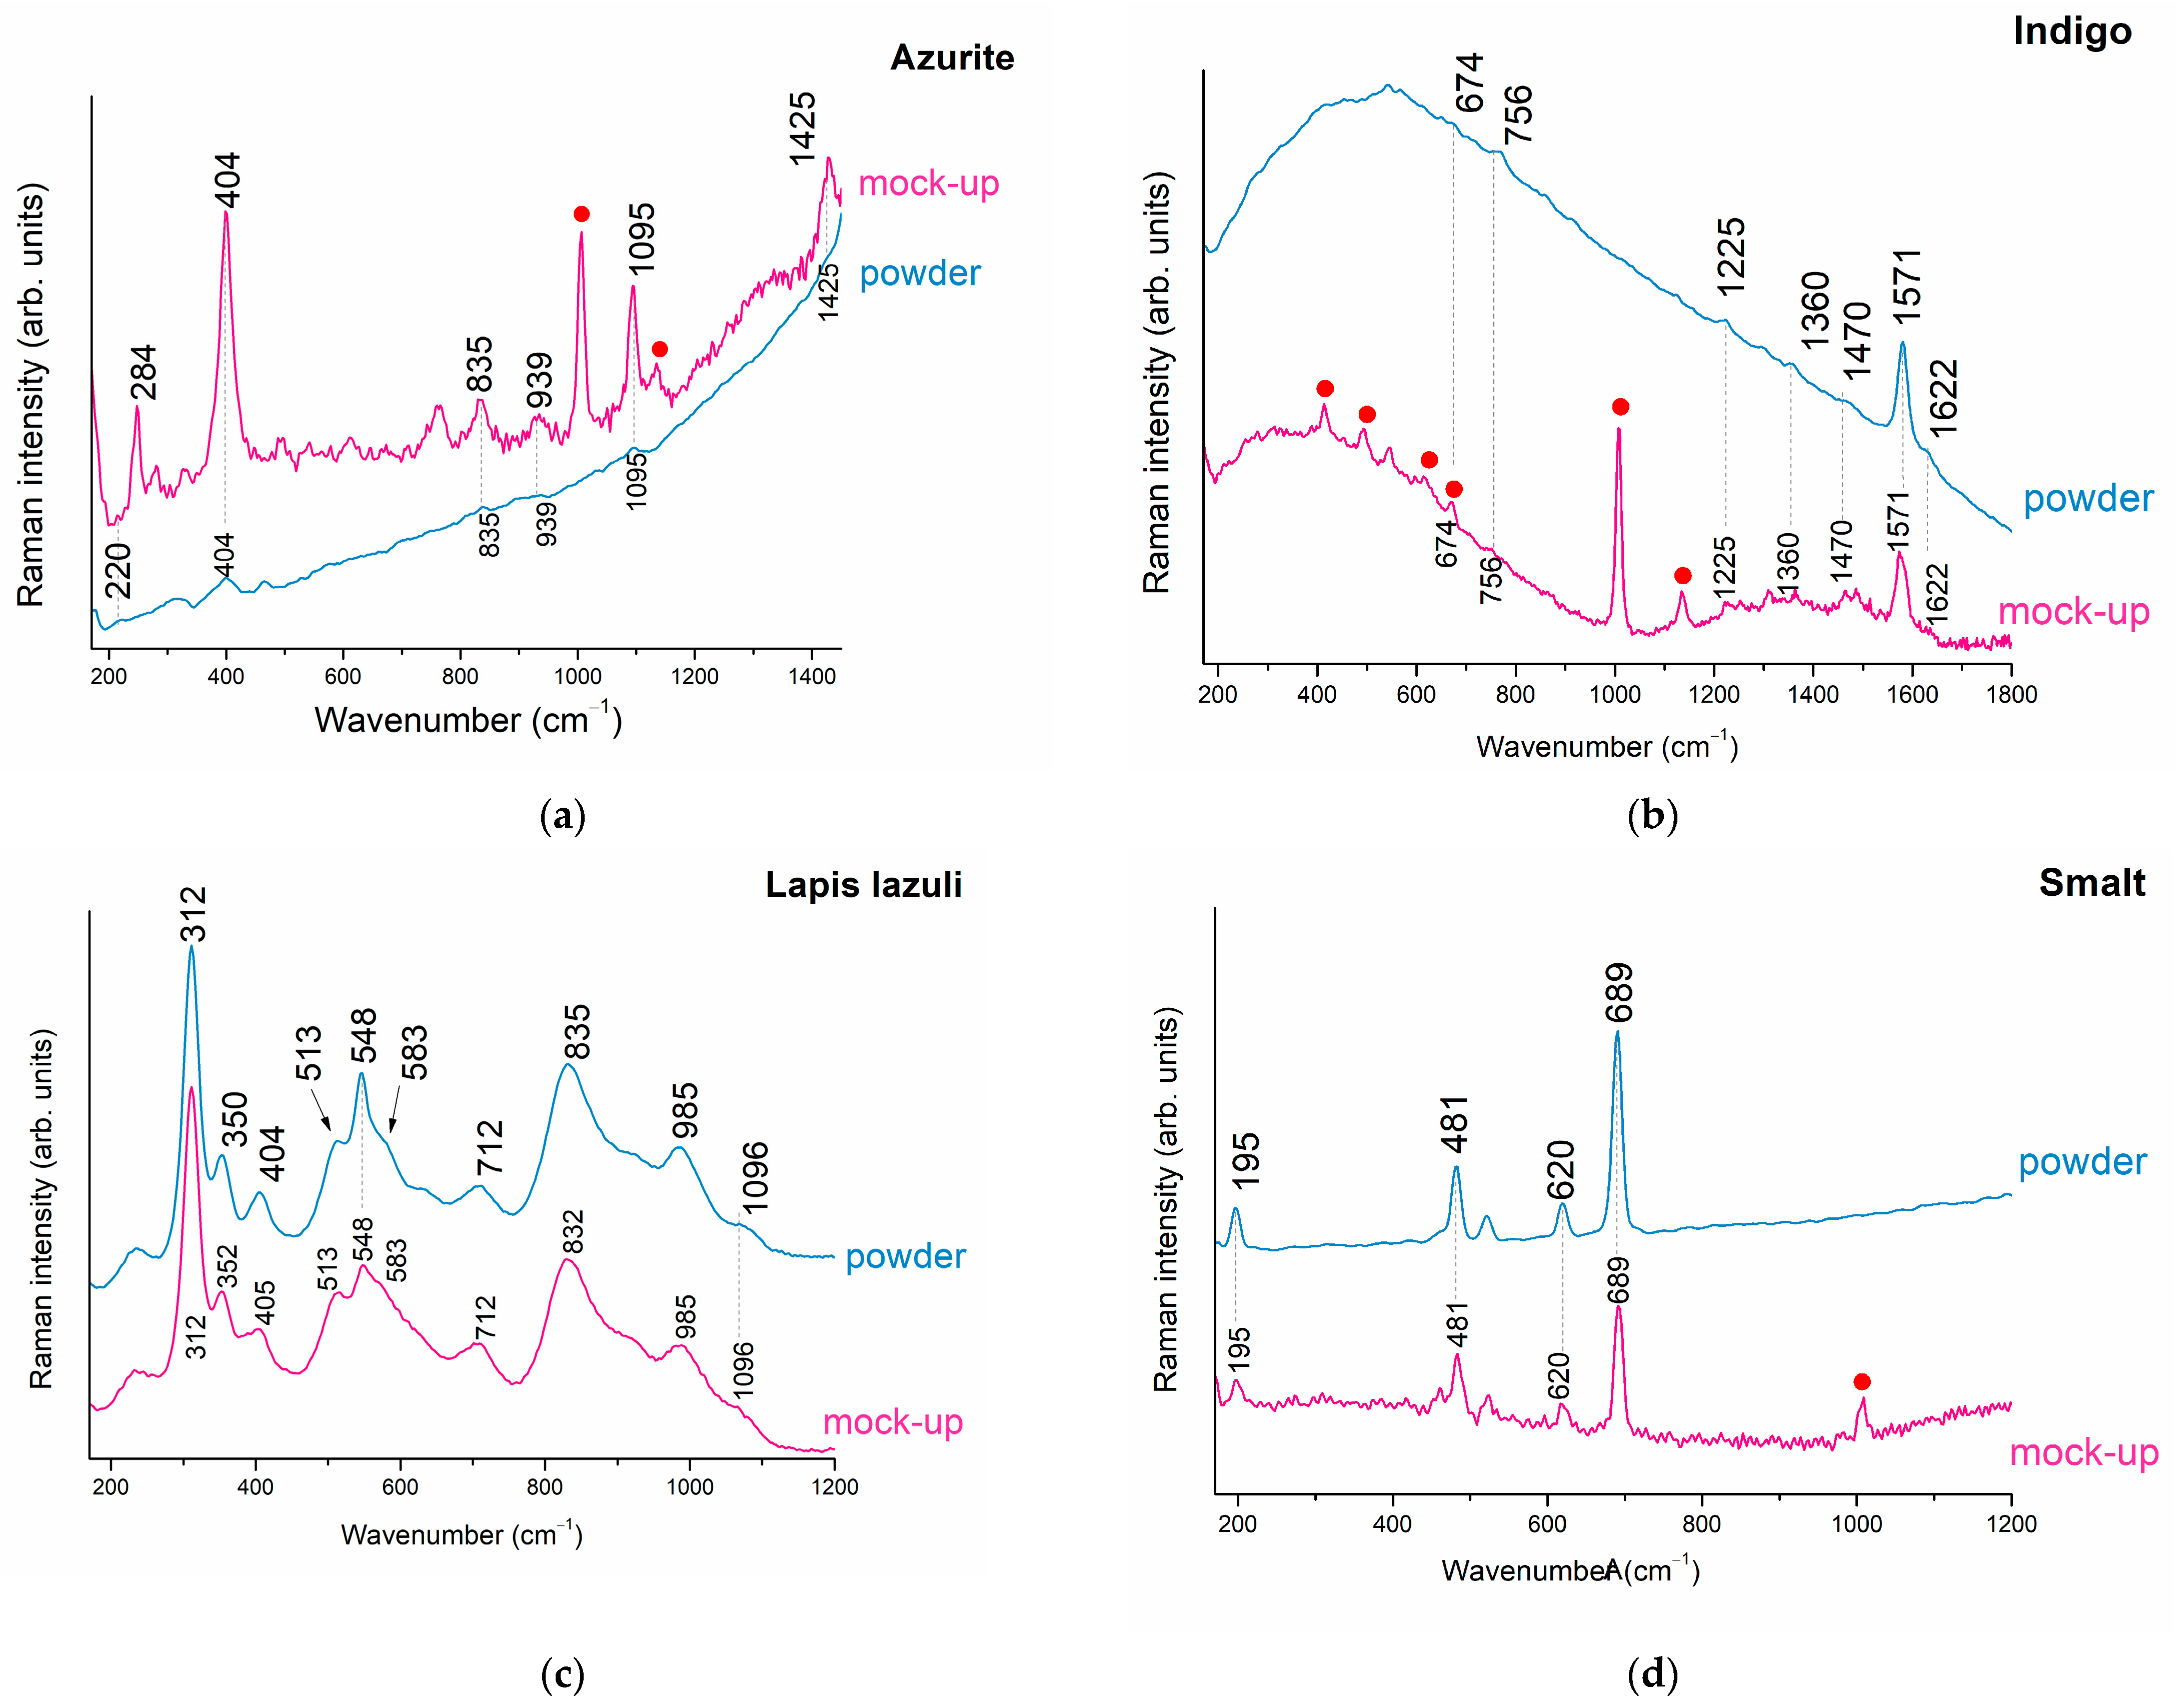
| Azurite [68] | 320, 404 | Lattice mode | Figure 4e |
| 939 | δO-H out-of-plane | ||
| 1095 | νsCO3 | ||
| Indigo [70] | 674 | - | Figure 4f |
| 756 | - | ||
| 1225 | ρN-H | ||
| 1360, 1571, 1622 | νsC=C, C=O, and N–H | ||
| 1470 | ρC-H | ||
| 1571 | νs C=C, C=O, and N–H | ||
| Smalt [71] | 195, 481, 620 | The breathing vibration mode of the T–O–T substructure | Figure 4g |
| 689 | Si-O-Si vibration mode of SiO4 | ||
| Lapis lazuli [74] | 548 | νsS3- | Figure 4h |
| 1306 | Luminescence band of minerals accompanying genuine lazurite | ||
| Green earth [20] | 200, 277 | Internal vibrations of the MoO6 | Figure 5a |
| 393, 545 | vibrational Modes of the SiO4 | ||
| Cobalt green [20] | 340, 460, 520 | - | Figure 5b |
| 713 | νs CoO6 | ||
| Chromium oxide [80] | 297, 350, 528, 615 | Eg | Figure 5c |
| 554 | A1g | ||
| Viridian [81] | 262 | CrO2 | Figure 5d |
| 487, 584 | α-CrOOH | ||
| Malachite [69] | 219, 270, 350, 430 | Lattice mode | Figure 5e |
| 816, 834 | δs CO3 | ||
| 1095 | νs CO3 | ||
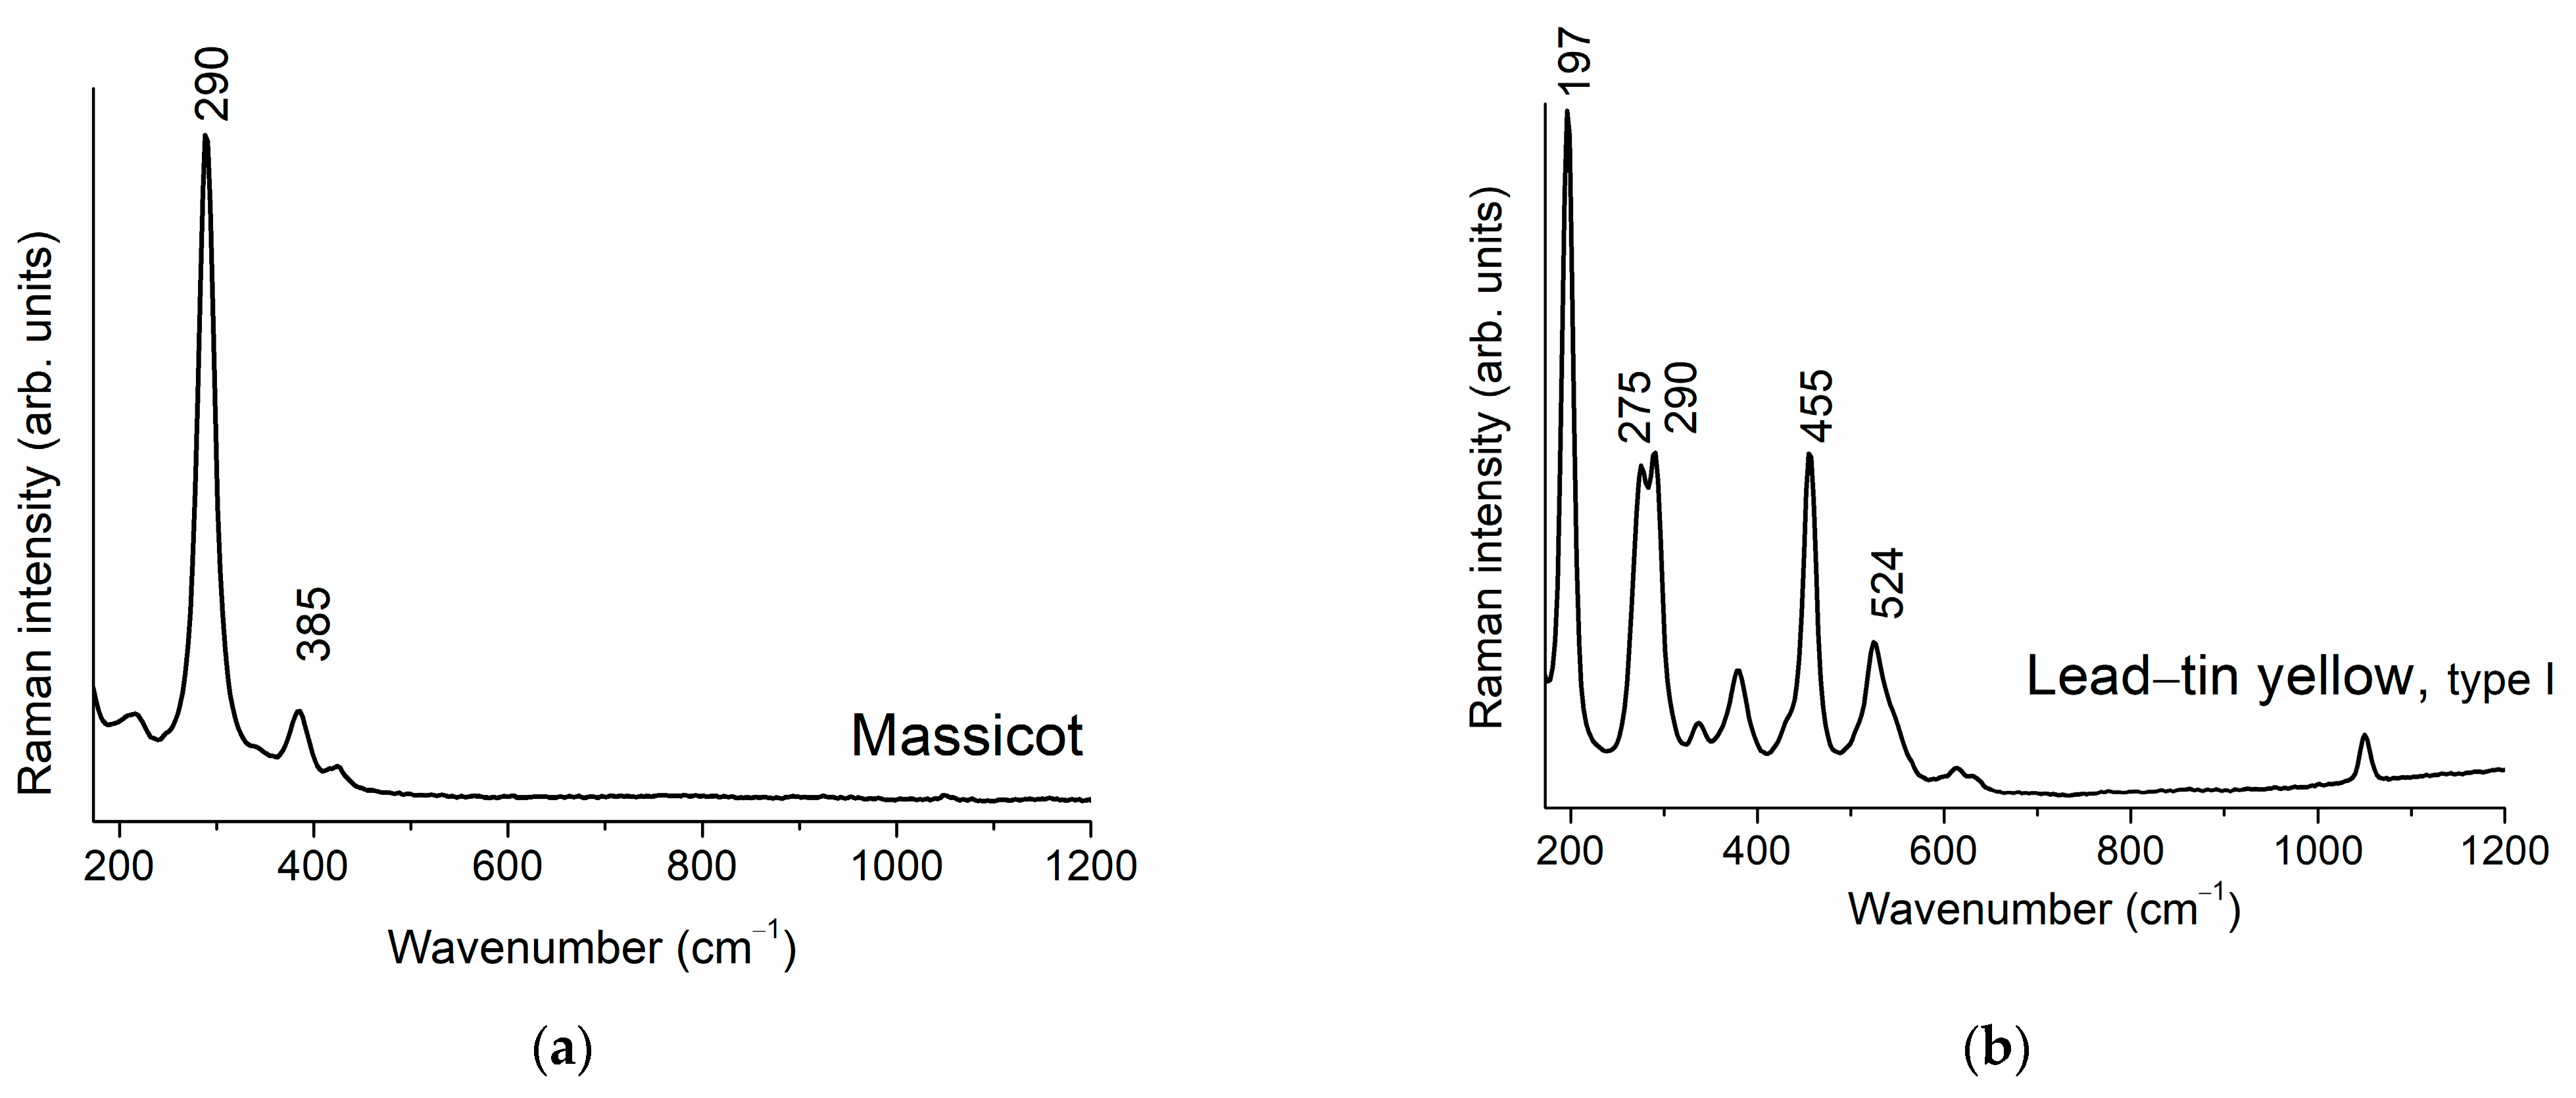
| Massicot [45] | 290, 385 | - | Figure 6a |
| Lead–tin yellow [82] | 197 | νs Pb-O | Figure 6b |
| 275, 290, 455, 524 | - | ||
| Naples yellow [83] | 290, 318, 348, 440 | Vibrational mode of Sb-O and PbO | Figure 6c |
| 510 | νs Sb-O | ||
| 613 | - | ||
| Chrome yellow [45] | 339, 360, 379, 402 | - | Figure 6d |
| 841 | νs Cr-O | ||
| Cadmium yellow [84,85] | 212 | LA of ZnS crystal lattice | Figure 6e |
| 298, 597 | LO+2E2 + overtones 2LO+2E2 of CdS crystal lattice | ||
| Yellow ochre [86] | 240, 480 | - | Figure 6f |
| 300 | δsFe-OH | ||
| 387 | νs Fe-O-Fe/-OH | ||
| 549 | νas Fe-OH | ||
| Raw sienna [86] | 240, 480 | - | Figure 6g |
| 300 | δsFe-OH | ||
| 390 | νs Fe-O-Fe/-OH | ||
| 550 | νas Fe-OH | ||
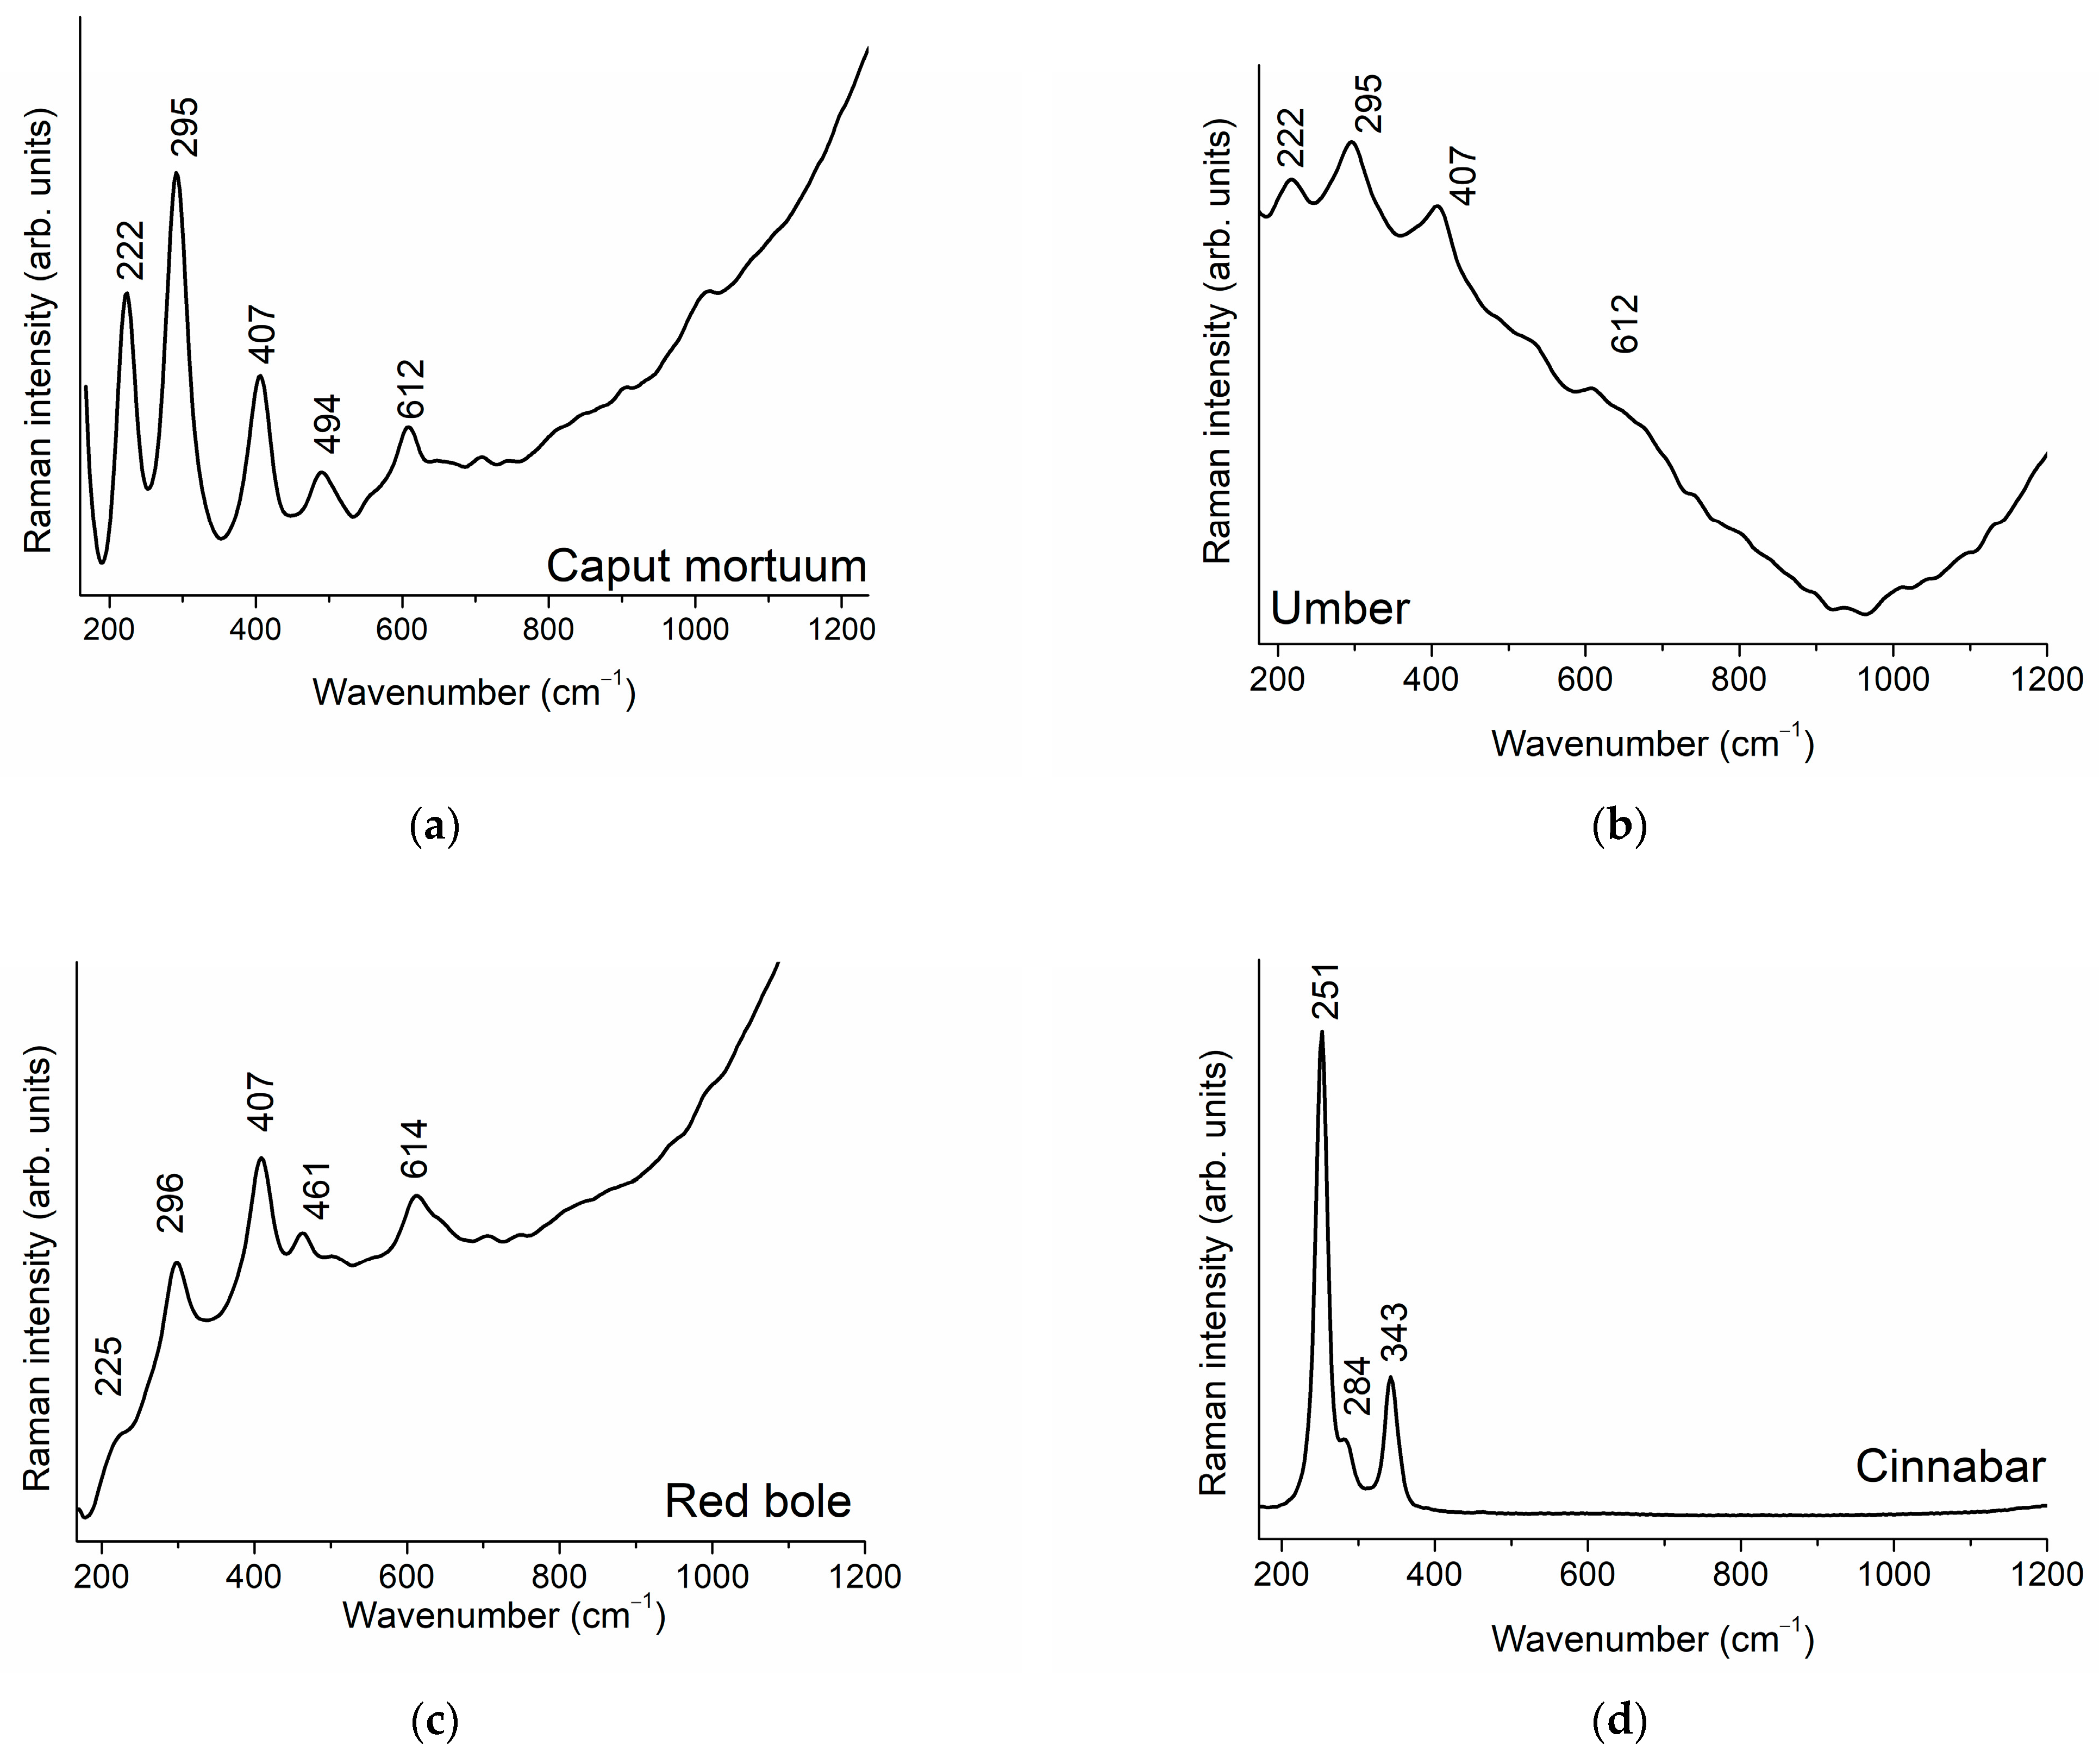
| Caput mortuum and umber [45] | 222, 494 | νs Fe-O | Figure 7a,b |
| 295,612 | δs Fe-O | ||
| 407 | νs Fe-O-Fe/-OH | ||
| Red bole [86] | 225 | νs Fe-O | Figure 7c |
| 296, 614 | Symmetric bending Fe-O | ||
| 407 | νas Fe-O-Fe/-OH | ||
| Cinnabar [87] | 251, 284, 343 | νs HgS | Figure 7d |
| Carmin naccarat [88] | 471 | Skeletal vibrations | Figure 7e |
| 1110 | δ(OH) + δ(CH) | ||
| 1252 | Gly | ||
| 1313 | δ(OH) + δ(CH) + δring | ||
| 1358 | Gly | ||
| 1426 | Gly | ||
| 1491 | δCH(m | ||
| 1530 | δ(OH) + δ(CH) - | ||
| Alizarin crimson | 238, 483, 655, 840, 903, 1020, 1047, 1164, 1190, 1223, 1292, 1328, 1358, 1480, 1522, 1574,1639 | - | Figure 7f |
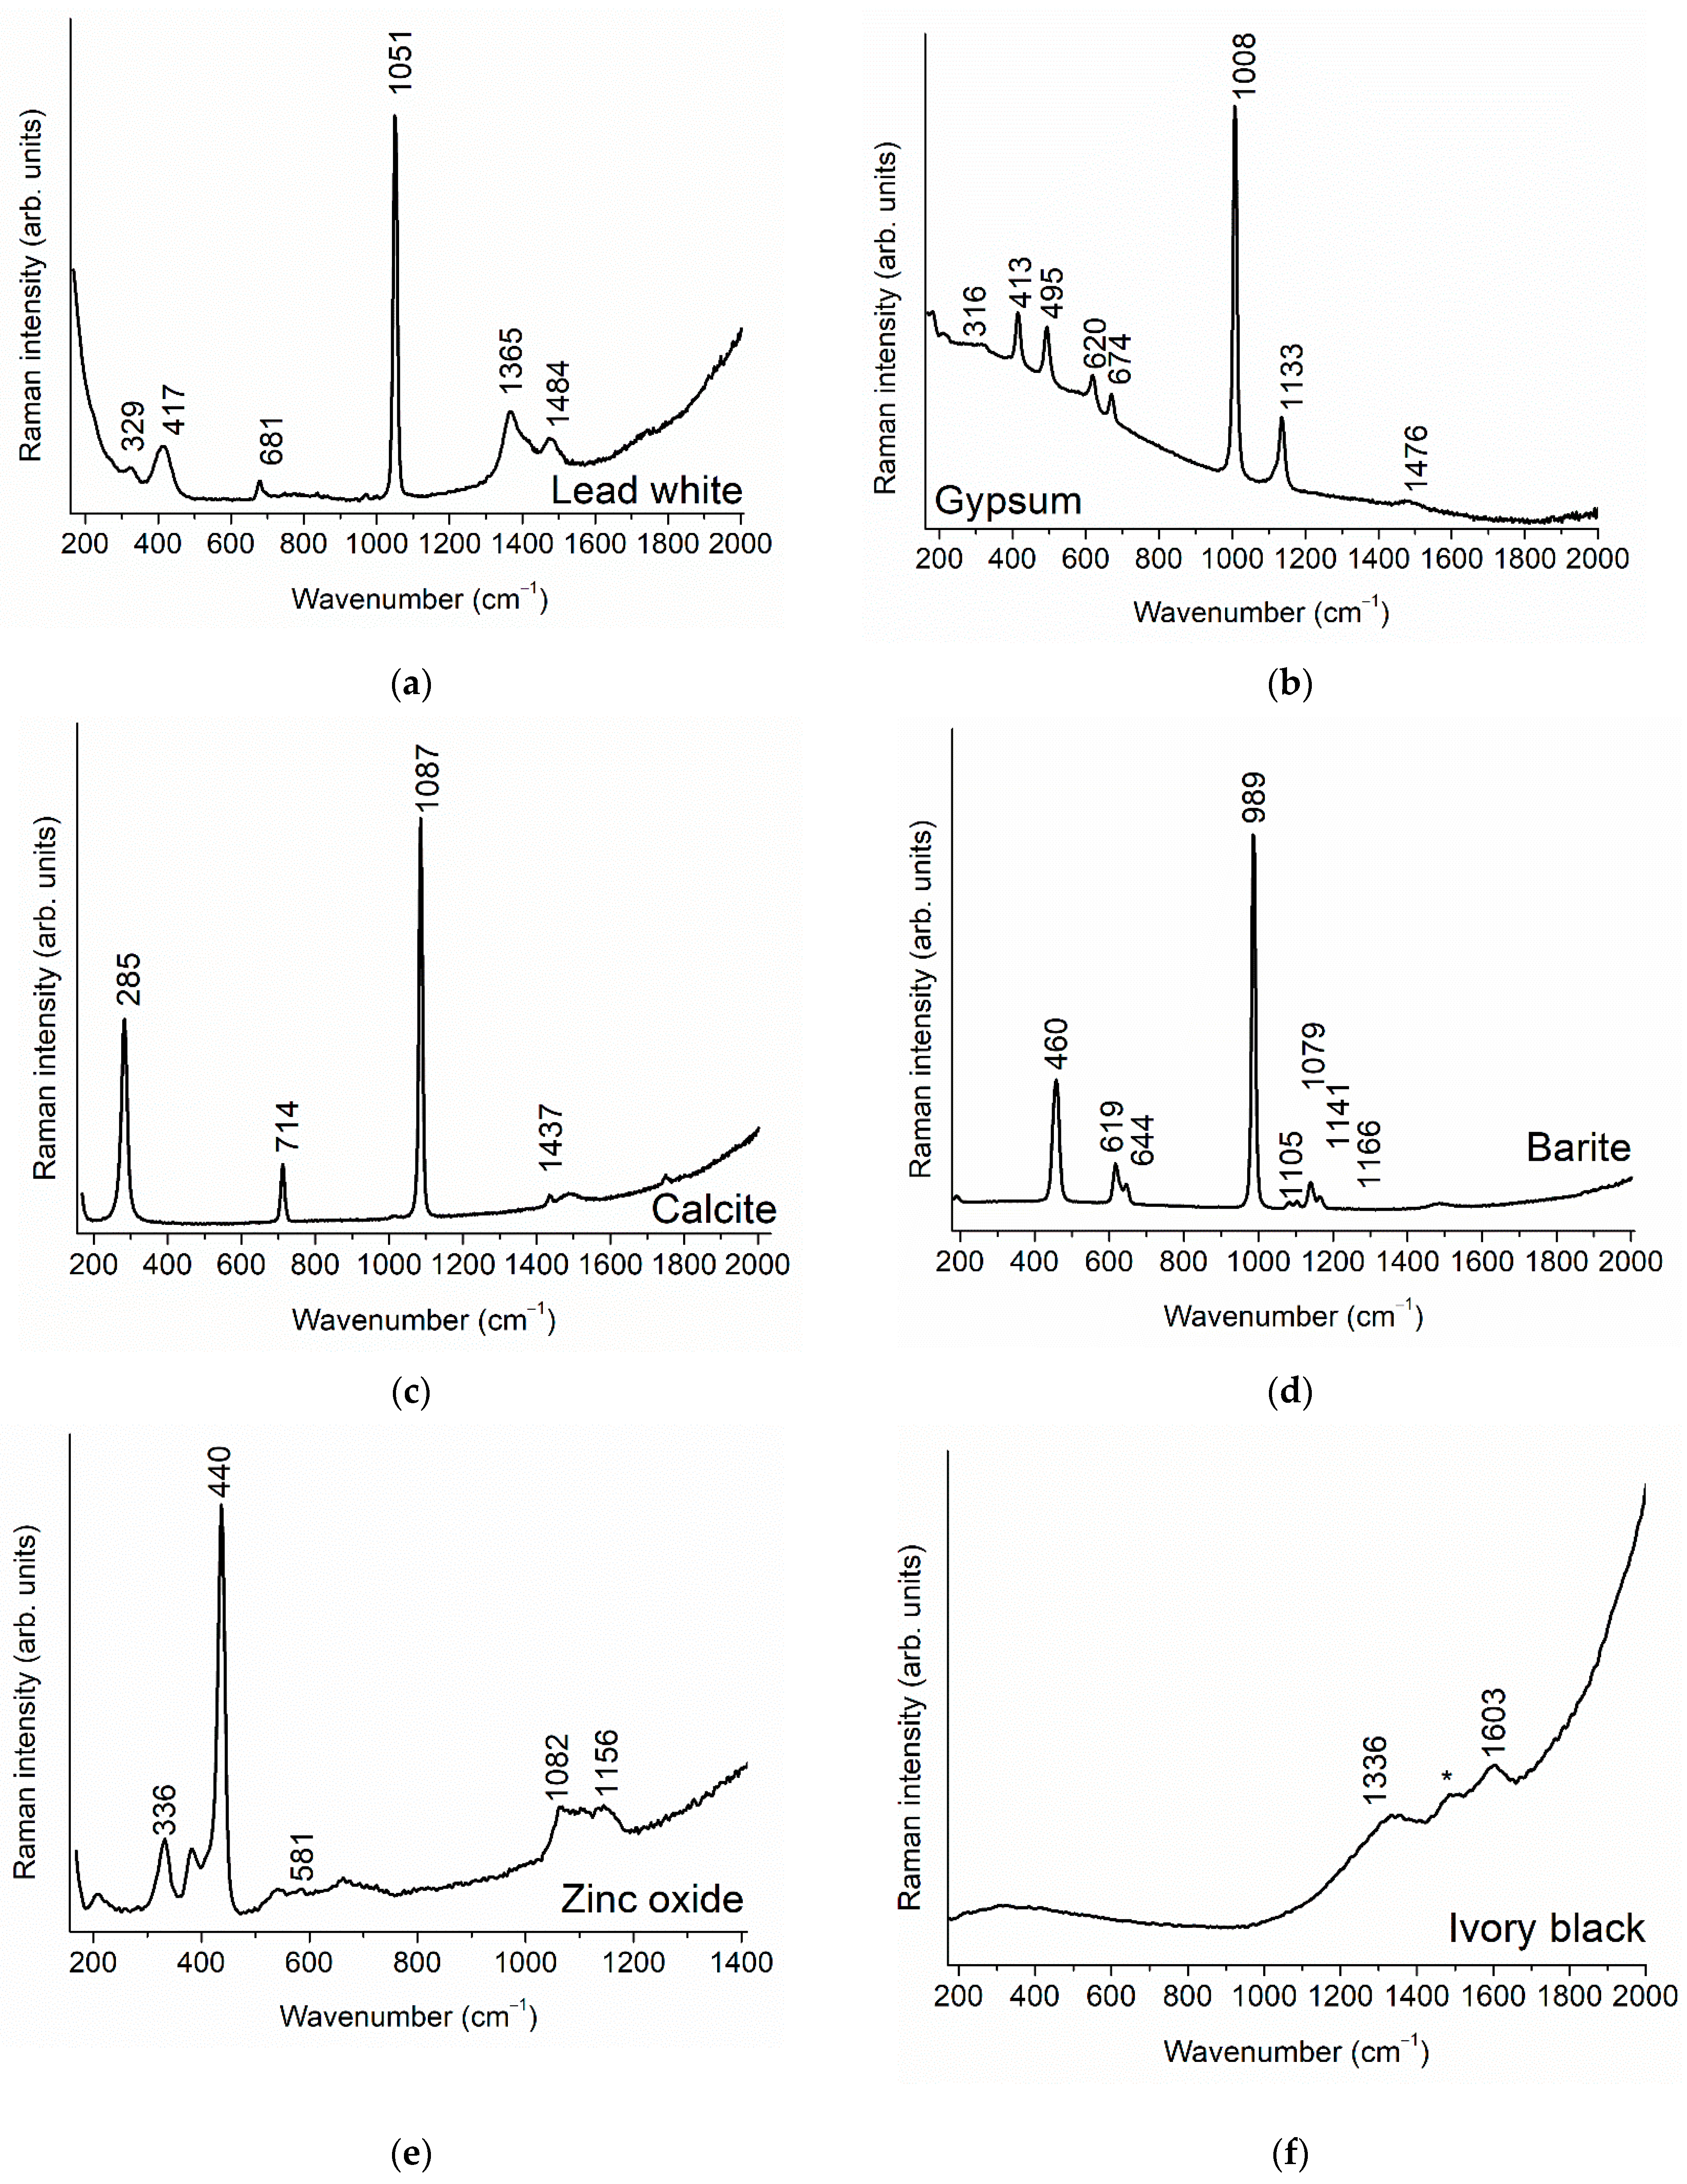
| Lead white [68,89] | 329, 417 | - | Figure 8a |
| 681, 1051 | CCO32− | ||
| 1365, 1484 | νasCO32− | ||
| Selenite, gypsum [78] | 316 | T(H2O, Ca) | Figure 8b |
| 413, 495 | δSSO42− | ||
| 620, 674 | δasSO42− | ||
| 1008 | νsSO42− | ||
| 1133, 1476 | νasSO42− | ||
| Calcite [68] | 285 | Translatory oscillations of CO3 | Figure 8c |
| 714 | δasCO32− | ||
| 1087 | νaCO32− | ||
| 1437 | νasCO32− | ||
| Barite [90] | 460 | δsSO42− | Figure 8d |
| 619, 644 | δasSO42− | ||
| 989 | νsSO42− | ||
| 1079, 1105, 1141, 1166 | νasSO42− | ||
| Zinc oxide [91] | 440, 336, 581 | - | Figure 8e |
| 1156 | Boundary photons | ||
| Ivory black [19] | 1336 | C-C A1g | Figure 8f |
| 1603 | C-C in-plane stretching |
References
- Vandenabeele, P. Practical Raman Spectroscopy: An Introduction; Wiley: Chichester, UK, 2013; ISBN 978-1-119-96190-1. [Google Scholar]
- Odelli, E.; Rousaki, A.; Raneri, S.; Vandenabeele, P. Advantages and Pitfalls of the Use of Mobile Raman and XRF Systems Applied on Cultural Heritage Objects in Tuscany (Italy). Eur. Phys. J. Plus 2021, 136, 449. [Google Scholar] [CrossRef]
- Bell Ian, M.; Clarck Robin, J.K.; Peter, J. Gibbs Raman Spectroscopic Library of Natural and Synthetic Pigments (Pre-N 1850 AD). Spectrochim. Acta Part A 1997, 53, 2159–2179. [Google Scholar] [CrossRef]
- Home|IRUG. Available online: http://www.irug.org/ (accessed on 28 March 2024).
- Cortea, I.M.; Angheluță, L.; Chiroșca, A.; Serițan, G. INFRA-ART Spectral Library: A New Open Access Infrastructure for Heritage Science. In Lasers in the Conservation of Artworks XIII; CRC Press: London, UK, 2023; pp. 37–47. ISBN 978-1-00-338687-2. [Google Scholar]
- Lafuente, B.; Downs, R.T.; Yang, H.; Stone, N. 1. The Power of Databases: The RRUFF Project. In Highlights in Mineralogical Crystallography; Armbruster, T., Danisi, R.M., Eds.; De Gruyter: Berlin, Germany, 2015; pp. 1–30. ISBN 978-3-11-041704-3. [Google Scholar]
- FT Raman Reference Spectra of Inorganics | The Infrared and Raman Discussion Group. Available online: https://www.irdg.org/ijvs/library-of-spectra (accessed on 28 March 2024).
- SOPRANO. Available online: https://soprano.kikirpa.be/ (accessed on 28 March 2024).
- Caggiani, M.C.; Cosentino, A.; Mangone, A. Pigments Checker Version 3.0, a Handy Set for Conservation Scientists: A Free Online Raman Spectra Database. Microchem. J. 2016, 129, 123–132. [Google Scholar] [CrossRef]
- Burgio, L.; Clark, R.J.H. Library of FT-Raman Spectra of Pigments, Minerals, Pigment Media and Varnishes, and Supplement to Existing Library of Raman Spectra of Pigments with Visible Excitation. Spectrochim. Acta Part A Mol. Biomol. Spectrosc. 2001, 57, 1491–1521. [Google Scholar] [CrossRef] [PubMed]
- Lomax, S.Q. The IRUG Raman Spectral Web Database: Objectives, Progress and Plans. E-Preserv. Sci. 2013, 10, 38–41. [Google Scholar]
- Buzgar, N.; Apopei, A.; Buzatu, A. Romanian Database of Raman Spectroscopy. 2009. Available online: http://rdrs.uaic.ro/ (accessed on 28 March 2024).
- Fremout, W.; Saverwyns, S. Identification of Synthetic Organic Pigments: The Role of a Comprehensive Digital Raman Spectral Library. J. Raman Spectrosc. 2012, 43, 1536–1544. [Google Scholar] [CrossRef]
- Vandenabeele, P.; Moens, L.; Edwards, H.G.M.; Dams, R. Raman Spectroscopic Database of Azo Pigments and Application to Modern Art Studies. J. Raman Spectrosc. 2000, 31, 509–517. [Google Scholar] [CrossRef]
- Bouchard, M.; Smith, D.C. Catalogue of 45 Reference Raman Spectra of Minerals Concerning Research in Art History or Archaeology, Especially on Corroded Metals and Coloured Glass. Spectrochim. Acta Part A Mol. Biomol. Spectrosc. 2003, 59, 2247–2266. [Google Scholar] [CrossRef] [PubMed]
- Scherrer, N.C.; Stefan, Z.; Francoise, D.; Annette, F.; Renate, K. Synthetic Organic Pigments of the 20th and 21st Century Relevant to Artist’s Paints: Raman Spectra Reference Collection. Spectrochim. Acta Part A Mol. Biomol. Spectrosc. 2009, 73, 505–524. [Google Scholar] [CrossRef]
- Martina, I.; Wiesinger, R.; Jembrith-Simburger, D.; Schreiner, M. Micro-Raman Characterisation of Silver Corrosion Products: Instrumental Set up and Reference Databasee. E-Preserv. Sci. 2012, 9, 1–8. [Google Scholar]
- Pozzi, F.; Lombardi, J.R.; Leona, M. Winsor & Newton Original Handbooks: Asurface-Enhanced Raman Scattering (SERS) andRaman Spectral Database of Dyes from Modernwatercolor Pigments. Herit. Sci. 2013, 1, 23. [Google Scholar]
- Coccato, A.; Jehlicka, J.; Moens, L.; Vandenabeele, P. Raman Spectroscopy for the Investigation of Carbon-based Black Pigments. J. Raman Spectrosc. 2015, 46, 1003–1015. [Google Scholar] [CrossRef]
- Coccato, A.; Bersani, D.; Coudray, A.; Sanyova, J.; Moens, L.; Vandenabeele, P. Raman Spectroscopy of Green Minerals and Reaction Products with an Application in Cultural Heritage Research. J. Raman Spectrosc. 2016, 47, 1429–1443. [Google Scholar] [CrossRef]
- Marucci, G.; Beeby, A.; Parker, A.W.; Nicholson, C.E. Raman Spectroscopic Library of Medieval Pigments Collected with Five Different Wavelengths for Investigation of Illuminated Manuscripts. Anal. Methods 2018, 10, 1219–1236. [Google Scholar] [CrossRef]
- Culka, A.; Jehlička, J. Identification of Gemstones Using Portable Sequentially Shifted Excitation Raman Spectrometer and RRUFF Online Database: A Proof of Concept Study. Eur. Phys. J. Plus 2019, 134, 130. [Google Scholar] [CrossRef]
- Burrafato, G.; Calabrese, M.; Cosentino, A.; Gueli, A.M.; Troja, S.O.; Zuccarello, A. ColoRaman Project: Raman and Fluorescence Spectroscopy of Oil, Tempera and Fresco Paint Pigments. J. Raman Spectrosc. 2004, 35, 879–886. [Google Scholar] [CrossRef]
- Castro, K.; Pérez-Alonso, M.; Rodríguez-Laso, M.D.; Fernández, L.A.; Madariaga, J.M. On-Line FT-Raman and Dispersive Raman Spectra Database of Artists’ Materials (e-VISART Database). Anal. Bioanal. Chem. 2005, 382, 248–258. [Google Scholar] [CrossRef]
- Sessa, C.; Steuer, C.; Quintero Balbas, D.; Sciutto, G.; Prati, S.; Stege, H. Analytical Studies on Commercial Artists’ Colour Charts from Das Deutsche Farbenbuch (1925)—Identification of Synthetic and Natural Organic Colourants by Raman Microscopy, Surface-Enhanced Raman Spectroscopy and Metal Underlayer ATR-FTIR Spectroscopy. Herit. Sci. 2022, 10, 109. [Google Scholar] [CrossRef]
- Thorley, F.C.; Baldwin, K.J.; Lee, D.C.; Batchelder, D.N. Dependence of the Raman Spectra of Drug Substances upon Laser Excitation Wavelength. J. Raman Spectrosc. 2006, 37, 335–341. [Google Scholar] [CrossRef]
- Ferraro, J.R.; Nakamoto, K.; Brown, C.W. Introductory Raman Spectroscopy, 2nd ed.; Academic Press: Amsterdam, The Netherlands; Boston, MA, USA, 2003; ISBN 978-0-12-254105-6. [Google Scholar]
- Conti, C.; Botteon, A.; Bertasa, M.; Colombo, C.; Realini, M.; Sali, D. Portable Sequentially Shifted Excitation Raman Spectroscopy as an Innovative Tool for in Situ Chemical Interrogation of Painted Surfaces. Analyst 2016, 141, 4599–4607. [Google Scholar] [CrossRef]
- Jehlička, J.; Culka, A. Critical Evaluation of Portable Raman Spectrometers: From Rock Outcrops and Planetary Analogs to Cultural Heritage—A Review. Anal. Chim. Acta 2022, 1209, 339027. [Google Scholar] [CrossRef]
- Vagnini, M.; Gabrieli, F.; Daveri, A.; Sali, D. Handheld New Technology Raman and Portable FT-IR Spectrometers as Complementary Tools for the in Situ Identification of Organic Materials in Modern Art. Spectrochim. Acta Part A Mol. Biomol. Spectrosc. 2017, 176, 174–182. [Google Scholar] [CrossRef] [PubMed]
- Daveri, A.; Paziani, S.; Marmion, M.; Harju, H.; Vidman, A.; Azzarelli, M.; Vagnini, M. New Perspectives in the Non-Invasive, in Situ Identification of Painting Materials: The Advanced MWIR Hyperspectral Imaging. TrAC Trends Anal. Chem. 2018, 98, 143–148. [Google Scholar] [CrossRef]
- Pozzi, F.; Basso, E.; Rizzo, A.; Cesaratto, A.; Tague, T.J. Evaluation and Optimization of the Potential of a Handheld Raman Spectrometer: In Situ, Noninvasive Materials Characterization in Artworks. J. Raman Spectrosc. 2019, 50, 861–872. [Google Scholar] [CrossRef]
- Mollica Nardo, V.; Renda, V.; Bonanno, S.; Parrotta, F.; Anastasio, G.; Caponetti, E.; Saladino, M.L.; Vasi, C.S.; Ponterio, R.C. Non-Invasive Investigation of Pigments of Wall Painting in S. Maria Delle Palate Di Tusa (Messina, Italy). Heritage 2019, 2, 2398–2407. [Google Scholar] [CrossRef]
- Alberghina, M.F.; Germinario, C.; Bartolozzi, G.; Bracci, S.; Grifa, C.; Izzo, F.; La Russa, M.F.; Magrini, D.; Massa, E.; Mercurio, M.; et al. Non-Invasive Characterization of the Pigment’s Palette Used on the Painted Tomb Slabs at Paestum Archaeological Site. IOP Conf. Ser. Mater. Sci. Eng. 2020, 949, 012002. [Google Scholar] [CrossRef]
- Dal Fovo, A.; Striova, J.; Pampaloni, E.; Fedele, A.; Morita, M.M.; Amaya, D.; Grazzi, F.; Cimò, M.; Cirrincione, C.; Fontana, R. Rubens’ Painting as Inspiration of a Later Tapestry: Non-Invasive Analyses Provide Insight into Artworks’ History. Microchem. J. 2020, 153, 104472. [Google Scholar] [CrossRef]
- Giuffrida, D.; Mollica Nardo, V.; Neri, D.; Cucinotta, G.; Calabrò, I.V.; Pace, L.; Ponterio, R.C. A Multi-Analytical Study for the Enhancement and Accessibility of Archaeological Heritage: The Churches of San Nicola and San Basilio in Motta Sant’Agata (RC, Italy). Remote Sens. 2021, 13, 3738. [Google Scholar] [CrossRef]
- Sharma, A.; Singh, M.R. Execution Technique and Pigment Characteristics of Decorative Wall from 17th CE Chatta Chowk, Red Fort Complex, New Delhi. Period. Di Mineral. 2020, 90, 43–56. [Google Scholar] [CrossRef]
- Amadori, M.L.; Mengacci, V.; Vagnini, M.; Casoli, A.; Holakooei, P.; Eftekhari, N.; Lin, K.; Maekawa, Y.; Germinario, G. Organic Matter and Pigments in the Wall Paintings of Me-Taw-Ya Temple in Bagan Valley, Myanmar. Appl. Sci. 2021, 11, 11441. [Google Scholar] [CrossRef]
- Amadori, M.L.; Vagnini, M.; Vivani, R.; Anselmi, C.; Chaverdi, A.A.; Callieri, P.; Matin, E.; Mengacci, V. Advances in Characterization of Colourful Residues Unearthed in Persepolis West Craft Zone Using Microscopic and Spectroscopic Techniques. Microchem. J. 2021, 167, 106304. [Google Scholar] [CrossRef]
- Invernizzi, C.; Fiocco, G.; Iwanicka, M.; Targowski, P.; Piccirillo, A.; Vagnini, M.; Licchelli, M.; Malagodi, M.; Bersani, D. Surface and Interface Treatments on Wooden Artefacts: Potentialities and Limits of a Non-Invasive Multi-Technique Study. Coatings 2020, 11, 29. [Google Scholar] [CrossRef]
- Vagnini, M.; Anselmi, C.; Azzarelli, M.; Sgamellotti, A. Things Always Come in Three: Non-Invasive Investigations of Alexander and Roxane’s Wedding Room in Villa Farnesina. Heritage 2021, 4, 2792–2809. [Google Scholar] [CrossRef]
- Gargano, M.; Longoni, M.; Pesce, V.; Palandri, M.C.; Canepari, A.; Ludwig, N.; Bruni, S. From Materials to Technique: A Complete Non-Invasive Investigation of a Group of Six Ukiyo-E Japanese Woodblock Prints of the Oriental Art Museum E. Chiossone (Genoa, Italy). Sensors 2022, 22, 8772. [Google Scholar] [CrossRef] [PubMed]
- Longoni, M.; Beccaria, C.; Bonizzoni, L.; Bruni, S. A Silver Monochrome “Concetto Spaziale” by Lucio Fontana: A Spectroscopic Non- and Micro-Invasive Investigation of Materials. Molecules 2022, 27, 4442. [Google Scholar] [CrossRef]
- Festa, G.; Scatigno, C.; Armetta, F.; Saladino, M.L.; Ciaramitaro, V.; Nardo, V.M.; Ponterio, R.C. Chemometric Tools to Point Out Benchmarks and Chromophores in Pigments through Spectroscopic Data Analyses. Molecules 2021, 27, 163. [Google Scholar] [CrossRef] [PubMed]
- Innocenti, S.; Quintero Balbas, D.; Pezzati, L.; Fontana, R.; Striova, J. Portable Sequentially Shifted Excitation Raman Spectroscopy to Examine Historic Powders Enclosed in Glass Vials. Sensors 2022, 22, 3560. [Google Scholar] [CrossRef] [PubMed]
- Ciaramitaro, V.; Armetta, F.; Mollica Nardo, V.; Ponterio, R.C.; Saladino, M.L. Portable Spectroscopic Techniques for the Non-Invasive Identification of Two Historical Yellow Pigments: Applications and Practical Challenges. J. Phys. Conf. Ser. 2022, 2204, 012056. [Google Scholar] [CrossRef]
- Beck, M.E.; MacDonald, B.L.; Ferguson, J.R.; Adair, M.J. Red Pigment in the Central Plains: A Pawnee Case at Kitkahahki Town. Plains Anthropol. 2022, 67, 405–430. [Google Scholar] [CrossRef]
- Giuffrida, D.; Bonanno, S.; Parrotta, F.; Mollica Nardo, V.; Anastasio, G.; Saladino, M.L.; Armetta, F.; Ponterio, R.C. The Church of S. Maria Delle Palate in Tusa (Messina, Italy): Digitization and Diagnostics for a New Model of Enjoyment. Remote Sens. 2022, 14, 1490. [Google Scholar] [CrossRef]
- Raicu, T.; Zollo, F.; Falchi, L.; Barisoni, E.; Piccolo, M.; Izzo, F.C. Preliminary Identification of Mixtures of Pigments Using the paletteR Package in R—The Case of Six Paintings by Andreina Rosa (1924–2019) from the International Gallery of Modern Art Ca’ Pesaro, Venice. Heritage 2023, 6, 524–547. [Google Scholar] [CrossRef]
- Vavřík, D.; Antušková, V.; Chlumská, Š.; Kumpová, I.; Šefců, R.; Vopálenský, M. Non-Destructive Exploration of Late Gothic Panel Painting Using X-Ray Tomography and Flattening of the Reconstructed Data. Eur. Phys. J. Plus 2023, 138, 618. [Google Scholar] [CrossRef]
- Volpi, F.; Vagnini, M.; Vivani, R.; Malagodi, M.; Fiocco, G. Non-Invasive Identification of Red and Yellow Oxide and Sulfide Pigments in Wall-Paintings with Portable ER-FTIR Spectroscopy. J. Cult. Herit. 2023, 63, 158–168. [Google Scholar] [CrossRef]
- Morales Toledo, E.G.; Raicu, T.; Falchi, L.; Barisoni, E.; Piccolo, M.; Izzo, F.C. Critical Analysis of the Materials Used by the Venetian Artist Guido Cadorin (1892–1976) during the Mid-20th Century, Using a Multi-Analytical Approach. Heritage 2023, 6, 600–627. [Google Scholar] [CrossRef]
- Bottura-Scardina, S.; Vandenabeele, P.; Miguel, C.; Candeias, A. Comparative Assessment of Two Portable Raman Spectrometers for the Characterisation of Historical Natural Dye Lakes. J. Raman Spectrosc. 2023, 54, 1303–1313. [Google Scholar] [CrossRef]
- Culka, A.; Hyršl, J.; Jehlička, J. Gem and Mineral Identification Using GL Gem Raman and Comparison with Other Portable Instruments. Appl. Phys. A 2016, 122, 959. [Google Scholar] [CrossRef]
- Pozzi, F.; Basso, E.; Snyder, R. Color, Collation, and Curious Creatures: A Technical Study of 15th-Century Block Books at The Morgan Library & Museum. Eur. Phys. J. Plus 2021, 136, 414. [Google Scholar] [CrossRef]
- Oubelkacem, Y.; Lamhasni, T.; El Bakkali, A.; Lyazidi, S.A.; Haddad, M.; Ben-Ncer, A. Parchments and Coloring Materials in Two IXth Century Manuscripts: On-Site Non-Invasive Multi-Techniques Investigation. Spectrochim. Acta Part A Mol. Biomol. Spectrosc. 2021, 247, 119093. [Google Scholar] [CrossRef] [PubMed]
- Rousaki, A.; Costa, M.; Saelens, D.; Lycke, S.; Sánchez, A.; Tuñón, J.; Ceprián, B.; Amate, P.; Montejo, M.; Mirão, J.; et al. A Comparative Mobile Raman Study for the on Field Analysis of the Mosaico de Los Amores of the Cástulo Archaeological Site (Linares, Spain). J. Raman Spectrosc. 2020, 51, 1913–1923. [Google Scholar] [CrossRef]
- Porcu, D.; Innocenti, S.; Galeotti, M.; Striova, J.; Dei, L.; Carretti, E.; Fontana, R. Spectroscopic and Morphologic Investigation of Bronze Disease: Performance Evaluation of Portable Devices. Heritage 2022, 5, 3548–3561. [Google Scholar] [CrossRef]
- Porcaro, M.; Lins, S.; Depalmas, A.; Anzalone, R.M.; Iannaccone, R.; Brunetti, A. Characterization of a Unique Nuragic Bronze Navicella with a Combination of X-Ray Fluorescence Spectrometry and Monte Carlo Simulation. Materials 2023, 16, 7345. [Google Scholar] [CrossRef] [PubMed]
- Armetta, F.; Ponterio, R.C.; Pibiri, I.; Saladino, M.L. New Insight on Archaeological Metal Finds, Nails and Lead Sheathings of the Punic Ship from Battle of the Egadi Islands. Molecules 2023, 28, 1968. [Google Scholar] [CrossRef] [PubMed]
- Feller, R.L. Artists’ Pigments: A Handbook of Their History and Characteristics; National Gallery of Art: Washington, DC, USA, 1986; ISBN 978-0-89468-086-1. [Google Scholar]
- Roy, A. Artists’ Pigments: A Handbook of Their History and Characteristics; National Gallery of Art: Washington, DC, USA, 1993; ISBN 978-1-904982-75-3. [Google Scholar]
- Fitzhugh, E.W. Artists’ Pigments: A Handbook of Their History and Characteristics; National Gallery of Art: Washington, DC, USA, 1997; ISBN 978-1-904982-76-0. [Google Scholar]
- D’Ippolito, V.; Andreozzi, G.B.; Bersani, D.; Lottici, P.P. Raman Fingerprint of Chromate, Aluminate and Ferrite Spinels. J. Raman Spectrosc. 2015, 46, 1255–1264. [Google Scholar] [CrossRef]
- Moretti, G.; Gervais, C. Raman Spectroscopy of the Photosensitive Pigment Prussian Blue. J. Raman Spectrosc. 2018, 49, 1198–1204. [Google Scholar] [CrossRef]
- Antwerp Blue—CAMEO. Available online: https://cameo.mfa.org/wiki/Antwerp_blue (accessed on 28 March 2024).
- Osticioli, I.; Mendes, N.F.C.; Nevin, A.; Gil, F.P.S.C.; Becucci, M.; Castellucci, E. Analysis of Natural and Artificial Ultramarine Blue Pigments Using Laser Induced Breakdown and Pulsed Raman Spectroscopy, Statistical Analysis and Light Microscopy. Spectrochim. Acta Part A Mol. Biomol. Spectrosc. 2009, 73, 525–531. [Google Scholar] [CrossRef] [PubMed]
- Buzgar, N.; Apopei, A. The Raman Study of Certain Carbonates. Geol. Tomul L 2009, 2, 97–112. [Google Scholar]
- Frost, R.L.; Martens, W.N.; Rintoul, L.; Mahmutagic, E.; Kloprogge, J.T. Raman Spectroscopic Study of Azurite and Malachite at 298 and 77 K. J. Raman Spectrosc. 2002, 33, 252–259. [Google Scholar] [CrossRef]
- Baran, A.; Fiedler, A.; Schulz, H.; Baranska, M. In Situ Raman and IR Spectroscopic Analysis of Indigo Dye. Anal. Methods 2010, 2, 1372. [Google Scholar] [CrossRef]
- Sharma, S.K.; Mammone, J.F.; Nicol, M.F. Raman Investigation of Ring Configurations in Vitreous Silica. Nature 1981, 292, 140–141. [Google Scholar] [CrossRef]
- Mihailova, B.; Zotov, N.; Marinov, M.; Nikolov, J.; Konstantinov, L. Vibrational Spectra of Rings in Silicate Glasses. J. Non-Cryst. Solids 1994, 168, 265–274. [Google Scholar] [CrossRef]
- Schmidt, C.M.; Walton, M.S.; Trentelman, K. Characterization of Lapis Lazuli Pigments Using a Multitechnique Analytical Approach: Implications for Identification and Geological Provenancing. Anal. Chem. 2009, 81, 8513–8518. [Google Scholar] [CrossRef] [PubMed]
- González-Cabrera, M.; Arjonilla, P.; Domínguez-Vidal, A.; Ayora-Cañada, M.J. Natural or Synthetic? Simultaneous Raman/Luminescence Hyperspectral Microimaging for the Fast Distinction of Ultramarine Pigments. Dye. Pigment. 2020, 178, 108349. [Google Scholar] [CrossRef]
- Spoto, S.E.; Somma, R.; Paladini, G.; CAridi, F.; Interdonato, M.; Majolino, D.; Venturi, V. From Lapis Lazuli to Synthetic Ultramarines: A μ-Raman Spectroscopy Investigation on the History and Development of “the Most Perfect” Color. In Proceedings of the 2022 IMEKO TC4 International Conference on Metrology for Archaeology and Cultural Heritage, University of Calabria, Calabria, Italy, 19–21 October 2022. [Google Scholar]
- Saleh, M. Validation with Raman Spectroscopy of Lapis Lazuli Provenance Study. Nuovo C. Soc. Ital. Fis. C Geophys. Space Phys. 2021, 44, 24. [Google Scholar] [CrossRef]
- Colomban, P. Lapis Lazuli as Unexpected Blue Pigment in Iranian Lâjvardina Ceramics. J. Raman Spectrosc. 2003, 34, 420–423. [Google Scholar] [CrossRef]
- Sarma, L.P.; Prasad, P.S.R.; Ravikumar, N. Raman Spectroscopic Study of Phase Transitions in Natural Gypsum. J. Raman Spectrosc. 1998, 29, 851–856. [Google Scholar] [CrossRef]
- Ospitali, F.; Bersani, D.; Di Lonardo, G.; Lottici, P.P. ‘Green Earths’: Vibrational and Elemental Characterization of Glauconites, Celadonites and Historical Pigments. J. Raman Spectrosc. 2008, 39, 1066–1073. [Google Scholar] [CrossRef]
- Vuurman, M.A.; Stufkens, D.J.; Oskam, A.; Moulijn, J.A.; Kapteijn, F. Raman Spectra of Chromium Oxide Species in CrO3/Al2O3 Catalysts. J. Mol. Catal. 1990, 60, 83–98. [Google Scholar] [CrossRef]
- Maslar, J.E.; Hurst, W.S.; Bowers, W.J.; Hendricks, J.H.; Aquino, M.I.; Levin, I. In Situ Raman Spectroscopic Investigation of Chromium Surfaces under Hydrothermal Conditions. Appl. Surf. Sci. 2001, 180, 102–118. [Google Scholar] [CrossRef]
- Šefců, R.; Chlumská, Š.; Hostašová, A. An Investigation of the Lead Tin Yellows Type I and II and Their Use in Bohemian Panel Paintings from the Gothic Period. Herit. Sci. 2015, 3, 16. [Google Scholar] [CrossRef]
- Rosi, F.; Manuali, V.; Grygar, T.; Bezdicka, P.; Brunetti, B.G.; Sgamellotti, A.; Burgio, L.; Seccaroni, C.; Miliani, C. Raman Scattering Features of Lead Pyroantimonate Compounds: Implication for the Non-invasive Identification of Yellow Pigments on Ancient Ceramics. Part II. In Situ Characterisation of Renaissance Plates by Portable micro-Raman and XRF Studies. J. Raman Spectrosc. 2011, 42, 407–414. [Google Scholar] [CrossRef]
- Kumar, P.; Saxena, N.; Chandra, R.; Gupta, V.; Agarwal, A.; Kanjilal, D. Nanotwinning and Structural Phase Transition in CdS Quantum Dots. Nanoscale Res. Lett. 2012, 7, 584. [Google Scholar] [CrossRef] [PubMed]
- Xiong, Q.; Wang, J.; Reese, O.; Lew Yan Voon, L.C.; Eklund, P.C. Raman Scattering from Surface Phonons in Rectangular Cross-Sectional w-ZnS Nanowires. Nano Lett. 2004, 4, 1991–1996. [Google Scholar] [CrossRef]
- Legodi, M.; Dewaal, D. The Preparation of Magnetite, Goethite, Hematite and Maghemite of Pigment Quality from Mill Scale Iron Waste. Dye. Pigment. 2007, 74, 161–168. [Google Scholar] [CrossRef]
- Frost, R.L.; Martens, W.N.; Kloprogge, J.T. Raman Spectroscopic Study of Cinnabar (HgS), Realgar (As4S4), and Orpiment (As2S3) at 298 and 77K. Neues Jahrb. Fuer Mineral. Monatshefte 2002, 10, 469–480. [Google Scholar] [CrossRef]
- Innocenti, S.; Ricci, M.; Lanterna, G.; Fontana, R.; Striova, J.; Becucci, M. Direct Microextraction for Red Lakes Detection in Painting Layers by Raman Spectroscopy. Eur. Phys. J. Plus 2021, 136, 1081. [Google Scholar] [CrossRef]
- Tomić, Z.; Makreski, P.; Gajić, B. Identification and Spectra–Structure Determination of Soil Minerals: Raman Study Supported by IR Spectroscopy and X-ray Powder Diffraction. J. Raman Spectrosc. 2010, 41, 582–586. [Google Scholar] [CrossRef]
- Buzgar, N.; Buzatu, A.; Sanislav, I.V. The Raman Study on Certain Sulfates. Sci. Ann. Univ. Al. I. Cuza Iaşi 2009, 55, 5–23. [Google Scholar]
- Du, Y.; Zhang, M.-S.; Hong, J.; Shen, Y.; Chen, Q.; Yin, Z. Structural and Optical Properties of Nanophase Zinc Oxide. Appl. Phys. A Mater. Sci. Process. 2003, 76, 171–176. [Google Scholar] [CrossRef]


| Libraries | Data Format | Analyzed Materials | Excitation Wavelength (nm) |
|---|---|---|---|
| ULC [3] | Online | Natural and synthetic pigments | 514, 633 |
| IRUG [11] | Online | Minerals, pigments, organic dyes, synthetic resins | 532, 633, 785 |
| Romanian Database of Raman Spectroscopy [12] | Online | Minerals | 532 |
| RRUFF [6] | Online | Minerals and pigments | 532, 785 |
| IRDG | Online | Pigments | 1062 |
| SOPRANO [13] | Online | Synthetic organic pigments (SOPs) | 785 |
| CHSOS—Pigments Checker [9] | Online | Pigments | 532, 638, 785, 830, 1064 |
| CAMEO Materials database (Museum of Fine Arts—Boston) | Online | Pigments and other art materials | 514, 532, 632, 785 |
| Vandenabeele et al. [14] | Published paper | Azo pigments | 785 |
| Burgio and Clark [10] | Published paper | Pigments, minerals, pigments media, and varnishes | 514, 633, 647, 780, 1064 |
| Bouchard and Smith [15] | Published paper | Minerals on corroded metals and colored glass | 514, 632 |
| Scherrer et al. [16] | Published paper | Synthetic organic pigments | 514, 633, 785 |
| Martina et al. [17] | Published paper | Silver corrosion products | 532 |
| Pozzi et al. [18] | Published paper | Watercolor’s dyes | 488, 785 |
| Coccato et al. [19,20] | Published paper | Carbon-based black pigments and green minerals | 532, 785 |
| Marucci et al. [21] | Published paper | Medieval pigments | 488, 532, 633, 785, 830 |
| Culka and Jehlicka [22] | Published paper | Gemstones | 785, 852 |
| ColoRaman database [23] | No longer available online | Oil, tempera, and fresco paint pigments | 531, 633, 780 |
| E-Visart [24] | No longer available online | Pigments | 785, 1062 |
| Sessa et al. [25] | Published paper | Synthetic organic pigments (SOPs) in watercolor, tempera, and oil paints | 532, 638, 785 |
| Name and Stereoscopic Image | Chemical Composition [61,62,63] | Colour Index (C.I.) Name and Number | Supplier and Article Number | ||
|---|---|---|---|---|---|
| Blue pigments | Cobalt blue |  | Cobalt(II) oxide–aluminum oxide, cobalt(II) aluminate CoOAl2O3 (CoAl2O4) | PB28 No. 77346 | Kremer, 45710 |
| Prussian blue |  | Iron(III) hexacyanoferrate(II) Fe4[Fe(CN)6]3 | PB27 No. 77510 | F.lli Maimeri | |
| Antwerp blue |  | Prussian blue + Cobalt blue | - | n.d. | |
| Ultramarine blue |  | Sodium silicate containing sulfur and aluminum (Na,Ca)8[(SO4,S,Cl)2(AlSiO4)6] | PB29 No. 77007 | Kremer, 10500 | |
| Azurite |  | Basic copper carbonate 2CuCO3·Cu(OH)2 | PB30 No. 77420 | Kremer, 10201 | |
| Indigo |  | 2-(3-oxo-2,3-dihydro-1H-indol-2-ylidene)-2,3-dihydro-1H-indol-3-one C16H10N2O2 | NB1 No. 75780 | Kremer, 36000 | |
| Smalt |  | Potassium glass containing cobalt SiO2 + K2O + Al2O3 + CoO | PB32 No. 77365 | Kremer, 10010 | |
| Lapis lazuli |  | Sodium silicate containing sulfur and aluminum (Na,Ca)8[(SO4,S,Cl)2(AlSiO4)6] | PB29 No. 77007 | Kremer, 10530 Origin Afghanistan | |
| Green pigments | Green earth |  | Hydrated iron (II-III) potassium silicate K(Mg,Fe2+)(Fe3+,Al)[Si4O10](OH)2, and/or (K,Na)(Fe3+,Al,Mg)2(Si,Al)4O10(OH)2 | N/A C.I. PG23 No. 77009 | Hopkins |
| Cobalt green |  | Cobalt(II) zincate Co2TiO4 | PG50 No. 77377 | Kremer, 44100 | |
| Chromium oxide |  | Chromium(III) oxide Cr2O3 | PG17 No. 77288 | Winsor & Newton | |
| Malachite |  | Basic copper (II) carbonate CuCO3·Cu(OH)2 | PG39 No. 77492 | Kremer, 10310 | |
| Viridian |  | Hydrated chromium(III) oxide Cr2O3·2H2O | PG18 No. 77289 | Winsor & Newton | |
| Yellow pigments | Massicot |  | Orthorhombic lead oxide β-PbO | PY46 No. 77577 | Kremer, 43010 |
| Lead tin yellow type I |  | Lead(II) stannate Pb2SnO4 | N/A No. 77629 | Kremer, 10110 | |
| Naples Yellow |  | Lead (II) antimonate Pb2Sb2O7 | PY41 No. 77588 | Kremer, 13100 | |
| Chrome yellow |  | Lead (II) chromate PbCrO4 | PY34 No. 77600 | Kremer, 43700 | |
| Cadmium yellow |  | Cadmium (II) sulfide, zinc oxide (CdS, ZnO) | PY35 No. 77117 | Roberson Ltd. | |
| Yellow ochre |  | Iron(III) oxide–hydroxide FeO(OH) | PBr6 No. 77499 | Kremer, 10220 | |
| Raw sienna |  | Iron (III) oxide–hydroxide FeO(OH) | PBr6 No. 77491 | Winsor & Newton | |
| Red pigments | Caput mortuum |  | Iron (III) oxide Fe2O3 | PR101 No. 77491 | Kremer, 48750 |
| Umber |  | Iron (III) oxide Fe2O3 | PBr7 No. 77492 | Kremer, 40700 | |
| Red bole |  | Iron (III) oxide Fe2O3 | PR102 No. 77015 | Kremer, 40503 | |
| Cinnabar |  | Mercury(II) sulfide HgS | PR106 No. 77766 | Kremer, 10600 | |
| Carmin naccarat |  | 2-Anthracene-carboxylic acid, 7-β-D-glucopyranosyl-9,10-dihydro-3,5,6,8-tetrahydroxy-1-methyl-9,10-dioxo- C22H2OO13 | NR4:1 No. 75470 | Kremer, 42100 | |
| Alizarin crimson |  | Dihydroxy-9,10-anthracene-dione calcium salt (1:1) C14H8CaO4 | PR83 No. 58000:1 | Winsor & Newton | |
| White and black pigments | Lead white |  | Lead (II) carbonate, basic (PbCO3)2·Pb(OH)2 | PW1 No. 77597 | Kremer 46060 |
| Gypsum |  | Calcium (II) sulfate dihydrate CaSO4·2H2O | PW25 No. 77231 | Kremer, 11800 | |
| Calcite |  | Calcium (II) carbonate CaCO3 | PW18 No. 77220 | Merck, 2066 | |
| Barite |  | Barium (II) sulfate BaSO4 | PW22 No. 77120 | CarloErba, 425497 | |
| Zinc oxide |  | Zinc (II) oxide ZnO | PW4 No. 77947 | Merck, 8849 | |
| Ivory black |  | Calcium (II) phosphate, calcium (II) carbonate, carbon [Ca3(PO4)2]+CaCO3+C | Bk9 No. 77267 | Winsor & Newton | |
| Samples | Spectral Range (cm−1) | Integration Time (s) | Number of Scans | |
|---|---|---|---|---|
| powders | Cobalt blue | 170–1200 | 2 | 20 |
| Prussian blue | 170–1200 | 10 | 25 | |
| Antwerp blue | 170–1200 | 50 | 5 | |
| Ultramarine | 170–1800 | 1 | 30 | |
| Azurite | 170–1450 | 5 | 20 | |
| Indigo | 170–1800 | 0.5 | 10 | |
| Smalt | 170–1200 | 5 | 10 | |
| Lapis lazuli | 170–1800 | 1 | 20 | |
| Calcite, Barite | 170–2000 | |||
| Green earth | 170–1200 | 10 | 10 | |
| Colbalt green | 170–1200 | 5 | 10 | |
| Chromium oxide | 170–1200 | 5 | 5 | |
| Viridian | 170–1200 | 5 | 15 | |
| Malachite | 170–1200 | 20 | 5 | |
| Massicot | 170–1200 | 5 | 5 | |
| Lead tin yellow, Chromium yellow, Cinnabar | 170–1200 | 1 | 10 | |
| Alizarin crimson | 170–1800 | |||
| Naples yellow, Gypsum | 170–1200 170–2000 | 1 | 5 | |
| Cadmium oxide | 170–1200 | 2 | 15 | |
| Yellow ochre, Caput mortuum, Umber, Red bole | 170–1200 | 5 | 15 | |
| Carmin naccarat | 170–1800 | |||
| Ivory black | 170–2000 | |||
| Raw sienna | 170–1200 | 10 | 5 | |
| Lead white | 170–2000 | 1.5 | 10 | |
| Zinc oxide | 170–1400 | 1.5 | 30 | |
| tempera | Azurite | 170–1450 | 5 | 2 |
| Indigo Lapis lazuli | 170–1800 170–1200 | 1.5 | 15 | |
| Smalt | 170–1200 | 1 | 15 | |
| Cobalt blue | 170–1200 | 1 | 20 | |
| Ultramarine blue Prussian blue | 170–1200 170–2500 | 1.5 | 10 |
| Measured Peaks (cm−1) in This Work Lapis Lazuli Kremer #10530 | References Peaks (cm−1) [9] Lapis Lazuli Kremer #10510 | ||||
|---|---|---|---|---|---|
| 785 nm | 852 nm | 532 nm | 638 nm | 785 nm | 1064 nm |
| 260 m | 260 m | ||||
| 285 sh | 285 sh | ||||
| 312 vs * | |||||
| 350 m * | |||||
| 405 w * | |||||
| 513 m * | |||||
| 364 m | 364 m | ||||
| 548 s | 548 s | 548 vs | 548 vs | 548 vs | 548 s |
| 583 vw | 583 sh | 583 sh | 583 sh | 583 m | |
| 712 w * | |||||
| 808 w | 808 w | ||||
| 835 s * | |||||
| 985 m * | |||||
| 1096 m | 1096 m | ||||
| 1306 s * | 1346 m | ||||
| 1358 vw | Split into two bands | ||||
| 1644 m | 1644 m | ||||
Disclaimer/Publisher’s Note: The statements, opinions and data contained in all publications are solely those of the individual author(s) and contributor(s) and not of MDPI and/or the editor(s). MDPI and/or the editor(s) disclaim responsibility for any injury to people or property resulting from any ideas, methods, instructions or products referred to in the content. |
© 2024 by the authors. Licensee MDPI, Basel, Switzerland. This article is an open access article distributed under the terms and conditions of the Creative Commons Attribution (CC BY) license (https://creativecommons.org/licenses/by/4.0/).
Share and Cite
Innocenti, S.; Quintero Balbas, D.; Galeotti, M.; Cagnini, A.; Porcinai, S.; Striova, J. Historical Pigments and Paint Layers: Raman Spectral Library with 852 nm Excitation Laser. Minerals 2024, 14, 557. https://doi.org/10.3390/min14060557
Innocenti S, Quintero Balbas D, Galeotti M, Cagnini A, Porcinai S, Striova J. Historical Pigments and Paint Layers: Raman Spectral Library with 852 nm Excitation Laser. Minerals. 2024; 14(6):557. https://doi.org/10.3390/min14060557
Chicago/Turabian StyleInnocenti, Silvia, Diego Quintero Balbas, Monica Galeotti, Andrea Cagnini, Simone Porcinai, and Jana Striova. 2024. "Historical Pigments and Paint Layers: Raman Spectral Library with 852 nm Excitation Laser" Minerals 14, no. 6: 557. https://doi.org/10.3390/min14060557
APA StyleInnocenti, S., Quintero Balbas, D., Galeotti, M., Cagnini, A., Porcinai, S., & Striova, J. (2024). Historical Pigments and Paint Layers: Raman Spectral Library with 852 nm Excitation Laser. Minerals, 14(6), 557. https://doi.org/10.3390/min14060557