Article

DIGIT: An In Situ Experiment for Studying the Diffusion of Water and Solutes under Thermal Gradient in the Toarcian Clay Rock at the Tournemire Underground Research Laboratory: Part 1—Goals, Scoping Calculations, Installation and First Results under Unheated Conditions

by
Maïwenn Humbezi Desfeux
1,*,
Manuel Marcoux
2,
Jean-Michel Matray
1,
Josselin Gorny
3,
Philipp Schädle
4 and
Guillaume Pochet
5
1
Institut de Radioprotection et de Sûreté Nucléaire (IRSN), PSE-ENV/SPDR/LETIS, F-92260 Fontenay-aux-Roses, France
2
Institut de Mécanique des Fluides de Toulouse, UMR 5502 CNRS/INP/UPS, F-31400 Toulouse, France
3
Institut de Radioprotection et de Sûreté Nucléaire (IRSN), PSE-ENV/SPDR/LT2S, F-92260 Fontenay-aux-Roses, France
4
Swiss Federal Nuclear Safety Inspectorate (ENSI), CH-5201 Brugg, Switzerland
5
Federal Agency for Nuclear Control, rue du Marquis 1 bte 6A, 1000 Bruxelles, Belgium
*
Author to whom correspondence should be addressed.
Minerals 2024, 14(6), 563; https://doi.org/10.3390/min14060563
Submission received: 31 March 2024 / Revised: 13 May 2024 / Accepted: 16 May 2024 / Published: 29 May 2024

Abstract

:
The DIGIT experiment was launched at the Tournemire Underground Research Laboratory URL with the aim of determining the effects of temperature on the transfer of analogues of most mobile radionuclides (i.e., 36Cl, 129I and 79Se) in the Toarcian clay rock, the properties of which are close to host rocks being considered for future deep geological disposal of high-level (HL) radioactive wastes. The experimental principle involves the monitoring of an exchange between a test water traced with stable halides and deuterium at constant concentration and the porewater of the Toarcian clay rock submitted to various temperatures. This experiment seeks to partially address questions regarding the potential spread of contaminants during the thermal phase of High Level Waste (HLW) waste packages. Specifically, the in situ experiment aims to evaluate the role of scale effects and thermodiffusion, a process that combines Fick’s law and the Soret effect, in the transfer of radionuclides. This paper presents the first steps of the study, including the scoping calculations, the experimental set-up and the first results obtained during the unheated phase. The study started with the acquisition of the initial parameters, including the rock thermal properties, the concentrations of the four tracers (chloride, bromide, iodide and deuterium) naturally present in the clay porewater and their diffusive transport parameters by using four diffusion exchange techniques (phase 0). A model coupling heat and mass transfers was then developed using Comsol Multiphysics®, integrating data acquired so far with existing literature data. A test water with a tracer concentration around 1000 times higher than those in the pore water was proposed with a temperature imposed at the test section wall of 70 °C. A large test zone of 50 cm height and 1 m in diameter and installed in a 3 m deep vertical well located in a sound zone at the URL was then proposed. The installation of the experiments required the realization of one shaft and of nine peripheral boreholes for the monitoring of temperature, water pressure and deformation. The experiment started with phase 1, involving a traced, unheated water start-up for a period of 5 months. Then, a core sampling was conducted in the emptied well, and the same diffusion exchange techniques were applied. The results of anionic tracers were compared to simulations based on initial parameters (phase 0), revealing that tracer penetration at the end of phase 1 exceeded simulated values by approximately 2 cm. This result is interpreted as an increase in the accessible porosity to tracers, possibly due to the excavation damaged zone. Future simulations should incorporate these adjusted diffusive transport parameters. Following phase 1, the heating system was activated, applying a temperature of 70 °C to the test zone. New data will enable the comparison of tracer penetration and assess the actual impact of temperature on tracer transfer.

1. Introduction

Ensuring the secure and resilient management of radioactive waste over the long term is paramount for countries hosting nuclear power facilities, where such waste is generated. There is a worldwide consensus about geological disposal of high-level waste (HLW) and long-lived intermediate-level waste (LL-ILW), based on a multi-barrier approach. In France, the decision was made in 2005 to develop a concept of a geological disposal based on three main barriers that include host rock, engineered barrier systems and waste packages. This project aims to dispose of HLW and LL-ILW deep underground, in a clay layer dating from the Callovo-Oxfordian period, 500 m below ground [1]. The French disposal project proposed by Andra (Agence nationale pour la gestion de déchets radioactifs) and known as Cigéo (Centre industriel de stockage géologique) includes an underground facility composed of two disposal zones or quarters, one for long-lived intermediate-level waste (LL-ILW) and the second for high-level waste (HLW) [1,2].
This paper focuses on the HLW disposal area of the Cigéo project and the environment of its packages. These are vitrified waste packages from the reprocessing of spent fuel. HL wastes are exothermic, with an average thermal power at installation of around 30 W per package, which diminishes over time [1,2]. In the Cigéo project, HL wastes are going to be stored in horizontal cells around 100 m long, separated by a half-axis (or half-distance between cells) of around 25 m. The packages, surrounded by their carbon steel overpacks, would be placed in a carbon steel liner to enable them to be positioned during the operating phase, which is expected to last around 150 years, and to be removed in the event of defective packages being detected [2].
It is also for the sake of retrievability that the French concept does not call for HL waste packages to be surrounded by an engineered barrier, as is the case with most other concepts in Scandinavia, Switzerland and Canada [3,4,5,6,7]. However, Andra is proposing that the liner should be surrounded on its extrados by an alkaline filling material, in order to limit technological voids, the effects of acidity of the geological environment [8] and the corrosion kinetics of the steels. This material would also facilitate the acceleration of resaturation of the immediate environment of the liner’s extrados, which would then be saturated with water during package emplacement and the operating phase, before it desaturates as a result of hydrogen production. The HL waste packages have been designed and retained in particular to prevent the arrival of water from the clay layer on the vitrified HL waste, at least during the thermal phase (>70 °C for the most exothermic vitrified waste packages) with a maximum duration of around 500 years [1]. The thermal peak would be reached between 10 and 30 years after emplacement of the packages, with a maximum temperature of around 80 °C in the near-field of the HL disposal cells, and around 45 °C maximum at the half-axis of the HL disposal cells, depending on the package family and their location in the HL waste disposal quarters.
This paper focuses on the specific case of premature leakage of radionuclides from HL waste packages in a saturated environment in the middle of the thermal phase. The safety issue lies in being able to assess the zone of rock affected by this potential leak in anticipation of the planned retrieval of packages in Cigéo. The scientific challenge is to study the contribution of the various coupled thermal–hydraulic–mechanical–chemical (TMHC) processes to radionuclide transfer in the near field of the disposal cell under thermal stress and in saturated conditions. To date, our focus here has been on the TC coupling, while the contribution of other processes may be assessed at a later stage, for the reasons outlined below.
Heat transfer in saturated low-permeability porous media, such as the Callovo-Oxfordian indurated clay rocks at the underground research laboratory of Meuse/Haute-Marne (MHM URL), the Upper Toarcian at the URLs of Tournemire in France or Mont Terri in Switzerland, is recognized as being dominated by thermal conduction (Fournier’s law). This translates into an exchange of energy between solids and immobilized fluids, without any mass transfer. Other potential contributors to heat transfer by convection (macroscopic displacement of thermal energy by fluid movement) or radiation (transfer of energy by the emission of electromagnetic radiation) have always been considered minor or even negligible for both URLs [9]. As the hydraulic conductivity of the Tournemire URL clay rock is at least one order of magnitude lower than that of the MHM URL, and in the absence of radiation, only thermal conduction will be considered in the following predictive calculations.
The transfer of radionuclides from one point to another is driven by various gradients (e.g., pore pressure, temperature and concentration of the aqueous species) and their possible retention on the host rock. As is often the case in porous media, these transfers take place via the two primary transport mechanisms of diffusion (driven by a concentration gradient) and convection (driven by a pore pressure gradient), and their combination through hydrodynamic dispersion. Within undamaged (sound) clay rocks, the dominant transport process remains diffusion, as demonstrated by Andra and IRSN in several studies of clay rocks at the Meuse/Haute Marne Underground Research Laboratories (or URLs) at Bure [10,11], Tournemire [12] and Mont Terri [13,14]. The diffusive contribution to the overall transport is governed by the effective diffusion coefficient (De). For environments like the ones mentioned above, the effective diffusion coefficients need to account for two effects, i.e., the anisotropy of the clayey rocks over-consolidated by burial and its temperature dependency. The extent of these effects depends strongly on the studied site for Tournemire [10,15] for LSMHM and for Mont Terri [16]. For the three URLs studied in Western Europe, the anisotropy of the effective diffusion coefficients of radionuclides like HTO, 36Cl and 22Na+ varies by factors ranging between 3 and 6, reflecting a shorter path (tortuosity) for species diffusing parallel to stratification [17]. For the Tournemire URL, an anisotropy factor of 3 was determined [18]. Finally, in addition to the diffusion of aqueous species along a concentration gradient, there is also diffusion along a temperature gradient; this is a coupled phenomenon called thermal diffusion associated to the Soret effect [19,20]. So far, a single study has accounted for this process in Callovo-Oxfordian clay [21]. However, it is difficult to apply the results obtained in this study to studies on the safety of a nuclear waste repository, due to the utilized samples of crushed and recompacted rock, i.e., in conditions significantly different to the actual conditions in sound clay materials. Therefore, IRSN decided to launch its own experiment to assess the impact of temperature on mass transfer in a material more representative of in situ conditions, in its underground research laboratory at Tournemire. This experiment was based on an experimental concept originally proposed for the Mont Terri URL [22]. The main idea of this experiment was to install a reservoir of traced water maintained at constant tracer concentrations and constant heat. Further, the surrounding rock is regularly sampled to estimate the penetration of the tracers over time and assess the impact of temperature on transfer processes. This new experiment is named DIGIT (Diffusion under Thermal Gradient) and was finally adapted and set up at the Tournemire URL with the objectives to (i) identify the transfer processes likely to be involved in the migration of non-radioactive tracers as radionuclide analogues with and without thermal stress, (ii) appreciate the effects of scale, anisotropy and damage on the transfers of analogues with and without a thermal gradient, and finally (iii) increase the degree of confidence in the knowledge of the processes by demonstrating the ability to assess a rock volume potentially impacted by radionuclide migration.
To meet these objectives, the study was split into four temporal phases, the first three of which are considered in this article: (i) characterization of the initial state and dimensioning of the test, (ii) setting up the experiment on the basis of scoping calculations, (iii) filling of the test section with an unheated traced water followed by an initial sampling campaign—the aim of these phases is to identify the impact of excavation and impoundment on initial transport parameters—and finally (iv) heating of the test zone, followed by sampling and interpretation of tracer penetration.

2. Initial State and Test Dimensioning

The aims of this section are as follows: Section 2.1 presents the Tournemire site where the DIGIT experiment has been set up, Section 2.2 verifies the rock soundness in the test zone by carrying out reconnaissance boreholes and well drilling, Section 2.3 proposes a cocktail of tracers to be used and determines their initial concentrations in the pore water, Section 2.4 estimates the diffusive transport parameters in their initial state, and finally, Section 2.5 carries out scoping calculations with a view to dimension the test.

2.1. The Tournemire Clay Rock and Site

The Toarcian-Domerian clays and marls are Mesozoic in age (180–195 million years). These 250 m thick clay layers are the result of a deep marine deposit developed under an extensive E-W tectonic regime. Clay sedimentation ended with the deposition of the Aalenian and Middle Jurassic carbonates that form the backbone of today’s Grand Causses basin. The Toarcian-Domerien claystone dates from the Lower Jurassic (195–180 million years ago) and is 250 m thick today. The clay layer is detrital in origin, and sedimentation took place in a shallow marine environment (probably around 50 m deep) during an extensive E-W tectonic regime. The area selected for the DIGIT experiment is located in the Upper Toarcian at an altitude of 517.44 m asl (above sea level) from the invert of the South 2008 gallery, corresponding to experimental level 0, i.e., around 50 m below the basement of the upper aquifer of Aalenian age (Figure 1).
The zone was selected following an in-depth geological study showing the absence of tectonic fractures in the walls of the galleries and based on core samples taken from the bottom of the 2008 South Gallery. It is still 117 m above sea level and at the same altitude as the laboratory’s reference zone, located at the intersection of the 1996 galleries and the tunnel, and at −3 m/ground from the tunnel, i.e., at around 517 m asl (Figure 2).
The selected zone should therefore theoretically involve the same sub-horizontal strata (dipping less than 5° to the north) as the reference level. Therefore, as a first approximation, the parameters shown in Table 1, which were originally used in the predictive calculations, are representative of the DIGIT test zone. Table 1 summarizes the main characteristics of the Upper Toarcian acquired at reference level in the centre of the tunnel and outside the area damaged by excavation.

2.2. Test Area Validation

An initial study combining observation of the gallery walls and analysis of geological surveys suggested an a priori fracture-free zone located in the 2008 South Gallery (Figure 3). This study led us to carry out two fully cored exploratory boreholes, DGT-EX1 and DGT-REF (Table 2 and Figure 3). In this table, the depth is given in relation to the reference altitude of the concrete ground level, i.e., 517.44 m asl. It should be noted that this sector is located at almost 130 m from the reference level at the intersection of the 1996 galleries and the tunnel.
Beyond the 13 cm of concrete covering the gallery floor, analysis of the cores from the two boreholes validated the test zone, confirming the absence of damage fractures linked to excavation of the gallery or fractures of tectonic origin. The depth of these boreholes was chosen to exclude a test in the zone damaged by the excavation, which had been estimated by Induced Polarization at around 0.5 m maximum depth for this in 2008 [29].
Petrophysical measurements were carried out on a 10 cm core from borehole DGT-EX1 at an elevation of 2.90 m from the cemented ground level, i.e., in the centre of the future test zone (Table 3).
Table 3 shows the petrophysical properties as described by [24]. The errors on the functions are estimated by propagating the variances of the analytical errors according to Gauss’s classic formula (in Theoria combinationis, 1821).
The results obtained show average values within the range of those obtained for the reference level located at over 130 m (Table 1) for gravimetric water content (3.8 wt %), total porosity (9.8%), bulk wet density (2.54 g cm−3) and grain density (2.70 g cm−3). These results indicate that the level to be tested must still have identical mineralogical properties, due to the same grain density, which results from the sum of the densities of the various minerals relative to their proportions. It also shows that the medium can be considered as fully saturated, as the degrees of saturation are close to 1.
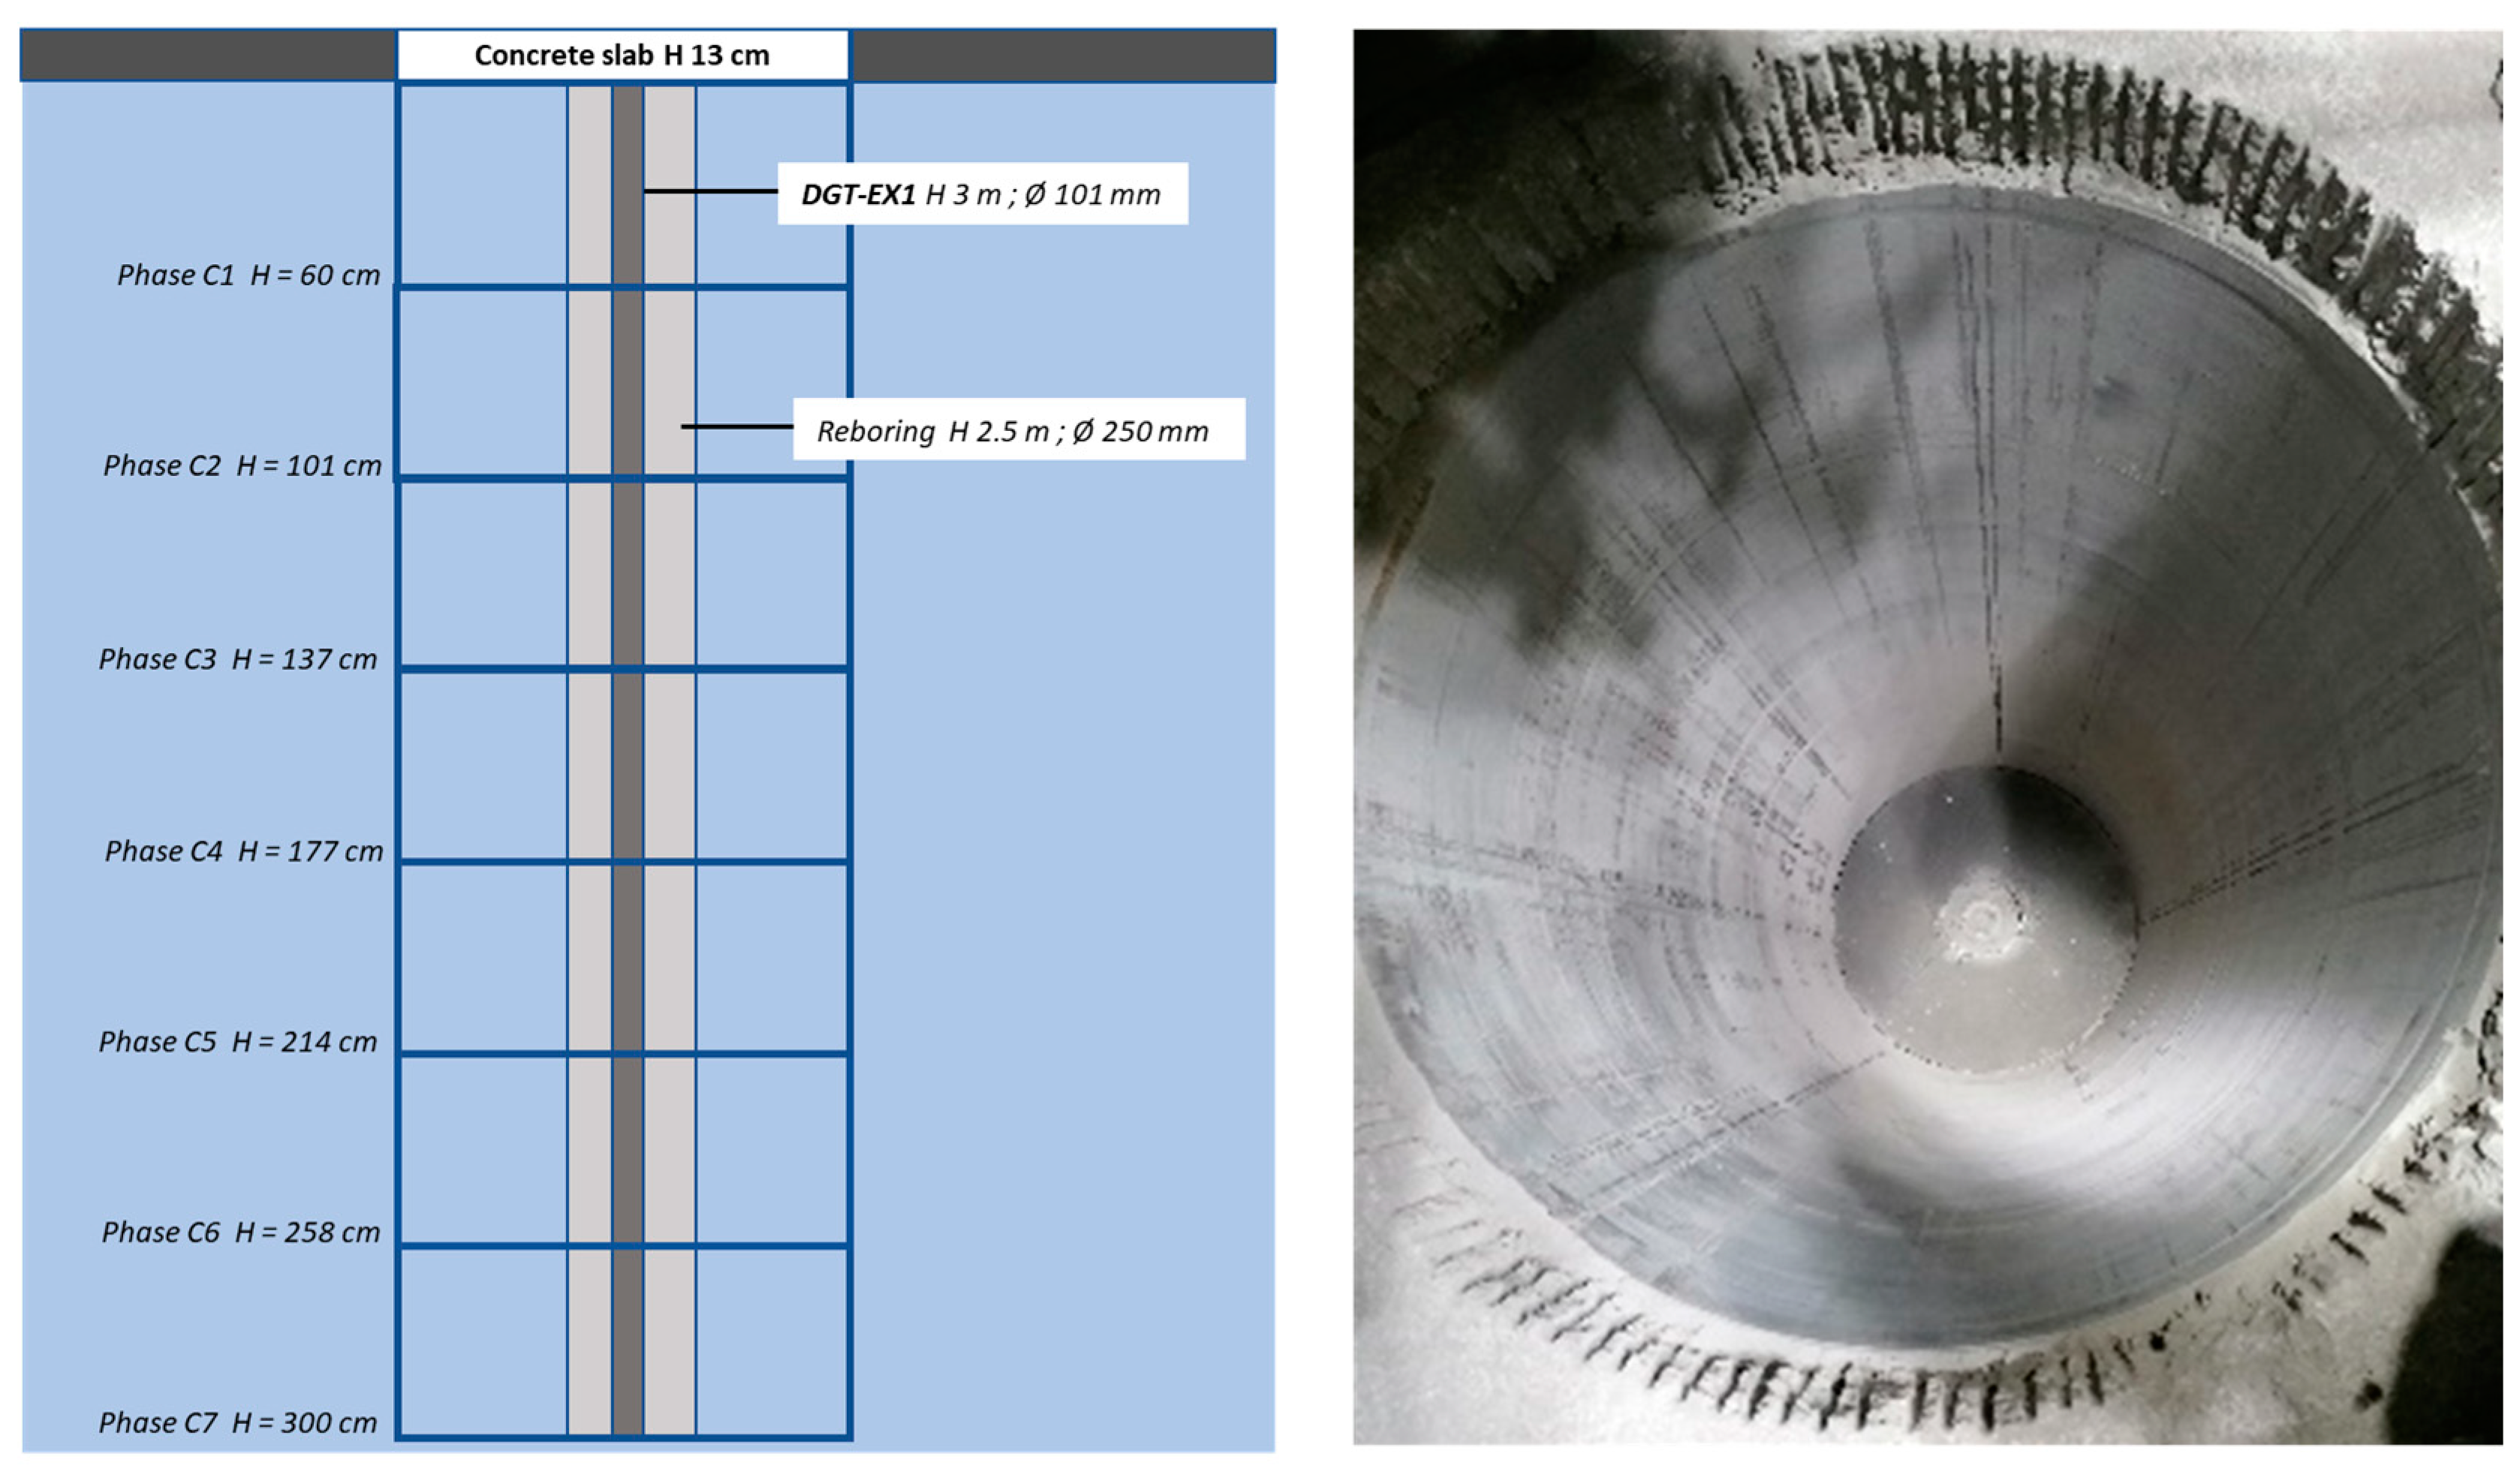
Following this preliminary validation phase, the one-meter-diameter shaft was completed in 3 weeks between May and June 2022. Large-diameter dry coring was carried out using a HILTI© machine and the FOGRAD device developed and patented by IRSN, using the EX1 borehole as a guide borehole and re-boring it to a diameter of 250 mm (Figure 4).
In all, 7 large-diameter cores of around 40 cm each were extracted from the shaft to a depth of 3 m. The soundness of the rock and its absence of cracks were again verified during this large-diameter core drilling.

2.3. Tracer Selection and Their Initial Concentrations in Pore Water

The focus here is on the transfer of the most mobile species, those most likely to travel the longest distances in the rock at the periphery of the potentially altered package. This excludes all species sensitive to retention with distribution coefficients or Kd other than zero. As the use of radionuclides is prohibited at the Tournemire URL, the choice naturally fell on stable halogen anions with oxidation degrees I i.e., chlorine (Cl), bromine (Br) and iodine (I), species not being retained by any of the clay rocks studied. These stable halogen anions can also be considered as analogues of radionuclides (36Cl, 129I and 79Se) recognized as being the fastest to reach the biosphere as soon as they are released from the waste packages [1]. Although halogen anions are not retained, or retained only to a very limited extent, they are nevertheless excluded by charge repulsion towards the pore centre from negatively charged clay surfaces [30,31]. The consequence is a deficit of anions compared with cations in Electric Double Layers (EDLs), and lower values of effective diffusion coefficients and diffusion-accessible porosities for anions compared with water tracers and cations.
Deuterium (2H) was added to this cocktail as a tracer of the water molecule and an analogue of tritium (3H). This isotope was preferred to oxygen-18, which is known to fractionate by exchange with rock carbonates with temperature [32]. As it is completely accessible to the pore space, 2H should make it possible to trace the penetration of water into the rock, to specify the anionic exclusion linked to surface reactions with clay minerals [33,34,35] and the anisotropy linked to stratigraphy by comparing the diffusion coefficients deduced from each tracer.
As the selected tracers (I, Br, Cl and 2H) are naturally present in the pore water (cf. Section 2.3), it was decided to consider a concentration in the test water approximately 1000 times greater than the concentration found in the pore water. The initial concentration of these tracers in the pore water was determined directly on samples taken from boreholes drilled in the test zone (phase 0).
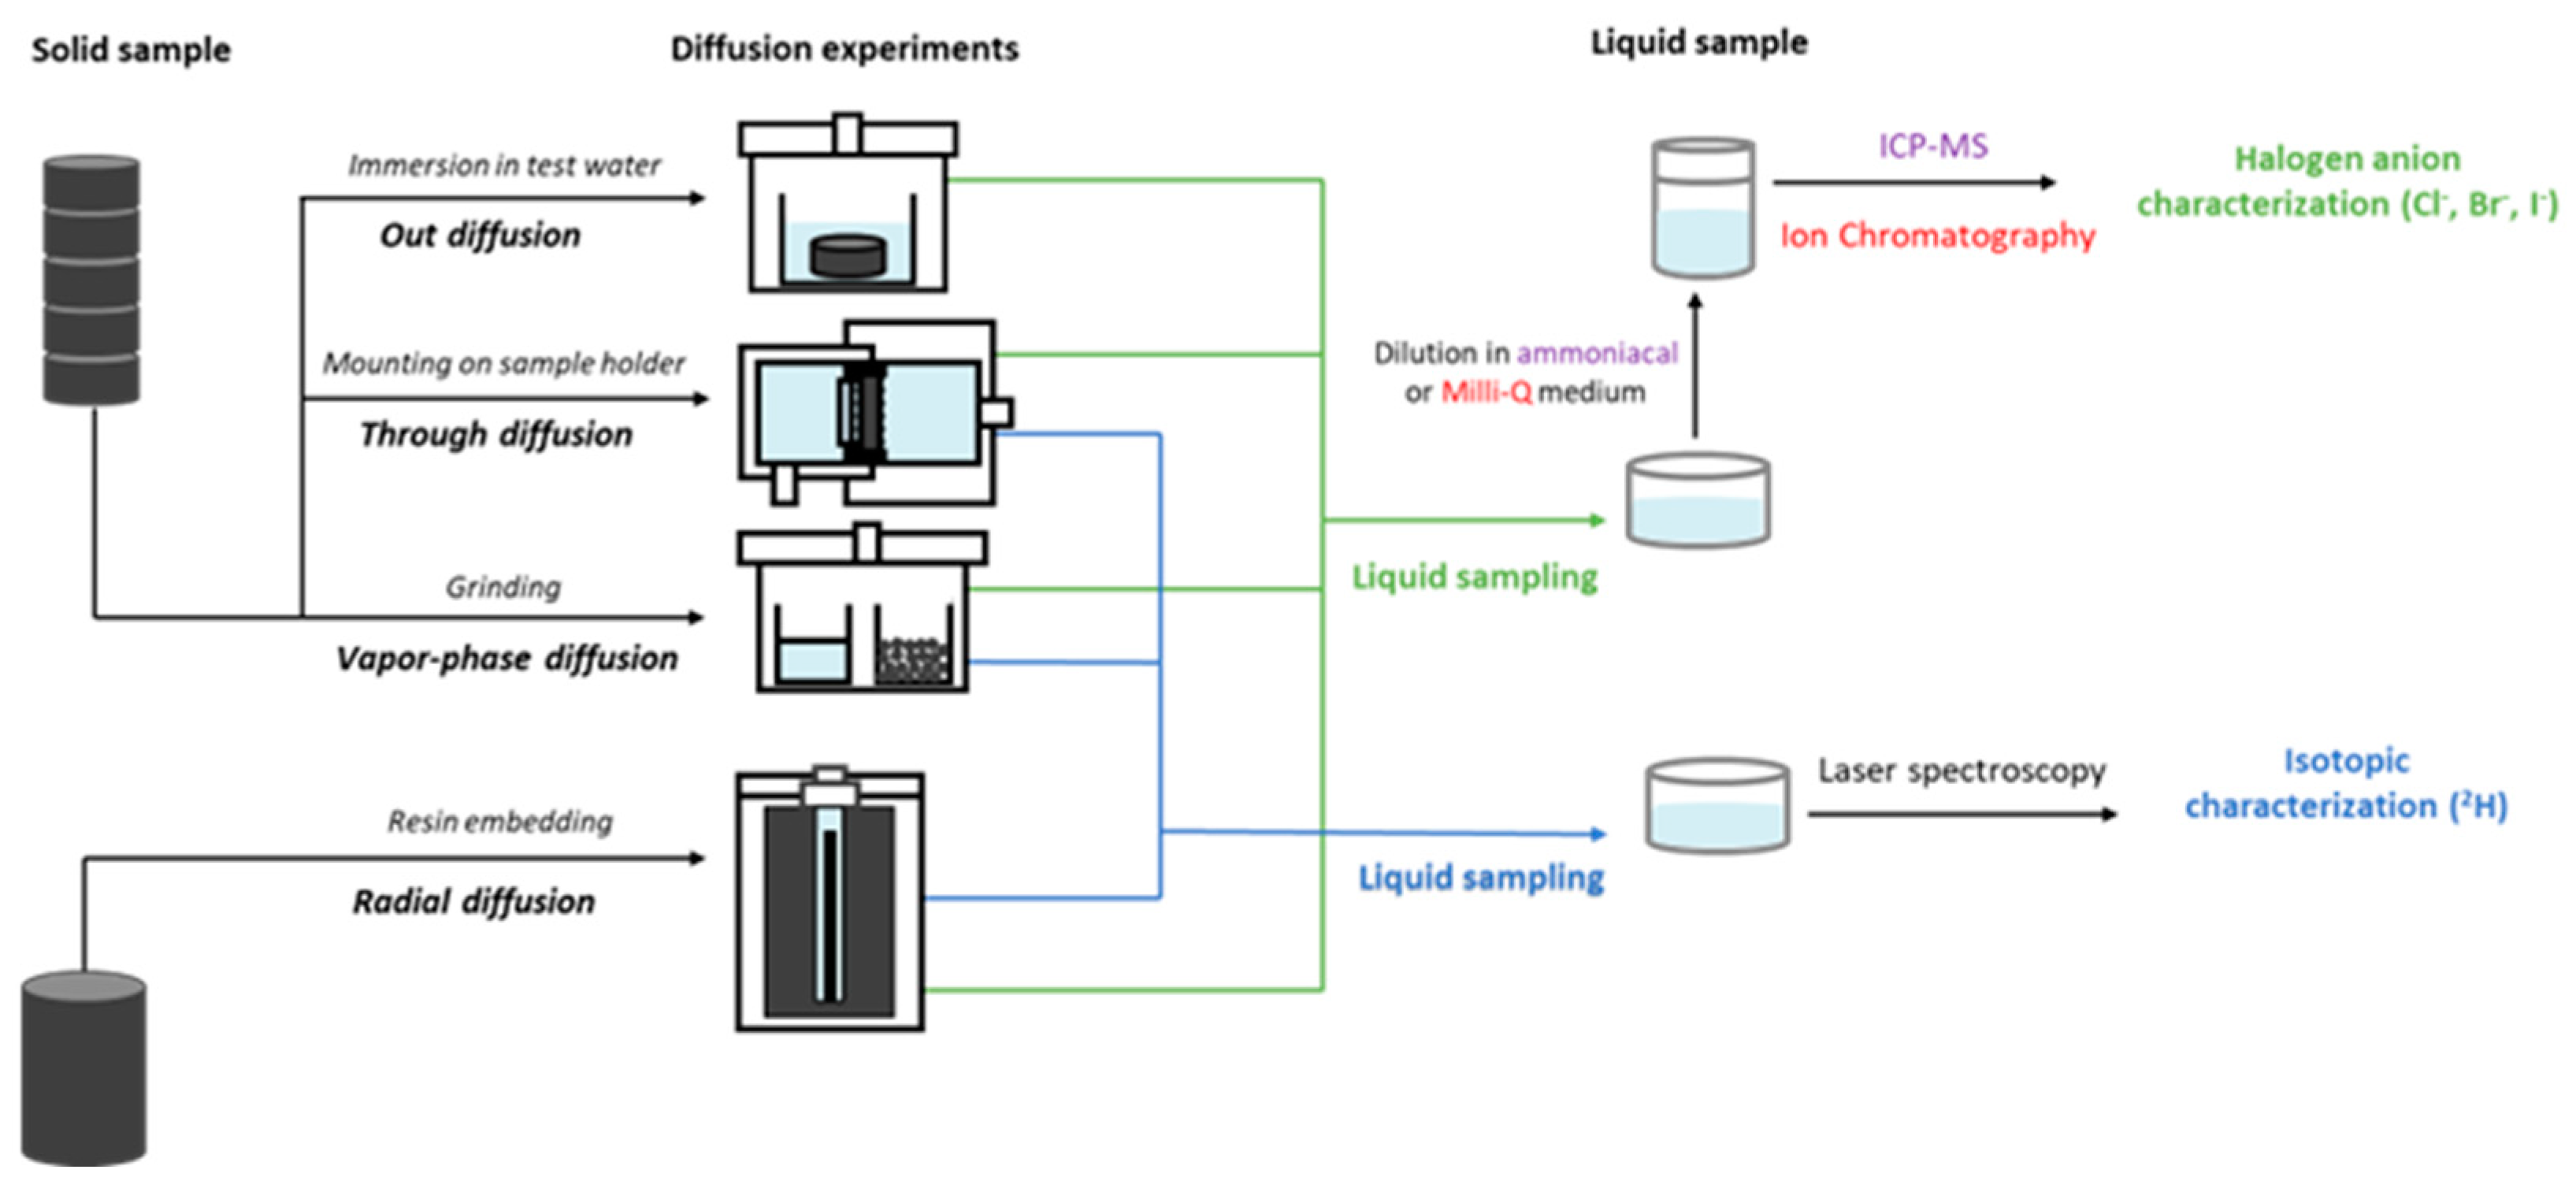
Four diffusion exchange techniques were used to acquire transport parameters and pore water concentrations: three aqueous phase diffusion experiments, in radial, through or out diffusion configuration, and one gas phase diffusion experiment. The choice of these techniques is explained by the impossibility of extracting pore water due to the very low hydraulic conductivity of the Upper Toarcian clay rock from 10−14 to 10−15 m s−1, according to Table 1. This further explains the predominance of diffusive transport over convection. The clay rock samples used in the various experiments came from cores taken during exploration drilling (DGT-EX1) or reference drilling (DGT-REF). These samples underwent various conditioning processes before the launch of each diffusion experiment (Figure 5).
The radial diffusion experiment consists of a diffusive equilibrium between pore water and a test solution of known composition placed in a reservoir drilled into a core [27,36]. The advantage of this technique is that tracer contents (2H, Cl, Br, I) and diffusive transport parameters, the porosities accessible (ωacc) and effective diffusion coefficients (De) can be obtained simultaneously on the same sample. In this experiment, the De and the ωacc to tracers can be estimated by fitting the analytical solution of the radial diffusion equation to the experimental results of the time-dependent tracking [37]. From these equations, a routine was developed using the “Mathematica 5.2” software, employing the algorithm by [38]. For these experiments, the ωacc to water are deduced from total porosity measurements (Table 3) and assuming an anion-accessible fraction of 0.55 determined by calibration.
The results from 3 diffusive exchange cells have enabled us to propose values for the De and ωacc to the tracers. The mean results of those experiments are reported in Table 6 for scoping calculations.
The out diffusion experiment involves immersing a cylindrical sample (approx. 60 mm in diameter and 10 mm in height) in a synthetic solution and sampling the solution until equilibrium is reached between the pore water and the synthetic solution. This method has been used on the Upper Toarcian clay rocks of Tournemire [39,40] and the Opalinus clay of Mont Terri [15]. It is used to estimate the pore diffusion coefficient (Dp) as well as the halogen anion concentration in the pore water by mass balance as described in [15].
The through diffusion experiment involves studying the migration of a tracer (often radioactive) through a porous cylindrical sample, placed between an upstream reservoir containing tracers at constant concentration and a downstream reservoir devoid of tracers. This method has been used on all the clay rocks of the Toarcian at Tournemire [41], the Aalenian-Toarcian or Opalinus clay at Mont Terri [15,18] and finally, the Callovo-Oxfordian at LMHM at Bure [42]. This experiment is used to determine the effective diffusion coefficient (Equation (4)) of the sample tested by inverse modeling using the multiphysics transport code Comsol®.
Diffusive vapour phase exchange is characterized by isotopic equilibrium by vapour phase diffusion between the pore water of a ground rock and a control water of known isotopic composition. This exchange makes it possible to obtain the isotopic composition of the pore water and the water content of the sample by mass balance [16,39,43].
For each diffusion cell, liquid samples were taken at different time intervals. Then, they were filtered at 0.45 µm (nylon filter) and conditioned for halide anion measurements (Cl, Br and I) or elemental measurements (Br and I) according to their concentration level. All analytical procedures are described in the supplementary data information (Section S1). Due to detection issues for Br and I by ion chromatography (detection limit in Section S1), the latter were consequently specifically analyzed by ICP-MS during phase 0 (Section S1, Table S1). Some speciation controls for Br and I were performed by using ion chromatography, hyphenated to ICP-MS [44,45]. The only species detected were Br and I (Section S1, Figure S1), and so the elemental concentrations measured by ICP-MS were therefore considered as the species concentration. For phase 1, the halogen anions were analyzed by ion chromatography. The other part of the samples enabled characterization of deuterium (2H) isotopic contents by T-LWIA-45-EP laser spectrometry [46,47]. Deuterium results are expressed as ‰ deviation (δ notation) relative to the international standards (V-SMOW for 2H). The analytical uncertainties ±1.0‰ for δ2H. Errors were estimated by using the same Gauss’s law as for petrophysics.
Table 4 and Table 5 summarize the different acquisitions performed so far in terms of initial pore water concentrations and diffusive parameters acquired on cores from borehole DGT-EX1. At this stage of the experiment, the results were deduced from out diffusion experiments for anions (Cl, Br, I) and by vapor-phase diffusive exchange for water stable isotopes (δ2HV-SMOW). The water content obtained by vapor phase exchange cells will not be taken into account in our calculations because they represent massic water content values that are underestimated compared to the volumetric water content that we calculate using radial diffusion cells.
Also, the average Cl, Br and I contents retained in the pore water in the initial state are (3.66 ± 0.02), (0.0290 ± 0.0002) and (0.00175 ± 0.00002) mmol L−1 respectively. For deuterium, the δ2HV-SMOW value considered for pore water is −42‰.
Moreover, in order to obtain a sufficient contrast with the pore water in its initial state, the concentrations retained for the test water were as follows: 500 mmol L−1 for Cl and 50 mmol L−1 for I and Br and +560‰ vs. V-SMOW for deuterium expressed as δ²H notation.
Note that the final concentration of the test water expressed in total dissolved solids is TDS = 41.9 g L−1, which is only slightly higher than that of seawater and experienced by the rock at the time of deposition (assumed at 35 g L−1). It is worthy to note that this TDS value also corresponds to an electrical conductivity at 15 °C of 50.4 mS cm−1 according to the equation proposed in [48] for seawater and to an ionic strength of I = 5.705 10−1 mol kgw−1. The protocol for preparing the water in the test section was therefore to add sodium chloride, sodium bromide and sodium iodide salts (VWR, all normapur quality) to demineralized water in the following proportions: NaCl 22.2 g L−1, NaBr 5.14 g L−1 and NaI 7.49 g L−1.
The diffusive exchange results obtained parallel to the bedding by radial diffusion technique are summarized in Table 6. The diffusion coefficients for deuterium and chloride were estimated from the mean over three samples from the DGT-EX1 borehole at depths of 184, 206 and 233 cm from the edge of the borehole ( D e , 2 H = 3.23 ± 0.618 10−11 m2 s−1 for a ω a c c , 2 H = 10 ± 1.0%; D e , C l = 2.60 ± 0.115 10−12 m2 s−1 for a ω a c c , C l = 5.36 ± 0.3%) when those for bromide and iodide were deduced from a single sample from the DGT-EX1 borehole at depths of 184 ( D e , B r = 2.58 10−12 m2 s−1 for a ω a c c , B r = 5.8 ± 0.5%; D e , I = 4.03 10−12 m2 s−1 for a ω a c c , I = 4.9 ± 0.5%). It is worthy to note that the results acquired by the radial diffusion technique are clearly in the range of those given in Table 1 for the reference level. We can also note that the mass water content acquired by diffusive vapour phase exchange for deuterium is on average (4.9 ± 0.2) wt % (Table 5), i.e., a porosity accessible to deuterium ω a c c , D of 12.5 vol % by considering a bulk wet density of 2.538 kg L−1 (Table 3). Although the value is close to that determined by radial diffusion ( ω a c c , D = 10 ± 1.0%), the latter is preferred as it is less disturbed by sample grinding.

2.4. Determination of Heat and Mass Transport Parameters in Their Initial State

For heat transfer, thermal conduction is defined by Fourier’s law as
J T C = λ T  
where the heat flux J T C is proportional to the temperature gradient T via a phenomenological coefficient called the effective thermal conductivity λ (W m−1 K−1). This parameter is in turn defined by
λ = α T ρ c p  
which in turn is defined by the effective thermal diffusivity α(T) (m2 s−1), bulk density ρ (kg m−3) and heat capacity   c p   (J m−3 K−1).
The Tournemire clay rock exhibits thermal values typical of clay rocks (for the Callovo-Oxfordian argillite at the Bure site [1] and for the Opalinus clay at Mont Terri [49]) with an effective thermal conductivity parallel to stratification of (2.2 ± 0.7) W m−1 K−1 and an effective specific heat capacity of (800 ± 100) J kg−1 K−1 [13] with CNRS-PROMES and GFZ laboratories [50]. The recent measurements performed by GFZ labs by TLS (transient line source) on the sound rock at a different location provide an effective thermal conductivity of 2.2 W m−1 K−1 and 3.16 W m−1 K−1 normal and parallel to the bedding, respectively, with a specific heat capacity estimated by TPS (transient plane source) of about 850 J kg−1 K−1. In the framework of this study, some measurements were also performed at the French CNRS-PROMES laboratory on core samples from borehole DGT-TD1 by the laser Flash method. The results revealed effective thermal diffusivity values normal to the bedding of 3.5 × 10⁻⁷ m2 s−1 at 250 cm/ground level, leading to an estimate of effective thermal conductivity value perpendicular to the stratification of (0.6 ± 0.2) W m−1 K−1 for a bulk wet density of 2540 kg m−3 and a heat capacity of 1.8 × 10⁶ J m−3 K−1. Therefore, the absence of a clear trend in the anisotropy of effective thermal conductivity values perpendicular to the stratification pleads in favour of calibration for obtaining the effective thermal conductivity normal to the bedding.
For mass transfer, the first step is to assess the minimum distance that can be reached by tracer migration. This involves simplifying mass transfer to diffusive transfer, which is known to be dominant over convection. The diffusive flow to be considered in our case is a thermo-diffusive flow coupling diffusive flows under concentration gradient (Fick’s law) and temperature gradient (Soret effect). The thermo-diffusion mass transfer equation then becomes:
J T D = D e , i c i + S T c i T
with S T the Soret coefficient, which will be considered constant in our case study. The effective diffusion coefficient of species i  D e , i is defined by
D e , i = ω a c c , i D p , i
with ω a c c , i the accessible porosity to the diffusive species and D p , i   its pore diffusion coefficient.
In a porous medium, the porewater diffusion coefficient ( D p , i ) differs from the diffusion coefficient in free water by tortuosity and constrictivity factors [51,52]:
D p , i = δ θ 2 D 0 , i
where D 0 , i is the diffusion coefficient of the species in water (m² s−1).
The tortuosity factor ( θ 2 ) characterizes the fact that diffusing molecules must bypass solid grains and travel a longer path (Le) than the straight-line distance (L). The constriction factor (δ) defines the effects of pore narrowing and widening [53]. A straight pore has a constriction factor of 1; if it narrows, it becomes less than 1, and if it widens, it becomes greater than 1. Inert porous media have constriction factors slightly less than 1 [51].
However, in a natural porous medium, it is difficult to differentiate tortuosity from constrictivity, so both factors are combined into a geometric factor which is related by Archie’s law to the accessible porosity [33,53]:
δ θ 2 = 1 G i = ( ω a c c , i ) n
where n is an empirical factor ( 1 ).
In the context of geological disposal, the temperature may vary with depth, due to the local geothermal gradient and the presence of exothermic disposal packages. In this case, a correction of the diffusion coefficients is necessary, and can be approached in two ways. The first is via the Stokes–Einstein model, based on the temperature dependence of water viscosity [54]. The second considers an Arrhenius-type law to estimate the dependence of the effective diffusion coefficient on temperature and on the activation energy of the diffusing species [55]. In both cases, the models demonstrated their ability to describe the diffusion of 36Cl in pore water from the Callovo-Oxfordian and Opalinus clays of Mont Terri and Benken. In contrast, the Stokes–Einstein model failed to describe the temperature dependency of tritiated water and cations in the Opalinus [55]. The Arrhenius-type model will therefore be preferred in our predictive approach, as follows:
D e , i T j = D e , i T r e f e E a R 1 T r e f 1 T j      
with Ea the activation energy (J mol−1), which depends on the diffusing species, and R the perfect gas constant (J mol−1 K−1). In the absence of values from specific activation energy measurements on the Toarcian clay rock, predictive measurements were carried out on values obtained for the Opalinus clay from the Benken site, whose mineralogical, petrophysical and transfer properties are closest to those of the Tournemire Toarcian. The following value of Ea = 22.2 ± 1.78 kJ mol−1 for deuterium and (20.3 ± 1.84) kJ mol−1 are therefore used, with reference to measurements carried out on 36Cl and 3H.
If necessary, in addition to diffusive flow, convection could be considered by numerical modelling. However, this part of the work will be considered at a later stage in combination with inverse calculations fitted to experimental mass transfer data.

2.5. Scoping Calculations for Experiment Dimensioning and Design

The aims of these calculations are (1) to estimate the heat transfer extension around the test zone for a constant temperature of 70 °C imposed at the walls and the bottom of the test section referencing to temperatures expected at the HLW cell wall of Andra’s concept during the thermal period; (2) to dimension the test zone in terms of useful volume, seeking to establish the penetration depth of the tracers and their lateral influence, to avoid disturbing future sampling; and (3) to analyze the importance of certain proposed transport parameters such as Soret’s coefficient with currently available data.
Using identical parameters as well as initial and boundary conditions to the DIGIT experiment, we developed a numerical model to confirm the accuracy of thermal–solute transport coupling aspects in the proposed mathematical model. We did not apply convection mechanisms for this simulation; merely Equations (1) and (3) are considered, allowing for the material’s anisotropy. The model is implemented in the finite element software Comsol Multiphysics®, where the heat transfer module was used to study heat transport, while the transport of diluted species module was used to study solute transport. Further extensions of these modules have been made to account for Soret’s law and the Arrhenius-type model for temperature dependent diffusion. Table 6 summarizes the input data used for the predictive calculation, most of which was acquired for the purposes of the study.
Table 6. Input parameters used for scoping calculations.
ParameterSymbolValueUnitSource
∥ parallel, ⊥ normal to bedding
Initial 2H concentration in porewater δ 2 H 0 −42.0 ± 4‰ vs. SMOWThis study
Initial Cl concentration in porewater C l 0 3.66 ± 0.02mmol L−1This study
Initial Br concentration in porewater B r 0 0.0290 ± 0.0002mmol L−1This study
Initial I concentration in porewater I 0 0.00175 ± 0.00002mmol L−1This study
Specific heat capacityCp800 ± 100J kg−1 L−1[28]
Thermal conductivityλ2.2 ± 0.7 ∥W m−1 K−1[28]
Bulk wet density ρ h 2540 ± 2Kg m−3This study
Total porosity accessible to water ω w 10 ± 1.0vol. %This study
Total porosity accessible to Cl ω C l 5.36 ± 0.3vol. %This study
Total porosity accessible to Br ω B r 5.8 ± 0.5vol. %This study
Total porosity accessible to I ω I 4.9 ± 0.5vol. %This study
Effective diffusion coefficient for 2H ∥ D e 2 H 3.23 ± 0.618 × 10⁻¹¹m2 s−1This study
Effective diffusion coefficient for Cl D e C l 2.60 ± 0.115 × 10⁻¹²m2 s−1This study
Effective diffusion coefficient for Br D e B r 2.58 × 10⁻¹²m2 s−1This study
Effective diffusion coefficient for I D e I 4.03 × 10⁻¹²m2 s−1This study
Anisotropy   for   D e 2 H valuesDe/De3 [19]
Anisotropy   for   D e C l valuesDe/De3.0 ± 0.4 [17]
Anisotropy   for   D e B r valuesDe/De2.6 ± 0.4 [17]
Anisotropy   for   D e I valuesDe/De3.8 ± 0.4 [17]
Activation energy for 2H E a 2 H 22.2 ± 1.78kJ mol−1[55]
Activation energy for anions E a A 20.3 ± 1.84kJ mol−1[55]
Soret coefficientST1 × 10−2K−1[22]
Reference temperatureTref288.15 (15)K (°C)This study
Input temperature at the test section wallTtest section343.15 (70)K (°C)This study
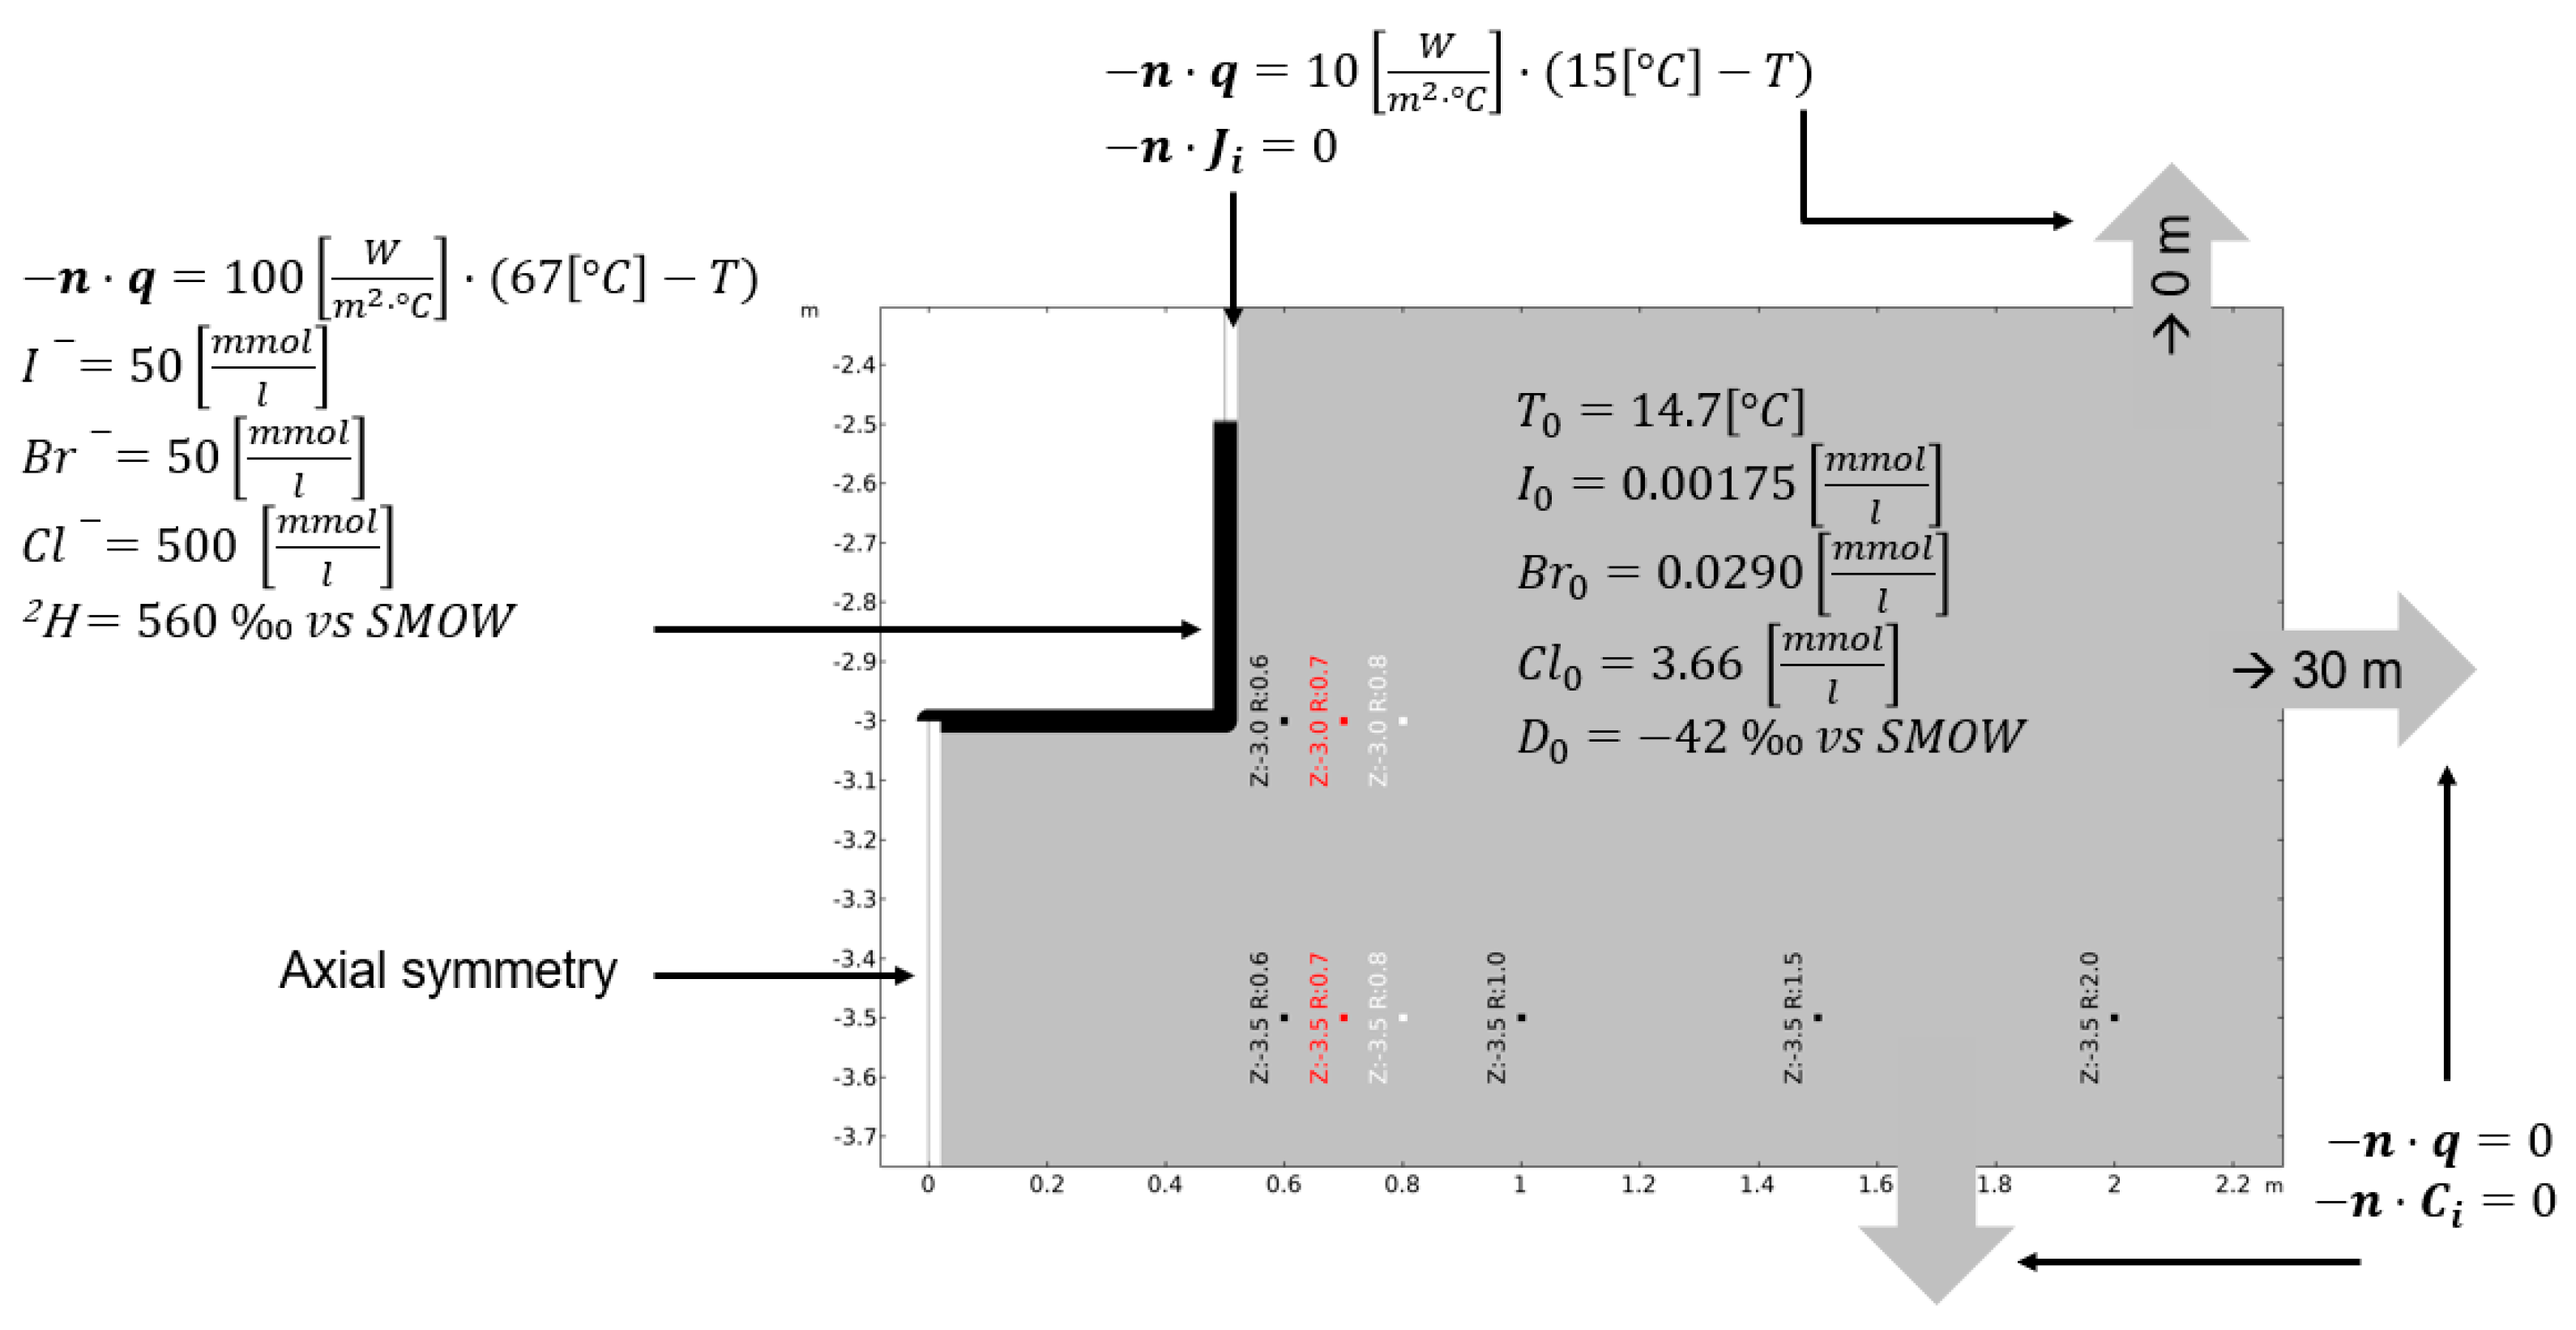
The model, including initial and boundary conditions, used for the scoping calcu-lations is summarized in Figure 6.
Figure 6 depicts an axis-symmetric model along the horizontal axis with zero fluxes for temperature and concentrations at 30 m radially and 20 m axially. These distances to the outer boundaries are chosen to avoid boundary effects on the results.
Indeed, the model built in Comsol allows imposing two conditions, either n j = 0 if n u 0 or C = C 0 if n u < 0 at the boundaries. Since the Darcy velocity ( u ) is zero everywhere, as we do not impose a Darcy velocity, the boundary conditions are thus defined by n j = 0 and C = 0 at the domain boundaries. A variable heat flux with temperature is imposed on the walls and surface of the gallery in contact with the atmosphere, characterized by exchange coefficients of 10 and 100. A supposedly homogeneous temperature of 70 °C is imposed on the walls of the test section.
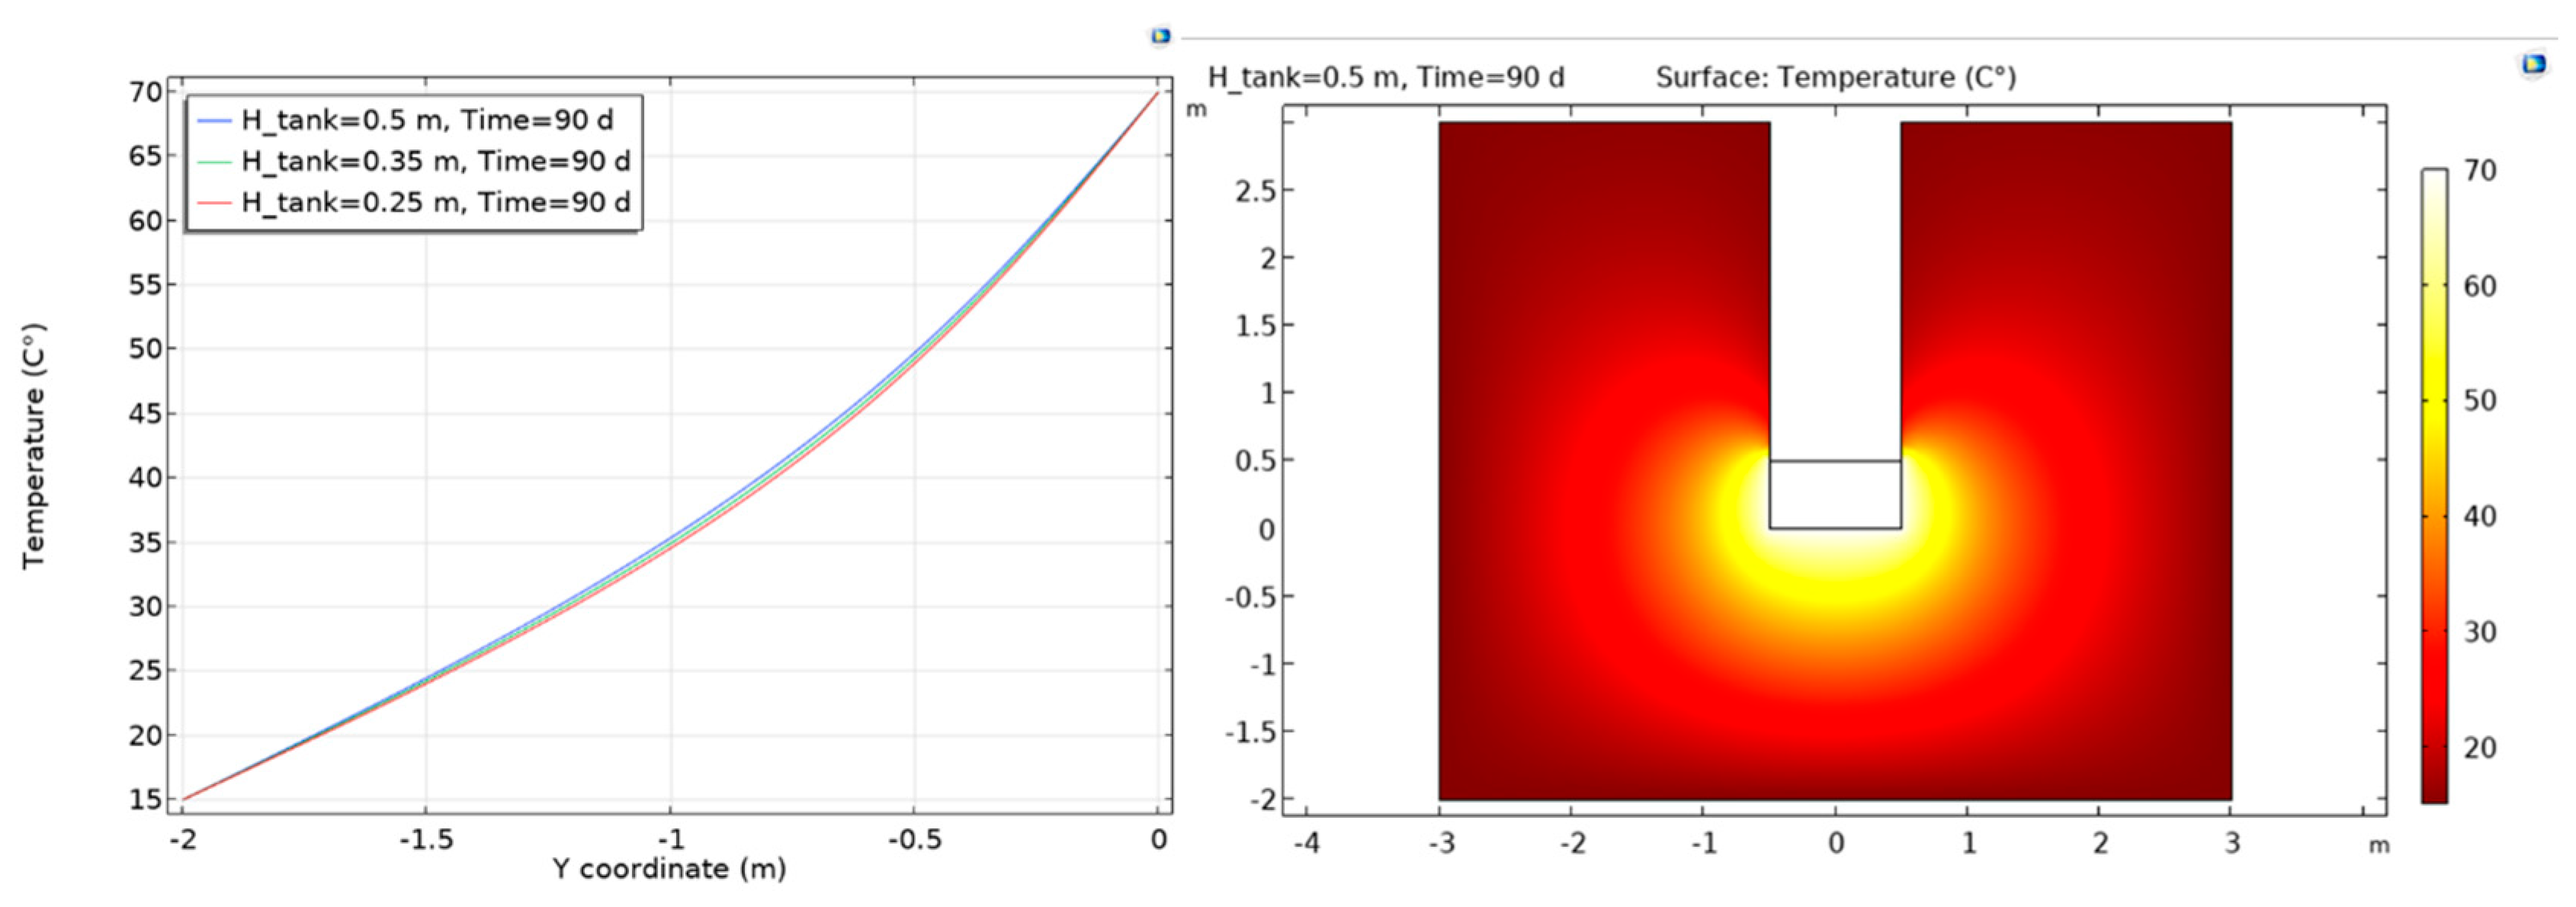
The heat transfer results (Figure 7) for a temperature in the test section of 70 °C suggest that an equilibrium was reached after three months. Additionally, the temperature decreased significantly after three months, by 50 °C in the first few tens of cm from the test section. In order to verify this trend, it is therefore proposed to install numerous temperature probes between 10 cm and 150 cm distance from the test section.
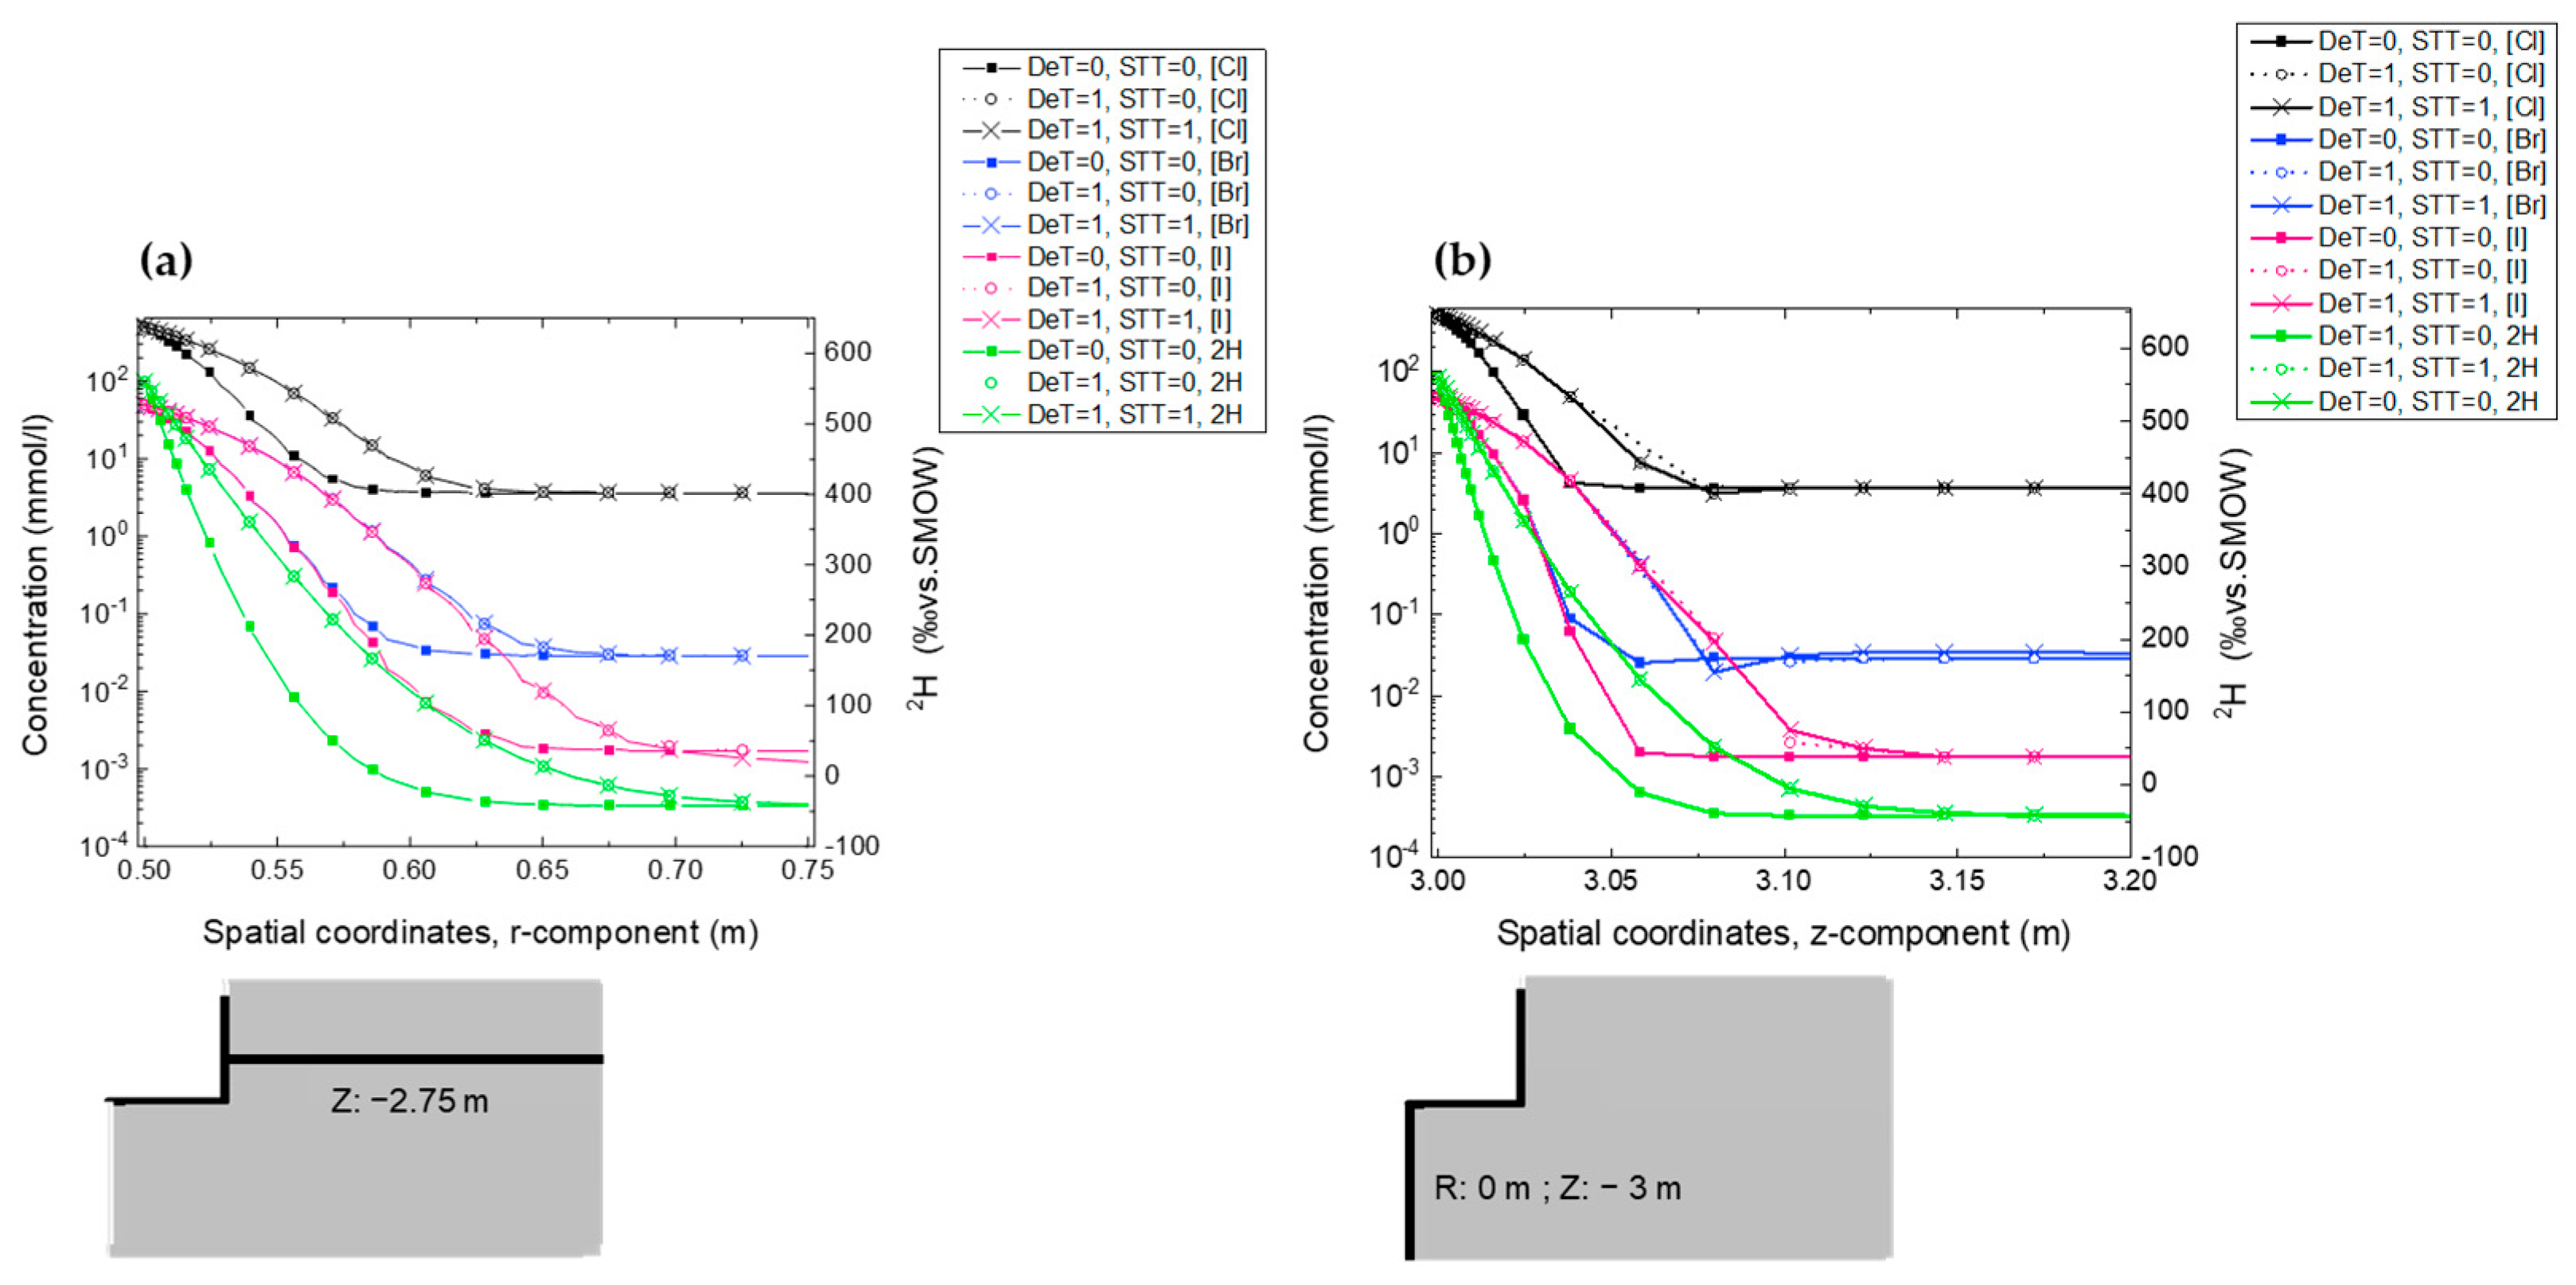
For simulation times of 1 month, 12 months and 10 years, the mass transfer results acquired without any effect of temperature on the diffusion coefficients (DeT = 0, i.e., at 15 °C) and without any Soret effect (SST = 0) suggest a penetration of deuterium parallel to the stratification of the order of 5 cm for a transfer time of one month period (Figure 8a) and up to 4 cm for a transfer perpendicular to the stratification (Figure 8b). For the same conditions, the results give slightly higher penetrations for anions of around 7 cm. The results allow us to estimate a temperature-accelerated penetration multiplied by about 1/3 of the distance, taking into account the effect of temperature on the diffusion coefficients (DeT = 1). They also show that the Soret effect has no visible effect on the transfer of tracers with values taken from the literature.
All these results suggest that the test area should allow samples to be taken at least 1 radius apart. With 3 sampling phases planned—one before heating and two after heating, and an average of 3 samples per phase and for each direction—we were able to estimate the height of the test zone at around 50 cm.

3. Installation of the DIGIT Experiment

Following the large-diameter core drilling, several boreholes were drilled in 2022 to monitor the experiment. Their characteristics are shown in Table 1 and their layout in Figure 4 and Figure 9.
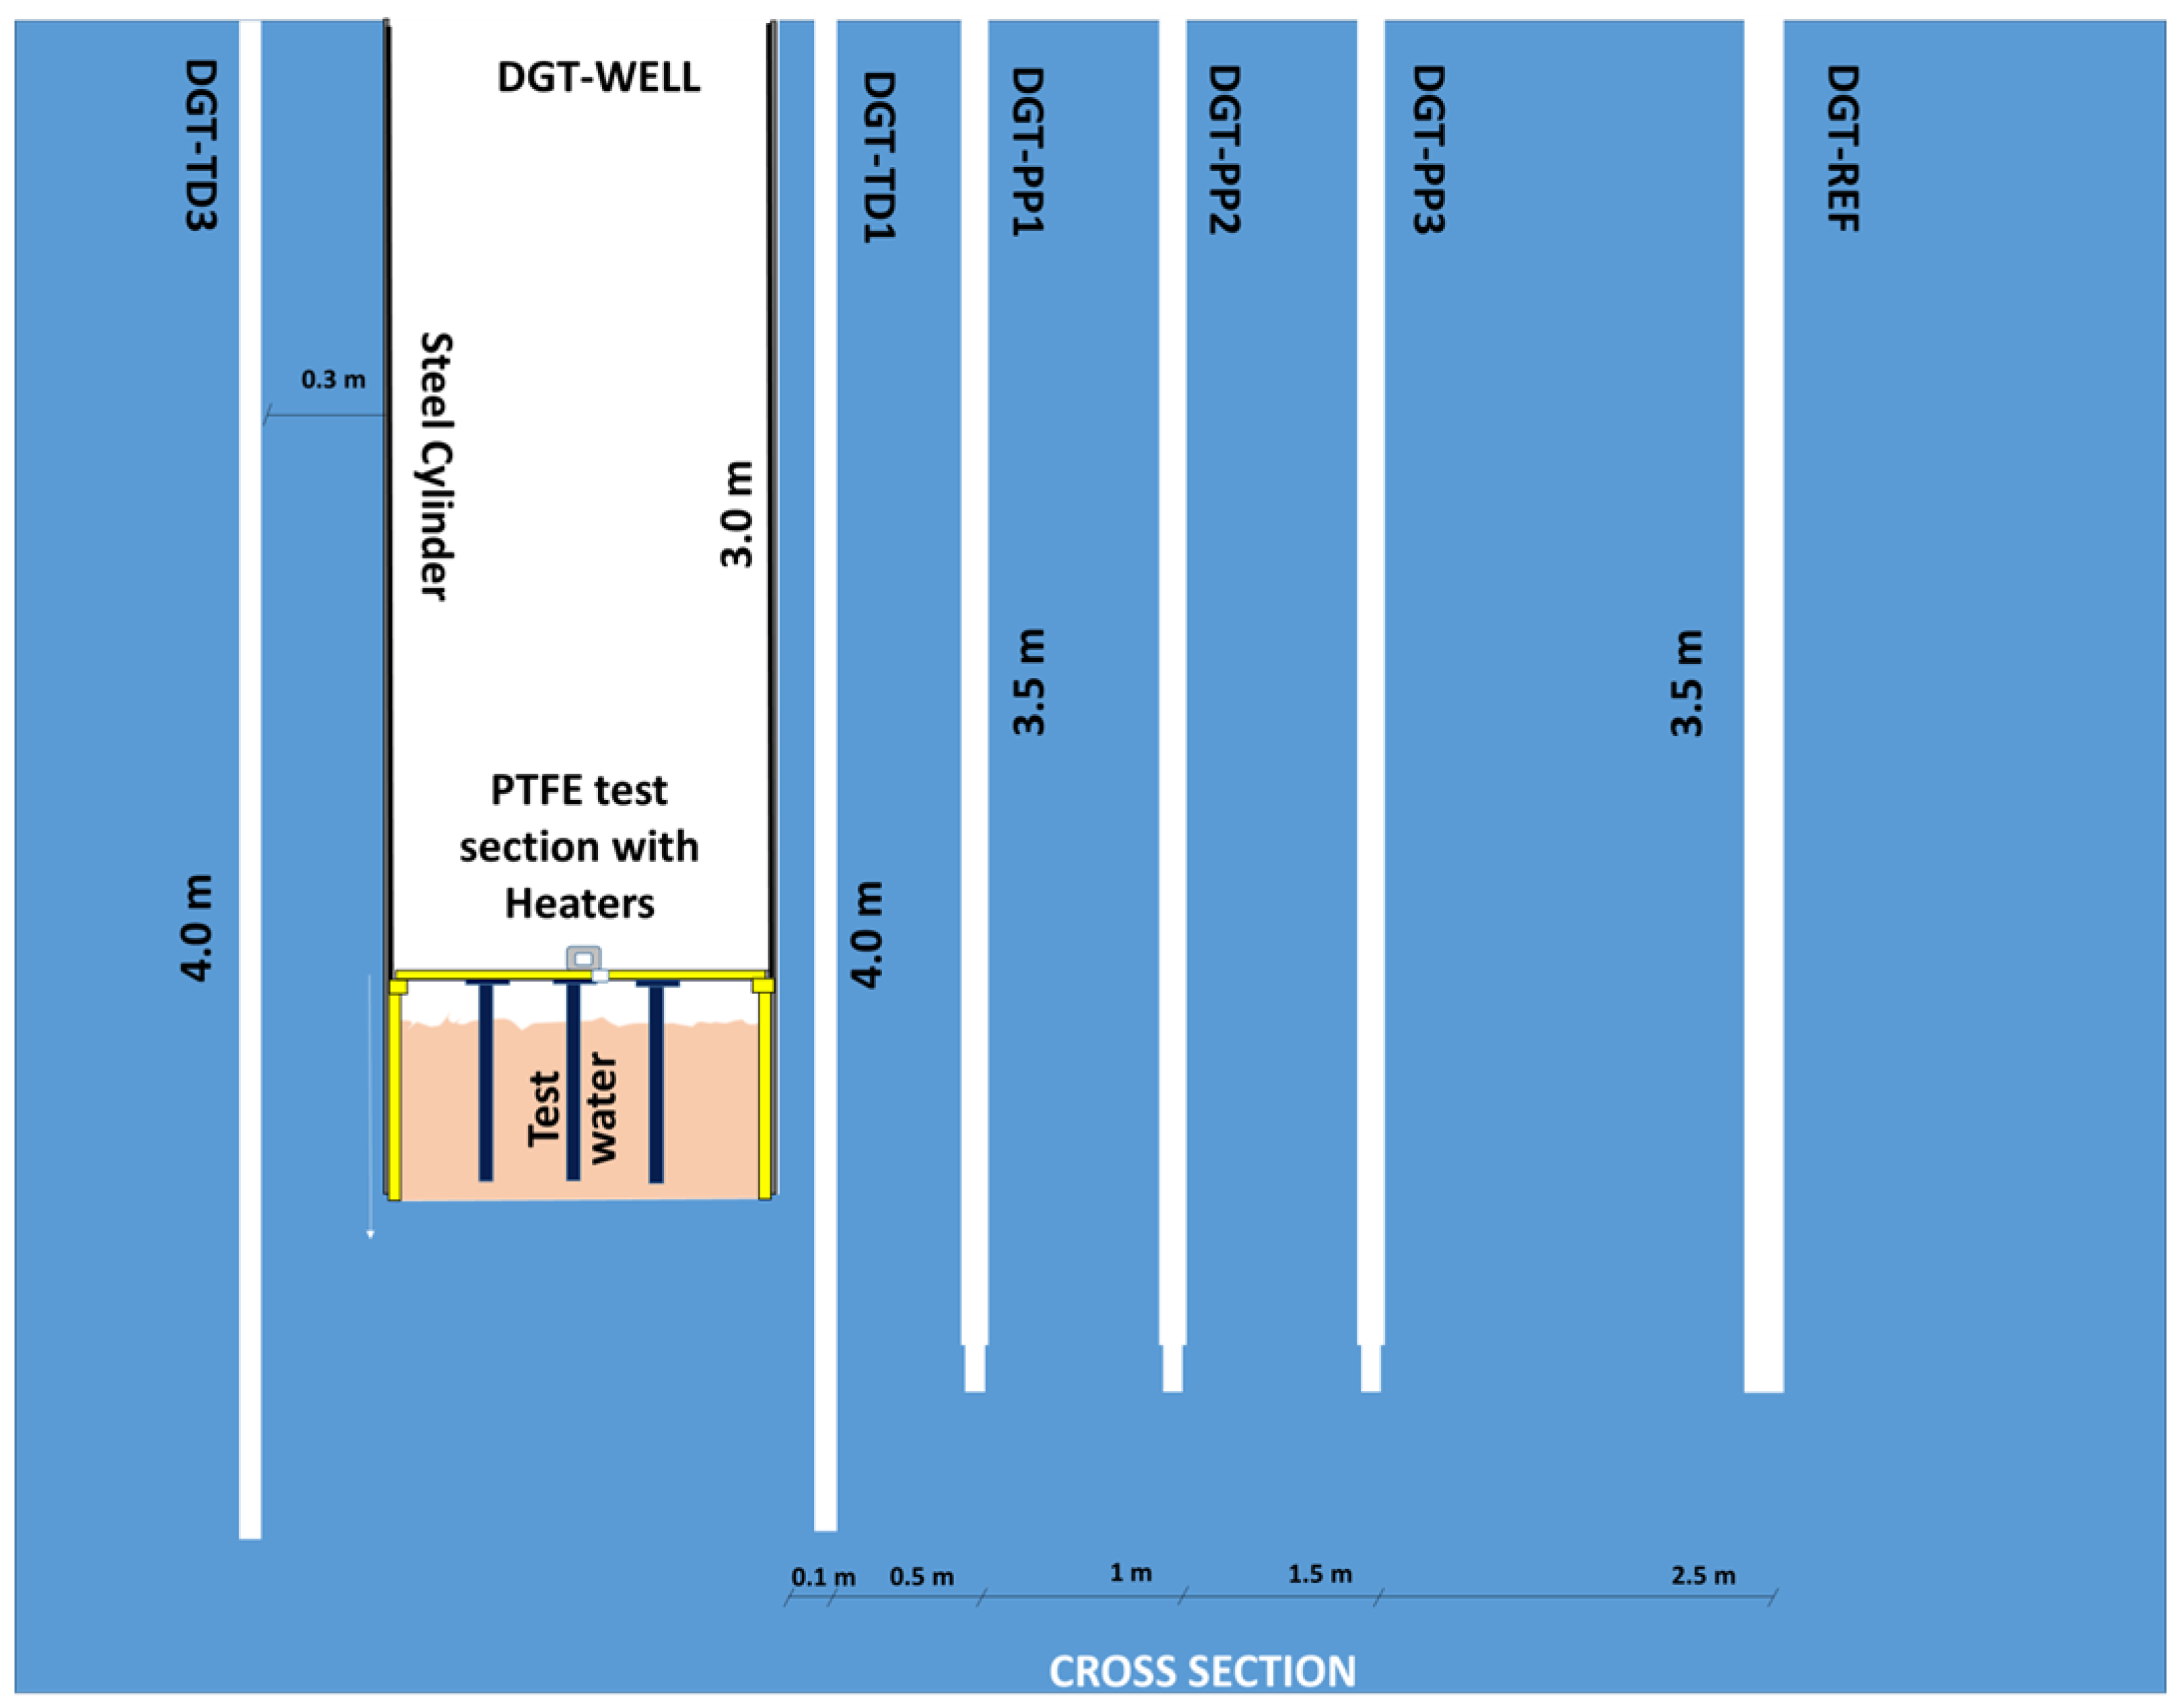
Figure 9 shows a cross section of the main shaft and the various peripheral boreholes (TD and PT) drilled around it. The purpose of these boreholes is to monitor changes in temperature, pressure, and deformation during the various thermal tests. All the boreholes are air-drilled.
Boreholes TD1, TD2 and TD3 are located 10, 20 and 30 cm respectively from the well wall. Each borehole was equipped with 2 platinum probes (PT100) located at a depth of 3 m and 3.5 m from the concrete floor of the gallery (0 m) and an optical fiber to measure temperature and deformation.
Boreholes PP1, PP2 and PP3 (depth 3.5 m, borehole diameter 46 mm) were installed 50, 100 and 150 cm, respectively, from the well wall. These boreholes are equipped with pressure (absolute pressure) and temperature (PT1000) sensors at a depth of 3.5 m. Two hydraulic lines link the test chamber to the surface and are connected to a pressure gauge. These lines made it possible to resaturate the test chamber before starting the heating experiment and to recover the equilibrium pore pressure (200 kPa) at the start of the thermal test. The reference borehole DGT-REF is supposed to be far enough from the well (distance from the well 2.5 m) to be not affected, or weakly affected by the temperature. It was drilled to monitor the evolution of the water in equilibrium with the pore water in the rock, undisturbed by the heating test, using electrical conductivity coupled with a temperature probe. The borehole was also filled with the same solution as that used for the test section of the DGT-well.
The DGT-INS borehole, known as the instrumentation borehole, is used to run the cables for the sensors installed in the test zone. Once the cables had been installed, the borehole was filled with a bentonite-based cement.
The well test zone was delimited by 16 PTFE strips (500 mm × 50 mm × 20 mm) laid flush with the rock and designed to support (a) a PTFE ring (external diameter 1000 mm—internal diameter 900 mm) on which a 316 L stainless steel ferrule (height 2.6 m, diameter 1 m, thickness) rests, and (b) a cover, also made of PTFE, supporting the heating elements. The spacing of the bands was chosen to allow horizontal cores of at least 100 mm diameter to be drilled in the stratification plane.
The test zone was then equipped with sensors as described in Table 2 and shown in Figure 10. In order to study the homogeneity of the temperature in the test section, the temperature sensors (PT100 and PT1000), each approximately 100 mm high, were placed at two different depths (100 and 300 mm from the bottom of the well). For the same reason, an optical fiber with a temperature sensor and LUNA termination for and ODISI 6000 interrogator (Sisgeo) lecture was installed in a spiral in the test chamber of the shaft. Finally, the area was also equipped with a conductivity probe for simultaneous measurement of electrical conductivity and temperature.
With the exception of the conductivity probes and the fiber optic sensors, all the other temperature and pore pressure sensors were connected to a datalogger (Omnialog data acquisition system from sisgeo.com) with the aim of obtaining one acquisition per sensor every two hours. These transfers were made via two multiplexers placed in a box installed opposite the DIGIT experiment and connected to the Datalogger using an LSZH-type cable. All the sensors installed underwent factory calibration, which for some of them (pressure probes) resulted in the entry of their calibration parameter in the Datalogger. Once the sensors had been created in the datalogger, they could be connected remotely to IRSN’s data management system, which collects data and couples it to a predictive and prescriptive analysis engine.

4. Discussion

The initialization of the experiment is also described as phase 1. It consisted in carrying out a traced, unheated water start-up. The aim of this phase was to compare the mass transfer results obtained at the end of the unheated phase with those deduced from the predictive calculations. Phase 1 should therefore enable the effects of scale to be deduced, and in particular, the possible contribution of the damaged zone to mass transfer.
Phase 1 started with the test section being flooded on 3 November 2022 and drained on 27 February 2023, i.e., a duration of 2365 h or approx. 100 days. The volume of water used was 392 litres in the test area under the lid supporting the heating elements and isolating the test section from atmosphere.
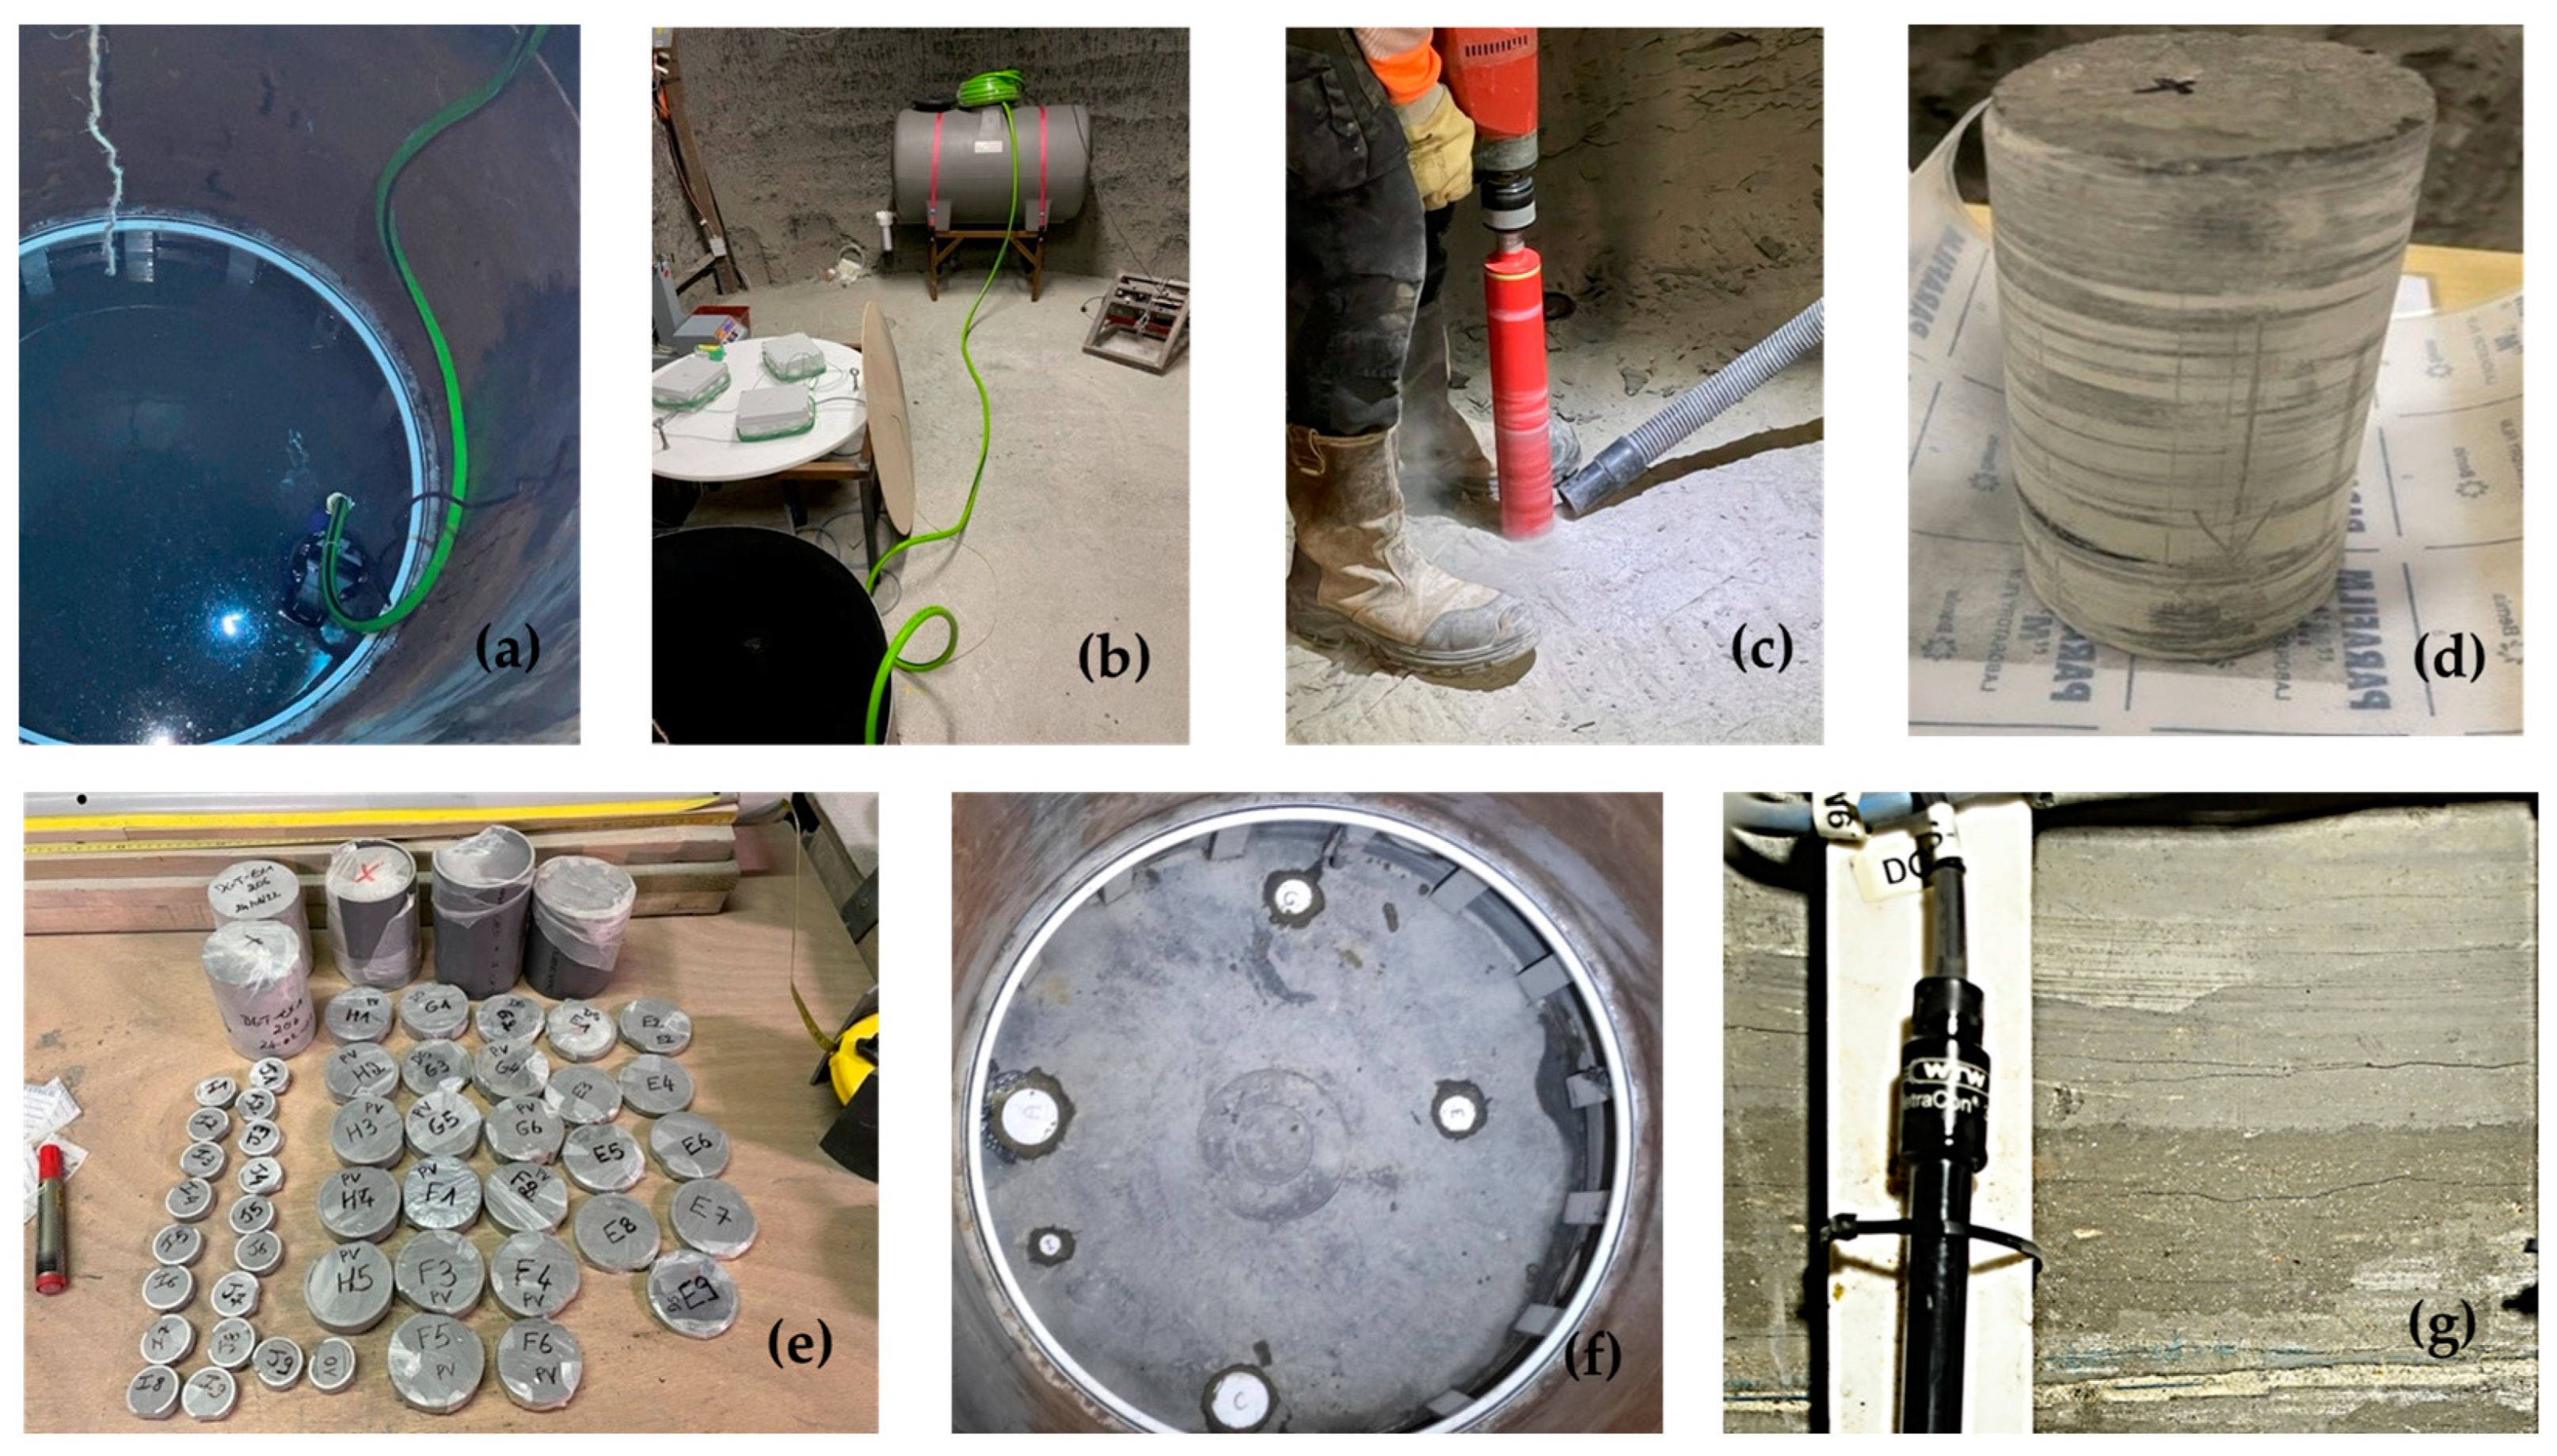
The 1st sampling campaign took place at the end of this exchange phase under isothermal conditions (15 °C). Figure 11 summarizes the various stages of sampling carried out at the end of phase 1 between 27 February 2023 and 3 March 2023. The water was pumped and then stored in a 600 L PTFE tank. Core samples were taken using a Hilti machine equipped with 91, 66 and 35 mm external diameter coring tools. The samples were placed in plastic tubes to limit their deconfinement and facilitate their cutting before being wrapped in parafilm to limit their desaturation. Shrinkage cracks appeared the day after the well was emptied. These cracks are linked to the dry atmosphere prevailing in the galleries of the underground laboratory in winter [56]. It is generally admitted at this URL that the penetration depth of these cracks in the rock varies in between 0 and 1 m following exposition time and period to the desaturated atmosphere.
At the end of phase 1, the samples intended for the acquisition of tracer profiles were processed first.
Initially, out diffusion cells were launched for the three analyzed tracers. We obtained concentrations of Cl, Br and I in pore water ranging from (435.48 ± 2.53) to (4.37 ± 0.03) mmol L−1, (41.51 ± 0.238) to (0.1034 ± 0.0003) mmol L−1, and (40.95 ± 0.239) to (0.045 ± 0.0005) mmol L−1, respectively, from 1 cm to 10 cm depth (Table 7). These results were obtained from a 10 cm core drilled perpendicular to the stratification.
The initial calibration results of effective diffusion coefficients against experimental results for anions show De values higher than those measured in phase 0 by radial diffusion cell (Figure 12).
Indeed, we observe an increase in the penetration of halogen anions with depth between phase 0 and phase 1. For instance, for Cl at a depth of 4 cm, its initial concentration is reached, whereas in phase 1 at the same distance, its concentration is approximately (50.0 ± 0.3) mmol L−1, reaching the initial concentration at 6 cm (Figure 12a). Thus, we observe a penetration of Cl of about 2 cm more between phase 0 and phase 1. The same phenomenon is observed for Br and I (Figure 12b,c, respectively), suggesting a similar mobility.
The simulation of halogen anions obtained at the end of Phase 1 and compared to that simulated at initial conditions (Figure 12) clearly indicates an increase in effective diffusion coefficients. According to [24], the experimental results obtained at the end of phase 1 should be located in the Excavated Damaged Zone (EDZ) of the shaft. Therefore, assuming the same pore diffusion coefficient between phase 0 and phase 1, one could assume that this increase in the effective diffusive coefficients reflects the increase in accessible porosity to tracers. The results for 2H are currently being acquired. It can conclude that the new De estimates should be considered for the heating phase to come (Table 8).
Thus, the difference between the effective diffusion coefficients of deuterium and anionic species is explained, in part, by their diffusion coefficient in water, which may be slightly different [57], but mainly by their accessible porosity specified in Table 6, which is approximately 50% of the total porosity for the anions, and their geometric factor G i (Equation (6)), which is a function of the tortuosity factor θ 2 and the constrictivity factor δ. The pore diffusion coefficient as specified in Equation (5) allows us to estimate a geometric factor of 44.7, 46.8, 24.9 and 10.4, respectively, for Cl, Br, I and 2H. These results lead us to conclude that the geometric factor for anionic species is between 4 and 2 times higher than that of deuterium, which is consistent with observations for Opaline clay despite lower values [53]. We also assume that anion exclusion phenomena may explain the differences in De between the halogen anions and deuterium.

5. Preliminary Conclusions and Perspectives

The DIGIT experiment was launched at the Tournemire underground research laboratory (LRST) with the aim of determining the effects of temperature on the transfer of the most mobile radionuclide analogues. The aim of this experiment is to provide a partial answer to certain questions about the possible spread of contamination in the host rock following a possible leak of radioelements from a high-level disposal package in the middle of a thermal phase and in a clay context such as that of Cigéo, the French geological disposal project. More specifically, the in situ experiment should make it possible to assess the role of scale effects and thermodiffusion—a coupled process generally forgotten, adding diffusion due to Soret effect in the transfer of these radioelement analogues. This first paper presents the first phase of the study and the initial results obtained when the experiment was set up. This phase, known as phase 1, is limited to isothermal conditions, the start of the heating phase being now in progress. It should be noted, however, that some parameters are still being acquired and will only be presented in the second part of the study.
The first part of this work consisted in defining the initial state of the site and the dimensions of the experiment. After the presentation of the site and validation of the test zone, a selection of four tracers was proposed as analogues of the most mobile radionuclides. As radiotracers are banned at the LRST, the choice was necessarily made for a cocktail of tracers consisting of three halides (Cl, Br and I) and 2H as a tracer of the water molecule. All these tracers are naturally present in the pore water of the clay rock, at low concentration levels, so it was necessary to determine their initial concentrations. Data were obtained from core samples taken from exploration boreholes drilled in the vicinity of the site. As it was impossible to extract water due to the very low permeability of the rock, diffusive exchange techniques in the liquid or gas phase were used to acquire the initial concentrations of anions and water isotopes, respectively. The concentrations of anionic tracers were acquired by the out diffusion technique. The results obtained at this stage enabled us to propose initial Cl, Br and I concentrations of (3.66 ± 0.02), (0.0290 ± 0.0002) and (0.00175 ± 0.00002) mmol L−1, respectively. Ion chromatography was used for chlorides and ICP-MS for bromides and iodides. For deuterium, a content of −42‰ vs. V-SMOW could be determined. Diffusive transport parameter measurements were also obtained on cores from these same exploration boreholes. The first acquisitions presented here were acquired by radial diffusion in parallel with stratification. The results of the effective diffusion coefficients and accessible porosity obtained ( D e , 2 H = 3.23 ± 0.618 10−11 m2 s−1 for a ω a c c , 2 H = 10 ± 1.0%; D e , C l = 2.60 ± 0.115 10−12 m2 s−1 for a ω a c c , C l = 5.36 ± 0.3%; D e , B r = 2.58 10−12 m2 s−1 for a ω a c c , B r = 5.8 ± 0.5%; D e , I = 4.03 10−12 m2 s−1 for a ω a c c , I = 4.9 ± 0.5%) are consistent with those obtained previously at the LRST. While awaiting the results of the through-scattering studies still in progress, it was decided to consider the anisotropy values acquired during previous studies on the site. For the thermal parameters, the combination of past values and those acquired in the course of this study lead us to propose effective thermal conductivity values parallel to stratification of 2.2 W m−1 K−1. However, the anisotropy of this parameter could not be determined with precision and will have to be determined by calibration. These results enabled us to carry out sizing calculations, which led us to propose a test section volume of around 400 litres. They also enabled us to define the concentration of the test solution at around 1000 times that in the pore water, i.e., 500 mmol L−1 for chlorides, and 50 mmol L−1 for bromides and iodides, and a deuterium content of +560‰ vs. V-SMOW.
This paper further describes the various phases involved in setting up the DIGIT experiment. The choice was made to select a test zone between 2.5 and 3 m deep with a diameter of 1 m, and this outside the EDZ assumed to be limited to 1 m from the surface. The test zone was equipped with several temperature sensors, a conductivity probe and an optical fiber to monitor the homogeneity of the temperature distribution. Predictive calculations were used to select the location of several boreholes, in particular to monitor temperature. All the temperature and pressure sensors installed were connected remotely via IRSN’s data management system.
The well was then filled with water for a period of 6 months. At the end of phase 1, core sampling was carried out in the emptied well. The sampling campaign carried out in March 2023 collected several cores parallel and perpendicular to the stratification. The cores were used to create radial, out and through diffusion cells, which enabled us to obtain results in both directions and compare them with the data acquired in the initial condition.
A model coupling heat and mass transfers was developed using Comsol Multiphysics® based on the data acquired during this study combined with data from the literature. The simulation of the mass transfer of anionic tracers was then compared with the tracer measurements carried out in the pore water.
The results obtained for the anionic tracers are compared with those simulated using the parameters characterizing the initial state. Tracer penetration at the end of phase 1 exchange is approximately 2 cm greater than that simulated in the initial state. Calibration of the diffusive transport parameters to the data measured at the end of phase 1 suggests an increase in the diffusive transport parameters. This increase can be explained by an increase in the porosity accessible to tracers, which in turn can be explained by the fact that the exchange zone is installed in the area damaged by the excavation. For the next phase, this increase in diffusive transport parameters should be taken into account in future simulations.
The heating system was initiated just after phase 1, and a temperature of 70 °C was imposed in the test zone. Two sampling campaigns are planned during this phase at this temperature, to compare tracer penetration and assess the real impact of temperature on tracer transfer and to characterize the anisotropy of effective thermal conductivity.

Supplementary Materials

The following supporting information can be downloaded at: https://www.mdpi.com/article/10.3390/min14060563/s1, Figure S1: Example of chromatogram obtained for filtered samples grey line) and compared to standard solutions (doted black line) whose the concentrations of bromine and iodine species were 20 and 1 µg L−1, respectively. Note that nonorganic Br and I species were found during speciation controls; Table S1: ICP-MS operating conditions; Section S1: Experimental section.

Author Contributions

Conceptualization, J.-M.M. and G.P.; methodology, M.H.D.; software, P.S. and M.M.; validation, J.-M.M., M.M. and J.G.; formal analysis, M.H.D. and J.G.; writing—original draft preparation, M.H.D.; writing—review and editing, M.H.D., J.-M.M., M.M., J.G., P.S. and G.P.; visualization, M.M.; supervision, J.-M.M. and M.M.; funding acquisition, J.-M.M. All authors have read and agreed to the published version of the manuscript.

Funding

This research received no external funding.

Data Availability Statement

Data are contained within the article and Supplementary Materials.

Acknowledgments

This work is being carried out under the Globe implementation agreement co-financed by IRSN and FANC and relating to research activities on the clay geological barrier of a geological repository for radioactive waste. This agreement is part of the Tenor consortium’s umbrella agreement on studies relating to research activities carried out at the Tournemire Underground Research Laboratory. Halogen analyses were performed with the mass spectrometry facilities of IRSN mass spectrometry platform PATERSON (Fontenay-aux-Roses, France; this is PATERSON contribution n°26). The authors thank the Geosciences Paris-Saclay Laboratory (GEOPS) for the isotopic measurements.

Conflicts of Interest

The authors declare no conflict of interest.

References

  1. Andra. Argile. Synthesis-Evaluation of the Feasibility of a Geological Repository in an Argillaceous Formation. 2005. Available online: https://www.andra.fr/cigeo/les-documents-de-reference (accessed on 27 March 2024).
  2. Andra. Authorization File for the Creation of the Cigéo Basic Nuclear Facility (INB). December 2022. Available online: https://www.andra.fr/sites/default/files/2023-04/Pi%C3%A8ce%2007-VPRS-PARTIE%203%20D%C3%A9monstration%20s%C3%BBret%C3%A9-Volume%2008-D%C3%A9monstration%20de%20s%C3%BBret%C3%A9%20apr%C3%A8s-fermeture.pdf (accessed on 27 March 2024).
  3. Sellin, P.; Leupin, O. The Use of Clay as an Engineered Barrier in Radioactive-Waste Management—A Review. Clays Clay Miner. 2014, 61, 477–498. [Google Scholar] [CrossRef]
  4. Swedish Radiation Safety Authority (SRSA). 2021:15 National Plan: Responsible and Safe Management of Spent Fuel and Radioactive Waste in Sweden. Strålsäkerhetsmyndigheten. Available online: https://www.stralsakerhetsmyndigheten.se/publikationer/rapporter/avfall--transport--fysiskt-skydd/2021/202115/ (accessed on 27 March 2024).
  5. Nagra. Technical Report NTB 21-01. Nagra. 14 December 2021. Available online: https://nagra.ch/downloads/technischer-bericht-ntb-21-01/ (accessed on 27 March 2024).
  6. Nuclear waste Management Organization (NWMO). Canada’s Deep Geological Repository. Available online: https://www.nwmo.ca/en/canadas-plan/canadas-deep-geological-repository (accessed on 27 March 2024).
  7. Zou, L.; Cvetkovic, V. Disposal of high-level radioactive waste in crystalline rock: On coupled processes and site development. Rock Mech. Bull. 2023, 2, 100061. [Google Scholar] [CrossRef]
  8. Vinsot, A.; Lundy, M.; Linard, Y. O2 Consumption and CO2 Production at Callovian-oxfordian Rock Surfaces. Procedia Earth Planet. Sci. 2017, 17, 562–565. [Google Scholar] [CrossRef]
  9. Guo, R.; Thatcher, K.E.; Seyedi, D.M.; Plúa, C. Calibration of the thermo-hydro-mechanical parameters of the Callovo-Oxfordian claystone and the modelling of the ALC experiment. Int. J. Rock Mech. Min. Sci. 2020, 132, 104351. [Google Scholar] [CrossRef]
  10. Gens, A.; Vaunat, J.; Garitte, B.; Wileveau, Y. In situ behaviour of a stiff layered clay subject to thermal loading: Observations and interpretation. Géotechnique 2007, 57, 207–228. [Google Scholar] [CrossRef]
  11. Bensenouci, F.; Michelot, J.L.; Matray, J.M.; Savoye, S.; Massault, M.; Vinsot, A. Coupled study of water-stable isotopes and anions in porewater for characterizing aqueous transport through the Mesozoic sedimentary series in the eastern Paris Basin. Mar. Pet. Geol. 2014, 53, 88–101. [Google Scholar] [CrossRef]
  12. Rebeix, R.; La Salle, C.L.G.; Jean-Baptiste, P.; Lavastre, V.; Fourré, E.; Bensenouci, F.; Matray, J.M.; Landrein, P.; Shouakar-Stash, O.; Frape, S.K.; et al. Chlorine transport processes through a 2000 m aquifer/aquitard system. Mar. Pet. Geol. 2014, 53, 102–116. [Google Scholar] [CrossRef]
  13. Trémosa, J. Influence of Osmotic Processes on the Excess-Hydraulic Head Measured in the Toarcian/Domerian Argillaceous Formation of Tournemire. Ph.D. Thesis, Universite de Paris VI, Paris, France, 2010. Available online: https://theses.fr/2010PA066670 (accessed on 9 April 2024).
  14. Gonçalvès, J.; Matray, J.M.; Yu, C.J. Assessing relevant transport processes in Opalinus Clay at the Mont Terri rock laboratory using excess-pressure, concentration and temperature profiles. Appl. Clay Sci. 2023, 242, 107016. [Google Scholar] [CrossRef]
  15. Yu, C.J. Comparative Study of Convective and Diffusive Transport Phenomena within the Opalinus Clay of Mont Terri. Ph.D. Thesis, Aix-Marseille, Marseille, France, 2017. Available online: http://www.theses.fr/2017AIXM0409/document (accessed on 9 April 2024).
  16. Bensenouci, F. Apport Des Traceurs Naturels à La Compréhension Des Transferts Au Sein Des Formations Argileuses Compactées. Ph.D. Thesis, Université Paris-Sud 11, Bures-sur-Yvette, France, 2010. Available online: https://theses.fr/2010PA112156 (accessed on 9 April 2024).
  17. Leupin, O.X.; Van Loon, L.R.; Gimmi, T.; Wersin, P.; Soler, J.M. Exploring diffusion and sorption processes at the Mont Terri rock laboratory (Switzerland): Lessons learned from 20 years of field research. Swiss J. Geosci. 2017, 110, 391–403. [Google Scholar] [CrossRef]
  18. Van Loon, L.R.; Soler, J.M.; Müller, W.; Bradbury, M.H. Anisotropic Diffusion in Layered Argillaceous Rocks:  A Case Study with Opalinus Clay. Environ. Sci. Technol. 2004, 38, 5721–5728. [Google Scholar] [CrossRef]
  19. Motellier, S.; Devol-Brown, I.; Savoye, S.; Thoby, D.; Alberto, J.C. Evaluation of tritiated water diffusion through the Toarcian clayey formation of the Tournemire experimental site (France). J. Contam. Hydrol. 2007, 94, 99–108. [Google Scholar] [CrossRef] [PubMed]
  20. Davarzani, H.; Marcoux, M.; Costeseque, P.; Quintard, M. Experimental measurement of the effective diffusion and thermodiffusion coefficients for binary gas mixture in porous media. Chem. Eng. Sci. 2010, 65, 5092–5104. [Google Scholar] [CrossRef]
  21. Furry, W.H.; Jones, R.C.; Onsager, L. On the Theory of Isotope Separation by Thermal Diffusion. Phys. Rev. 1939, 55, 1083–1095. [Google Scholar] [CrossRef]
  22. Rosanne, R.; Paszkuta, M.; Tevissen, E.; Adler, P.M. Thermodiffusion in compact clays. J. Colloid Interface Sci. 2003, 267, 194–203. [Google Scholar] [CrossRef] [PubMed]
  23. Tremosa, J.; Arcos, D.; Matray, J.M.; Bensenouci, F.; Gaucher, E.C.; Tournassat, C.; Hadi, J. Geochemical characterization and modelling of the Toarcian/Domerian porewater at the Tournemire underground research laboratory. Appl. Geochem. 2012, 27, 1417–1431. [Google Scholar] [CrossRef]
  24. Matray, J.M.; Savoye, S.; Cabrera, J. Desaturation and structure relationships around drifts excavated in the well-compacted Tournemire’s argillite (Aveyron, France). Eng. Geol. 2007, 90, 1–16. [Google Scholar] [CrossRef]
  25. Massmann, J. Modeling of Excavation Induced Coupled Hydraulic-Mechanical Processes in Claystone. 2009. Available online: https://www.osti.gov/etdeweb/biblio/21269578 (accessed on 9 April 2024).
  26. Cornet, F.H. 15—The HTPF and the Integrated Stress Determination Methods. In Rock Testing and Site Characterization; Hudson, J.A., Ed.; Pergamon Press Ltd.: Oxford, UK, 1993; pp. 413–432. [Google Scholar] [CrossRef]
  27. Savoye, S.; Michelot J luc Wittebroodt, C.; Altinier, M.V. Contribution of the diffusive exchange method to the characterization of pore-water in consolidated argillaceous rocks. J. Contam. Hydrol. 2006, 86, 87–104. [Google Scholar] [CrossRef] [PubMed]
  28. Bonin, B. Deep geological disposal in argillaceous formations: Studies at the Tournemire test site. J. Contam. Hydrol. 1998, 35, 315–330. [Google Scholar] [CrossRef]
  29. Okay, G.O.N.C.A.; Cosenza, P.; Ghorbani, A.; Camerlynck, C.; Cabrera, J.; Florsch, N.; Revil, A. Localization and characterization of cracks in clay-rocks using frequency and time-domain induced polarization. Geophys. Prospect. 2013, 61, 134–152. [Google Scholar] [CrossRef]
  30. Pearson, F.J. What is the porosity of a mudrock? Geol. Soc. Lond. Spec. Publ. 1999, 158, 9–21. [Google Scholar] [CrossRef]
  31. Pearson, F.J.; Arcos, D.; Bath, A.; Boisson, J.Y.; Fernandez, A.M.; Gäbler, H.E.; Gaucher, E.; Gautschi, A.; Griffault, L.; Hernán, P.; et al. Mont Terri Project—Geochemistry of Water in the Opalinus Clay Formation at the Mont Terri Rock Laboratory. Bundesamt für Wasser und Geologie. Bern. 2003. Available online: https://www.admin.ch/gov/de/start/dokumentation/medienmitteilungen.msg-id-1375.html (accessed on 27 March 2024).
  32. Zhang, J. Oxygen Isotope Fractionation between Carbonate Minerals and Carbonic Acid Systems and Constraints for Environmental Science and Geological Processes. Molecules 2024, 29, 698. [Google Scholar] [CrossRef] [PubMed]
  33. Van Loon, L.R.; Soler, J.M.; Jakob, A.; Bradbury, M.H. Effect of confining pressure on the diffusion of HTO, 36Cl and 125I in a layered argillaceous rock (Opalinus Clay): Diffusion perpendicular to the fabric. Appl. Geochem. 2003, 18, 1653–1662. [Google Scholar] [CrossRef]
  34. Van Loon, L.R.; Glaus, M.A.; Müller, W. Anion exclusion effects in compacted bentonites: Towards a better understanding of anion diffusion. Appl. Geochem. 2007, 22, 2536–2552. [Google Scholar] [CrossRef]
  35. Wigger, C.; Van Loon, L.R. Importance of Interlayer Equivalent Pores for Anion Diffusion in Clay-Rich Sedimentary Rocks. Environ. Sci. Technol. 2017, 51, 1998–2006. [Google Scholar] [CrossRef] [PubMed]
  36. Savoye, S.; Michelot, J.L.; Wittebroodt, C. Evaluation of the reversibility of iodide uptake by argillaceous rocks by the radial diffusion method. Radiochim. Acta 2006, 94, 699–704. [Google Scholar] [CrossRef]
  37. van der Kamp, G.; Van Stempvoort, D.R.; Wassenaar, L.I. The Radial Diffusion Method: 1. Using intact cores to determine isotopic composition, chemistry, and effective porosities for groundwater in aquitards. Water Resour. Res. 1996, 32, 1815–1822. [Google Scholar] [CrossRef]
  38. De Hoog, F.R.; Knight, J.H.; Stokes, A.N. An Improved Method for Numerical Inversion of Laplace Transforms. SIAM J. Sci. Stat. Comput. 1982, 3, 357–366. [Google Scholar] [CrossRef]
  39. Patriarche, D.; Michelot, J.L.; Ledoux, E.; Savoye, S. Diffusion as the main process for mass transport in very low water content argillites: 1. Chloride as a natural tracer for mass transport—Diffusion coefficient and concentration measurements in interstitial water. Water Resour. Res. 2004, 40, W01516. [Google Scholar] [CrossRef]
  40. Bachir-Bey, N.; Matray, J.M. Origin of Halides (Cl and Br) and of Their Stable Isotopes (d37Cl and d81Br) at the Tournemire URL (France)—Experimental and Numerical Approach. Published online 1 May 2014. p. 2245. Available online: https://ui.adsabs.harvard.edu/abs/2014EGUGA..16.2245B/abstract (accessed on 27 March 2024).
  41. Wittebroodt, C. Transfert de l’iode dans l’argilite de Tournemire. 2009. Available online: https://www.irsn.fr/sites/default/files/documents/larecherche/formation_recherche/theses/theses-soutenues/dei/2009-these-wittebroodt.pdf (accessed on 27 March 2024).
  42. Savoye, S.; Frasca, B.; Grenut, B.; Fayette, A. How mobile is iodide in the Callovo–Oxfordian claystones under experimental conditions close to the in situ ones? J. Contam. Hydrol. 2012, 142–143, 82–92. [Google Scholar] [CrossRef] [PubMed]
  43. Altinier, M.V. Etude de La Composition Isotopique Des Eaux Porales de l’argilite de Tournemire: Inter-Comparaison Des Méthodes de Mesure et Relations Avec Les Paramètres Pétrophysiques. Université Paris-Sud 11, Bures-sur-Yvette, France. 2006. Available online: https://theses.fr/2006PA112065 (accessed on 27 March 2024).
  44. LGR-ICOS Enhanced Performance Benchtop Analyzers GLA431 Series. Measurement Products. Available online: https://new.abb.com/products/measurement-products/analytical/laser-gas-analyzers/laser-analyzers/lgr-icos-enhanced-performance-benchtop-analyzers/lgr-icos-enhanced-performance-benchtop-analyzers-gla431-series (accessed on 27 March 2024).
  45. Gorny, J.; Jardin, C.; Diez, O.; Galceran, J.; Gourgiotis, A.; Happel, S.; Coppin, F.; Février, L.; Simonucci, C.; Cazala, C. Dissolved iodide in marine waters determined with Diffusive Gradients in Thin-films technique. Anal. Chim. Acta 2021, 1177, 338790. [Google Scholar] [CrossRef]
  46. Kerstel, E.T.; Gagliardi, G.; Gianfrani, L.; Meijer, H.A.J.; Van Trigt, R.; Ramaker, R. Simultaneous Determination of the 2H/1H, 17O/16O, and 18O/16O Isotope Abundance Ratios in Water by Means of Laser Spectrometry. Anal. Chem. 1999, 71, 5297–5303. [Google Scholar] [CrossRef] [PubMed]
  47. Gianfrani, L.; Gagliardi, G.; Van Burgel, M.; Kerstel, E.T. Isotope analysis of water by means of near-infrared dual-wavelength diode laser spectroscopy. Opt. Express. OE 2003, 11, 1566–1576. [Google Scholar] [CrossRef] [PubMed]
  48. Aminot, A.; Kerouel, R. Hydrologie des écosystèmes marins. In Paramètres et analyses. Ifremer MA0401; Ifremer: Plouzané, France, 2004. [Google Scholar]
  49. Mügler, C.; Filippi, M.; Montarnal, P.; Martinez, J.M.; Wileveau, Y. Determination of the thermal conductivity of opalinus clay via simulations of experiments performed at the Mont Terri underground laboratory. J. Appl. Geophys. 2006, 58, 112–129. [Google Scholar] [CrossRef]
  50. Fuchs, S.; Norden, B.; Peksa, R. GFZ Thermal Petrophysics Lab—Data Report 2024-01: Thermal Properties of the Shaly Jurassic (Upper Toarcian) Formation at the Tournemire Underground Research Lab (Tournemire, France). GFZ Data Services. 2024. Available online: https://dataservices.gfz-potsdam.de/portal/ (accessed on 27 March 2024).
  51. van Brakel, J.; Heertjes, P.M. Analysis of diffusion in macroporous media in terms of a porosity, a tortuosity and a constrictivity factor. Int. J. Heat Mass Transf. 1974, 17, 1093–1103. [Google Scholar] [CrossRef]
  52. Dullien, F.A.L. Porous Media: Fluid Transport and Pore Structure; Academic Press: Cambridge, MA, USA, 2012. [Google Scholar]
  53. Appelo, C.A.J.; Van Loon, L.R.; Wersin, P. Multicomponent diffusion of a suite of tracers (HTO, Cl, Br, I, Na, Sr, Cs) in a single sample of Opalinus Clay. Geochim. Cosmochim. Acta 2010, 74, 1201–1219. [Google Scholar] [CrossRef]
  54. Savoye, S.; Goutelard, F.; Beaucaire, C.; Charles, Y.; Fayette, A.; Herbette, M.; Larabi, Y.; Coelho, D. Effect of temperature on the containment properties of argillaceous rocks: The case study of Callovo–Oxfordian claystones. J. Contam. Hydrol. 2011, 125, 102–112. [Google Scholar] [CrossRef] [PubMed]
  55. Van Loon, L.R.; Müller, W.; Iijima, K. Activation energies of the self-diffusion of HTO, 22Na+ and 36Cl in a highly compacted argillaceous rock (Opalinus Clay). Appl. Geochem. 2005, 20, 961–972. [Google Scholar] [CrossRef]
  56. Bailly, D.; Matray, J.M.; Ababou, R. Temporal behavior of a ventilated claystone at the Tournemire URL: Cross-spectral analyses focused on daily harmonics. Eng. Geol. 2014, 183, 137–158. [Google Scholar] [CrossRef]
  57. Boudreau, B. Diagenetic Models and Their Implementation: Modelling Transport and Reactions in Aquatic Sediments. 2 January 2013. Available online: https://www.researchgate.net/profile/Bernard-Boudreau/publication/235335761_Diagenetic_models_and_their_implementation_modelling_transport_and_reactions_in_aquatic_sediments/links/0fcfd510fd916cfdde000000/Diagenetic-models-and-their-implementation-modelling-transport-and-reactions-in-aquatic-sediments.pdf (accessed on 27 March 2024).
Figure 1. Location and geological cross section showing the investigation area within the Tournemire Underground Research Laboratory.
Minerals 14 00563 g001
Figure 2. Location of the DIGIT experiment in the South Gallery 2008 of the Tournemire research laboratory.
Minerals 14 00563 g002
Figure 3. Plan view of the boreholes and main shaft of the DIGIT experiment.
Minerals 14 00563 g003
Figure 4. Drilling phases of the DIGIT shaft (left) and state of the shaft at the end of drilling (right).
Minerals 14 00563 g004
Figure 5. Sketch summarizing the preparation of solid samples for diffusion experiments and analytical treatment of liquid samples taken from each diffusion cell.
Minerals 14 00563 g005
Figure 6. Conceptual model of the DIGIT scoping calculations imposing a symmetry in the center axis of the test section. Shown is a zoom to the test section which ignores the outer boundaries in 30 m radially and 20 m axially distance. Further, the initial and boundary conditions are given for the heat and solute transport. The dots shown in the model domain refer to the temperature sensors localized with respect to vertical (Z) direction from the surface and radial (R) distance from the axial symmetry.
Minerals 14 00563 g006
Figure 7. Predictive calculation of temperature evolution for a test zone 50 cm high and a test zone wall temperature of 70 °C.
Minerals 14 00563 g007
Figure 8. Penetration of the tracers Cl, Br, I and 2H parallel to stratification (a) and perpendicular to stratification (b) with the effect of temperature on their effective diffusion coefficients DeT (1 with effect, 0 without effect) and on the Soret effect (1 considered, 0 not considered) after 1 month.
Minerals 14 00563 g008
Figure 9. Cross section of the DIGIT experiment with boreholes position.
Minerals 14 00563 g009
Figure 10. 3D view of the test section located at the bottom of the DIGIT shaft and fitted with 16 PTFE strips. It is equipped with 4 temperature sensors (2 PT1000 and 2 PT100), a spiral optical fiber and a conductivity probe.
Minerals 14 00563 g010
Figure 11. The various stages of the sampling carried out at the end of phase 1 with (a) emptying of the well, (b) temporary storage of the test water in a buffer tank, (c) drill coring using a Hilti machine, (d) a cored sample, (e) cut and packaged samples, (f) drill holes filled with bentonite cement and PTFE plugs and (g) appearance of shrinkage cracks a few days after the well emptying.
Minerals 14 00563 g011
Figure 12. Evolution of the anion concentration as a function of depth obtained by predictive calculations calibrated to the anion concentrations obtained in phase 1 by out diffusion cells. The red curves are obtained from the transport parameters in phase 0 and the blue curves in phase 1. (a) Evolution of the chloride concentration as a function of depth. (b) Evolution of the bromide concentration as a function of depth. (c) Evolution of the iodide concentration as a function of depth.
Minerals 14 00563 g012
Table 1. Properties acquired for the Upper Toarcian at the Tournemire URL and at the tunnel reference level located at the intersection of gallery 1996 and the tunnel. Parallel (P) and Normal (N) to the bedding.
Upper Toarcian (Reference Level)
ParameterRange
Mineralogy [23]
Clay fraction (illite, I/S R1, chlorite, kaolinite) [wt %]44–87
Mica, Illite7–22
Chlorite [wt %]1–7
Kaolinite [wt %]8–15
Illite/Smectite mixed layers–R1 type [wt %]28–43
Quartz + Opal [wt %]17–22
Calcite + Dolomite/Ankerite [wt %]11–19
Pyrite, Siderite, Fe Oxy-hydroxides [wt %]2–4
Total Organic Carbon [wt %]0.9
Petrophysical properties [24]
Total (Physical) & water loss porosity [vol %]9–10
Water content [wt %]3–4
Density (humid) [g/cm3]2.50–2.60
Grain density [g/cm3]2.70–2.71
Specific surface area (N2 BET + BJH) [m2/g]22–26
Mechanical properties [13,25,26]
Elastic module E-module (P) [GPa]20–28
Elastic module E-module (N) [GPa]5–13
Uniaxial compressive strength (P) [MPa]57
Uniaxial compressive strength (N) [MPa]20
Free swelling (P) [%]<1
Free swelling (N) [%]2%
Stess field σh [MPa]1.1–3.1
Stress field σv [MPa]3.4–4.2
Stress field σH [Mpa]2–6
Intrinsic permeability (k) [m2]10−21–10−22
Elastic module E-module (P) [GPa]20–28
Elastic module E-module (N) [GPa]5–13
Uniaxial compressive strength (P) [MPa]57
Uniaxial compressive strength (N) [MPa]20
Free swelling (P) [%]<1
Free swelling (N) [%]2
Geochemical properties [23]
Total Exchange Capacity (CsCl) [meq/100 g rock]8.6–9.0
Exchangeable cations [meq/100 g rock] Na+: 1.7; K+: 1.2; Ca2+: 3.8; Mg2+: 1.9; CEC: 8.6
Porewater composition [mmol L−1]Alkalinity: 4.43; SO42−: 9.5; Cl: 4.5; Ca2+: 1.5; Mg2+: 0.75; Na+: 22.6; K+: 0.77
Porewater composition—other propertiespH: 7.74; I: 0.035; pCO2: 10−2.6 atm; TDS: 2 g/L
Water and mass transport properties [19,24,27]
Pore pressure [MPa]0.6
Hydraulic conductivity (K) [m/s]10−14–10−15
Specific storativity (Ss) [1/m]5 × 10−7–10−6
Anions accessible porosity [vol. %]2.8–4.7
Cl and Br effective diffusion coefficient (DeCl,Br) (P) [m2/s]1.2 × 10−12–2 × 10⁻¹²
I effective diffusion coefficient (DeI) (P) [m2/s]7 × 10−13–15 × 10−12
Water tracer effective diffusion coefficient (DeW) (P) [m2/s]1.7 × 10−11–3 × 10⁻¹¹
Anion exclusion (DeCl,Br/DeW)0.12–0.15
Thermal properties [28]
Thermal conductivity (N) [W/(mK)]1.6–1.8
Heat capacity [J/(m3K)]1.8–1.9 × 106
Table 2. Information on cored boreholes of the DIGIT experiment and of their equipment.
IDDistance from the Well WallDrilling DateDepth/Ground LevelDrilling MethodBorehole out DiameterCore DiameterEquipment (Supplier)
cm m mmmm
DGT-EX1024 February 20223air-cored10196None
DGT-REF25024 February 20223.510196PT100 (Socotec) + Conductivity probe (WTW)
DGT-TD1103 May 20224635PT100 at 3 m and at 3.5 m + Sensolux optic fiber
DGT-TD2204 May 20224635PT100 at 3 m and at 3.5 m + Sensolux optic fiber
DGT-TD3305 May 20224635PT100 at 3 m and at 3.5 m + Sensolux optic fiber
DGT-PP1509 May 202266 (down to 3.38 m) + 45 (down to 3.5 m)60 + 35Absolute pressure probe (2 MPa max, Sisgeo) + PT1000 (Sisgeo) at 3.5 m
DGT-PP210010 May 202266 (down to 3.38 m) + 45 (down to 3.5 m)61 + 35Absolute pressure probe (2 MPa max, Sisgeo) + PT1000 (Sisgeo) at 3.5 m
DGT-PP315011 May 202266 (down to 3.38 m) + 45 (down to 3.5 m)62 + 35Absolute pressure probe (2 MPa max, Sisgeo) + PT1000 (Sisgeo) at 3.5 m
DGT-INS1007 July 20223+ 101962 PT1000 (Sisgeo) + 2 PT100 (Socotec) + 1 Tetracon probe (WTW) + 1 Sensolux sensor (Socotec)
Table 3. Petrophysical measurements obtained on a core from borehole DGT-EX1 and at a depth ranging between 290 and 300 cm/top cement of the 2008 South gallery.
Mean Distance from the
Borehole Mouth
Bulk Wet
Density
Dry DensityGrain Density by Helium
Pycnometry
Degree of
Saturation
Gravimetric Water ContentTotal PorosityVolumetric Moisture
Content
+/−rhσrhrdσrdrsσrsSσSWCdry,105 °CσWCdry,105 °Cntotσntotqσq
cmcmg cm−3g cm−3g cm−3g cm−3g cm−3g cm−3% DS% DS% DS% DS% DS% DS% DS% DS
291.50.52.5400.0022.4390.0022.7020.00195.911.223.850.029.710.129.310.16
291.50.52.5410.0022.4410.0022.7060.00394.560.993.810.029.770.089.240.13
292.50.52.5350.0022.4340.0032.7160.00190.381.353.890.0410.400.109.400.17
293.50.52.5330.0022.4290.0022.6970.00195.471.003.940.029.960.099.500.13
294.50.52.5360.0022.4370.0032.7150.00488.651.803.760.0410.240.179.080.24
295.50.52.5360.0022.4330.0022.7040.00197.020.814.040.0110.040.089.740.11
295.50.52.5410.0022.4400.0022.6960.00097.850.963.840.029.490.089.290.12
296.50.52.5460.0022.4500.0022.6960.00498.681.693.720.019.150.159.030.22
296.50.52.5370.0022.4350.0022.7270.00188.190.733.900.0210.700.089.430.10
297.50.52.5370.0022.4350.0022.7010.00195.110.793.860.019.820.079.340.10
298.50.52.5400.0022.4430.0022.6830.00194.291.053.470.028.930.098.420.12
298.50.52.5340.0022.4400.0022.6890.00291.521.023.510.029.270.098.490.13
mean values
295.20.52.5380.0022.4380.0022.7030.00293.971.123.800.029.790.109.190.14
Table 4. Initial pore water Cl, Br, I concentrations obtained by ion chromatography and ICP-MS and deduced from out diffusion cells performed on core samples from borehole DGT-EX1. Errors were calculated from the propagation of analytical errors.
Analytical Method: IC
CellDepthCore[Cl]pwσClpw
cmorientationmmol L−1mmol L−1
DS_1294┴ strat3.720.0225
DS_22953.420.0211
DS_32963.920.0245
DS_42983.420.0216
DS_52993.840.0244
mean296 3.660.0228
Analytical Method: ICP-MS
CellDepthCore[Br]pwσBrpw
cmorientationmmol L−1mmol L−1
DS_1294┴ strat0.0290.000183
DS_22950.0310.000188
DS_32960.0260.000161
DS_42980.0290.000185
DS_52990.0290.000177
mean296 0.0290.000179
Analytical Method: ICP-MS
CellDepthCore[I]pwσIpw
cmorientationmmol L−1mmol L−1
DS_1294┴ strat0.001540.0000148
DS_22950.001770.0000165
DS_32960.001680.0000166
DS_42980.001990.0000184
DS_52990.001780.0000166
mean296 0.001750.0000166
Table 5. Initial deuterium 2H contents in pore water measured by T-LWIA-45-EP laser spectrometry and deduced from vapor phase diffusive exchange cells performed on core samples perpendicular to the stratification from borehole DGT-EX1. The results of deuterium and water content are obtained with an uncertainty of ±10%.
CellDepth
cm
δ²Hpw
‰ vs. V-SMOW
Water Content
wt %
PV1245−42.15.20
PV2249−42.54.88
PV3255−42.94.61
PV4260−41.24.59
PV5265−42.24.91
PV6270−42.54.75
PV7274−42.94.73
PV8321−42.95.25
PV9337−43.15.16
PV10338.5−43.35.05
PV11340−42.95.07
PV12341.5−42.54.76
PV13342−41.75.14
Mean295.2−42.54.9
Std. Dev.41.00.5880.229
Table 7. Pore water Cl, Br, I concentrations deduced from out diffusion cells performed on core samples from phase 1. Errors were calculated from the propagation of analytical errors.
Analytical Method: IC
CellDepthCore[Cl]pwσClpw
cmorientationmmol L−1mmol L−1
E1301┴ strat435.482.53
E2302216.211.25
E3303114.160.65
E430450.340.28
E530526.710.15
E63066.240.04
E73074.180.02
E93094.370.03
mean303 168.581.1458
Cell DepthCore[Br]pwσBrpw
cmorientationmmol L−1mmol L−1
E1301┴ strat41.5140.238
E230219.8150.114
E330310.2060.059
E43043.596
E53050.9780.006
E63060.1100.001
E73070.0230.0001
E93090.0450.0003
mean303 15.220.1042
Cell DepthCore[I]pwσIpw
cmorientationmmol L−1mmol L−1
E1301┴ strat40.950.239
E230218.650.108
E33037.720.044
E43041.500.02
E53050.210.001
E63060.10340.000030
E73070.00120.000012
E93090.00410.000030
mean303 13.810.0981
Table 8. Effective diffusion coefficient and accessible porosity for anions in phase 0 and 1.
TitlePhase 0Phase 1
DeωaccDeωacc
(m2·s−1) × 10−12%(m2 s−1) × 10−12%
Cl2.505.51.0523
Br2.585.89.7621
I4.034.96.4317
2H24.811.5currently being acquired
Disclaimer/Publisher’s Note: The statements, opinions and data contained in all publications are solely those of the individual author(s) and contributor(s) and not of MDPI and/or the editor(s). MDPI and/or the editor(s) disclaim responsibility for any injury to people or property resulting from any ideas, methods, instructions or products referred to in the content.