Article

Assessing the Performance of CO2-Mineralized Underground Backfilling Materials through the Variation Characteristics of Infrared Radiation Temperature Index

1
School of Mines, China University of Mining and Technology, Xuzhou 221116, China
2
Key Laboratory of Xinjiang Coal Resources Green Mining, Xinjiang Institute of Engineering, Ministry of Education, Urumqi 830023, China
3
Xinjiang Key Laboratory of Coal-Bearing Resources Exploration and Exploitation, Xinjiang Institute of Engineering, Urumqi 830023, China
4
Xinjiang Engineering Research Center of Green Intelligent Coal Mining, Xinjiang Institute of Engineering, Urumqi 830023, China
*
Author to whom correspondence should be addressed.
Minerals 2024, 14(6), 566; https://doi.org/10.3390/min14060566
Submission received: 23 April 2024 / Revised: 26 May 2024 / Accepted: 27 May 2024 / Published: 29 May 2024
(This article belongs to the Section Mineral Processing and Extractive Metallurgy)

Abstract

:
The utilization of CO2 mineralization fly ash (F) and coal gangue (G) technology is proposed in this research work to prepare underground backfilling materials. The test process can be divided into pre-treatment and post-treatment stages. In the pre-treatment stage, a sealed stirring vessel is used to conduct CO2 wet mineralization. The ratios of F and G were selected as follows: 20%:60% (F2G6), 30%:50% (F3G5), 40%:40% (F4G4), 50%:30% (F5G3), and 60%:20% (F6G2). The ratios were prepared into Φ50 mm × 100 mm cylindrical samples, with curing durations of 3 d, 7 d, 14 d, and 28 d. In the post-processing stage, the SANS microcomputer-controlled electronic universal testing machine and FLIR A615 infrared thermal imager were used to carry out uniaxial loading and temperature detection, respectively. The unconfined compressive strength (UCS), X-ray diffraction (XRD), average infrared radiation temperature (AIRT), variance of original infrared image temperature (VOIIT), and variance of successive minus infrared image temperature (VSMIT) of the samples were compared and analyzed. The results indicated that when curing reaches 14 d, the strength approaches its peak, with minimal changes in strength over a delayed period; furthermore, as the ratio of F to G continues to increase, the mineralization effect gradually strengthens, reaching its optimum level at a ratio of 5:3. However, when the ratio exceeds 5:3, signs of deteriorating mineralization effect start to appear. During the loading process, the AIRT of the mineralized samples showed a continuous increase, but the VOIIT and VSMIT of the mineralized sample both exhibited significant fluctuations or rapid increases during damage rupture. Moreover, the rise in the AIRT value was found to be linked to the increase in the ratio of F to G. This indicates that F has a higher thermal–mechanical conversion efficiency compared to G, so the temperature change will be greater during the loading process. The drastic changes in the VOIIT and VSMIT indicate that they can be used as sensitive response indicators for sample rupture, and can predict and warn of damage rupture in mineralized samples. Research work can provide practical guidance and reference for underground backfilling of CO2 mineralization industrial waste.

1. Introduction

The development and utilization of coal resources generate significant amounts of coal-based solid waste, such as fly ash (F), coal gangue (G), and waste residue, as well as CO2 emissions. This activity can also lead to issues like land collapse and groundwater loss due to the migration of overlying rocks [1]. To tackle these challenges, this research work opted to utilize CO2-mineralized coal-based solid waste to generate carbonate precipitation and prepare backfilling material. Drawing on the concept of “parallel mining and backfilling” in the branch roadway of the stope, we constructed backfilling spaces using carbonized materials. Simultaneously, infrared radiation technology was employed to monitor and warn of damage and rupture processes in the backfilling body to achieve the goal of building an entire backfilling system of “CO2-mineralized coal-based solid waste material development + ‘parallel mining and backfilling’ space construction + infrared radiation method to monitor the damage and fracture of the backfilling body”.
Seifritz et al. first introduced the concept of CO2 mineralization and storage in a publication in Nature in 1990 [2]. Mazzella et al. investigated the use of F with a calcium content of 31.95% for CO2 storage at a temperature of 45 °C and a pressure of 1.5 MPa. The results showed that each ton of F can store up to 180 kg of CO2 [3]. Baciocchi et al. validated the feasibility of a gas–solid dry carbonation process using F with a calcium content of 35% under the conditions of a temperature of 400 °C and a CO2 pressure of 0.1 MPa [4]. Mayoral et al. studied the process of improving the carbonation efficiency of F by adding NaCl under conditions of temperature 30–80 °C and pressure of 0.1 MPa. The findings demonstrated a significant increase in the CO2 storage capacity of F when NaCl was introduced [5]. Zhang et al. and Ren et al. compared the CO2 storage performance of different industrial solid wastes in various scenarios [6,7]. Chang et al., utilizing steel slag as the raw material, performed a 12 h mineralization test in a high-pressure reactor operating at 160 °C and a CO2 pressure of 4.8 MPa. The outcome of the test was a notable 68% calcium conversion rate [8]. The practical implementation of mine backfilling engineering presents various challenges that encompass meeting the demands for high temperature and high pressure capabilities, and high calcium content. Therefore, Ma et al. explored CO2 mineralization low-calcium fly ash technology under conventional conditions and found that alkaline activators can effectively improve carbon sequestration efficiency and compressive strength, and promote the resource utilization of formed CO2 [9].
At the same time, many scholars are also exploring the use of coal-based solid waste or construction waste to prepare controllable low-strength materials (CLSMs), so as to reduce the supply pressure of current aggregates and prevent waste from polluting the ecological environment. For example, Devaraj et al. used F, cement, M-sand, and M-sand slurry to prepare a controllable low-strength material (CLSM), and the results showed that the mixed material has sufficient eco-friendliness and strength characteristics [10,11]. Do et al. studied a cementless binder, which is made of F, lime, and gypsum. The results showed that all the prepared CLSMs met the requirements of ACI 229R in terms of engineering performance, environmental impact, and thermal conductivity, and the CLSM made of cementless binder was more suitable for grout for borehole heat exchangers [12]. Devaraj et al. presented a detailed summary of the research achievements of CLSMs in recent years and finally concluded that the conversion of various wastes such as industrial or mining waste into usable mixed cementing materials has great application prospects [13]. In 2022, Chen et al. explored the production of CLSMs by utilizing five different by-products of the coal industry and changing the content of bottom ash (BA) and milling time. The results show that increasing BA content and grinding time can enhance the strength of CLSMs and reduce the setting time [14]. In 2024, Chen et al. used orthogonal experiments to optimize the ratios of multi-component coal-based solid waste materials (F, bottom ash, desulfuration gypsum, cement, gasification coarse slag, and G) to prepare CLSMs and ultimately obtained a CLSM of 7.79 MPa after 28 days [15]. Liu et al. used in situ thermal upgrading to adjust the pore system of low-maturity oil shale and carried out digital processing of FE-SEM images through machine learning to obtain fractal dimension (D), form factor (ff), and random entropy (H) to characterize the evolution process of pore structure morphology and azimuthal disorder during thermal upgrading [16]. Das et al. took shale overlying strata of an open-pit coal mine as the base material, F and cement as the gelling materials through laboratory tests, and prepared CLSM materials with excellent properties [17]. On a comprehensive comparison, CO2-mineralized coal-based solid waste-prepared backfilling materials have two advantages over CLSM materials: firstly, the CO2 mineralization process can reduce greenhouse gas carbon dioxide emissions, resulting in less environmental impact; secondly, CO2-mineralized coal-based solid waste prepared backfilling materials can provide better strength and durability.
Additionally, it is worth noting that apart from the performance of backfilling materials, the selection of backfilling methods and real-time monitoring of damage and rupture in the backfilling bodies are also crucial. Traditional filling methods face several challenges, such as a complex process, high filling costs, difficulties in mining and filling coordination, and insufficient constraints on the filling bodies [18,19,20]. For example, backward dry-filling equipment leads to low labor efficiency and a relatively complex process. The water–sand filling method involves a troublesome dehydration process, increases underground drainage, and has limited applications, with industrial testing discontinued in China [18]. Paste filling, despite having higher material costs compared to other filling materials, also presents technical index gaps [19]. The weathering resistance of high-water material filling requires further research before large-scale implementation [20]. Furthermore, there are still challenges to be addressed in dump-filling and wind-filling key technologies [21]. This research proposes the “parallel mining and backfilling” method, where all stope branches in the mining block are divided into multiple stages for mining and filling. The stope branches and filling are then divided at intervals within the stages, overcoming the shortcomings of insufficient filling time and filling space found in traditional goaf filling mining methods.
When materials are backfilled underground, they inevitably face the risk of damage, fracture, and failure due to surrounding rock pressure. This can easily lead to overlying rock migration, surface subsidence, and collapse disasters [22]. Hence, it is imperative to monitor and give warnings about the degradation and fracturing procedures of the backfill body to preclude the emergence of dynamic disasters. As is well known, the damage and failure of coal rock backfilling materials under external forces is essentially a process of energy accumulation and release, which usually releases phenomena such as sound, heat, and electromagnetic radiation [23,24]. Infrared radiation technology can fully capture parameters such as the temperature change in the surface of middling coal rock backfill during loading so that the damage and fracture of coal rock backfill can be predicted, thus providing early warning based on the sudden change in the temperature index [25]. At present, infrared radiation technology has become a potentially effective means for coal rock damage and fracture range, detection of coal rock damage and fatigue strength, and even for early warning and prediction of mine gas outbursts, water inrush, and rock bursts [26,27,28]. The coal mining industry is experiencing a growing adoption of backfilling materials. However, research is scarce on the infrared properties of these materials, and their mechanisms have been analyzed to an even lesser degree. Given this, this research adopts infrared radiation technology to monitor the loading and failure behavior of coal rock backfilling materials, attempting to provide theoretical guidance for the dynamic disaster warning of coal-based solid waste mineralization backfilling materials.
Based on previous research, this study utilizes CO2-mineralized coal-based solid waste to develop filling materials, constructs filling space for carbonized materials using the “parallel mining and backfilling” method in the stope’s branch roadway, employs infrared technology to monitor and warn of the damage and fracture process of mining rock filling body, and establishes a comprehensive underground backfilling system.

2. Materials and Methods
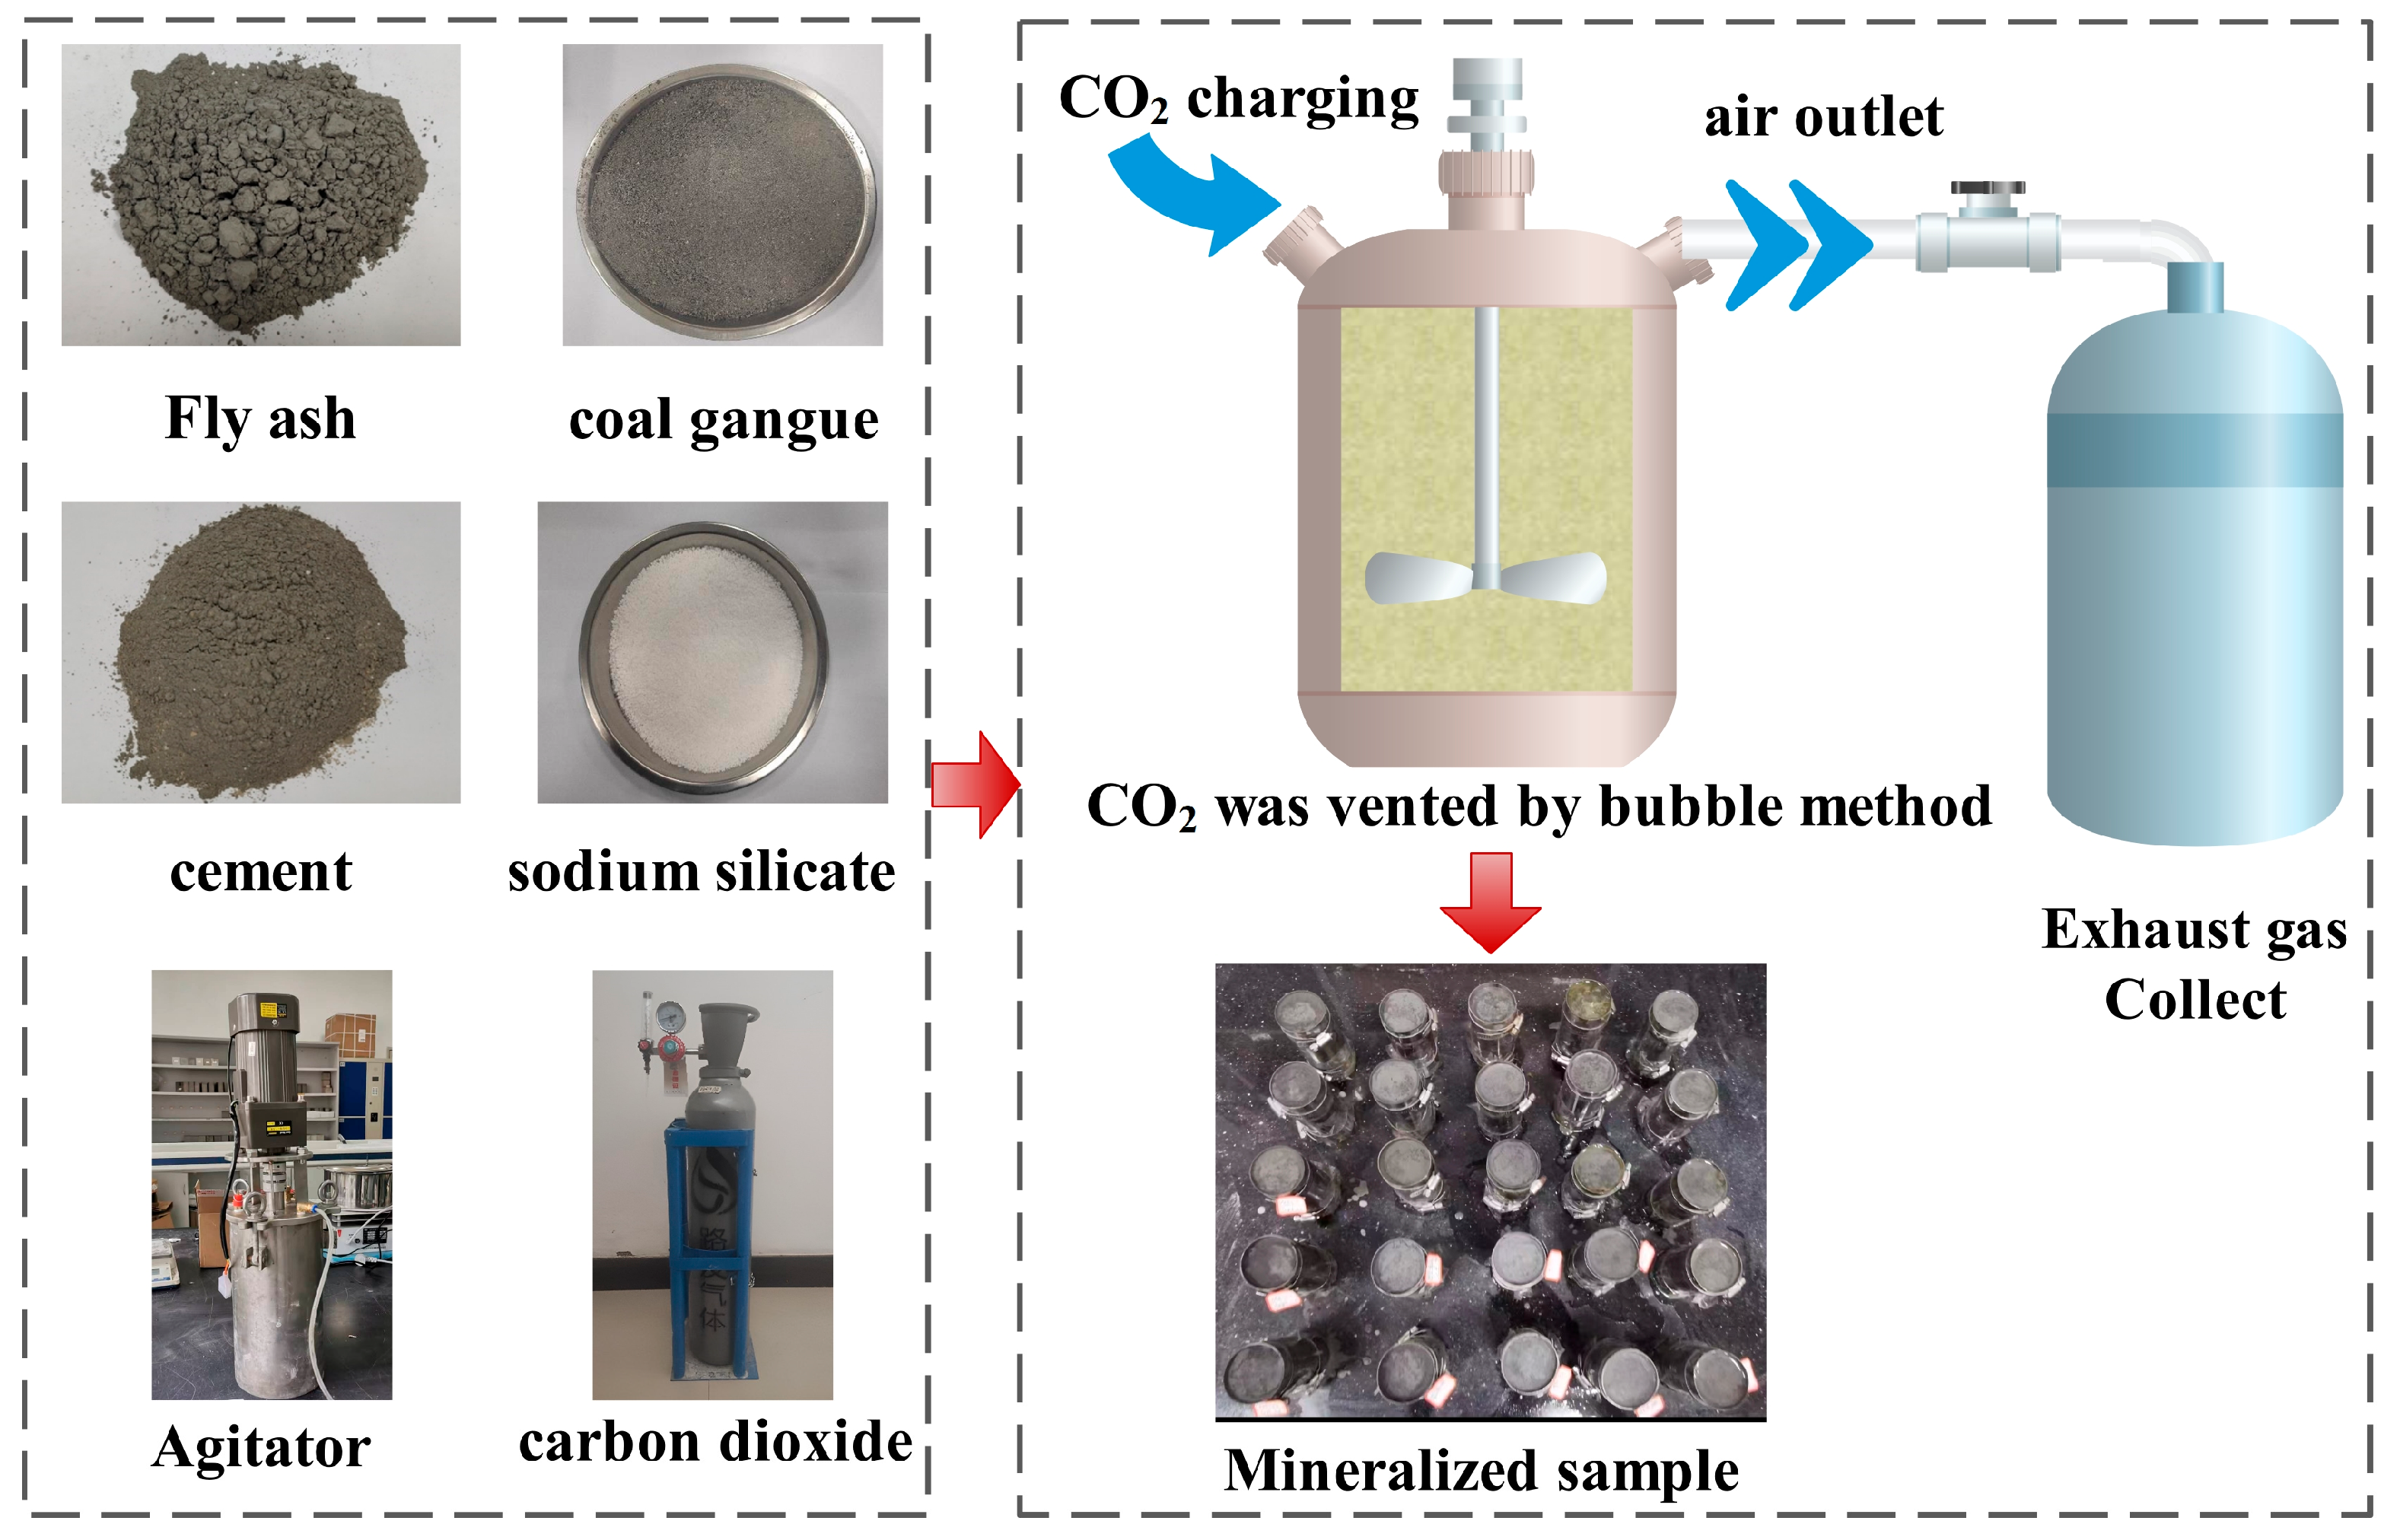
2.1. Sample Making

The primary materials utilized for the production of samples primarily consist of fly ash (F), coal gangue (G), cement, CO2, and sodium silicate. The F and G were carefully chosen from the Chenjiashan Coal Mine located in Shaanxi, China. The cement model used meets the national standard P O. 32.5, while the purity of the CO2 and sodium silicate activators is an impressive 99.99%. Deionized water was employed for material preparation. For more detailed information on the chemical composition of the materials under investigation, please refer to Table 1. The calcium oxide content in F accounts for 22.3%, while the calcium oxide content in cement is 50.3%. Following the initial backfill material ratio experiment, this research opted for 5 different mass fractions of F and G. The cement mass ratio was set at 20%, and the mass ratio of F to G was set at 20%:60% (F2G6), 30%:50% (F3G5), 40%:40% (F4G4), 50%:30% (F5G3), and 60%:20% (F6G2). The sodium silicate concentration was set at 20 wt%, the mass ratio of activator to water was 1:9, and the total mass fraction ratio of solid and liquid was 7:3 [29]. In addition, four types of mineralization specimens were set for different curing durations, which were 3 days, 7 days, 14 days, and 28 days. A total of 5 scheme groups were designed, with 20 specimen numbers. The test schemes are shown in Table 2. Sodium silicate alkaline activator, also known as a cement foaming agent, has a colorless transparent liquid appearance, which is environmentally friendly and pollution-free. The introduction of air can yield a high quantity of foam, which can react with water, CO2, F, and G to form a gel structure, which is conducive to the mineralization reaction [30,31]. In addition, adding cement is mainly used to improve the solidified body’s long-term stability and environmental safety. In the test, when the solid–liquid ratio is fixed, the mass ratio of F to G is set primarily based on the fluidity of the slurry, with higher mass ratios of F to G resulting in better slurry fluidity, and conversely, lower ratios leading to reduced fluidity [32].

2.2. Experimental Steps
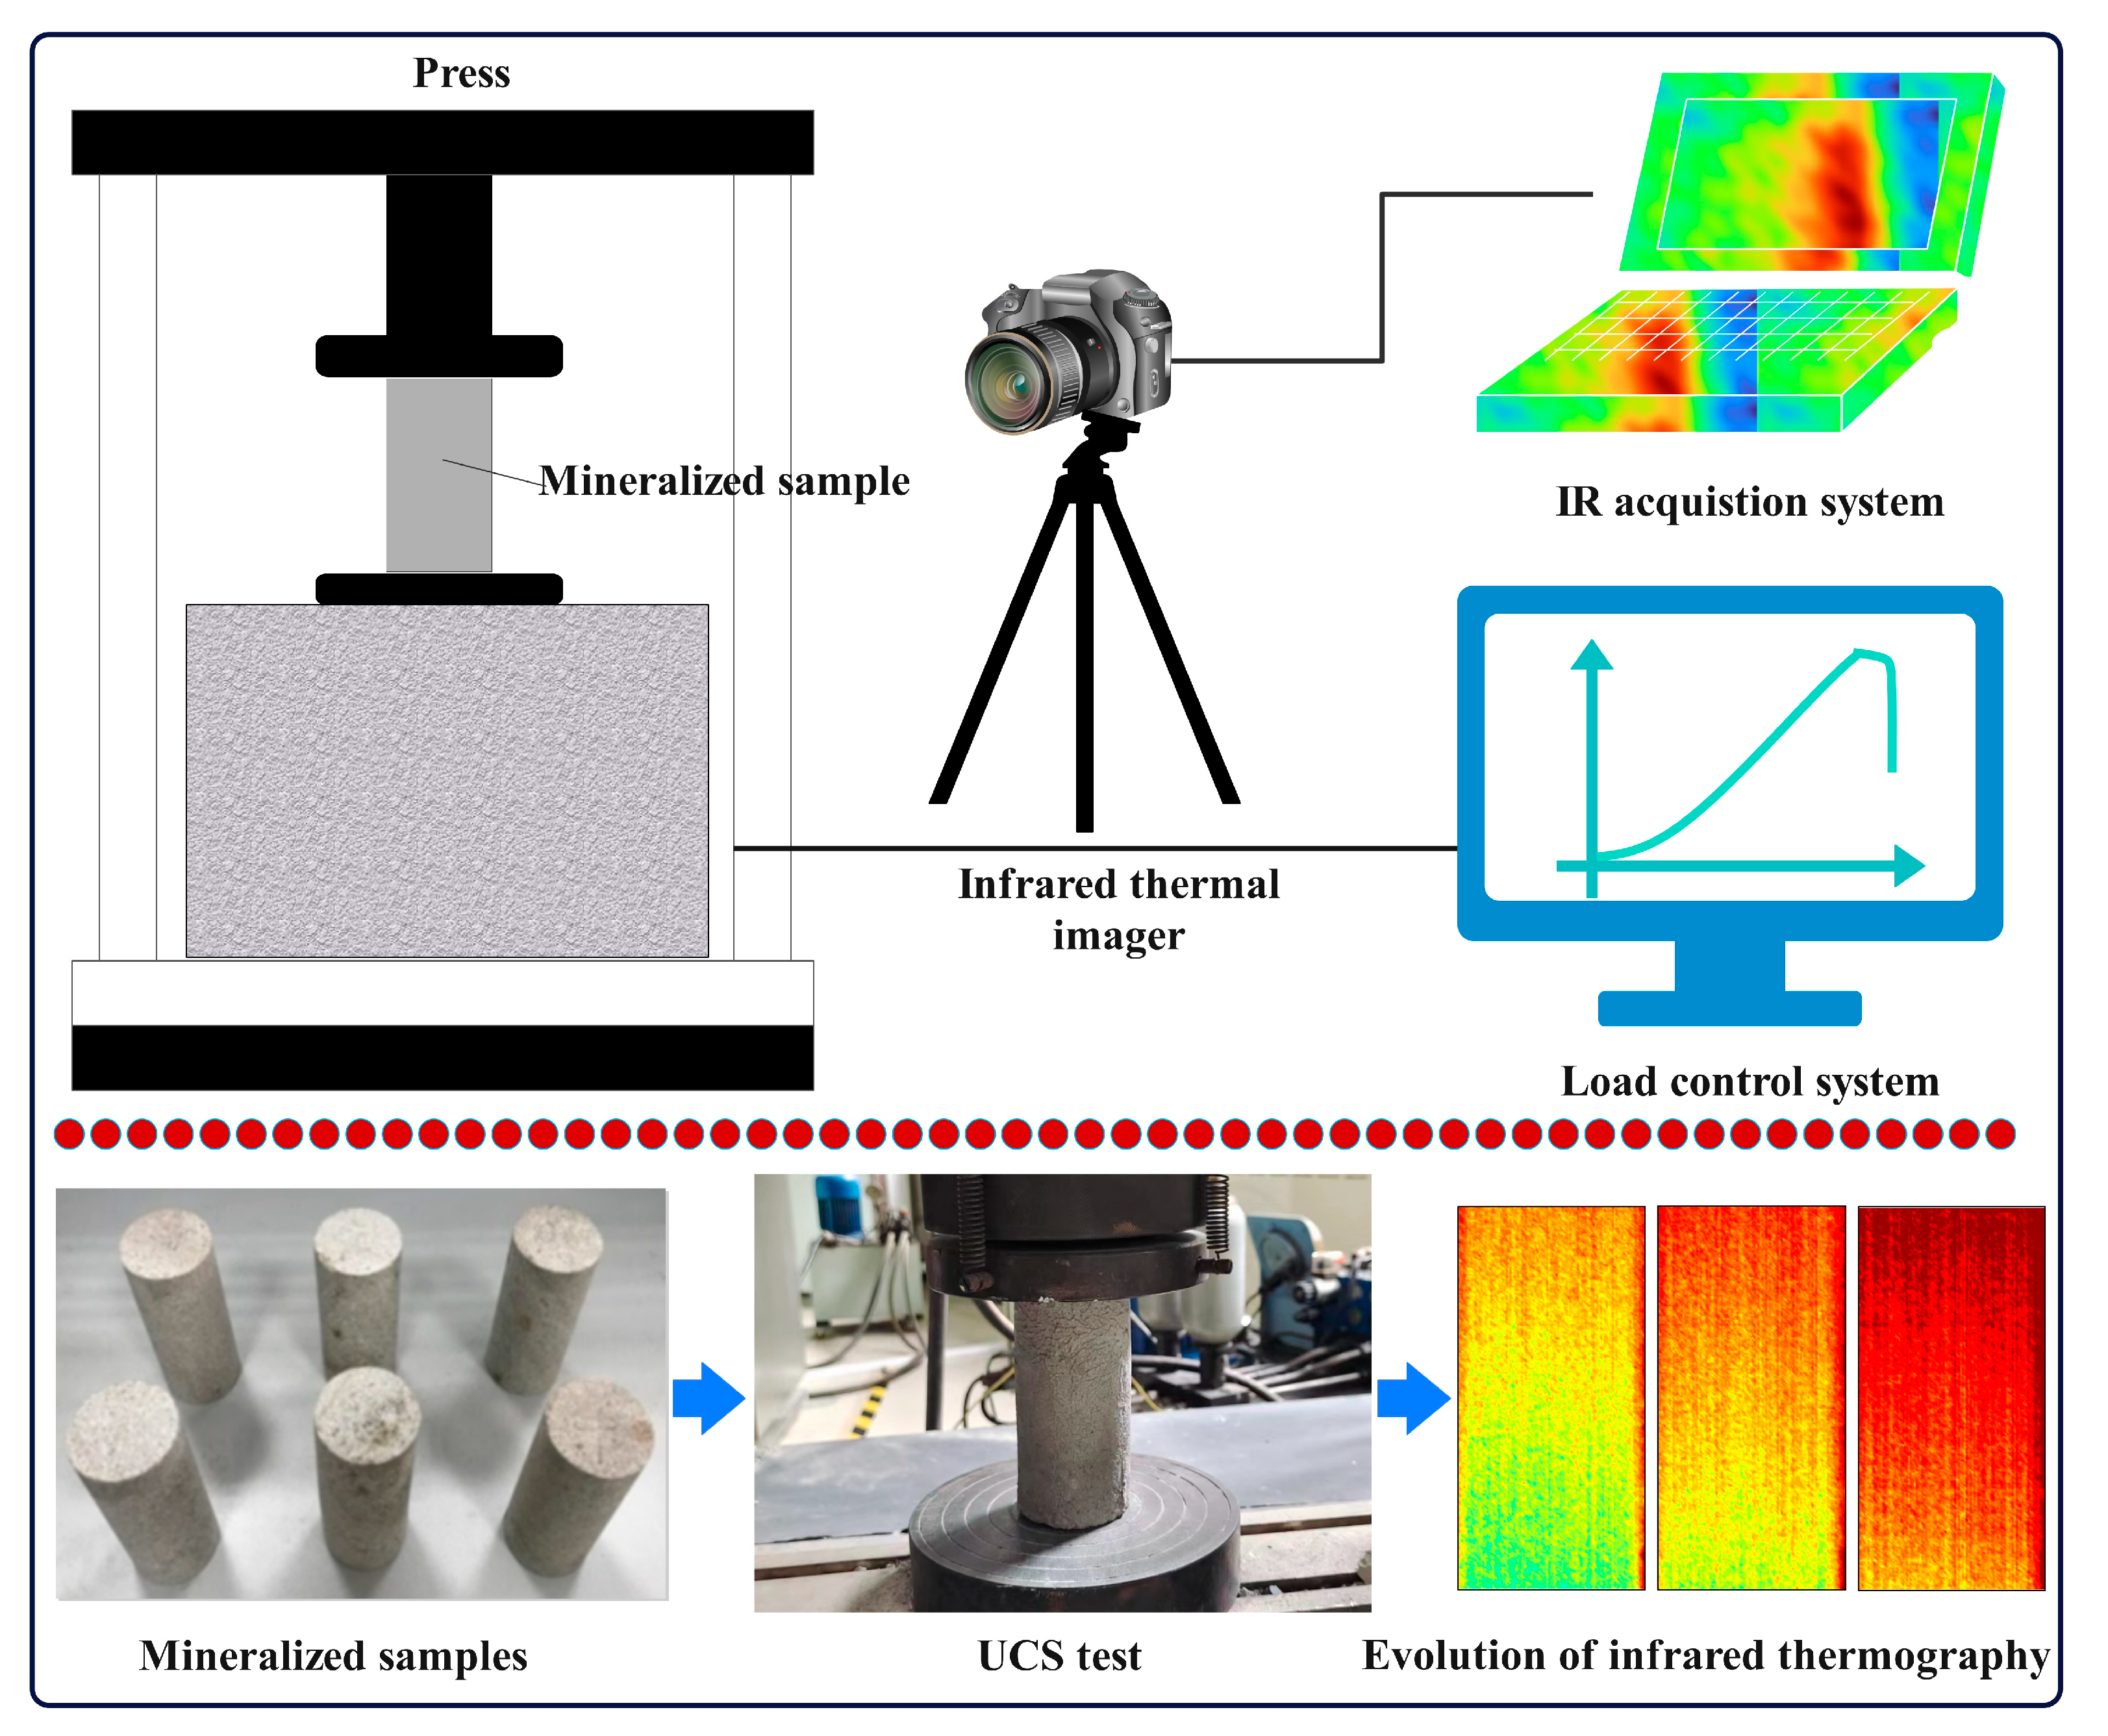
The experimental procedure is shown in Figure 1. Firstly, the F, G, and cement were put into the agitator according to mass ratio from the feeding port and stirred for 5 min to ensure a uniform dry phase. Subsequently, the aqueous solution and alkaline activator were combined in a mass ratio of 1:9, well mixed using a glass rod, and then added to the mixer. The mixer’s rotation speed was set at 500 r/min. After 5 min of rotation, CO2 was passed at a rate of 1.0 L/min through the inflation port into the mixer [33]. The test time was set to 30 min. Finally, after mixing was completed, the slurry was poured out through the feeding port. A mold was employed to create a cylindrical sample measuring 50 mm in diameter and 100 mm in height. The sample was then positioned in a constant temperature and humidity chamber set at 95% humidity and 40 °C temperature for a curing period of 48 h before demolding. Subsequently, the sample was transferred to normal temperature and pressure conditions for further curing. After curing was completed, the mineralized specimen sample was obtained for testing. To ensure the reliability of the test results, three parallel samples were prepared for each mineralized specimen number.

2.3. Test Equipment

The experimental loading equipment adopts the SANS microcomputer-controlled electronic universal testing machine system, with a maximum vertical load of 300 kN. The infrared radiation detection device adopts the FLIR A615 infrared thermal imager from the United States, with a thermal sensitivity of <0.05 °C, an infrared resolution of 640 × 480 pixels, and a pixel spacing of 17 μm. The time constant measures 8 ms, the maximum rate at which images are acquired is 25 frames per second, and the wavelength range spans from 7.5 to 14 μm.

2.4. Test Method

The infrared monitoring experiment and its data processing method are shown in Figure 2. The specimen was placed precisely in front of the infrared thermal imager, about a meter away, to record the temperature changes brought on by the infrared radiation as the sample experienced uniaxial compression. The sample was loaded at a rate of 0.005 mm/s, while the pressure machine recorded data at a frequency of 5 times/s. The thermal imager has a frame acquisition rate of 7.5 frames per second. The clocks of the two devices were adjusted to be consistent before the test, and data recording commenced at the same time. In order to reduce the influence of ambient light on the infrared radiation characteristics of the rock surface, a closed opaque cardboard box was used to cover the uniaxial compressed rock sample, and the open holes on the lens of the thermal imager were used to receive only infrared radiation from the sample. To avoid the effects of air convection, the laboratory’s doors and windows were securely closed. Personnel were prohibited from walking or shaking at will to avoid the impact of human radiation [34]. The infrared radiation temperature variations on the surface of each rock sample were observed using an infrared thermal imager before commencing the experiments. The experiment was initiated only after the temperature curve had reached a stable state.

3. Experimental Results

3.1. Unconfined Compressive Strength (UCS)

The UCS value is of great significance for CO2-mineralized coal-based solid waste materials. It can not only reflect the support strength of the backfilling material on the roof but also reflect the constraint ability of the surrounding overlying rock transport. The mineralized samples’ UCS values were divided into two graphs, Figure 3a,b, for comparison, utilizing the mass ratio of F to G. Figure 3 illustrates that with a constant ratio of F to G, the UCS gradually increases and exhibits a stepwise growth as the curing time prolongs. As the curing time progresses, the amplitude increase gradually lessens. Taking F2G6 as an example, the UCS measures 7.23 MPa after 14 days of curing and 7.28 MPa after 28 days, with the disparity being almost negligible. The data provided unequivocally indicate that the early phase of the CO2 mineralization response is notably intense, occurring within a period of 7 days. Following this, the subsequent phase progresses at a slower pace, spanning from 7 to 14 days. Lastly, the later stage, extending beyond 14 days, demonstrates a slow and nearly static rate of mineralization. Additionally, while considering the same maintenance timeframe, a comparison of Figure 3a in a horizontal manner shows that the UCS values result in the following scheme order: F2G6 < F3G5 < F4G4; this result indicates that the UCS value increases with a higher ratio of F to G. Figure 3b demonstrates that the UCS value of F5G3 surpasses F4G4 and F6G2, with a maximum strength of 13.31 MPa. Notably, the UCS does not consistently rise with the increase in the F to G ratio. Instead, it exhibits an initial increase followed by a subsequent decrease. Hence, F5G3 is considered the optimal ratio of F to G.
We can analyze the mineralization mechanism by enumerating chemical equations. The alkaline activator Na2SiO3 dissolves a significant amount of OH in water, creating an alkaline environment that breaks down the Si-O-Si, Al-O-Al, and Si-O-Al bonds found in abundance within coal-based solid waste materials [29]. This process forms unsaturated and highly active chemical bonds, thereby enhancing the reactivity of coal-based solid waste materials. C a 2 + , [ S i O ( O H ) 3 ] , and [ A l ( O H ) 4 ] ions are dissolved with cations and anions that combine to initiate a polycondensation reaction, which ultimately yields a highly polymerized C-S-H gel [35]. The chemical reaction formula is as follows:
Y [ S i O ( O H ) 3 ] + X C a 2 + + Z X Y H 2 O + 2 X Y O H C x S y H z
When CO2 is injected by bubbling method at room temperature and pressure, C O 3 2 is dissolved and combined with C a 2 + and C a ( O H ) 2 in the system to form CaCO3; the reaction formula is as follows:
C O 2 + H 2 O H 2 C O 3 H + + H C O 3 2 2 H + + C O 3 2
C a 2 + + C O 3 2 C a C O 3
C a ( O H ) 2 + C O 2 C a C O 3 + H 2 O
A gel structure (CaO-SiO2-H2O, C-S-H) and calcium carbonate (CaCO3) are formed when CO2 and Na2SiO3 hydrate reacts in a mixed solution of F and G. The C-S-H mainly plays the role of bonding free body, while CaCO3 particles are mainly backfilled into the pores of the material, both of which can promote the strength of the specimen [36]. It can be observed from Table 1 that the CaO content in F reaches 20%. The SiO2 content in G exceeds 40%, and the C-S-H contains SiO2 and CaO. The CaCO3 is primarily generated by CO2 and CaO in an aqueous solution. Therefore, the mass ratio of F to G affects the UCS strength of the specimen from two dimensions of C-S-H and CaCO3. Consequently, there is no single change in UCS with an increase in F content. The higher the ratio of F to G in the initial stage, the higher the UCS will be. This could be attributed to the generation of more C-S-H and CaCO3. However, when the ratio of F to G reaches a certain upper limit, the UCS begins to decrease with an increase in the ratio. This decline might be caused by the generation of more C-S-H but a lower amount of CaCO3, leading to less backfilling of CaCO3 in the pores of the test piece and resulting in UCS reduction.

3.2. X-ray Diffraction (XRD)

The XRD data for F4G4, F5G3, and F6G2 were explored in relation to the 28-day mineralization conditions, as outlined in Figure 4. Both gel and calcium carbonate were detected in the diffraction peaks, which proved that they were the products of the hydration reaction and could ultimately improve the strength of mineralized specimens. Mullite is a general term for silicate minerals composed of Si-Al-O, mainly composed of Al2O3, which is common in F [37]. As can be seen from Table 1, SiO2 comes from F and G, but the SiO2 component of G is higher than that of F. Physicochemical analysis shows that from F4G4 to F5G3 and then to F6G2, the diffraction peak intensity of mullite phases appearing at angles ranging from 16°, 35°, 41°, and 57° gradually increases, indicating that the F content is increasing. The diffraction peak of SiO2 has a wide distribution range, and the main characteristic peak at angle 33° is found to decrease gradually, indicating that the G content is decreasing. In addition, the diffraction peaks of the gel structure (C-S-H) appear near 21°, 31°, and 33°, and the diffraction peak intensity of F5G3 is relatively large; the diffraction peaks of calcium carbonate appear near 30°, 43°, 48°, 61°, and 65°, and F4G4 is slightly larger than F5G3. Since C-S-H and CaCO3 jointly determine the UCS intensity of the sample, therefore, the UCS shows the numeric result of F5G3 > F4G4 > F6G2 in Figure 3.

3.3. Average Infrared Radiation Temperature (AIRT)

The average infrared radiation temperature (AIRT) of mineralized samples represents the comprehensive intensity of their infrared radiation under loading. According to research, the characteristics of the AIRT change over time during the loading process of the specimen and are related to various factors, such as the type of specimen [38], water content (water pressure) [39], gas content [40], etc. Many rocks have anomalous precursors before experiencing uniaxial compression failure, and these precursor types can be grouped into three categories: transient cooling, heating acceleration, and descending to ascending [41].
The object of this experiment was to select carbonized samples with different F and G contents that have been oxidized for 14 days for analysis and discussion. The AIRT and stress change curves are shown in Figure 5a–e. The AIRT of coal-based solid waste mineralization samples in this article is also linearly correlated with stress, mostly showing fluctuating and linear upward patterns. In addition, many backfilling materials exhibit a sudden temperature drop at the point of severe damage. From the AIRT image, it can be seen that there is a significant difference in the degree of surface temperature change during the loading process of samples with different F and G mass ratios. As the loading progresses, the surface temperature of the mineralized sample gradually increases, and the synchronicity between its AIRT curve and stress curve is very high. When the AIRT of the F2G6 mineralized sample approaches the stress peak, there is a turning point decrease phenomenon, and the temperature rise on the surface of the sample is relatively small, with a value of 0.12 °C. When the AIRT of the F3G5 mineralized sample approaches the stress peak, there is also a phenomenon of turning and decreasing. After the sample reaches the peak stress, it immediately fails, and its surface temperature also immediately decreases, which is almost consistent with the time point of severe failure. The AIRT of the F4G4 mineralized sample continued to increase, but the rate of increase gradually slowed down, and the sample showed plasticity after reaching the peak stress. However, during the continued loading process, its surface temperature did not decrease with stress but continued to rise until the sample was damaged, with a temperature change of 0.37 °C. The mineralization sample AIRT of F5G3 shows a linear upward trend, and its temperature change was the largest, reaching 0.83 °C. The AIRT of the F6G2 mineralized sample also showed a linear increase.
Based on comprehensive analysis, as the ratio of F to G increases, the heating amplitude of the sample gradually increases. It is speculated that this is because the thermal–mechanical conversion efficiency of F is higher. According to the infrared radiation response mechanism during the coal rock stress fracture process, thermal radiation mainly includes the thermal elastic effect, frictional thermal effect, and crack propagation thermal effect, which are released in the form of thermal energy [42]. During the loading process of the backfilling body, the mechanical energy of the loading machine is converted into thermal energy, while high F content is more prone to heating, resulting in a larger heating amplitude [43].

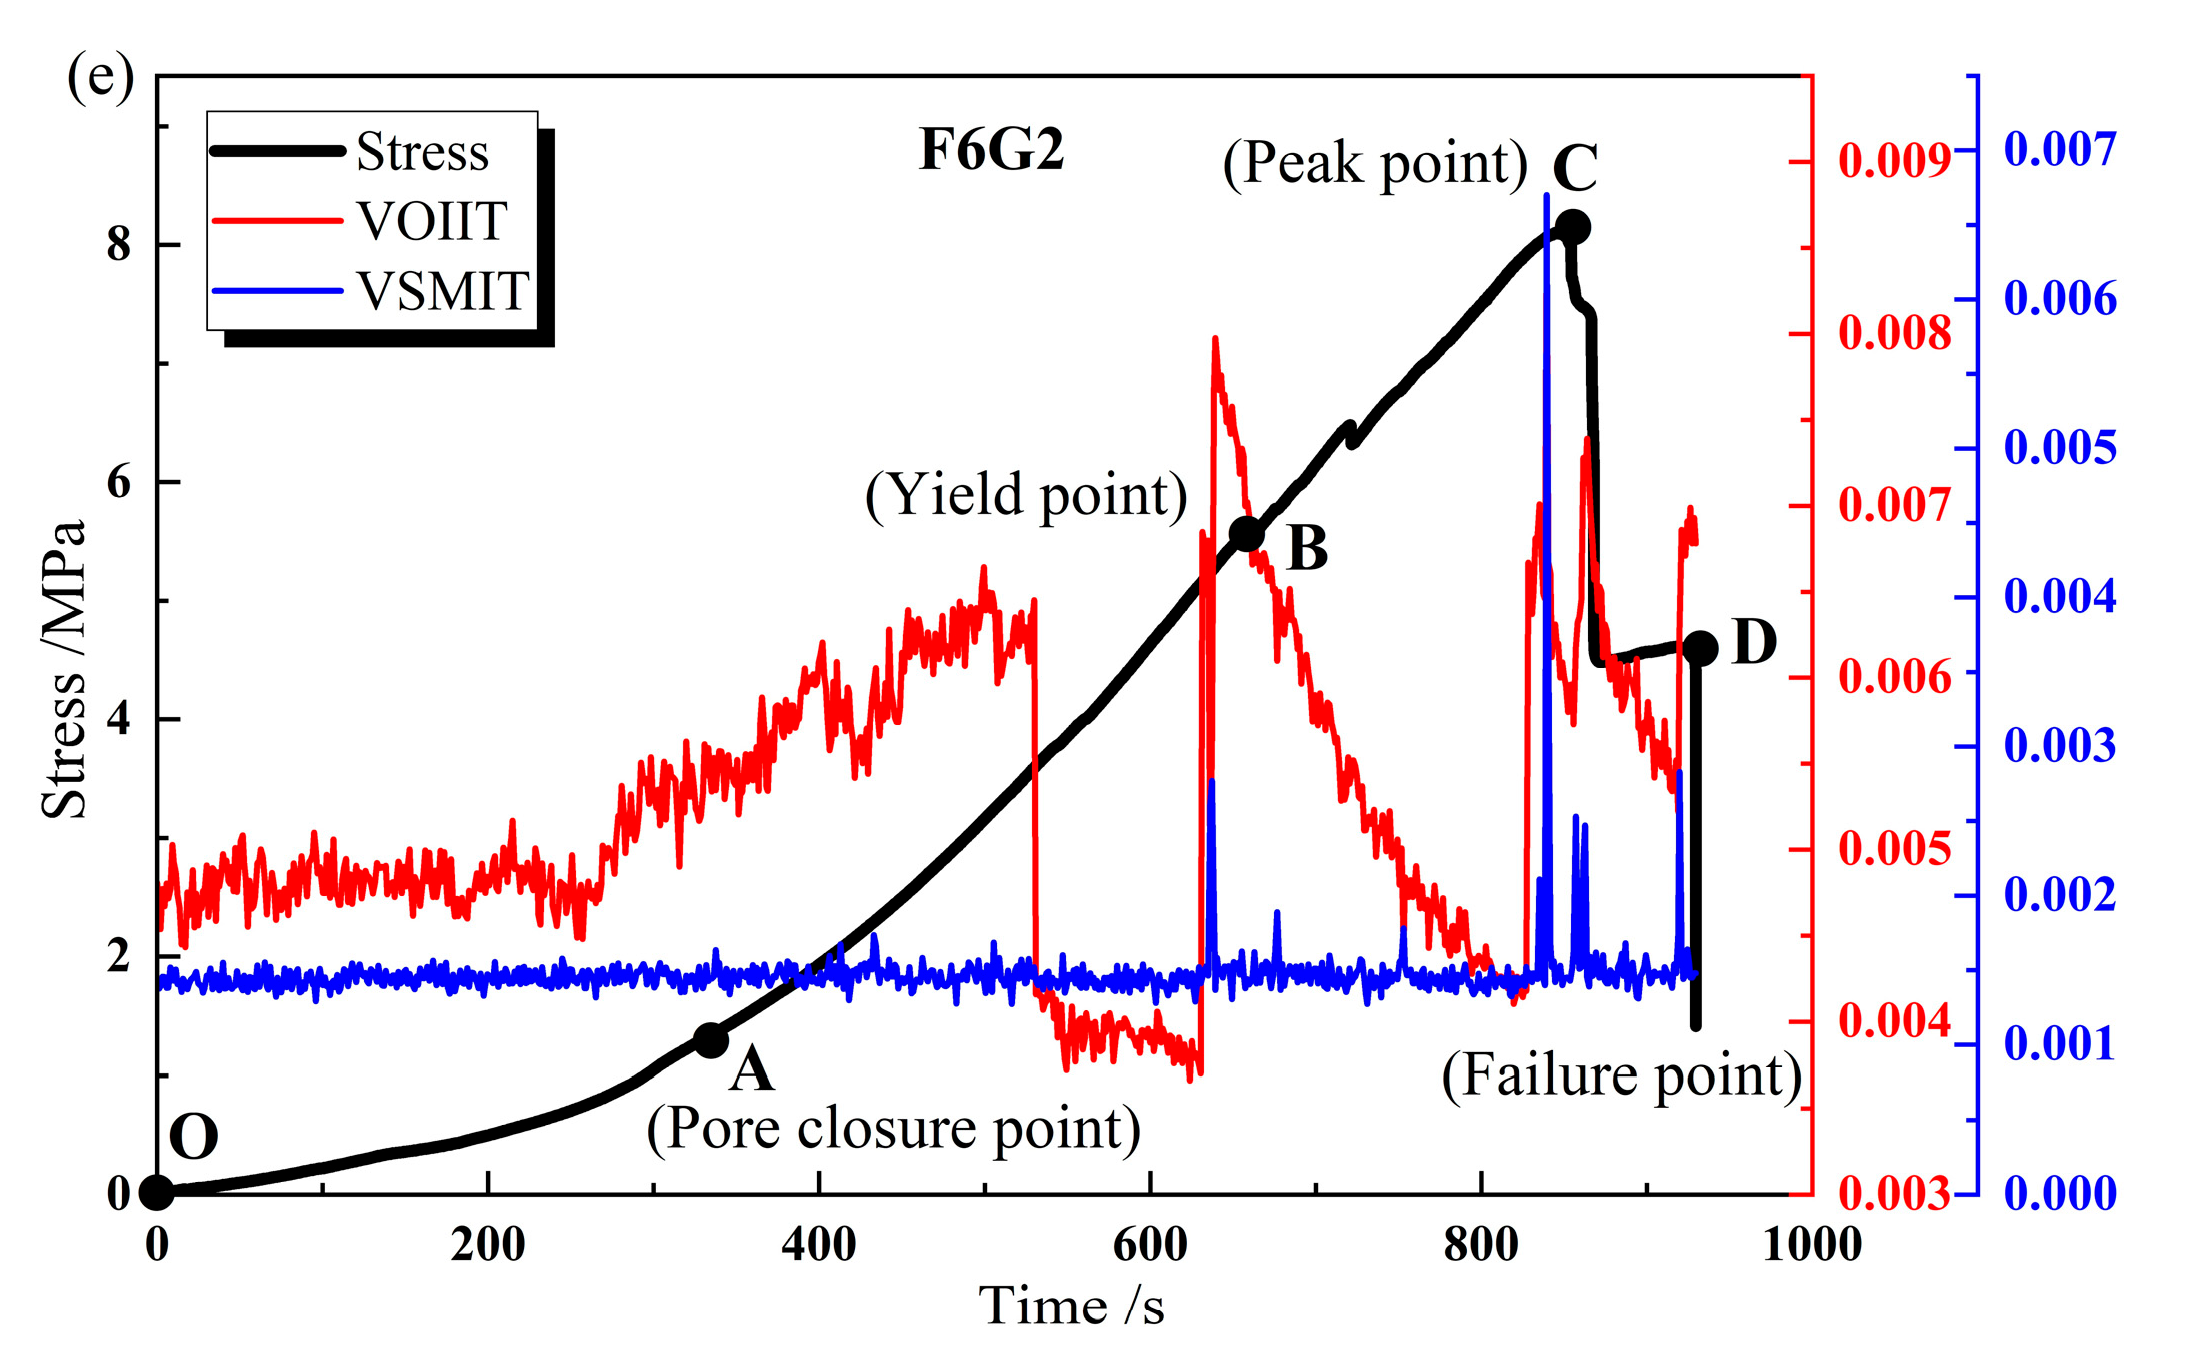
3.4. Variance of Original Infrared Image Temperature (VOIIT) and Variance of Successive Minus Infrared Image Temperature (VSMIT)

The physical significance of the VOIIT is the degree of dispersion of the entire coal rock surface temperature field, with a higher value indicating a more pronounced differentiation in the infrared thermal image. The physical significance of the VSMIT is to describe the fluctuation of the entire coal rock surface temperature field between adjacent time points, with a larger VSMIT value indicating a more pronounced difference in the infrared thermal images of neighboring frames, representing the presence of larger cracks and fracture scales in the sample [44]. Sun et al. utilized infrared and acoustic emission combined monitoring to investigate the thermo-acoustic effects during the rock damage process, and the results showed that the VSMIT and the related dimension of the acoustic emission ringing count (Dm) exhibit significant mutation during rock damage and fracture events, with the VSMIT mutation time being earlier than the Dm mutation time in 71.1% of rock samples, indicating that the formation of unstable cracks is the fundamental reason for the mutation in the VSMIT and Dm [45]. Cui et al. utilized an infrared thermal camera to monitor sandstone water seepage experiments, and the results revealed a significant mutation in the VOIIT and VSMIT before the sandstone water seepage fracture, with the VSMIT exhibiting pulse-like mutation [46].
The VOIIT and VSMIT in the pth frame infrared image can be expressed as follows:
V O I I T p = 1 L x 1 L y y = 1 L x x = 1 L y f p ( x , y ) A I R T p 2
V S M I T p = 1 L x 1 L y y = 1 L x x = 1 L y φ p x , y A I R T p 2
In the formula, f p ( x , y ) represents the infrared radiation data matrix of the p frame, φ p x , y represents the difference between the infrared radiation data matrix of the p + 1 frame and the p frame, L x and L y represent the number of rows and columns of the matrix, respectively, and A I R T p and A I R T p represent the average values of f p ( x , y ) and φ p x , y , respectively.
As shown in Figure 6, it can be seen that the VOIIT of all samples undergoes mutations, and the mutations are particularly frequent in the later stage of loading, especially when approaching fracture. The mutations are more rapid and violent, often exhibiting pulse-like fluctuations, and the mutation time is before the final damage occurs, which is related to the intensification of the damage degree of the samples in the middle and later stages. The graph reveals a notable pattern where the mutation of the VOIIT is frequently accompanied by a mutation in the VSMIT, indicating a strong synchronization between the two. Consequently, when the VOIIT experiences fluctuations, it is highly probable for the VSMIT to undergo variations. Conversely, when the VSMIT undergoes variations, it is imperative for the VOIIT to undergo fluctuations. The VSMIT operates in a pulsating manner, while the VOIIT demonstrates a gradual increase as displayed in Figure 6c, along with a sporadic pattern in Figure 6a and a pulse-like variation in Figure 6b. Therefore, in terms of numerical variation, the pulsating mutation phenomenon of the VSMIT is more prominent and easier to discern. From the perspective of fluctuations, the VOIIT provides a relatively more comprehensive dataset. Consequently, both the VOIIT and VSMIT have significant roles in temperature data analysis, damage prediction, and warning, and can be mutually validated and supplemented.
Based on the evaluation of the quality ratio between F and G, it is evident that while a higher proportion of F compared to G may result in an increase in the average infrared radiation temperature amplitude, drawing a consistent conclusion regarding the variance index is challenging. This difficulty arises primarily because the fluctuation and variability of temperature data, as described by the VOIIT and VSMIT, are closely linked to the internal crack development of the sample during the loading process. Consequently, this phenomenon involves the homogeneity and anisotropy of mineralized materials. As a result, determining the appropriate ratio of F to G proves to be a complex task. However, the mutation of the VOIIT and VSMIT during the loading process can describe the crack development at each stage of the loading process, and thus reasonably infer the uniformity of the mineralization effects of different samples. As shown in Figure 6, the damage evolution process of mineralized samples can be roughly divided into four stages: microporous crack compaction closure stage (OA), elastic deformation stage (AB), plastic deformation stage (BC), and post-peak failure stage (CD). In the OA section, the VOIIT and VSMIT performance of all mineralized samples are relatively stable. In section AB, there were two large pulse-like fluctuations in the VOIIT and one variation in the VSMIT of the F6G2 sample, indicating that there was already a large crack propagation inside the F6G2 sample during the elastic deformation stage, and its mineralization bonding uniformity was poor. During the plastic deformation stage (BC), irreversible damage and accelerated internal crack propagation occur in the specimens. The VOIIT and VSMIT of F2G6, F3G5, F4G4, F5G3, and F6G2 specimens all show varying degrees of abrupt changes. Among them, the frequency and amplitude of abrupt changes in the F5G3 specimens are low, while the frequency and amplitude of abrupt changes in the F2G6 and F6G2 specimens are high, indicating good homogeneity in the F5G3 specimens and poor uniformity in the F2G6 and F6G2 specimens. Therefore, the UCS of the F5G3 specimens is higher, while the UCS of the F2G6 and F6G2 specimens is lower. In the CD failure stage, microcracks aggregate to form through cracks and the VOIIT and VSMIT exhibit high-frequency and significant mutations. For example, the F2G6, F3G5, and F6G2 samples have abnormally active VOIIT and VSMIT mutations, indicating the possible formation of multiple through-failure cracks. However, the F4G4 and F5G3 samples have relatively fewer mutations, indicating that they have fewer failure cracks, higher uniformity, and stronger strength.
Although there is no inherent connection between the AIRT and variance, the mutations observed in the VOIIT and VSMIT occur at a high frequency in the period preceding fracture, indicating that these indicators offer a more effective response in the later stages of specimen loading. On the other hand, the AIRT exhibits a noticeable upward and downward trend from the pore compaction stage to the stable crack propagation stage of the sample, implying that its reaction effect is more pronounced in the early and middle stages.

4. Mineralized Material Underground Backfilling Method

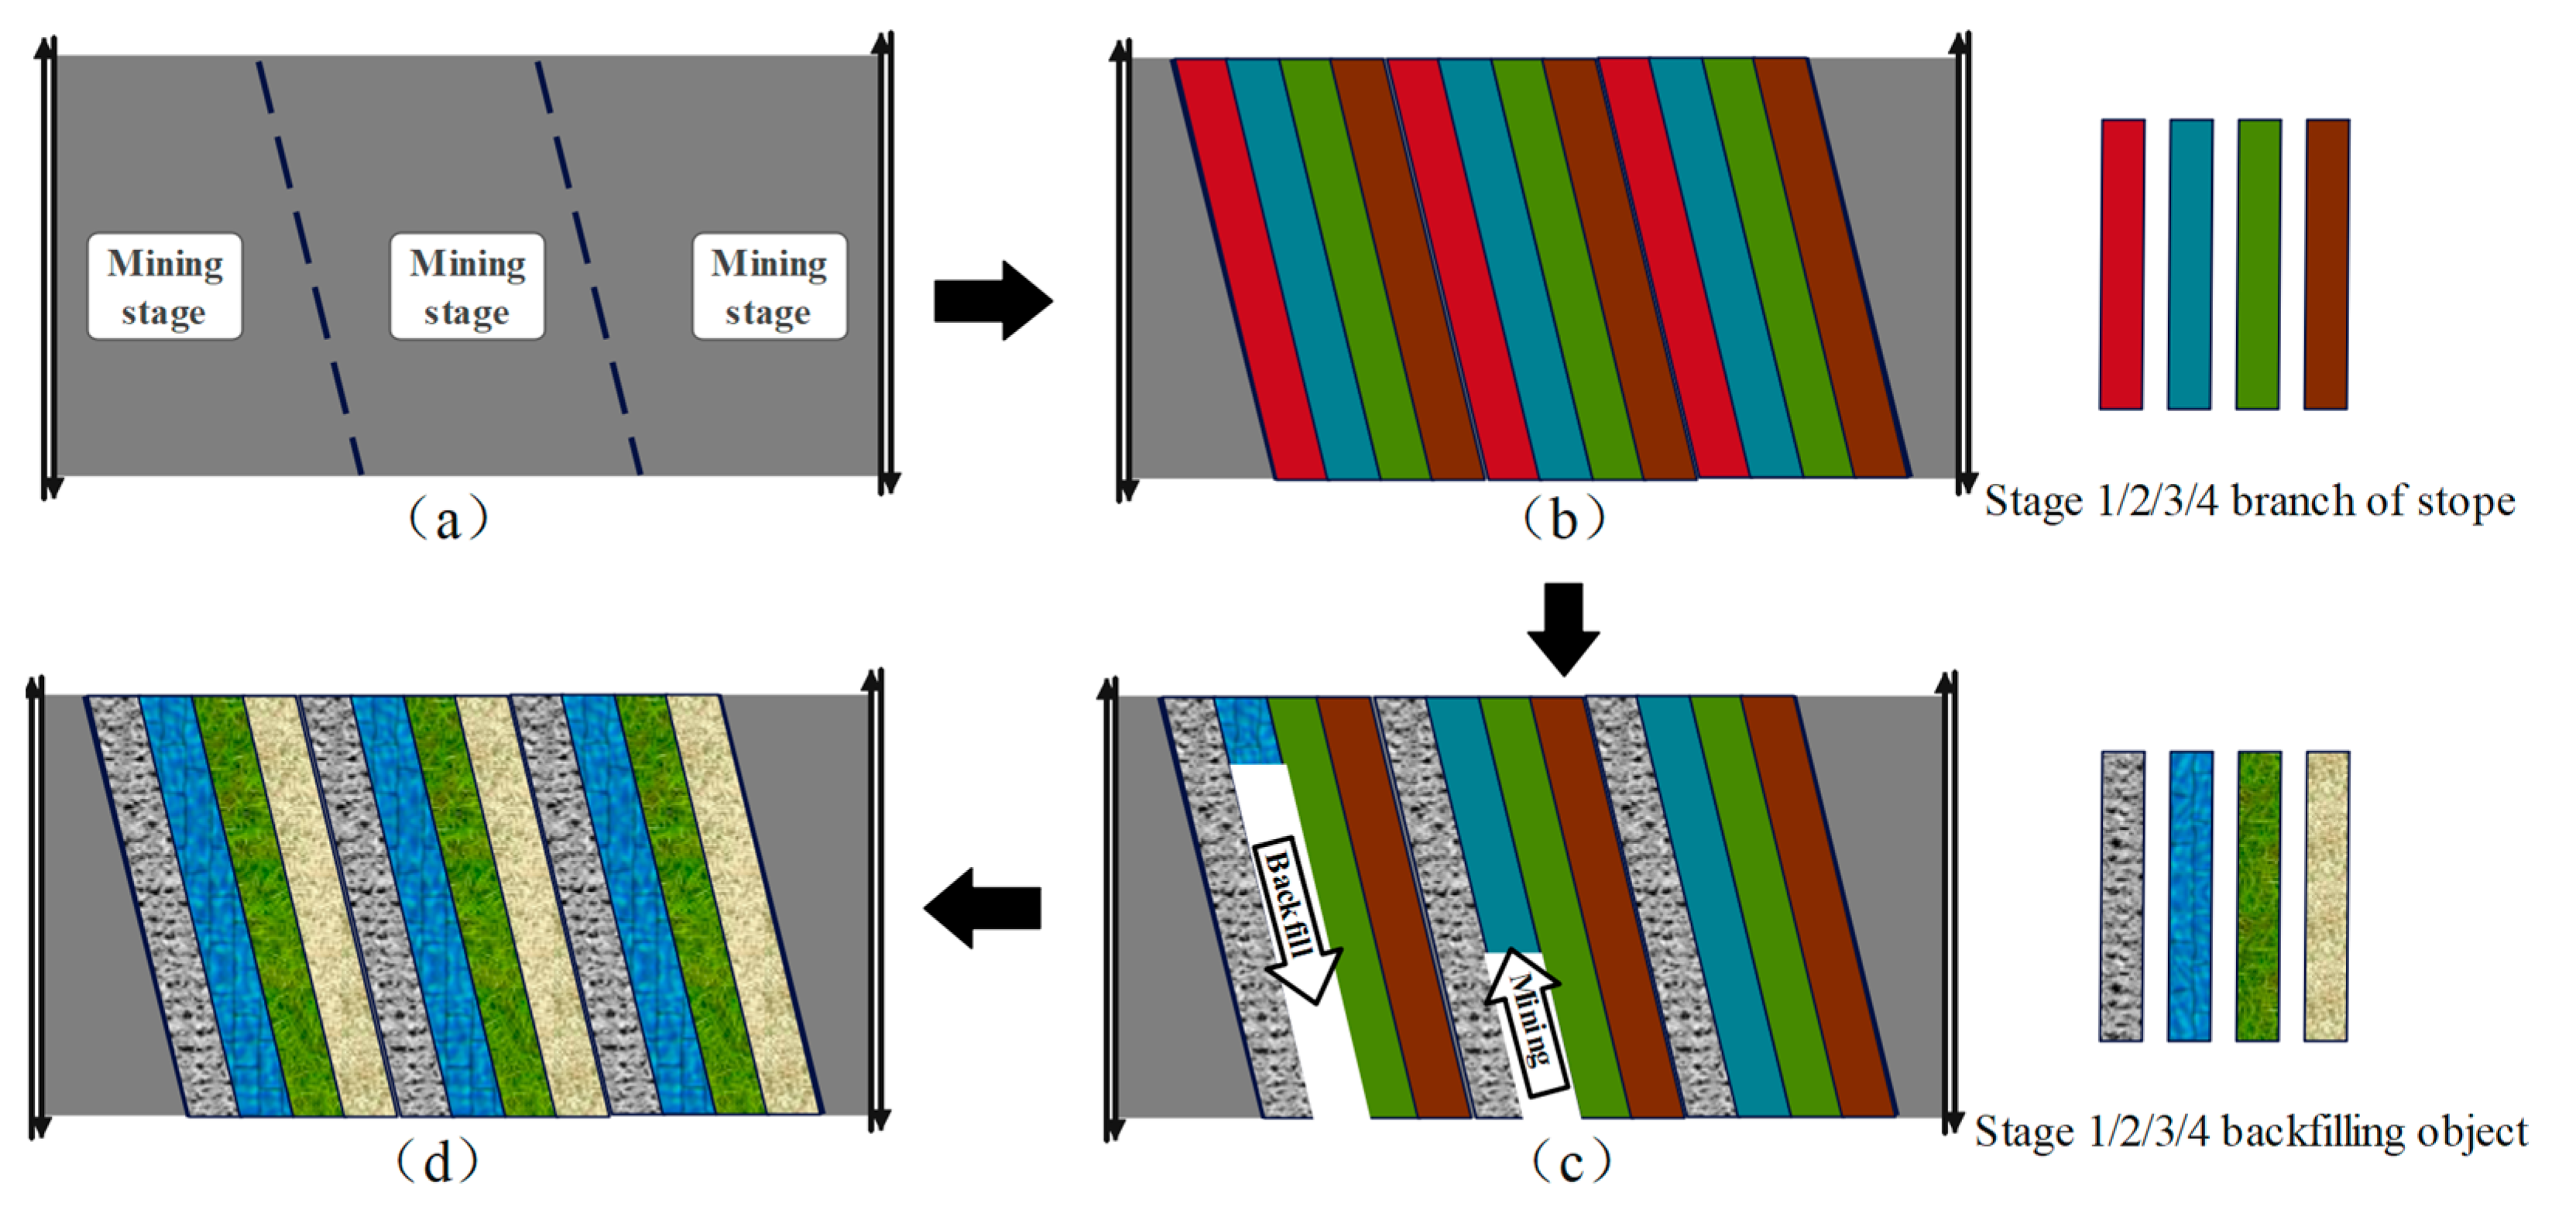
4.1. Working Face Layout

The construction of mining and backfilling space mainly includes the layout of the working face and the selection of mining and backfilling methods in the branch roadway of the stope. By adjusting the layout of the working face and the mining and backfilling methods, the overall migration of the overlying rock and the local migration of the rock strata are controlled, and then the permeability of the mining overlying rock is actively controlled to meet the requirements of coal mining with water conservation.
In this research work, the stope arranges the transportation lane, return air lane, and cutting eye according to the form of the wall working face, so that the whole working face forms negative pressure ventilation. In the working face, the branch roadway of the stope is arranged according to the Wongawilli method [47], with a double-wing arrangement for a near-horizontal coal seam and a single-wing arrangement for a coal seam with a large inclination angle. The branch roadway of the stope is perpendicular to the direction of the working face or at an angle of 40~60°; the length is generally not more than 150 m, and the width is generally not less than 4 m [48]. Each mining of the branch of the stope is equivalent to the feed of a wall shearer.
Before mining, the stope branches are divided into several mining stages (generally two to five), and the branches of the same mining stage are separated from each other to ensure that coal mining and backfilling are always in an independent and stable working space. Continuous mining equipment such as a continuous shearer is used to successively exploit the stope branches of the same mining stage, and the finished branches of the mining are immediately closed and backfilled, and the working face forms a “parallel mining and backfilling” operation mode until all the branches of the stope are mined and backfilled.
The principle of “parallel mining and backfilling” is mainly based on the advantages of the rapid mining method and the pillar backfilling mining method to solve the problems of insufficient backfilling time and backfilling space, and the difficulty of coordination between mining and backfilling operations [49]. In the mining process, all the stope branches within the entire mining block are first divided into multiple mining stages. After mining and backfilling all the branches in one stage, the mining and backfilling of the branches in the next stage are carried out until all the branches are mined and filled, ultimately achieving a complete replacement of coal with backfill materials. At present, using the method of “parallel mining and backfilling”, the research group has successfully carried out industrial tests in the Wangtaipu Coal Mine in North China. Under the condition that the recovery rate of the test block is 96.8%, the maximum surface subsidence value is 28 mm, the maximum horizontal movement value is 15 mm, the maximum horizontal deformation value is 0.63 mm/m, and the maximum dip value is 0.80 mm/m. The maximum curvature value is 0.09 mm/m2, which is less than the Grade I damage index stipulated by the Chinese state. The maximum horizontal deformation of the water barrier layer above the test block is less than 1.2 mm/m and the integrity of the water barrier layer is not damaged; thus, the water retention mining is realized [50].

4.2. Mining Sequence in the Branch Roadway of the Stope

4.2.1. Mining Sequence of Stope Branches

The mining principle of the stope branches on both sides of the transport lane remains consistent. To illustrate, let us focus on one wing as an example. The mining sequence of the branch roadway in the stope is further explained in Figure 7. To minimize the distance for ventilation, the stope branches in the working face (or mining block) are divided into three mining stages. Each stage involves mining the stope branches in a specific numbered sequence (1/2/3/4), with the previously cut-through branches immediately backfilled before moving on to the next one. The stope consistently follows the “mining and backfilling in parallel” operation mode. This stope layout method offers the advantages of complete mining and backfilling, as well as simultaneous mining and backfilling until all the branches of the stope are mined and backfilled.
In the second mining area of the Wangtaipu Coal Mine [50], based on the mining geological conditions of the test block and the mining experience of the mine, the width of the branch roadway of the stope is determined to be 6.0 m and the height is 2.6 m. According to the principle of isolator design, the width of the isolator is determined to be 18.0 m. Under the condition that the design width of the stope branch is 6.0 m, the stope branch in the whole block is divided into four mining stages. The branch roadway of the stope adopts the double-wing arrangement, that is, a main transportation roadway is arranged in the middle of the block along the direction of the coal seam. A total of 88 stope branch lanes are arranged with 50° openings on both sides of the main transportation lane. Finally, the application effect is remarkable; from the economic point of view, the recovery rate of the entire experimental block segment is 96.8%, and the backfilling and roof connection effect of the branch lane in the mining area is good.

4.2.2. Coal Mining Operation in the Branch of the Stope

The coal cutting, loading, transporting, and supporting tasks are executed utilizing various equipment such as the continuous shearer with shuttle car, continuous transport machine, scraper conveyor, and hydraulic drill car. Subsequently, the branch roadway of the stope is promptly backfilled to manage roof subsidence, thereby establishing a mining process comprising of “mining, loading, transporting, supporting, and backfilling” [51].

4.2.3. Backfilling Operation in the Branch of the Stope

Figure 8 illustrates the process of backfilling the stope branch lane. This operation involves several steps, including equipment inspection, pipeline washing, backfill grouting, observation, and monitoring. Prior to backfilling, walls are constructed on both sides of the stope branch roadway opening, and the backfilling pipe inlet is positioned near the transport roadway. Subsequently, the stope branch pipeline is installed close to the roof within the stope branch. Ultimately, the backfilling slurry is transported to the stope branch roadway through pipeline transportation.

4.3. Production System

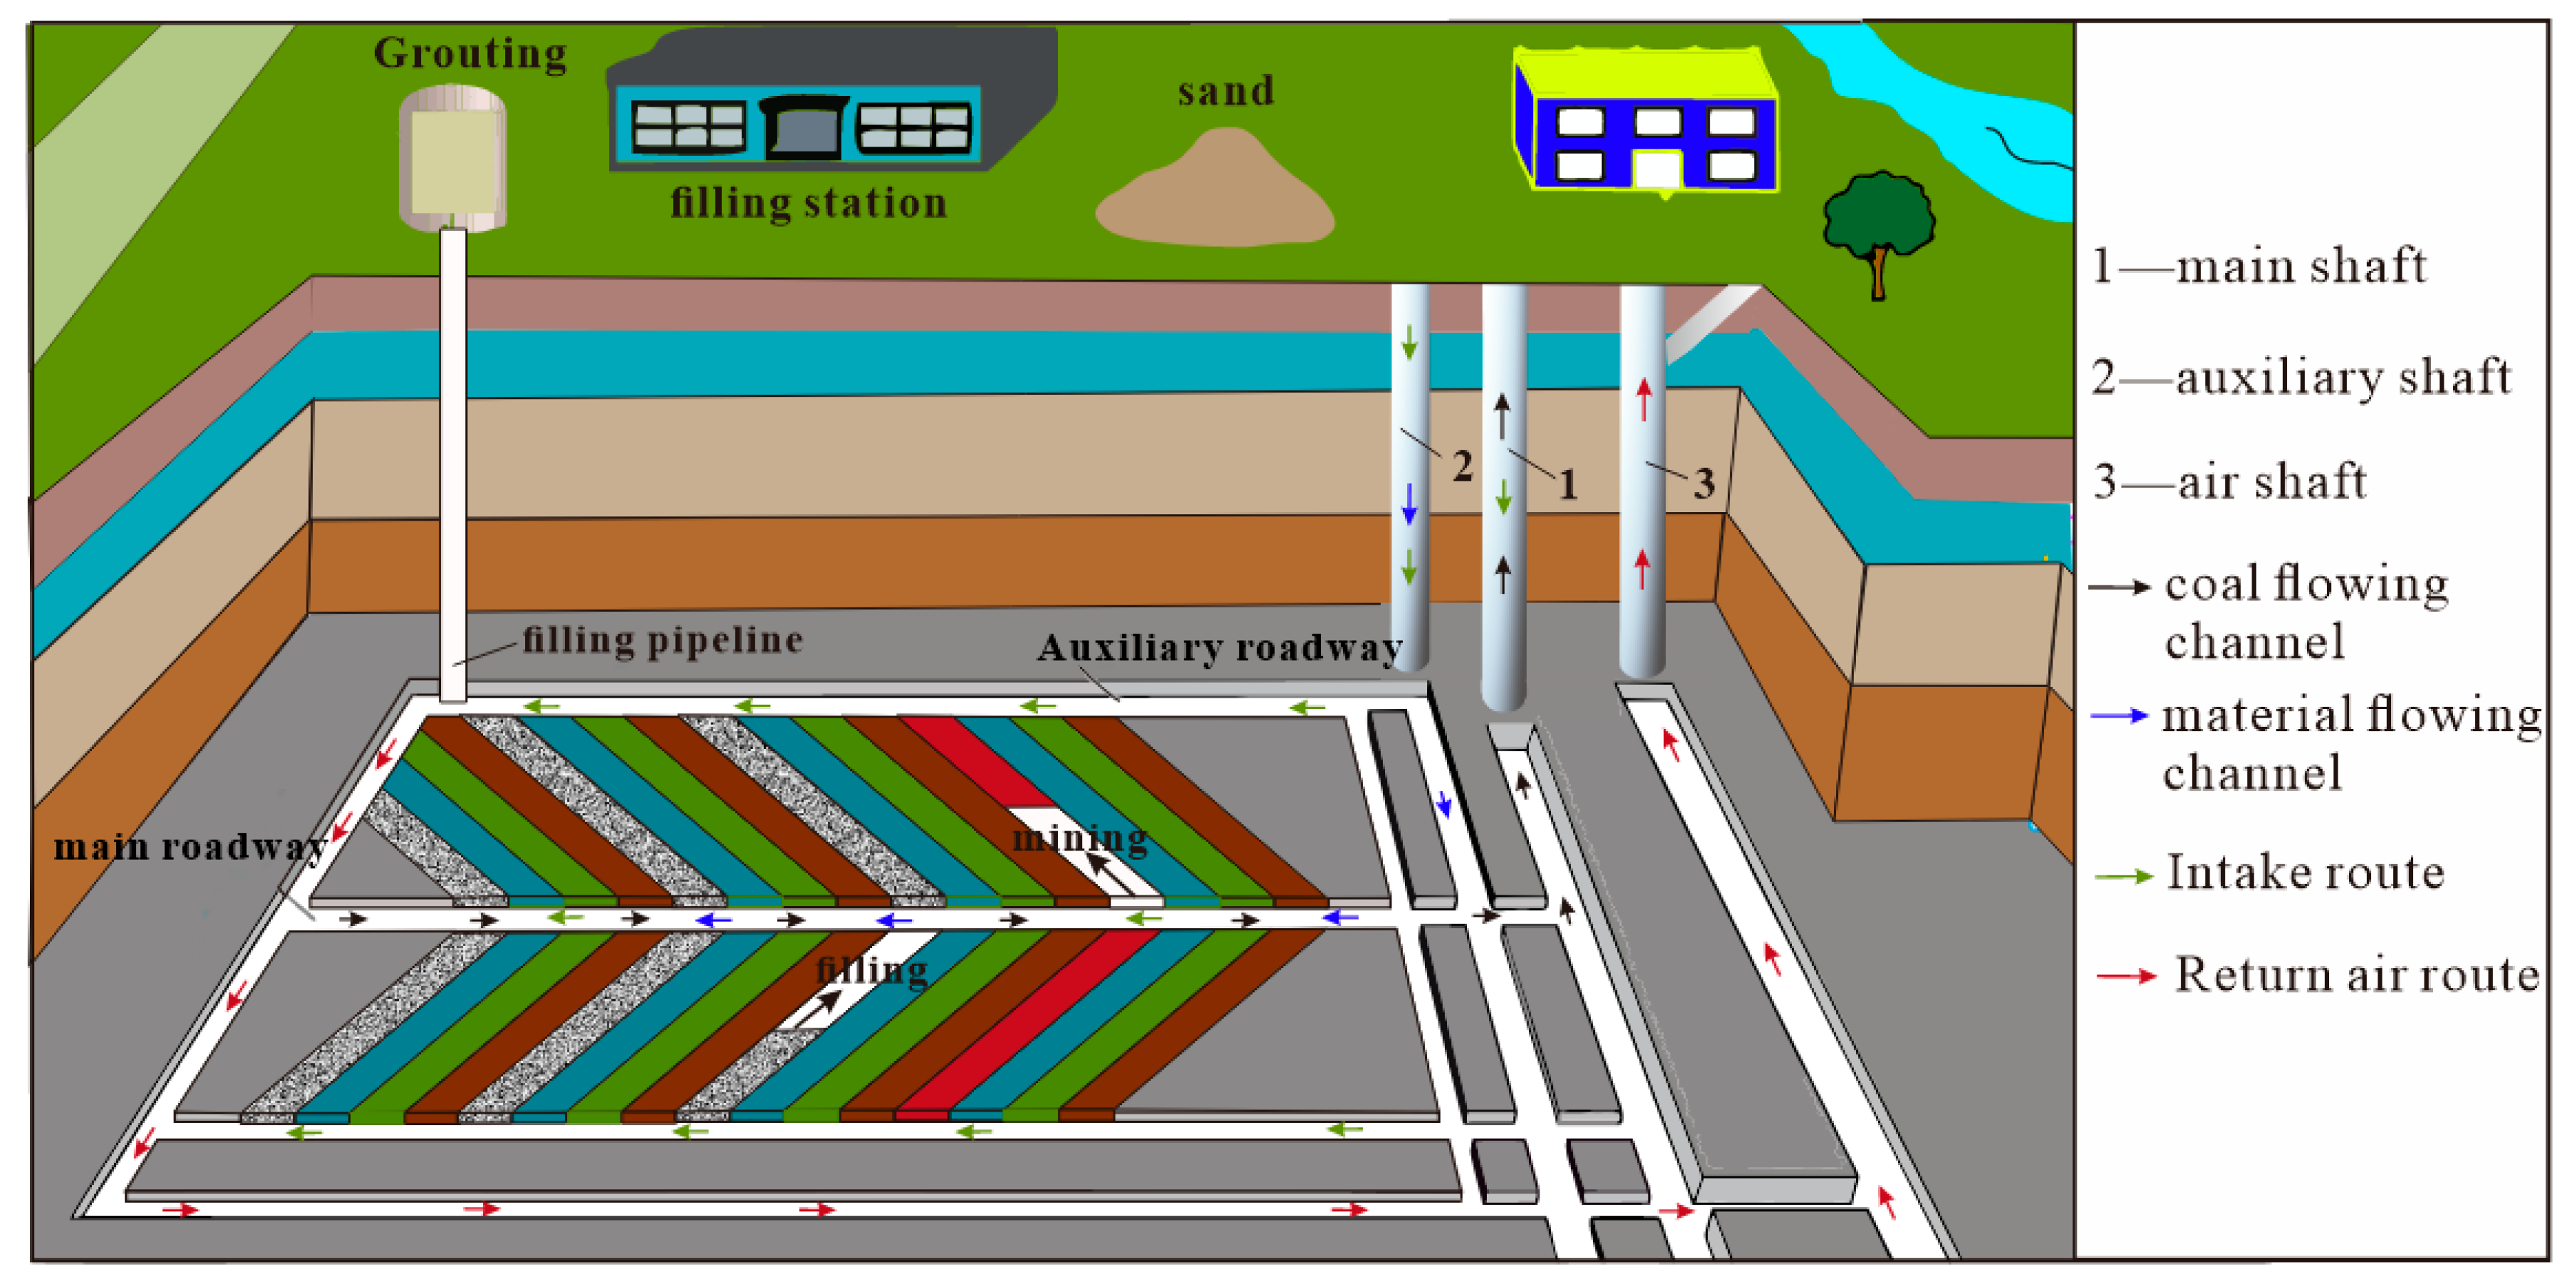
4.3.1. Transportation System

After the continuous shearer completes the cutting and loading of coal in the branch lane of the stope, the coal is transported to the continuous conveyor by the transportation equipment (such as shuttle cars, etc.), and the continuous conveyor transfers the crushed coal to the belt conveyor of the transportation lane. Finally, the coal is transported to the ground through the centralized transportation of the transportation lane and the main shaft lifting.

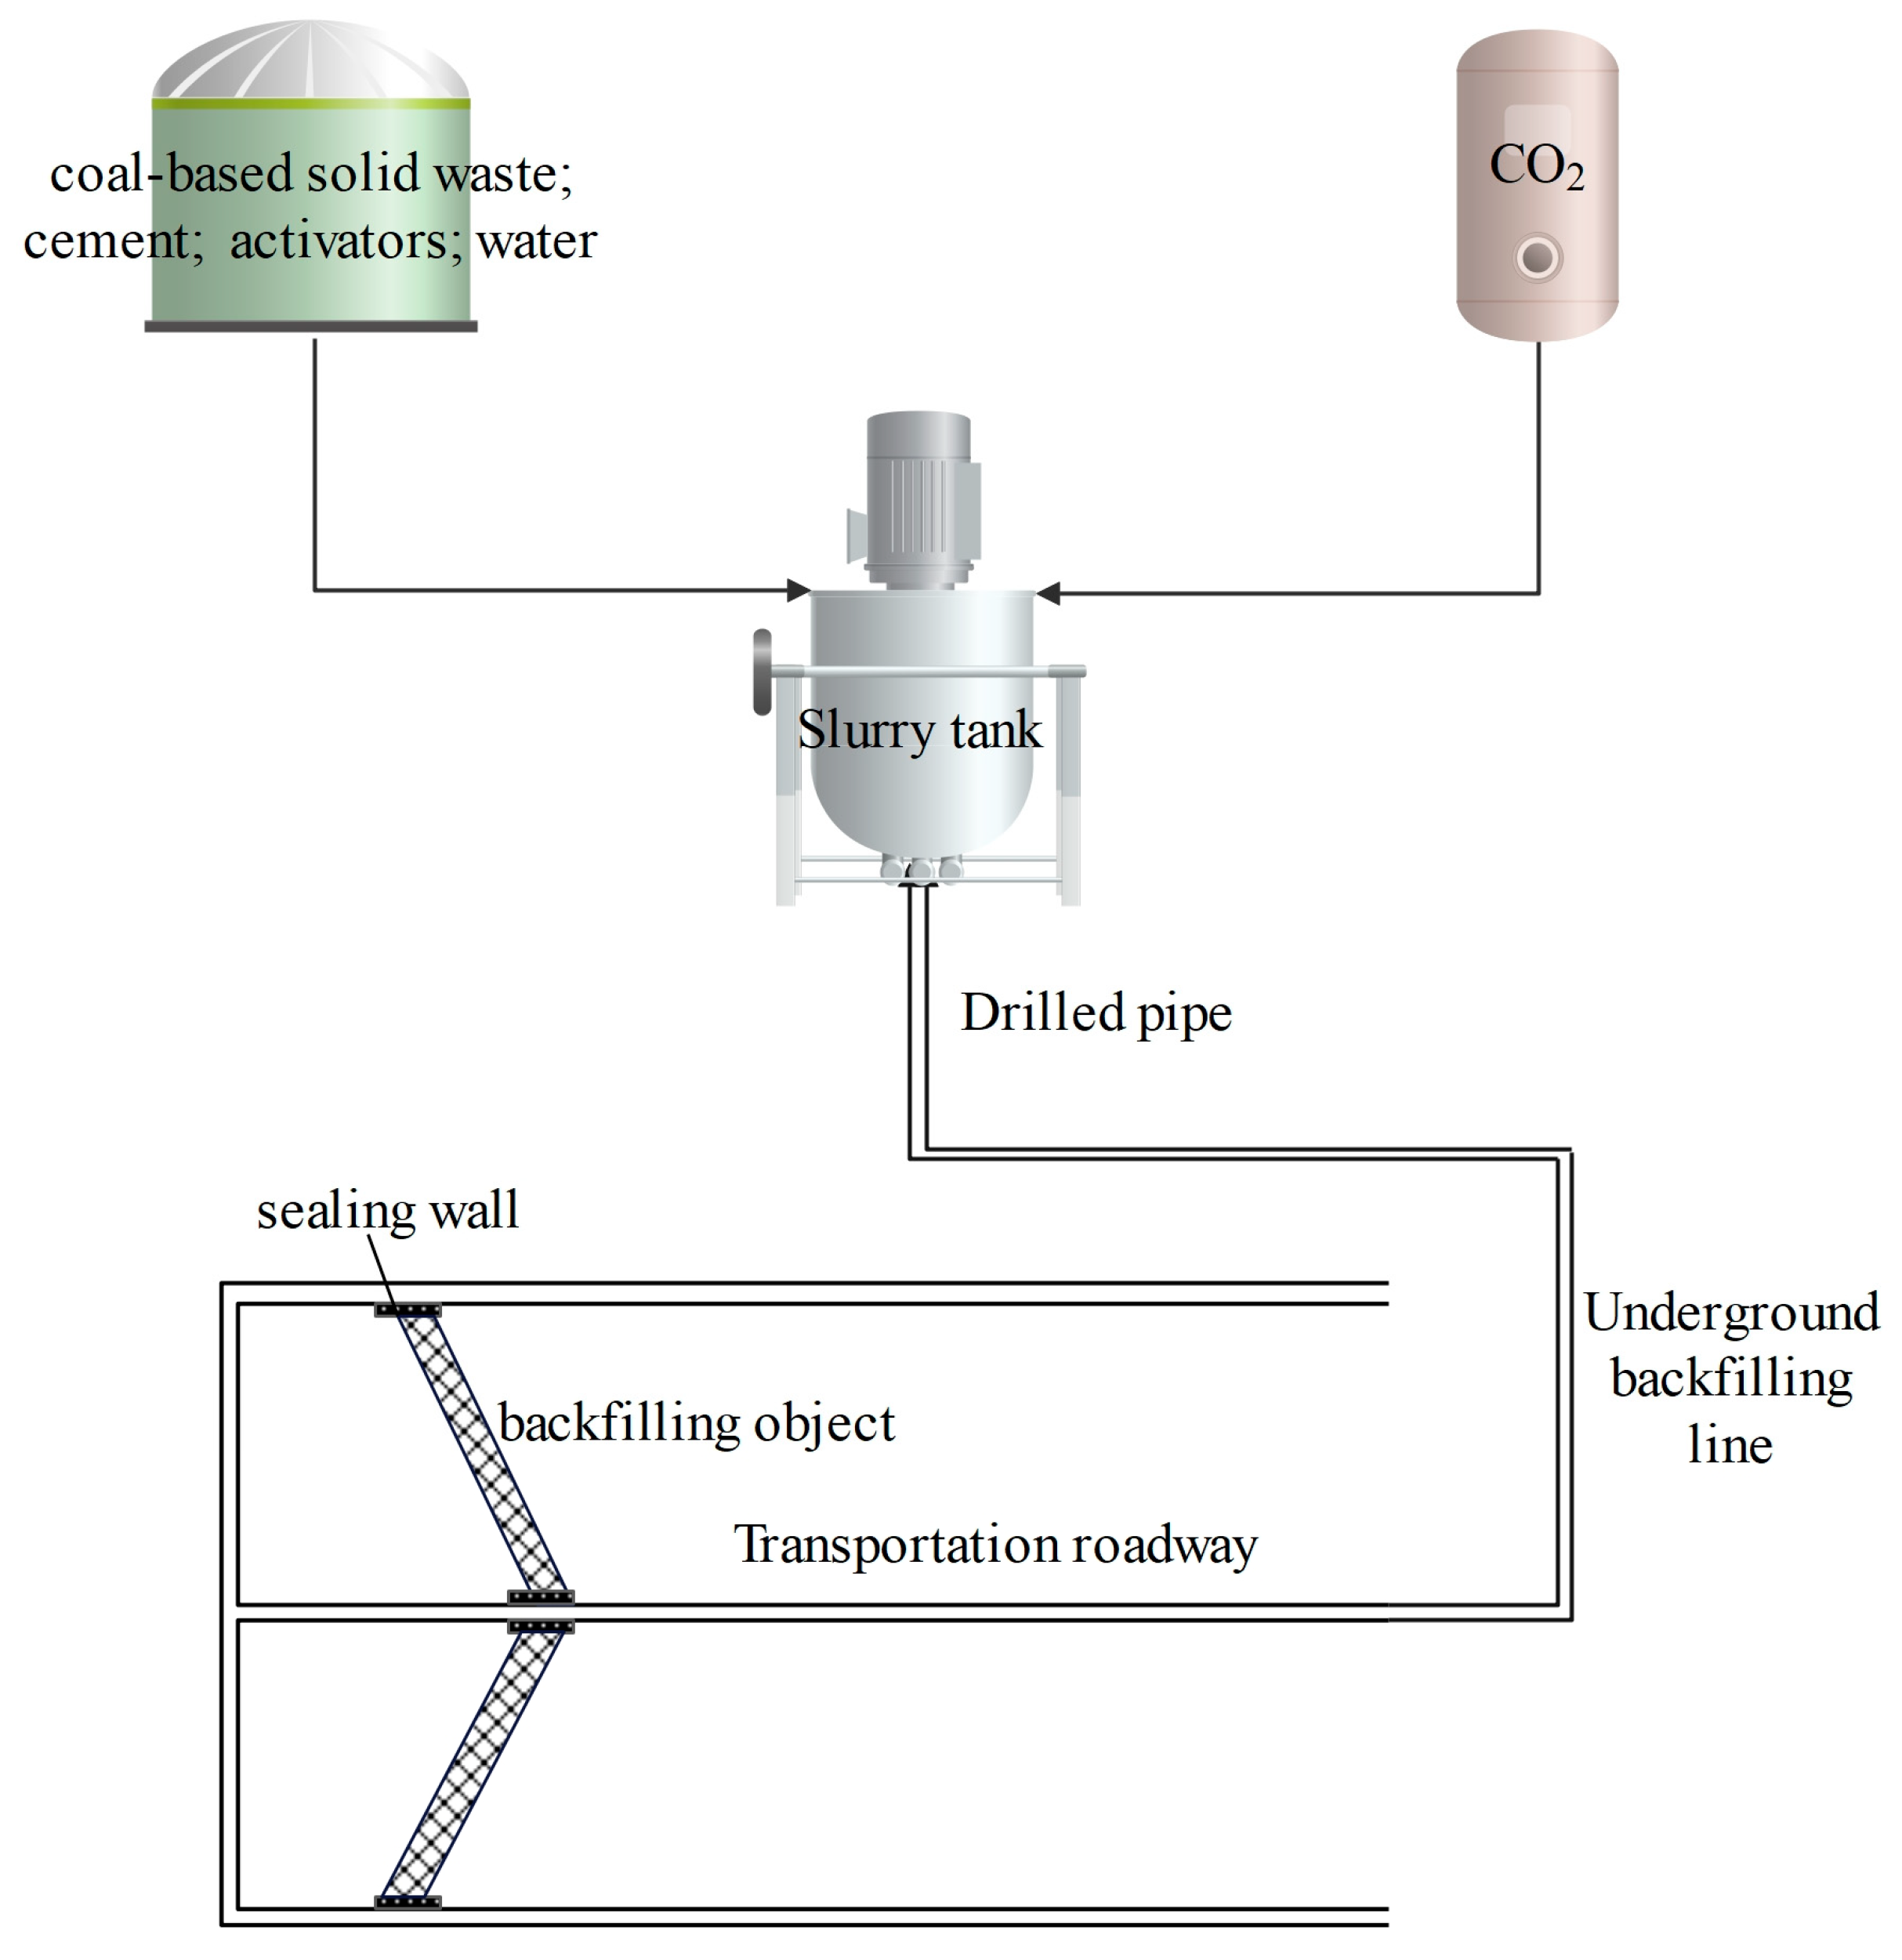
4.3.2. Backfill System

The backfilling system process mainly includes slurry preparation and pipeline transportation, as shown in Figure 9. Firstly, the early slurry is prepared by mixing the aggregate, water, and additives in the set proportion on the slurry tank, making sure to mix well; secondly, a CO2 rate of 1.0 L/min is introduced into the slurry tank and stirred continuously. After about half an hour, the backfilling slurry is transported to the empty branch roadway of the stope by gravity flow and underground pumping as power. Finally, the backfilling pipeline is cleaned.
Figure 10 illustrates the production system, which bears a resemblance to the wall-backfilling mining production system. This system primarily comprises the coal transport system, backfilling system, ventilation system, and other components. Using the ventilation system as an example, the dual-wing layout in the development drifts allows for ventilation route adjustment between the main and branch lanes by installing air doors in the cutting eye. During the backfilling process of the branch roadway of the stope, the air doors are opened to facilitate the delivery of fresh air through the first and second shafts, creating a W-shaped negative pressure ventilation throughout the entire working face. Subsequently, the contaminated air is expelled through the return airway via the third shaft.
Therefore, overall, the entire production system includes three major systems: coal mining, slurry backfilling, and ventilation. Each system has a clear division of labor, which can improve work efficiency. At the same time, the parallel working mode of mining and backfilling can not only reduce the impact of coal-based solid waste and CO2 on the surface environment but also effectively prevent surface subsidence and groundwater loss caused by coal mining, thereby effectively ensuring the personal safety of underground workers.

5. Discussion

5.1. Further Prospects

The authors’ research work has been pursuing the forefront of mining engineering and mine backfilling, covering the preparation of CO2 backfilling materials, monitoring of damage and fracture during the loading process of backfilling bodies, and optimization of underground backfilling methods, striving for research innovation at every stage. In the next sections, we conduct research in the following two specific areas, addressing the concerns triggered by this research work.

5.1.1. Optimize the CO2-Mineralized Coal-Based Solid Waste Program

In this research work, in addition to F and G, cement is also used, and cement is used as the existing underground aggregate backfilling material, which significantly increases the cost of backfilling. Therefore, the next step is to explore the reuse of industrial waste as a substitute for cement, such as demolished building construction wastes or soil containing heavy metals.

5.1.2. Temperature Change in the Reaction Stage of the CO2-Mineralization of Coal-Based Solid Waste

When backfilling the underground goaf, the backfilling material is transported to the goaf in the form of a slurry, and the flowing slurry is inevitably accompanied by a strong chemical reaction before solidification. The chemical reaction undergoes intense heat absorption and release, which may cause serious consequences such as gas explosion, rock burst, coal rock damage, and water inrush. Therefore, the next step is to explore the temperature index changes in the backfilling material before it is fully formed and speculate on the serious risks of employing this material.

5.2. Advantages and Disadvantages of Different Infrared Indicators

Presently, the average infrared radiation temperature (AIRT) displays a continuous rise type and rise to fall type while loading the bearing specimen, with noticeable variations. Nonetheless, as a precursor indicator for the failure of coal-based solid waste backfilling materials, its mutation is inadequate, the mutation amplitude is small, and accurately determining the mutation time point becomes challenging without clear and standardized infrared radiation anomaly information. This is because the generation of infrared radiation response information is closely related to the failure mode of the specimen. In cases where there is a thermal effect with contrasting trends occurring on the surface of the bearing specimen, specifically heating in the compressive stress area and cooling in the tensile stress area, the offsetting nature of these effects leads to a discrepancy and lack of synchronization between the infrared thermal image anomaly and the average infrared radiation temperature anomaly. Existing research usually takes the trend change (wave shape) of the average infrared radiation temperature curve of bearing coal and rock as the infrared radiation precursor for the failure and instability of bearing coal and rock. This infrared radiation precursor is not a unified conclusion (the average infrared radiation temperature precursor is divided into three types: transient cooling, heating acceleration, and descending to ascending). However, the subjective classification of these trends as precursors of infrared radiation lacks reliability without quantitative analysis. This method of identifying damage precursors is vulnerable to false alarms and is unsuitable for in situ rock engineering. To precisely identify the infrared radiation precursors associated with coal and rock damage, a quantitative analysis of the infrared radiation indicators is indispensable. The variance of successive minus infrared image temperature (VSMIT) exhibits a slight amplitude variation prior to the fracture (stress drop) of the bearing coal rock. As it nears the fracture, a sudden change occurs alongside the stress drop, and this mutation phenomenon is more pronounced compared to the variance of original infrared image temperature (VOIIT). Consequently, it provides a more accurate depiction of the evolution and differentiation characteristics of the infrared radiation temperature field during the fracture and failure process of the bearing coal rock. Therefore, the VSMIT is more advantageous for identifying the infrared radiation precursors of bearing coal and rock failure, making it easier to capture the precursors of bearing coal and rock failure. Therefore, the VSMIT is suitable as an indicator for searching for precursors of bearing coal and rock failure [46].
In fact, searching for the location of coal rock fractures based on the mutation of infrared indicators has been applied in engineering sites. Cui et al. applied explosion-proof infrared thermal imagers to conduct real-time non-destructive monitoring of the dynamic evolution process of fractures and microseepage in the top and bottom coal rock masses of the #15 coal seam in the Lingzhida Coal Mine, Shanxi, China. They used two temperature indicators, AIRT and VSMIT, to search for the fracture and seepage points of the top and bottom coal rock masses. At the same time, based on the actual situation on site, the AIRT threshold of the #15 coal seam was set to 0.5 °C and the VSMIT threshold was set to 0.005532. According to the infrared indicator threshold, any place exceeding the threshold can be determined as the location of coal rock fracture and seepage water, thus determining the high-risk area for water inrush disasters [52].

5.3. Temperature Change Mechanism of the Backfill Rupture Process

According to the first law of thermodynamics, the total energy input to the specimen mainly includes elastic strain energy, plastic strain energy, friction, and other process loss energy. The entire loading and fracturing process of backfill roughly goes through four stages: microcrack pressure closure, elastic deformation stage, plastic deformation (stable crack propagation stage), and failure instability (unstable crack propagation until failure stage) [45].

5.3.1. Thermal Effect during Pore Compaction Stage

When the stress on the specimen is relatively small and the loading is in the pore compaction stage, the system can theoretically be regarded as adiabatic compression. According to the first law of thermodynamics, as the gas volume decreases, the internal energy of the system increases, and as a result the temperature and pressure increase. Assuming that the initial gas temperature is T 1 , the pressure is P1, and the volume is V1, during the adiabatic process, it is compressed to a volume of V2, a pressure of P2, and a temperature of T2. According to the ideal gas state equation of PV = nRT and a gas constant of R = 8.314, the temperature at the final state T 1 is as follows:
T 1 = T 2 T 1 = P 2 V 2 n R T 1

5.3.2. Thermal Effect during Elastic Deformation

According to the first law of thermodynamics, if the loading site is in the linear elastic stage and there are no other heat sources, the thermoelastic effect theory proposed by William Thomson can be used [53]. Based on the assumption of ideal viscoelastic materials and small perturbations, as well as the isotropic theory, the thermodynamic coupling can be described as follows:
ρ C v T , t = ρ r + d i v k g a r d T β : 4 D : E , t e T + S : E , t l
T 2 = T β δ i j ε i j ρ C p = K α ρ C p T σ 1
In the formula, ρ is the density; C v is the specific heat capacity at a constant volume; T , t is the time derivative of the absolute temperature; r is the heat source; d i v is the divergence operator; k is the thermal conductivity; g a r d is the garden gradient operator, β is the thermal expansion matrix coefficient; 4/D is the fourth order elastic stiffness tensor; E , t e and E , t l are the derivatives of elastic and inelastic strain tensors with respect to time, respectively; and S is the second Piola Kirchhoff stress tensor. In the formula, T 2 and T , respectively, represent the change in surface temperature of the solid material and the initial temperature; α is the coefficient of linear expansion; σ 1 is the axial stress; C p is the specific heat capacity of the material; and K is the adjustment coefficient for the thermoelastic effect.
The equation above illustrates that in an adiabatic closed system, with low stress, the temperature variation in backfilling materials is influenced by parameters like initial temperature, specific heat capacity, thermal expansion coefficient, and principal stress acting on the backfilling materials. Moreover, the infrared radiation temperature on the surface of the backfilling materials is linearly related to its stress value. In theory, it can quantitatively characterize the relationship between the temperature and stress on the surface of the materials. To exemplify, a commonly observed physical phenomenon entails the temperature of samples rising as stress levels escalate, and correspondingly, decreasing as stress levels diminish. Nonetheless, the intricate nature of engineering geology introduces complications such as the microstructure characteristics of backfilling materials, including pores and microcracks, which often exhibit significant anisotropy and non-uniformity. Consequently, it becomes challenging to directly quantify the relationship between temperature and stress using the above equation. It is important to introduce a thermal elastic effect coefficient, denoted as K , which takes into account the anisotropy and non-uniformity of coal and rock. This coefficient allows for necessary adjustments to be made to the equation mentioned, resulting in a more accurate representation of the relationship between temperature and stress [54].

5.3.3. Thermal Effect in Plastic Deformation and Failure Stage

When the stress and strain of backfilling materials enter the plastic deformation and failure stage during loading, the thermal coupling effect becomes more complex compared to the linear elastic stage. In this stage, the lateral deformation rate of materials is greater than the vertical deformation rate, and cracks enter the unstable development stage. The volume strain rapidly increases, generating a large number of irreversible new cracks. The generation of these microcracks causes a friction thermal effect, leading to an increase in the material’s temperature [55]. The core principle underlying the thermal effect of friction can be concisely summarized as the production of heat through the plastic deformation of materials. In contrast to the elastic deformation work, the plastic deformation work will remain in the solid material after unloading, and 85% to 95% of the plastic deformation work will be transformed into deformation heat, thus increasing the temperature in the plastic deformation [42]. The formula is as follows:
J ρ C p T ˙ λ 2 y x 2 T = β ε p σ ε p , ε p , T ε p α E T ε e
β ε p = 1 n ε p ε 0 n 1
J ρ C p T ˙ = β ε p σ ε p , ε p , T ε p α E T ε e
T 3 = β ε p J ρ C p ε i ε i + 1 σ ε p , ε p , T d ε p 1 J ρ C p ε i ε i + 1 α E T d ε e
In the equations, J is the heat equivalent;  J ρ C p T ˙ is the temperature increase component; λ is the heat dissipation coefficient, λ 2 y x 2 T is the thermal conductivity component; ε p is the plastic strain; β ε p is the thermal effect coefficient; β ε p σ ε p , ε p , T ε p is the transformation component of the deformation work; E is the elastic modulus; ε e is the effective elastic strain rate; and α E T ε e is the latent heat component. It should be noted that while materials undergo frictional thermal effects under load, the temperature is easily affected by the physicochemical properties of the coal rock, such as water content, water pressure, strength, gas, and crack distribution. Therefore, it is necessary to introduce frictional thermal effect coefficients β ε p and make corrections.

6. Conclusions

(1)
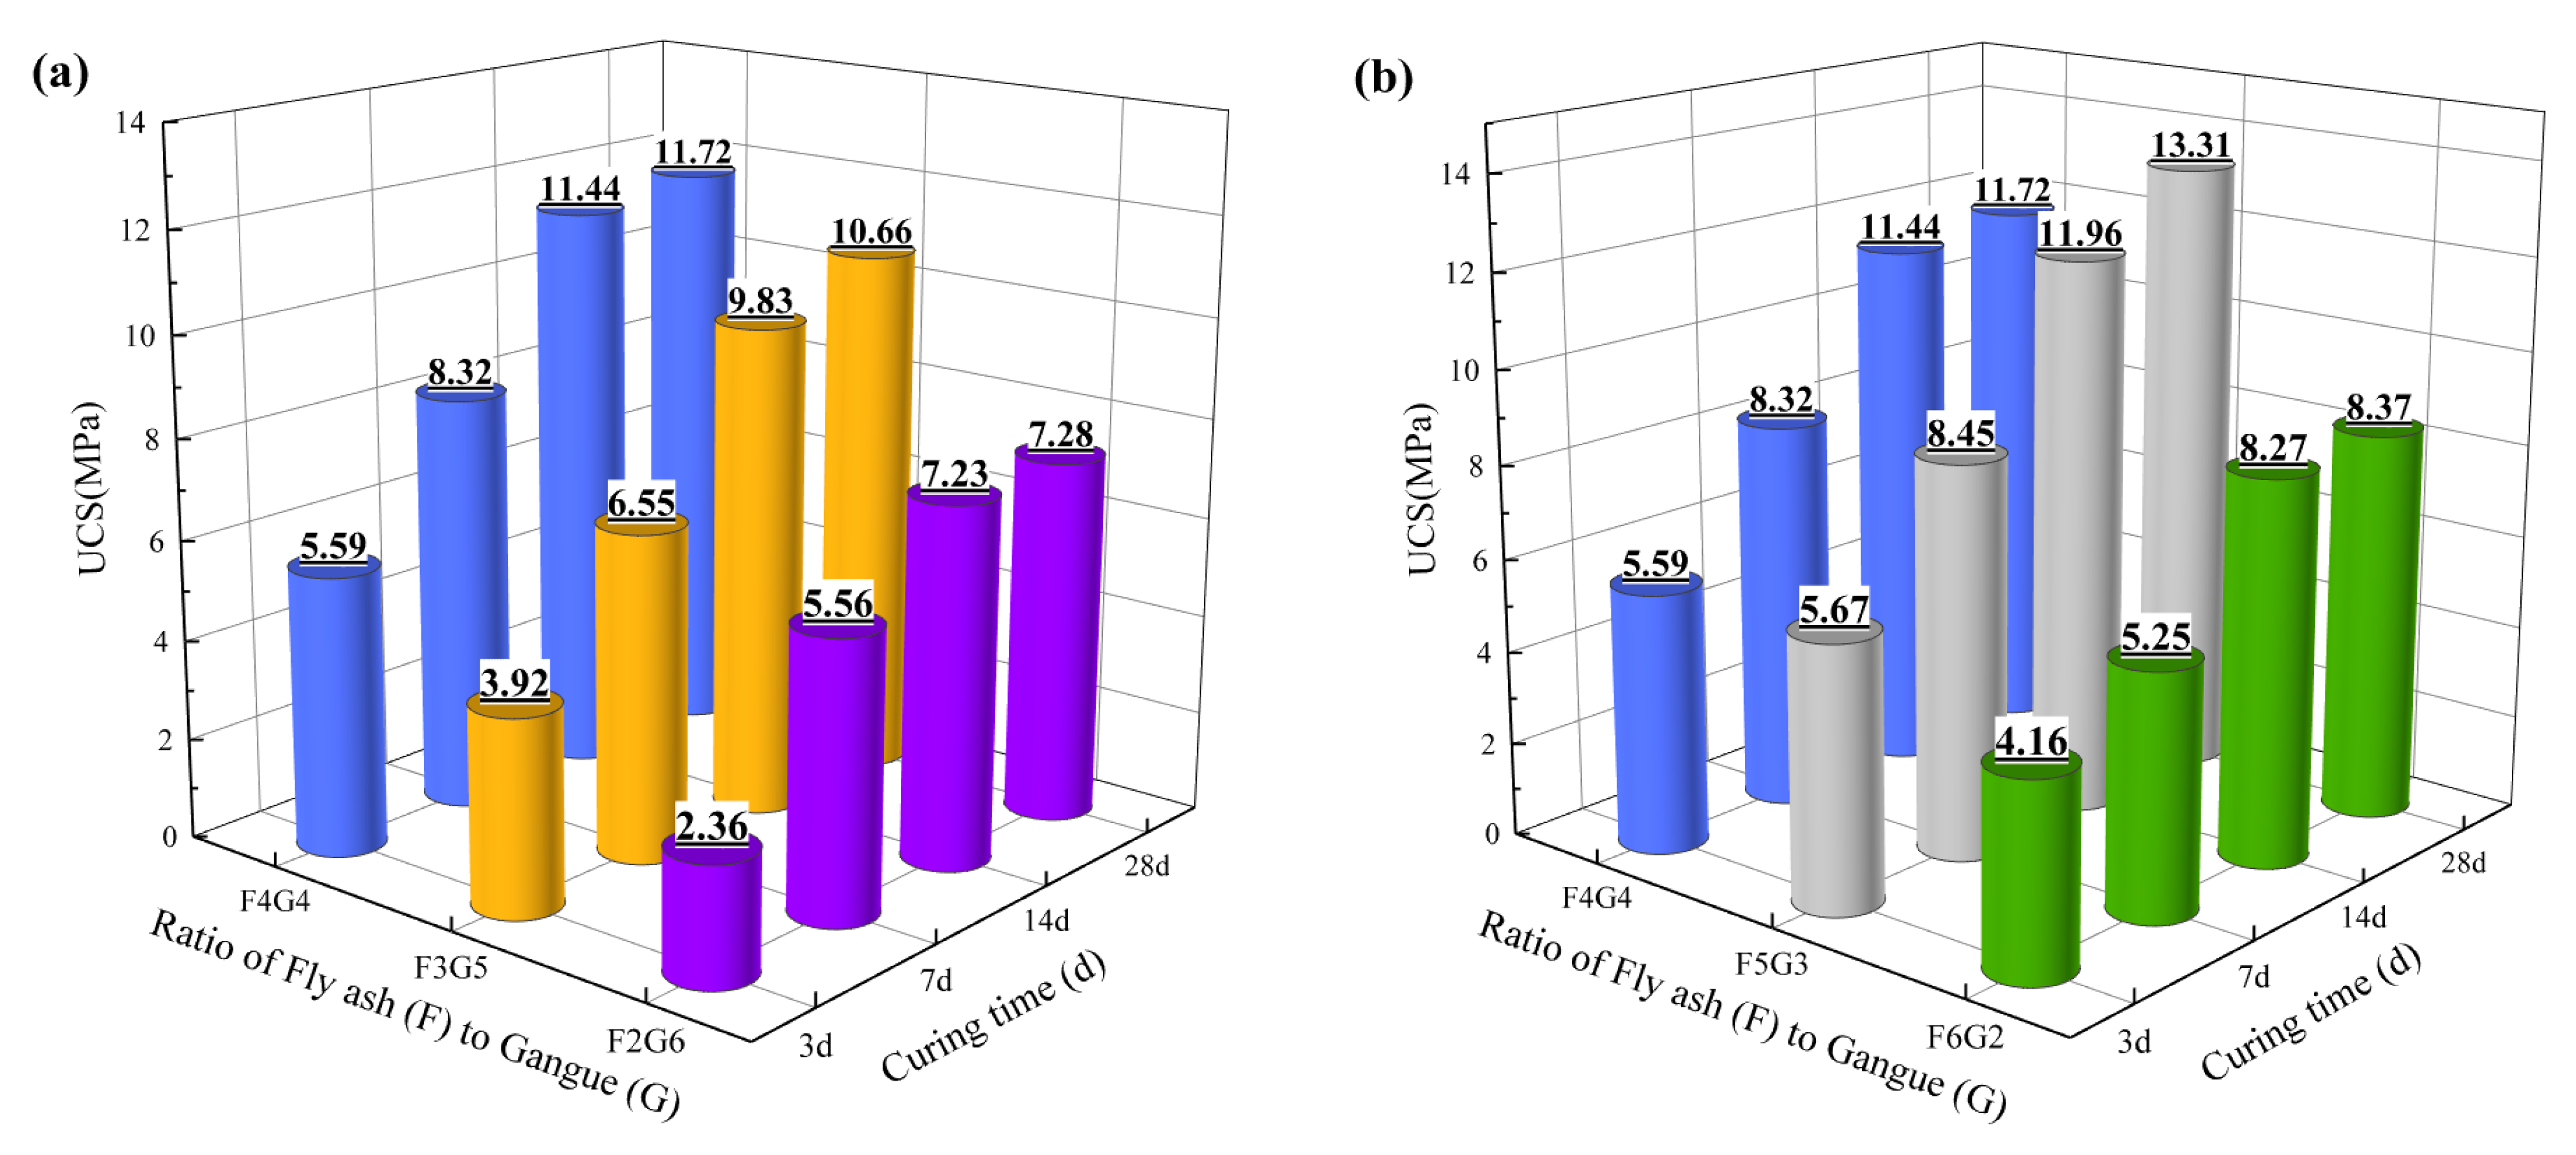
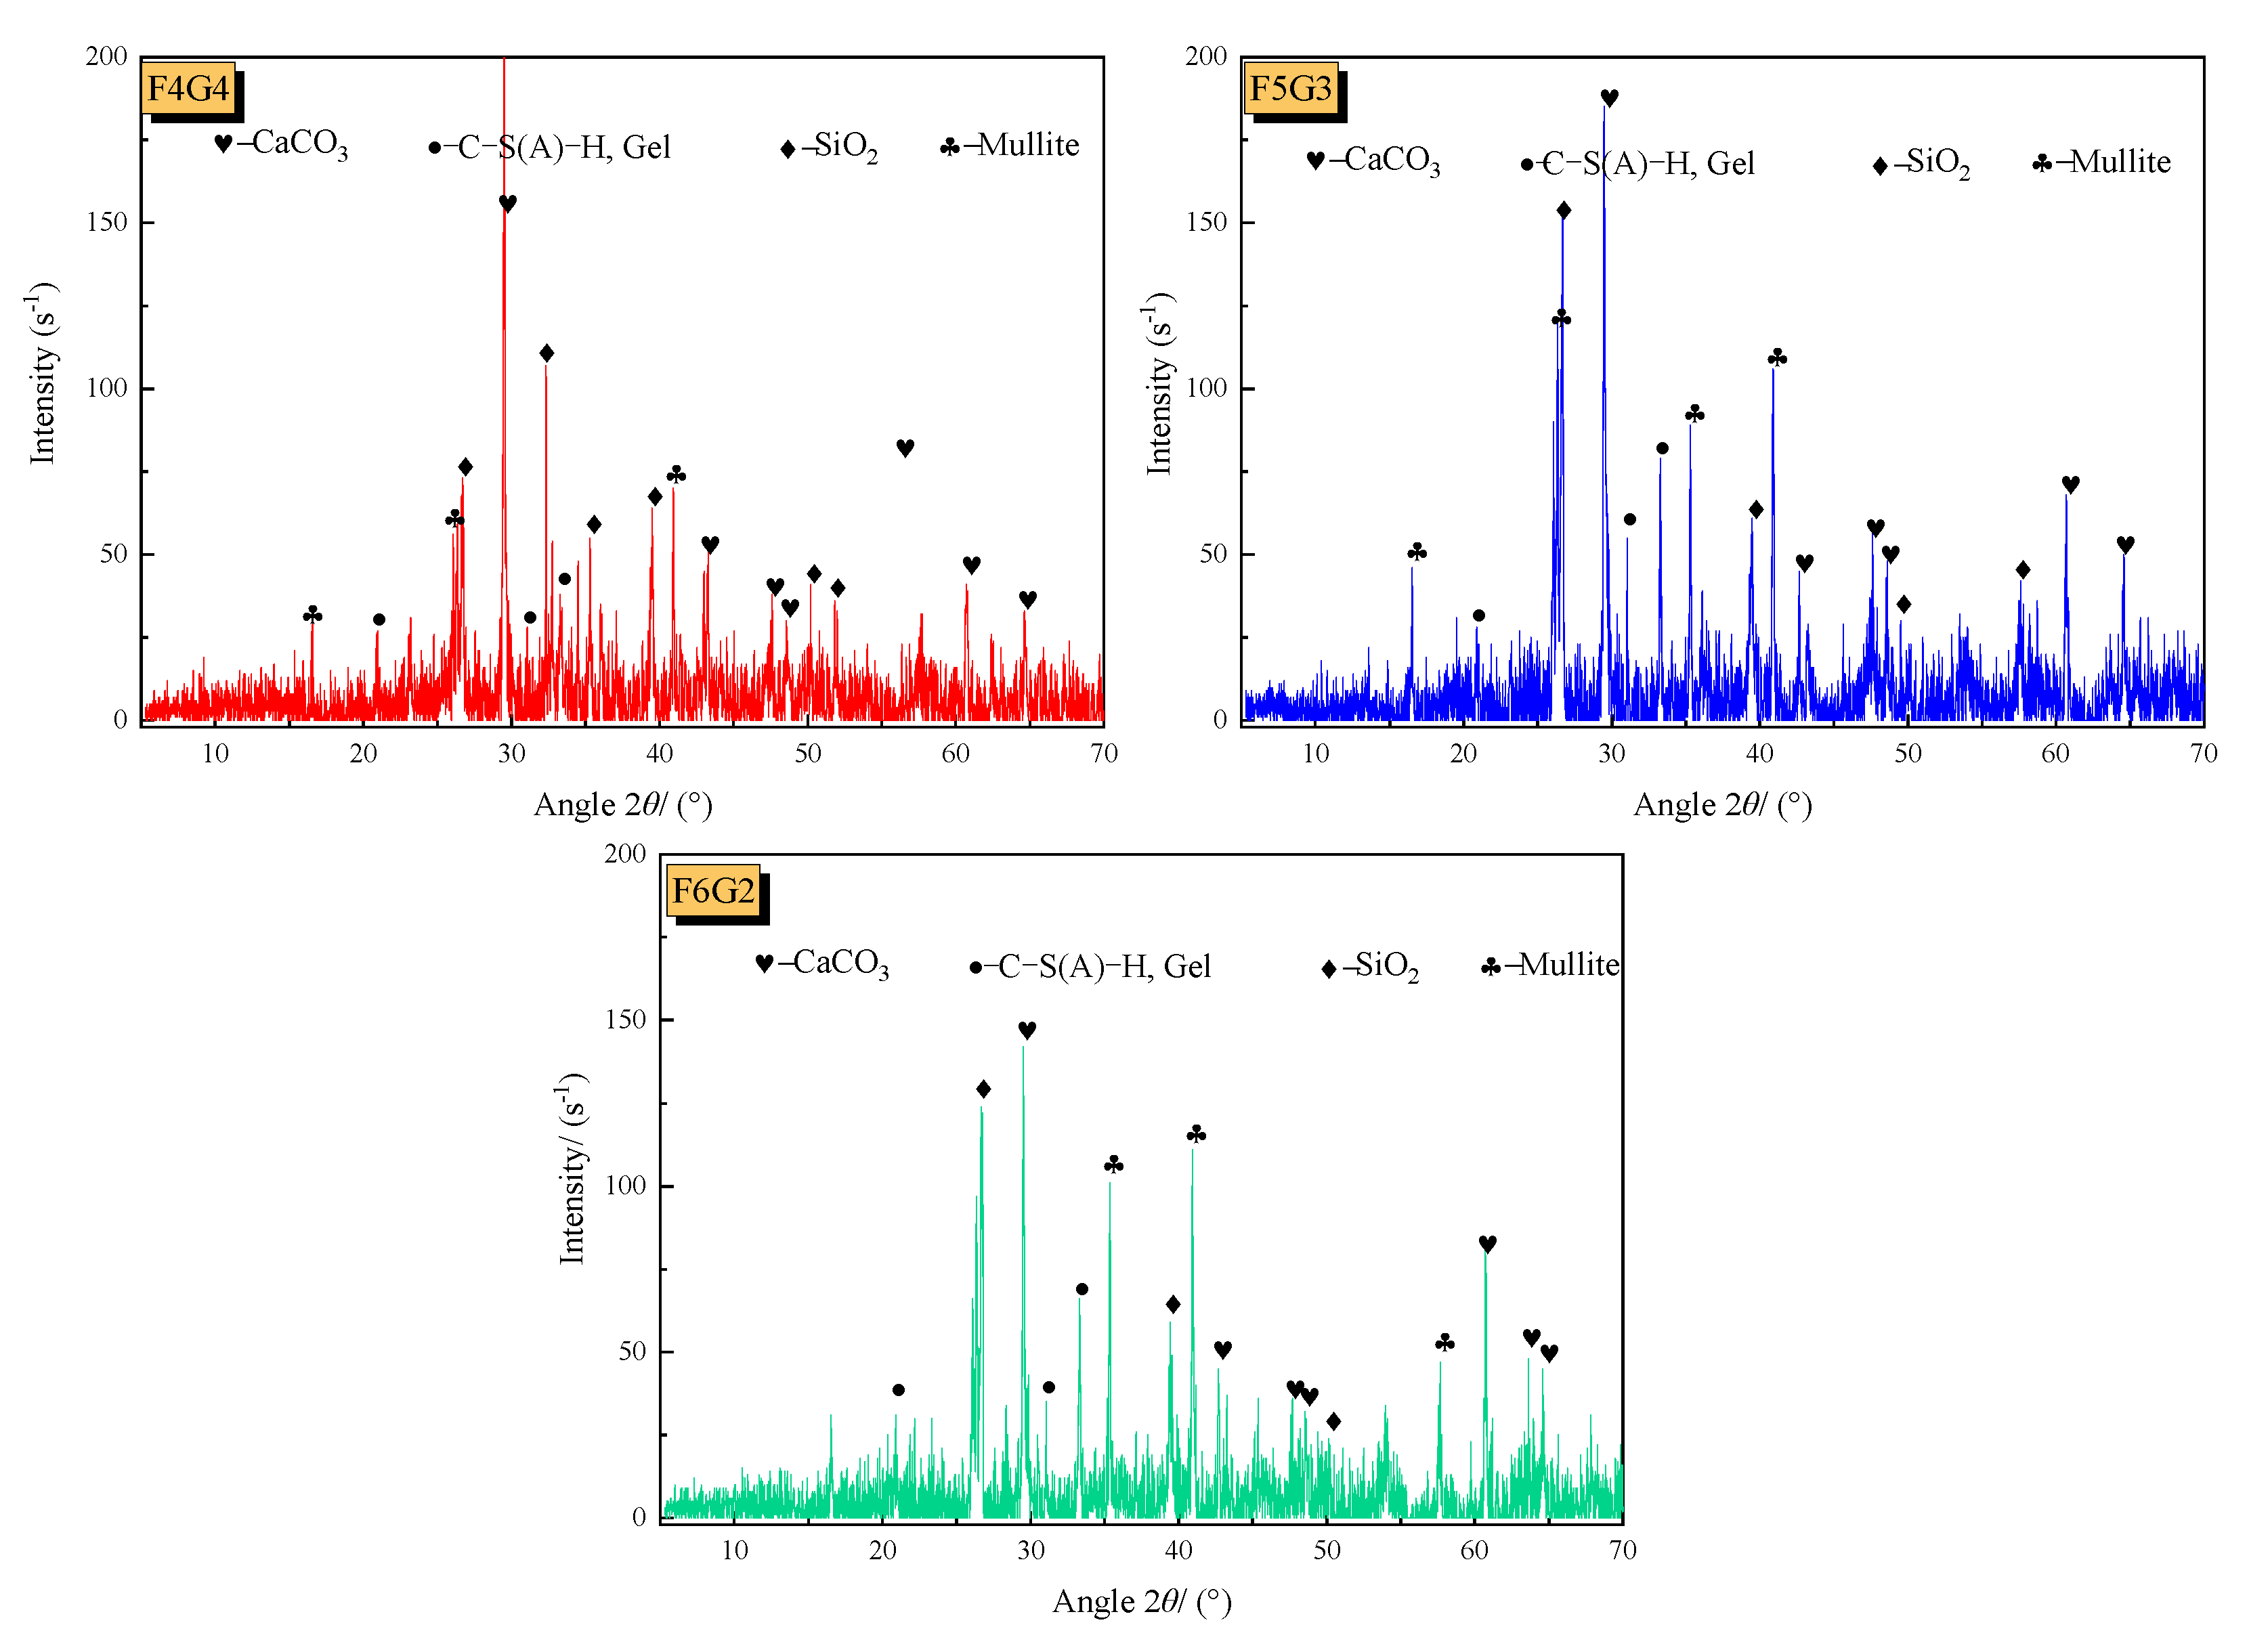
The UCS gradually increases with curing time, reaching basic stability at 14 days, with minimal changes in strength at 28 days compared to 14 days. Under the same curing time, the UCS of the F2G6 scheme is lower, while the mineralization effects of the F3G5, F4G4, and F5G3 schemes are relatively better; in particular, the UCS of the F5G3 scheme can reach up to 13.31 MPa, indicating that an increase in the ratio of fly ash (F) to coal gangue (G) can improve the strength of mineralized specimens to a certain extent. The XRD results indicate that hydration reactions ultimately produce gel structure (C-S-H) and calcium carbonate (CaCO3), both of which can effectively improve the strength of mineralized specimens.
(2)
The average infrared radiation temperature (AIRT) of mineralized samples exhibits a continuous rise during the loading process, and some samples demonstrate a sudden decrease in the AIRT during the severe damage stage, indicating a strong positive correlation between the AIRT and loading stress. In addition, the increase in the AIRT amplitude is mostly observed to rise with the increase in the ratio of F and G, with the highest temperature rise of up to 0.83 °C observed in the F5G3 sample, indicating that F exhibits larger temperature variations compared to G during the loading process.
(3)
The variance of original infrared image temperature (VOIIT) and the variance of successive minus infrared image temperature (VSMIT) can be used as sensitive response indicators for sample rupture. When the indicators fluctuate violently or rise rapidly, they reflect the expansion of internal cracks in the sample, proving that they can serve as precursors to severe sample failure.
(4)
The construction of parallel backfilling space for mining and backfilling can ensure that the branch roadways of the same mining stage are spaced apart from each other, and the coal mining and backfilling are always in an independent and stable working space, achieving efficient mining of coal resources, rapid backfilling of mineralized materials, and controlling the movement of overlying strata.

Author Contributions

Experimental work, methodology, data curation, writing, original draft, validation, G.C.; supervision, L.M.; funding acquisition, L.M.; editing, A.E.O.; review and editing, I.N.; review, Q.G.; investigation, K.Y.; investigation, Z.G. All authors have read and agreed to the published version of the manuscript.

Funding

This research was supported by the Research and Engineering Demonstration of Low Cost Large Scale Purification and Cascade Utilization Technology for Mining Brackish Water in the Zhundong Region under grant number 2023B03009 (Liqiang Ma), the Fundamental Research Funds for the Central Universities under grant number 2021ZDPY0211 (Liqiang Ma), the Key Laboratory of Xinjiang Coal Resources Green Mining of Ministry of Education (Xinjiang Institute of Engineering, grant number KLXGY-KA2403) (Ichhuy Ngo), and the National Natural Science Foundation of China under grant number 52250410338 (Ichhuy Ngo), and the National Natural Science Foundation of China under grant number 51874280 (Liqiang Ma).

Data Availability Statement

The data presented in this study are available on request from the corresponding author due to privacy and ethical restrictions to ensure lawful use of the data.

Conflicts of Interest

The authors declare no conflicts of interest.

References

  1. Xi, X.; Sang, S.; Liu, S. Progress in research of CO2 fixation and sequestration by coal mine solid waste mineralization and co-disposal of pollution and carbon reduction. J. China Coal Soc. 2023, 1075, 1–16. (In Chinese) [Google Scholar]
  2. Seifritz, W. CO2 Disposal by means of silicates. Nature 1990, 345, 486. [Google Scholar] [CrossRef]
  3. Mazzella, A.; Errico, M.; Spiga, D. CO2 uptake capacity of coal fly ash: Influence of pressure and temperature on direct gas-solid carbonation. J. Environ. Chem. Eng. 2016, 4, 4120–4128. [Google Scholar] [CrossRef]
  4. Baciocchi, R.; Costa, G.; Polettini, A.; Pomi, R.; Prigiobbe, V. Comparison of different reaction routes for carbonation of APC residues. Energy Procedia 2009, 1, 4851–4858. [Google Scholar] [CrossRef]
  5. Mayoral, M.C.; Andrés, J.M.; Gimeno, M.P. Optimization of mineral carbonation process for CO2 sequestration by lime-rich coal ashes. Fuel 2013, 106, 448–454. [Google Scholar] [CrossRef]
  6. Zhang, Y.; Cui, L.; Liu, Y.; Li, H.; Wang, Z.; Lang, Z. Comparison of three typical industrial solid wastes on the performance of CO2 mineralization and sequestration. Chin. J. Environ. Eng. 2021, 15, 2344–2355. (In Chinese) [Google Scholar]
  7. Ren, G.; Liao, H.; Wu, H.; Gao, H.; Yan, Z.; Cheng, F. Carbonation characteristics of fly ash, carbide slag and their mixtures. Chin. J. Environ. Eng. 2018, 12, 2295–2300. (In Chinese) [Google Scholar]
  8. Chang, E.E.; Pan, S.Y.; Chen, Y.H.; Chu, H.W.; Wang, C.F.; Chiang, P.C. CO2 sequestration by carbonation of steelmaking slags in an autoclave reactor. J. Hazard. Mater. 2011, 195, 107–114. [Google Scholar] [CrossRef] [PubMed]
  9. Ma, L.; Zhai, J.; Ngo, I. Experimental study on preparation of negative carbon filling material for water protection mining by CO2 mineralization of coal-based solid waste. J. China Coal Soc. 2022, 47, 4228–4236. (In Chinese) [Google Scholar]
  10. Devaraj, V.; Mangottiri, V.; Balu, S. Prospects of sustainable geotechnical applications of manufactured sand slurry as controlled low strength material. Constr. Build. Mater. 2023, 400, 132747. [Google Scholar] [CrossRef]
  11. Devaraj, V.; Mangottiri, V.; Balu, S. Sustainable Approach for Using M-Sand Slurry as a Controlled Low Strength Material. J. Solid Waste Technol. Manag. 2023, 49, 333–339. [Google Scholar] [CrossRef]
  12. Do, T.M.; Kang, G.O.; Go, G.H.; Kim, Y.S. Evaluation of Coal Ash–Based CLSM Made with Cementless Binder as a Thermal Grout for Borehole Heat Exchangers. J. Mater. Civ. Eng. 2019, 31, 04019027. [Google Scholar] [CrossRef]
  13. Devaraj, V.; Mangottiri, V.; Balu, S. Sustainable utilization of industrial wastes in controlled low-strength materials: A review. Environ. Sci. Pollut. Res. 2023, 30, 14008–14028. [Google Scholar] [CrossRef] [PubMed]
  14. Chen, T.; Yuan, N.; Wang, S.; Hao, X.; Zhang, X.; Wang, D.; Yang, X. The Effect of Bottom Ash Ball-Milling Time on Properties of Controlled Low-Strength Material Using Multi-Component Coal-Based Solid Wastes. Sustainability 2022, 14, 9949. [Google Scholar] [CrossRef]
  15. Chen, T.; Yuan, N.; Wang, S.; Zhang, X.; Lin, C.; Wu, X.; Wang, Q.; Wang, D. Optimization of Controlled Low-Strength Material from Multi-Component Coal-Based Solid Waste. Sustainability 2024, 16, 1513. [Google Scholar] [CrossRef]
  16. Liu, J.; Yao, Y.; Elsworth, D. Morphological complexity and azimuthal disorder of evolving pore space in low-maturity oil shale during in-situ thermal upgrading and impacts on permeability. Pet. Sci. 2024, 03.020, 1–13. [Google Scholar] [CrossRef]
  17. Das, S.K.; Mahamaya, M.; Reddy, K.R. Coal mine overburden soft shale as a controlled low strength Material. Int. J. Min. Reclam. Environ. 2020, 34, 725–747. [Google Scholar] [CrossRef]
  18. Feng, J.; Zhang, Z.; Guan, W.; Wang, W.; Xu, X.; Song, Y.; Liu, H.; Su, H.; Zhao, B.; Hou, D. Review of the Backfill Materials in Chinese Underground Coal Mining. Minerals 2023, 13, 473. [Google Scholar] [CrossRef]
  19. Lai, X.; Sun, H.; Shan, P.; Wang, C.; Cui, N.; Yang, Y. Acoustic emission and temperature variation in failure process of hard rock pillars sandwiched between thick coal seams of extremely steep. Chin. J. Rock Mech. Eng. 2015, 34, 2285–2292. (In Chinese) [Google Scholar]
  20. Wang, S.; Sun, Q.; Qiao, J.; Wang, S. Geological guarantee of coal green mining. J. China Coal Soc. 2020, 45, 8–15. (In Chinese) [Google Scholar]
  21. Wu, Q.; Tu, K.; Zeng, Y.; Liu, S. Discussion on the main problems and countermeasures for building an upgrade version of main energy (coal) industry in China. J. China Coal Soc. 2019, 44, 1625–1636. (In Chinese) [Google Scholar]
  22. Zhang, Q.; Zhang, J.; Wu, Z.; Chen, Y.; Xia, K.; Liu, H. Function relational expression of backfilled body’s density and its influencing factors. Energy Sources 2019, 43, 2218–2234. [Google Scholar] [CrossRef]
  23. Kim, J.; Lee, K.; Cho, W.; Choi, H.; Cho, G. A Comparative Evaluation of Stress–Strain and Acoustic Emission Methods for Quantitative Damage Assessments of Brittle Rock. Rock Mech. Rock Eng. 2015, 48, 495–508. [Google Scholar] [CrossRef]
  24. Wu, X.; Gao, X.; Liu, X.; Zhao, K. Abnormality of infrared temperature mutation in the process of saturated siltstone failure. J. China Coal Soc. 2015, 40, 328–336. (In Chinese) [Google Scholar]
  25. Zhang, D.; Fan, G.; Liu, Y.; Ma, L. Field trials of aquifer protection in longwall mining of shallow coal seams in China. Int. J. Rock Mech. Min. Sci. 2010, 47, 908–914. [Google Scholar] [CrossRef]
  26. Sun, X.; Xu, H.; He, M.; Zhang, F. Experimental investigation of the occurrence of rockburst in a rock specimen through infrared thermography and acoustic emission. Int. J. Rock Mech. Min. Sci. 2017, 93, 250–259. [Google Scholar] [CrossRef]
  27. Cao, K.; Dong, F.; Liu, W.; Khan, N.; Cui, R.; Li, X.; Hussain, S.; Alarifi, S.; Niu, D. Infrared radiation denoising model of “sub-region-Gaussian kernel function” in the process of sandstone loading and fracture. Infrared Phys. Technol. 2023, 129, 104583. [Google Scholar] [CrossRef]
  28. Blokhin, D.I.; Sheinin, V.I. Thermomechancal effects in different geomaterials in limiting behavior of cyclic loading. IOP Conf. Ser. Earth Environ. Sci. 2021, 773, 012055. [Google Scholar] [CrossRef]
  29. Ngo, I.; Ma, L.; Zhai, J.; Wang, Y.; Wei, T.; Ni, Y. Experimental Investigation of CO2-Induced Silica Gel as the Water Blocking Grout Effect of Aquifer Ions. ACS Omega 2022, 7, 27090–27101. [Google Scholar] [CrossRef]
  30. Liu, H.; Wang, C.; Zhou, C.; Song, L.; Ma, K.; Yue, H. Gas and slurry flow behaviors in a CO2-mineralization spray tower reactor. ALCHE J. 2023, 70, e18329. [Google Scholar] [CrossRef]
  31. Yuan, Y.; Lu, W.; Cheng, W.; Qi, G.; Hu, X.; Su, H.; Wang, M.; Zhang, M.; Liang, Y. Method for rapid mineralization of CO2 with carbide slag in the constant-pressure and continuous-feed way and its reaction heat. Powder Technol. 2022, 398, 117148. [Google Scholar] [CrossRef]
  32. Lu, Y.; Li, S.; Tian, Y.; Meng, Y.; Chen, H.; Shi, W. The Effect of Alkali Activator on the Properties of Super Sulfate Cement and Concrete. Fly Ash Compr. Util. 2020, 34, 1–6. (In Chinese) [Google Scholar]
  33. Luo, X.; Wei, C.; Li, X.; Deng, Z.; Li, M.; Fan, G. A green approach to prepare polymorph CaCO3 for clean utilization of salt gypsum residue and CO2 mineralization. Fuel 2023, 333, 126305. [Google Scholar] [CrossRef]
  34. Hao, T.; Li, F.; Tang, Y.; Wang, Z.; Zhao, L. Infrared radiation characterization of damaged coal rupture based on stress distribution and energy. ACS Omega 2022, 7, 28545–28555. [Google Scholar] [CrossRef] [PubMed]
  35. Pratiwi, W.D.; Ekaputri, J.J.; Fansuri, H. Combination of precipitated-calcium carbonate substitution and dilute-alkali fly ash treatment in a very high-volume fly ash cement paste. Constr. Build. Mater. 2020, 234, 117273. [Google Scholar] [CrossRef]
  36. Ling, Q.; Mao, X.; Cui, Y.; Bao, J.; Sant, G.; Chen, T.; Zhang, P.; Gao, X.; Bauchy, M. New insights into the early stage nucleation of calcium carbonate gels by reactive molecular dynamics simulations. J. Chem. Phys. 2022, 157, 234501. [Google Scholar]
  37. Ho, H.J.; Lizuka, A.; Shibata, E. Utilization of low-calcium fly ash via direct aqueous carbonation with a low-energy input: Determination of carbonation reaction and evaluation of the potential for CO2 sequestration and utilization. J. Environ. Manag. 2021, 288, 112411. [Google Scholar] [CrossRef] [PubMed]
  38. Deng, N.; Qiao, L.; Li, Q.; Hao, J.; Wu, S. A Method to Predict Rock Fracture with Infrared Thermography Based on Heat Diffusion Analysis. Geofluids 2021, 2021, 6669016. [Google Scholar] [CrossRef]
  39. Liu, Y.; Wang, C.; Li, X. Coupling Study of Acoustic Emission and Infrared Radiation in Sandstone under Water-Rock Interaction. J. Yangtze River Sci. Res. Inst. 2022, 39, 127–133. (In Chinese) [Google Scholar]
  40. Li, F.; Hao, T.; Wang, G.; Tang, Y.; Yuan, M.; Zhao, L. Mechanical Properties and Fractal Characteristics of Fractured Coal Under Different Gas Pressures. Nat. Resour. Res. 2024, 33, 793–812. [Google Scholar] [CrossRef]
  41. Ma, L.; Sun, H.; Zhang, Y.; Hu, H.; Zhang, C. The Role of Stress in Controlling Infrared Radiation during Coal and Rock Failures; Wiley & Sons Ltd.: Hoboken, NJ, USA, 2018; Volume 54, pp. 1–12. [Google Scholar]
  42. Nie, X.; Xiao, B.; Shen, D.; Guo, W. Research on thermal-mechanical stamping forming considering deformation heat and friction heat effect. China Mech. Eng. 2020, 31, 2005–2015. (In Chinese) [Google Scholar]
  43. Prendes, G.; Suárez, D.; González, C.; Alvarez, F. Infrared thermography methodology applied to detect localized rockfalls in self-supporting underground mines. In Rock Mechanics for Resources, Energy and Environment; CRC Press: Boca Raton, FL, USA, 2013; pp. 825–829. [Google Scholar]
  44. Ma, L.; Sun, H. Spatial-temporal infrared radiation precursors of coal failure under uniaxial compressive loading. Infrared Phys. Technol. 2018, 93, 144–153. [Google Scholar] [CrossRef]
  45. Sun, H.; Ma, L.; Liu, W.; Spearing, A.J.S.; Han, J.; Fu, Y. The response mechanism of acoustic and thermal effect when stress causes rock damage. Appl. Acoust. 2021, 180, 108093. [Google Scholar] [CrossRef]
  46. Cui, R.; Cao, K.; Li, X.; Khan, R.M.A.; Khan, N.M.; Liu, W.; Gao, Q.; Wang, F.; Yang, Y.; Quan, J.; et al. The Infrared Radiation Characteristics of Sandstone Fracture Seepage under Coupled Stress-Hydro Effect. Sustainability 2022, 14, 16454. [Google Scholar] [CrossRef]
  47. Ma, L.; Jin, Z.; Liu, W.; Zhang, D.; Zhang, Y. Wongawilli roadway backfilling coal mining method—A case study in Wangtaipu coal mine. Int. J. Oil Gas Coal Technol. 2019, 20, 342–359. [Google Scholar] [CrossRef]
  48. Peng, S.; Bi, Y. Strategic consideration and core technology about environmental ecological restoration in coal mine areas in the Yellow River basin of China. J. China Coal Soc. 2020, 45, 1211–1221. (In Chinese) [Google Scholar]
  49. Zong, T.; Zhu, G.; Zhang, Q.; Yang, K.; Wang, Y.; Han, Y.; Lv, H.; Gao, J. Solid Backfilling Efficiency Optimization in Coal Mining: Spatiotemporal Linkage Analysis and Case Study. Appl. Sci. 2023, 13, 12298. [Google Scholar] [CrossRef]
  50. Ma, L.; Zhang, D.; Wang, S.; Xie, Y.; Yu, Y. Water—Preserved mining with the method named “backfilling while mining”. J. China Coal Soc. 2018, 43, 62–69. (In Chinese) [Google Scholar]
  51. Lu, B.; Li, Y.; Fang, S.; Lin, H.; Zhu, Y. Cemented Backfilling Mining Technology for Gently Inclined Coal Seams Using a Continuous Mining and Continuous Backfilling Method. Shock Vib. 2021, 2021, 6652309. [Google Scholar] [CrossRef]
  52. Cui, R. Infrared Radiation Monitoring and Early Warning of Coal and Rock Fracture and Water Penetration or Inrush under Coupled Stress-Hydro Effect. Master′s Thesis, China University of Mining and Technology, Xuzhou, China, 2022. (In Chinese). [Google Scholar]
  53. Wang, D.; Zhou, F.; Dong, Y.; Sun, D.; Yu, B. Experimental Investigation of Thermal Effect on Fracability Index of Geothermal Reservoirs. Nat. Resour. Res. 2021, 30, 273–288. [Google Scholar] [CrossRef]
  54. Lin, H.; Deng, J.; Zhang, X.; Gao, J. Porothermoelastic Response of a Borehole in Fluid-Saturated Medium Subjected to Thermal Osmosis Effect. Geofluids 2023, 2023, 4030804. [Google Scholar] [CrossRef]
  55. Yuan, M.; Ouyang, J.; Zheng, S.; Tian, Y.; Sun, R.; Bao, R.; Li, T.; Yu, T.; Li, S.; Wu, D. Research on Ecological Effect Assessment Method of Ecological Restoration of Open-Pit Coal Mines in Alpine Regions. Int. J. Environ. Res. Public Health 2022, 19, 7682. [Google Scholar] [CrossRef]
Figure 1. Mineralized sample production process.
Minerals 14 00566 g001
Figure 2. Schematic diagram of infrared radiation information test method.
Minerals 14 00566 g002
Figure 3. Effect of the ratio of F to G and curing time of mineralized specimens on UCS: (a) samples of F2G6, F3G5, and F4G4; (b) samples of F4G4, F5G3, and F6G2.
Minerals 14 00566 g003
Figure 4. XRD images.
Minerals 14 00566 g004
Figure 5. The AIRT and load variation curves of specimens cured for 14 days in different mass ratios of F to G over time: (a) sample of F2G6; (b) sample of F3G5; (c) sample of F4G4; (d) sample of F5G3; (e): sample of F6G2.
Minerals 14 00566 g005aMinerals 14 00566 g005b
Figure 6. The curves of the VOIIT, VSMIT, and load over time of the samples after 14 days of curing: (a) sample of F2G6; (b) sample of F3G5; (c) sample of F4G4; (d) sample of F5G3; (e): sample of F6G2.
Minerals 14 00566 g006aMinerals 14 00566 g006b
Figure 7. The sequence of mining roadways: (a) mining stages; (b) stage 1/2/3/4 branch of stope; (c) stage 1/2/3/4 backfilling object; (d) complete backfilling.
Minerals 14 00566 g007
Figure 8. Backfilling operation in the branch of the stope.
Minerals 14 00566 g008
Figure 9. Technological process of backfilling.
Minerals 14 00566 g009
Figure 10. Production system diagram.
Minerals 14 00566 g010
Table 1. Main chemical constituents and contents of F, G, and cement.
Component NameCaOSiO2Al2O3Fe2O3K2OTiO2MgOSO3P2O3Others
F22.3%31.0%30.3%5.2%1.3%1.2%0.5%0.5%0.2%5.5%
G1.6%43.5%18.2% 3.6%1.1%0.5%0.7%2.1%0.2%29.2%
cement49.5%23.2%8.1% 3.2%0.9%0.5%4.6%4.1%0.1%5.4%
Table 2. Backfilling material ratio.
Scheme GroupSpecimen NumberMass Fraction of SolidsMass Fraction of LiquidSolid–Liquid Mass Fraction RatioCuring Time
/Day
FGCementAlkaline ActivatorWater
1-120%60%20%10%90%70%:30%3
F2G61-220%60%20%10%90%70%:30%7
1-320%60%20%10%90%70%:30%14
1-420%60%20%10%90%70%:30%28
2-130%50%20%10%90%70%:30%3
F3G52-230%50%20%10%90%70%:30%7
2-330%50%20%10%90%70%:30%14
2-430%50%20%10%90%70%:30%28
3-140%40%20%10%90%70%:30%3
F4G43-240%40%20%10%90%70%:30%7
3-340%40%20%10%90%70%:30%14
3-440%40%20%10%90%70%:30%28
4-150%30%20%10%90%70%:30%3
F5G34-250%30%20%10%90%70%:30%7
4-350%30%20%10%90%70%:30%14
4-450%30%20%10%90%70%:30%28
5-160%20%20%10%90%70%:30%3
F6G25-260%20%20%10%90%70%:30%7
5-360%20%20%10%90%70%:30%14
5-460%20%20%10%90%70%:30%28
Disclaimer/Publisher’s Note: The statements, opinions and data contained in all publications are solely those of the individual author(s) and contributor(s) and not of MDPI and/or the editor(s). MDPI and/or the editor(s) disclaim responsibility for any injury to people or property resulting from any ideas, methods, instructions or products referred to in the content.

