Article

Pore Structure and Heterogeneity Characteristics of Coal-Bearing Marine–Continental Transitional Shales from the Longtan Formation in the South Sichuan Basin, China

1
State Key Laboratory of Shale Oil and Gas Enrichment Mechanisms and Effective Development, Beijing 100083, China
2
Sinopec Key Laboratory of Shale Oil/Gas Exploration and Production Technology, Beijing 100083, China
3
Key Laboratory of Exploration Technologies for Oil and Gas Resources (Yangtze University), Ministry of Education, Wuhan 430100, China
4
College of Resources and Environment, Yangtze University, Wuhan 430100, China
5
Institute of Digital Geology and Energy, Linyi University, Linyi 276000, China
6
School of Resources and Environment (College of Carbon Neutrality), Linyi University, Linyi 276000, China
*
Author to whom correspondence should be addressed.
Minerals 2024, 14(6), 588; https://doi.org/10.3390/min14060588
Submission received: 25 April 2024 / Revised: 29 May 2024 / Accepted: 1 June 2024 / Published: 2 June 2024
(This article belongs to the Special Issue Distribution and Development of Faults and Fractures in Shales)

Abstract

:
Marine–continental transitional shale has become a new field for shale gas exploration and development in recent years. Its reservoir characteristics analysis lags significantly behind that of marine shale, which restricts the theoretical research on the accumulation of marine–continental transitional shale and the progress of exploration and development. The shale pore system is complex and has strong heterogeneity, which restricts the fine evaluation and optimization of the reservoir. Based on nitrogen adsorption–desorption experiments, the morphology and structural characteristics of coal-bearing shale pores were analyzed, and then the micro-pore structure heterogeneity was quantitatively characterized based on fractal theory and nitrogen adsorption–desorption data, and the relationship between pore structure parameters and their influence on fractal characteristics were discussed. The hysteresis loop of nitrogen desorption isotherm mainly belongs to type B, indicating ink bottle, flat plate, and slit are the main pore shapes. The pore size distribution curves are left unimodal or multimodal, with the main peak around 4 nm and 20–60 nm. Smaller pores develop a larger specific surface area, resulting in a high value of fractal dimension (2.564 to 2.677). The rougher the pore surface and the larger the specific surface area provide an adequate adsorption site for shale gas adsorption and aggregation. Thus, fractal characteristics conduced to understand the pore structure, heterogeneity, and gas-bearing property of coal-bearing shale.

1. Introduction

As one of the important unconventional resources, with several advantages, including being clean, efficient, and pollution-free, shale gas resources have received worldwide attention after the shale gas revolution in the United States [1,2,3,4,5,6]. In particular, significant progress has recently been made in theoretical research and exploration practice of shale gas in China [5,7,8]. Shale gas is mainly hosted on the surface of clay minerals and organic matter (OMs) and partly as free gas, which generally exists in the pores and fractures of shale [9,10,11,12,13,14]. Shale gas has self-generation and self-storage characteristics, while shale characteristics, such as low porosity and permeability, complex pore structure, and strong heterogeneity, greatly increase the difficulty of its exploitation [15,16,17,18,19,20,21]. Pore structure plays a crucial role in the evaluation of natural gas reservoirs. Pore volume, size diameter, and smoothness of pore surface influence the storage and seepage of reservoir [22,23,24,25,26,27,28]. As the larger the pore volume and size diameter increases, the smoother the pore surface and the better the reservoir and seepage properties of the pore network [29,30,31,32,33]. The investigation of pore structure parameters plays a significant role in researching the occurrence state, desorption–diffusion, and seepage effect of shale gas [34,35,36,37,38,39].
Shale pore structure not only affects the occurrence state of shale gas but also affects its storage performance [22,23,24,25,26]. Although there are many research results on shale pores, the research on the Longtan Formation shale of the marine–continental transitional phase lags significantly behind that of marine shale and continental shale [21,33,36,39]. The exploration and development of marine–terrestrial transitional shale is still in its initial stage. The cumulative thickness of marine–continental transitional shale is large, but the lithological phase changes rapidly, which creates complex shale gas accumulation conditions and brings greater uncertainty to shale gas exploration [9,21]. The exploration and research of marine–continental transitional shale gas in the Longtan Formation is currently in its infancy, and the shale gas storage conditions and enrichment rules are still unclear, which directly restricts the selection of favorable sweet spot intervals and exploration and development deployment of shale gas. The analysis of pore characteristics and pore heterogeneity characteristics of Longtan Formation shale gas reservoirs in southern Sichuan could provide an important reference for the gas-bearing evaluation and exploration and development of marine–continental transitional shale in the study area. Shale pores have various shapes and uneven distribution, which poses a challenge for the quantitative characterization of pore heterogeneity [40,41,42,43,44,45,46]. In order to quantitatively characterize the complexity and heterogeneity of porous media, fractal geometry theory has been proposed by predecessors [47,48,49,50,51,52]. The fractal dimension can quantitatively describe the self-similarity of the fractal system and is a key indicator to quantitatively characterize the heterogeneity and complexity of pore development, which is extremely important for shale reservoir evaluation. Based on fractal theory, the fractal dimension (D) value of three-dimensional European space ranges between 2 and 3 [51,52,53], and the fractal dimension is meaningless beyond this range. Theoretical values of 2 and 3 reflect the absolutely smooth, uniform, and extremely rough and complex structures, respectively [51,52,53,54,55,56]. In addition, the box dimension (DB) has finite stability, which is commonly suitable for fractal characterization of 2D images with or without self-similar characteristics. The fractal model is an important method for quantitatively characterizing the heterogeneity of the shale reservoir pore structure. It provides a new idea for studying the pore structure and adsorption–desorption mechanism of shale gas.

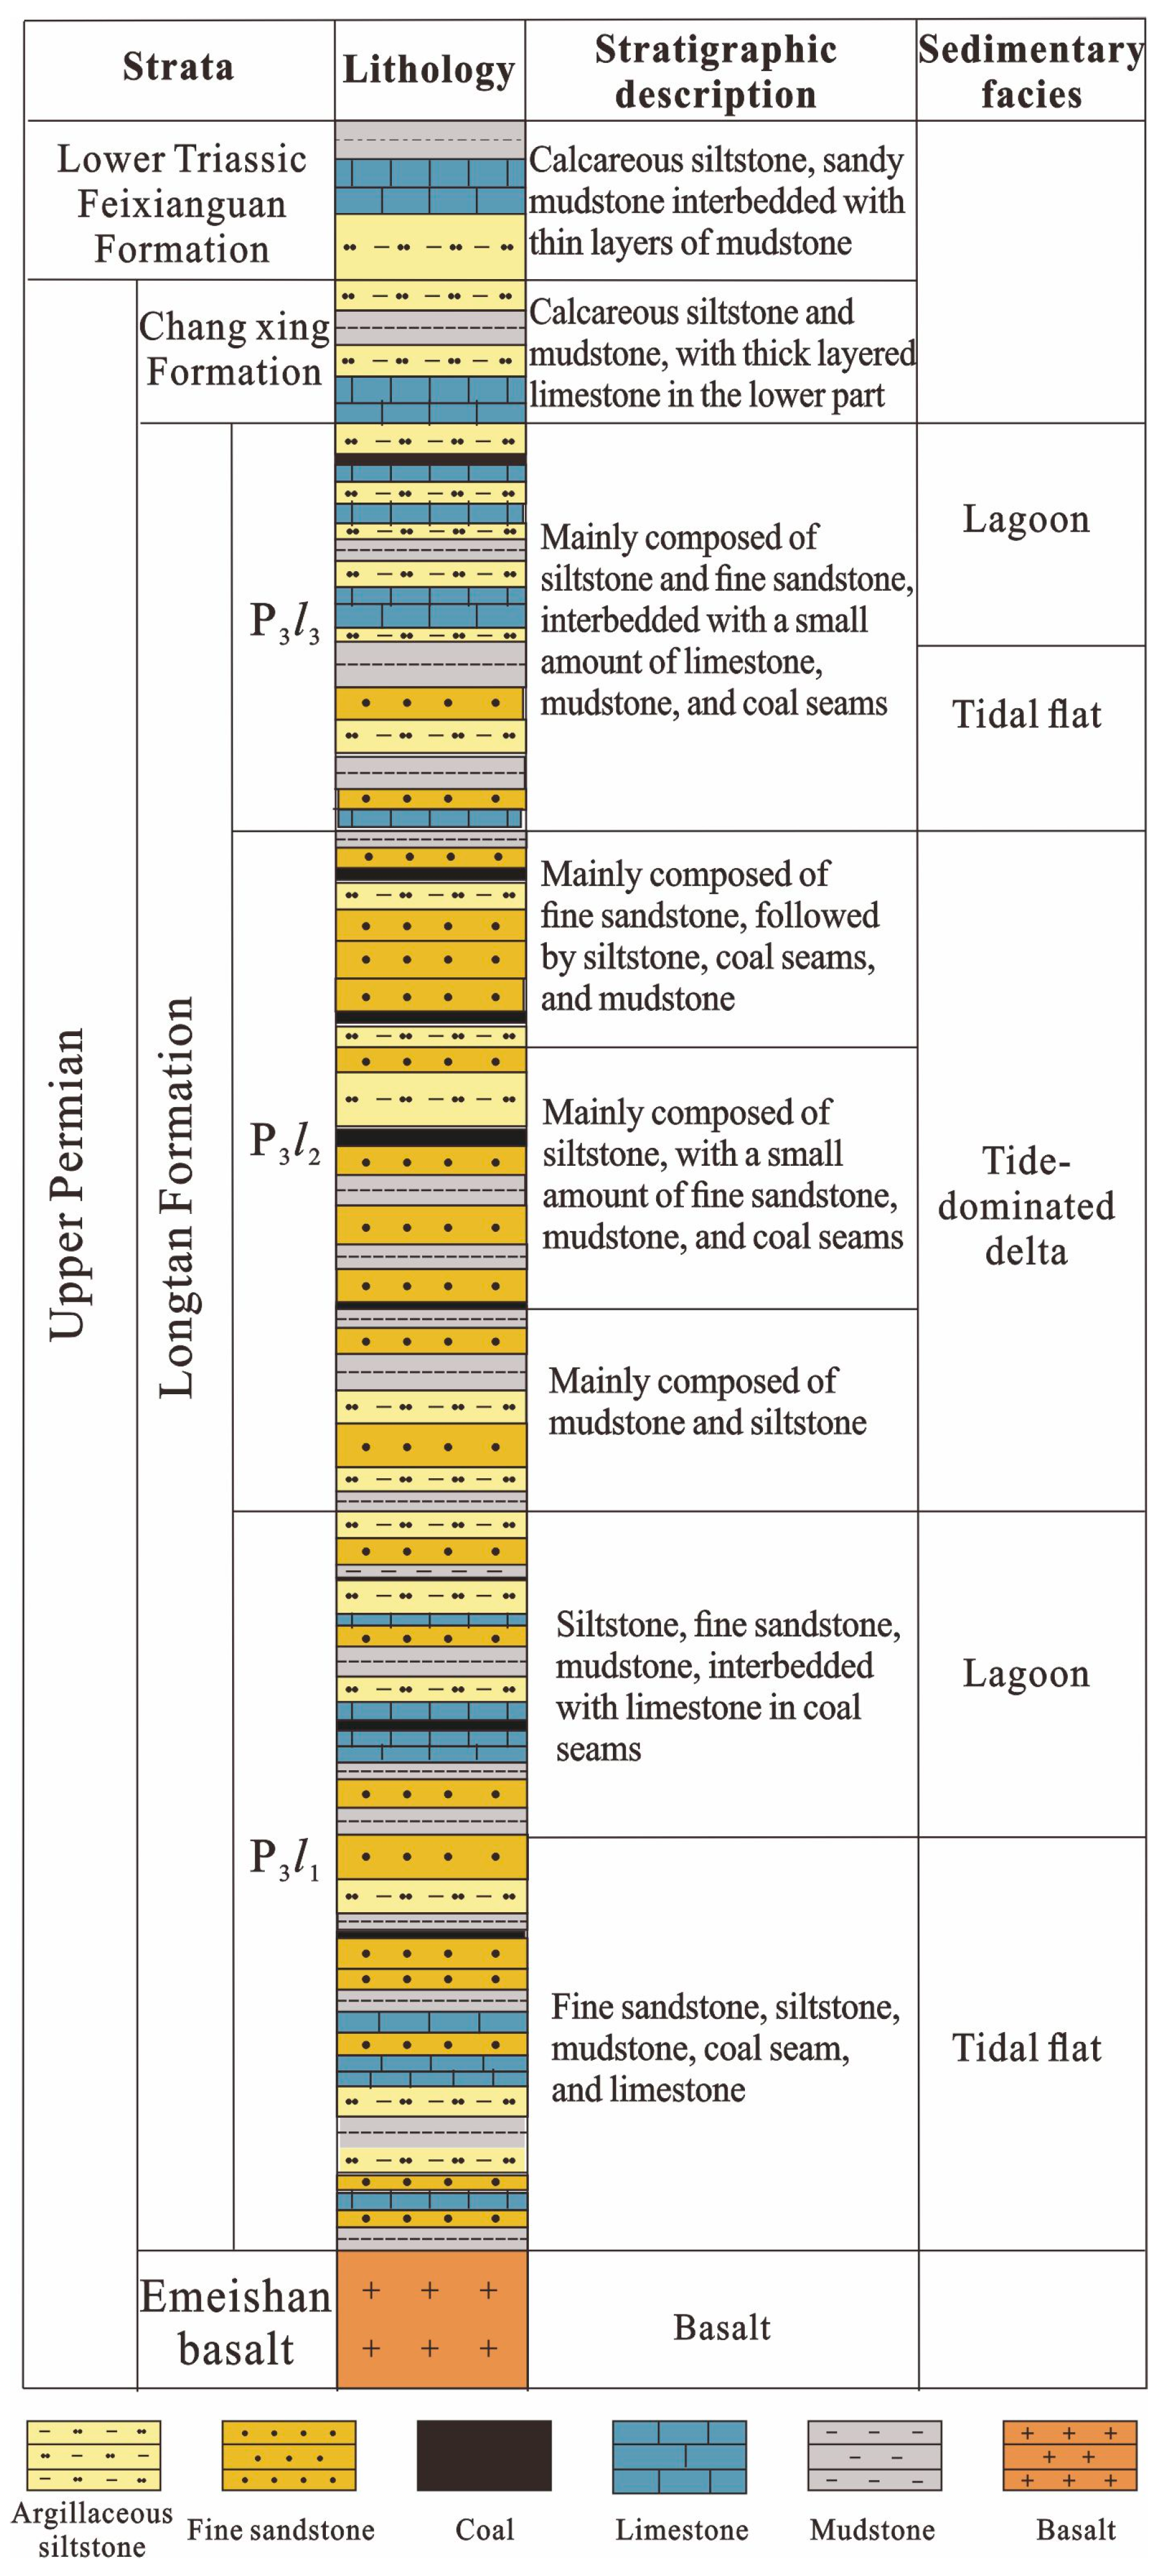
2. Geological Setting

The Sichuan Basin, situated in the upper Yangtze region within the western part of the Yangtze Platform, is surrounded by a series of fold systems or orogenic belts [44,50,57]. Shaped like a northeast–southwest rhombus, the basin has undergone numerous tectonic cycles from the Sinian era to the present, including the Caledonian, Hercynian, Indosinian, Yanshan, and Himalayan cycles [44,50,57]. These cycles have resulted in the formation of NE–SW trending slopes, synclines, anticlines, and other structural features within the basin. The internal structure of the basin can be classified into three major divisions and six secondary structural areas [44,50,57]. The research area primarily lies in the low-steep fold belt of southern Sichuan, located in the southwest of the Sichuan Basin (Figure 1).
The Soochow Movement at the end of the Middle Permian caused most of the Sichuan Basin to rise as a whole and expose it above the sea level. Affected by weathering and erosion, the Kangdian Ancient Continent further uplifted and expanded, becoming the Upper Permian of the Sichuan Basin—the main provenance area [44,50,57]. Due to the influence of the Soochow Movement, the seawater retreated eastward, causing the western area of the basin to rise into land, with high southwest and low northeast [44,50,57]. Therefore, the early sedimentation of the Late Permian showed an obvious trend from west to east, with a phase change from land to sea. At the beginning of the Late Permian, the sea level began to rise intermittently, and transgression advanced from east to west and from northeast to southwest, and a set of Longtan Formation marine–continental transitional coal-bearing strata was widely deposited in the central and southern Sichuan areas (Figure 1).
The Upper Permian Longtan Formation (P3l) is rich in organic shale, which is widely developed in the Sichuan Basin and is a high-quality transitional shale gas reservoir between the sea and land. It can be divided from bottom to top into Section 1 (P3l1) to Section 3 (P3l3) [57,58,59,60]. Among them, the P3l1 section has a thickness of 25–55 m and is mainly composed of sandstone and siltstone, containing coal seams. The thickness of the P3l2 section is 25–50 m, with sandstone as the main layer at the bottom and a thin interlayer of mudstone and coal seam transitioning upwards [57,58,59,60]. A set of sandstone has developed in the middle, and the upper lithology is mainly thick mudstone interbedded with siltstone and coal seam [57,58,59,60]. The thickness of the coal seam is 1–3 m. The thickness of the P3l3 section is 25–35 m, with sandstone developed at the bottom and mudstone interbedded with coal seams in the middle and upper parts [57,58,59,60]. The coal is about 2 m thick (Figure 2).

3. Materials and Methods

3.1. Materials

Twelve marine–continental transitional drilling shale samples were collected from the Longtan Formation in the Southern Sichuan Basin, with a depth of 2948.80–3180.32 m. After the sample is collected, it is sealed with paraffin and sent to the laboratory for experiment. Before mineralogical experiments and the N2 adsorption–desorption experiments, all samples were prepared as a powder with a particle size of <0.5 mm. Then these samples were put into the oven and baked at 110 °C for 12 h to remove the moisture.

3.2. TOC and Mineralogical Experiments

Using a Leco carbon/sulfur analyzer (Cornerstone)™, following the Chinese National Standard GB/T 19145-2022, the TOC content of the Longtan shale samples was measured. It is worth noting that before the experiment, the sample was crushed into powder with a particle size of <150 mm and treated with hydrochloric acid to remove carbonates. Afterwards, it was cleaned with distilled water to remove hydrochloric acid and then baked at 110 °C in a muffle furnace for 12 h. The mineral content of the Longtan shale samples was measured by a RIGAK–D/Mas 2500PC Powder X-ray diffractometer (Rigaku, Tokyo, Japan) under the Chinese Oil and Gas Industry Standard SY/T 5163-2018. During this experiment, the sample pretreatment process does not require acidification treatment.

3.3. SEM and N2 Adsorption–Desorption Experiments

For the observation of types and morphological characteristics of the Longtan shale pores, high-resolution field emission-scanning electron microscopy (FE–SEM) images were obtained by a Quanta 200F (Thermo Fisher, Waltham, MA, USA) installed with an energy-dispersive spectrometer (EDS). All experiments were performed following the Oil and Natural Gas Industry Standard of the People’s Republic of China, SY/T 5162–2014.
Using a “Quantachrome-nova2000” Surface Area Analyzer (Annton Paar, Graz, Austria) and Pore Size Analyzer, N2 adsorption–desorption experiments were conducted under low-pressure (0–101.3 kPa), with the relative pressure (P/P0) ranging from 0.01 to 0.995, under the Chinese National Standard GB/T19587-2017. The automatic balance detection algorithm was used in the analysis process, for determining the equilibrium between the adsorbed phase and the non-adsorbed phase is reached before the isotherm data collection.

3.4. Fractal Dimension Calculation

Fractal dimension D, is the key indicator for measuring the heterogeneity of shale reservoirs and can be calculated by various methods, including the particle size method, the fractal Brunauer–Emmett–Teller (BET) method, the fractal Frenkel–Halsey–Hill (FHH) model, and the thermodynamic method [60,61,62,63,64,65,66]. In these methods, based on the data from the N2 adsorption experiments and the FHH model, the fractal dimension of the marine–continental transitional Longtan shales was calculated using the following equations [65,66]:
ln(V/V0) = A ln(ln(P0/P)) + constant
D = A + 3
where V and V0 are the N2 adsorbed volume at the equilibrium pressure and the monolayer coverage volume, respectively; P0 is the saturation pressure, and A is the slope of ln(V) versus ln [ln(P0/P)]. D is the fractal dimension.

4. Results

4.1. TOC and Mineralogy

According to the statistics of 12 core samples from 3 drilling wells in the research area, the TOC content of shale in the Longtan Formation ranged from 2.2% to 7.98%, with an average of 5.13%. Among them, samples with a TOC content > 4% accounted for 75%. The shale of the Longtan Formation was rich in clay minerals, ranging from 44.4 wt.% to 67.7 wt.% (mean of 56.9 wt.%), followed by brittle minerals such as quartz (17.5 wt.% to 30.1 wt.%, average of 22.6 wt.%). The carbonate content was relatively low, with calcite and dolomite content ranging from 0.08 wt.% to 5.4 wt.% (mean of 3.32 wt.%) and 2.48 wt.% to 6.87 wt.% (mean of 3.94 wt.%). In addition, it also contained a small amount of pyrite and feldspar, with the content of 1.11 wt.% to 6.20 wt.% (mean of 3.03 wt.%) and 2.63 wt.% to 9.60 wt.% (mean of 6.11 wt.%), respectively. The main clay minerals were an illite and illite-smectite mixed layer, followed by kaolinite and chlorite. Overall, there is a significant difference in mineral composition between the Longtan Formation shale in the southern Sichuan region and the North American shales [67,68,69,70]. The shale samples have a higher clay mineral content, while the brittle mineral content is relatively low. Using the content of clay minerals, carbonate minerals (calcite + dolomite), and silicate minerals (quartz + feldspar) as the three terminal elements for mineral composition lithofacies classification. Dividing the shale facies by 5%, 25%, 50%, and 75%, all samples in this study belong to argillaceous shale.

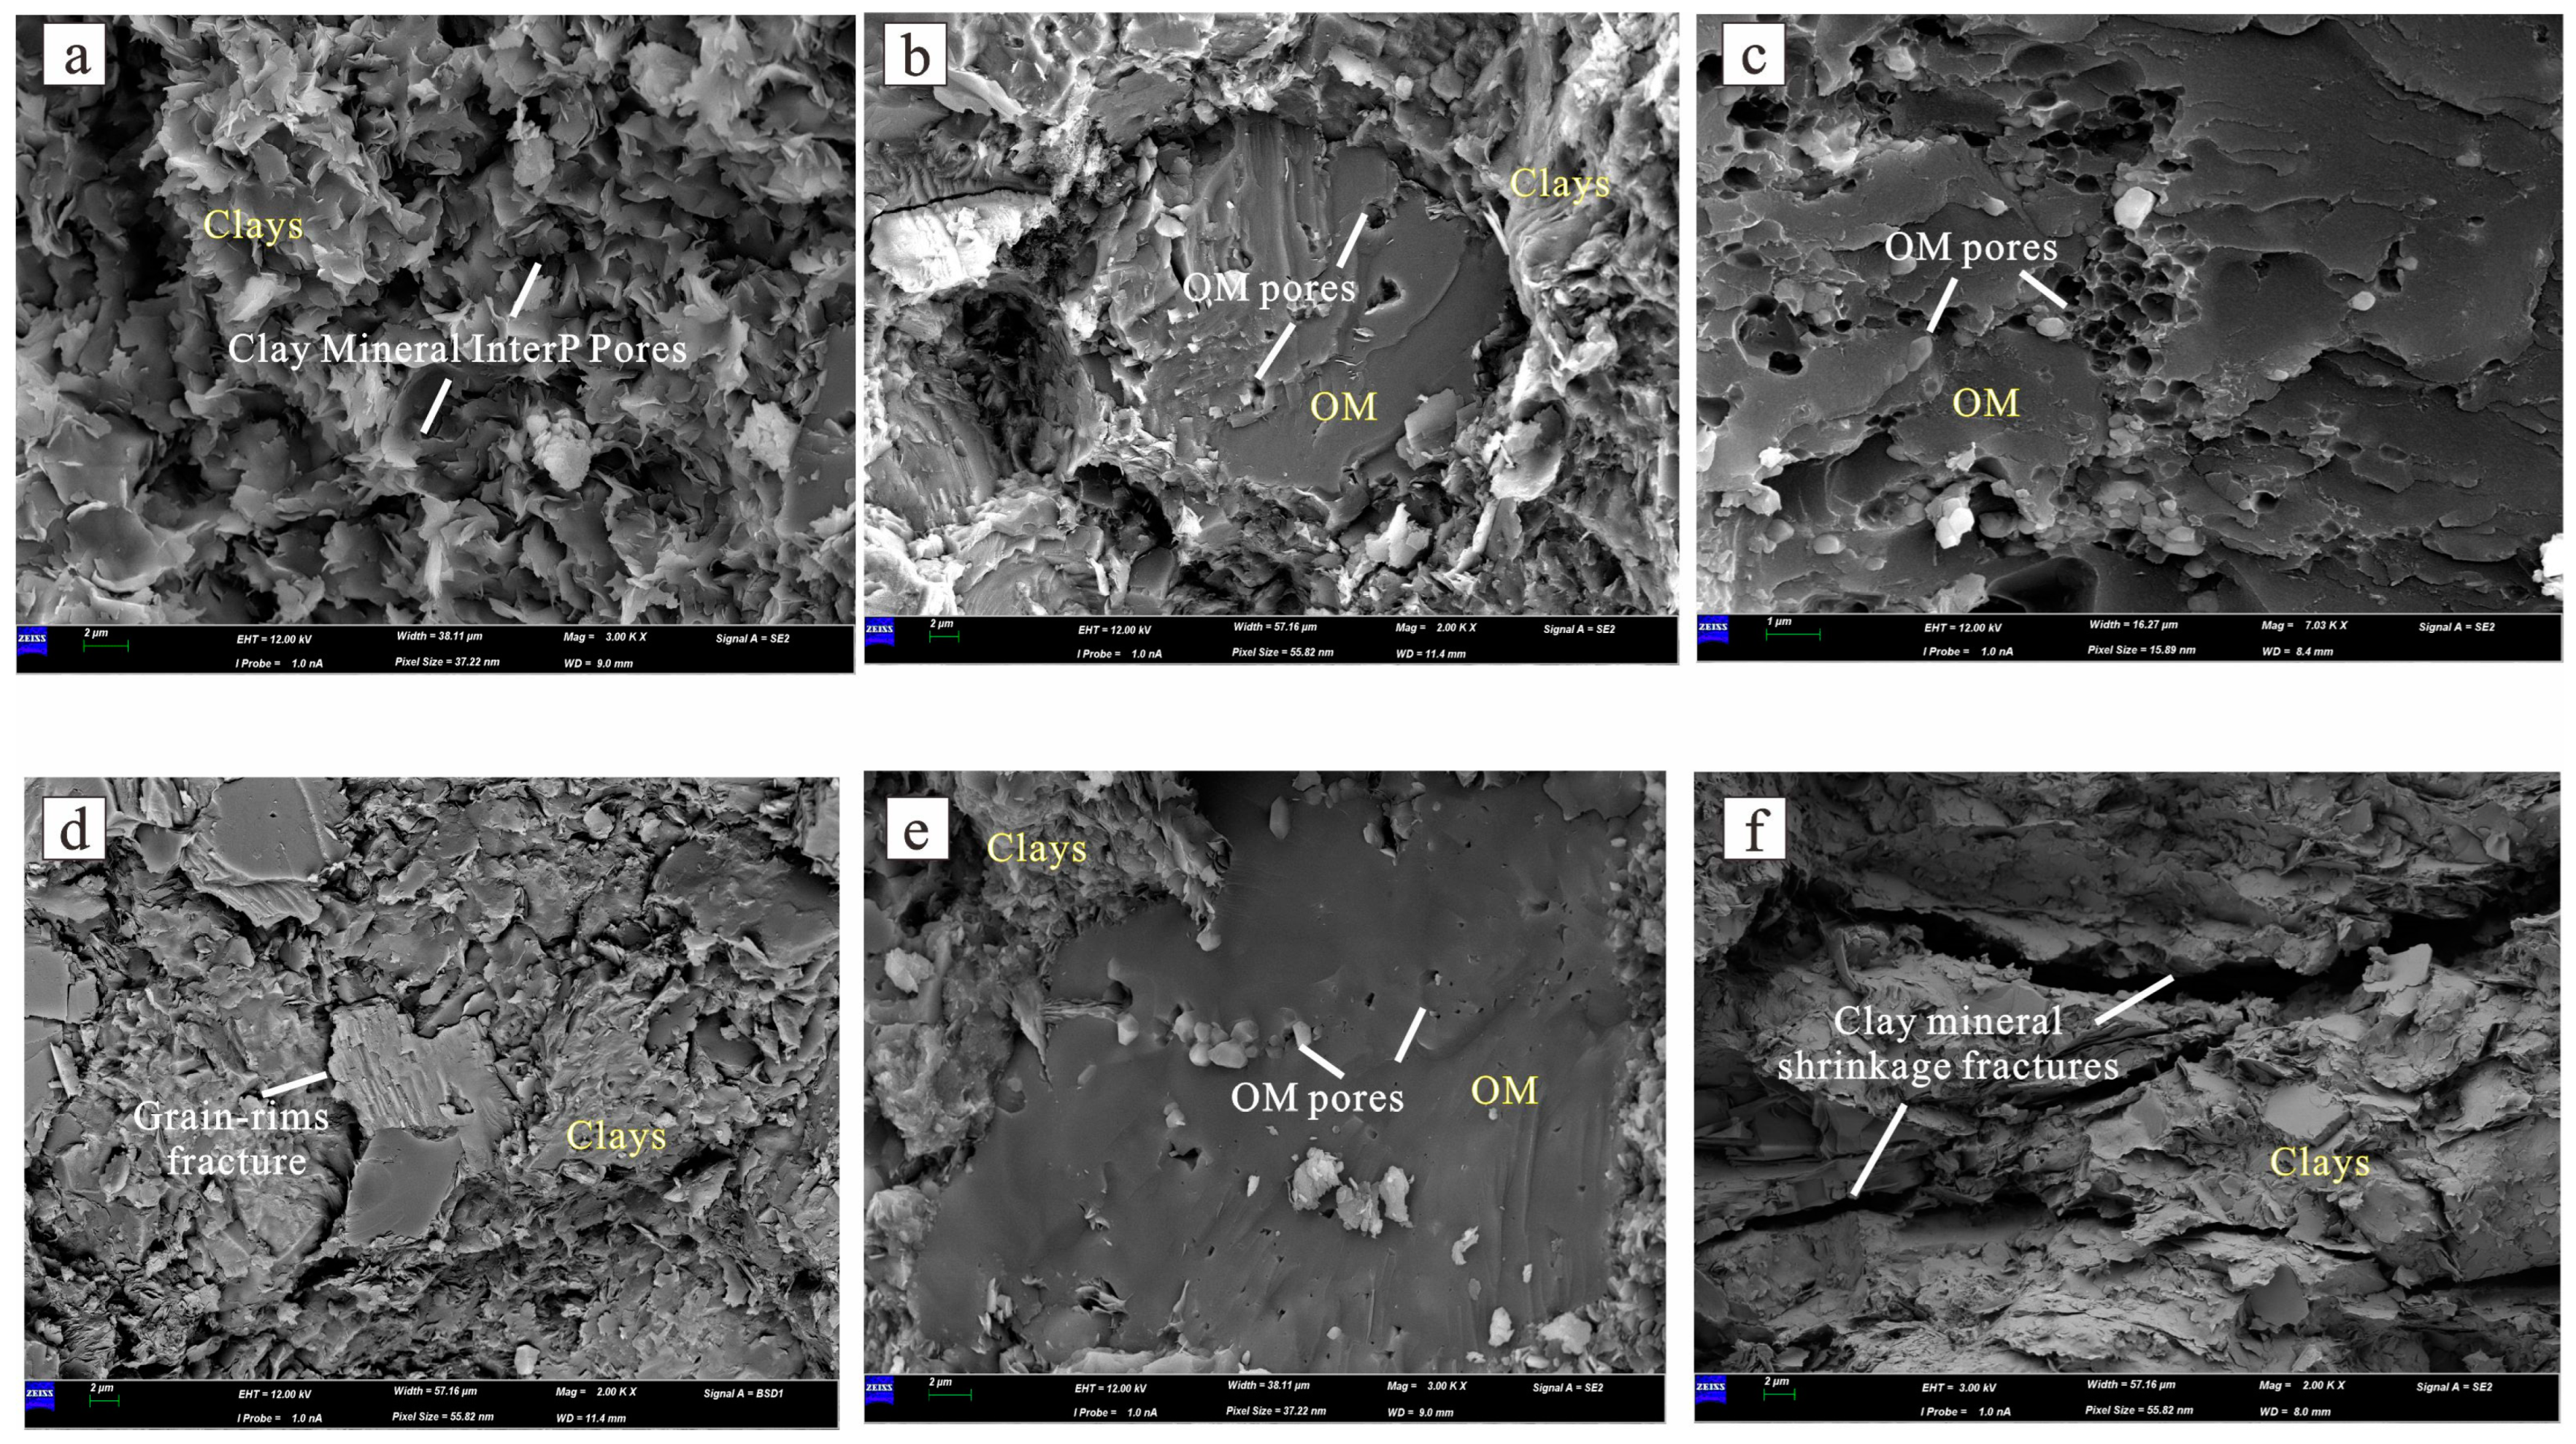
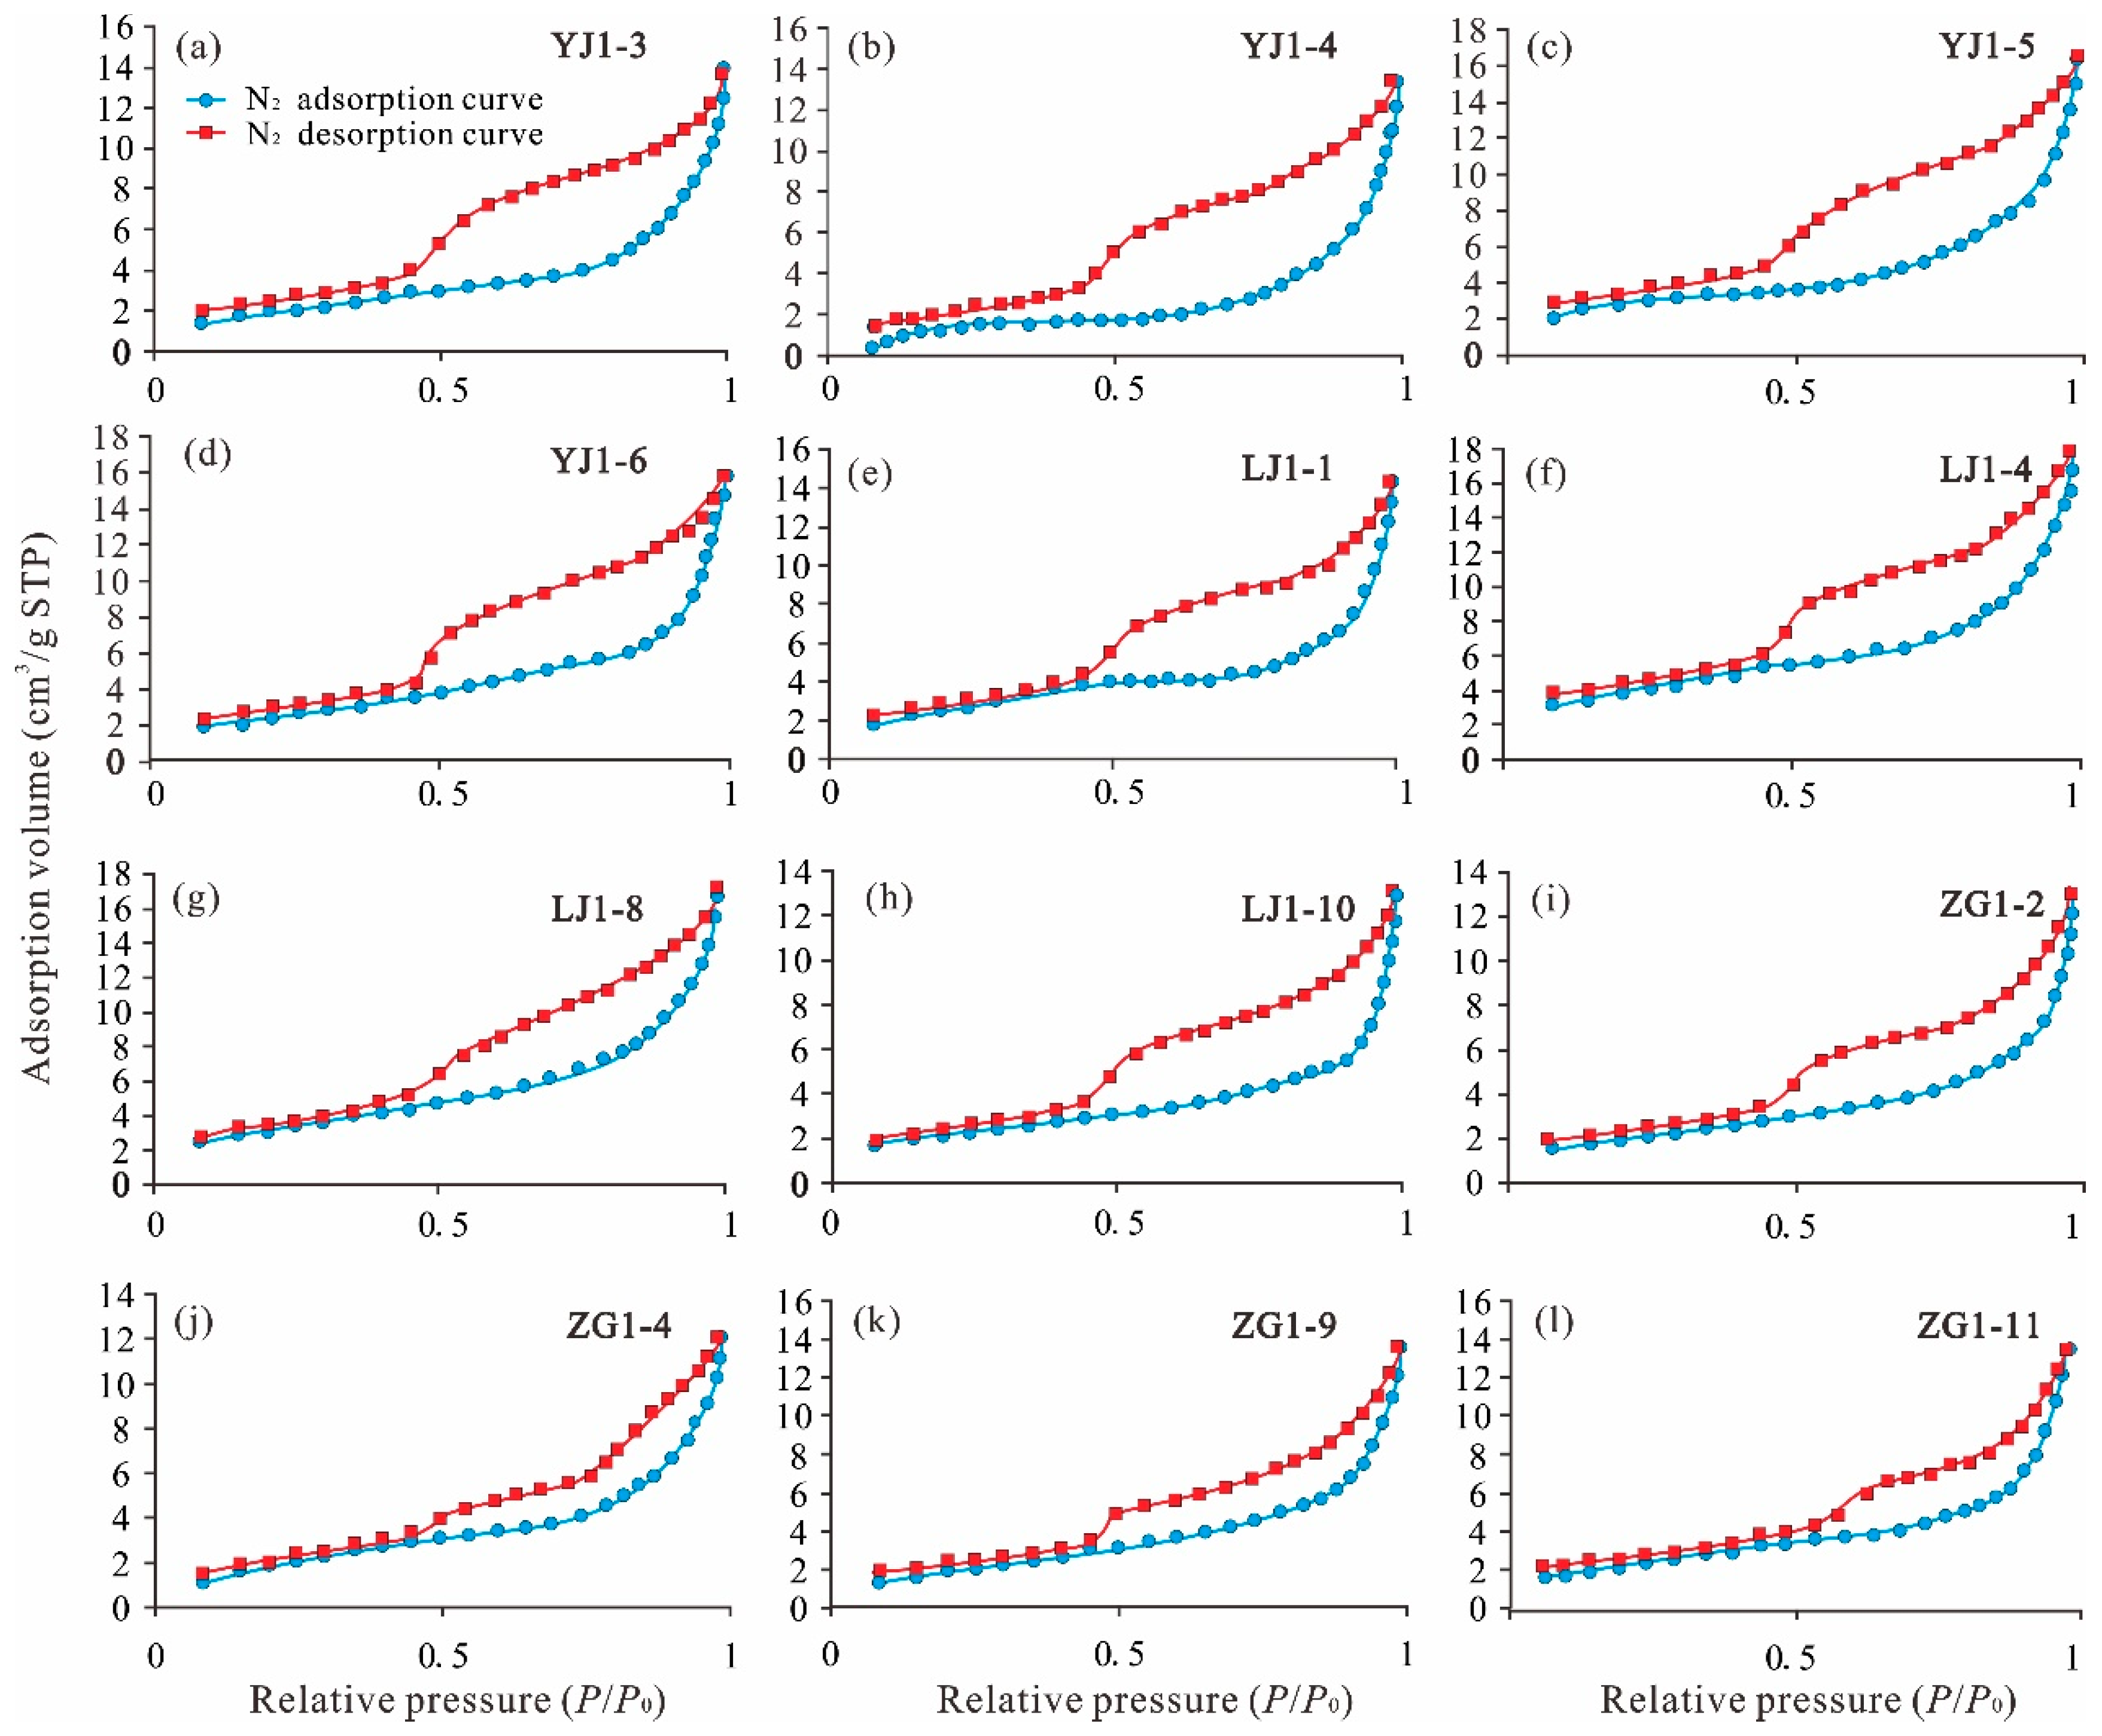
4.2. Pore Shapes Based on SEM and N2 Adsorption–Desorption Isotherms

Fine observation of natural cross-sections of shale samples based on FE-SEM images, and pore types and shapes of coal-bearing marine–continental transitional shales from the Longtan Formation in the South Sichuan Basin were analyzed. The images show that Longtan shale develops various types of micropores, with pore morphology often exhibiting irregular, angular, elliptical, and narrow slit shapes. It is commonly found in inorganic pores of clay mineral matrices (Figure 3). Compared with the Longmaxi Formation shale in southern Sichuan [33,36] and the marine shale in North America [24,25,26,27,28,29], the Longtan Formation shale has a significantly lower number of organic matter pores, while the intergranular pores of clay minerals are more developed. The pore size of intergranular pores in clay mineral layers is usually less than 500 nm, and this type of pore morphology is relatively irregular, with significant changes in pore size, ranging from tens of nanometers to several micrometers (Figure 3a,b,d). The shape is commonly narrow slit-shaped due to the influence of compaction. OM pores develop inside organic matter clumps, usually in the shape of pits, ellipses, honeycombs, crescents, and irregular shapes, with smooth edges and clear boundaries, ranging in size from a few nanometers to several hundred nanometers (Figure 3a,b,d). The main genesis of OM pores is the generation and expulsion of hydrocarbons during the thermal evolution of OMs, and their development is directly controlled by the abundance and maturity of OMs, closely related to the formation and occurrence of shale gas [21,34,35]. The micropores of OM in the shale of the Longtan Formation are mostly developed in samples with relatively high OM abundance, especially in samples with high OM and clay content (Table 1, Figure 3). Microcracks are also developed in the shale of the Longtan Formation, but they are generally fewer than those in marine shale reservoirs. Cracks are usually formed between OM and clay minerals due to the contraction effect of the thermal evolution process of OM. During the diagenesis process, cracks formed by the contraction effect of clay minerals in the matrix are also more common. These cracks usually have serrated edges, often in the form of broken lines, long strips, and linear shapes, with a width generally not exceeding 500 nm and a maximum length of several millimeters (Figure 3d,f).
As shown in the low-pressure N2 adsorption and desorption isotherm curves of Figure 4, both mesopore and macropore developed within shale samples. These results show that the adsorption isotherm of each sample coincides with the desorption branch, as the relative pressure is <0.45. At this stage, nitrogen molecules can first adsorb in a single layer on the inner wall of the medium. However, when the relative pressure exceeds 0.45, the adsorption branch of the isotherm will be inconsistent with the desorption branch, and the hysteresis loop will appear. This process belongs to the stage of multilayer coverage, and this phenomenon may reflect that the pore size of shale samples has strong heterogeneity. The International Union of Pure and Applied Chemistry (IUPAC) classified four types of gas isothermal adsorption [71,72]. The isotherm shapes of the Longtan shale samples are Type IV, showing that pores of different scales are relatively developed with good connectivity [73].
By recognizing the shape of the hysteresis loop, the pore morphology can be indirectly characterized [73]. Two groups (group A (Figure 4a–f) and group B (Figure 4g–l)) were divided based on the data from N2 adsorption–desorption experiments. In group A, the hysteresis phenomenon occured at a high relative pressure (greater than 0.45) for adsorption and desorption isotherms (Figure 4a–f), classified as type H2. This type of curve reflects pores with narrow necks and wide bodies (known as ink bottle-shaped pores). Compared with this type of pore, another type of pore has a relatively small N2 adsorption capacity at a higher relative pressure (greater than 0.45) (Figure 4g–l), mainly belonging to the B-type pore shown in Figure 4, closely related to the slit type pore. Shales that develop these types of pores typically have a high content of clay minerals, which is due to the narrow slit-shaped pores formed by clay minerals.

4.3. Pore Structure Parameters

The results of pore structure parameters are presented in Table 2. Based on the total pore volume estimated from the N2 single point adsorption total pore volume at a relative pressure of 0.99, using the Barret-Joyner-Halenda (BJH) method [65], ranged from 0.019 to 0.028 cm3/g (mean of 0.024 cm3/g). The specific surface area calculated by the BET method [64] varied from 4.918 m2/g to 13.228 m2/g (mean of 8.727 m2/g). The average pore size of Longtan shales ranged from 3.23 to 6.86 nm (mean of 4.37 nm). The average pore size diameter of the Longtan shales ranged from 58.85 to 110.89 nm, with an average value of 80.02 nm.

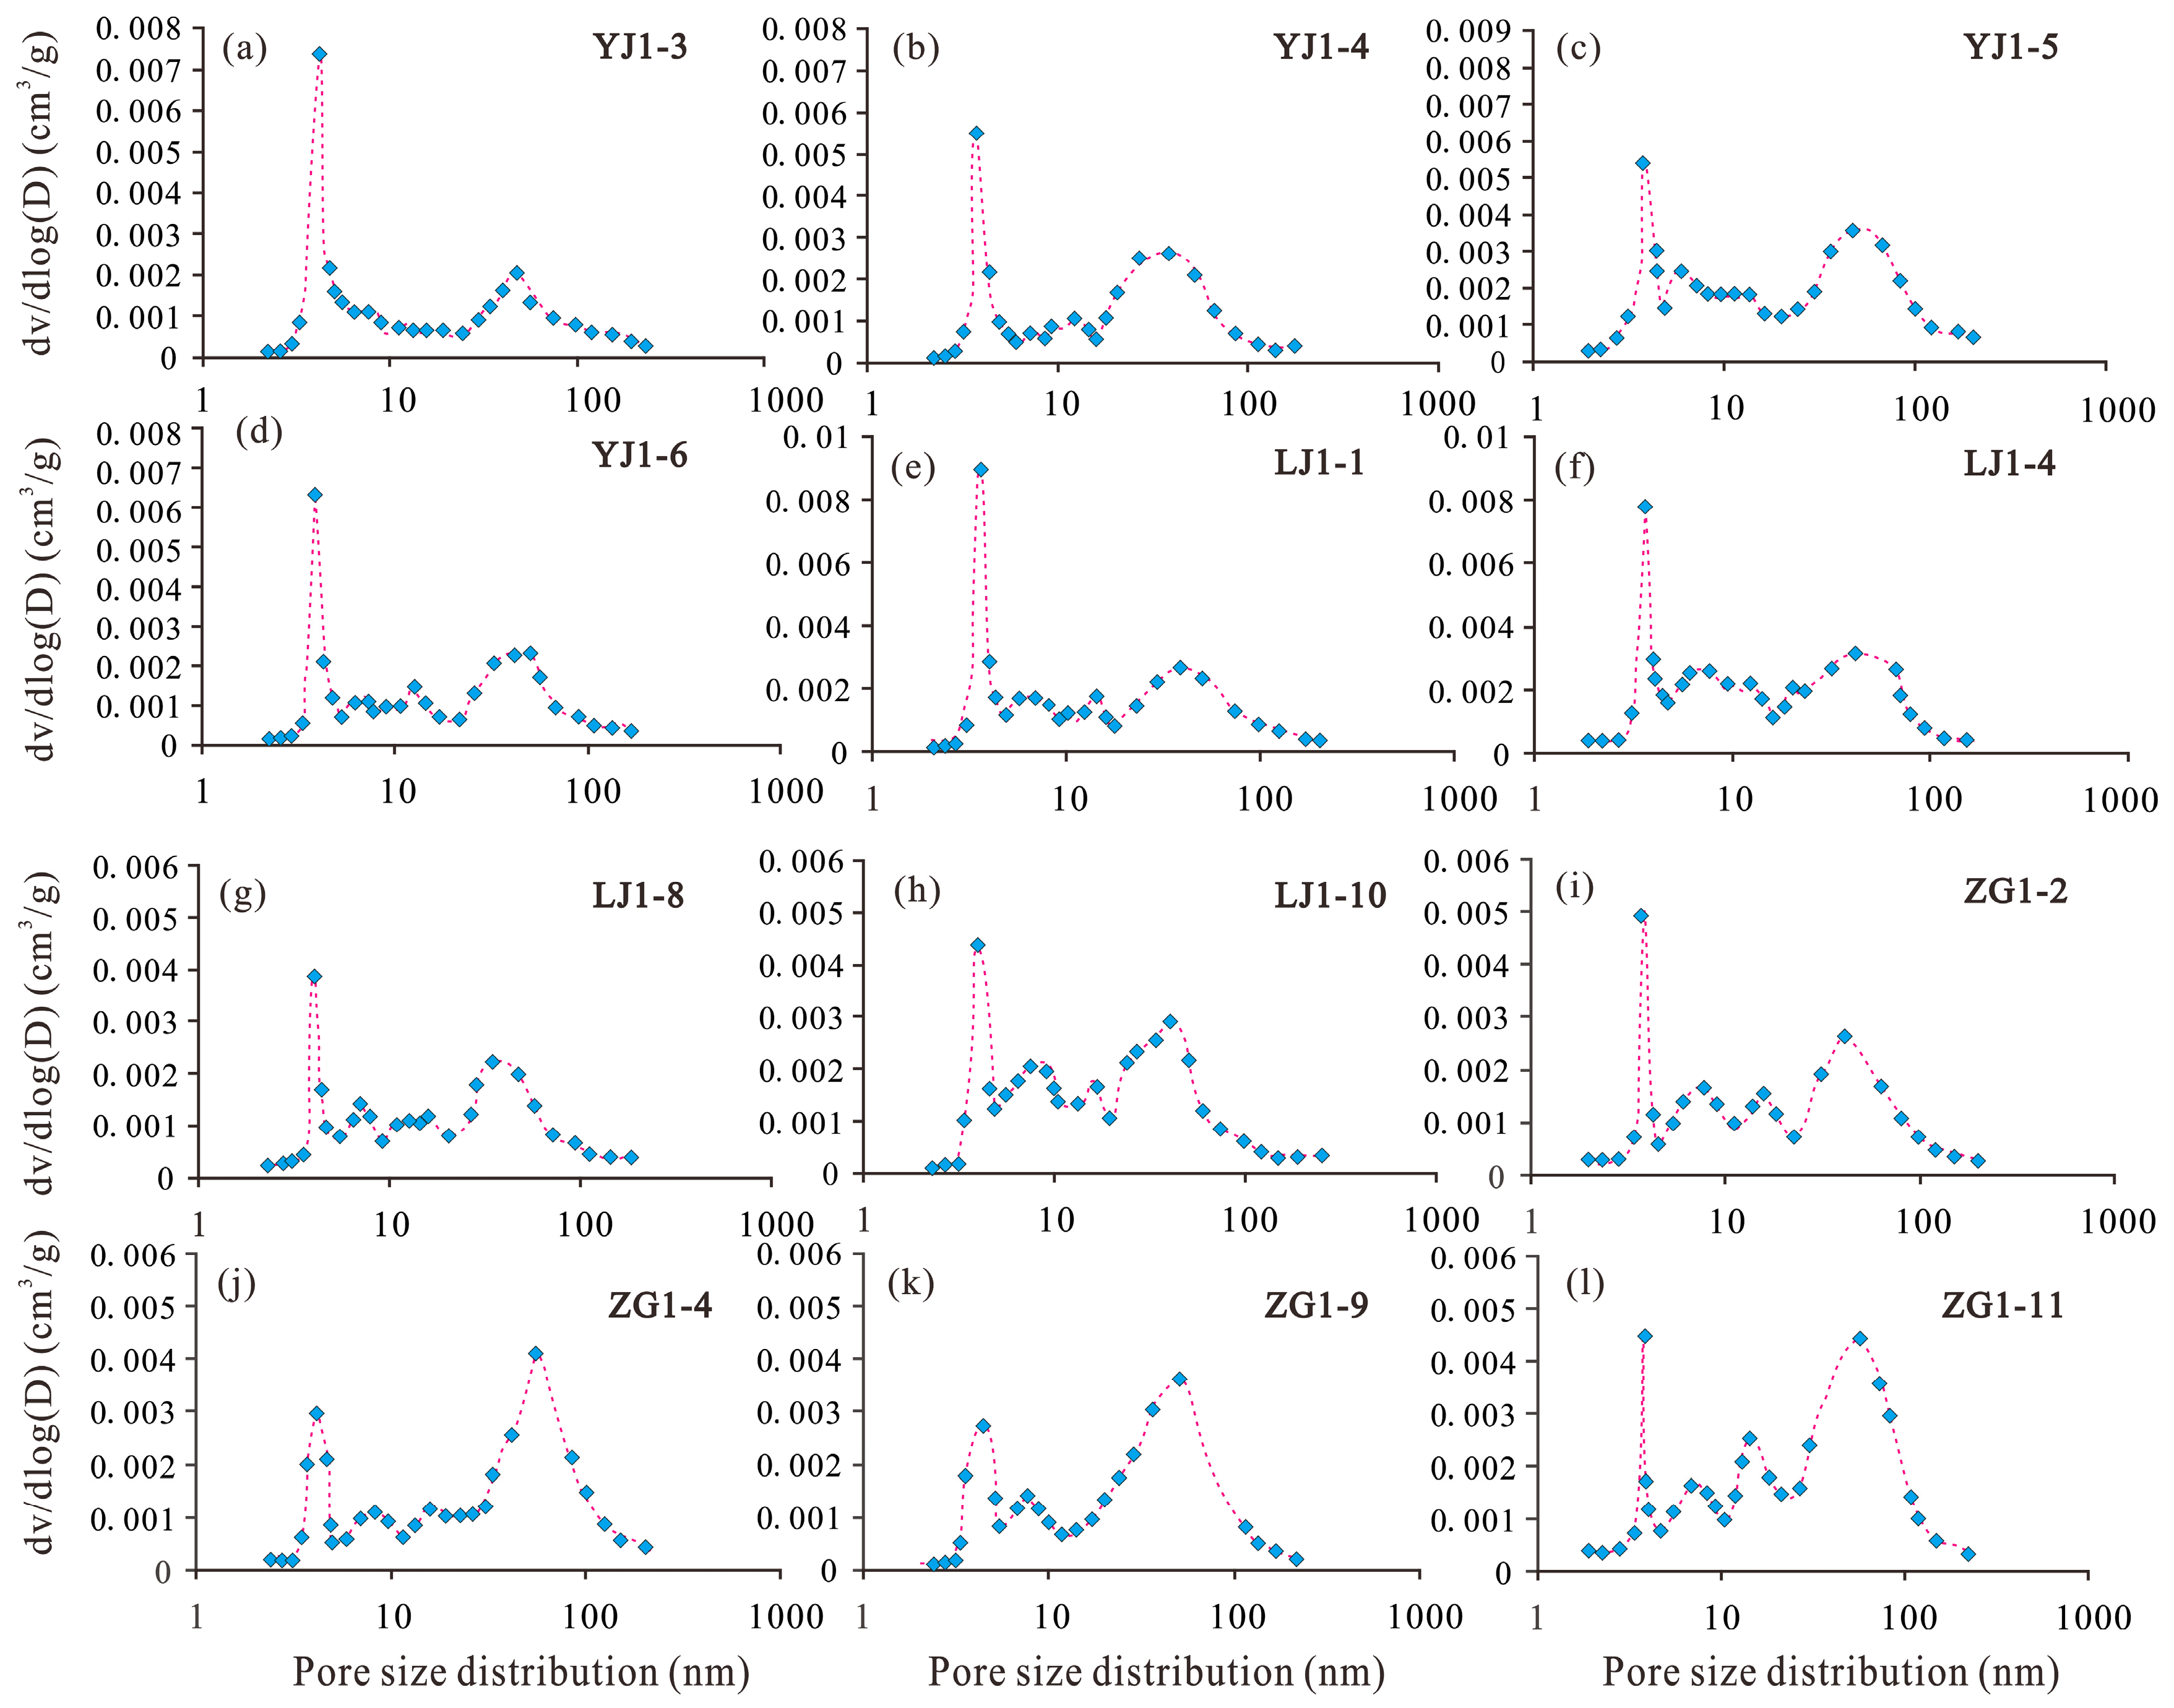
4.4. Pore Size Distribution

The nitrogen adsorption method is a relatively mature and widely used method to determine the pore size distribution [74,75]. It is an extension of the nitrogen adsorption method to determine the BET specific surface. It uses the capillary condensation phenomenon and the principle of volume equivalent exchange. The amount of liquid nitrogen filled is equivalent to the volume of the hole. Capillary condensation refers to the phenomenon that, at a certain temperature, the vapor has not yet reached saturation for the horizontal liquid surface, but the concave liquid surface in the capillary tube may have reached a saturated or supersaturated state, and the vapor will condense into liquid [55,56].
The differential curve of pore volume distribution relative to pore size can be used to represent pore size distribution [74,75]. The pore size distribution curve can reflect the development degree of pores at different scales [55,56]. The gas adsorption–desorption curve has a high advantage in calculating the pore size distribution and is not easily affected by the tensile strength effect [75,76,77]. Based on the BJH method, the pore volume distributions of shale samples are shown in Figure 5. It is observed clearly that the Longtan shales have a wide pore diameter distribution, and the curves present unimodal or multimodal distributions, with the major peak around 4 nm and 20–60 nm.

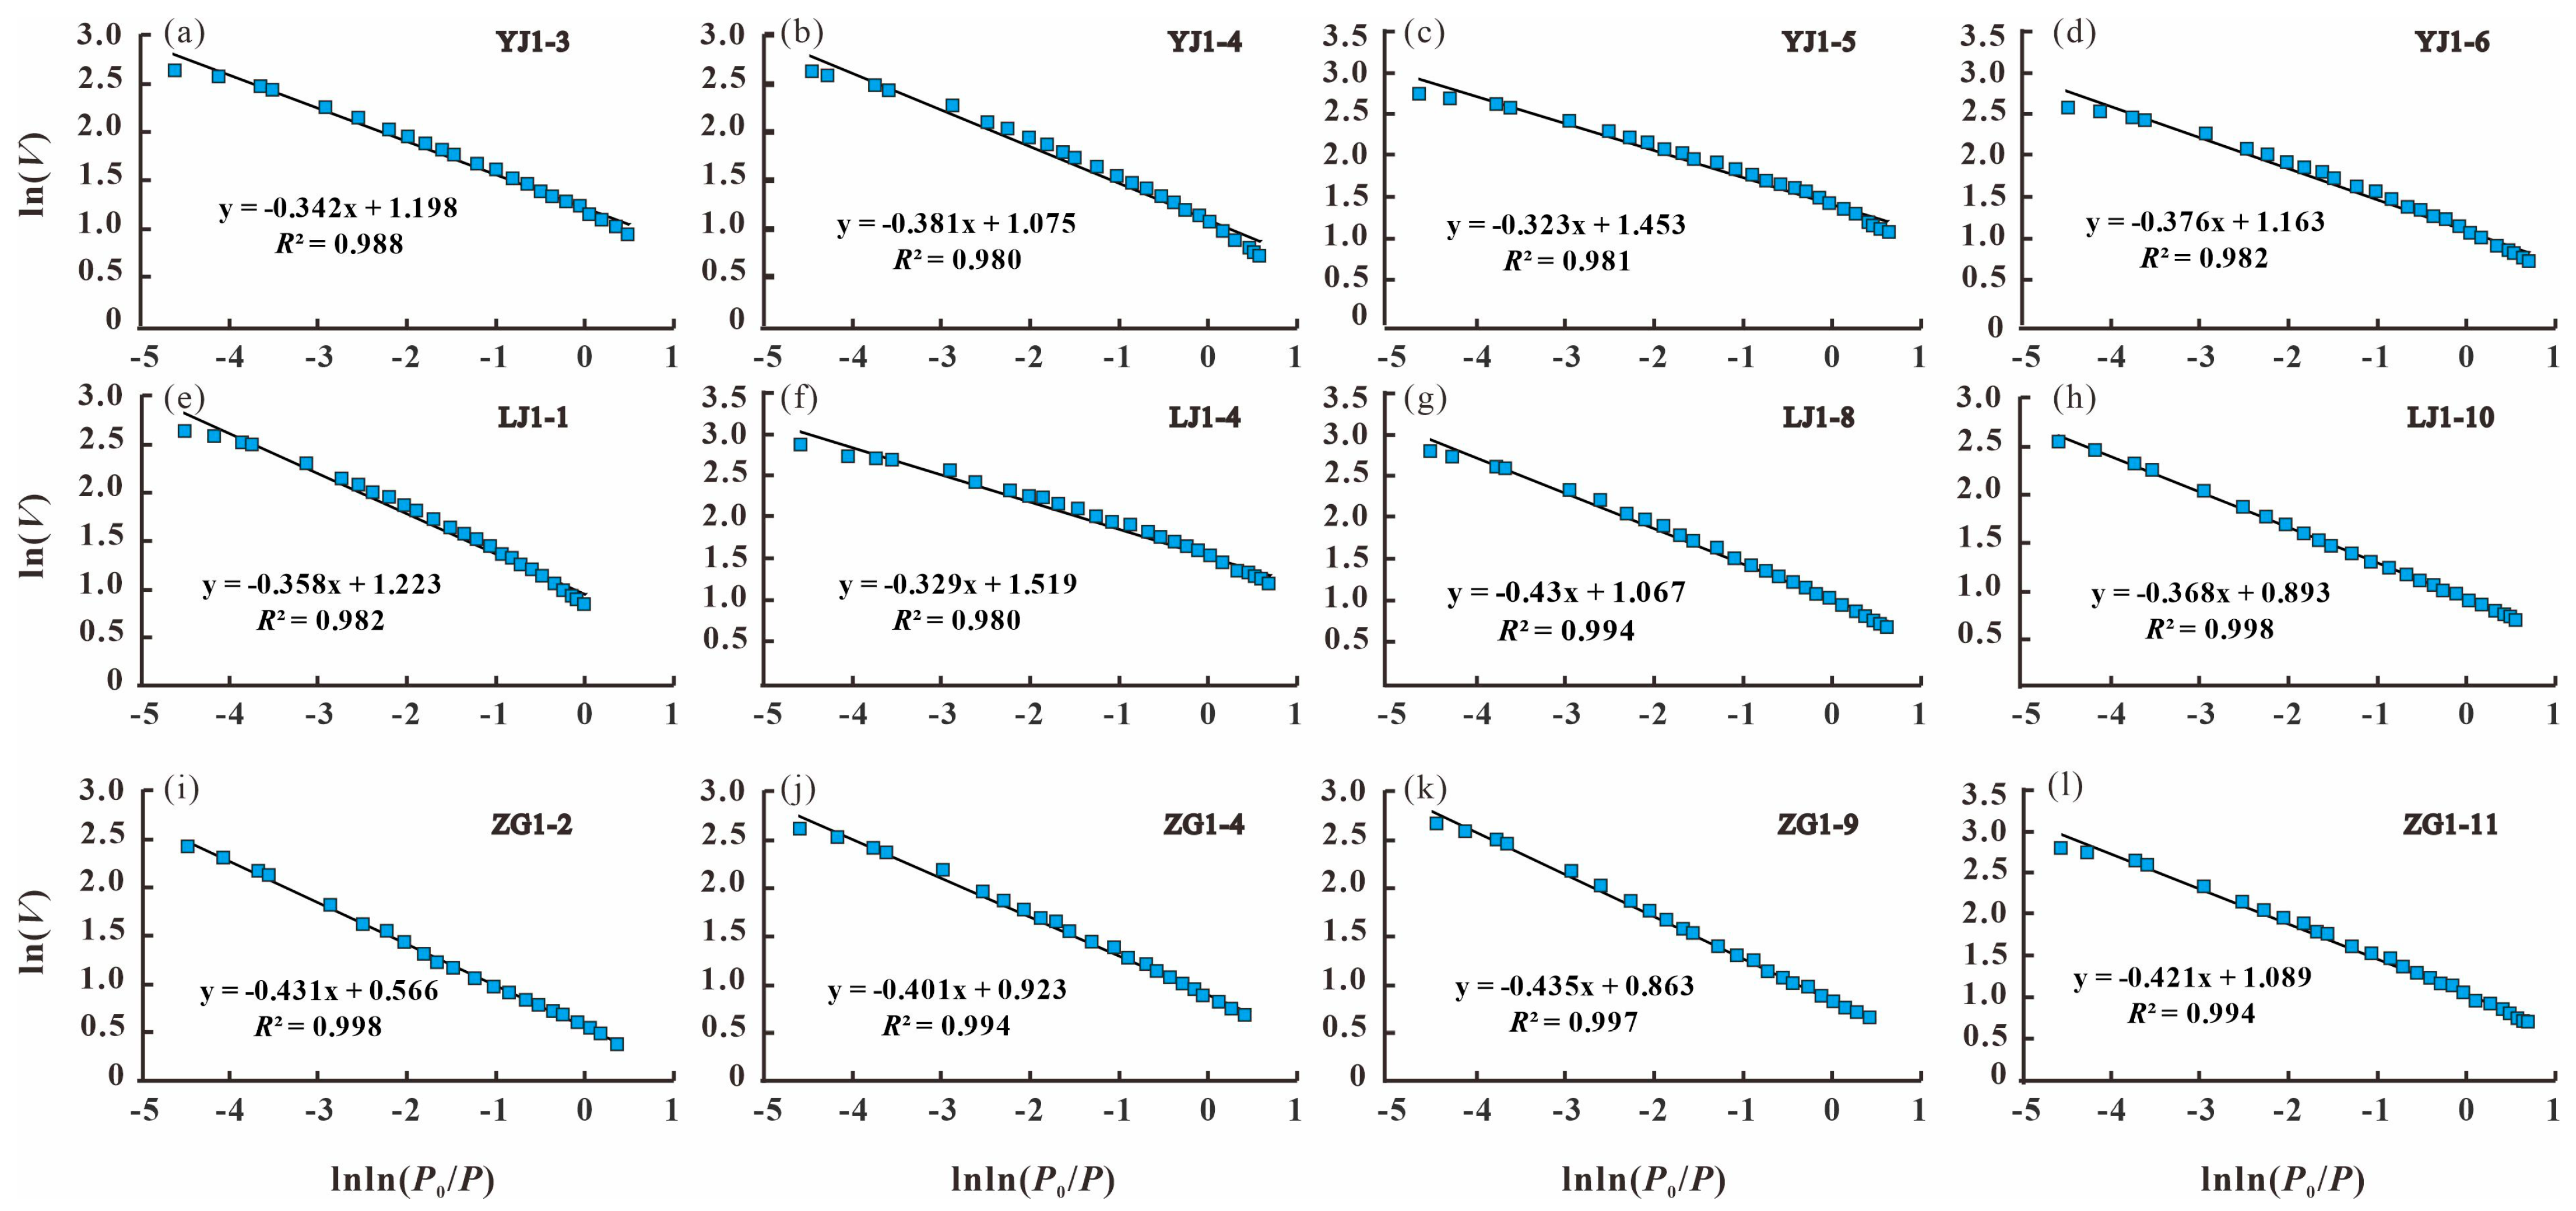
4.5. Fractal Dimensions

In the isotherm of the low-temperature nitrogen adsorption–desorption isotherm of shale, the hysteresis loop is obvious. According to the fractal FHH model, the plots of ln(V) vs ln(ln(p0/p)) from the N2 adsorption data are shown in Figure 6, and all FHH plots have very high degrees of fit, with the coefficients of 0.9805–0.9988. This indicates that the shale pores have good fractal properties. The fractal dimension D of the shale samples were calculated from the slope of the fractal fitting line, and the fractal dimension results are listed in Table 3. The fractal dimension value ranged from 2.5641 to 2.6768, with an average value of 2.6167, indicating that the pore structure in the shale samples is very complex. The fractal dimension D in group A (Figure 6a–f) was greater than those in group B (Figure 6g–l), ranging from 2.682 to 2.677 (mean of 2.645) and 2.564 to 2.632 (mean of 2.585). The results show that the pore structure of the shale samples in group A is more complicated. The hysteretic loop shape of the shale samples in group A can be considered as type H2, mainly appearing as ink bottle-shaped pores, which make the gas adsorption, diffusion, and seepage in the shale more difficult. The phenomenon is possibly because the depth of the shale samples in group B is deeper than group A; thus, the samples in group B suffer strong geological stress and, consequently, this enhances the uniformity of the pore structure in shale.

5. Discussion

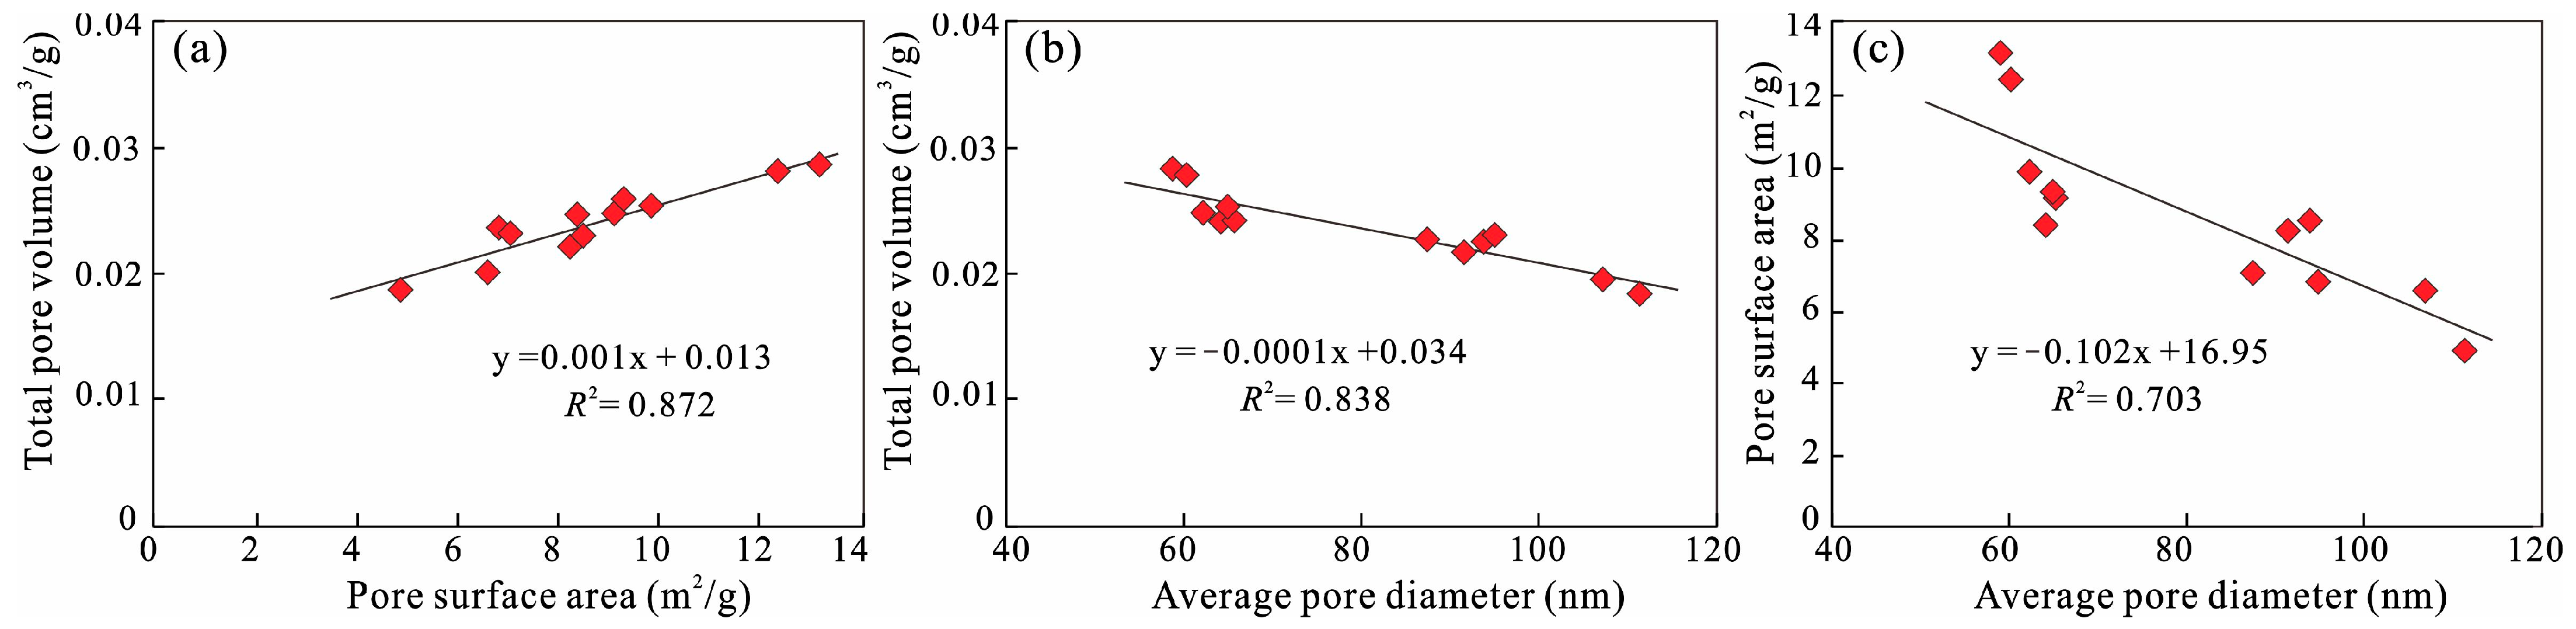
5.1. The Coupling Mechanism between Pore Structure Parameters

As shown in Figure 5, the relationships among total pore volume, BET surface area, and average pore diameter were obvious. Consistent with the results obtained from North America and South China shales, there is a significant positive correlation between the total pore volume and BET surface area, with a correlation coefficient R2 of 0.872 (Figure 7a). However, the total pore volumes of samples show a significant negative relationship with the average pore diameters, which is in agreement with previous studies [55,56,74,75]. Additionally, a strong negative relationship between average pore size and total pore volume can be found in Figure 7c. The results demonstrate that the smaller the average pore diameter, the larger the total pore diameter and specific surface area in the shales. Shales with much more clay minerals have a larger total pore volume and specific surface area, whereas quartz-rich samples have the opposite trend (Table 1 and Table 2). Marine shale is rich in biogenic quartz (>30 wt.%), high OM thermal maturity (Ro > 1.2%), and abundant OM pores [55,56,78]. Compared with those marine shales, however, the studied shale samples are rich in clay minerals and have low OM thermal maturity of OM, mainly including interlaminar and intergranular pores and a small number of OM pores.

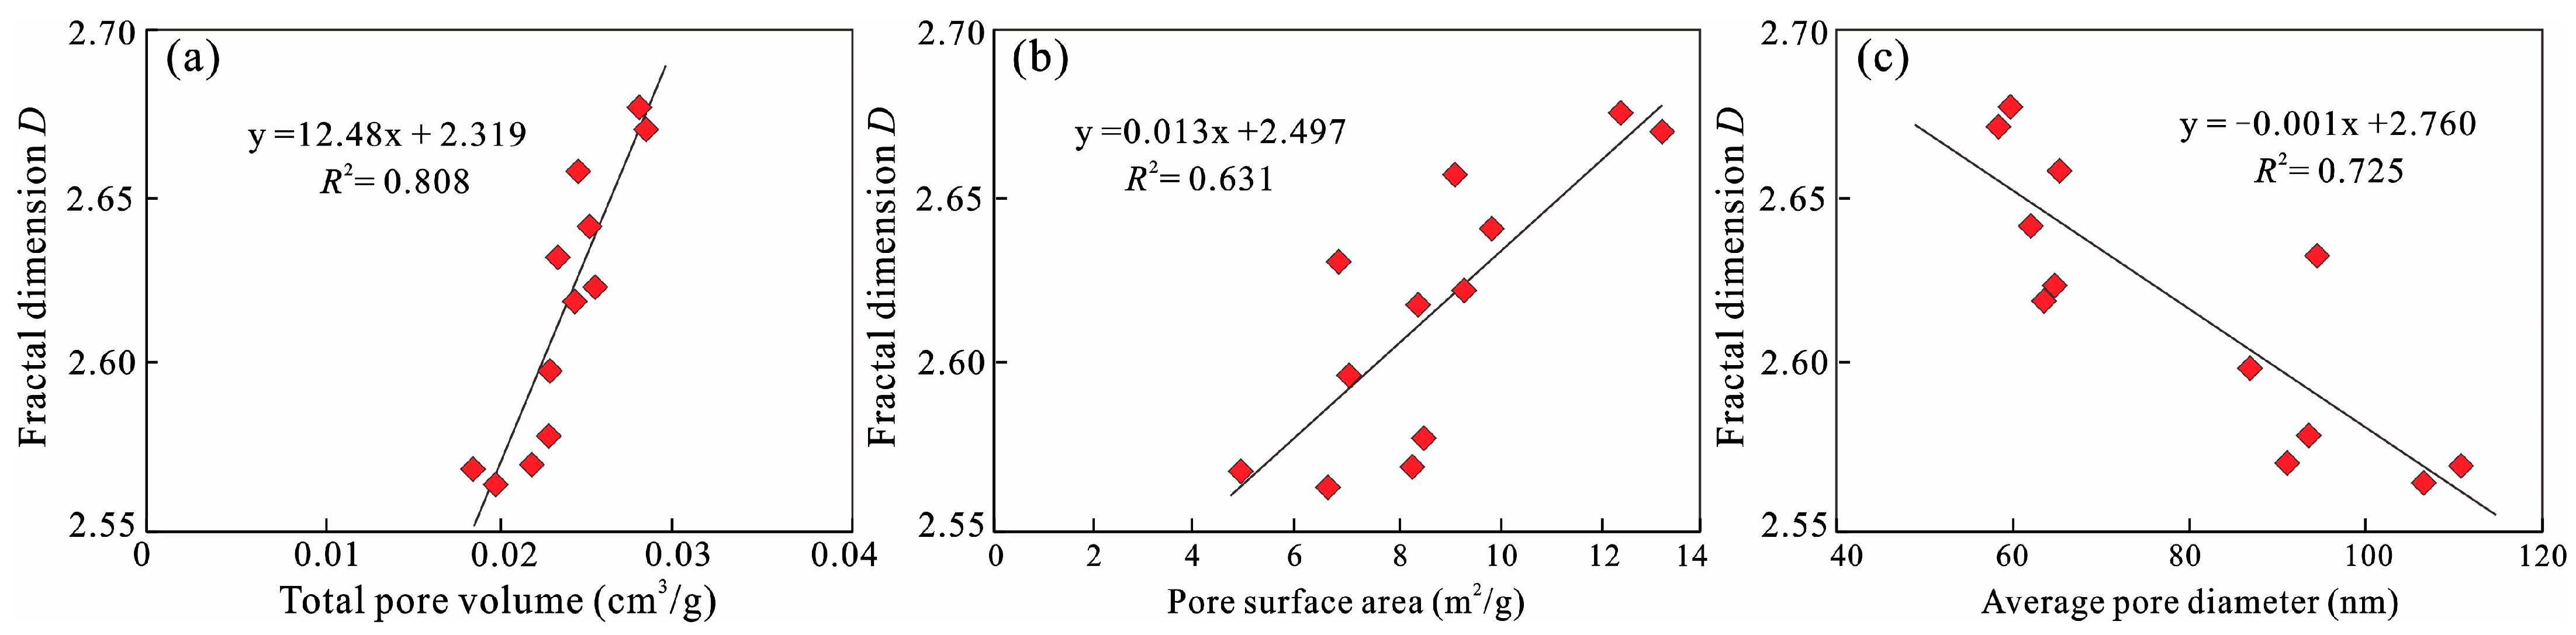
5.2. The Influence of Heterogeneity on Pore Structure

In order to investigate the relationship between fractal dimension and pore volume, specific surface area, and average pore diameter, the fitting curves of fractal dimension versus the above parameters are drawn and illustrated in Figure 6. The pore volume and fractal dimension have a significant linear positive correlation, with a correlation coefficient R2 of 0.808 (Figure 6a), which demonstrates that the fractal dimension increases with the increase of pore volume in the shale. Shale properties are mainly measured in terms of gas adsorption on the surface of the shale pores, while the fractal dimension can comprehensively reflect the irregular and complex degree of the shale pore surface. Thus, the fractal dimension of the pore structure has a certain representation of the gas adsorption capacity in shale. As presented in Figure 8b, the fractal dimension shows a positive linear correlation with the specific surface area. These results show that for shale pores of a certain size, the more the micropore volume in shale, the more complex the pore structure and the pore surface is rougher, and the fractal dimension of shale is greater. In addition, the average pore diameter has a strong negative correlation with the fractal dimension (Figure 8c, R2 = 0.725). The results show that the smaller the average pore diameter of shale, the more small pores in shale, the more complex the pore structure and the rougher the pore surface, and the larger the specific surface area, thus resulting in the larger the fractal dimension.

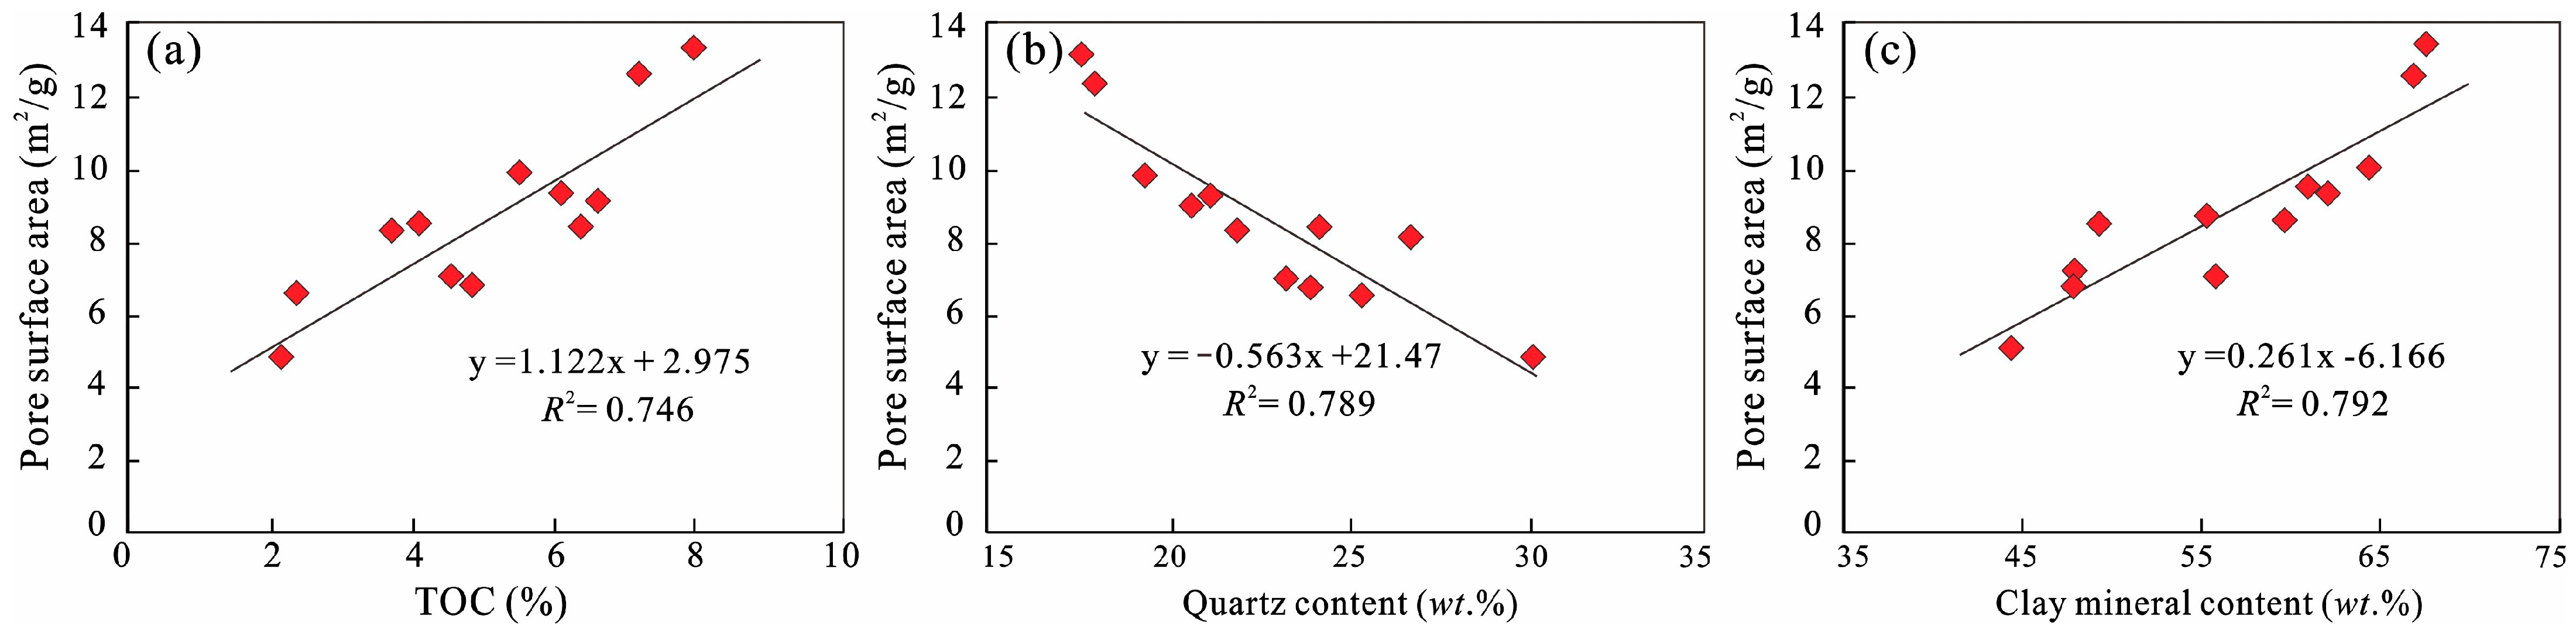
5.3. Compositional Controls on Pore Structure

The abundance of OM in shale is positively correlated with pore volume (Figure 9a) and pore-specific surface area (Figure 10a), with fitting coefficients of 0.926 and 0.746, respectively. Typically, micropores in shale reservoirs have a larger specific surface area [22,57,62]. These results show that there are a large number of micropores developed in OM, most of which are micropores with a larger specific surface area, which can provide more adsorption sites for shale gas adsorption and facilitate the occurrence of shale gas. Due to the low content of brittle minerals in the Longtan shales, the pore type does not dominate the pore system, and its pore size is relatively large, resulting in a relatively low pore-specific surface area. Therefore, as the quartz content increases, the pore volume and specific surface area decrease significantly, with a fitting coefficient of 0.900 and 0.789, (Figure 9b and Figure 10b). The shale samples of the Longtan Formation are rich in clay minerals. Due to their small particle size and complex spatial stacking, clay minerals have a larger specific surface area. Thus, the higher the content, the higher the porosity, and the larger the pore-specific surface area (Figure 9c and Figure 10c). Therefore, the pore sizes and types developed by different components are different, and the diversity of shale matrix components increases the complexity of pore structures.
Clay minerals generally have two effects on the physical properties of shale reservoirs: ① a higher content of clay minerals provides a material basis for the formation of clay mineral-related pores (Figure 3); ② due to the plastic mechanical properties of clay minerals themselves, their contribution to the compaction resistance of reservoirs is weak, making existing pores more susceptible to damage during the diagenesis process, and resulting in a predominantly narrow slit type pore morphology (Figure 3). Due to the dominant position of clay mineral-related pores in the pore system of the Longtan shales in the research area, the large number of clay mineral-related pores brought by high clay mineral content makes up for the reduced compaction resistance of the reservoir. Therefore, the content of clay minerals is positively correlated with porosity, pore volume, and specific surface area (Figure 7 and Figure 9c). Meanwhile, the control effect of clay minerals on pore volume and specific surface area is more significant, indicating that numerous nano-scale clay mineral-related pores can provide more adsorption space and specific surface area for shale gas storage.
Generally speaking, skeleton minerals in shale can effectively bear the pressure during diagenesis. However, the content of skeleton minerals in this article is negatively correlated with porosity, pore volume, and specific surface area (Figure 9b). This is mainly because the contribution of clay mineral-related pores to pores in the shale of the study area is much greater than that of skeleton mineral-related pores. A high content of skeleton minerals often means a low content of clay minerals. Therefore, the content of skeleton minerals is mainly negatively correlated with the physical properties of shale.

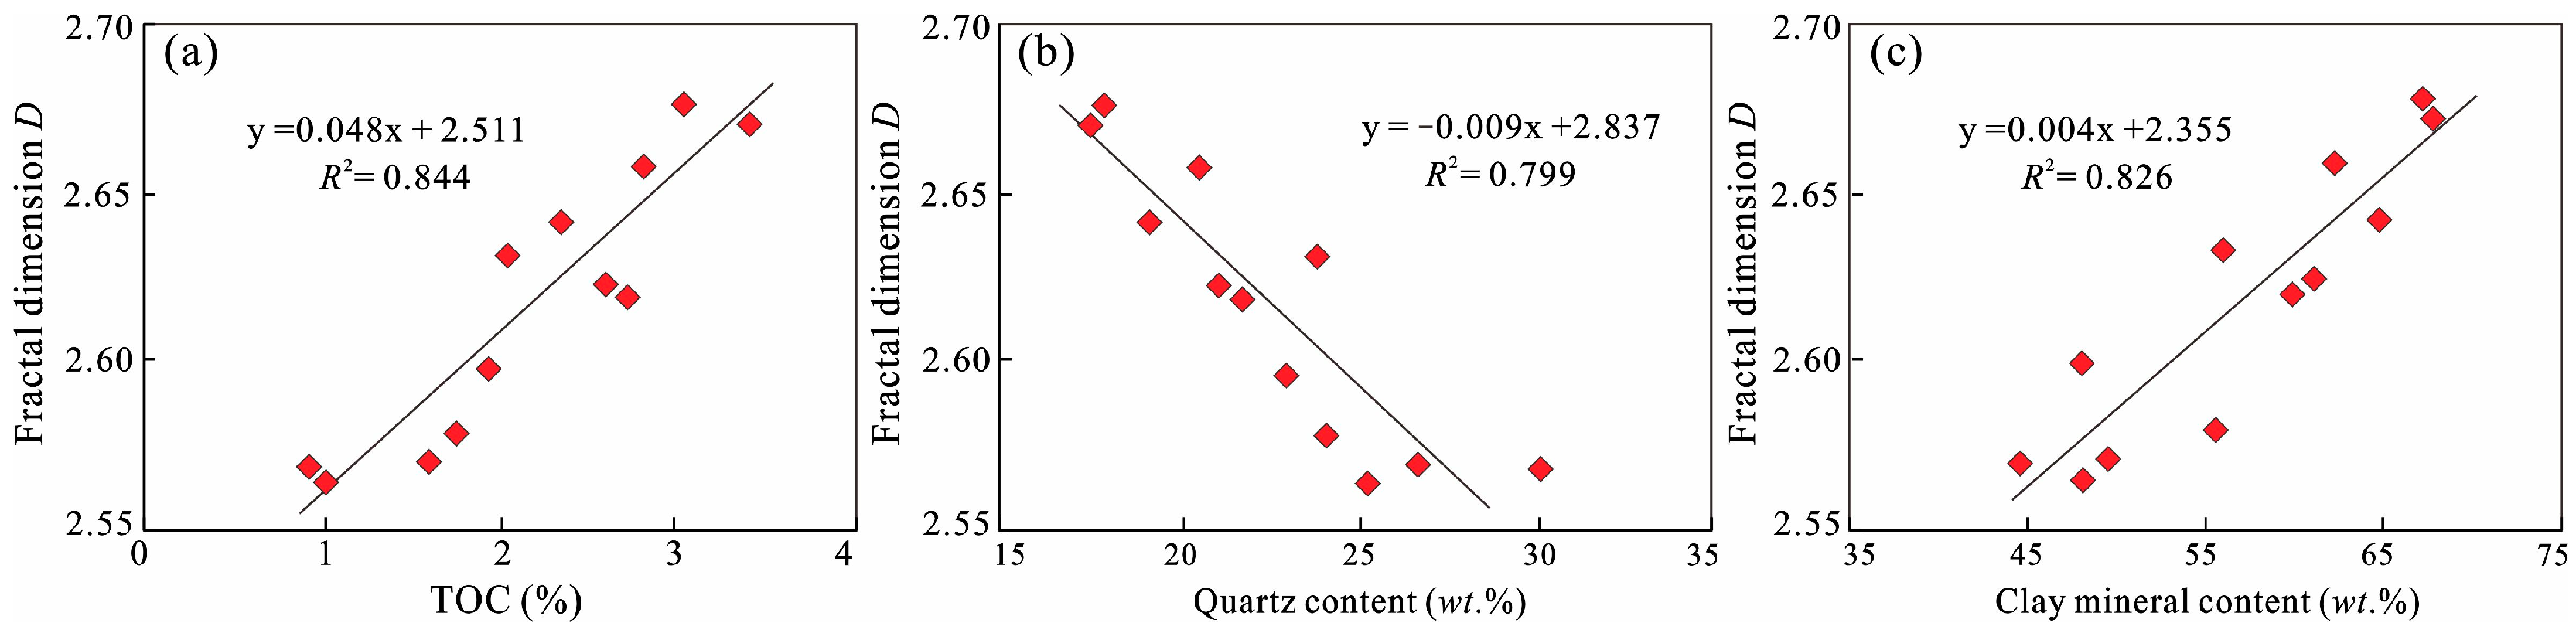
5.4. Compositional Controls on Heterogeneity

As shown in Figure 11a, there is a good positive correlation between the TOC content and fractal dimension of the Longtan Formation shale, with an R2 of 0.844. As the TOC content increases, the fractal dimension of shale also increases, which is mainly related to the development of numerous micropores in the OM of shale. Previous studies on the Longmaxi Formation shale in the Sichuan Basin, the Nenjiang Formation coal-bearing shale in the Fuxin Basin, and the Early Cretaceous and Jurassic shale in the Western Canadian Basin have shown that larger-sized pores are mainly developed in shale clay minerals, while micropores and mesopores are mainly developed in OM [12,17,18]. A large number of micropores are developed in OM, and the larger the specific surface area of micropores, the higher the OM content of the shale and the more developed the micropores are. Considering the significant positive correlation between shale pore volume, specific surface area, and organic carbon content (Figure 9a and Figure 10a), as the organic carbon content increases, the shale’s hydrocarbon generation ability increases, and the number of OM pores increases. There are more micropores in the OM pores, indicating a positive correlation between organic carbon content and the degree of micropore development, resulting in an increase in the specific surface area and pore volume of micropores. As the organic carbon content increases, the number of OM pores increases, resulting in an increase in the number of derived micropores, which contribute significantly to the specific surface area and pore volume of shale. From the physical meaning of the fractal dimension, it can be seen that the fractal dimension is a measure of pore roughness. The smaller the pores are, the more complex the pore structure is, the larger the fractal dimension of shale, and the enhanced adsorption capacity of shale, which is more conducive to the storage of natural gas.
Figure 11b,c show the correlation between the quartz content, clay mineral content, and fractal dimension of the Longtan Formation shale, respectively. The fractal dimension of shale shows a good positive correlation with quartz content but a weak negative correlation with clay mineral content. The increase in clay mineral content in shale leads to an increase in the number of micropores, which greatly contributes to the surface area and pore volume of shale, resulting in a complex pore structure and an increase in the fractal dimension of shale. The abundance of OMs and the content of clay minerals are the main factors affecting the fractal dimension of shale pores. OM pores and clay mineral particle pores are the two most important types of pores in the Longtan Formation shales, which have the greatest impact on the shale pore structural complexity. The type of OM in the Longtan Formation shale is mainly of type III kerogen [50], with strong hydrocarbon generation ability; thus, the higher the TOC would result in more OM pores (Figure 3) and the pore morphology and distribution become more uneven, resulting in an increase in fractal dimension (Figure 11). The Longtan Formation shales have diverse types of clay minerals (Figure 3), and there are differences in the development of micropore types and structures among different clay mineral particles, resulting in complex and diverse pore morphology within the clay mineral layer, including sheet-like, wedge-shaped, slit-shaped, and irregular shapes. Therefore, the higher the content of clay minerals, the more complex the morphology of pores will be, which enhances the heterogeneity of pores and increases the fractal dimension.

6. Conclusions

In this work, pore structure and heterogeneity characteristics of coal-bearing marine–continental transitional shales from the Longtan Formation in the South Sichuan Basin were investigated using TOC and mineralogical experiments, N2 adsorption–desorption experiments, and fractal dimension calculation. Pore structure parameters characteristics, relationships between heterogeneity and pore structure, compositional controls on pore structure, and compositional controls on heterogeneity were discussed. The main conclusions are as follows:
(1) The coal-bearing shale samples have complex pore structures and diverse pore types with good openness. The pore types of shale samples are mainly composed of plate-like pores, fissure pores, and ink bottle-like pores. The pore size diameter of shale samples is widely distributed, and the curves generally show a single peak or multiple peak distribution, with the main peak around 4 nm and 20–60 nm.
(2) The linear fitting relation between total pore volume and specific surface area is good, but the average pore size is negatively correlated with total pore volume and specific surface area. The fractal dimension (2.564–2.677) shows strong heterogeneity and complexity of pore structure in coal-bearing shales. The fractal dimension has a positive relationship with the total volume and the pore-specific surface but has a negative correlation with the average pore size.
(3) The fractal dimension is positively correlated with organic matter and clay mineral content and negatively correlated with brittle mineral content. The smaller the average pore diameter, the more small pores develop in OMs and clays of shale samples with a larger specific surface area, a more complex pore structure, and rough pore surface, thus resulting in a larger fractal dimension.

Author Contributions

Conceptualization, J.Z.; methodology, X.X.; software, W.L. and Y.C.; validation, M.L.; formal analysis, X.X. and W.L.; investigation, J.W.; resources, J.Z.; data curation, J.Z.; writing—original draft preparation, J.Z.; writing—review and editing, J.Z.; visualization, J.Z.; supervision, J.Z.; project administration, J.Z.; funding acquisition, J.Z. All authors have read and agreed to the published version of the manuscript.

Funding

This work is funded by the National Natural Science Foundation of China (Grant No. 42202141), the Open Fund Project of Sinopec Key Laboratory of Shale Oil/Gas Exploration and Production Technology (Grant No. 33550000-22-ZC0613-0204), and the Natural Science Foundation of Hubei Province, China (Grant No. 2021CFB370).

Data Availability Statement

The data that support the findings of this study are available from the corresponding author upon reasonable request due to privacy.

Conflicts of Interest

The authors declare that they have no conflicts of interest.

References

  1. Curtis, J.B. Fractured shale-gas systems. AAPG Bull. 2002, 86, 1921–1938. [Google Scholar]
  2. Wang, H.; Li, J.; Zhao, Q.; Lin, Y. Resources and development of new energy in China. Acta Petrol. Sin. 2009, 30, 469–474. [Google Scholar]
  3. Selley, R.C. UK shale gas: The story so far. Mar. Pet. Geol. 2012, 31, 100–109. [Google Scholar] [CrossRef]
  4. Johnson, C.; Boersma, T. Energy (in) security in Poland the case of shale gas. Energy Policy 2013, 53, 389–399. [Google Scholar] [CrossRef]
  5. Liang, C.; Jiang, Z.; Zhang, C.; Guo, L.; Yang, Y.; Li, J. The shale characteristics and shale gas exploration prospects of the Lower Silurian Longmaxi shale, Sichuan Basin, South China. J. Nat. Gas Sci. Eng. 2014, 21, 636–648. [Google Scholar] [CrossRef]
  6. Daly, H.E.; Walton, M.A. Energy Access Outlook: From Poverty to Prosperity, World Energy Outlook-2017 Special Report. Available online: https://www.oecd-ilibrary.org/energy/energy-access-outlook-2017_9789264285569-en (accessed on 10 January 2019).
  7. Fu, C.Y. China’s shale gas and shale oil resources: Opportunities and challenges. Energy Explor. Exploit. 2014, 32, 759–770. [Google Scholar] [CrossRef]
  8. Ma, Y.S.; Cai, X.Y.; Zhao, P.R. China’s shale gas exploration and development: Understanding and practice. Pet. Explor. Dev. 2018, 45, 589–603. [Google Scholar] [CrossRef]
  9. Ding, C.; He, J.; Wu, H.; Zhang, X. Nanometer pore structure characterization of taiyuan formation shale in the lin-xing area based on nitrogen adsorption experiments. Minerals 2021, 11, 298. [Google Scholar] [CrossRef]
  10. Loucks, R.G.; Reed, R.M.; Ruppel, S.C.; Jarvie, D.M. Morphology, genesis, and distribution of nanometer-scale pores in siliceous mudstones of the Mississippian Barnett shale. J. Sediment. Res. 2009, 79, 848–861. [Google Scholar] [CrossRef]
  11. Loucks, R.G.; Reed, R.M.; Ruppel, S.C.; Hammes, U. Spectrum of pore types and networks in mudrocks and a descriptive classification for matrix-related mudrock pores. AAPG Bull. 2012, 96, 1071–1098. [Google Scholar] [CrossRef]
  12. Chalmers, G.R.L.; Bustin, R.M. The organic matter distribution and methane capacity of the Lower Cretaceous strata of Northeastern British Columbia, Canada. Int. J. Coal Geol. 2007, 70, 223–239. [Google Scholar] [CrossRef]
  13. Ross, D.J.K.; Bustin, R.M. The importance of shale composition and pore structure upon gas storage potential of shale gas reservoirs. Mar. Pet. Geol. 2009, 26, 916–927. [Google Scholar] [CrossRef]
  14. Clarkson, C.R.; Freeman, M.; He, L.; Agamalian, M.; Melnichenko, Y.B.; Mastalerz, M.; Bustin, R.M.; Radlinski, A.P.; Blach, T.P. Characterization of tight gas reservoir pore structure using USANS/SANS and gas adsorption analysis. Fuel 2012, 95, 371–385. [Google Scholar] [CrossRef]
  15. Pollastro, R.M.; Jarvie, D.M.; Hill, R.J.; Adams, C.W. Geologic framework of the Mississippian Barnett Shale, Barnett-Paleozoic total petroleum system, Bend arch–Fort Worth Basin, Texas. AAPG Bull. 2007, 91, 405–436. [Google Scholar] [CrossRef]
  16. Nelson, P.H. Pore throat sizes in sandstones, tight sandstones, and shales. AAPG Bull. 2009, 93, 329–340. [Google Scholar] [CrossRef]
  17. Chalmers, G.R.; Bustin, R.M.; Power, I.M. Characterization of gas shale pore systems by porosimetry, pycnometry, surface area, and field emission scanning electron microscopy/transmission electron microscopy image analyses: Examples from the Barnett, Woodford, Haynesville, Marcellus, and Doig unit. AAPG Bull. 2012, 96, 1099–1119. [Google Scholar] [CrossRef]
  18. Chalmers, G.R.L.; Ross, D.J.K.; Bustin, R.M. Geological controls on matrix permeability of Devonian Gas Shales in the Horn River and Liard basins, northeastern British Columbia, Canada. Int. J. Coal Geol. 2012, 103, 120–131. [Google Scholar] [CrossRef]
  19. Liu, X.J.; Xiong, J.; Liang, L.X. Investigation of pore structure and fractal characteristics of organic–rich Yanchang formation shale in central China by nitrogen adsorption/desorption analysis. J. Nat. Gas Sci. Eng. 2015, 22, 62–72. [Google Scholar] [CrossRef]
  20. Niu, X.; Yan, D.; Hu, M.; Liu, Z.; Zuo, M. Controls of distinct mineral compositions on pore structure in over-mature shales: A case study of Lower Sambrian Niutitang shales in South China. Minerals 2021, 11, 51. [Google Scholar] [CrossRef]
  21. Zhang, J.Z.; Lin, W.; Li, M.T.; Wang, J.G.; Xiao, X.; Li, Y.; Zhang, X.C. Evolution Mechanism of Microscopic Pore System in Coal-Bearing Marine–Continental Transitional Shale with Increasing Maturation. Minerals 2023, 13, 1482. [Google Scholar] [CrossRef]
  22. Curtis, M.E.; Ambrose, R.; Sondergeld, C.H.; Rai, C.S. Investigation of the Relationship between Organic Porosity and Thermal Maturity in The Marcellus Shale. In Proceedings of the North American Unconventional Gas Conference and Exhibition, The Woodlands, TX, USA, 14–16 June 2011; Volume 144370, pp. 1–4. [Google Scholar]
  23. Li, J.; Zhou, S.; Li, Y.; Ma, Y.; Yang, Y.; Li, C. Effect of organic matter on pore structure of mature lacustrine organic-rich shale: A case study of the Triassic Yanchang shale, Ordos Basin, China. Fuel 2016, 185, 421–431. [Google Scholar] [CrossRef]
  24. Montgomery, S.L.; Jarvie, D.M.; Bowker, K.A.; Pollastro, R.M. Mississippian Barnett Shale, Fort Worth basin, north-central Texas: Gas-shale play with multi–trillion cubic foot potential. AAPG Bull. 2005, 90, 963–966. [Google Scholar] [CrossRef]
  25. Hill, R.J.; Zhang, E.; Katz, B.J.; Tang, Y. Modeling of gas generation from the Barnett Shale, Fort Worth Basin, Texas. AAPG Bull. 2007, 91, 501–521. [Google Scholar] [CrossRef]
  26. Ross, D.J.K.; Bustin, R.M. Impact of mass balance calculations on adsorption capacities in microporous shale gas reservoirs. Fuel 2007, 86, 2696–2706. [Google Scholar] [CrossRef]
  27. Ross, D.J.K.; Bustin, R.M. Shale gas potential of the Lower Jurassic Gordondale Member, northeastern British Columbia. Bull. Can. Pet. Geol. 2007, 55, 51–75. [Google Scholar] [CrossRef]
  28. Ross, D.J.K.; Bustin, R.M. Characterizing the shale gas resource potential of Devonian-Mississippian strata in the Western Canada sedimentary basin: Application of an integrated formation evaluation. AAPG Bull. 2008, 92, 87–125. [Google Scholar] [CrossRef]
  29. Li, A.; Ding, W.; He, J.; Dai, P.; Yin, S.; Xie, F. Investigation of pore structure and fractal characteristics of organic-rich shale reservoirs: A case study of Lower Cambrian Qiongzhusi formation in Malong block of eastern Yunnan Province, South China. Mar. Pet. Geol. 2016, 70, 46–57. [Google Scholar] [CrossRef]
  30. Chalmers, G.R.L.; Bustin, R.M. Lower Cretaceous gas shales in northeastern British Columbia, Part I: Geological controls on methane sorption capacity. Bull. Can. Pet. Geol. 2008, 56, 1–21. [Google Scholar] [CrossRef]
  31. Jarvie, D.M. Shale Resource Systems for Oil and Gas: Part 1—Shale-gas Resource Systems. AAPG Mem. 2012, 97, 89–119. [Google Scholar]
  32. Slatt, R.M.; O’Brien, N.R. Pore types in the Barnett and Woodford gas shales: Contribution to understanding gas storage and migration pathways in fine-grained rocks. AAPG Bull. 2011, 95, 2017–2030. [Google Scholar] [CrossRef]
  33. Li, Z.W.; Tang, Z.L.; Zheng, W.Q. Micropore Structural Heterogeneity of Siliceous Shale Reservoir of the Longmaxi Formation in the Southern Sichuan Basin, China. Minerals 2019, 9, 548. [Google Scholar] [CrossRef]
  34. Jarvie, D.M.; Hill, R.J.; Ruble, T.E.; Pollastro, R.M. Unconventional shale-gas systems: The Mississippian Barnett Shale of north-central Texas as one model for thermogenic shale-gas assessment. AAPG Bull. 2007, 91, 475–499. [Google Scholar] [CrossRef]
  35. Fishman, N.S.; Hackley, P.C.; Lowers, H.A.; Hill, R.J.; Egenhoff, S.O.; Eberl, D.D.; Blum, A.E. The nature of porosity in organic-rich mudstones of the Upper Jurassic Kimmeridge Clay Formation, North Sea, offshore United Kingdom. Int. J. Coal Geol. 2012, 103, 32–50. [Google Scholar] [CrossRef]
  36. Hu, H.; Hao, F.; Lin, J.; Lu, Y.; Ma, Y.; Li, Q. Organic matter-hosted pore system in the Wufeng-Longmaxi (O3w-S11) shale, Jiaoshiba area, Eastern Sichuan Basin, China. Int. J. Coal Geol. 2017, 173, 40–50. [Google Scholar] [CrossRef]
  37. Klaver, J.; Hemes, S.; Houben, M.; Desbois, G.; Radi, Z.; Urai, J.L. The connectivity of pore space in mudstones: Insights from high-pressure Wood’s metal injection, BIB–SEM imaging, and mercury intrusion porosimetry. Geofluids 2015, 15, 577–591. [Google Scholar] [CrossRef]
  38. Curtis, M.E.; Sondergeld, C.H.; Ambrose, R.J.; Rai, C.S. Microstructural investigation of gas shales in two and three dimensions using nanometer–scale resolution imaging. AAPG Bull. 2012, 96, 665–677. [Google Scholar] [CrossRef]
  39. Chen, Q.; Zhang, J.; Tang, X.; Li, W.; Li, Z. Relationship between pore type and pore size of marine shale: An example from the Sinian–Cambrian formation, upper Yangtze region, South China. Int. J. Coal Geol. 2016, 158, 13–28. [Google Scholar] [CrossRef]
  40. Avnir, D.; Jaroniec, M. An isotherm equation for adsorption on fractal surfaces of heterogeneous porous materials. Langmuir 1989, 5, 1431–1433. [Google Scholar] [CrossRef]
  41. Zhang, J.Z.; Li, X.Q.; Wei, Q.; Gao, W.J.; Liang, W.L.; Wang, Z.; Wang, F.Y. Quantitative characterization of pore-fracture system of organic-rich marine-continental shale reservoirs: A case study of the Upper Permian Longtan Formation, Southern Sichuan Basin, China. Fuel 2017, 200, 272–281. [Google Scholar] [CrossRef]
  42. Zhang, J.Z.; Li, X.Q.; Xie, Z.Y.; Li, J.; Zhang, X.Q.; Sun, K.X.; Wang, F.Y. Characterization of microscopic pore types and structures in marine shale: Examples from the Upper Permian Dalong formation, Northern Sichuan Basin, South China. J. Nat. Gas Sci. Eng. 2018, 59, 326–342. [Google Scholar] [CrossRef]
  43. Tang, X.; Jiang, Z.; Jiang, S.; Li, Z. Heterogeneous nanoporosity of the Silurian Longmaxi Formation shale gas reservoir in the Sichuan Basin using the QEMSCAN, FIB-SEM, and nano-CT methods. Mar. Pet. Geol. 2016, 78, 99–109. [Google Scholar] [CrossRef]
  44. Zhang, J.Z.; Li, X.Q.; Wei, Q.; Sun, K.X.; Zhang, G.W.; Wang, F.Y. Characterization of full-sized pore structure and fractal characteristics of marine–continental transitional Longtan formation shale of Sichuan Basin, South China. Energy Fuels 2017, 31, 10490–10504. [Google Scholar] [CrossRef]
  45. Wu, J.G.; Luo, Y.; Bai, Y.D.; Wang, A. Characteristics of Pore Types of Weibei Gas Shales: An Investigation by FE-SEM with Ar-Ion Milling. Adv. Mater. Res. 2014, 955–959, 3470–3473. [Google Scholar] [CrossRef]
  46. Yang, F.; Ning, Z.; Wang, Q.; Zhang, R.; Krooss, B.M. Pore structure characteristics of lower Silurian shales in the southern Sichuan Basin, China: Insights to pore development and gas storage mechanism. Int. J. Coal Geol. 2016, 156, 12–24. [Google Scholar] [CrossRef]
  47. Klaver, J.; Desbois, G.; Littke, R.; Urai, J.L. BIB-SEM pore characterization of mature and post mature Posidonia Shale samples from the Hils area, Germany. Int. J. Coal Geol. 2016, 158, 78–89. [Google Scholar] [CrossRef]
  48. Leu, L.; Georgiadis, A.; Blunt, M.J.; Busch, A.; Bertier, P.; Schweinar, K.; Liebi, M.; Menzel, A.; Ott, H. Multiscale description of shale pore systems by scanning SAXS and WAXS microscopy. Energy Fuels 2016, 30, 10282–10297. [Google Scholar] [CrossRef]
  49. Aslannejad, H.; Hassanizadeh, S.M.; Raoof, A.; Winter, D.A.M.D.; Tomozeiu, N.; Genuchten, M.T.V. Characterizing the hydraulic properties of a porous coating of paper using FIB-SEM tomography and 3D pore-scale modeling. Chem. Eng. Sci. 2016, 160, 275–280. [Google Scholar] [CrossRef]
  50. Zhang, J.Z.; Li, X.Q.; Zou, X.Y.; Zhao, G.J.; Zhou, B.G.; Li, J.; Xie, Z.Y.; Wang, F.Y. Characterization of full-sized pore structure of coal-bearing shales and its effect on shale gas content. Energy Fuels 2019, 33, 1969–1982. [Google Scholar] [CrossRef]
  51. Krohn, C.E. Fractal measurements of sandstone, shales and carbonates. J. Geophys. Res. Solid Earth 1988, 93, 3297–3305. [Google Scholar] [CrossRef]
  52. Mandelbrot, B.B. The Fractal Geometry of Nature; Freeman: San Francisco, CA, USA, 1982; pp. 1–10. [Google Scholar]
  53. Mishra, S.; Mendhe, V.A.; Varma, A.K.; Kamble, A.D.; Sharma, S.; Bannerjee, M.; Kalpanad, M.S. Influence of organic and inorganic content on fractal dimensions of Barakar and Barren Measures shale gas reservoirs of Raniganj basin, India. J. Nat. Gas Sci. Eng. 2018, 49, 393–409. [Google Scholar] [CrossRef]
  54. Yang, F.; Ning, Z.; Liu, H. Fractal characteristics of shales from a shale gas reservoir in the Sichuan Basin, China. Fuel 2014, 115, 378–384. [Google Scholar] [CrossRef]
  55. Zhang, J.Z.; Li, X.Q.; Zhang, G.W.; Zou, X.Y.; Wang, F.Y.; Tang, Y.J. Microstructural investigation of different nanopore types in marine-continental transitional shales: Examples from the Longtan formation in Southern Sichuan Basin, south China. Mar. Pet. Geol. 2019, 110, 912–927. [Google Scholar] [CrossRef]
  56. Zhang, J.Z.; Tang, Y.J.; He, D.X.; Sun, P.; Zou, X.Y. Full-scale nanopore system and fractal characteristics of clay-rich lacustrine shale combining FE-SEM, nano-CT, gas adsorption and mercury intrusion porosimetry. Appl. Clay Sci. 2020, 196, 105758. [Google Scholar] [CrossRef]
  57. Chen, S.B.; Zhu, Y.M.; Wang, H.Y.; Liu, H.L.; Wei, W.; Fang, J.H. Shale gas reservoir characterization: A typical case in the southern Sichuan Basin of China. Energy 2011, 36, 6609–6616. [Google Scholar] [CrossRef]
  58. Yang, H.; Lin, L.; Chen, L.; Yu, Y.; Li, D.; Tian, J.; Zhou, W.; He, J. Characteristics of Mineralogy, Lithofacies of Fine-Grained Sediments and Their Relationship with Sedimentary Environment: Example from the Upper Permian Longtan Formation in the Sichuan Basin. Energies 2021, 14, 3662. [Google Scholar] [CrossRef]
  59. Tan, L.; Liu, H.; Zhou, G.; Tang, S.; Zeng, Y.X.; Li, M.; Li, M.H.; Hu, D. Characteristics of Permian igneous rocks and their petroleum geology implications in the northern part of central Sichuan, Sichuan Basin, China. Interpretation 2023, 3, 11. [Google Scholar] [CrossRef]
  60. Chen, Y.N.; Pei, X.Y.; Zhang, J.Z.; Wang, N.; Han, D.L.; Wang, J.; Xiao, X.; Wang, J.G. Geochemical and gas bearing characteristics of the marine-continental transitional Longtan shales in southern Sichuan, China. Front. Earth Sci. 2023, 11, 1202005. [Google Scholar] [CrossRef]
  61. Wang, M.; Xue, H.T.; Tian, S.S.; Wilkins, R.W.T.; Wang, Z.W. Fractal characteristics of Upper Cretaceous lacus trine shale from the Songliao Basin, NE China. Mar. Pet. Geol. 2015, 67, 144–153. [Google Scholar] [CrossRef]
  62. Pyun, S.I.; Rhee, C.K. An investigation of fractal characteristics of mesoporous carbon electrodes with various pore structures. Electrochim. Acta 2004, 49, 4171–4180. [Google Scholar] [CrossRef]
  63. Yao, Y.B.; Liu, D.M.; Tang, D.Z.; Tang, S.H.; Huang, W.H. Fractal characterization of adsorption–pores of coals from North China: An investigation on CH4 adsorption capacity of coals. Int. J. Coal Geol. 2008, 73, 27–42. [Google Scholar] [CrossRef]
  64. Brunauer, S.; Emmett, P.H.; Teller, E. Adsorption of Gases in Multimolecular Layers. J. Am. Chem. Soc. 1938, 60, 309–319. [Google Scholar] [CrossRef]
  65. Barrett, E.P.; Joyner, L.G.; Halenda, P.P. The Determination of Pore Volume and Area Distributions in Porous Substances I Computations from Nitrogen Isotherms. J. Am. Chem. Soc. 1951, 73, 373–380. [Google Scholar] [CrossRef]
  66. Bustin, R.M.; Clarkson, C.R. Geological controls on coalbed methane reservoir capacity and gas content. Int. J. Coal Geol. 1998, 38, 3–26. [Google Scholar] [CrossRef]
  67. Curtis, M.E.; Cardott, B.J.; Sondergeld, C.H.; Rai, C.S. Development of organic porosity in the Woodford Shale with increasing thermal maturity. Int. J. Coal Geol. 2012, 103, 26–31. [Google Scholar] [CrossRef]
  68. Clarkson, C.R.; Solano, N.R.; Bustin, R.M.; Bustin, A.M.M.; Blach, T.P. Pore structure characterization of North American shale gas reservoirs;using USANS/SANS, gas adsorption, and mercury intrusion. Fuel 2013, 103, 606–616. [Google Scholar] [CrossRef]
  69. Gasparik, M.; Bertier, P.; Gensterblum, Y.; Ghanizadeh, A.; Krooss, B.M.; Littke, R. Geological controls on the methane storage capacity in organic-rich shales. Int. J. Coal Geol. 2014, 123, 34–51. [Google Scholar] [CrossRef]
  70. Metwally, Y.M.; Chesnokov, E.M. Clay mineral transformation as a major source for authigenic quartz in thermo-mature gas shale. Appl. Clay Sci. 2012, 55, 138–150. [Google Scholar] [CrossRef]
  71. Behar, F.; Vandenbroucke, M. Chemical modelling of kerogens. Org. Geochem. 1987, 11, 15–24. [Google Scholar] [CrossRef]
  72. Rouquérol, J.; Avnir, D.; Fairbridge, C.W.; Everett, D.H.; Haynes, J.H.; Pernicone, N.; Ramsay, J.D.F.; Sing, K.S.W.; Unger, K. Physical chemistry division commission on colloid and surface chemistry, subcommittee on characterization of porous solids: Recommendations for the characterization of porous solids. Pure Appl. Chem. 1994, 66, 1739–1758. [Google Scholar]
  73. Ko, L.T.; Ruppel, S.T.; Loucks, R.G.; Hackley, P.C.; Zhang, T.W.; Shao, D.Y. Pore-types and pore-network evolution in Upper Devonian-Lower Mississippian Woodford and Mississippian Barnett mudstones: Insights from laboratory thermal maturation and organic petrology. Int. J. Coal Geol. 2018, 190, 3–28. [Google Scholar] [CrossRef]
  74. Zhang, X.; Wu, C.; He, J.; Ren, Z.; Zhou, T. The controlling effects of compositions on nanopore structure of over-mature shale from the longtan formation in the laochang area, eastern yunnan, china. Minerals 2019, 9, 403. [Google Scholar] [CrossRef]
  75. Guan, Q.Z.; Dong, D.Z.; Wang, S.F.; Huang, J.L.; Wang, Y.M.; Lu, H.; Zhang, C.C. Preliminary study on shale gas micro-reservoir characteristics of the lower silurian Longmaxi formation in the southern Sichuan basin, China. J. Nat. Gas Sci. Eng. 2016, 31, 382–395. [Google Scholar] [CrossRef]
  76. Rexer, T.F.; Mathia, E.J.; Aplin, A.C.; Thomas, K.M. High-Pressure Methane Adsorption and Characterization of Pores in Posidonia Shales and Isolated Kerogens. Energy Fuels 2014, 28, 2886–2901. [Google Scholar] [CrossRef]
  77. Wang, F.; Guo, S. Shale gas content evolution in the Ordos basin. Int. J. Coal Geol. 2019, 211, 103231. [Google Scholar] [CrossRef]
  78. Wang, P.F.; Zhang, C.; Li, X.; Zhang, K.; Yuan, Y.; Zang, X.P.; Cui, W.J.; Liu, S.Y.; Jiang, Z.X. Organic matter pores structure and evolution in shales based on the he ion microscopy (HIM): A case study from the Triassic Yanchang, Lower Silurian Longmaxi and Lower Cambrian Niutitang shales in China. J. Nat. Gas Sci. Eng. 2020, 84, 103682. [Google Scholar] [CrossRef]
Figure 1. (a) Location of the study area, (b) distribution of shale thickness, TOC and maturity in the Longtan Formation from Sichuan basin (modified after [57,58,59,60]).
Minerals 14 00588 g001
Figure 2. Comprehensive stratigraphic column chart of the Longtan Formation of the Upper Permian in the southern Sichuan Basin (modified after [57,58,59,60]).
Minerals 14 00588 g002
Figure 3. SEM images of coal-bearing marine–continental transitional shales from the Longtan Formation in the South Sichuan Basin. (a) 3049.99 m, interpartile pores of clay minerals; (b) YJ1-5, 3034.60 m OM pores; (c) LJ1-4, 3175.16 m, OM pores; (d) LJ1-8, 3179.30 m, grain-rims fracture; (e) ZG1-9, 2952.50 m, OM pores; (f) ZG1-2, 2948.80 m, clay mineral shrinkage fractures.
Minerals 14 00588 g003
Figure 4. (al) Low pressure N2 adsorption–desorption isotherms of the Longtan shales from the southern Sichuan Basin.
Minerals 14 00588 g004
Figure 5. (al) Pore volume distribution with pore size of the Longtan shales from the southern Sichuan Basin obtained from the adsorption branch of isotherms using the BJH method.
Minerals 14 00588 g005
Figure 6. (al) Plots of ln(V) vs ln(ln(P0/P)) reconstructed from the adsorption branch of the N2 adsorption–desorption isotherms of the Longtan shale samples.
Minerals 14 00588 g006
Figure 7. Relationships between the fractal dimension and total pore volume (a), specific surface area (b), and average pore size (c).
Minerals 14 00588 g007
Figure 8. Relationships between fractal dimension and total pore volume (a), specific surface area (b), and average pore size (c).
Minerals 14 00588 g008
Figure 9. Relationships between total pore volume and TOC (a), quartz contents (b), and clay minerals contents (c).
Minerals 14 00588 g009
Figure 10. Relationships between pore surface area and TOC (a), quartz contents (b), and clay minerals contents (c).
Minerals 14 00588 g010
Figure 11. Relationships between fractal dimension and TOC (a), quartz contents (b), and clay minerals contents (c).
Minerals 14 00588 g011
Table 1. TOC and mineral composition (wt.%) of the Longtan shales in the Southern Sichuan Basin.
Sample IDDepth/mSedimentary FaciesTOC/%ClayQuartzOrthoclaseAnorthoseCalciteDolomitePyriteOthers
YJ1-33026.56 Tidal flat6.6062.07 20.55 1.76 2.60 4.50 3.82 1.58 3.13
YJ1-43029.85 Tidal flat6.3659.70 21.84 2.64 4.34 4.50 3.24 1.11 2.64
YJ1-53034.60 Lagoon7.1467.00 17.88 1.76 1.73 4.50 3.15 2.31 1.67
YJ1-63049.99Lagoon6.1161.02 21.12 1.76 2.60 5.39 4.20 1.92 1.99
LJ1-13164.87 Lagoon5.5064.54 19.22 1.76 1.73 4.50 3.82 1.57 2.87
LJ1-43175.16 Lagoon7.9867.70 17.50 1.76 0.87 2.70 4.77 2.11 2.59
LJ1-83179.30 Lagoon3.7749.31 26.74 3.52 2.60 5.39 2.67 4.57 5.19
LJ1-103180.32 Lagoon4.8255.91 23.89 4.40 5.20 1.80 3.15 3.43 2.22
ZG1-22948.80 Tidal flat2.2044.38 30.14 6.15 2.60 2.90 2.48 5.86 5.49
ZG1-42949.20 Lagoon4.5447.82 23.22 3.52 1.73 0.90 5.82 4.30 12.70
ZG1-92952.50 Lagoon2.3947.90 25.34 6.15 2.60 0.08 6.87 6.20 4.85
ZG1-112974.70 Lagoon4.1255.40 24.17 4.40 5.20 2.70 3.24 1.43 3.46
Table 2. Pore structure parameters of shale samples from N2 adsorption–desorption isotherms.
Sample IDTotal Pore Volume (cm3/g)Specific Surface Area (m2/g)Average Pore Diameter (nm)Sample IDTotal Pore Volume (cm3/g)Specific Surface Area (m2/g)Average Pore Diameter (nm)
YJ1-30.02810.3274.06LJ1-80.0207.4281.88
YJ1-40.0217.3655.95LJ1-100.0247.0897.86
YJ1-50.02611.7156.78ZG1-20.0195.02113.11
YJ1-60.0279.6367.01ZG1-40.0267.9497.74
LJ1-10.02610.2364.44ZG1-90.0196.47103.88
LJ1-40.02712.8757.26ZG1-110.0228.0288.22
Table 3. Fractal dimensions derived from fractal FHH model based on N2 adsorption–desorption data.
Sample IDFractal Fitting Equation DR2Sample IDFractal Fitting Equation DR2
YJ1-3y = −0.3421x + 1.19872.6579 0.9882 LJ1-8y = −0.4300x + 1.06732.5700 0.9946
YJ1-4y = −0.3811x + 1.07572.6189 0.9805 LJ1-10y = −0.3681x + 0.89302.6319 0.9988
YJ1-5y = −0.3232x + 1.45372.6768 0.9811 ZG1-2y = −0.4311x + 0.56662.5689 0.9987
YJ1-6y = −0.3767x + 1.16392.6233 0.9822 ZG1-4y = −0.4018x +0.92342.5982 0.9946
LJ1-1y = −0.3587x + 1.22382.6413 0.9826 ZG1-9y = −0.4359x + 0.86322.5641 0.9976
LJ1-4y = −0.3292x + 1.51972.6708 0.9803 ZG1-11y = −0.4214x + 1.08982.5786 0.9944
Disclaimer/Publisher’s Note: The statements, opinions and data contained in all publications are solely those of the individual author(s) and contributor(s) and not of MDPI and/or the editor(s). MDPI and/or the editor(s) disclaim responsibility for any injury to people or property resulting from any ideas, methods, instructions or products referred to in the content.

