

Elucidating the Genetic Mechanism and the Ore-Forming Materials of the Kaladawan Iron Deposit in the North Altyn Tagn, Western China
 ,
,
Abstract
:
1. Introduction
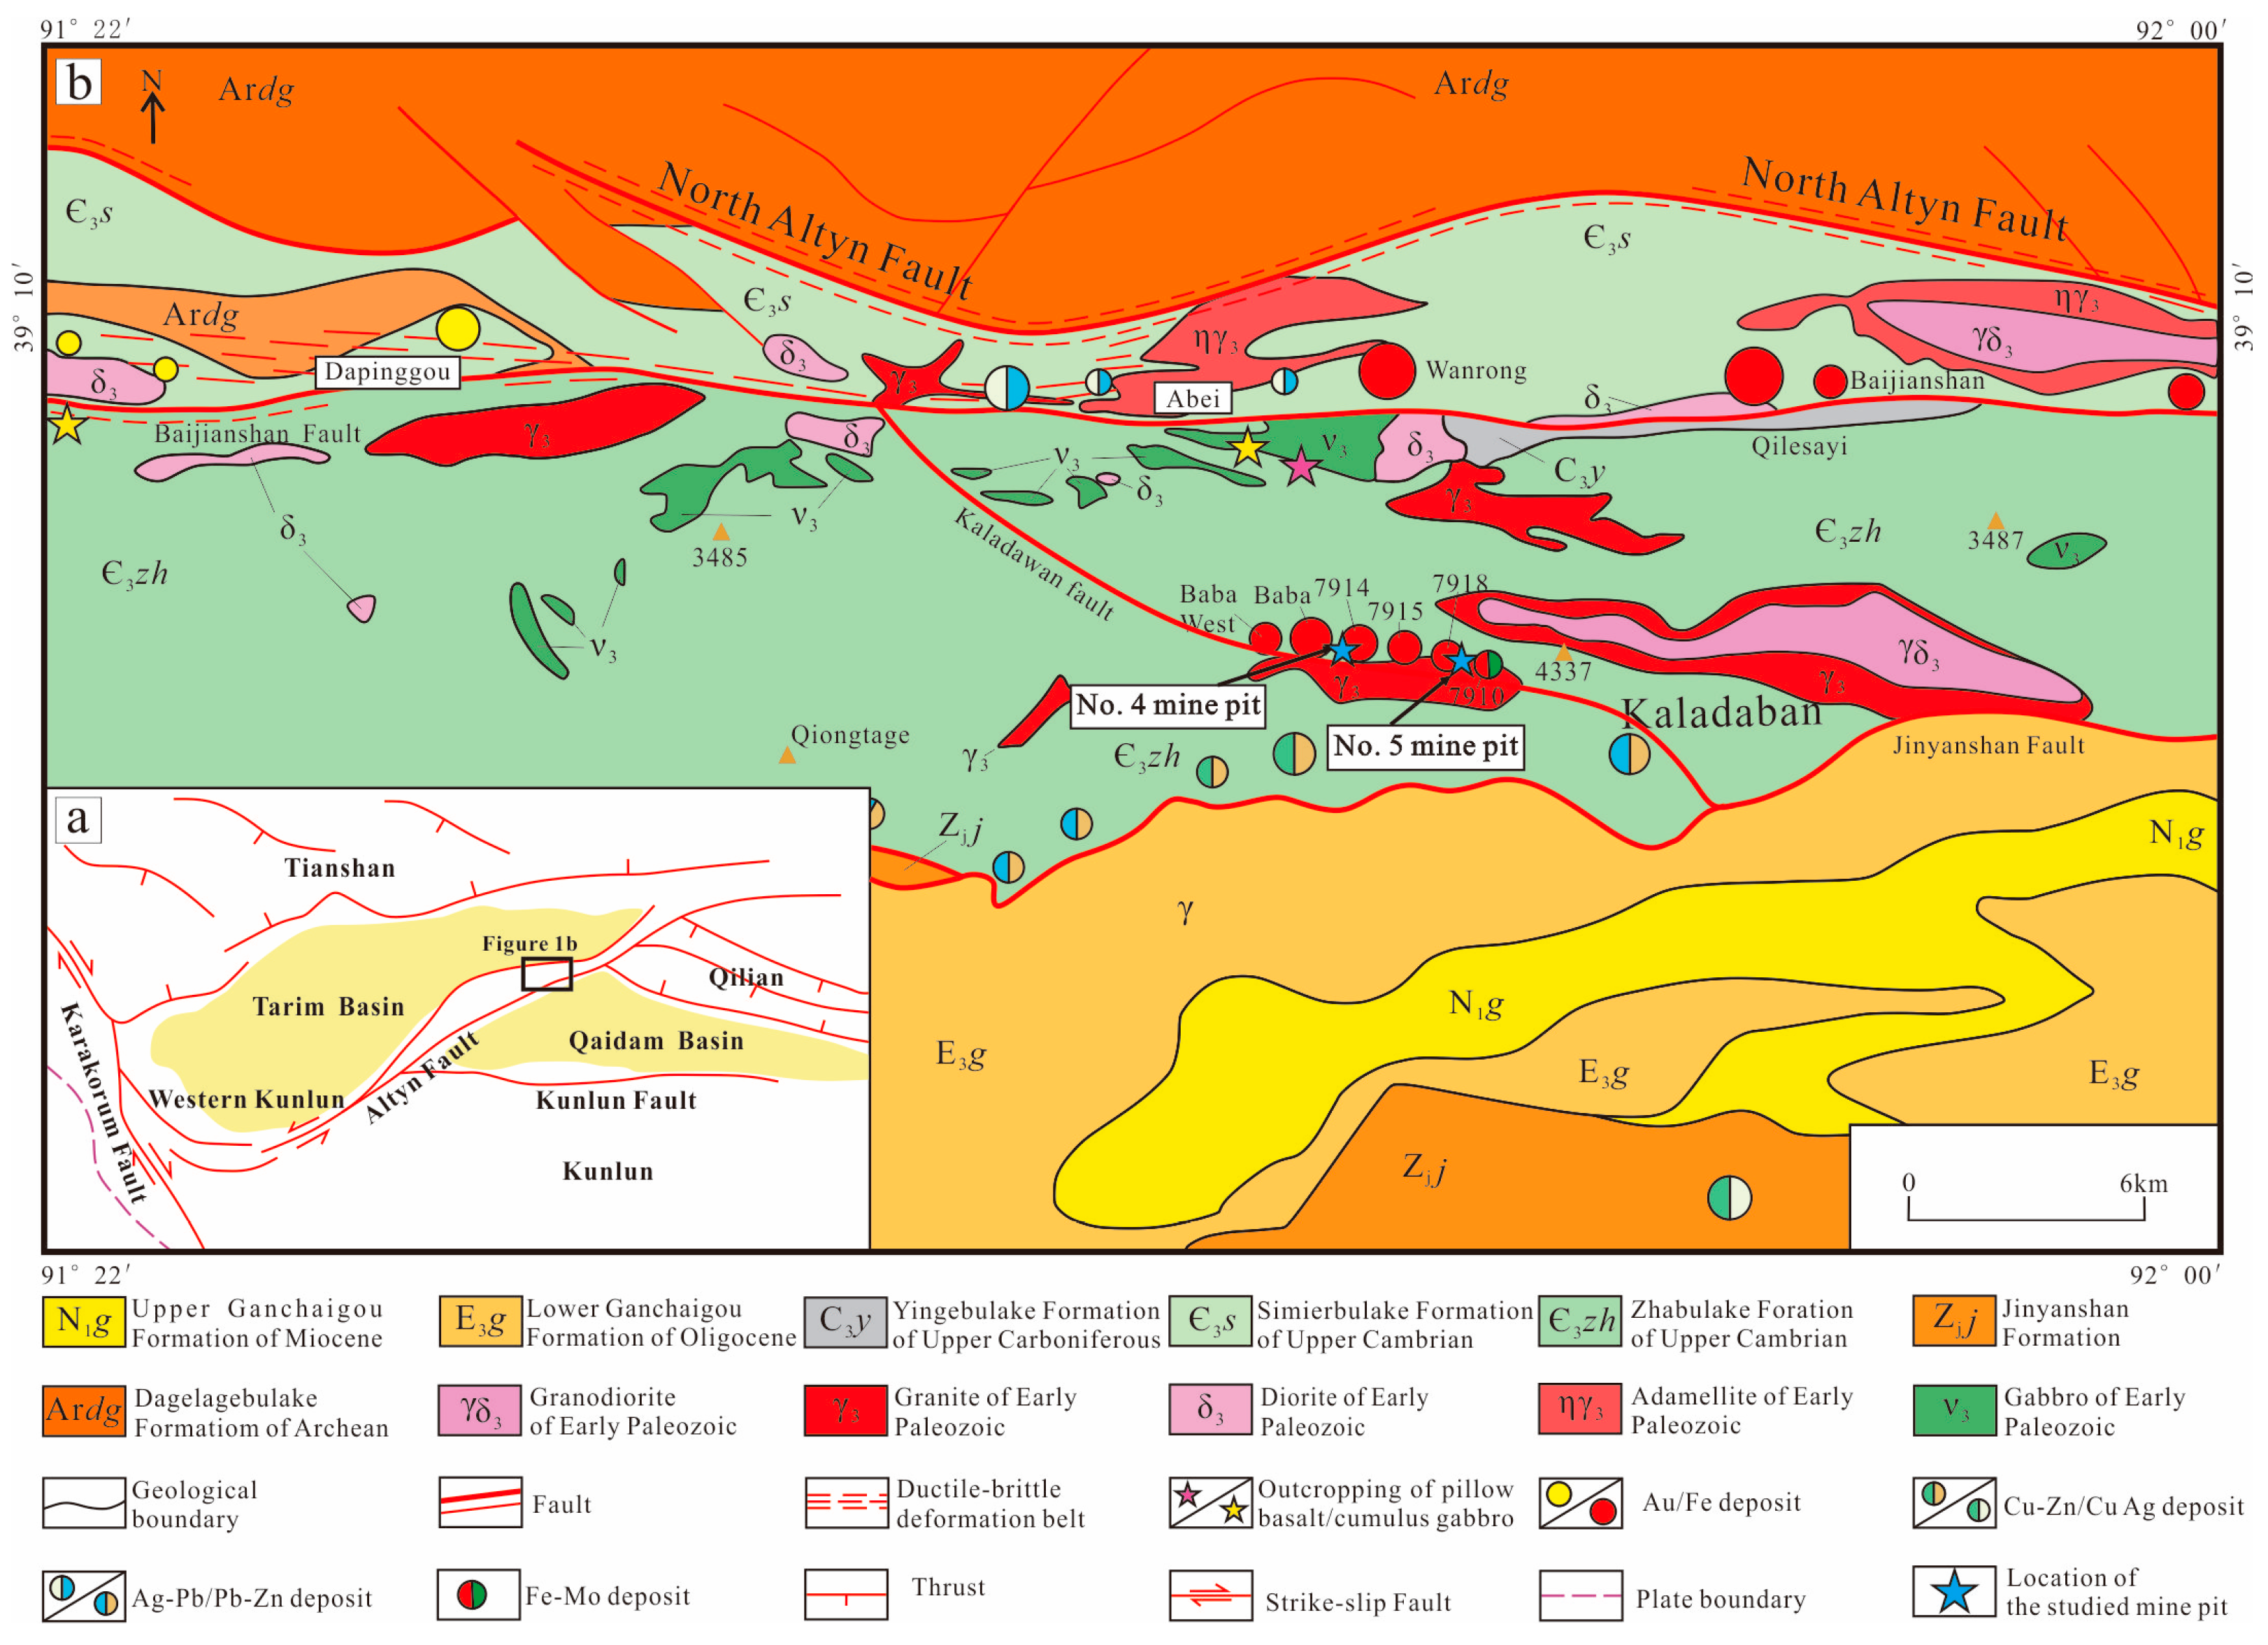
2. Geological Background
3. Samples
3.1. No. 5 Mine Pit
3.2. No. 4 Mine Pit
4. Petrography and Mineralogy
4.1. Rhyodacite/Rhyolite
4.2. Granodiorite
4.3. Altered Basalt
4.4. Iron Ore
5. Analytical Methods
5.1. Whole-Rock Chemistry Analyses
5.2. Magnetite Trace Element Analyses
5.3. Fe Isotope Analyses
6. Results
6.1. Whole-Rock Chemistry
6.1.1. Rhyodacite/Rhyolite

6.1.2. Altered Basalt
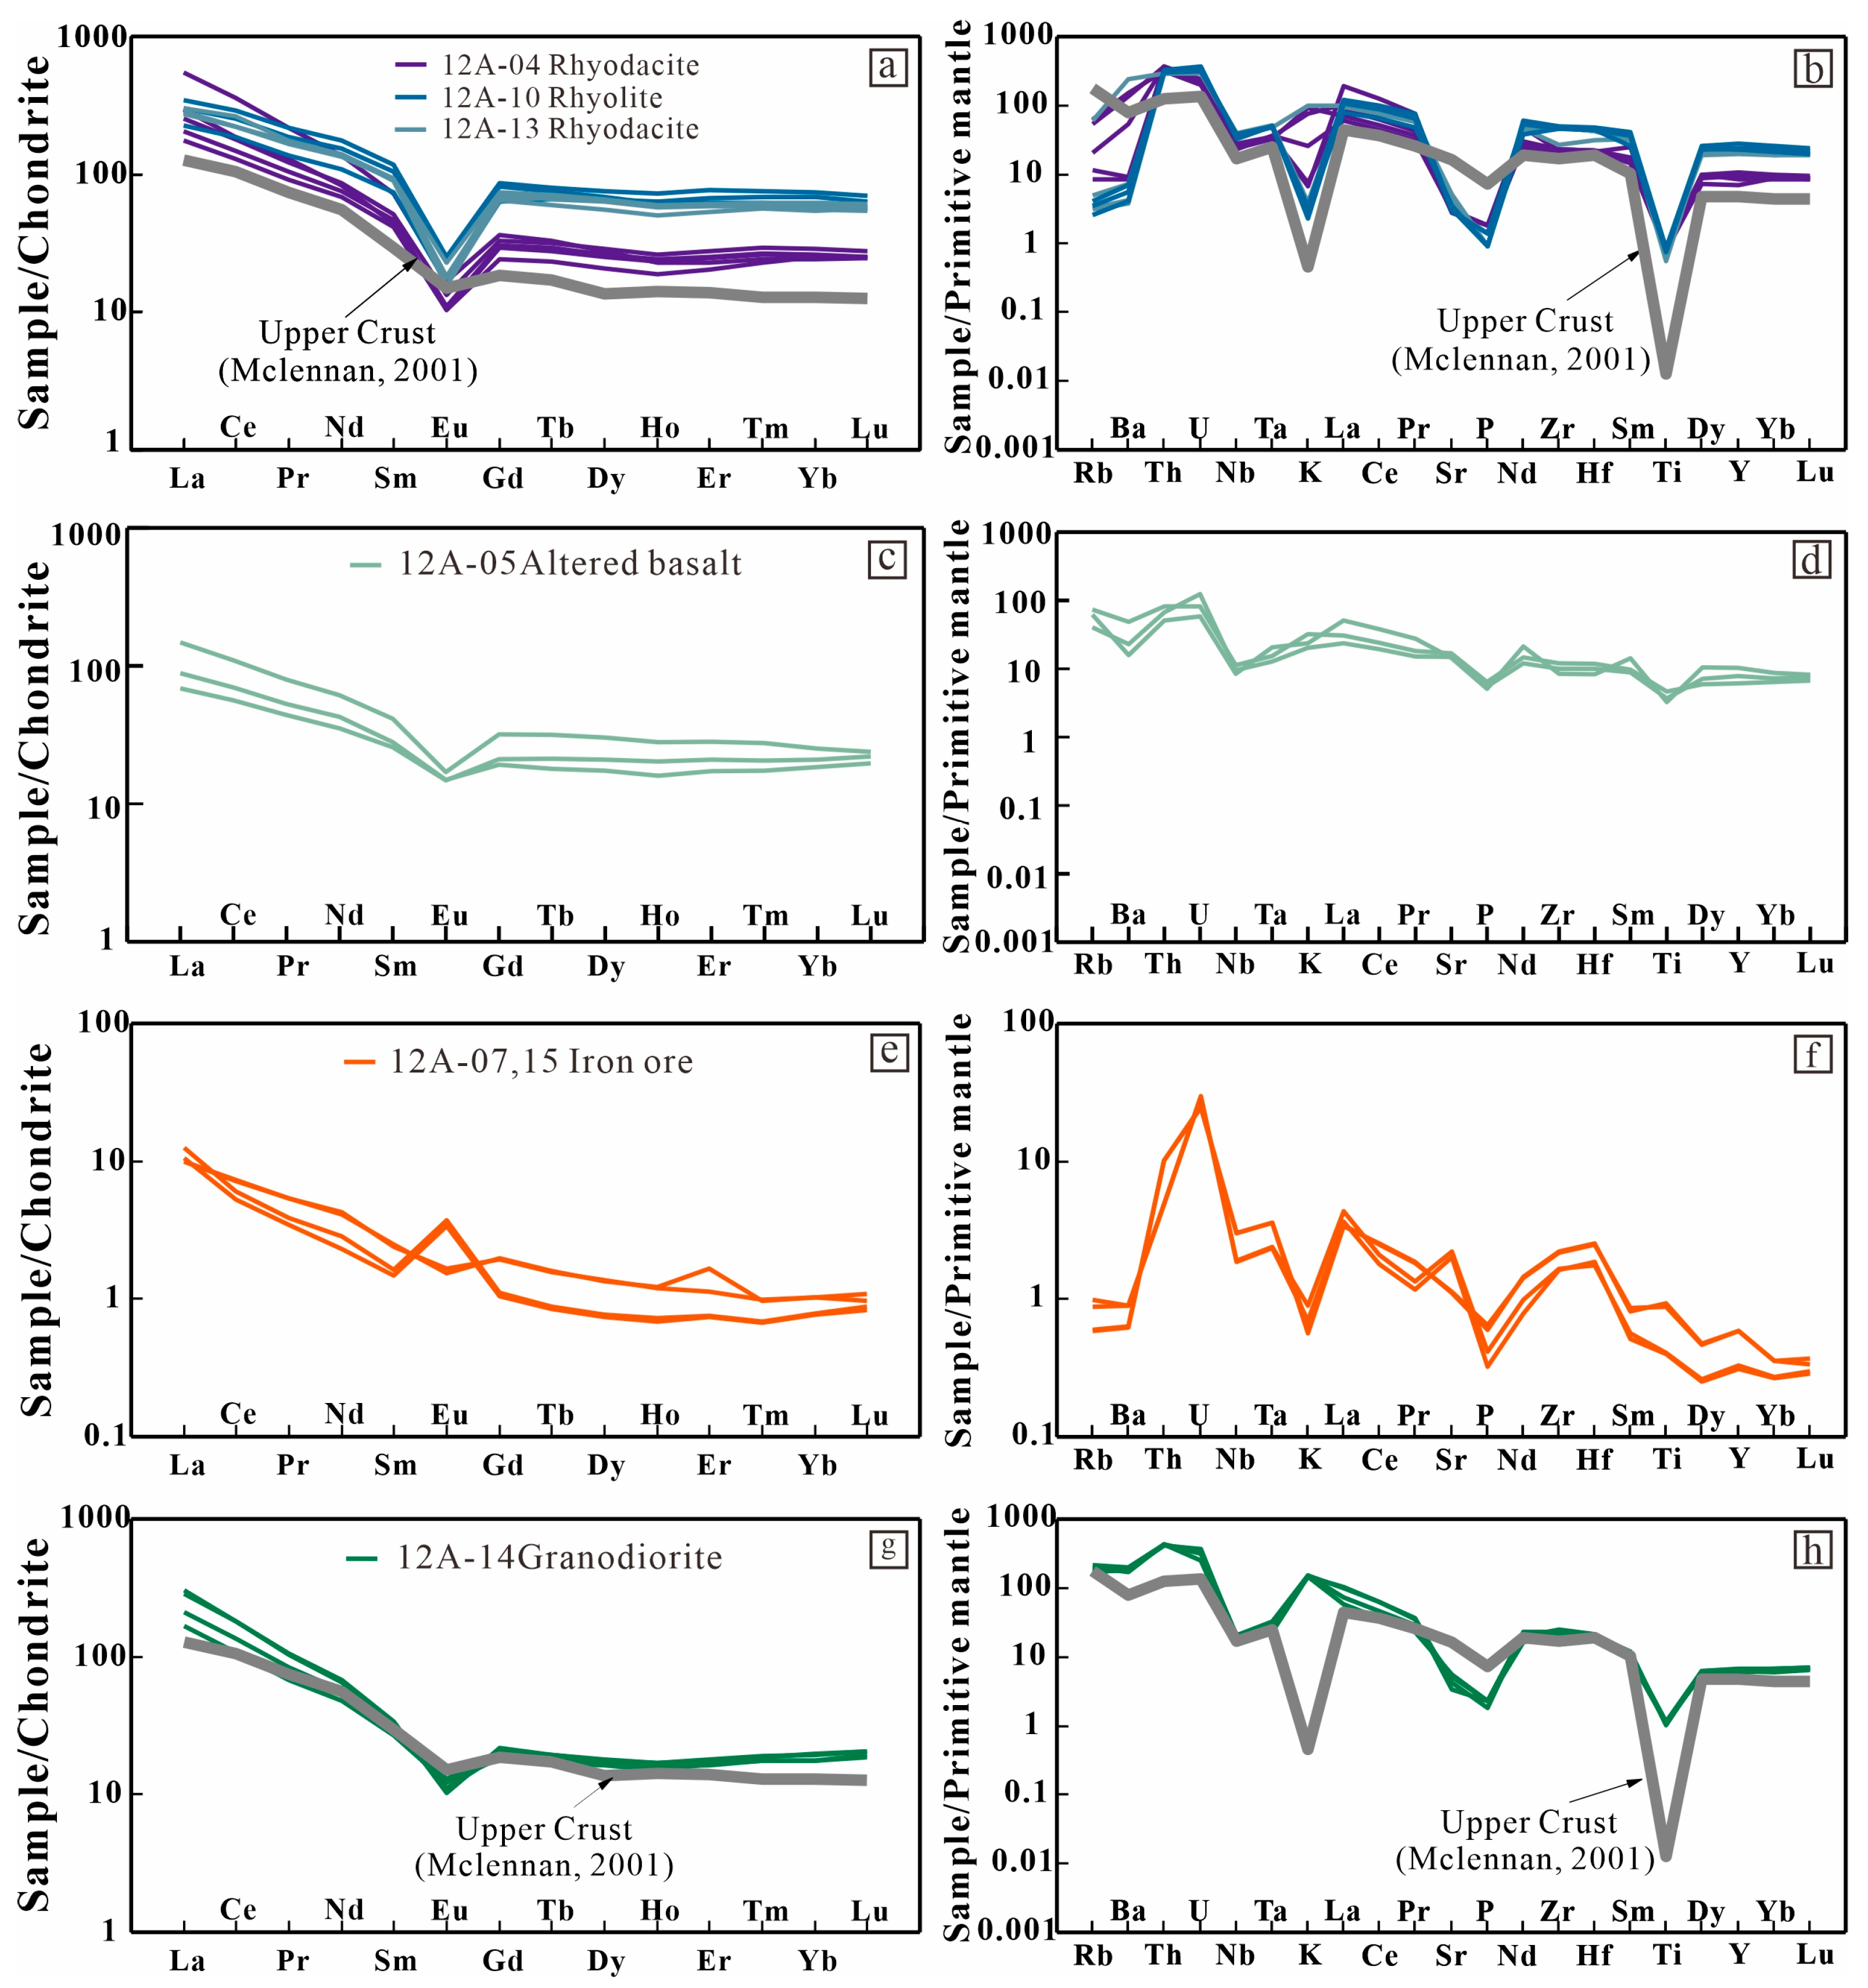
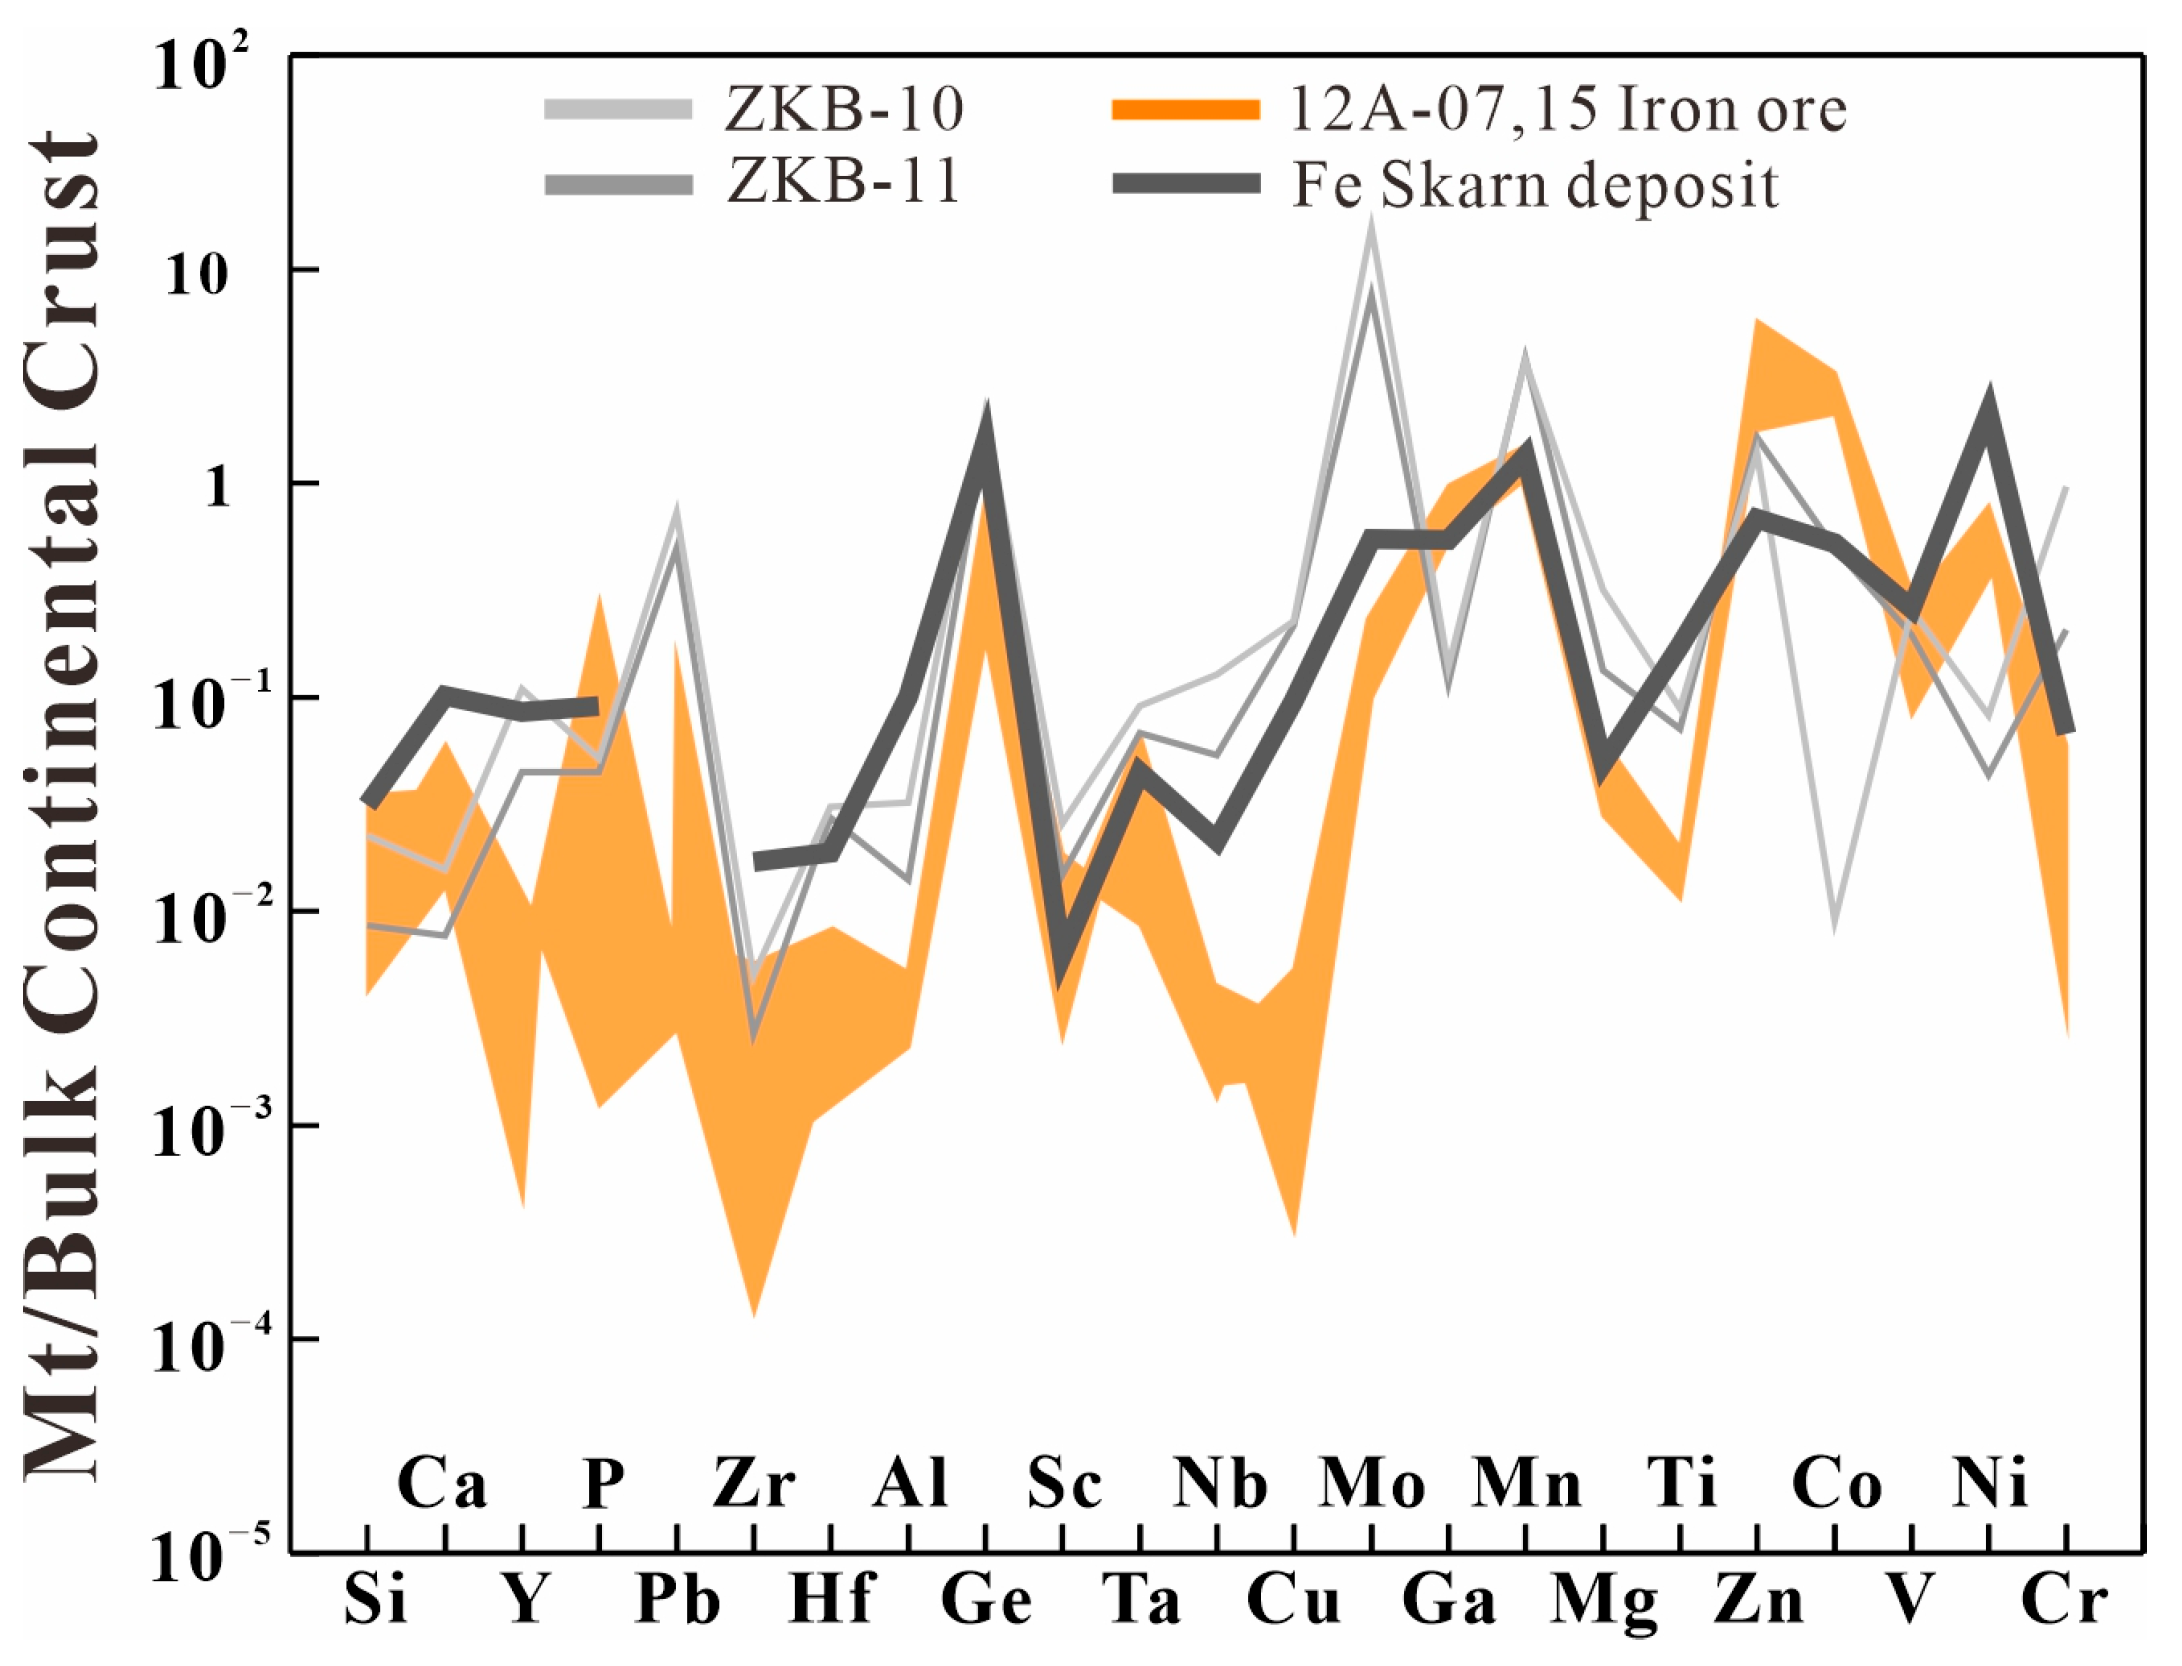
6.1.3. Iron Ore
6.1.4. Granodiorite
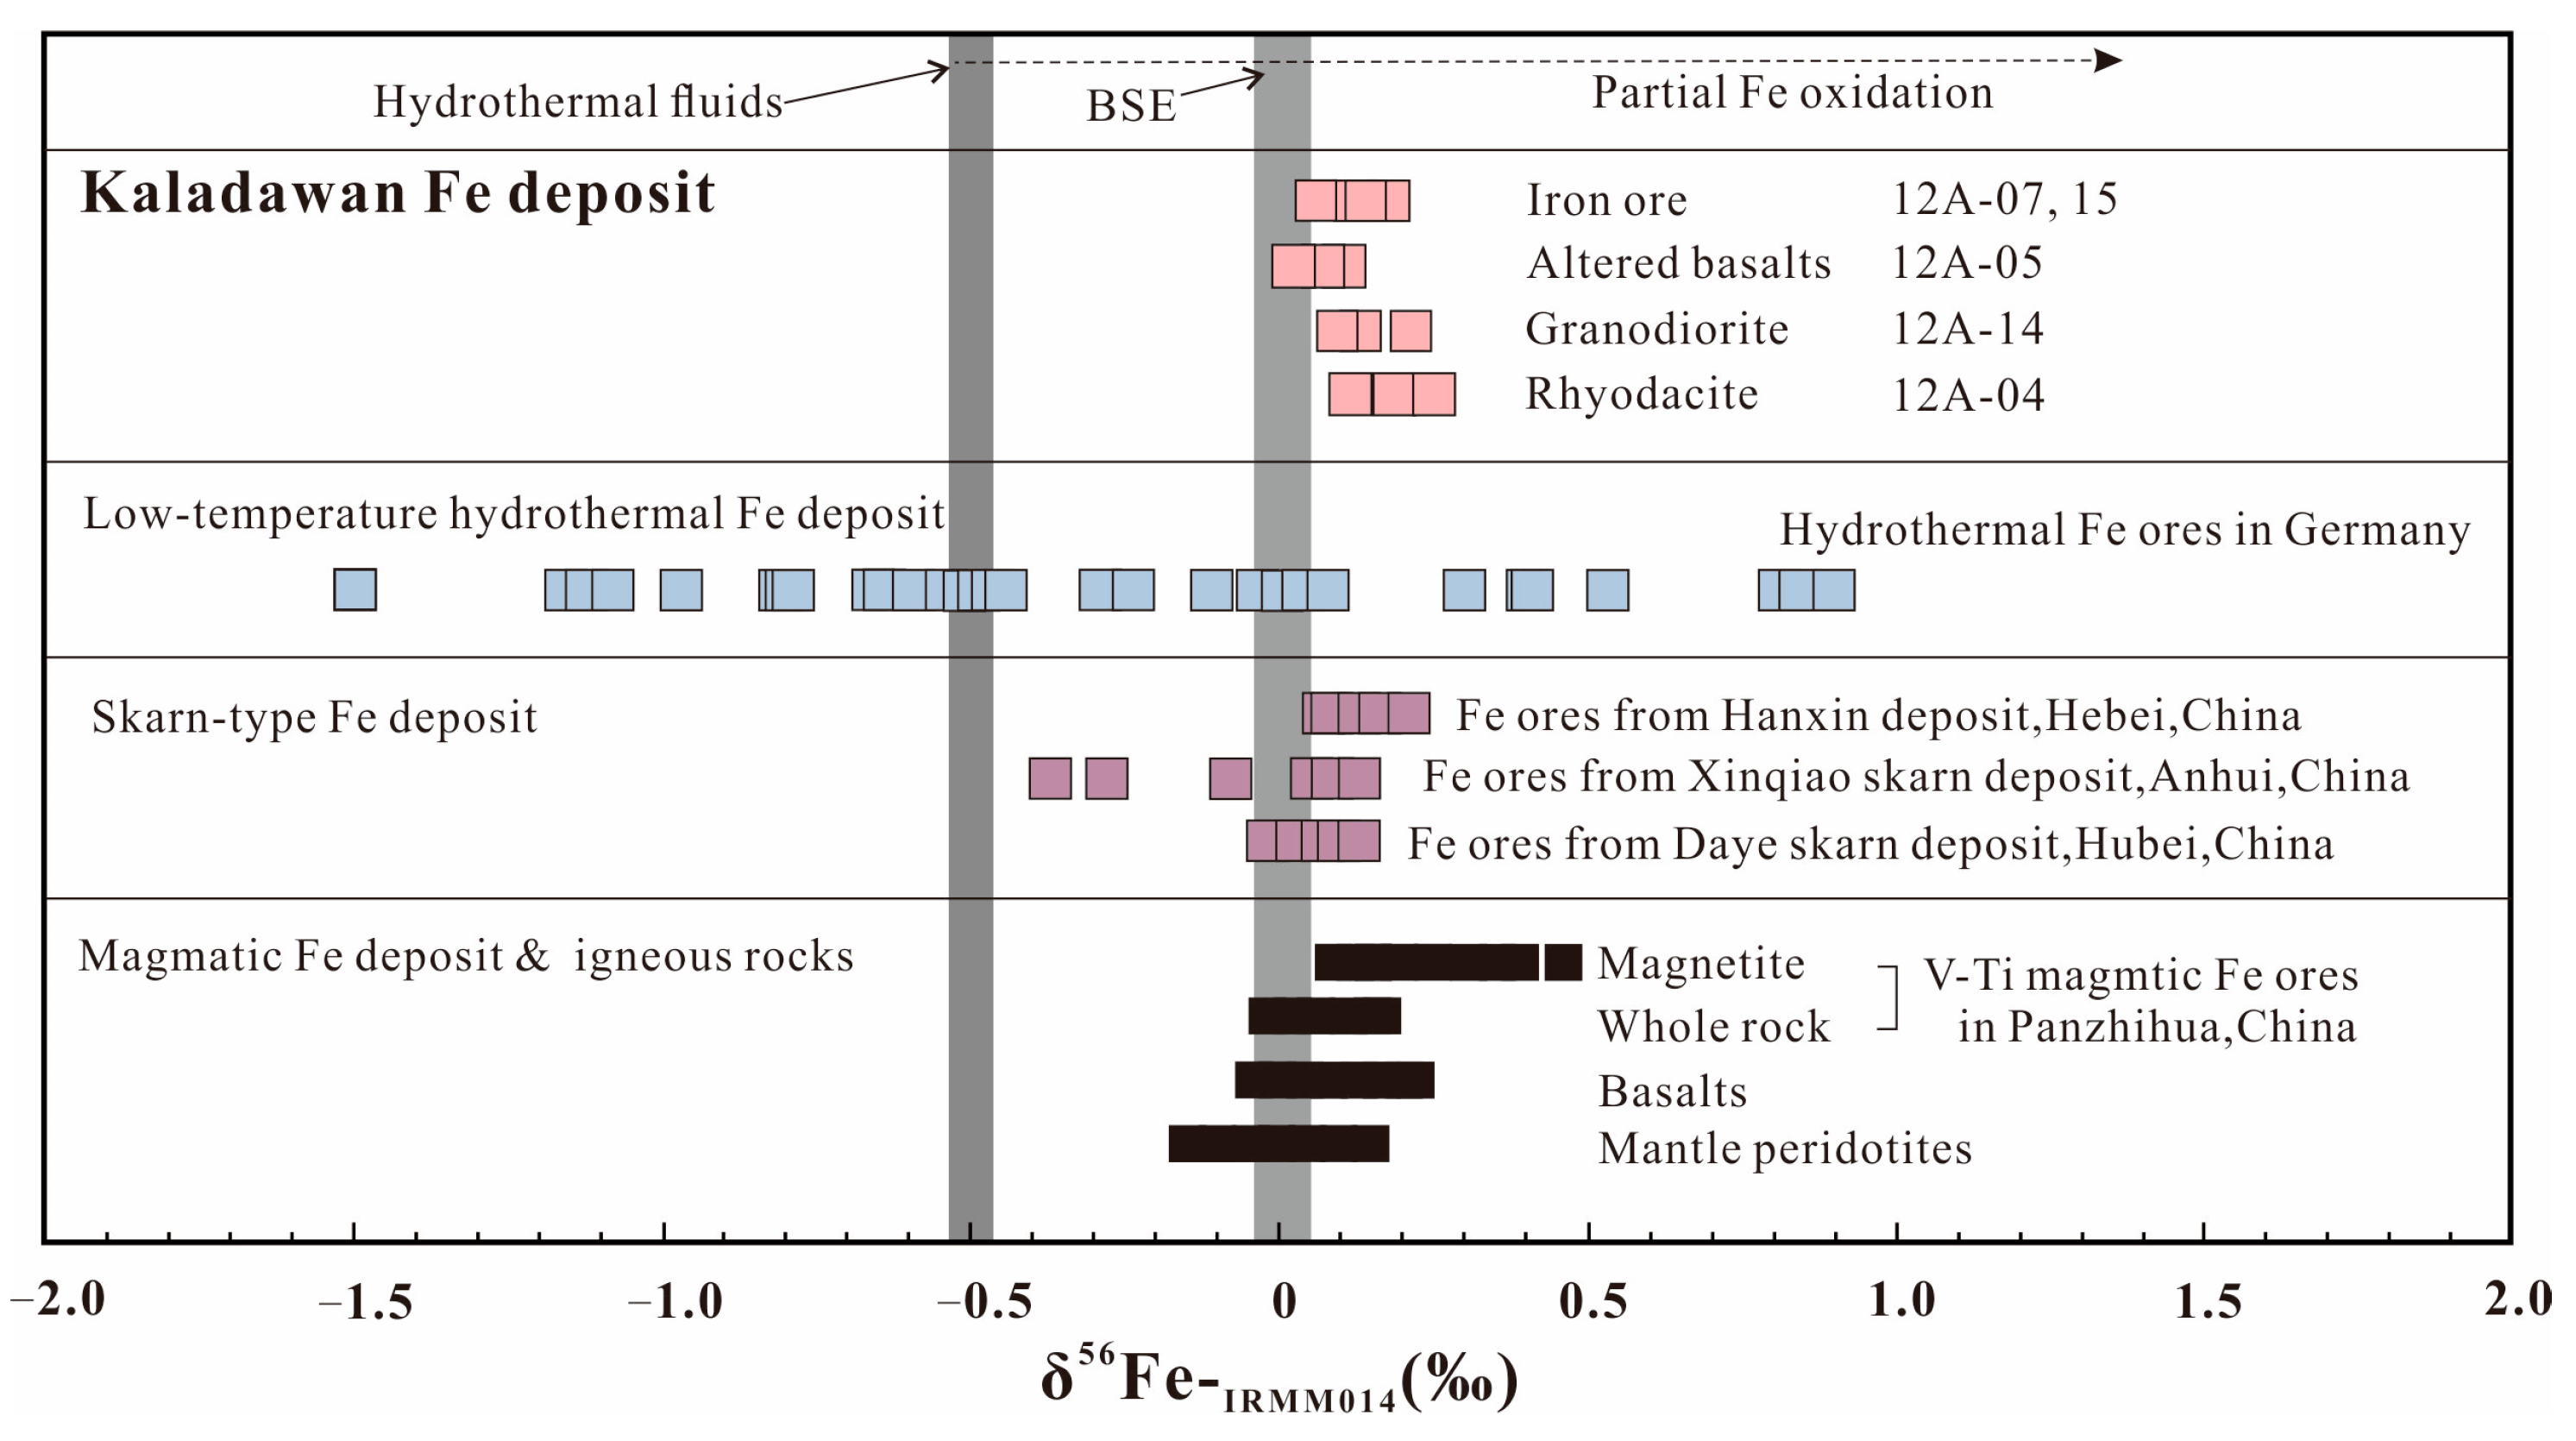
6.2. Fe Isotope
6.3. Magnetite Chemistry
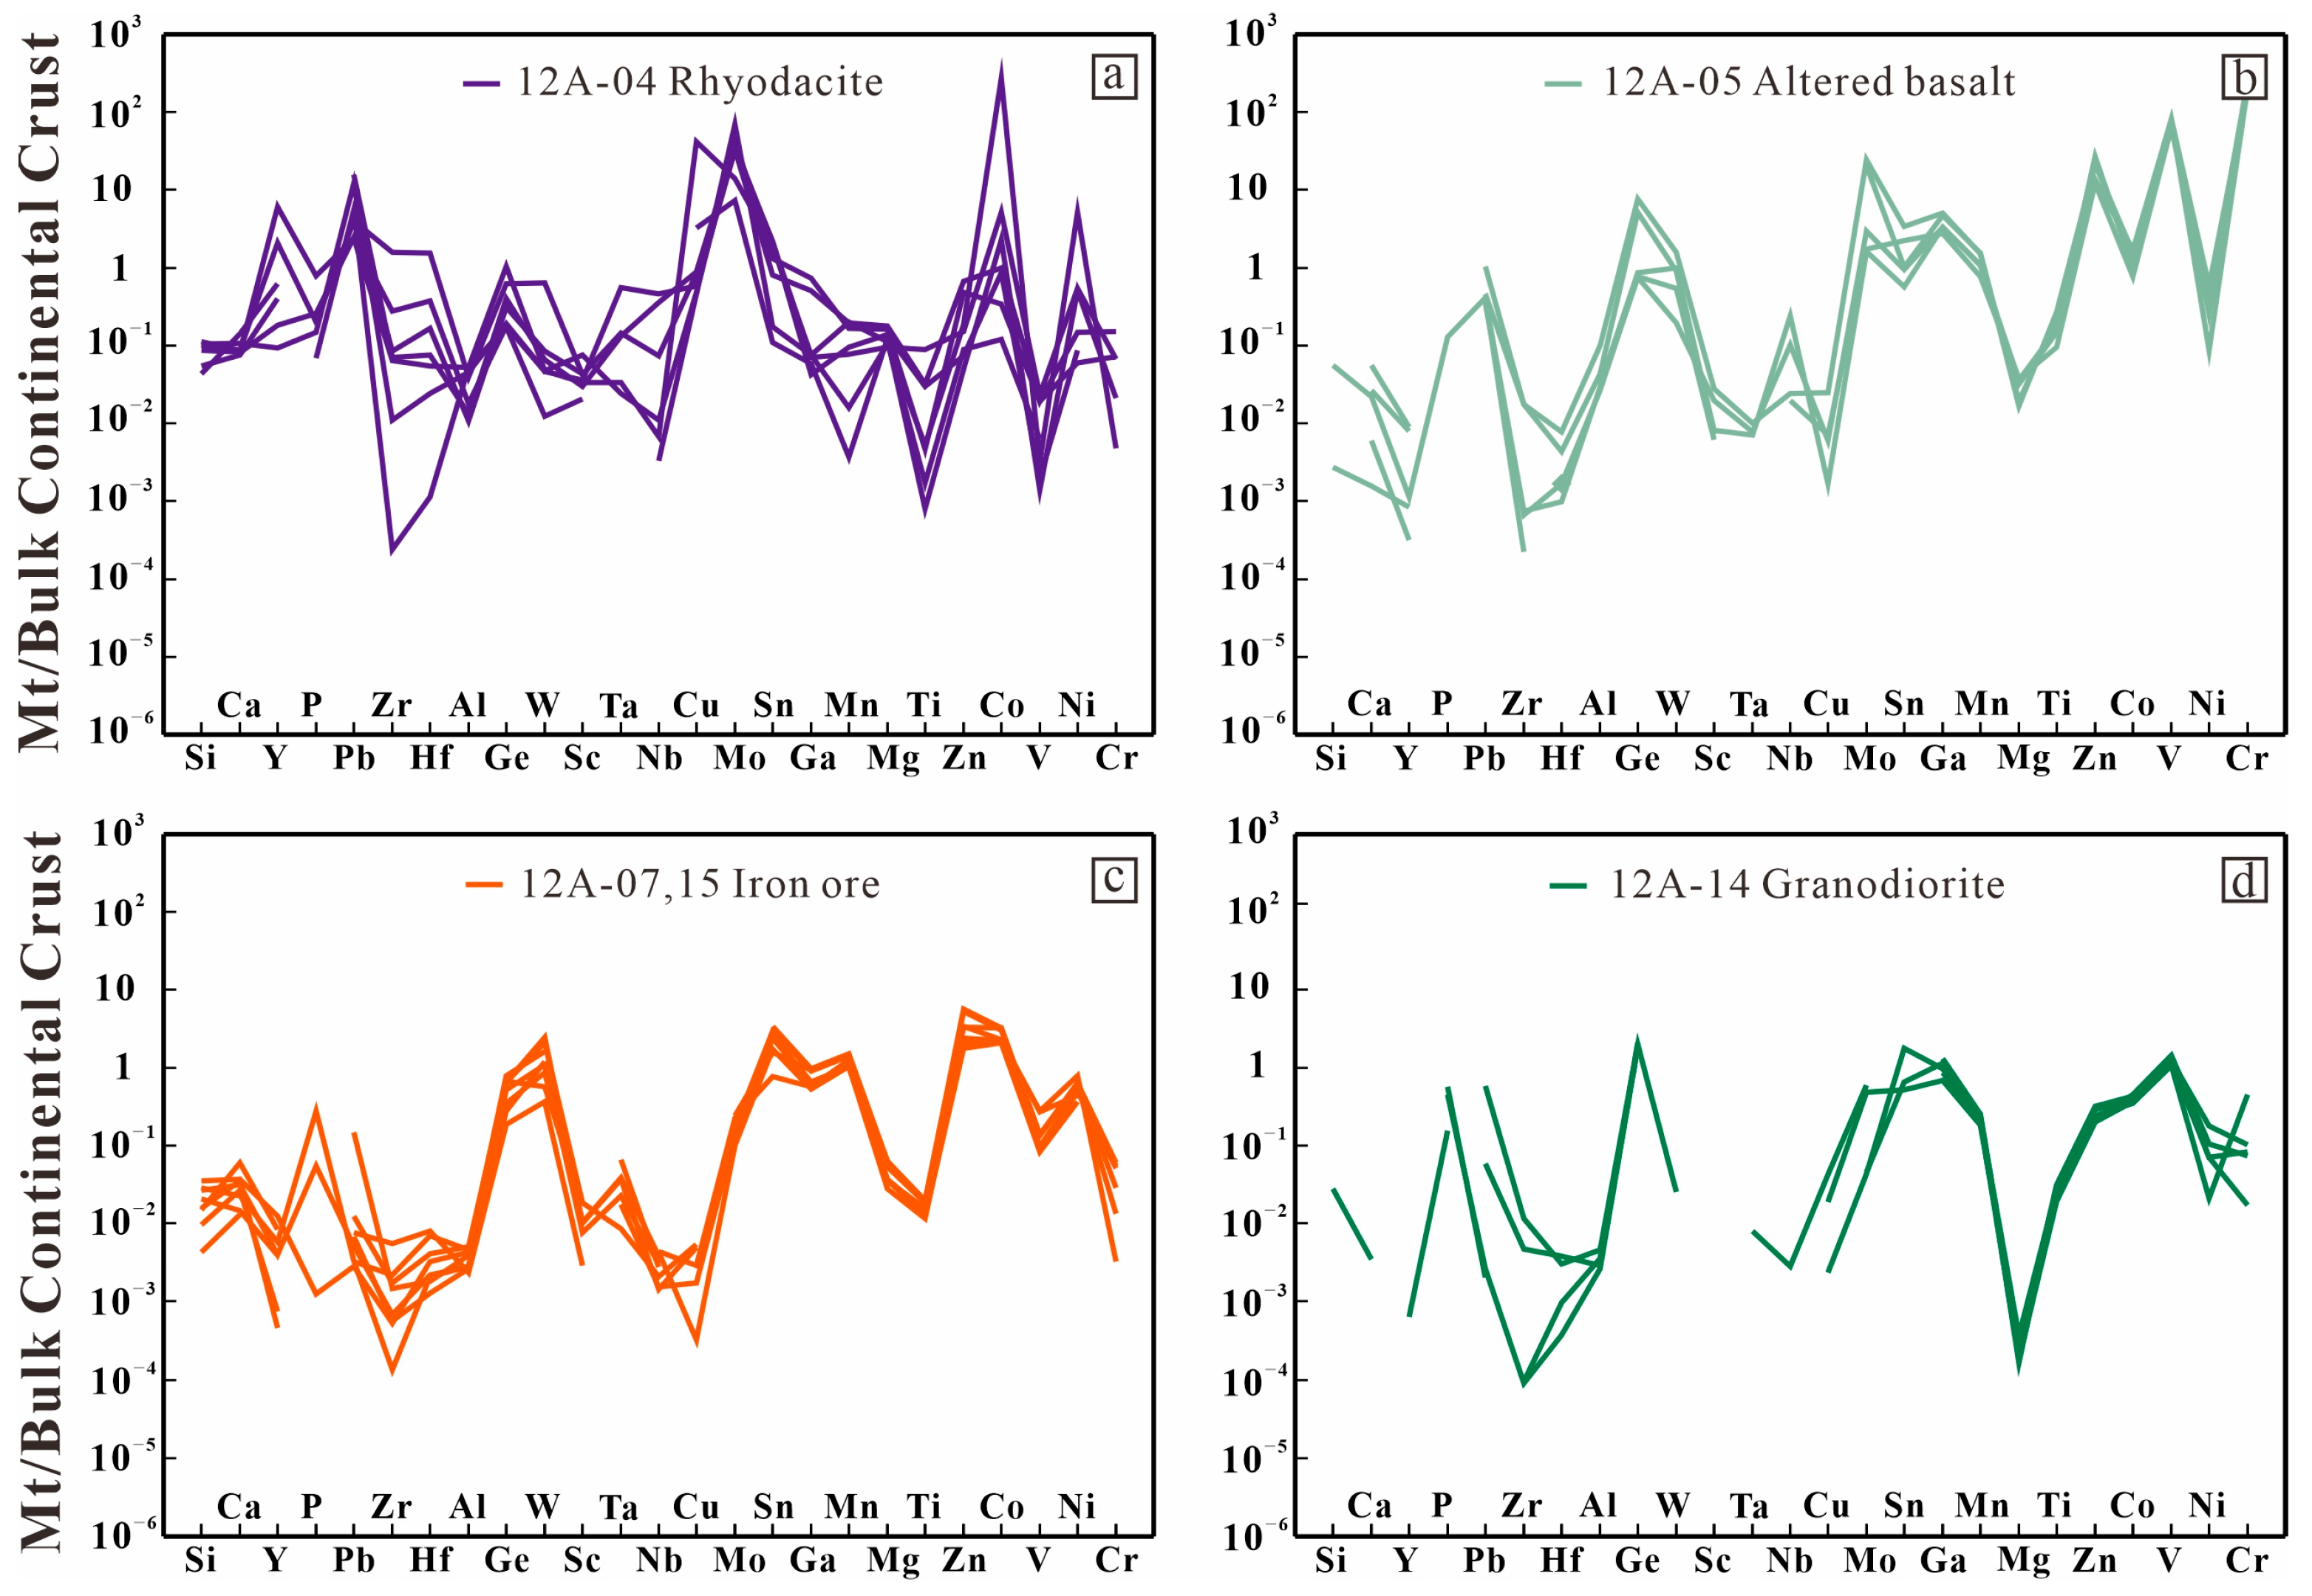
6.3.1. Rhyodacite
6.3.2. Altered Basalt
6.3.3. Iron Ore
6.3.4. Granodiorite
7. Discussion
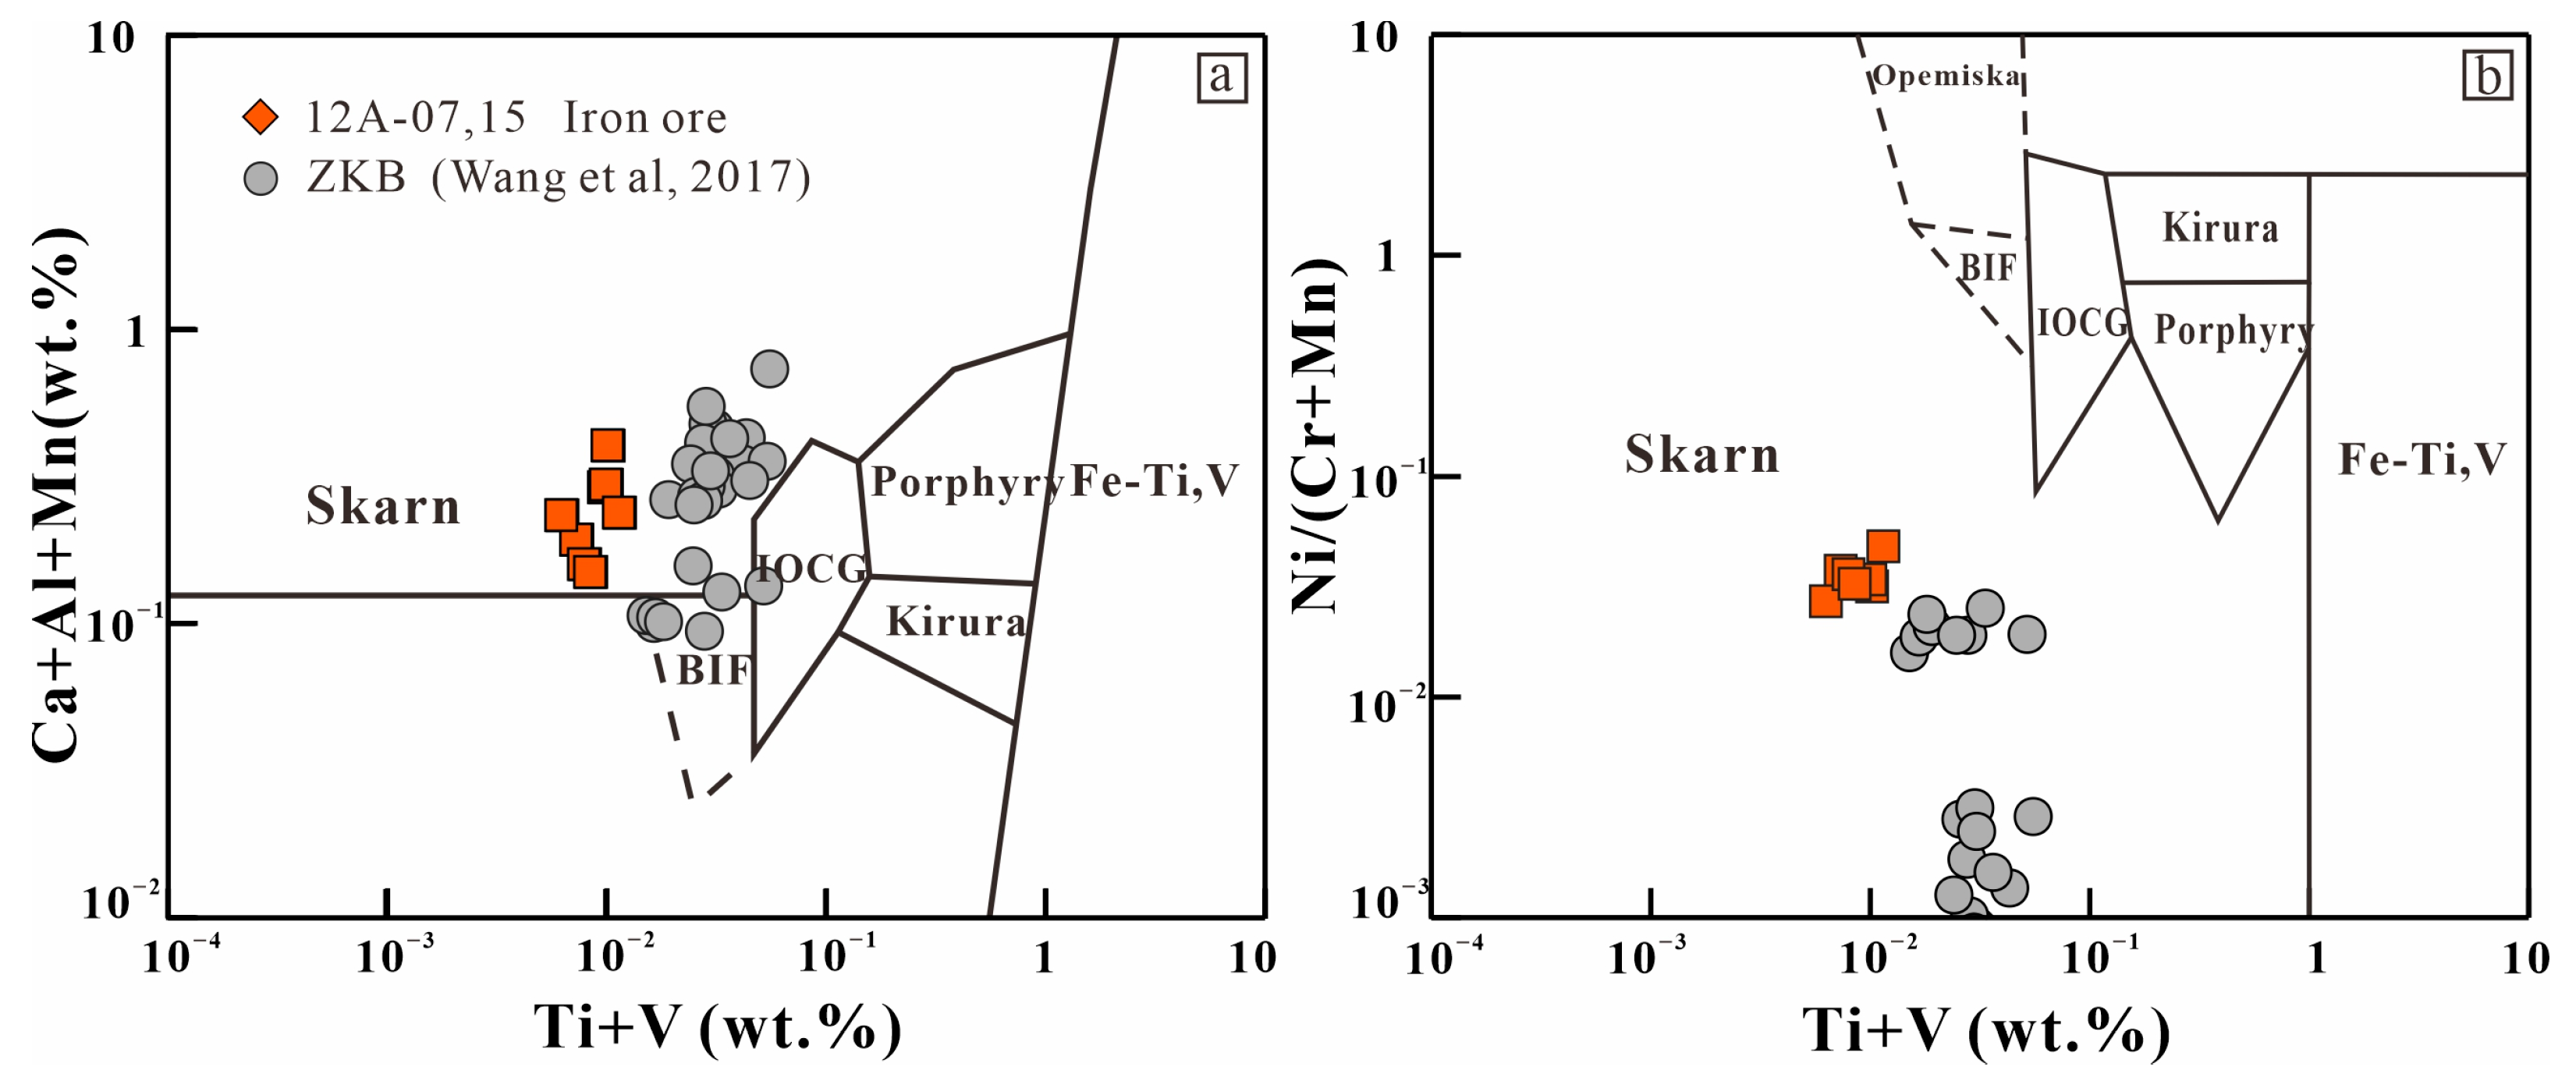
7.1. Genesis of the Iron Deposit
7.2. Source of Ore-Forming Material
7.3. The Possible Origin of the Hydrothermal Fluid
8. Conclusions
- (1)
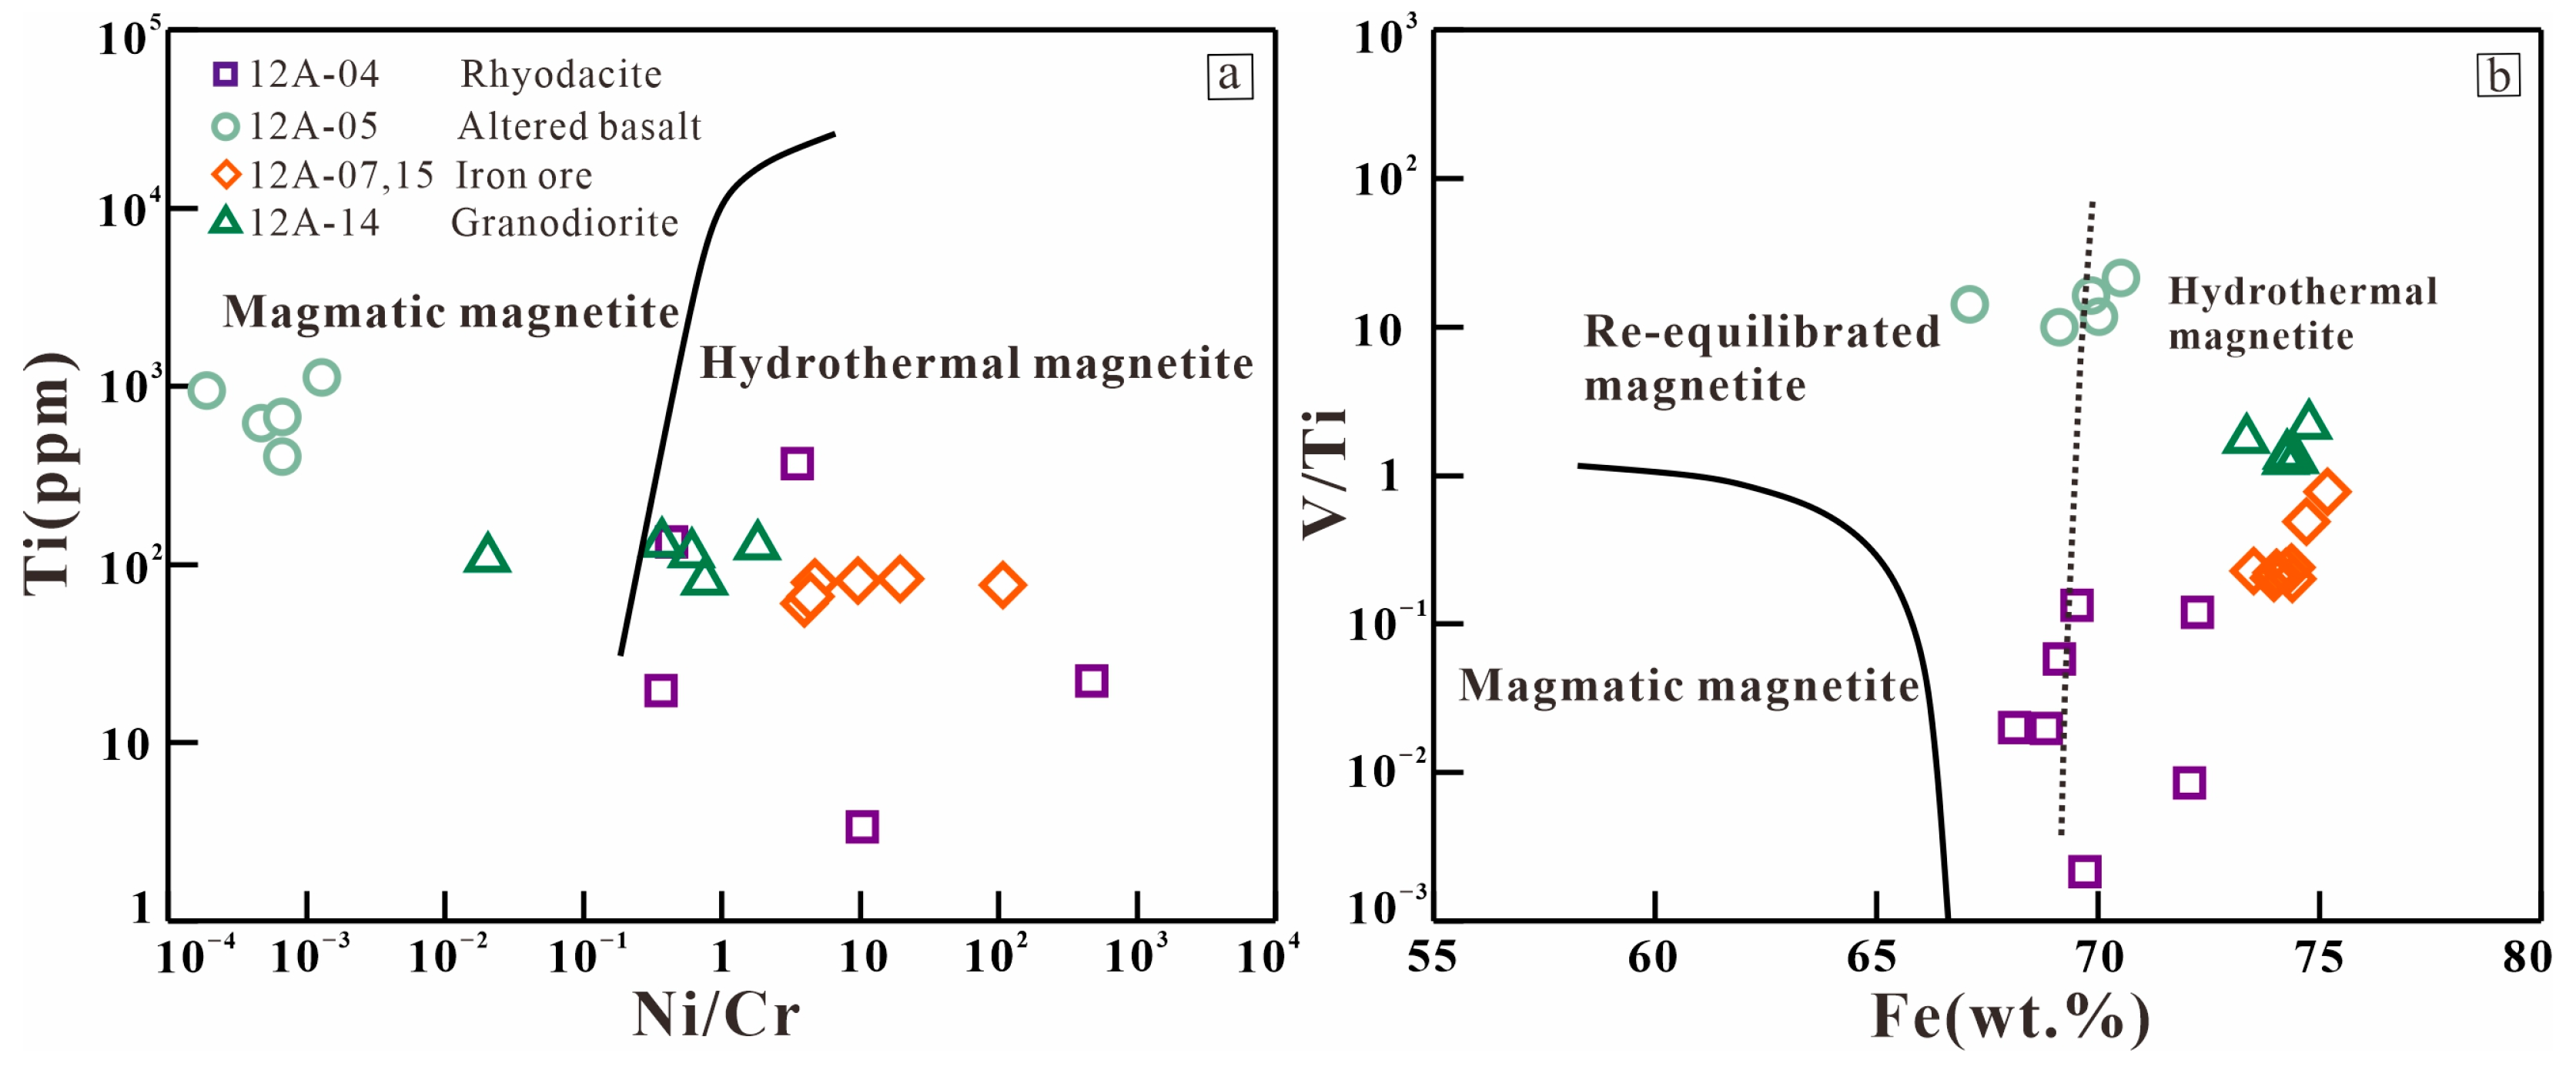
- Geochemical studies suggest that the magnetite from different types of rocks in the Kaladawan iron ore is formed through hydrothermal metasomatism, indicating that the deposit is of skarn origin.
- (2)
- The consistent distribution pattern of rare earth elements in the altered basalt and iron ore, along the lower content of heavy isotopes of Fe observed in the altered basalt compared to the unaltered basalt, suggests that the basalt plays a significant role as one of the ore-forming materials.
- (3)
- The hydrothermal fluid responsible for the formation of iron ore carrying the light Fe isotope derived from the late intrusive granodiorite.
Supplementary Materials
Author Contributions
Funding
Data Availability Statement
Acknowledgments
Conflicts of Interest
References
- Chen, B.L.; Jiang, R.B.; Li, L.; Chen, Z.L.; Qi, W.X.; Liu, R.; Cui, L.L.; Wang, S.X. Discovery of iron ore zones in the Kaladawan area within the eastern part of the Altun Mountains and its significance. Acta Geosci. Sin. 2009, 30, 143–154. [Google Scholar]
- Qi, W.X.; Ma, Y.Z.; Wang, R.; Wei, X.C.; Jiang, J.Y. The geological characteristics of Baba iron deposit, northern margin area of Altyn Mountain and its criteria for prospecting and genesis. Xinjiang Geol. 2008, 26, 253–257. [Google Scholar]
- Chen, B.L.; Li, L.; Qi, W.X.; Chen, Z.L.; Wang, Y.; Hao, R.X.; Li, S.B.; Zhou, Y.G.; Jiang, R.B.; Han, F.B.; et al. Geological characteristics and metallogenic age of Kaladawan iron orefield in Altun Mountains, northwestern China. Miner. Depos. 2016, 35, 315–334. [Google Scholar]
- Ni, K. Characteristics and genesis analysis of Kaladawan iron deposit in Ruoqiang county, Xinjiang, NW China. Acta Mineral. Sin. 2013, 33, 405. [Google Scholar]
- Hou, T.; Zhang, Z.C.; Pirajno, F.; Santosh, M.; Encarnacion, J.; Liu, J.L.; Zhao, Z.D.; Zhang, L.J. Geology, tectonic settings and iron ore metallogenesis associated with submarine volcanism in China: An overview. Ore Geol. Rev. 2014, 57, 498–517. [Google Scholar] [CrossRef]
- Guo, H.J. On the analysis of geological characteristics and genesis of Kaladawan area iron mine in Ruoqiang county of Xinjiang province. Geol. Fujian 2015, 34, 45–51. [Google Scholar]
- Hao, R.X. The Characteristics and Genetic of Kaladawan Area Iron Deposit, Altyn Tagh, Xinjiang. Master’s Thesis, Chinese Academy of Geological Sciences, Beijing, China, 2013. [Google Scholar]
- Pan, C.Z.; Chen, B.L.; Chen, Z.L.; Hao, R.X. The origin of the Kaladawan iron deposit—New evidence from the geochemistry, Altun Tagh Mountains, NW China. Xinjiang Geol. 2015, 33, 340–346. [Google Scholar]
- Meng, L.T. The Characteristics of Ore Controlling Structure for Kaladawan Iron Ore-Field in the North Altun Area, Xinjiang. Master’s Thesis, Chinese Academy of Geological Sciences, Beijing, China, 2016. [Google Scholar]
- Wang, C.M.; Zhou, M.L.; Zhong, L.F.; Li, D.F. Garnet and titanite U–Pb dating of the Kaladawan Fe–Mo orefield in the Altyn Mountains, NW China: Constrains for ore genesis. Ore Geol. Rev. 2022, 140, 104575. [Google Scholar] [CrossRef]
- Wang, Y.; Wu, Y.; Chen, B.L.; Chen, Z.L.; Wang, B.; Shi, Y.H.; Tan, R.W.; Gao, Y.; Shen, J.H. Geochemical characteristics and metallogenic potential of ultrabasic rocks in North Altun area, Xinjiang. Geol. China 2020, 47, 1220–1240. [Google Scholar]
- Wu, Y.; Chen, Z.L.; Chen, B.L.; Wang, Y.; Meng, L.T.; He, J.T.; Wang, B.; Han, M.M. Geochemistry, zircon SHRIMP U-Pb dating and Hf isotpic compositions of the monzogranite from the southern Kaladawan of North Altyn and their implications for crust-mantle interaction. Acta Geosci. Sin. 2017, 91, 1227–1244. [Google Scholar]
- Che, Z.C.; Liu, L.; Liu, H.F.; Luo, J.H. The discovery of high-pressure metamorphic argillaceous rocks and its occurrence environment in the Altun Mountains, Northwest China. Chin. Sci. Bull. 1995, 40, 1298–1300. [Google Scholar]
- Chen, X.H.; Wang, X.F.; Yang, F.; Chen, Z.L.; Chen, B.L.; Wang, K.Z. Tectonic enviroments of magmatism in Early Paleozoic in the north Altyn Tagh, China. J. Geomech. 2001, 7, 193–200. [Google Scholar]
- Yang, Y.; Chen, X.H.; George, G.; Wang, X.F.; Qin, H.; Chen, Z.L.; Yang, F.; Chen, B.L.; Li, X.Z. Early Paleozoic magmatism and gold metallogenesis in Altun Mountains, Northwest China. Miner. Depos. 2004, 23, 464–472. [Google Scholar]
- Wu, C.L.; Yang, J.S.; Yao, S.Z.; Zeng, L.S.; Chen, S.Y.; Li, H.B.; Qi, X.Q.; Wooden, J.L.; Mazdab, F.K. Characteristics of the granitoid complex and its zircon SHRIMP dating at the south margin of the Bashikaogong Basin, North Altun, NW China. Acta Petrol. Sin. 2005, 21, 846–858. [Google Scholar]
- Yang, J.S.; Shi, R.D.; Wu, C.L.; Su, D.C.; Chen, S.Y.; Wang, X.B.; Wooden, J. Petrology and SHRIMP age of the Hongliugou ophiolite at Milan, north Altun, at the northern margin of the Tibetan plateau. Acta Petrol. Sin. 2008, 24, 1567–1584. [Google Scholar]
- Zhang, F.; Wang, K.Q.; Yu, W.Q.; Yang, G.C. Geochemical characteristics and formation environment and epoch of volcanic rocks on the northern margin of Altun area, northwestern China. Miner. Depos. 2008, 27, 105–114. [Google Scholar]
- Xu, Z.Q.; Yang, J.S.; Li, H.B.; Zhang, J.X.; Wu, C.L. Orogenic Plateau: Terrane Amalgamation, Collision and Uplift in the Qinhai-Tibet Plateau; Geological Publishing House: Beijing, China, 2007; pp. 1–458. [Google Scholar]
- Han, F.B.; Chen, B.L.; Cui, L.L.; Wang, S.X.; Chen, Z.L.; Jiang, R.B.; Li, L.; Qi, W.X. Zircon SHRIMP U-Pb age of intermediate-acid intrusive rocks in Kaladawan area, eastern Altun Mountains, NW China, and its implications. Acta Petrol. Sin. 2012, 28, 2277–2291. [Google Scholar]
- Liu, Y.; Hu, Z.; Gao, S.; Günther, D.; Xu, J.; Gao, C.; Chen, H. In situ analysis of major and trace elements of anhydrous minerals by LA-ICP-MS without applying an internal standard. Chem. Geol. 2008, 257, 34–43. [Google Scholar] [CrossRef]
- Maréchal, C.N.; Télouk, P.; Albarède, F. Precise analysis of copper and zinc isotopic compositions by plasma-source mass spectrometry. Chem. Geol. 1999, 156, 251–273. [Google Scholar] [CrossRef]
- Le Maitre, R.W.; Streckeisen, A.; Zanettin, B.; Le Bas, M.J.; Bonin, B.; Bateman, P. Igneous Rocks: A Classification and Glossary of Terms: Recommendations of the International Union of Geological Sciences Subcommission on the Systematics of Igneous Rocks, 2nd ed.; Cambridge University Press: Cambridge, UK, 2002. [Google Scholar]
- Peccerillo, A.; Taylor, S.R. Geochemistry of eocene calc-alkaline volcanic rocks from the kastamonu area, northern turkey. Contrib. Mineral. Petrol. 1976, 58, 63–81. [Google Scholar] [CrossRef]
- Dupuy, C.; Dostal, J. Trace element geochemistry of some continental tholeiites. Earth Planet. Sci. Lett. 1984, 67, 61–69. [Google Scholar] [CrossRef]
- Sun, S.S.; Mcdonough, W.F. Chemical and isotopic systematics of oceanic basalts: Implications for mantle composition and processes. Geol. Soc. Lond. Spec. Publ. 1989, 42, 313–345. [Google Scholar] [CrossRef]
- Mclennan, S.M. Relationships between the trace element composition of sedimentary rocks and upper continental crust. Geochem. Geophys. Geosystems 2001, 2. [Google Scholar] [CrossRef]
- Rudnick, R.L.; Gao, S.; Holland, H.D.; Turekian, K.K. Composition of the continental crust. Treatise Geochem. 2003, 3, 1–64. [Google Scholar]
- Baker, T.; Lang, J.R. Reconciling fluid inclusion types, fluid processes, and fluid sources in skarns: An example from the Bismark Deposit, Mexico. Miner. Depos. 2003, 38, 474–495. [Google Scholar] [CrossRef]
- Wen, G.; Li, J.W.; Hofstra, A.H.; Koenig, A.E.; Lowers, H.A.; Adams, D. Hydrothermal reequilibration of igneous magnetite in altered granitic plutons and its implications for magnetite classification schemes: Insights from the Handan-Xingtai iron district, North China Craton. Geochim. Cosmochim. Acta 2017, 213, 255–270. [Google Scholar] [CrossRef]
- Dare, S.A.S.; Barnes, S.J.; Beaudoin, G.; Méric, J.; Boutroy, E.; Potvin-Doucet, C. Trace elements in magnetite as petrogenetic indicators. Miner. Depos. 2014, 49, 785–796. [Google Scholar] [CrossRef]
- Hu, H.; Li, J.W.; Lentz, D.; Ren, Z.; Zhao, X.F.; Deng, X.D.; Hall, D. Dissolution–reprecipitation process of magnetite from the Chengchao iron deposit: Insights into ore genesis and implication for in-situ chemical analysis of magnetite. Ore Geol. Rev. 2014, 57, 393–405. [Google Scholar] [CrossRef]
- Hu, H.; Lentz, D.; Li, J.W.; Mccarron, T.; Zhao, X.F.; Hall, D. Reequilibration processes in magnetite from iron skarn deposits*. Econ. Geol. 2015, 110, 1–8. [Google Scholar] [CrossRef]
- Makvandi, S.; Ghasemzadeh-Barvarz, M.; Beaudoin, G.; Grunsky, E.C.; Beth Mcclenaghan, M.; Duchesne, C. Principal component analysis of magnetite composition from volcanogenic massive sulfide deposits: Case studies from the Izok Lake (Nunavut, Canada) and Halfmile Lake (New Brunswick, Canada) deposits. Ore Geol. Rev. 2016, 72, 60–85. [Google Scholar] [CrossRef]
- Dupuis, C.; Beaudoin, G. Discriminant diagrams for iron oxide trace element fingerprinting of mineral deposit types. Miner. Depos. 2011, 46, 319–335. [Google Scholar] [CrossRef]
- Wang, C.M.; Zhang, L.; Tang, H.S.; Chen, H.Y.; Li, X.L.; Zheng, Y.; Li, D.F.; Fang, J.; Dong, L.H.; Qu, X. Genesis of the Kaladawan Fe–Mo ore field in Altyn, Xinjiang, China: Constraints from mineralogy and geochemistry. Ore Geol. Rev. 2017, 81, 587–601. [Google Scholar] [CrossRef]
- Pons, J.; Franchini, M.; Meinert, L.; Recio, C.; Etcheverry, R. Iron skarns of the Vegas Peladas district, mendoza, argentina. Econ. Geol. 2009, 104, 157–184. [Google Scholar] [CrossRef]
- Dauphas, N.; Zuilen, M.; Wadhwa, M.; Davis, A.; Marty, B.; Janney, P. Clues from Fe isotope variations on the origin of Early Archean BIFs from Greenland. Science 2004, 306, 2077–2080. [Google Scholar] [CrossRef] [PubMed]
- Sun, J.; Zhu, X.K.; Chen, Y.L.; Fang, N. Iron isotopic constraints on the genesis of Bayan Obo ore deposit, Inner Mongolia, China. Precambrian Res. 2013, 235, 88–106. [Google Scholar] [CrossRef]
- Dong, A.; Zhu, X.K.; Li, Z.H.; Kendall, B.; Li, S.Z.; Wang, Y.; Tang, C. A multi-isotope approach towards constraining the origin of large-scale Paleoproterozoic B-(Fe) mineralization in NE China. Precambrian Res. 2017, 292, 115–129. [Google Scholar] [CrossRef]
- Sun, J.; Zhu, X.K.; Li, Z.H. Confirmation and global significance of a large-scale early Neoproterozoic banded iron formation on Hainan Island, China. Precambrian Res. 2018, 307, 82–92. [Google Scholar] [CrossRef]
- Hanson, G.N. Rare earth elements in petrogenetic studies of igneous systems. Annu. Rev. Earth Planet. Sci. 1980, 8, 371–406. [Google Scholar] [CrossRef]
- Ge, Z.H.; Han, F. Geochemistry of rare earth elements in the Makeng iron deposit. Miner. Depos. 1984, 3, 1–10. [Google Scholar]
- Frietsch, R.; Perdahl, J.A. Rare earth elements in apatite and magnetite in Kiruna-type iron ores and some other iron ore types. Ore Geol. Rev. 1995, 9, 489–510. [Google Scholar] [CrossRef]
- Zhang, Z.X.; Yang, F.Q.; Chai, F.M.; Liu, F.; Geng, X.X.; Lv, S.J.; Jiang, L.P.; Zhong, T.Z.; Ouyang, L.J. A study of REE geochemistry of Wutubulake iron deposit in Altay, Xin jiang. Miner. Depos. 2011, 30, 87–102. [Google Scholar]
- Hu, H. Mineralogical, Geochemical, and Geochornologcal Constrains on the Genesis of Iron Deposits in the Daye District, Eastern China. Ph.D. Thesis, China University Of Geosciences, Wuhan, China, 2016. [Google Scholar]
- Wang, Y.; Zhu, X.K.; Mao, J.W.; Li, Z.H.; Cheng, Y.B. Iron isotope fractionation during skarn-type metallogeny: A case study of Xinqiao Cu–S–Fe–Au deposit in the Middle–Lower Yangtze valley. Ore Geol. Rev. 2011, 43, 194–202. [Google Scholar] [CrossRef]
- Bullen, T.D.; White, A.F.; Childs, C.W.; Vivit, D.V.; Schulz, M. Demonstration of significant abiotic iron isotope fractionation in nature. Geology 2000, 29, 699. [Google Scholar] [CrossRef]
- Polyakov, V.B.; Mineev, S.D. The use of Mössbauer spectroscopy in stable isotope geochemistry. Geochim. Cosmochim. Acta 2000, 64, 849–865. [Google Scholar] [CrossRef]
- Johnson, C.M.; Skulan, J.L.; Beard, B.L.; Sun, H.; Nealson, K.H.; Braterman, P.S. Isotopic fractionation between Fe(III) and Fe(II) in aqueous solutions. Earth Planet. Sci. Lett. 2002, 195, 141–153. [Google Scholar] [CrossRef]
- Liang, J.X. Experimental Study on the Formation Mechanism of Skarn and Skarn Deposits in China; Xueyuan Publishing House Beijing: Beijing, China, 2000; pp. 152–192. [Google Scholar]
- Meng, L.T.; Chen, B.L.; Zhao, N.N.; Wu, Y.; Zhang, W.G.; He, J.T.; Wang, B.; Han, M.M. The distribution, geochronology and geochemistry of early Paleozoic granitoid plutons in the North Altun orogenic belt, NW China: Implications for the petrogenesis and tectonic evolution. Lithos 2017, 268, 399–417. [Google Scholar] [CrossRef]
- Zhu, B.; Zhang, H.F.; Zhao, X.M.; He, Y.S. Iron isotope fractionation during skarn-type alteration: Implications for metal source in the Han-Xing iron skarn deposit. Ore Geol. Rev. 2016, 74, 139–150. [Google Scholar] [CrossRef]
- Chou, I.M.; Eugster, H.P. Solubility of magnetite in supercritical chloride solutions. Am. J. Sci. 1977, 277, 1296–1314. [Google Scholar] [CrossRef]
- Chen, Y.; Zhang, Z.C. Study on source, transport and the enrichment mechanism of iron in iron skarn deposits. Rock Miner. Anal. 2012, 31, 889–897. [Google Scholar]


| Sample | Description | TFe2O3 (wt.%) | TFe2O3/TiO2 | δ56Fe (‰) | 2SD | δ57Fe | 2SD | F |
|---|---|---|---|---|---|---|---|---|
| SK-01 | Weakly altered basalt | 15.00 | 27.27 | 0.129 | 0.041 | 0.201 | 0.063 | 0.37 |
| SK-02 | Unaltered basalt | 16.90 | 73.48 | 0.197 | 0.041 | 0.301 | 0.063 | |
| 12A-05 | Altered basalt | 9.75 | 9.65 | 0.100 | 0.033 | 0.141 | 0.054 | 0.13 |
| 15.92 | 22.42 | 0.082 | 0.032 | 0.091 | 0.053 | 0.31 | ||
| 11.72 | 14.65 | 0.024 | 0.031 | 0.023 | 0.050 | 0.20 | ||
| 12A-07 | Iron ore | 80.44 | 0.171 | 0.017 | 0.264 | 0.029 | ||
| 80.03 | 0.142 | 0.014 | 0.205 | 0.028 | ||||
| 12A-15 | 73.66 | 0.152 | 0.018 | 0.235 | 0.028 | |||
| 73.34 | 0.062 | 0.023 | 0.092 | 0.035 | ||||
| 12A-04 | Rhyodacite | 1.96 | 0.120 | 0.014 | 0.191 | 0.028 | ||
| 1.91 | 0.212 | 0.015 | 0.301 | 0.026 | ||||
| 2.00 | 0.245 | 0.020 | 0.336 | 0.030 | ||||
| 12A-14 | Granodiorite | 2.41 | 0.224 | 0.023 | 0.319 | 0.041 | ||
| 2.27 | 0.128 | 0.035 | 0.177 | 0.060 | ||||
| 2.35 | 0.108 | 0.018 | 0.150 | 0.028 |
Disclaimer/Publisher’s Note: The statements, opinions and data contained in all publications are solely those of the individual author(s) and contributor(s) and not of MDPI and/or the editor(s). MDPI and/or the editor(s) disclaim responsibility for any injury to people or property resulting from any ideas, methods, instructions or products referred to in the content. |
© 2024 by the authors. Licensee MDPI, Basel, Switzerland. This article is an open access article distributed under the terms and conditions of the Creative Commons Attribution (CC BY) license (https://creativecommons.org/licenses/by/4.0/).
Share and Cite
Chen, Y.; Cao, Y.; Liu, L.; Wang, C.; Yang, W.; Gai, Y.; Xie, T.; Song, L.; Xie, F. Elucidating the Genetic Mechanism and the Ore-Forming Materials of the Kaladawan Iron Deposit in the North Altyn Tagn, Western China. Minerals 2024, 14, 589. https://doi.org/10.3390/min14060589
Chen Y, Cao Y, Liu L, Wang C, Yang W, Gai Y, Xie T, Song L, Xie F. Elucidating the Genetic Mechanism and the Ore-Forming Materials of the Kaladawan Iron Deposit in the North Altyn Tagn, Western China. Minerals. 2024; 14(6):589. https://doi.org/10.3390/min14060589
Chicago/Turabian StyleChen, Yuyao, Yuting Cao, Liang Liu, Chao Wang, Wenqiang Yang, Yongsheng Gai, Tianhe Xie, Lihao Song, and Fei Xie. 2024. "Elucidating the Genetic Mechanism and the Ore-Forming Materials of the Kaladawan Iron Deposit in the North Altyn Tagn, Western China" Minerals 14, no. 6: 589. https://doi.org/10.3390/min14060589