Article

Energy Mechanism and Acoustic Emission Characteristics in Rock-Backfill Composite Structure Specimens under Multi-Level Cyclic Loads: Cement-Tailings Ratio Effect

by
Dayu Long
1,2,
Yu Wang
1,2,*,
Changhong Li
1,2,
Yunfeng Wu
1,2 and
Yongyue Hu
1,2
1
School of Civil & Resource Engineering, University of Science & Technology Beijing, Beijing 10083, China
2
Key Laboratory of Ministry of Education for High-Efficient Mining and Safety of Metal Mines, University of Science & Technology Beijing, Beijing 10083, China
*
Author to whom correspondence should be addressed.
Minerals 2024, 14(7), 665; https://doi.org/10.3390/min14070665
Submission received: 7 June 2024 / Revised: 20 June 2024 / Accepted: 25 June 2024 / Published: 27 June 2024
(This article belongs to the Section Mineral Processing and Extractive Metallurgy)

Abstract

:
This study aimed to investigate the effects of the cement-tailings ratio (CTR) on the fatigue properties, acoustic emission (AE) activities, energy dissipation, and fracture patterns of rock-backfill composite structure (RBCS) samples. The investigation employed multi-level cyclic loading tests combined with acoustic emission monitoring and post-test CT scanning. The results indicated that the fatigue strength and fatigue lifetime of the RBCS samples initially increased and then decreased as the CTR was reduced from 1:4 to 1:12. The energy dissipation characteristics reflected the optimal energy absorption effect of the backfill at a CTR of 1:8. The AE ring counts/energy apparent skip phenomenon corresponded to the stress-strain curve from a dense to sparse pattern. The samples with CTRs of 1:4 and 1:8 showed a more significant increase in the peak frequency band at failure and released more energy. The fracture of the RBCS specimen was dominated by tensile cracking signals accompanied by some shear cracking signals. However, the proportion of shear signals was higher for samples with CTRs of 1:4 and 1:8. Similarly, the b value was smaller at failure. The 3D visualization images revealed that the fracture pattern of the RBCS was a mixed tensile-shear fracture, including shear fracture within the backfill, tensile cracking in the interface, and tensile-shear fracture within the rock. The volume and complexity of cracks increased and then decreased with decreasing CTR, i.e., from 1:4 to 1:12. The evolution of cracks probably involves internal backfill fracturing first, and then the fracture extends into the surrounding rock. A recommendation for the design of CTB was presented in this study to ensure the safety and stability of mine excavations.

1. Introduction

Environmental problems caused by improper management of tailings have resulted in serious challenges to the development of the global mining industry [1,2,3]. The cemented tailings backfill (CTB) method has been proposed and widely used to dispose of tailings through innovative and environmentally friendly mining practices. This technology is an important contribution to promoting the green and sustainable development of the mining industry. It can reduce geological hazards during mine excavation, such as rock bursts, rock spalling, and collapse [4,5,6,7]. CTB technology takes the form of a pipeline transporting filling slurry into the underground stope. The CTB and the pillar or surrounding rock then form a rock-backfill composite structure to bear the gravity of the overlying rock (Figure 1). The rock and backfill interact with each other to resist external loads and deformation under natural or artificial disturbing stresses [8]. However, the CTB in quarries is a “weak structure” material compared to the surrounding rock. The deformation and mechanical properties of RBCS under loading differ significantly from those of intact rock and backfill [9]. Therefore, it is crucial to accurately comprehend the fracture patterns and energy mechanism of the RBCS. This is significant for ensuring the long-term stability of deep mine excavations.
Currently, studying the mechanical properties of RBCS is increasingly becoming a hot topic in the research of underground mines. Many studies have been conducted under static loading, such as uniaxial loading tests [10,11], triaxial loading tests [12,13], and shear tests [14,15,16,17], which have revealed the interaction and mechanical properties of the surrounding rock and backfill. These findings detail the effects of CTR, backfill volume, and composite structural form on the strength, elastic modulus, energy dissipation, damage extension, and fracture evolution of RBCS. In addition, some findings have also revealed the effects of curing time, curing stress, curing temperature, drainage, and chemical conditions on the interfacial shear properties of the backfill and the surrounding rock, including shear strength, fracture toughness, friction angle, and cohesion. The RBCS under mining activities is subjected to both static loads and blast vibrations, especially low-frequency far-field blast stress waves [18]. Far-field disturbing stress is often equivalent to cyclic or fatigue loading at low to medium strains, which differs from static and impact loading.
In recent years, significant progress has been made in fatigue or cyclic loading tests on rocks and rock-like materials, and their fatigue mechanical properties have been explored in terms of stress amplitude, maximum stress, dynamic loading frequency, loading waveforms, and stress paths [19,20,21,22]. Research on the fracture patterns of rock and concrete materials under different cyclic loadings has yielded important insights with the help of AE detection technology. The elastic waves detected as AE signals reveal the energy dissipation during the process of crack initiation, propagation, and coalescence during the loading of rock and backfill [23]. Meng [23] investigated the acoustic emission evolution under cyclic loading and demonstrated that the Kaiser effect occurs in the linear elasticity stage of rock materials, while the Felicity effect occurs in the plastic yielding and post-peak failure stage. Wang [24] found that the AE b value is smaller for rocks with high cavity orientation under unconventional cyclic loads, and proposed a cumulative damage evolution model based on AE energy. Wang and Long [8,25] investigated the fracture evolution and mechanical response of RBCS under low cycle fatigue loading from different loading paths, and found that a lower CTR is beneficial for improving the fatigue strength of RBCS. Although previous studies have been conducted on the fatigue mechanical behavior of RBCS, there remains a limited understanding of the energy mechanisms, acoustic emission characteristics, and fracture patterns of RBCS subjected to stress disturbance.
Therefore, a series of laboratory tests were conducted in this study, focusing on the effects of different CTRs on the stress-strain response, energy conversion, AE characteristics, and fracture patterns of RBCS samples under multi-level cyclic loads. The activity state of internal damage and cracking events in RBCS samples were monitored using AE real-time monitoring technology. A method based on AE parameters was employed to extract fracture patterns from the AE signals. Moreover, CT scanning was used to visualize the crack network after failure, fully understanding the effect of CTR on the crack extension of RBCS samples and revealing the mechanisms of microstructure deterioration. The findings provide a reference for the optimal design of CTB in underground mines.

2. Materials and Methods

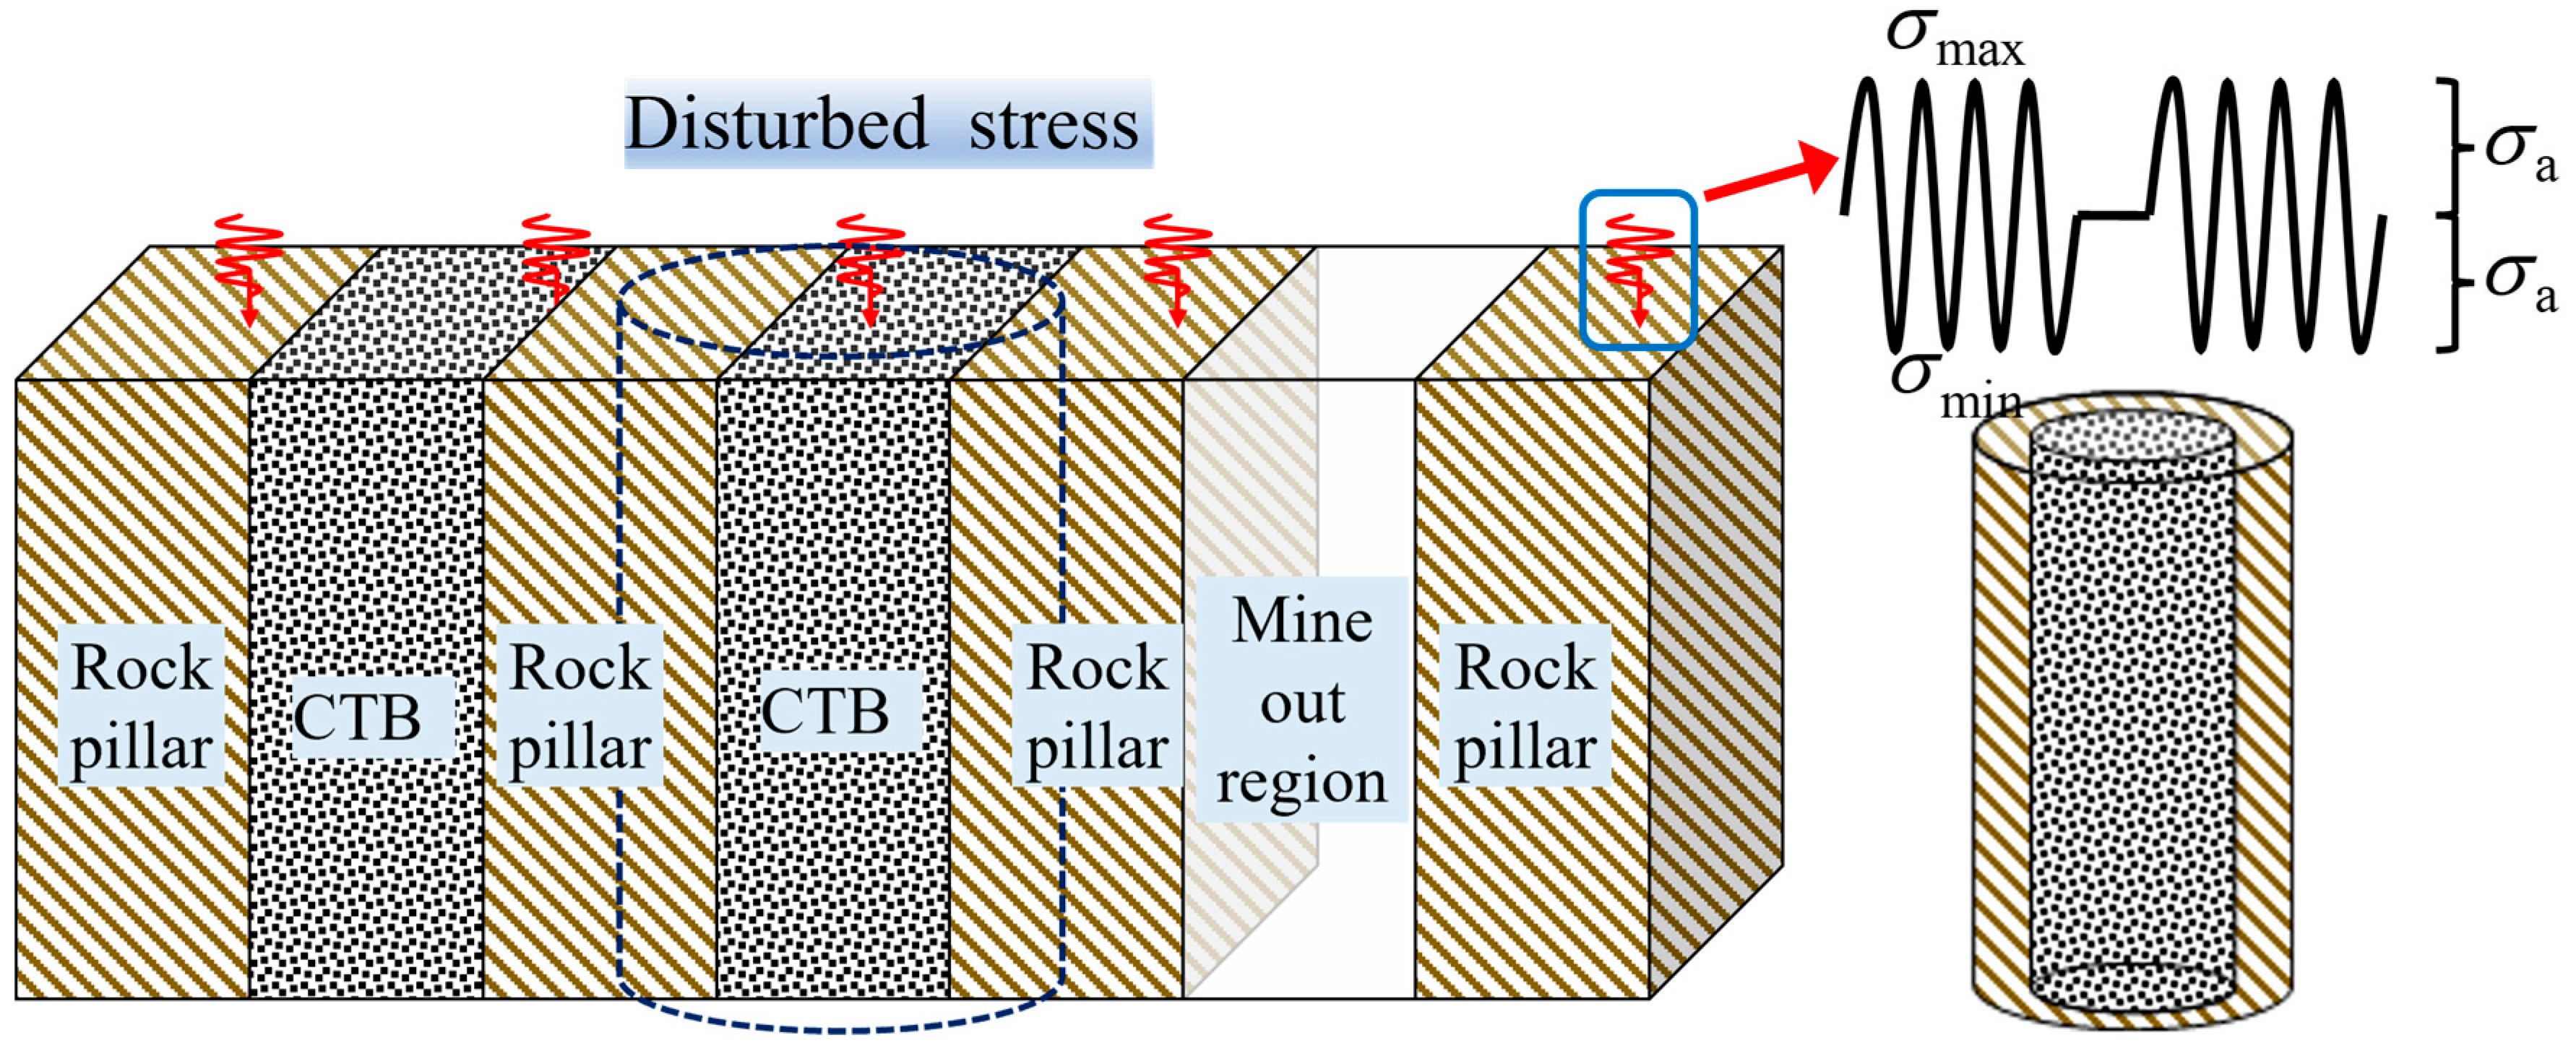
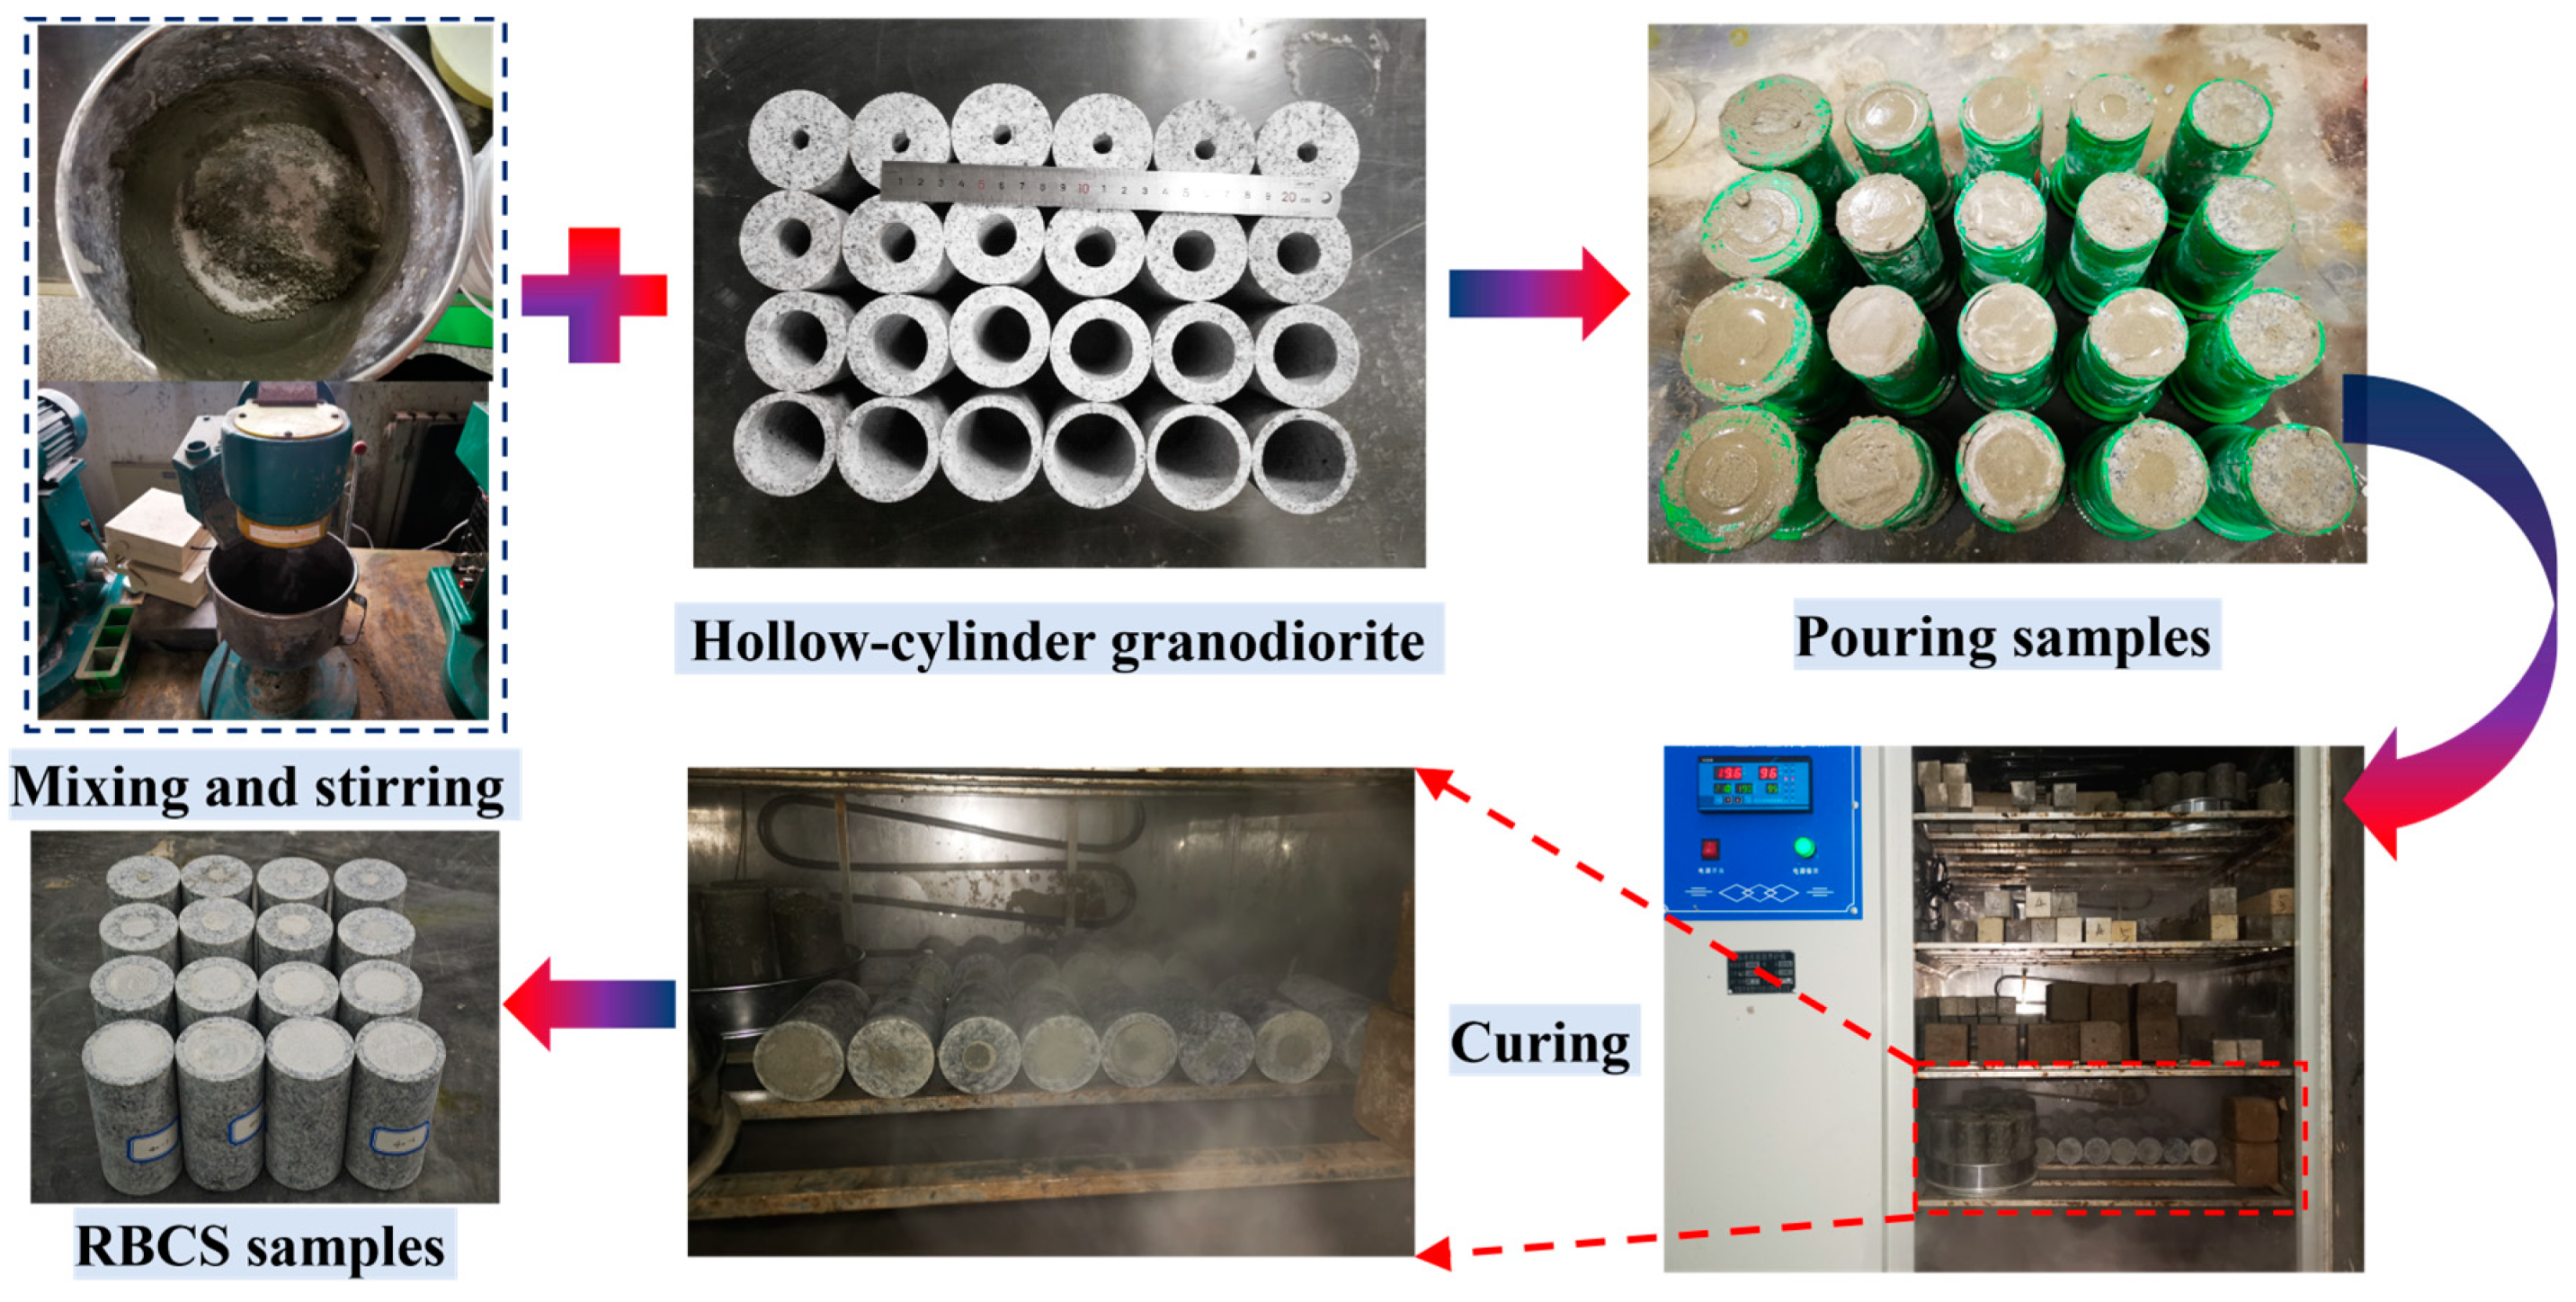
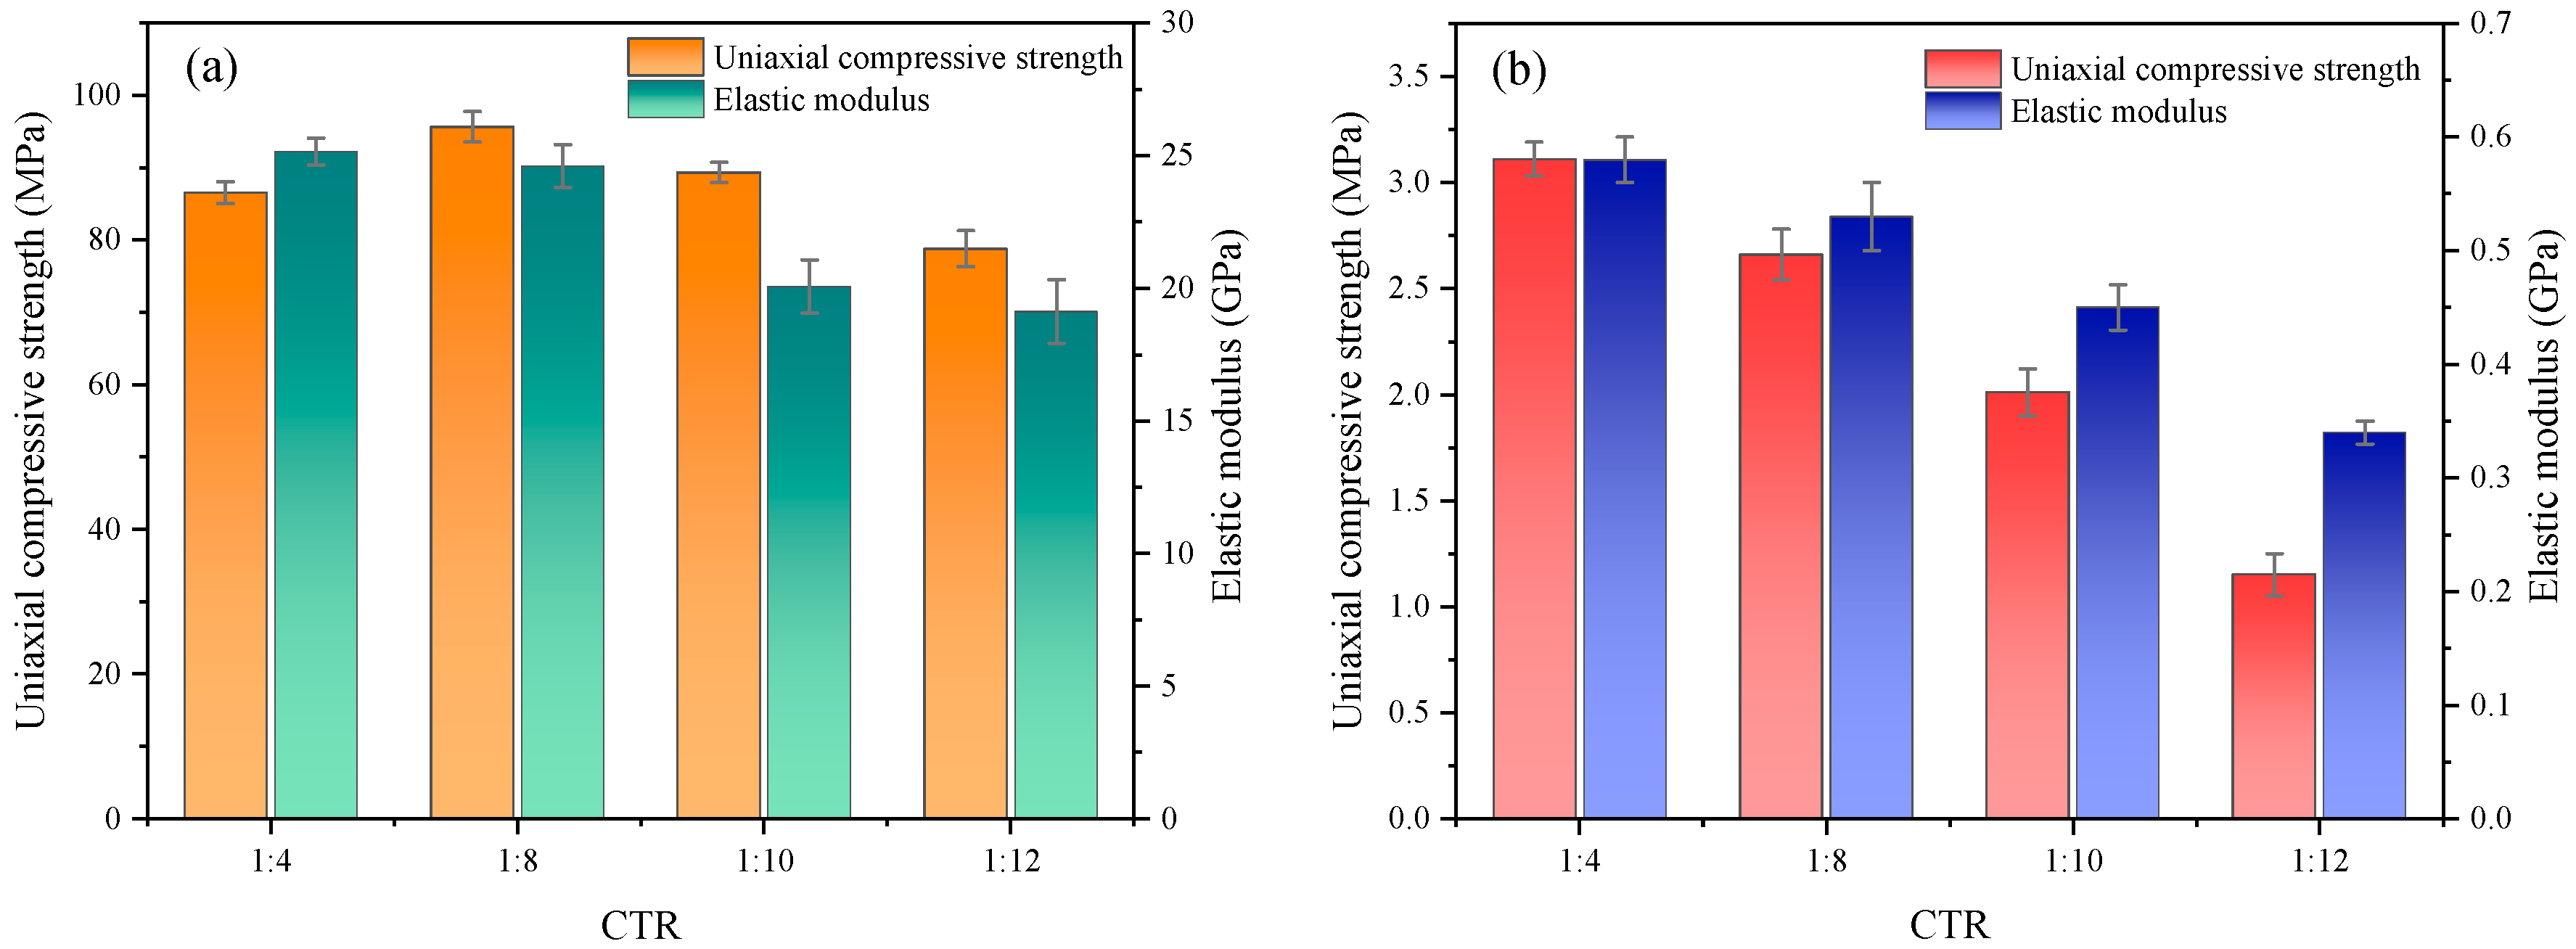
2.1. Preparation of Test Materials

The granodiorite material for the test was taken from a deep mine stope in Shandong Province, China. The tailings material was unclassified tailings post-beneficiation, and the cement material was Portland cement (P.O. 42.5). The detailed physical properties and chemical compositions of the test materials were referenced in previous studies [8]. According to the recommendations of the International Society for Rock Mechanics (ISRM), standard rock samples were prepared with a height and diameter of 100 mm and 50 mm, respectively. Since the width ratio of the mined-out area to the pillar was close to 1.5, a hollow cylindrical rock with a diameter of 30 mm was used to prepare the RBCS samples. The concentration of the filling slurry was designed to be 68% according to the field surveys, and the CTRs were 1:4, 1:8, 1:10, and 1:12, respectively. The detailed preparation process for the RBCS samples is shown in Figure 2, involving mixing and stirring of the filling material, pouring, and curing. The curing age was 28 days, followed by uniaxial compressive strength (UCS) tests and multi-level cyclic loading tests on the samples. The UCS and elastic modulus of the RBCS samples and CTB samples with different CTRs are shown in Figure 3a,b.

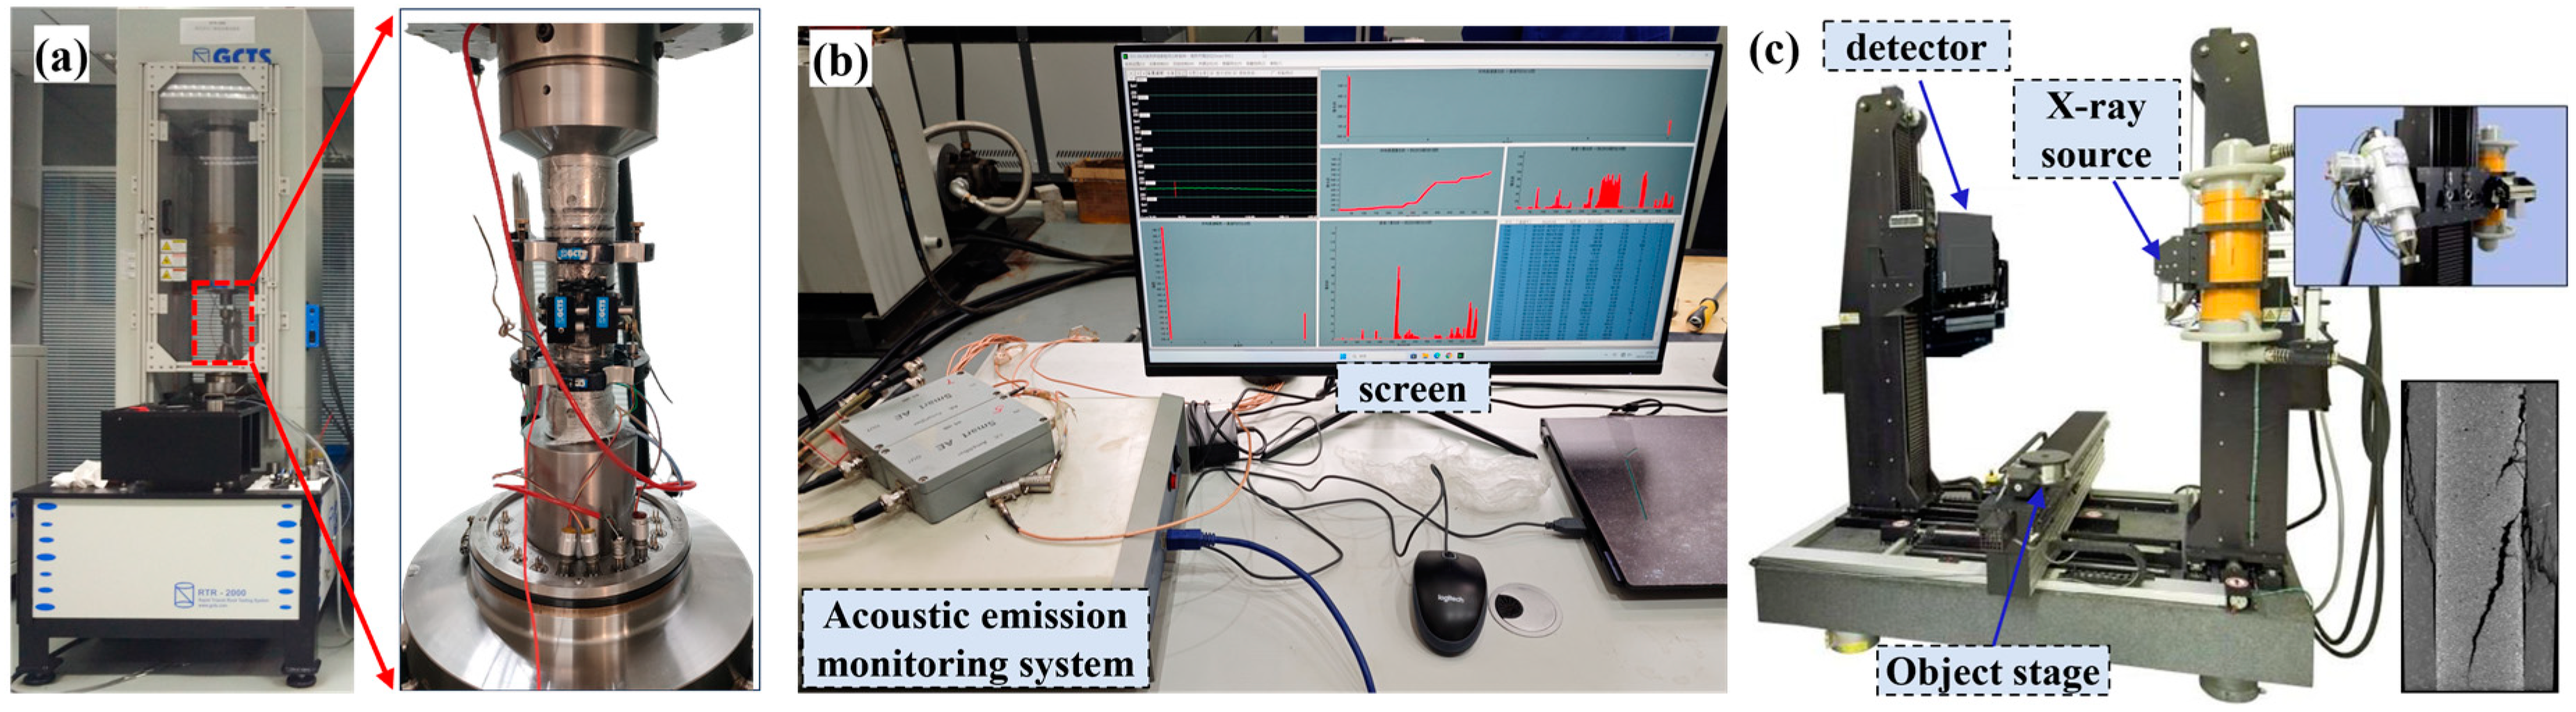
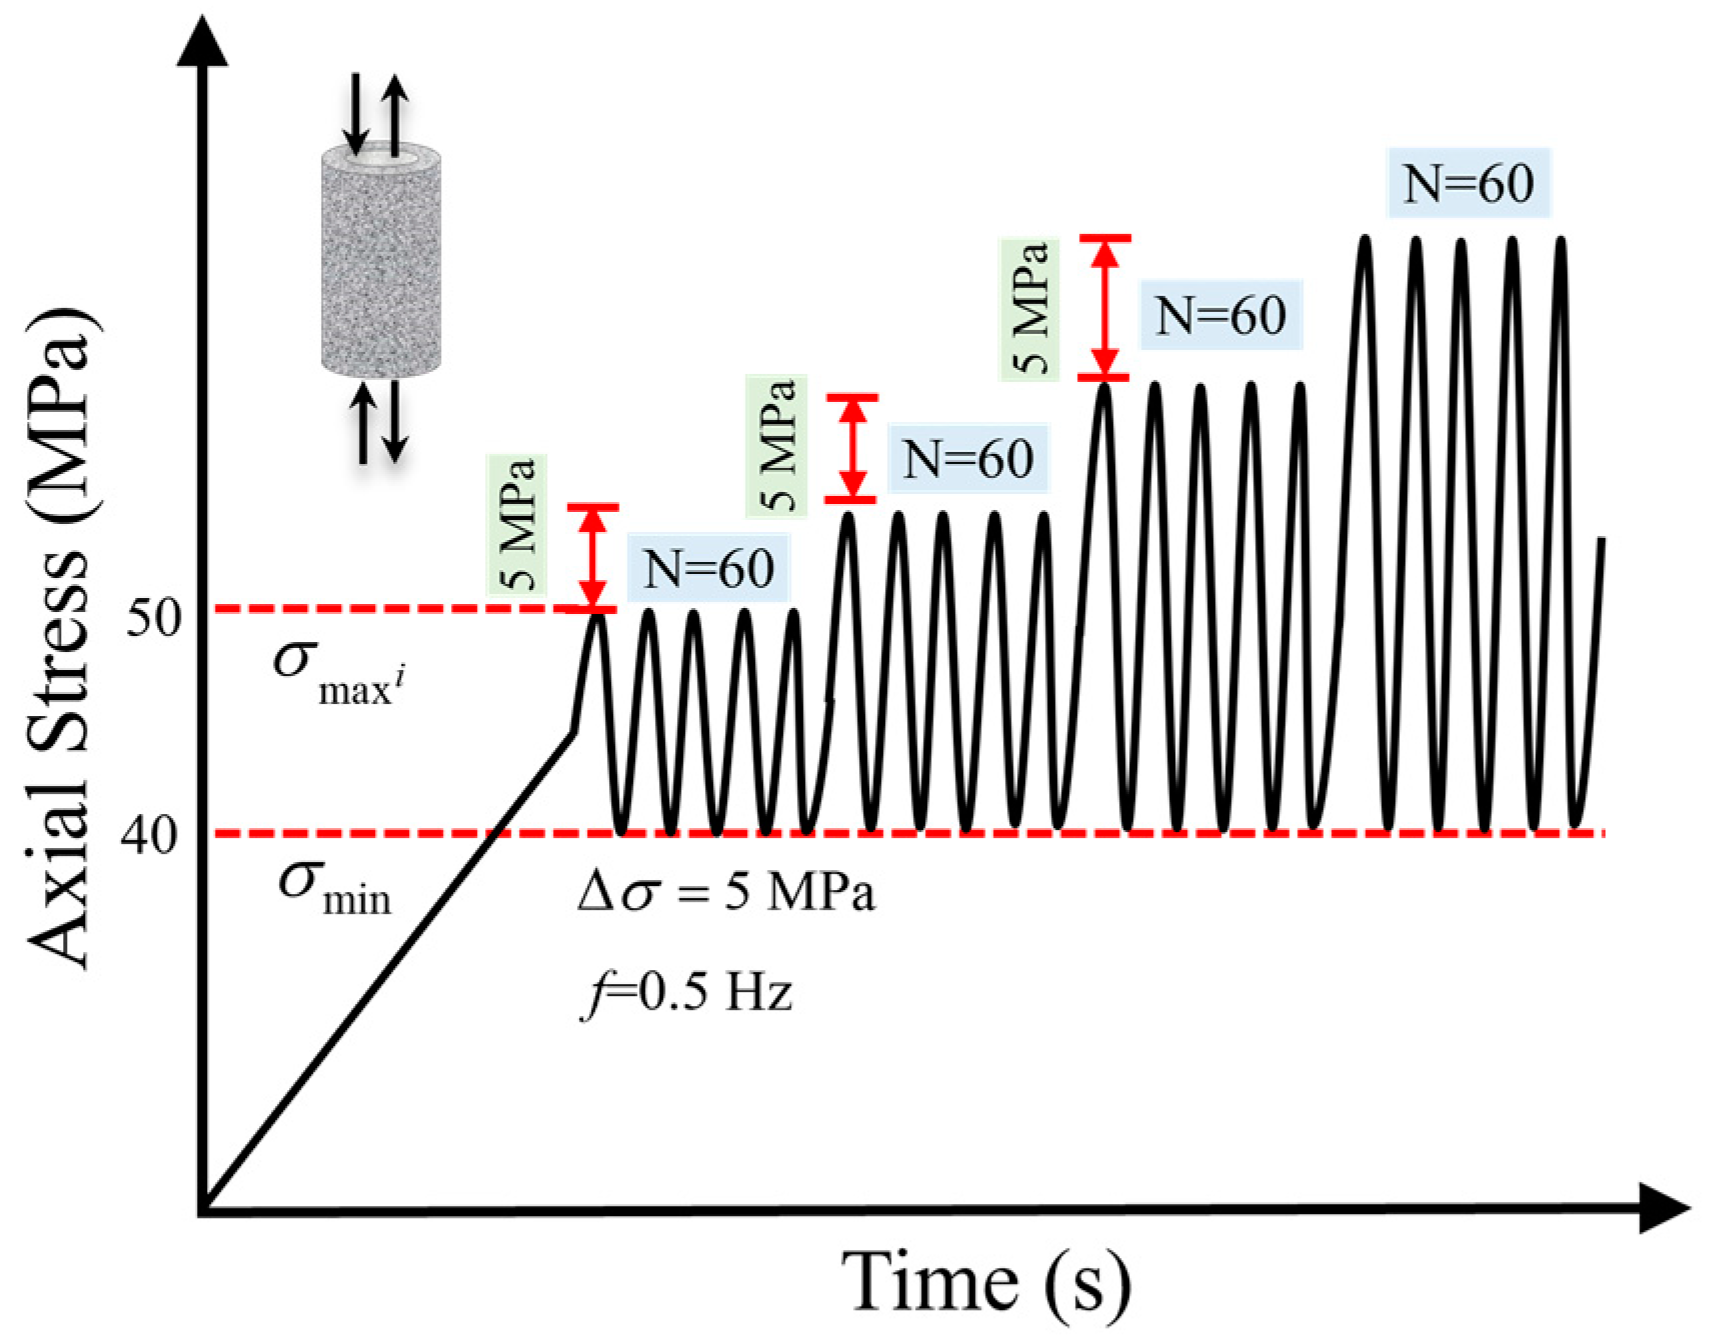
2.2. Test Equipment and Procedure

Multi-level cyclic loading tests were performed using the GCTS-RTR 2000 servo-controlled rock mechanics testing machine (GCTS testing systems, Tempe, AZ, USA). The axial and radial strains were recorded in real time using two linear variable differential transformer (LVDT) devices, as shown in Figure 4a. The device allows the loading of complex disturbed stress waves, such as triangular, sinusoidal, and square, with a dynamic loading frequency range of 0–10 Hz. The maximum stiffness of the main frame was 10 MN/mm, and the maximum axial load capacity was 2000 kN. The PCI-2 AE monitoring system from Physical Acoustics Corporation (PAC) (West Windsor Township, NJ, USA) was used to monitor the microfracture of the RBCS samples in real time during the cyclic loading process, as shown in Figure 4b. The AE noise threshold was set to 40 dB. An industrial CT machine with a voltage of 420 kV and a current of 8 mA was used to image the internal cracks of the sample after the test, as shown in Figure 4c. The minimum spatial resolution imaged by this device was 83 μm.
The cyclic loading test was divided into three steps. Firstly, a constant loading rate of 0.06 mm/min (i.e., 1 × 10⁻⁵ s−1) was applied monotonically loaded (quasi-static) to 45 MPa, which was similar to the geo-stress situation in the study mine. Subsequently, cyclic tests were conducted according to a preset increasing amplitude cyclic loading path with sinusoidal stress wave control, as shown in Figure 5. The lower cyclic load (σmin) was fixed at 40 MPa, and the upper cyclic load (σmax) was gradually increased in constant increments of 5 MPa between the two successive stages. The first upper cyclic load (σmaxi) was 50 MPa. Earlier studies indicated that the vibration frequency of the far-field blast stress wave transmitted to the structural surface of the stope was 0.04–1 Hz [18], so the dynamic loading frequency was fixed at 0.5 Hz. Sixty cycles were executed for each cyclic loading stage (CLS). As the stress amplitude increased, fatigue failure was observed in the RBCS samples with different CTRs. Both the fatigue life (number of cycles) and fatigue strength (ultimate fatigue stress) of the RBCS samples varied with different CTRs. Finally, CT scanning was performed on the failed samples to reveal the effect of CTR on crack propagation. A summary of the test loading program is presented in Table 1.

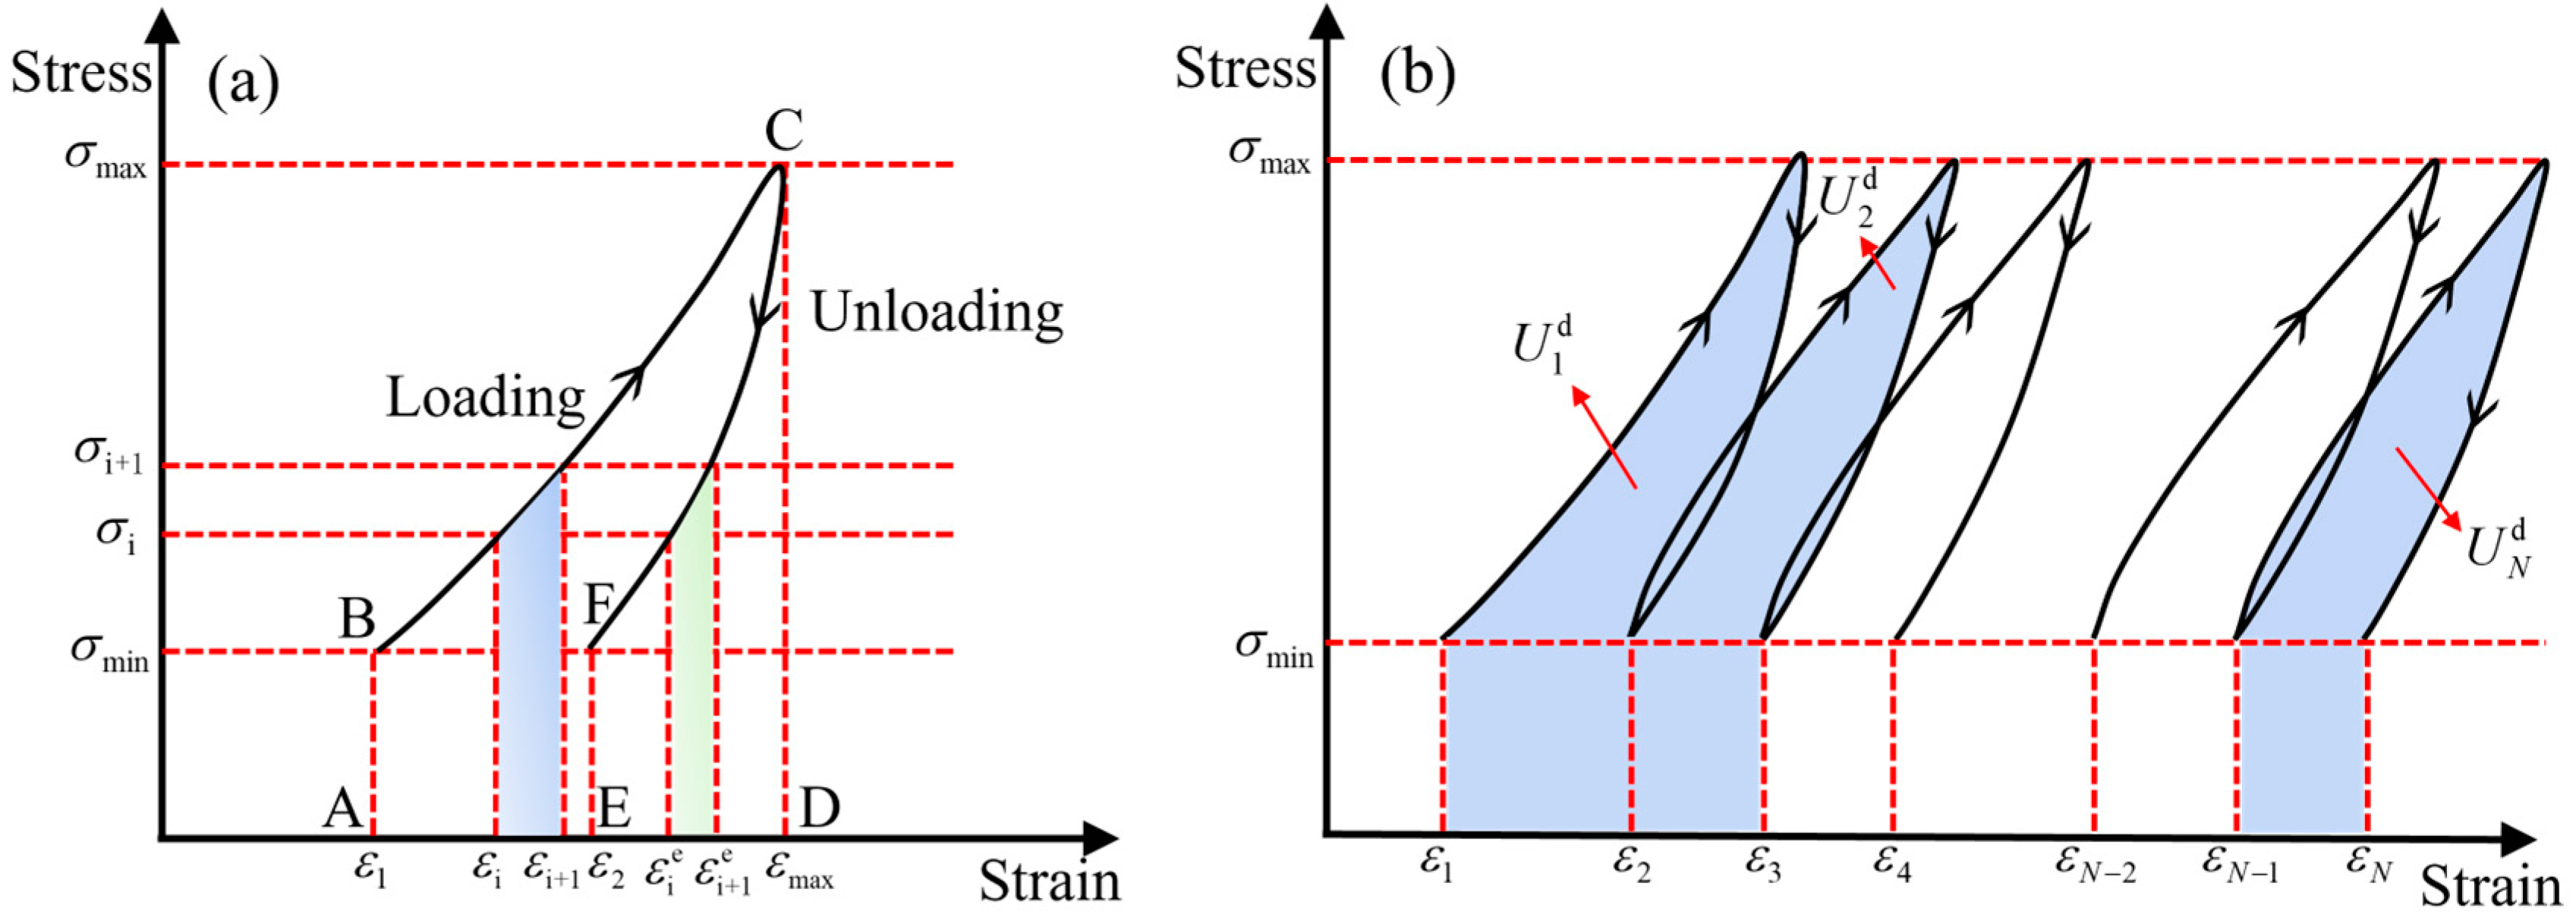
2.3. Energy Conversion Mechanism

Based on the first law of thermodynamics, the variation of the external work done is equal to the variation of the internal energy of each volume unit within the rock sample under adiabatic conditions. Previous literature states [26] that the following relationship exists between the total input energy, elastic energy, and dissipated energy of a rock:
U = U e + U d
where U is the total input energy, Ue is the elastic energy stored in the rock during the loading process, Ud is the dissipated hysteresis energy.
For RBCS samples subjected to cyclic loading tests, the fatigue energy density was calculated by integrating the cyclic stress-strain curve over the entire deformation. A schematic illustration of the strain energy calculation is shown in Figure 6. The calculation of U, Ue and Ud in one cycle is shown in Figure 6a. The area of the ABCD region under the loading stress curve represents the total energy U applied by the external load, and the area of the CDEF region under the unloading curve represents the stored elastic strain energy Ue, which is released during the unloading process. The area difference between U and Ue is the Ud, which is primarily used for internal damage and irreversible deformation. Figure 6b shows a schematic diagram of dissipated energy in N cycles. The detailed calculation procedure for fatigue energy density is shown in Equations (2)–(4) [27]:
U = ε 1 ε max σ d ε = i = 1 n 1 2 σ i + σ i + 1 ε i + 1 ε i
U e = ε 2 ε max σ d ε = i = 1 n 1 2 σ i + σ i + 1 ε i + 1 e ε i e
U d = U U d = ε 1 ε max σ d ε ε 2 ε max σ d ε
where ε 1 and ε 2 are the axial strains corresponding to the σmin; ε max is the axial strain corresponding to the σmax; ε i , ε i + 1 , ε i e and ε i + 1 e are the axial strains at the next integration step; σ i and σ i + 1 are applied axial stresses at the next integration step, respectively.

3. Test Results

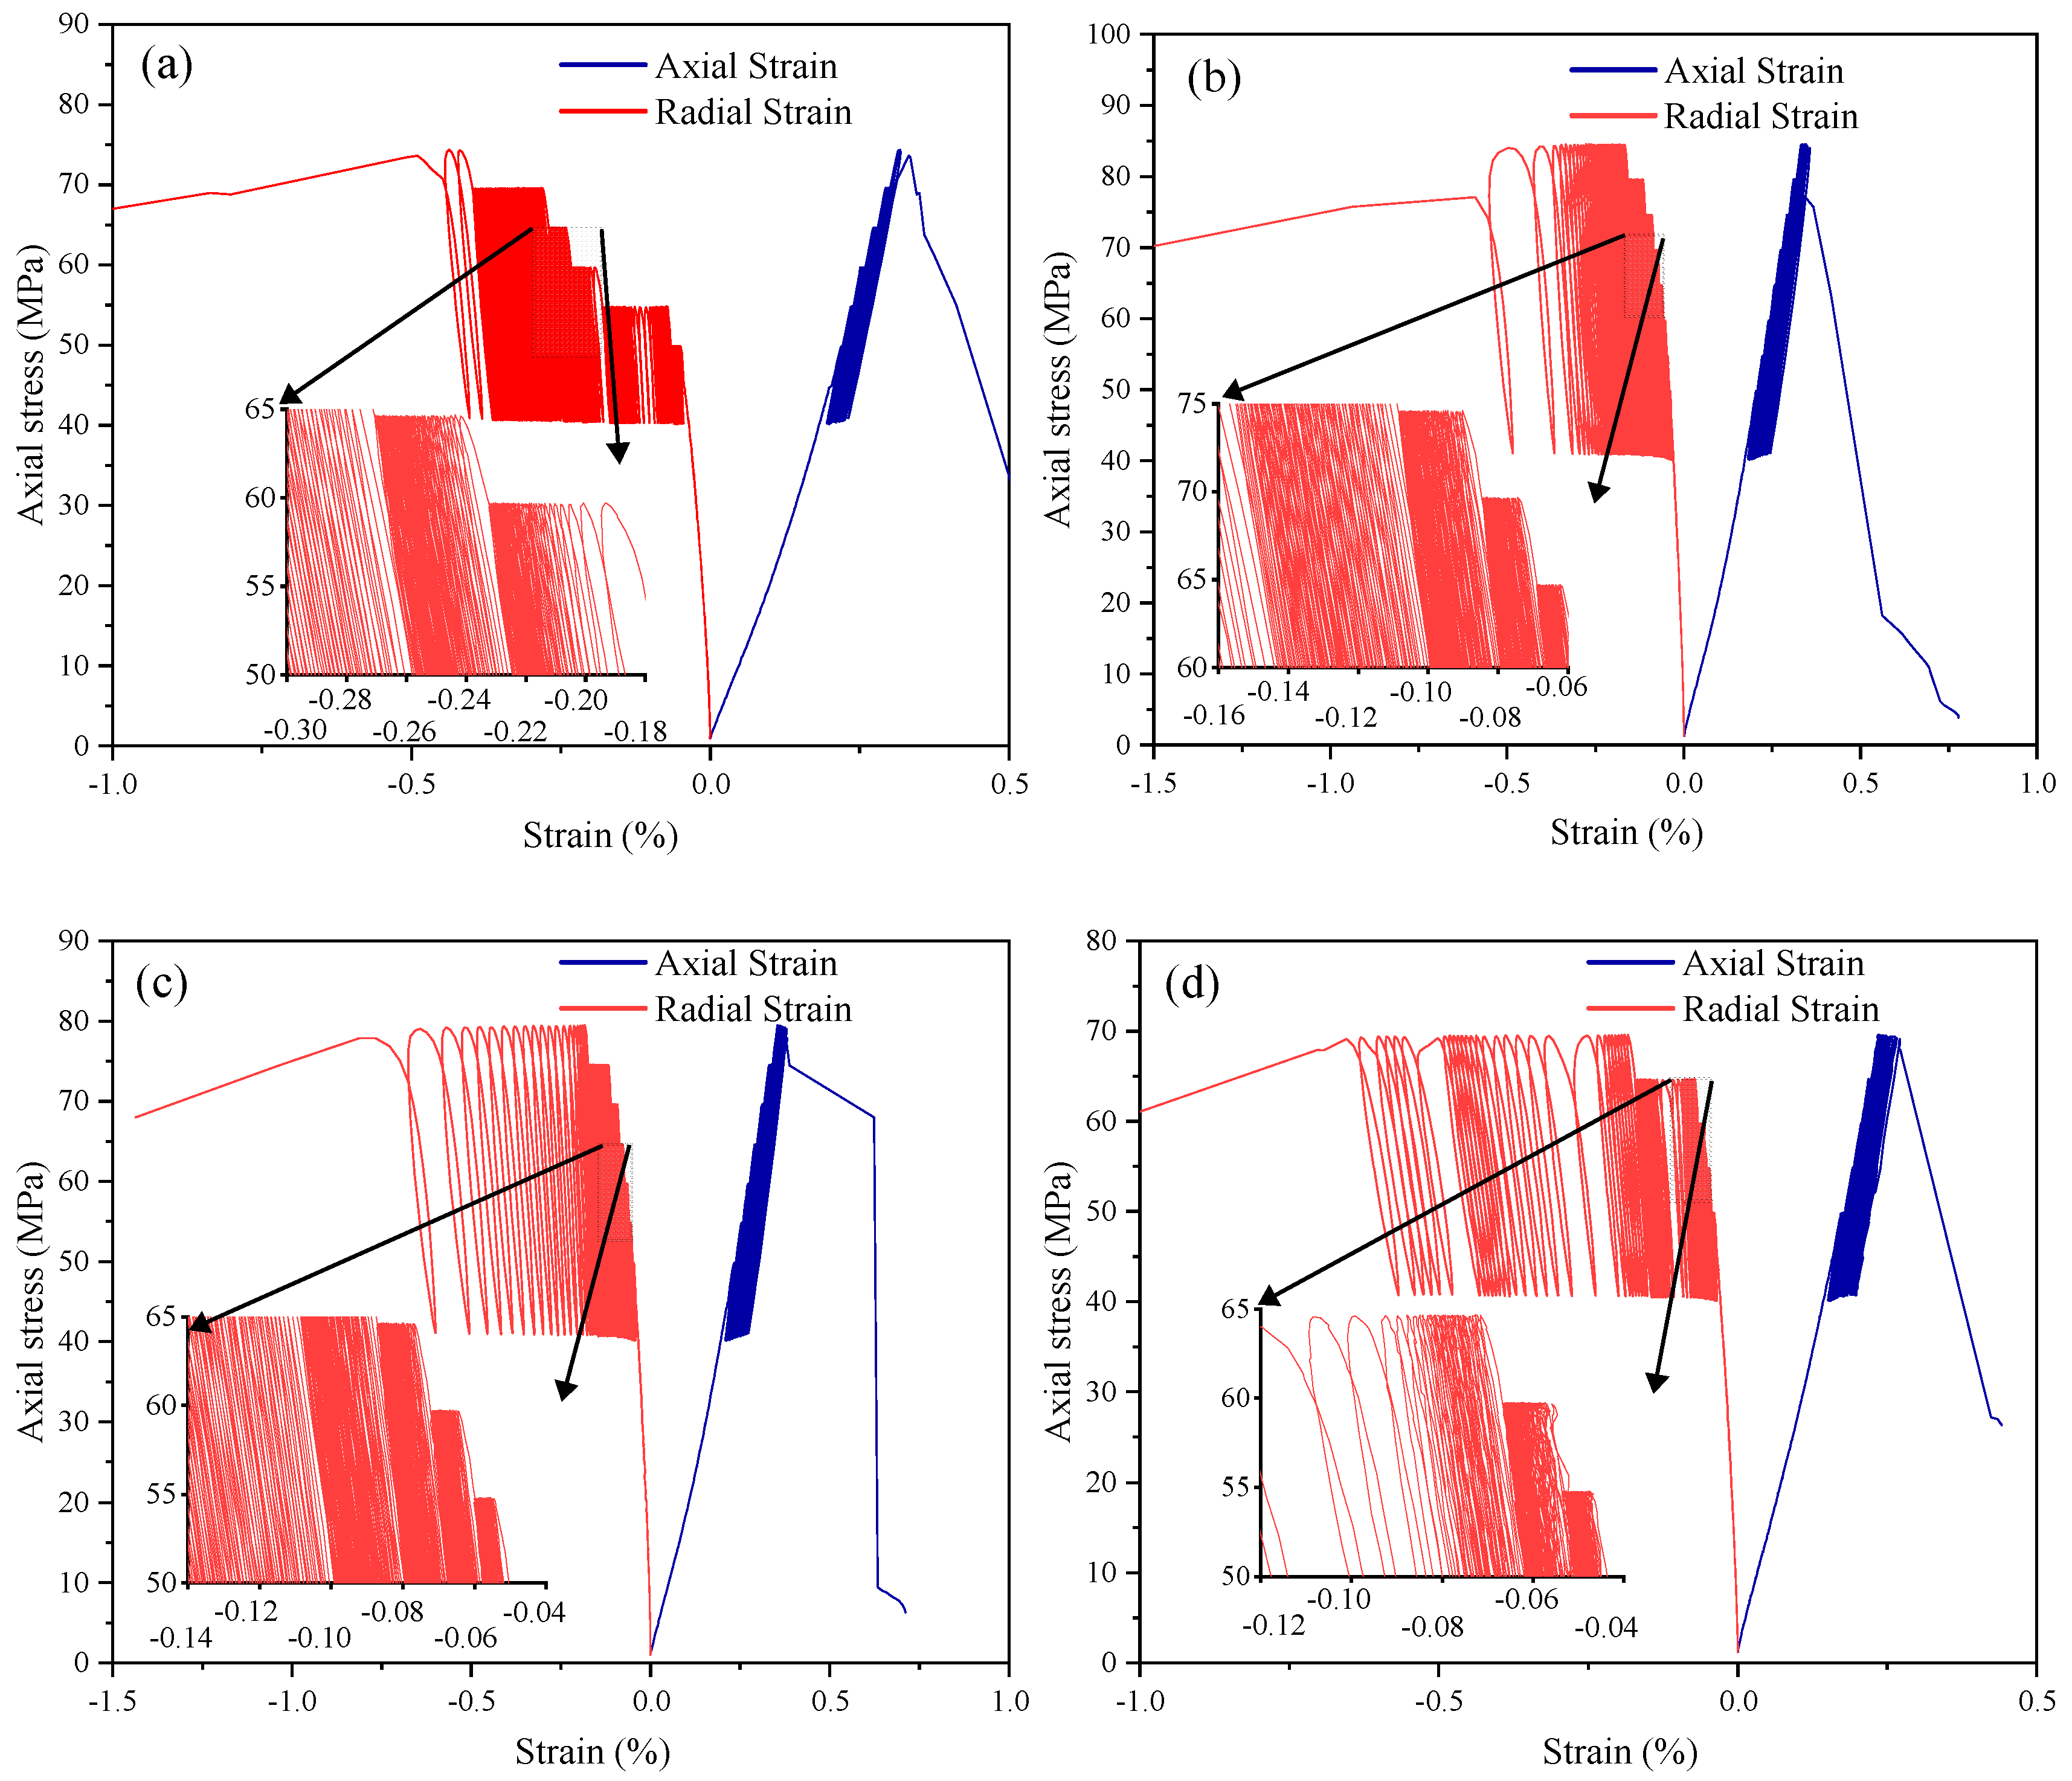
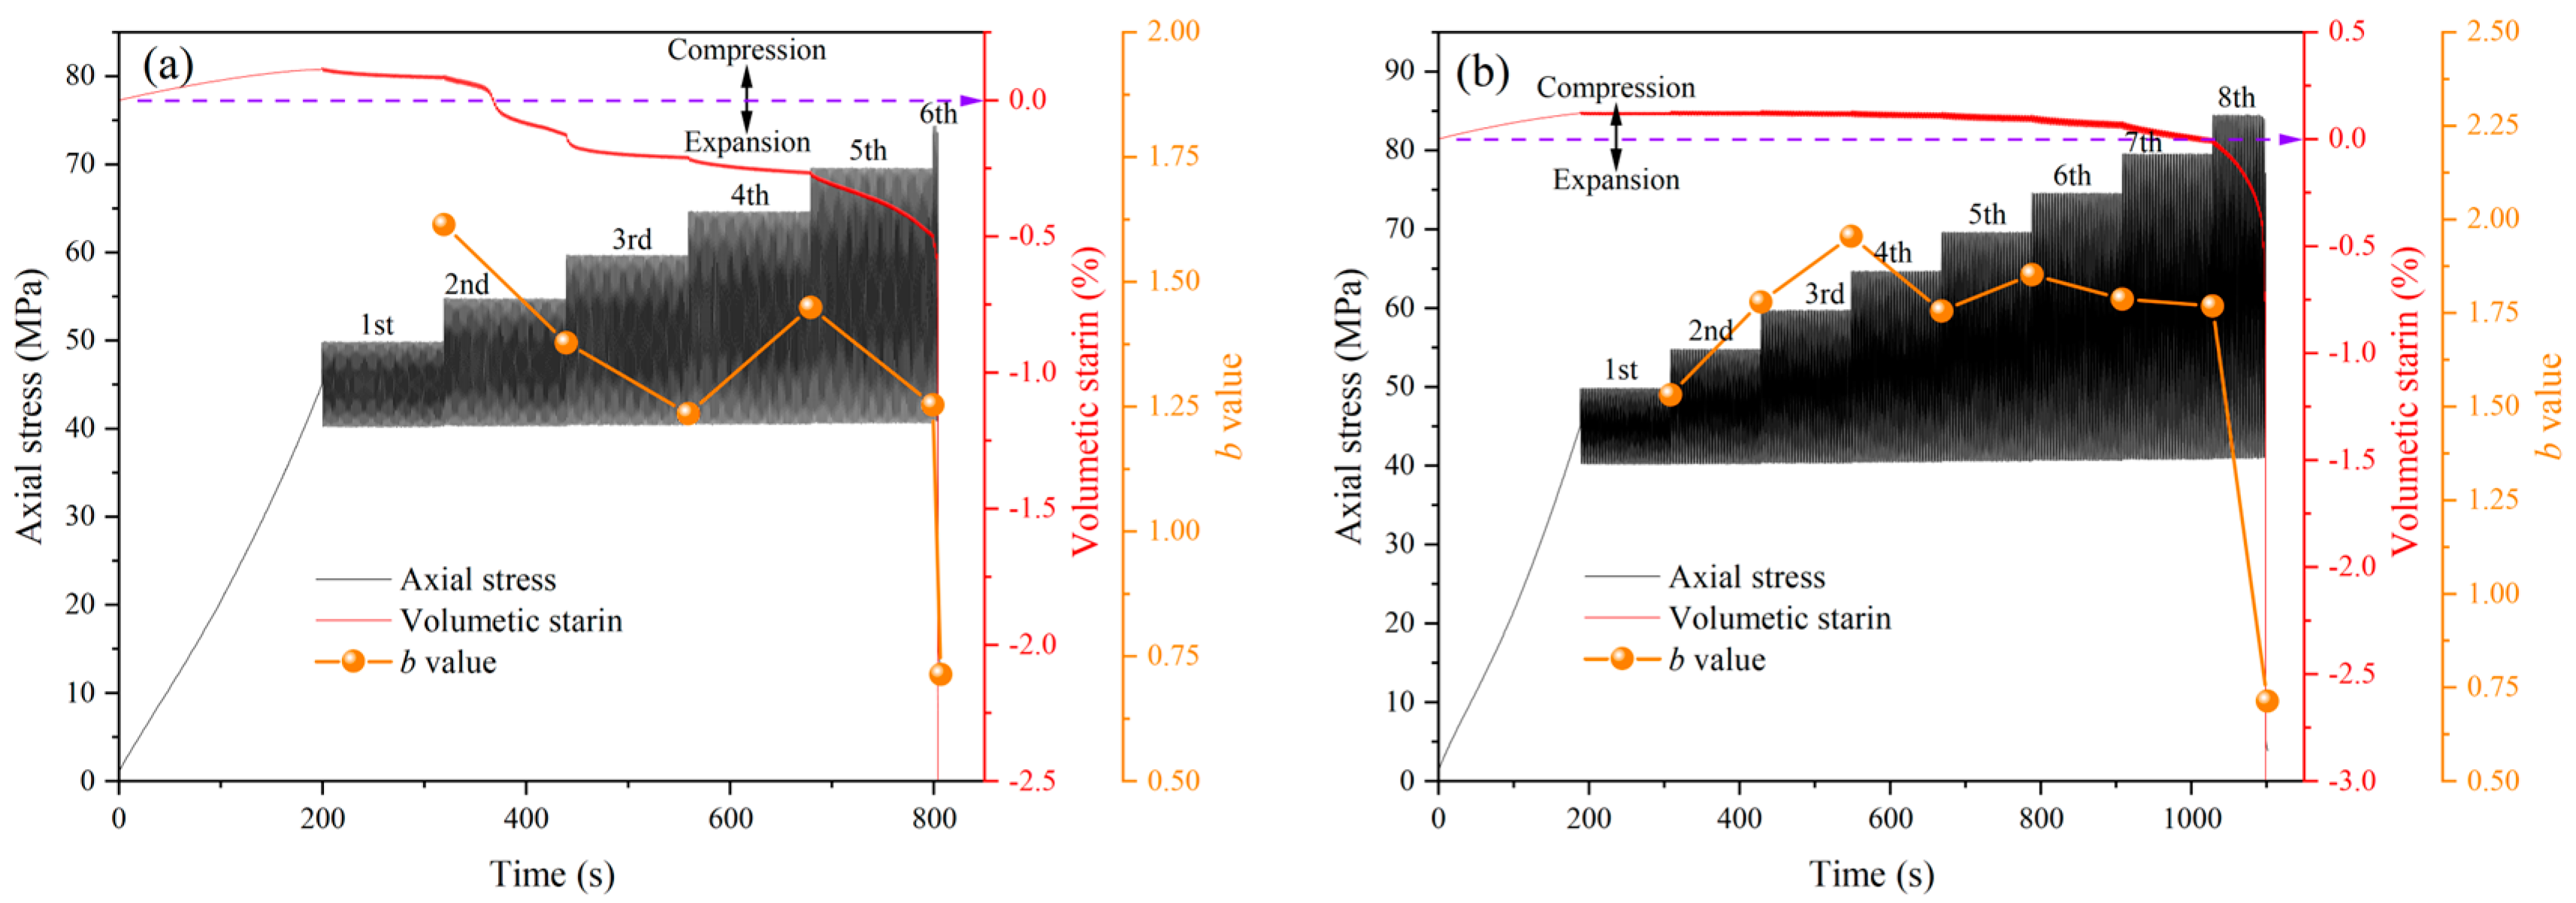
3.1. Stress-strain Curve Analysis

To facilitate an intuitive analysis of deformation characteristics, a group of typical samples was selected for analysis. Figure 7 shows the stress-strain curves of RBCS samples with different CTRs. It was observed that the CTR significantly affected the fatigue lifetime, the number of CLSs, and the fatigue strength of the RBCS samples. The number of CLS experienced was 6, 8, 7, and 5; the Nf was 302, 456, 379, and 270 cycles, and the σcf was 74.4 MPa, 84.1 MPa, 79.1 MPa, and 69.3 MPa, respectively, when the CTR ranged from 1:4 to 1:12. The strength and deformation characteristics of CTB samples were controlled by the CTR, which also affected the structural deterioration and fracture of the RBCS samples. The UCS of the CTB was positively correlated with the CTR, but the ultimate strength and peak strain of the RBCS samples initially increased and then decreased. The RBCS was a composite specimen consisting of two materials that experienced damage cracking at the interface under cyclic loading, and the CTR clearly influenced the degree of the cracking. Previous studies have reported that backfill can resist hole collapse and prevent rockburst [27]. As a “flexible material”, the backfill absorbed energy during rock fracture. However, the energy absorption effect was related to the slurry concentration and the CTR [28]. When the CTR was 1:8, the elastic matching effect between the backfill and the surrounding rock was better, as was the energy-absorbing property of the backfill, so the RBCS sample exhibited the best fatigue mechanical properties. Moreover, the tests revealed the stress-strain hysteresis phenomenon, which resembled the behavior of intact rock and rock-like brittle materials exposed to cyclic loading. The hysteresis curves presented a shape from dense to sparse.

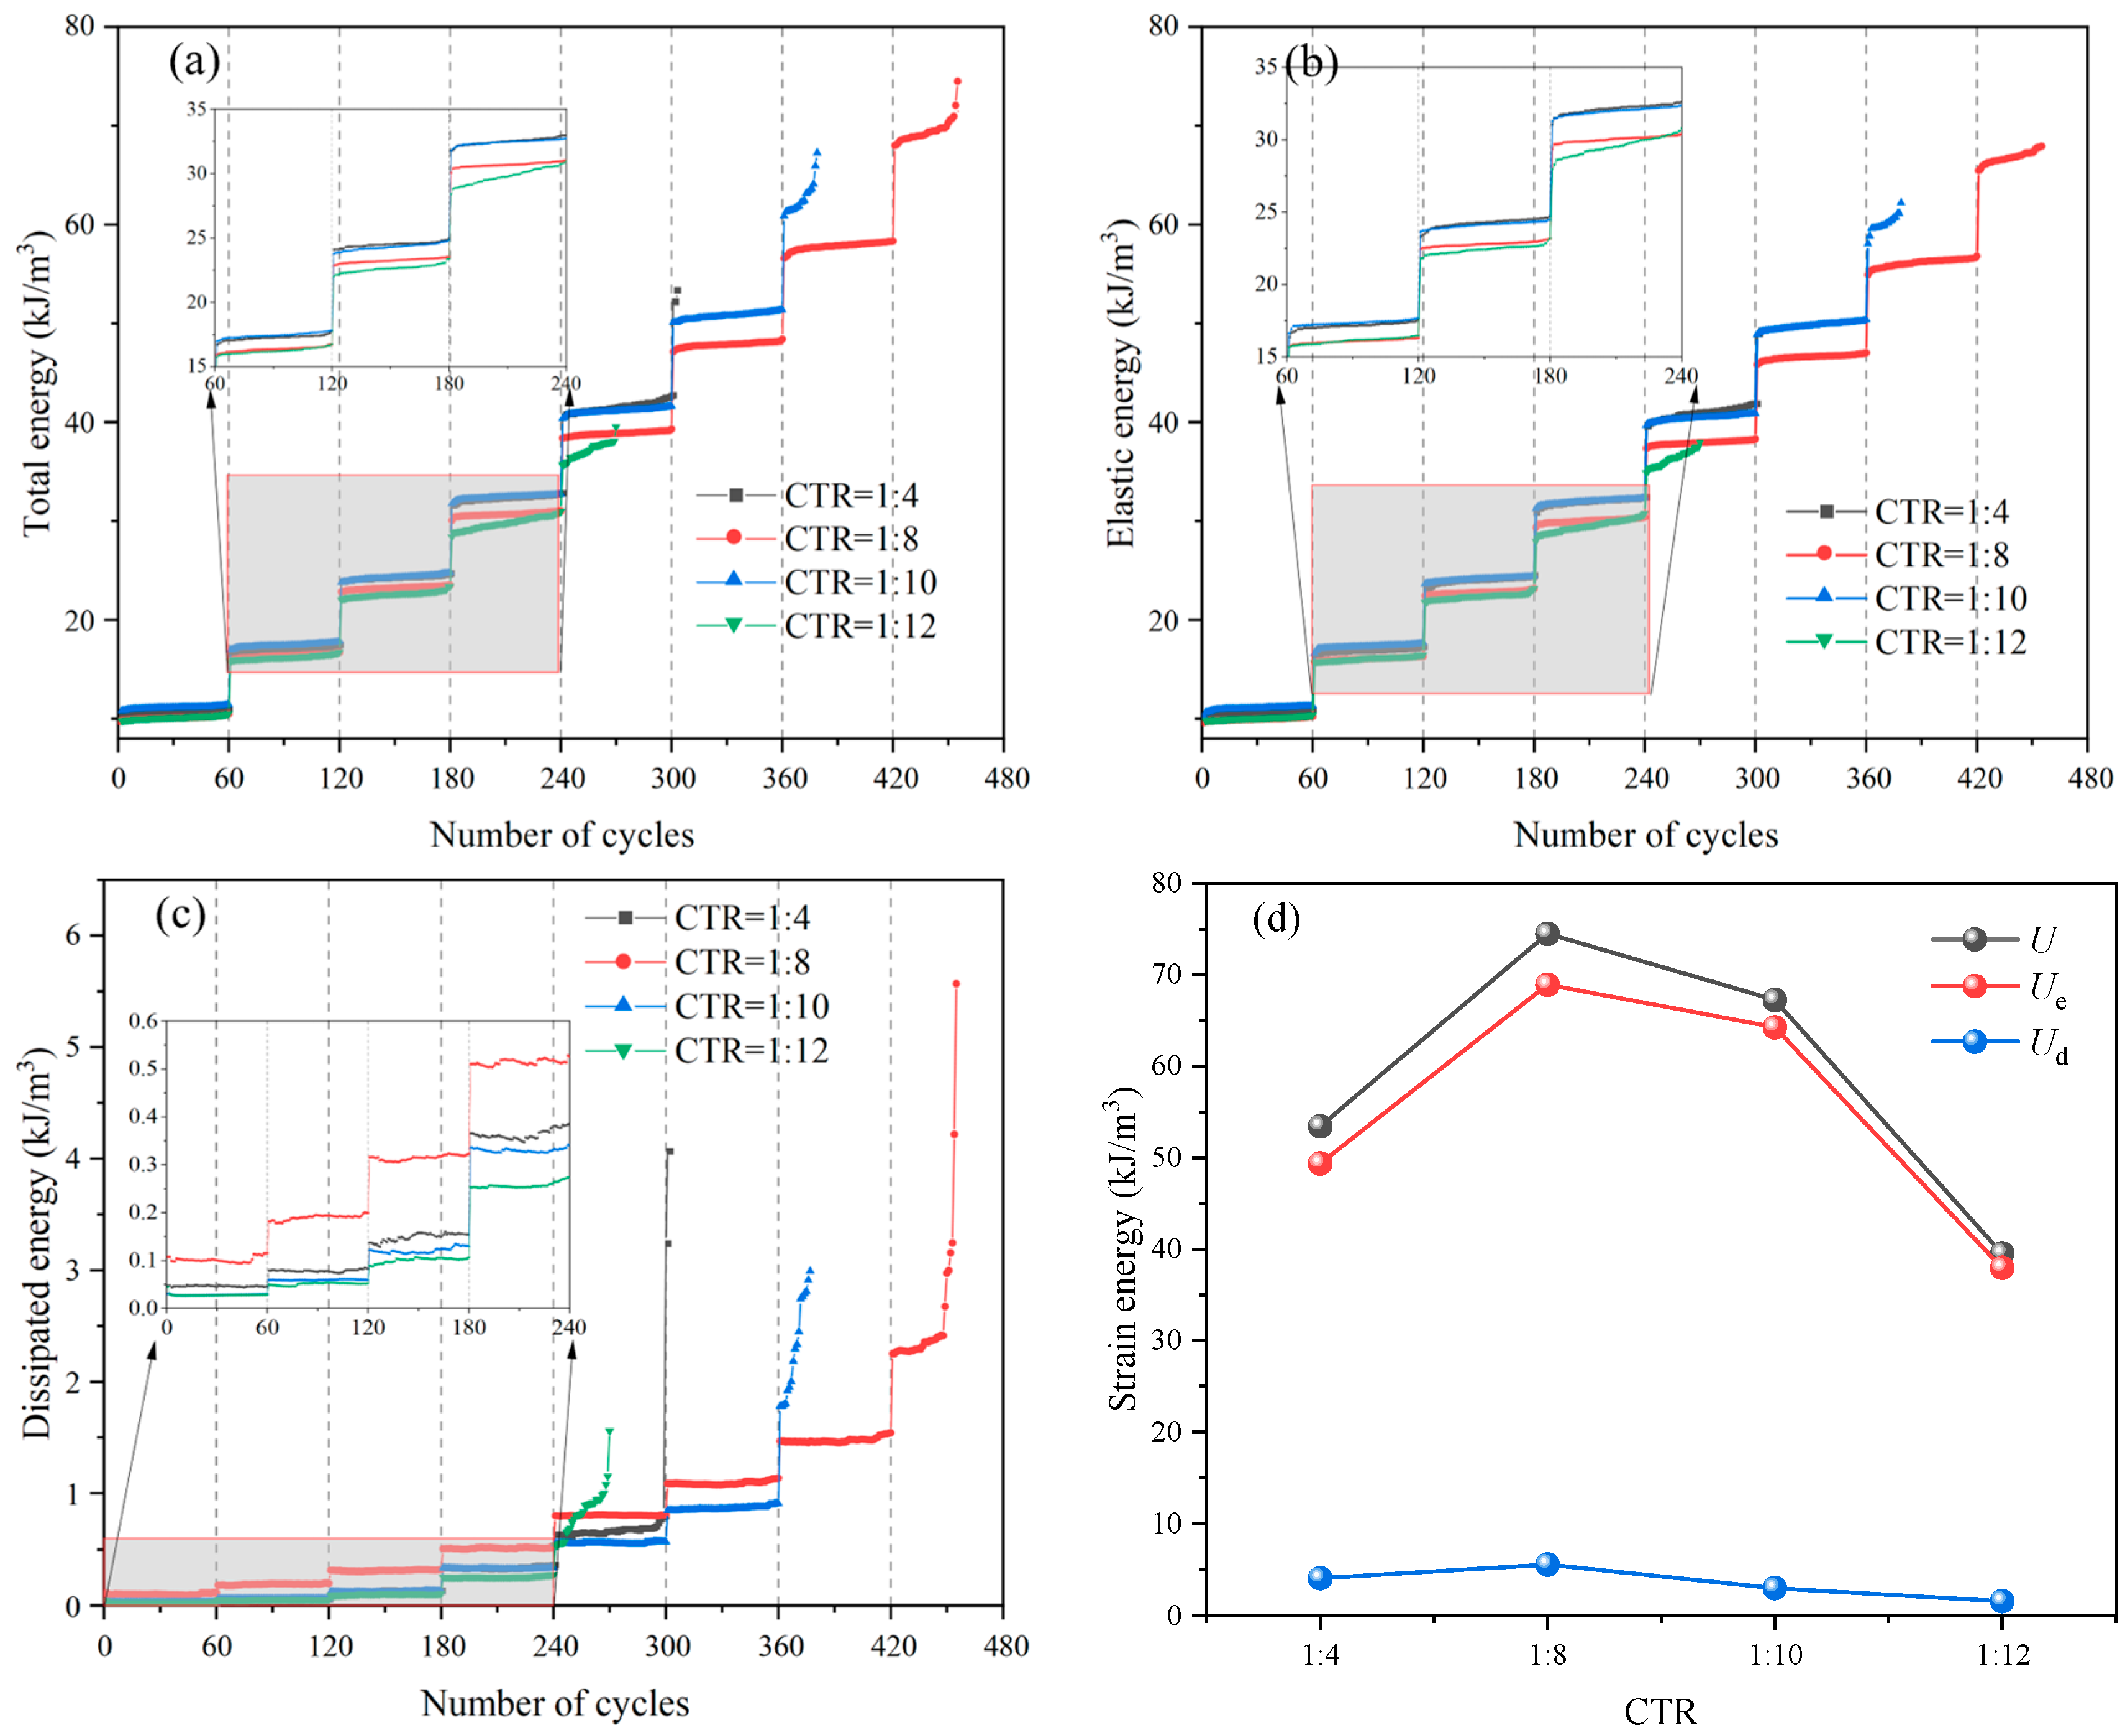
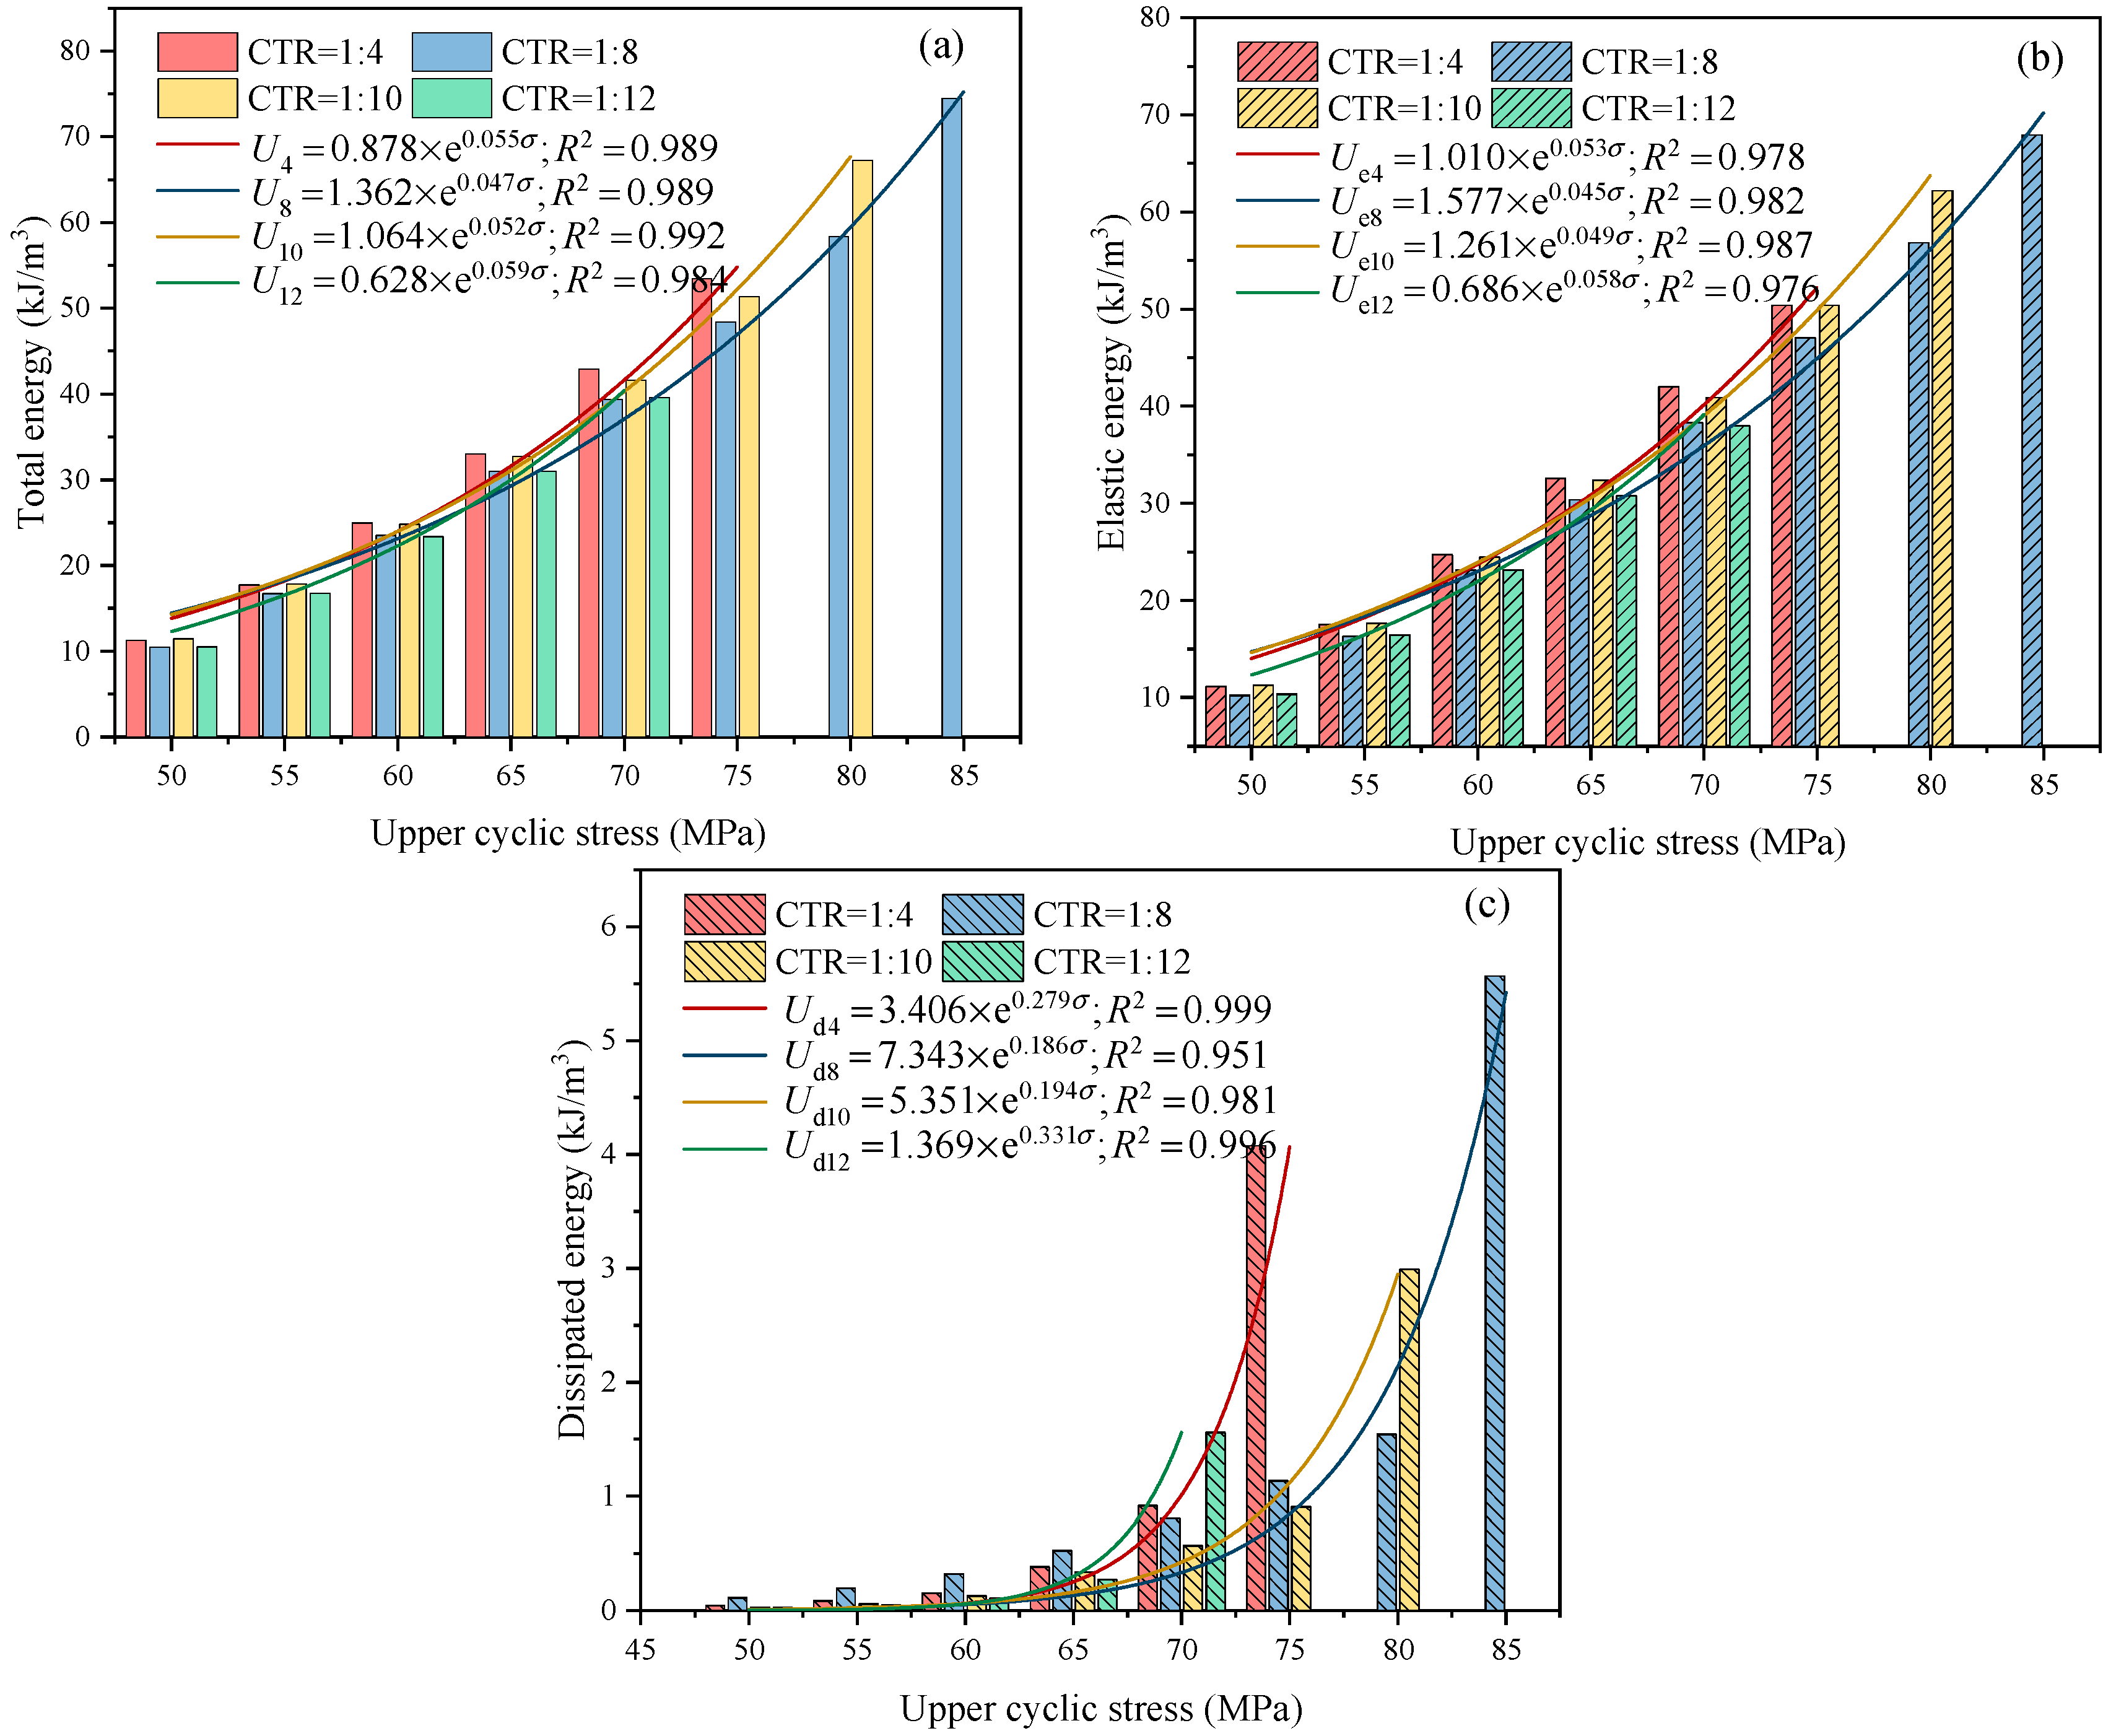
3.2. Energy Conversion Characteristics

It is well known that the damage cracking of rocks is driven by energy. The U, Ue, and Ud of RBCS samples with different CTRs subjected to cyclic loading were obtained from Equations (2)–(4), as shown in Figure 8. This revealed the energy storage and dissipation laws of RBCS samples. The evolution pattern of each energy curve was similar for samples with different CTRs. The U was converted into Ue and Ud as the number of CLSs increased. The overall trends of the energy curves were similar to those under monotonic loading. In the initial CLS, the U was almost entirely converted into Ue and stored inside the sample. Since the rock and the backfill were in the compaction stage, a small amount of energy dissipated, resulting in the total energy curve almost overlapping with the elastic strain energy curve. As the sample sustained damage and accumulative damage increased, a portion of the input energy was consumed for crack initiation and propagation. Consequently, the curve of U no longer overlapped with the curve of Ue. With the increase in the number of cycles, the Ud gradually increased, and the rate of increase became faster. To clearly observe the trend of Ud, the curve of Ud was magnified and plotted in the same graph. It was evident that before the final CLS, the variation of Ud was minor within the CLS. As the stress amplitude increased, the Ud suddenly increased, showing a distinct stepwise increase pattern. The analysis suggested that significant damage occurred instantaneously as the stress increased. In the final failure stage, the rate of increase of Ud accelerated, indicating that more energy drove crack propagation and coalescence until the sample completely failed.
The effects of different CTR on the energy evolution of RBCS samples are shown in Figure 9. The energy parameters of U, Ue, and Ud all exhibited a trend of initially increasing and then decreasing with the decrease in CTR, reaching a maximum at the CTR of 1:8. This finding demonstrated that the best elastic match between the surrounding rock and the backfill improved the energy storage capacity, which was macroscopically reflected in the maximum fatigue strength. The stiffness of the backfill at a CTR of 1:4 was higher, but the deformation capacity was lower. Rock deformation exerted a greater contact support force on the backfill, resulting in early-stage fatigue instability. Therefore, thenergyy storage capacity of the sample with a CTR of 1:4 was lower than that of the sample with a CTR of 1:8. When the CTR was 1:10 and 1:12, the elastic modulus of the backfill decreased, leading to a weakened ability to resist rock deformation and collapse. Moreover, the poor elastic match between the surrounding rock and backfill led to a decreased energy storage capacity in the samples. The energy storage capacity of the RBCS samples was quantified by the energy storage limit (elastic energy at fatigue failure). The energy storage limit of the RBCS samples increased by 34.9% when the CTR was reduced from 1:4 to 1:8. However, it decreased by 8.4% and 44.1% as the CTR was reduced from 1:8 to 1:12, respectively. Notably, the sample with a CTR of 1:8 dissipated more energy than the other samples in each CLS, but failure did not occur at an early stage. The reason for this phenomenon was the better elastic match between the surrounding rock and the backfill. Additionally, the backfill’s energy-absorbing effect played a significant role. Therefore, more energy was consumed to induce fatigue instability. Similarly, it can be inferred that the sample with a CTR of 1:8 suffered the most severe fatigue fracture. The above analysis showed that CTR had a significant effect on the energy evolution of RBCS samples.
The energy dissipation and release during cyclic loading were not only related to the number of cycles; they were also related to the CLS. The relationship between the energy parameters and the upper axial stress for RBCS samples subjected to multi-level fatigue loading is shown in Figure 10. Ud fluctuated more than U and Ue, which was strongly related to the fracture degree of samples with different CTRs. Figure 10c illustrates more energy dissipation for samples with CTR 1:4 and 1:10. The energy parameters of the samples with different CTRs were fitted to the upper cyclic stress, which revealed that the energy parameters of U, Ue, and Ud exhibited a nonlinear increase with the increase in upper cyclic stress. The fitted curve equations were consistent with an exponential function, and the correlation coefficients were all above 0.951, indicating a high correlation between energy and upper cyclic stress.

3.3. Analysis of AE Characteristics

3.3.1. Characterization of AE Ring Counts and AE Energy

AE studies of cracking processes in rocks and rock-like materials have shown that elastic waves expressed in the form of AE signals reveal energy dissipation during crack initiation, propagation, and coalescence [29]. The analysis of AE ringing counts/energy evolution patterns contributed to the understanding of the fracture instability mechanism of RBCS.
The evolution of AE ringing counts of RBCS samples with different CTRs subjected to cyclic loading is shown in Figure 11. As the stress amplitude increased, the AE ringing counts curve skipped and showed a surge point. The AE activities were not obvious in one CLS, showing a relatively quiet period. However, the RBCS samples with different CTRs experienced various degrees of structural deterioration, and the output AE activities varied significantly. The AE ring counts were more pronounced in each CLS for samples with CTRs of 1:4 and 1:12. Specifically, the sample with a CTR of 1:4 exhibited a sudden increase in AE events during the second CLS, which corresponded to a sudden increase in strain. This indicates that apparent damage and fracture occurred within the sample. However, the samples with CTRs of 1:8 and 1:10 exhibited a sharp increase in AE events during the ultimate fracture stage. Fewer AE events were recorded in the pre-rupture stage. In addition, the cumulative AE ringing counts showed a stepwise increase trend, and increased sharply in the final fatigue failure stage. This indicated that the RBCS samples exposed to cyclic loading showed progressive failure characteristics of crack expansion and energy release step by step. In other words, microcracks initiated and propagated into local cracks in the early fatigue stage, and the AE ringing counts were relatively insignificant. When the local crack propagated and coalesced to form a macroscopic crack, the AE signal increased significantly, showing a sharp increase in the cumulative AE ring count curve. The cumulative AE events reflected the degree of energy release in the fracture of RBCS samples. The cumulative AE ring counts for RBCS samples with CTRs of 1:4 to 1:12 were 10.82 × 10⁶, 11.36 × 10⁶, 10.38 × 10⁶, and 9.05 × 10⁶ respectively. As the CTR decreased, the cumulative AE ring counts tended to increase and then decrease. The maximum cumulative AE ringing counts were observed for the sample with a CTR of 1:8, and the minimum for the sample with a CTR of 1:12.
Figure 12 illustrates the evolution of AE energy during the cyclic loading of different RBCS samples, recording the strain energy released at failure. Observations indicated that the AE energy was strongly consistent with the AE ringing count activity pattern. As depicted in Figure 12, the AE energy curve exhibited a sharp increase when the stress amplitude increased, but the AE energy increment within one CLS was not significant. The results indicated that the sudden increase in stress amplitude significantly affected the damage of RBCS samples. However, the damage to RBCS samples tended to stabilize within a CLS. In the final CLS, the energy increased sharply, indicating that the RBCS samples underwent sudden fracture instability. The energy release characteristics of RBCS samples with various CTRs varied, which was similar to the AE ring count pattern. The cumulative AE energy for RBCS samples with CTRs of 1:4 to 1:12 were 7.02 × 10⁵ mV·ms, 7.85 × 10⁵ mV·ms, 6.78 × 10⁵ mV·ms 5.71 × 10⁵ mV·ms, respectively. The cumulative AE energy increased and then decreased as the CTR decreased, and the sample with a CTR of 1:12 had the lowest cumulative AE energy.

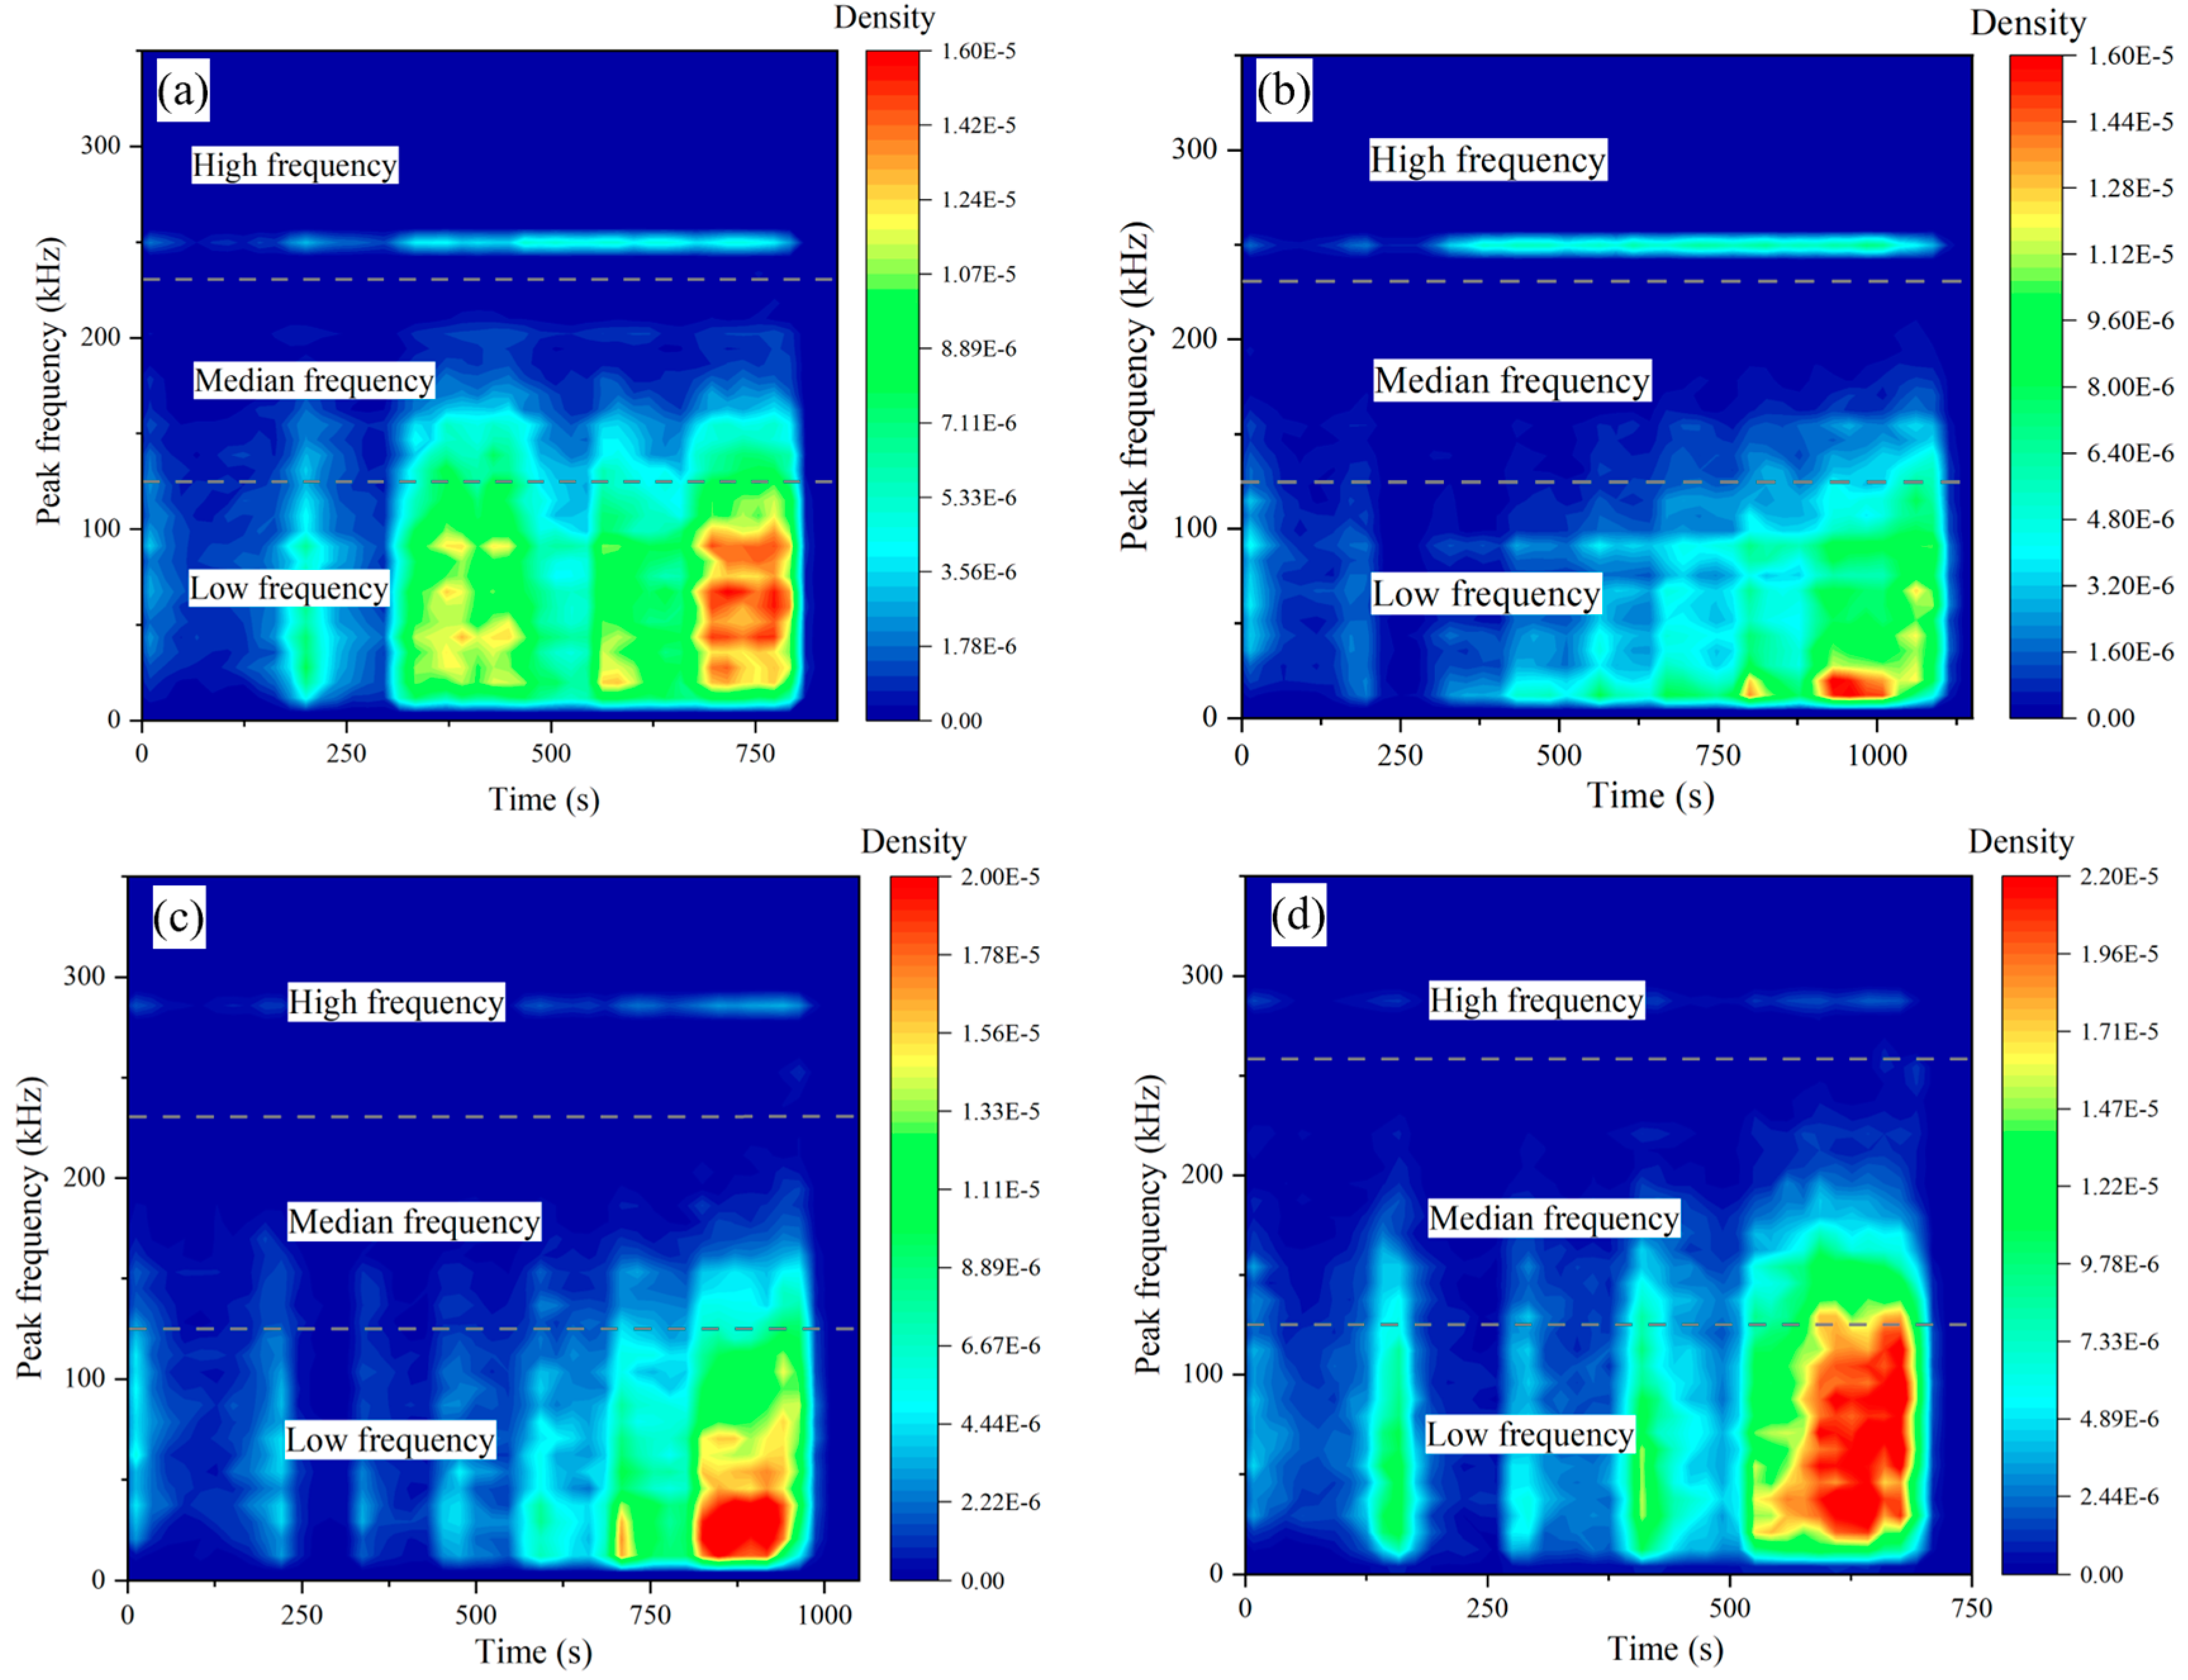
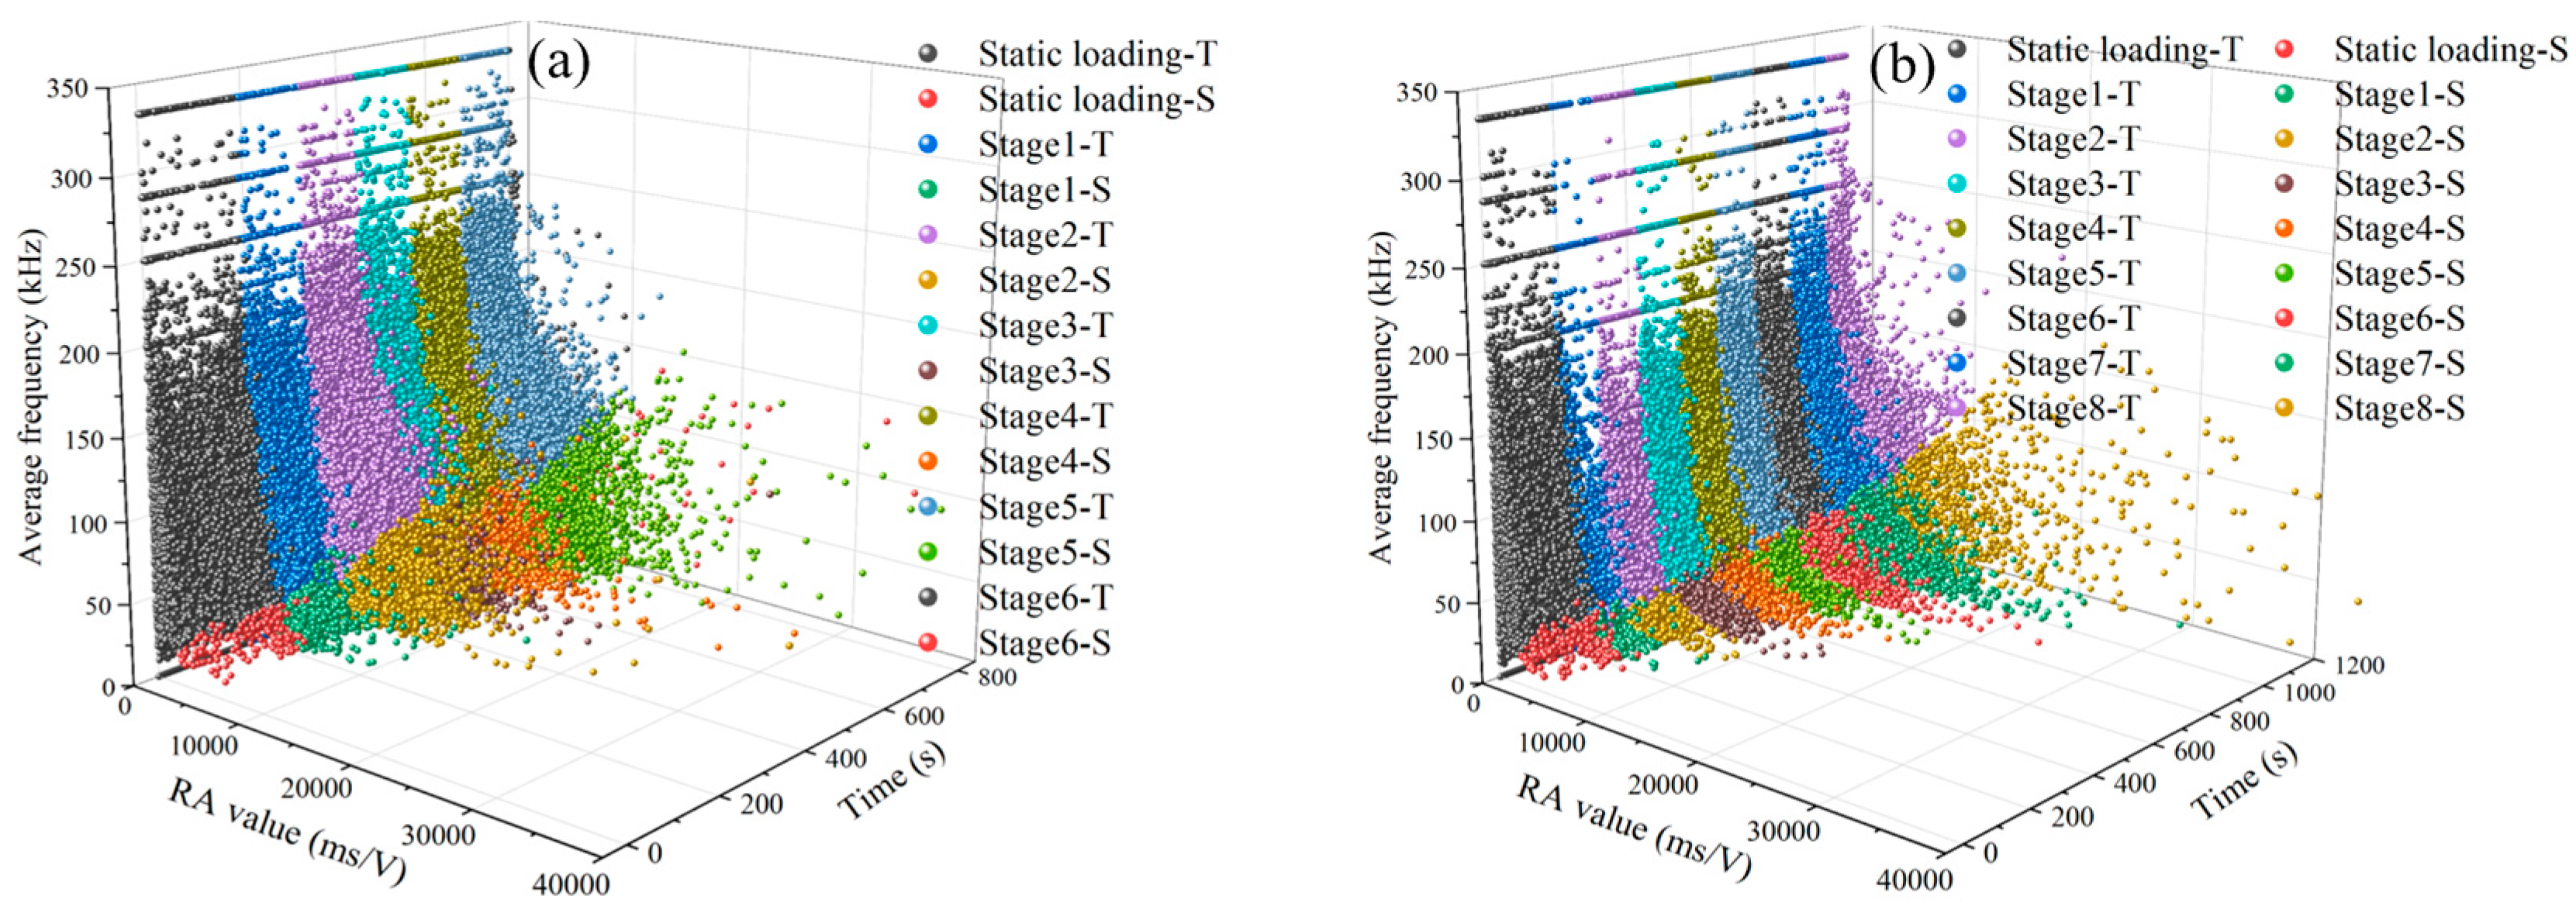
3.3.2. AE Spectrum Frequency Characteristics

It is widely agreed that rock and concrete materials generate large amounts of AE signals during plastic deformation, crack expansion, and coalescence. The discrete time-domain signals of AE signal waveforms were converted into continuous frequency-domain signals by the fast Fourier transform algorithm, so as to obtain the spectrum frequency characteristics of AE signals. Different AE signal sources generate different frequencies and amplitudes with various waveform characteristics [30]. Therefore, the spectrum frequency information reflects the fatigue fracture evolution of rock materials. Previous literature has stated [31] that the AE peak frequency is more sensitive than parameters such as AE ring counts/energy, making it a particularly useful parameter for studying the influence of CTR on RBCS sample damage and fractures. It is meaningful to study the effect of CTR on the damage and fracture of RBCS samples.
The density diagram of the AE peak frequency distribution of RBCS samples with different CTRs subjected to multi-level cyclic loading is shown in Figure 13. The AE peak frequency range was predominantly concentrated in 0–350 kHz. Combined with the frequency distribution characteristics, the AE peak frequency can be divided into three frequency bands: the low-frequency band from 0 to 125 kHz, the middle-frequency band from 125 to 230 kHz, and the high-frequency band from 230 to 350 kHz. The sample predominantly generated low-frequency and middle-frequency AE signals throughout the cyclic loading process. At the beginning of the CLS, the distribution of AE peak frequency points was denser, predominantly producing low-frequency signals. This phenomenon suggests that the increase in stress amplitude caused significant micro-rupture within the RBCS samples. Furthermore, the distribution of AE peak frequency points was denser at the beginning of the CLS, becoming sparser within the CLS. When fatigue failure occurred in the sample, the middle and low frequency signals abruptly increased, and relatively obvious high-frequency signals were detected. It was demonstrated that the microfracture inside the sample coalesced and connected to form a macroscopic fracture. Therefore, a significant increase in the peak frequency band of the AE signal serves as precursor information for predicting fatigue instability fractures in samples [32]. The samples with CTRs of 1:4 and 1:8 exhibited relatively obvious high-frequency signals, and the AE peak frequency densities across all frequency bands were higher. However, the samples with CTRs of 1:10 and 1:12 generated fewer high-frequency signals until the fatigue stage was approached. The results indicated that higher energy was released when the samples reached critical fatigue failure. Previous reports have indicated that AE frequency is inversely related to crack size [33,34]. That is, large-scale cracks correspond to low-frequency AE signals, while small-scale cracks correspond to high-frequency AE signals. All samples had both low-frequency and high-frequency bands’ AE signals approaching fatigue failure. This indicated that the process of fatigue fracture and instability involved microcrack initiation, propagation, and coalescence into main cracks.

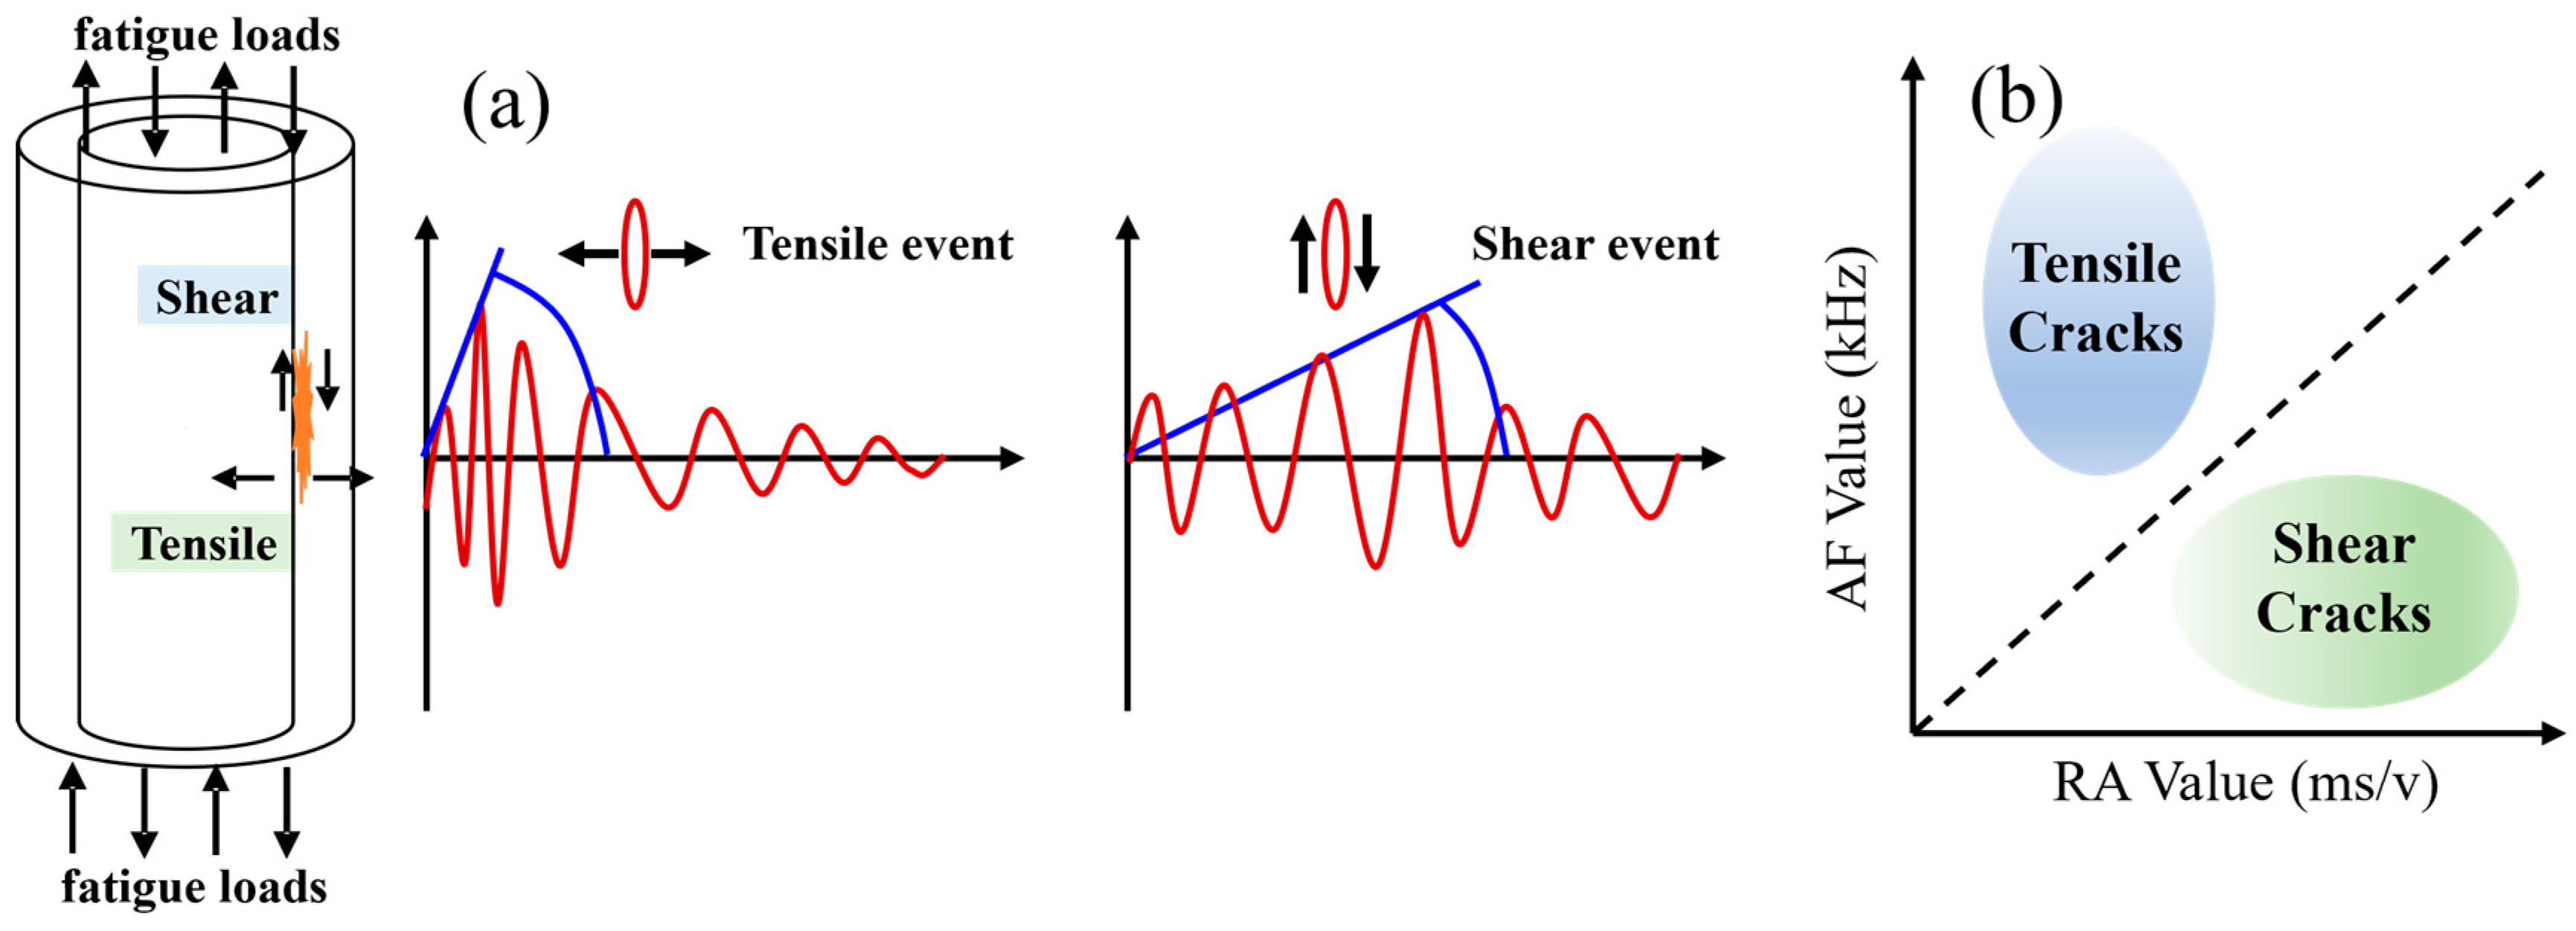
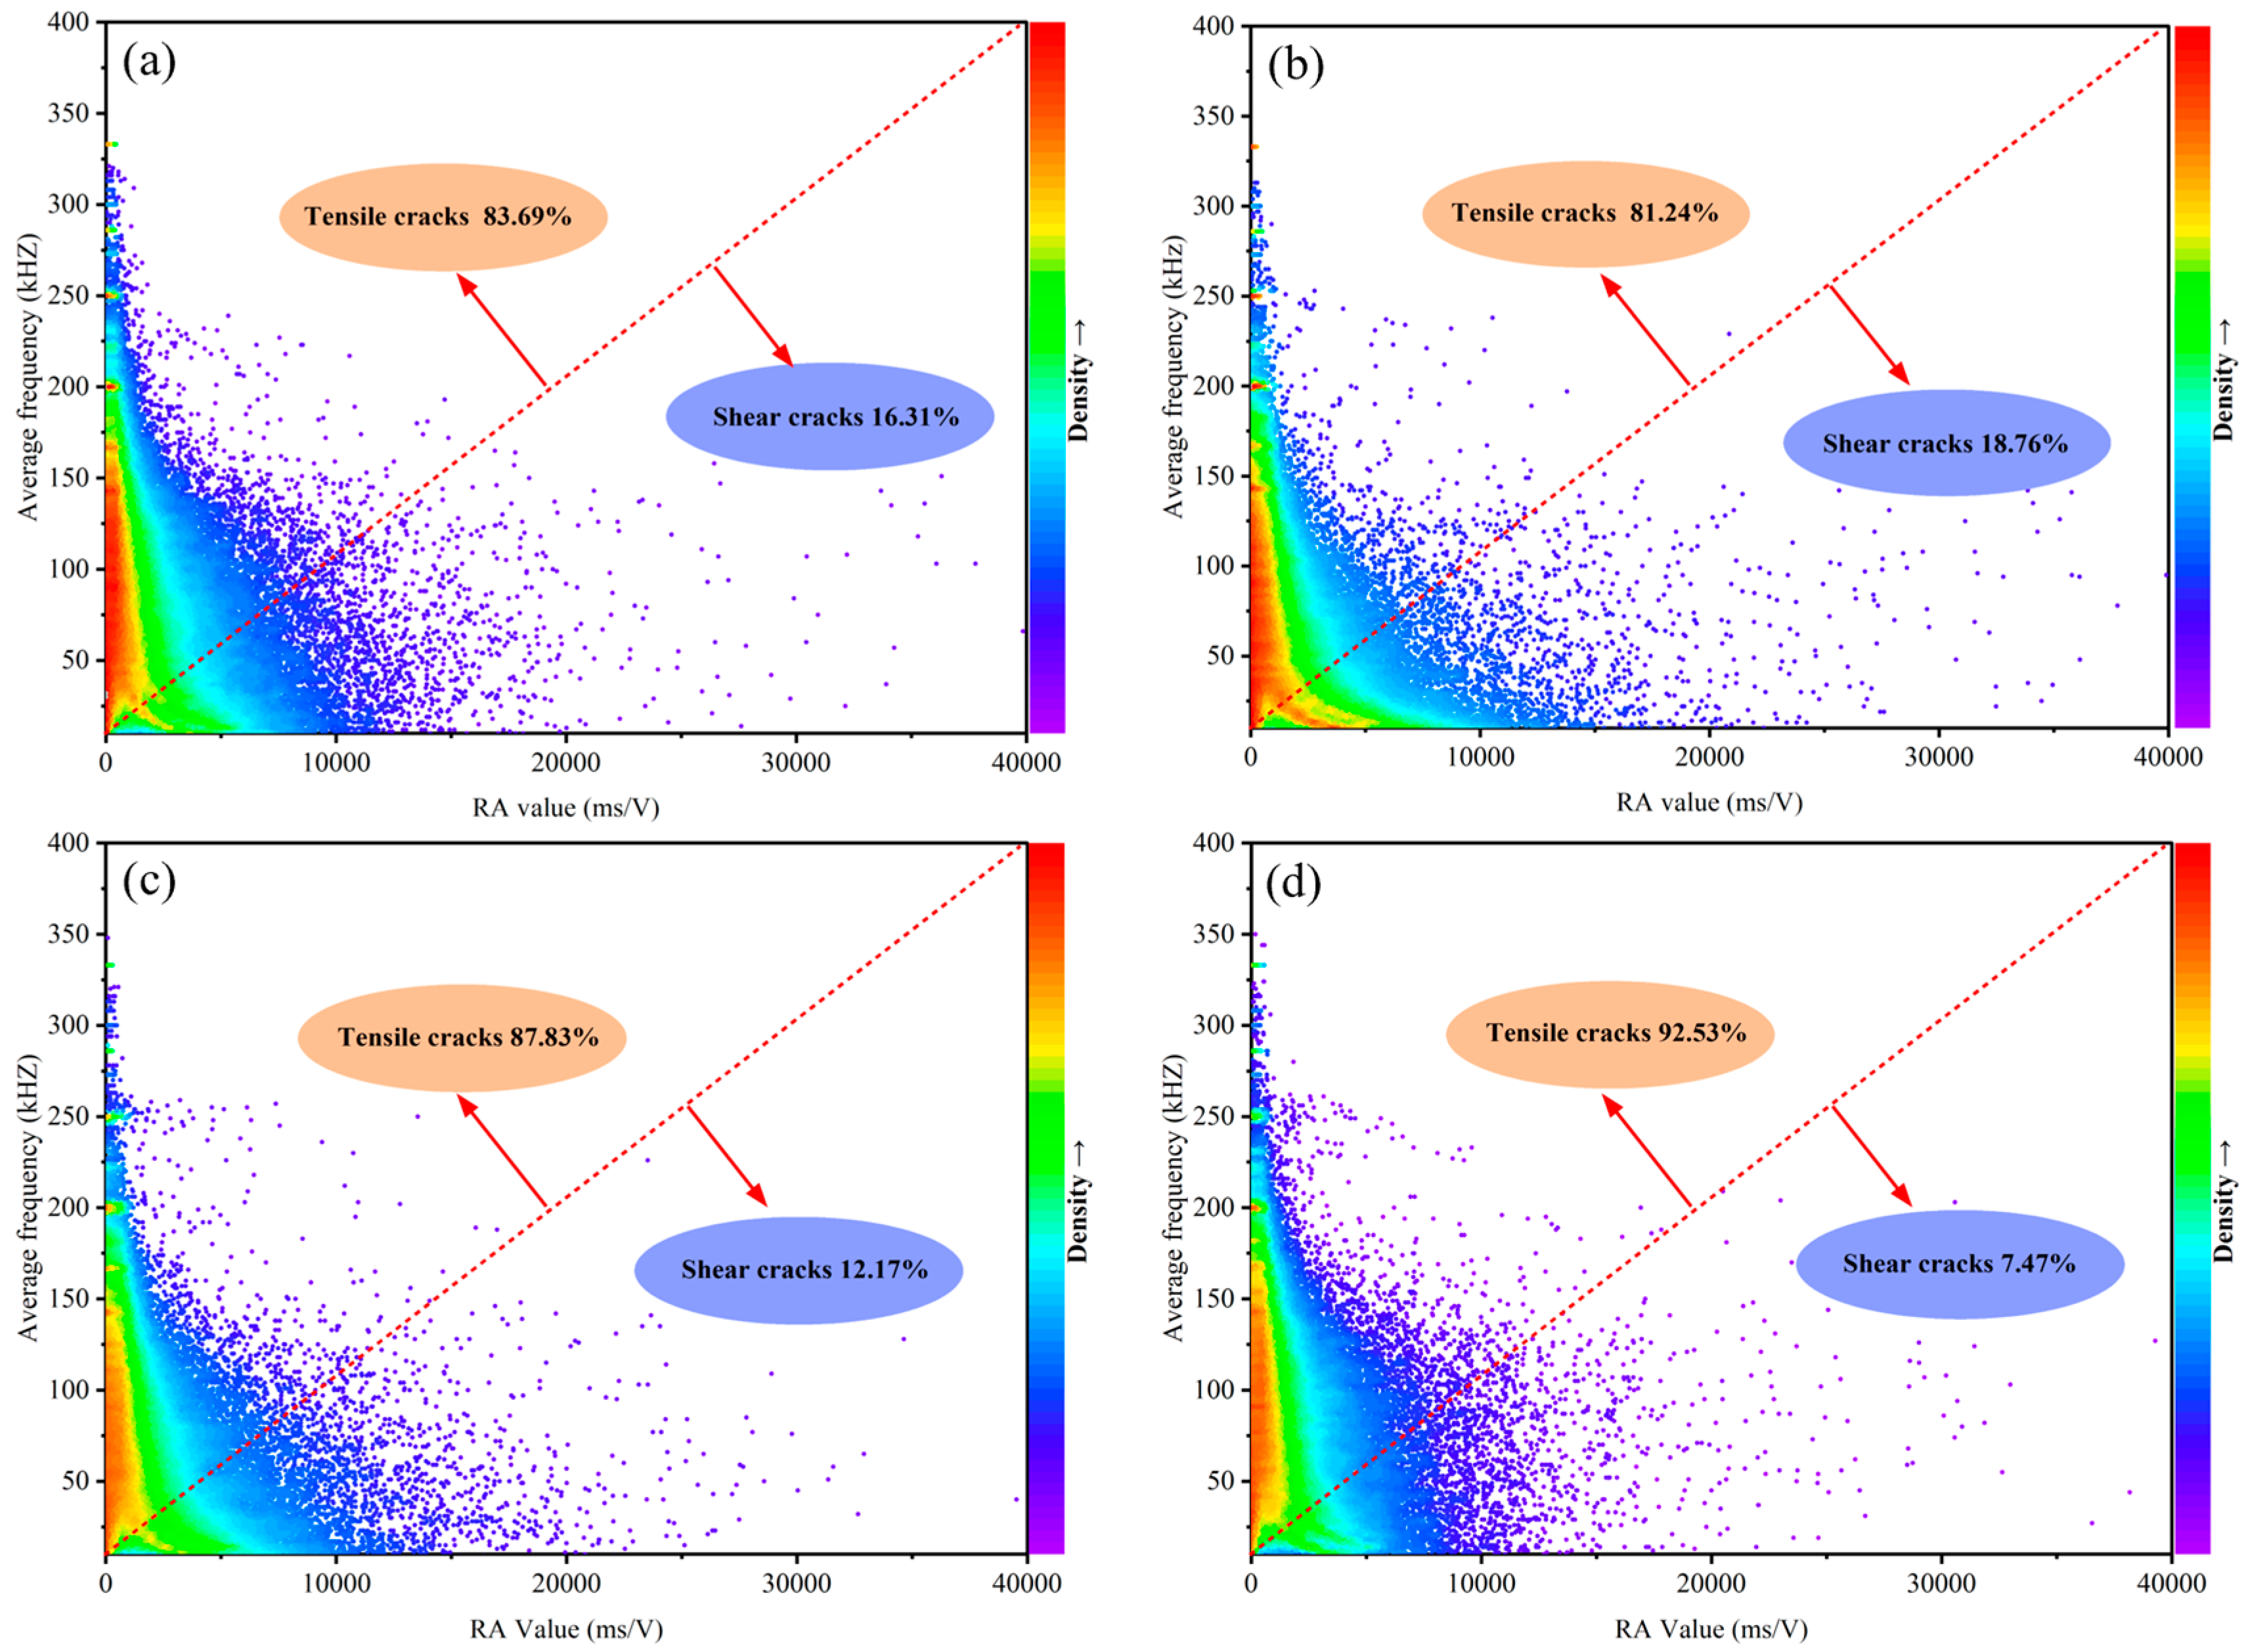
3.3.3. Crack Classification Analysis

The AE parameters of average frequency (AF) and rise angle (RA) are commonly used to distinguish the crack types [35,36]. The formulas for these parameters are as follows:
AF = RC D
AF = RC D
where RC is ring counts, D is duration, RT is rise time, and A is amplitude.
Extensive research has demonstrated that materials like rock and concrete exhibit high RA values and low AF values in shear fractures, whereas tensile fractures are characterized by low RA values and high AF values [37,38]. Differences in the AE waveforms for these fracture patterns are illustrated in Figure 14a. Additionally, Figure 14b displays the correlation between the RA and AF values. The crack types were classified into tensile and shear cracks by an inclined straight line whose gradient varies with the testing material. This section attempted to select the ratio of RA to AF values as 100:1 to reveal the effect of CTR on the fracture mechanism of RBCS samples. The classification of tensile and shear cracks was determined by analyzing the distribution density of the RA and AF datasets using a random data probability density function.
The AE signal distributions for tensile and shear cracking of RBCS samples with different CTRs are shown in Figure 15. The maximum density in the red region indicated the highest data concentration, while the purple region exhibited the minimum density, indicating the lowest data concentration. The transition from the red to the purple region signified a decrease in density distribution, enabling visual analysis of the variation in the number of AE crack signals. The AE signals of the RBCS samples were mainly concentrated in the region of the Y-axis, with fewer in the region of the X-axis. Therefore, tensile failure mainly occurred in the RBCS samples, accompanied by some shear-slip failures. The proportion of the two types of cracks in RBCS samples with different CTRs was quantitatively obtained through statistical analysis. The results demonstrated that the proportion of tensile cracking signals during fatigue deformation exceeded 80% for all samples, with fewer shear cracking signals. However, the distribution pattern of the RA and AF values was affected by the CTR. The percentage of tensile cracks was 83.69%, 81.24%, 87.83%, and 92.53% for the sample with CTR of 1:4, 1:8, 1:10, and 1:12, respectively, while that of shear cracks was 16.31%, 18.76%, 12.17%, and 7.47%, respectively. Notably, as the CTR ratio decreased, the number of tensile cracks initially decreased and then increased, while the opposite pattern was observed for shear cracks. The largest percentage of shear cracks was observed in the sample with a CTR of 1:8, while that of the 1:12 CTR was the smallest. This was attributed to the RBCS sample with a CTR of 1:8 having a better elastic match and higher resistance to external loading, producing more shear cracks at failure. However, the elastic modulus of the backfill decreased sharply when the CTR was 1:12, resulting in the weakest ability of the backfill to restrict the collapse of the surrounding rock. Moreover, the bonding force between the surrounding rock and backfill decreased sharply under fatigue loading, which promoted the elastic mismatch effect, making tensile failure more likely in the RBCS samples.
Using the above crack signal classification method, the fracture events at each CLS were investigated. The classification of progressive cracking signals of RBCS samples with different CTRs subjected to fatigue loading is shown in Figure 16. The progressive fracture process was affected by CTR. Tensile cracking was dominant in the CLS before fatigue failure. In the final CLS, numerous shear cracking signals appeared. This indicated that the fatigue fracture of the RBCS samples developed from tensile cracking to tensile-shear cracking, eventually forming a macrocrack. A similar crack propagation phenomenon was observed in intact rock and concrete materials. For the sample with a CTR of 1:4, a significant number of shear cracking signals appeared in the 2nd CLS, and the combined strain characterization suggested that shear cracking occurred in the internal backfill. For other CTR samples, the shear cracking signals gradually increased, and all of them produced obvious shear cracking signals at the final CLS.

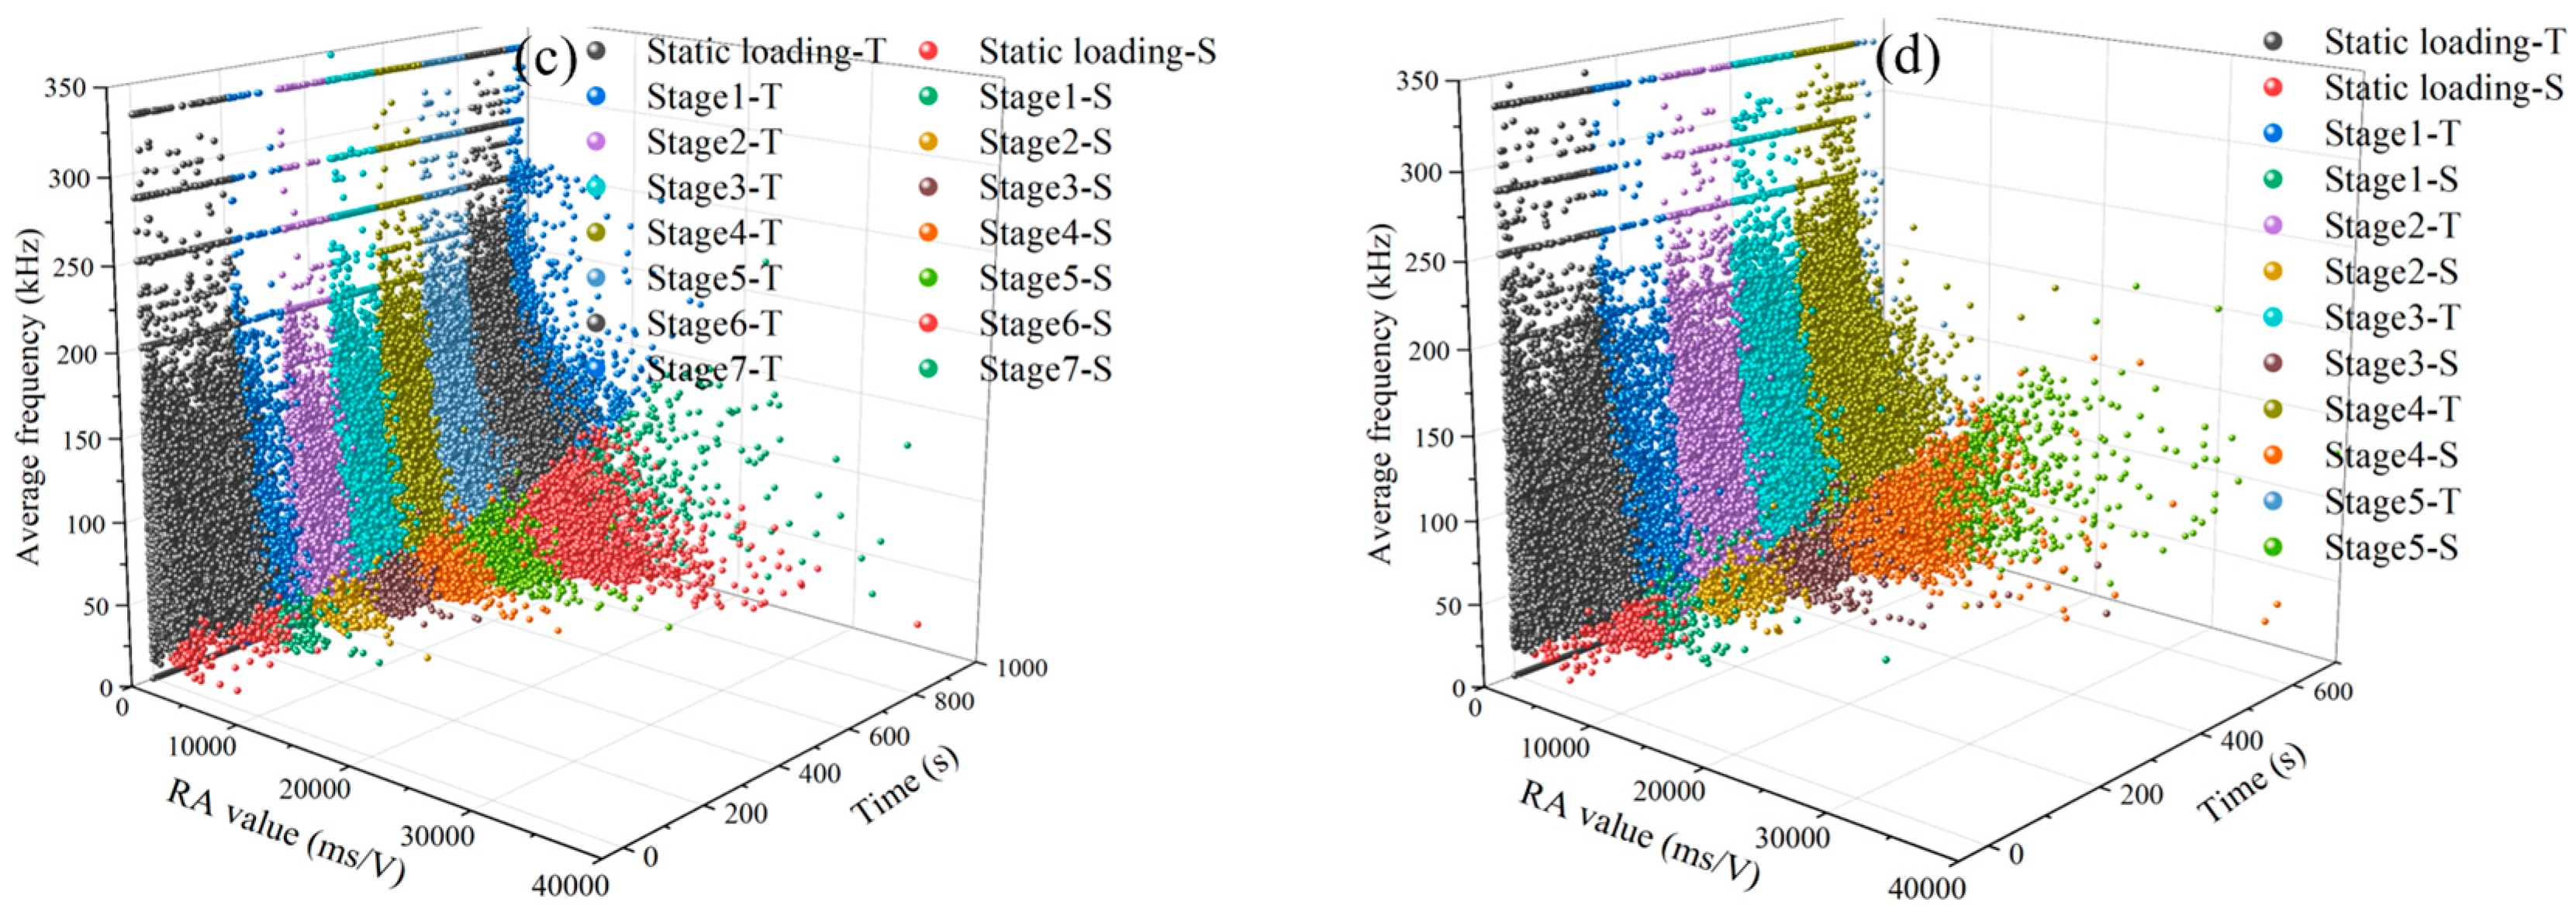
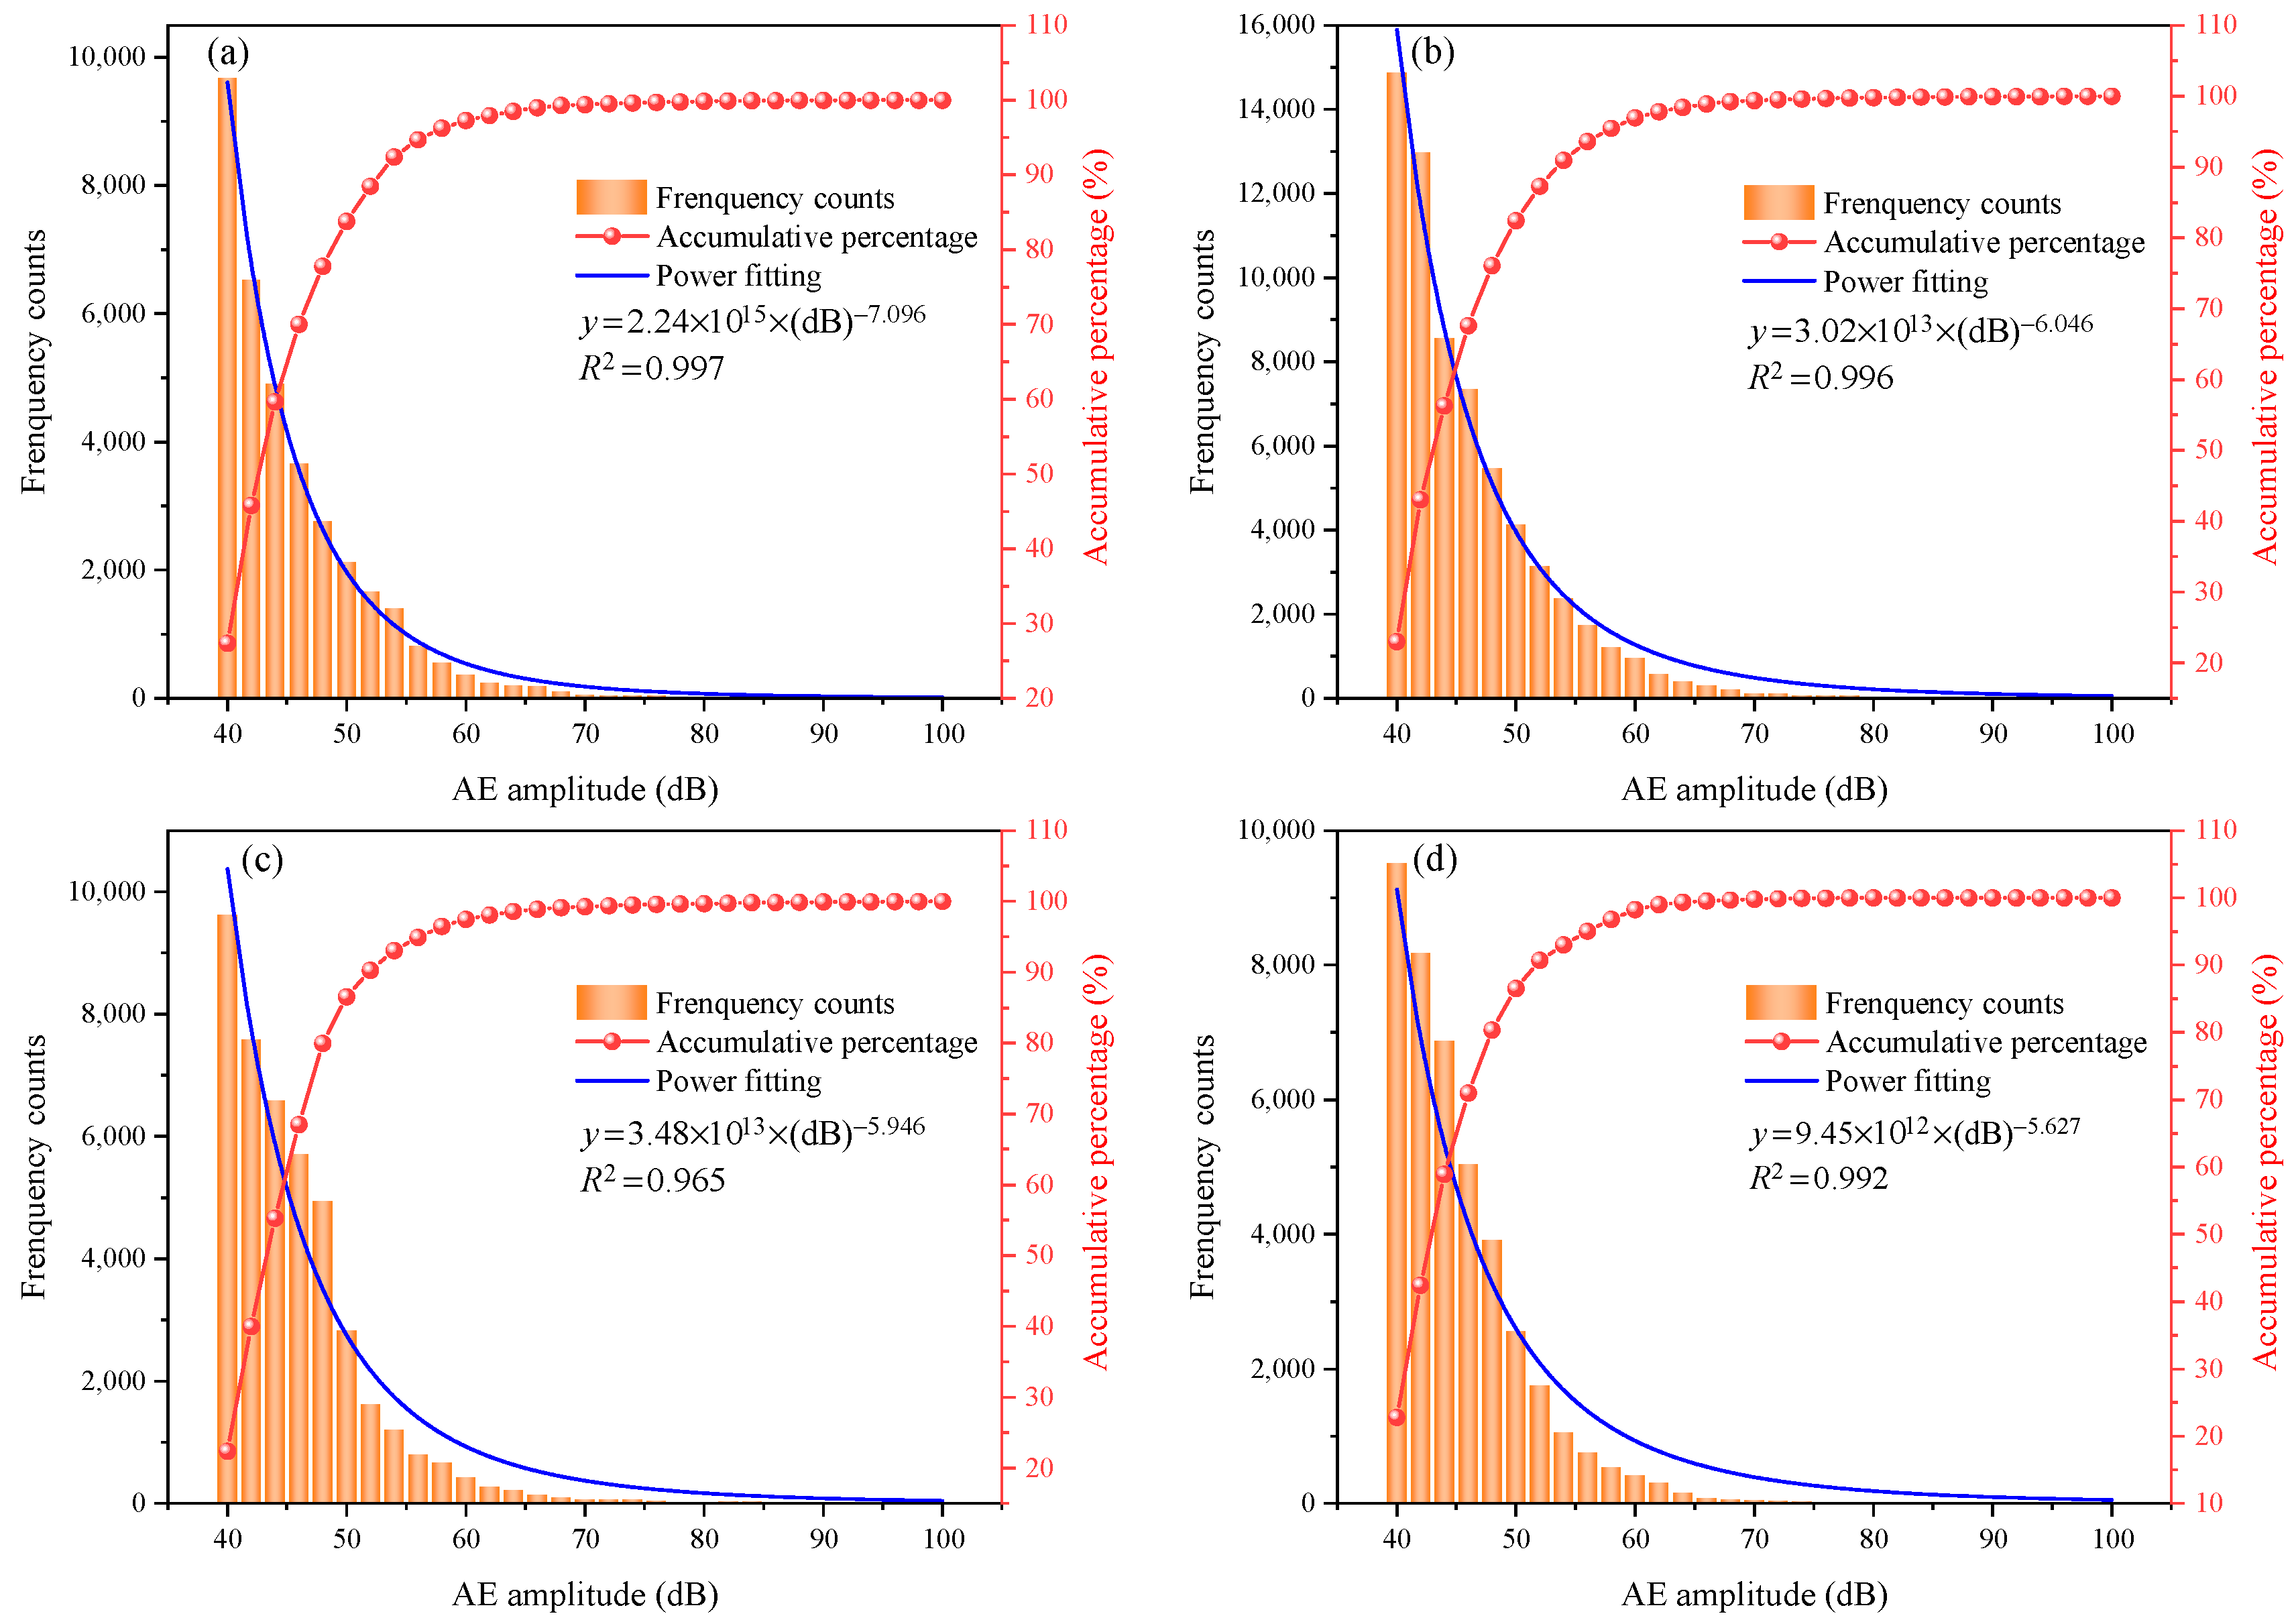
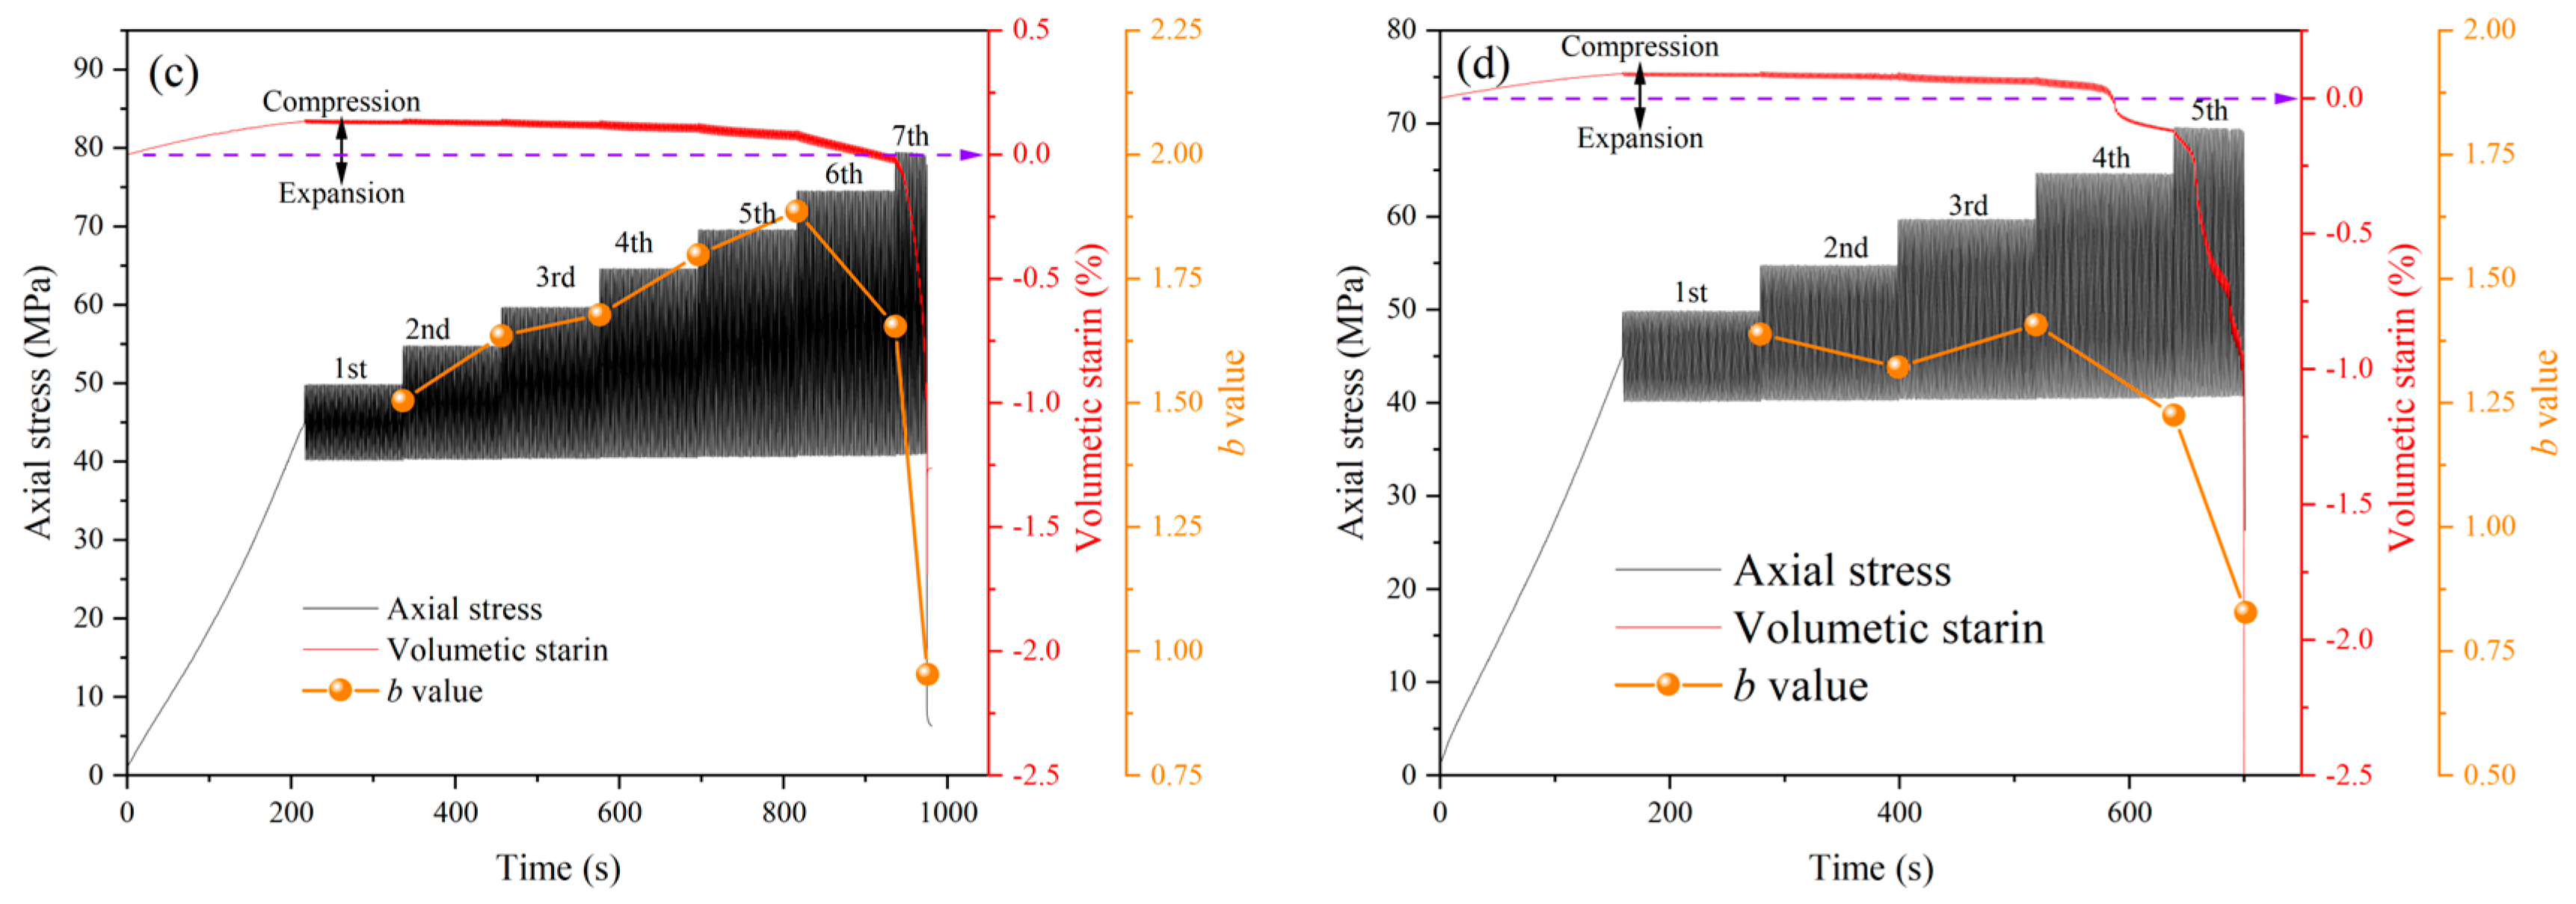
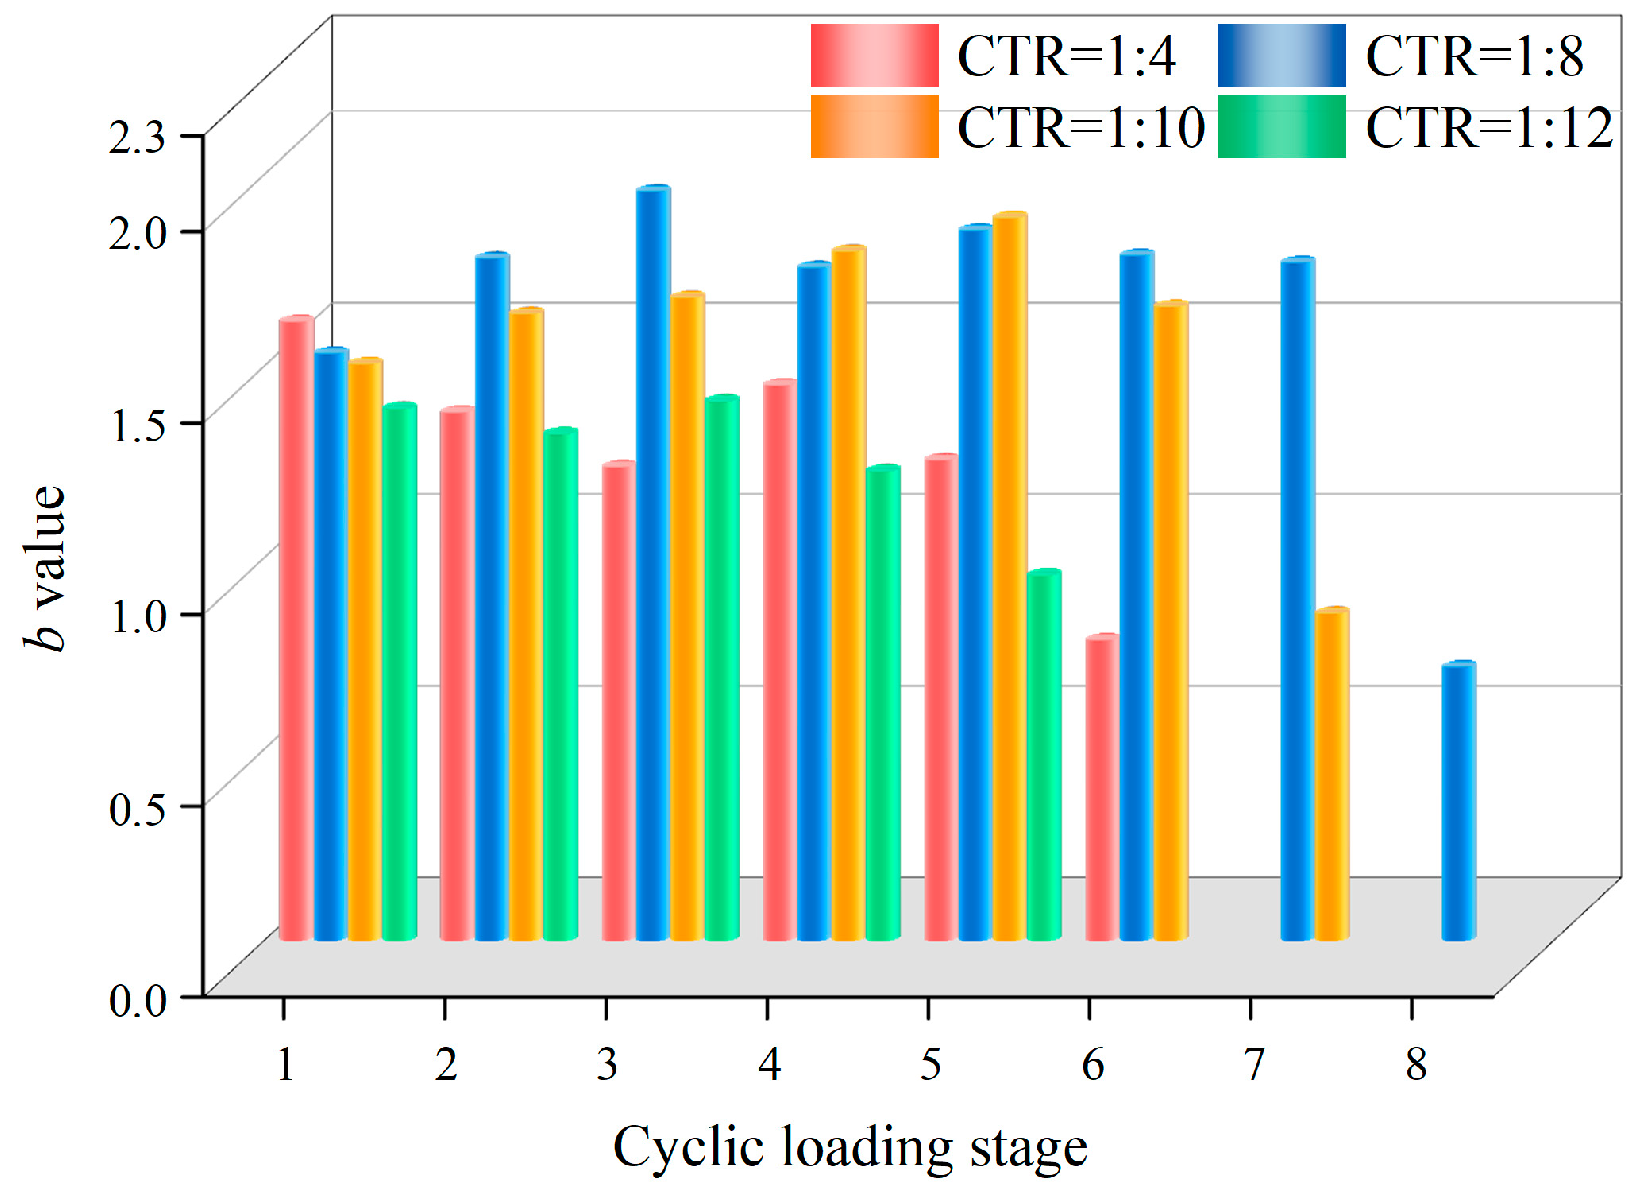
3.3.4. Analysis of AE b Value

The AE amplitude is a crucial parameter in indicating the degree of fracture in rock and concrete materials. Previous studies have shown a correlation between fracture energy and AE amplitude [39,40]. Figure 17 depicts the distribution pattern of the AE amplitude of RBCS samples with different CTRs during fatigue loading. The AE amplitude was concentrated in the range of 40–50 dB. The AE frequency counts decreased as the AE amplitude increased, showing a nonlinear decreasing power function relationship. When the CTRs were 1:4, 1:8, 1:10, and 1:12, the cumulative percentages corresponding to high AE amplitude (i.e., greater than 50 dB) were 16.2%, 17.6%, 13.5%, and 12.6%, respectively. As the CTR decreased, the high AE amplitude showed a trend of increasing and then decreasing. The cumulative frequency curves indicated that the proportion of high AE amplitude signals was larger for samples with CTRs of 1:4 and 1:8 than for those with CTR of 1:10 and 1:12, suggesting that more energy was released during the fracture.
The AE b value was employed to investigate the instability characteristics of RBCS samples subjected to multi-level cyclic loading in this section. The b value is introduced by the concept of seismology. The fracture of rock and concrete materials is similar to the occurrence mechanism of earthquakes. The AE event during rock deformation and failure is approximated as a seismic activity, giving the b value a corresponding physical meaning. In 1944, Gutenberg and Richter proposed a relationship between earthquake magnitude M and frequency N in their study of seismic activity characteristics [30,41]:
lg N = a b M
where M is the earthquake magnitude; N is the frequency of earthquakes with magnitudes between M + ∆M; a and b are fitting constants, and b is the parameter to characterize the relationship between earthquake magnitude and frequency.
The AE b value as a function of crack scale propagation reflects the variation law of the rock microcrack scale [42,43]. The magnitude was adopted for the conversion, and the relation was as follows:
M = A dB / 20
AdB = 20lgAmax
where AdB and Amax are the maximum amplitudes of the AE event expressed in dB and microvolts, respectively.
The evolution patterns of volumetric strain and b value of RBCS samples with different CTRs during fatigue deformation are shown in Figure 18. Before fatigue failure, the b value of the sample with a CTR of 1:4 exhibited a tendency to decrease and then increase, followed by a rapid decrease at the fatigue failure stage. The b values of samples with other CTRs showed a tendency to increase or fluctuate initially, and then decrease sharply at the fatigue failure stage. This demonstrated that the b value increased when the proportion of AE small events (i.e., small-scale fracture) increased, and decreased when the proportion of large AE events increased. However, the percentage of microfracture scales varies greatly with potential rock failure, causing the b value to rise and fall abruptly [44]. A significant decrease in b value occurred in the sample with a CTR of 1:4 in the second CLS, indicating the occurrence of large crack propagation. The analysis in Section 3.1 suggested that clear cracking had occurred in the backfill. However, the b values of the other CTR samples increased or fluctuated, indicating stable microcrack propagation. The b values of all samples appeared to decrease sharply at failure, indicating that microcracks coalesced to form macrocracks. Figure 18 also reveals the inherent connection between volumetric strain and b value. A sharp decrease in the b value corresponded with a sudden increase in volumetric strain, indicating a synchronous relationship between these two phenomena. The RBCS samples exhibited a strong dilatation phenomenon, resulting in large fractures.
The comparison of the b values of RBCS samples with different CTRs at each CLS is depicted in Figure 19. Before fatigue failure, the b values of the RBCS samples showed an overall fluctuating trend. There were complicated interactions between the surrounding rock and the backfill exposed to fatigue loading, and crack propagation may be hindered in a CLS. During fatigue failure, the rate of decrease in the b value was faster for samples with CTRs of 1:4 and 1:8 than those with CTRs of 1:10 and 1:12. Similarly, the b value after failure was also smaller. This suggests that the crack scale may be larger for samples with CTRs of 1:4 and 1:8 after failure.

3.4. Fracture Patterns

X-ray CT imaging technology non-destructively revealed the effect of CTR on the crack propagation modes of RBCS samples. The pore and crack network visualization images were obtained by a 3D reconstruction method, as shown in Figure 20. The rock and backfill were presented as dark grey and light grey, respectively. Referring to the previous classification of crack scale, macroscopic cracks with an equivalent diameter greater than 1 mm were marked in blue, while fractures of microfracture and mesofracture with diameters less than 1 mm were marked in other colors [45]. The RBCS samples showed a mix of tensile-shear fracture patterns. The shear fracture patterns in the backfill developed from an “x” pattern to a single shear plane as the CTR decreased, i.e., from 1:4 to 1:12. The rock and backfill interface experienced significant tensile fracture, and tensile-shear fracture occurred in the rock. The overall fracture morphology was presented as a ring shape, with the expansion direction generally following the loading direction. Moreover, the crack network complexity was greater for samples with CTRs of 1:4 and 1:8 compared to those with CTRs of 1:10 and 1:12, as shown in Figure 20a. The degree of fracture was further revealed by analyzing the volume and geometrical characteristics of the cracks and micropores. When the CTR was decreased from 1:4 to 1:12, the total crack volume values were 36,100 mm3, 46,400 mm3, 31,900 mm3, and 24,600 mm3, respectively. This trend demonstrated an evolution pattern of initially increasing and then decreasing, with the largest crack volume value observed at a CTR of 1:8. This was consistent with the energy evolution law in Section 3.2, indicating that the sample with a CTR of 1:8 consumed more energy for crack expansion during fatigue deformation. The variation in the 3D fractal dimension of the cracks was consistent with the total crack volume value (Figure 20b), which further indicated that the sample with a CTR of 1:8 had the most complex cracks. Microfractures and mesofractures with diameters less than 1 mm were primarily distributed within the internal backfill. In contrast, external rock fractures mostly formed macroscopic large cracks. Figure 20c shows that the volume of microfracture and mesofracture of RBCS samples were controlled by mesofracture with diameters of 0.2–0.8 mm. This phenomenon was more pronounced for samples with a CTR of less than 1:8.

4. Discussion

The RBCS is crucial for the safe mining of deep resources. It not only bears the load of overlying rock but also withstands the influence of complex disturbance stresses, such as far-field blasting vibration, earthquakes, and drilling. The CTR is a key factor affecting the stability of RBCS. Therefore, it is essential to thoroughly study the effect of CTR on the fracture and instability of RBCS subjected to disturbance stresses. This work investigated the stress-strain response, AE characteristics, and energy dissipation mechanism during fatigue fracture and instability of RBCS samples subjected to multi-level cyclic loading.
Based on the research results above, we found that the fatigue properties, AE activities, energy evolution, and fracture patterns of RBCS samples were greatly influenced by the CTR. It was shown that the fatigue strength and fatigue lifetime of RBCS samples increased and then decreased as the CTR was reduced from 1:4 to 1:12. The better fatigue mechanical behavior of the sample with a CTR of 1:8 was attributed to the better elastic match between the surrounding rock and backfill. As a “flexible material”, backfill absorbs energy during rock fracture, but the energy-absorbing effect is related to the CTR [28]. The best energy-absorbing property of backfill was achieved at a CTR of 1:8. This is evidenced by the fact that the dissipated energy of the sample with a CTR of 1:8 is greater than that of the other samples, as shown in Figure 9c. The AE ring counts/energy apparent skip phenomenon corresponds to the stress-strain curve from a dense to sparse pattern.
The fracture instability process of crack initiation, propagation, and coalescence in RBCS samples is revealed by AE monitoring technology [29]. A relatively quiet period of AE activities is observed within a CLS, and the cumulative AE ring counts/energy curves show a stepwise increase pattern. During the fatigue failure stage, AE activities increased significantly and accompanied by a large release of elastic energy. This phenomenon indicates that the RBCS samples subjected to multi-level cyclic loading exhibit the progressive failure characteristics of crack expansion and the energy release step and step. The phenomenon of a significant increase in the peak frequency band of AE signals serves as precursor information for predicting fatigue instability fractures in samples [32]. Comparing the AE Ring counts/energy and spectrum characteristics (Figure 11, Figure 12 and Figure 13), the RBCS samples with CTRs of 1:4 and 1:8 showed more pronounced AE activities and released more energy at failure than those with CTRs of 1:10 and 1:12. Crack classification methods based on RA and AF data are often applied to rock and concrete materials [46,47]. Using this method, it was observed that tensile cracking occurred predominantly during the fracture of RBCS samples, accompanied by some shear-slip cracking. The shear fracture signal was mainly produced during the final CLS. However, there was an effect of CTR on the proportion of tensile and shear signals. The proportion of shear cracking signals was higher in the fracture process of samples with CTRs of 1:4 and 1:8 than those with CTRs of 1:10 and 1:12. In addition, the AE b value reflects the variation laws of the microcrack scale. The b values were smaller during the fracture of samples with CTRs of 1:4 and 1:8, suggesting that the crack scale may be larger after failure.
The 3D visualization images of the crack network were obtained based on the CT scanning technology, which clearly showed the fracture patterns of RBCS samples. They revealed a mix of tensile-shear fracture patterns, including shear fracture within the backfill, tensile cracking at the interface, and tensile-shear fracture within the rock. This fracture pattern is also confirmed by the crack classification results from the AE signals. The crack volume and 3D fractal dimension showed a tendency to increase and then decrease, with the maximum at a CTR of 1:8. This indicates that the degree of fracture and complexity of this sample are both at their highest, consistent with the analysis of AE characteristics in Section 3.3. It has also been observed that the fracture patterns of the RBCS sample subjected to multi-level cyclic loading were similar to those applied to monotonic loading, but the fracture was more severe [10,13]. Moreover, similar fracture patterns were also observed in concrete encased coal samples [48]. For composite samples with large differences in strength and elastic modulus, the evolution of fracture progresses from the “weak structure” material to the “strong structure” material. Therefore, the evolution of cracks probably involves internal backfill fracturing first, and then the fracture extends to the surrounding rock. The “flexible CTB” with a small CTR is beneficial for controlling the stability of the quarry in engineering practice.

5. Conclusions

In this paper, the fatigue properties, AE characteristics, energy dissipation, and fracture patterns of RBCS samples with different CTRs subjected to cyclic loading were investigated. The following conclusions were drawn from the experimental study:
  • The fatigue mechanical properties, AE characteristics, energy evolution, and fracture patterns of RBCS samples were greatly influenced by the CTR. The fatigue strength and fatigue lifetime of the RBCS samples increased and then decreased as CTR was reduced from 1:4 to 1:12. The total energy, elastic energy, and dissipated energy exhibited a clear stepwise increase pattern, with the maximum values of the energy parameters found in sample with a CTR of 1:8. Moreover, the backfill with a CTR of 1:8 demonstrated the best energy absorption properties and, hence, the best macroscopic mechanical properties of the RBCS samples.
  • The AE characteristics were affected by CTR. The AE ringing counts/energy, spectrum frequency, crack evolution, and AE b value reflected the effect of the CTR on crack propagation in the RBCS samples. The AE ring counts/energy apparent skip phenomenon corresponded to the stress-strain curve transitioning from a dense to a sparse pattern. Notably, the sample with a CTR of 1:4 showed a sudden increase in AE activities during the second CLS, indicating the occurrence of significant damage rupture. During the fatigue fracture stage, AE activities increased significantly, accompanied by a large release of elastic energy. Samples with CTRs of 1:4 and 1:8 showed a more pronounced increase in the AE peak frequency band at failure. The cracking modes were well classified using the RA and AF data classification methods. The proportion of shear cracking signals was higher in the fracture process of samples with CTRs of 1:4 and 1:8 than those with CTRs of 1:10 and 1:12. The b value was similarly smaller at failure, implying that large-scale cracks formed.
  • The fracture patterns of RBCS samples with different CTRs were revealed based on CT scanning technology. The RBCS samples showed a mix of tensile-shear fracture patterns, including shear failure within the backfill, tensile cracking at the interface, and tensile-shear fracture within the rock. It was found that the fracture volume and complexity of samples with CTRs of 1:4 and 1:8 were larger than those CTR of 1:10 and 1:12. The evolution of cracks probably involves internal backfill fracturing first, and then the fracture extends to the surrounding rock. The backfill with a CTR of 1:8 offers the best resistance to hole collapse; therefore, the RBCS is less susceptible to structural deterioration. The “flexible CTB” with small CTR is beneficial for controlling the stability of the quarry in engineering practice.

Author Contributions

Conceptualization, D.L.; methodology, writing—original draft preparation, C.L.; data curation, Y.W. (Yunfeng Wu); formal analysis, Y.H.; funding acquisition, Y.W. (Yu Wang). All authors have read and agreed to the published version of the manuscript.

Funding

This article is funded by the National Natural Science Foundation of China (52174069), the Beijing Natural Science Foundation (8202033), and the Henan Key Laboratory for Green and Efficient Mining & Comprehensive Utilization of Mineral Resources (Henan Polytechnic University) (KCF2203).

Data Availability Statement

The original contributions presented in the study are included in the article; further inquiries can be directed to the corresponding author.

Conflicts of Interest

The authors declare no conflicts of interest.

References

  1. Qi, C.C.; Fourie, A. Cemented paste backfill for mineral tailings management: Review and future perspectives. Miner. Eng. 2019, 144, 106025. [Google Scholar] [CrossRef]
  2. Saedi, A.; Jamshidi-Zanjani, A.; Darban, A.K. A review of additives used in the cemented paste tailings: Environmental aspects and application. J. Environ. Manag. 2021, 289, 112501. [Google Scholar] [CrossRef] [PubMed]
  3. Yang, L.H.; Li, J.C.; Liu, H.B.; Jiao, H.Z.; Yin, S.H.; Chen, X.M.; Yu, Y. Systematic review of mixing technology for recycling waste tailings as cemented paste backfill in mines in China. Int. J. Min. Met. Mater. 2023, 30, 1430–1443. [Google Scholar] [CrossRef]
  4. Wu, J.Y.; Jing, H.W.; Gao, Y.; Meng, Q.B.; Yin, Q.; Du, Y. Effects of carbon nanotube dosage and aggregate size distribution on mechanical property and microstructure of cemented rockfill. Cement Concr. Comp. 2022, 127, 104408. [Google Scholar] [CrossRef]
  5. Wang, X.L.; Silva, M.C.E.; Costa Pereira, M.F.; Brás, H.; Paneiro, G. Strength behavior and deformability characteristics of paste backfill with the addition of recycled rubber. Int. J. Min. Reclam. Environ. 2023, 37, 713–730. [Google Scholar] [CrossRef]
  6. Wang, Y.; Yi, X.F.; Long, D.Y.; Xia, Y.J.; Li, P.; Cai, M.F. Energy-Based Fatigue–Creep Damage and Failure Pattern of Rock–Backfill Composite Structure Material in Mine Stopes Under High Static Stress: Disturbed Amplitude Effect. Rock Mech. Rock Eng. 2024, 57, 3021–3042. [Google Scholar] [CrossRef]
  7. Jafari, M.; Shahsavari, M.; Grabinsky, M. Drained Triaxial Compressive Shear Response of Cemented Paste Backfill (CPB). Rock Mech. Rock Eng. 2021, 54, 3309–3325. [Google Scholar] [CrossRef]
  8. Long, D.Y.; Wang, Y.; Li, C.H.; Wu, Y.F. Macro-meso fatigue fracture and instability of rock-backfill composite structure under increasing-amplitude cyclic loading. Constr. Build. Mater. 2024, 416, 135187. [Google Scholar] [CrossRef]
  9. Wang, J.; Zhang, C.; Song, W.D.; Zhang, Y.F. The Energy Dissipation, AE Characteristics, and Microcrack Evolution of Rock–Backfill Composite Materials (RBCM). Minerals 2022, 12, 482. [Google Scholar] [CrossRef]
  10. Wang, J.; Fu, J.X.; Song, W.D.; Zhang, Y.F. Mechanical properties, damage evolution, and constitutive model of rock-encased backfill under uniaxial compression. Constr. Build. Mater. 2021, 285, 122898. [Google Scholar] [CrossRef]
  11. He, Z.W.; Zhao, K.; Yan, Y.J.; Ning, F.J.; Zhou, Y.; Song, Y.F. Mechanical response and acoustic emission characteristics of cement paste backfill and rock combination. Constr. Build. Mater. 2021, 288, 123119. [Google Scholar] [CrossRef]
  12. Yu, X.; Kemeny, J.; Li, J.L.; Song, W.D.; Tan, Y.Y. 3D Observations of Fracturing in Rock-Backfill Composite Specimens Under Triaxial Loading. Rock Mech. Rock Eng. 2021, 54, 6009–6022. [Google Scholar] [CrossRef]
  13. Yu, X.; Kemeny, J.; Tan, Y.Y.; Song, W.D.; Huang, K. Mechanical properties and fracturing of rock-backfill composite specimens under triaxial compression. Constr. Build. Mater. 2021, 304, 124577. [Google Scholar] [CrossRef]
  14. Koupouli, N.J.F.; Belem, T.; Rivard, P.; Effenguet, H. Direct shear tests on cemented paste backfill–rock wall and cemented paste backfill–backfill interfaces. J. Rock Mech. Geotech. Eng. 2016, 8, 472–479. [Google Scholar] [CrossRef]
  15. Fang, K.; Fall, M. Effects of curing temperature on shear behaviour of cemented paste backfill-rock interface. Int. J. Rock Mech. Min. Sci. 2018, 112, 184–192. [Google Scholar] [CrossRef]
  16. Fang, K.; Fall, M. Shear Behavior of the Interface Between Rock and Cemented Backfill: Effect of Curing Stress, Drainage Condition and Backfilling Rate. Rock Mech. Rock Eng. 2020, 53, 325–336. [Google Scholar] [CrossRef]
  17. Fang, K.; Cui, L.; Fall, M. A coupled chemo-elastic cohesive zone model for backfill-rock interface. Comput. Geotech. 2020, 125, 103666. [Google Scholar] [CrossRef]
  18. Su, G.S.; Hu, L.H.; Feng, X.T.; Yan, L.B.; Zhang, G.L.; Yan, S.Z.; Zhao, B.; Yan, Z.F. True Triaxial Experimental Study of Rockbursts Induced by Ramp and Cyclic Dynamic Disturbances. Rock Mech. Rock Eng. 2018, 51, 1027–1045. [Google Scholar] [CrossRef]
  19. Roberts, L.A.; Buchholz, S.A.; Mellegard, K.D.; Düsterloh, U. Cyclic Loading Effects on the Creep and Dilation of Salt Rock. Rock Mech. Rock Eng. 2015, 48, 2581–2590. [Google Scholar] [CrossRef]
  20. Peng, K.; Zhou, J.; Zou, Q.L.; Song, X. Effect of loading frequency on the deformation behaviours of sandstones subjected to cyclic loads and its underlying mechanism. Int. J. Fatigue 2020, 131, 105349. [Google Scholar] [CrossRef]
  21. Liu, Y.; Dai, F. A review of experimental and theoretical research on the deformation and failure behavior of rocks subjected to cyclic loading. J. Rock Mech. Geotech. Eng. 2021, 13, 1203–1230. [Google Scholar] [CrossRef]
  22. Wang, Y.; Li, C.H.; Han, J.Q. On the effect of stress amplitude on fracture and energy evolution of pre-flawed granite under uniaxial increasing-amplitude fatigue loads. Eng. Fract. Mech. 2020, 240, 107366. [Google Scholar] [CrossRef]
  23. Meng, Q.B.; Zhang, M.W.; Han, L.J.; Pu, H.; Chen, Y.L. Acoustic Emission Characteristics of Red Sandstone Specimens Under Uniaxial Cyclic Loading and Unloading Compression. Rock Mech. Rock Eng. 2018, 51, 969–988. [Google Scholar] [CrossRef]
  24. Wang, Y.; Zhu, C.; Song, Z.Y.; Gong, S.H. Macro-meso failure characteristics of circular cavity-contained granite under unconventional cyclic loads: A lab-scale testing. Measurement 2022, 188, 110608. [Google Scholar] [CrossRef]
  25. Wang, Y.; Yi, X.F.; Long, D.Y.; Li, P.; Cai, M.F. Macro-meso fracture and instability of rock-backfill composite structure (RBCS) specimens subjected to fatigue-creep interaction loading: Cement-tailing ratio effect. Constr. Build. Mater. 2024, 420, 135615. [Google Scholar] [CrossRef]
  26. Solecki, R.; Conant, R.J. Advanced Mechanics of Materials; Oxford University Press: Oxford, UK, 2003. [Google Scholar]
  27. Wang, Y.; Gao, S.H.; Li, C.H.; Han, J.Q. Energy dissipation and damage evolution for dynamic fracture of marble subjected to freeze-thaw and multiple level compressive fatigue loading. Int. J. Fatigue 2021, 142, 105927. [Google Scholar] [CrossRef]
  28. Sun, W.; Zhang, S.Y.; Li, J.X.; Li, Z.Y. Experimental study on energy dissipation of layered backfill under impact load. Constr. Build. Mater. 2022, 347, 128478. [Google Scholar] [CrossRef]
  29. Rippengill, S.; Worden, K.; Holford, K.M.; Pullin, R. Automatic Classification of Acoustic Emission Patterns. Strain 2003, 39, 31–41. [Google Scholar] [CrossRef]
  30. Ohnaka, M.; Mogi, K. Frequency characteristics of acoustic emission in rocks under uniaxial compression and its relation to the fracturing process to failure. J. Geophys. Res.-Solid Earth 1982, 87, 3873–3884. [Google Scholar] [CrossRef]
  31. Wang, Y.; Feng, W.K.; Wang, H.J.; Li, C.H.; Hou, Z.Q. Rock bridge fracturing characteristics in granite induced by freeze-thaw and uniaxial deformation revealed by AE monitoring and post-test CT scanning. Cold Reg. Sci. Tech. 2020, 177, 103115. [Google Scholar] [CrossRef]
  32. Ji, H.G.; Lu, X. Characteristics of acoustic emission and rock fractureprecursors of granite under conventional triaxial compression. Chin. J. Rock Mech. Eng. 2015, 34, 694–702. (In Chinese) [Google Scholar]
  33. Cai, M.; Kaiser, P.K.; Morioka, H.; Minami, M.; Maejima, T.; Tasaka, Y.; Kurose, H. FLAC/PFC coupled numerical simulation of AE in large-scale underground excavations. Int. J. Rock Mech. Min. Sci. 2007, 44, 550–564. [Google Scholar] [CrossRef]
  34. Zhao, X.G.; Wang, J.; Cai, M.; Cheng, C.; Ma, L.K.; Su, R.; Zhao, F.; Li, D.J. Influence of Unloading Rate on the Strainburst Characteristics of Beishan Granite Under True-Triaxial Unloading Conditions. Rock Mech. Rock Eng. 2014, 47, 467–483. [Google Scholar] [CrossRef]
  35. Zhang, H.E.; He, B.; Zhu, X.P.; Wang, Q.Y.; Jiang, Z.W. The use of AE technique for identifying ductility degradation against cryogenic on flexural performance of UHPC at various temperature conditions. Cement. Concrete Comp. 2023, 137, 104904. [Google Scholar] [CrossRef]
  36. Prem, P.R.; Murthy, A.R. Acoustic emission monitoring of reinforced concrete beams subjected to four-point-bending. Appl. Acoust. 2017, 117, 28–38. [Google Scholar] [CrossRef]
  37. Rodríguez, P.; Celestino, T.B. Application of acoustic emission monitoring and signal analysis to the qualitative and quantitative characterization of the fracturing process in rocks. Eng. Fract. Mech. 2019, 210, 54–69. [Google Scholar] [CrossRef]
  38. Carpinteri, A.; Corrado, M.; Lacidogna, G. Heterogeneous materials in compression: Correlations between absorbed, released and acoustic emission energies. Eng. Fail. Anal. 2013, 33, 236–250. [Google Scholar] [CrossRef]
  39. Scholz, C.H. Microfracturing and the Inelastic Deformation of Rock in compression. J. Geophys. 1968, 4, 1417–1432. [Google Scholar] [CrossRef]
  40. Yang, J.; Mu, Z.L.; Yang, S.Q. Experimental study of acoustic emission multi-parameter information characterizing rock crack development. Eng. Fract. Mech. 2020, 232, 107045. [Google Scholar] [CrossRef]
  41. Dresen, G.; Kwiatek, G.; Goebel, T.; Ben-Zion, Y. Seismic and Aseismic Preparatory Processes Before Large Stick—Slip Failure. Pure Appl. Geophys. 2020, 177, 5741–5760. [Google Scholar] [CrossRef]
  42. Zhang, L.M.; Ma, S.Q.; Ren, M.Y.; Jiang, S.Q.; Wang, Z.Q.; Wang, J.L. Acoustic emission frequency and b value characteristics in rock failure process under various confining pressures. Chin. J. Rock Mech. Eng. 2015, 34, 2057–2063. (In Chinese) [Google Scholar]
  43. Li, Y.H.; Liu, J.P.; Zhao, X.D.; Yang, Y.J. Study on b-value and fractal dimension of acoustic emission during rock failure process. Chin. J. Rock Mech. Eng. 2009, 30, 2559–2563, 2574. (In Chinese) [Google Scholar]
  44. Chen, B.R.; Wei, F.B.; Wang, R.; Li, T.; Zhu, X.H.; Wang, X. Failure mechanisms and precursory characteristics of deep buried granite in a tunnel in Southwest China. Chin. J. Rock Mech. Eng. 2020, 39, 469–479. (In Chinese) [Google Scholar]
  45. Yang, P.J.; Miao, S.J.; Ma, Y.T.; Yu, W.X.; Shang, X.F. Multi-dimensional non-uniform deformation and failure of siltstone determined using acoustic, 3D-digital image correlation, and computed tomography. Theor. Appl. Fract. Mech. 2023, 125, 103800. [Google Scholar]
  46. Ohno, K.; Ohtsu, M. Crack classification in concrete based on acoustic emission. Constr. Build. Mater. 2010, 24, 2339–2346. [Google Scholar] [CrossRef]
  47. Zhang, H.G.; He, B.; Chen, W.; Ai, J.H.; Zhu, X.P.; Jiang, Z.W. Investigating the influence of fibre type and content on the toughness and ductility of geopolymer mortar with acoustic emission technology. Cement Concr. Comp. 2024, 147, 105434. [Google Scholar] [CrossRef]
  48. Wang, X.L.; Li, Z.F.; Guo, J.P.; Lu, C.W.; Jiang, H.Q.; Mei, J.W. Experimental and numerical investigations on damage mechanical behaviors of surrounding rock-backfill composite under uniaxial compression. Constr. Build. Mater. 2024, 417, 135210. [Google Scholar] [CrossRef]
Figure 1. The rock-backfill composite structure in the underground stope.
Minerals 14 00665 g001
Figure 2. Schematic illustration of the RBCS specimen preparation process.
Minerals 14 00665 g002
Figure 3. The UCS and elastic modulus of RBCS and CTB samples with different CTRs. ((a) RBCS samples; (b) CTB samples).
Minerals 14 00665 g003
Figure 4. Testing equipment. ((a) Mechanical testing device; (b) PIC-2 AE monitoring system; (c) 420 kV industrial CT machine).
Minerals 14 00665 g004
Figure 5. Schematic of the multi-level cyclic loading stress path.
Minerals 14 00665 g005
Figure 6. Schematic calculation of fatigue energy density. ((a) Schematic calculation of strain energy for a single cycle; (b) Schematic calculation of cumulative dissipated energy for multiple cycles).
Minerals 14 00665 g006
Figure 7. Stress-strain curves of RBCS samples with different CTRs. ((a)–(d) The CTR of 1:4, 1:8, 1:10, and 1:12, respectively).
Minerals 14 00665 g007
Figure 8. Evolution of strain energy with number of cycles for RBCS samples with different CTRs. ((a)–(d) The CTR of 1:4, 1:8, 1:10, and 1:12, respectively).
Minerals 14 00665 g008
Figure 9. Energy comparison of RBCS samples with different CTRs. ((a)–(c) Total energy, elastic energy, and dissipated energy, respectively; (d) Strain energy versus different CTR).
Minerals 14 00665 g009
Figure 10. Relationship between strain energy and upper cyclic stress of RBCS samples with different CTRs. ((a)–(c). Total energy, elastic energy, and dissipated energy, respectively).
Minerals 14 00665 g010
Figure 11. The AE ringing count characteristics of RBCS samples with different CTRs subjected to multi-level cyclic loading. ((a)–(d) The CTR of 1:4, 1:8, 1:10, and 1:12, respectively).
Minerals 14 00665 g011
Figure 12. The AE energy characteristics of RBCS samples with different CTR subjected to multi-level cyclic loading. ((a)–(d) The CTR of 1:4, 1:8, 1:10, and 1:12, respectively).
Minerals 14 00665 g012
Figure 13. The AE spectrum frequency characteristics of RBCS samples with different CTRs subjected to multi-level cyclic loading. ((a)–(d) The CTR of 1:4, 1:8, 1:10, and 1:12, respectively).
Minerals 14 00665 g013
Figure 14. Schematic illustration of crack classification. ((a) AE waveforms for different fracture modes; (b) Crack classification method based on RA and AF values).
Minerals 14 00665 g014
Figure 15. Distribution patterns of RA and AF values for RBCS samples with different CTRs ((a)–(d) The CTR of 1:4, 1:8, 1:10, and 1:12, respectively).
Minerals 14 00665 g015
Figure 16. Classification of progressive cracking signals for RBCS samples with different CTRs. ((a)–(d) The CTR of 1:4, 1:8, 1:10, and 1:12, respectively).
Minerals 14 00665 g016aMinerals 14 00665 g016b
Figure 17. Distribution pattern of AE amplitude during fatigue loading of RBCS samples with different CTRs. ((a)–(d) The CTR of 1:4, 1:8, 1:10, and 1:12, respectively).
Minerals 14 00665 g017
Figure 18. Evolution of volumetric strain versus b value during fatigue deformation of RBCS samples with various CTRs. ((a)–(d) The CTR of 1:4, 1:8, 1:10, and 1:12, respectively).
Minerals 14 00665 g018aMinerals 14 00665 g018b
Figure 19. Evolution of AE b values of RBCS samples with different CTRs at each CLS.
Minerals 14 00665 g019
Figure 20. Three-dimensional reconstruction and geometrical characteristics of RBCS samples after failure. ((a) Fracture of different scales; (b) 3D fractal dimension; (c) Fracture volume of microfracture and mesofracture).
Minerals 14 00665 g020
Table 1. Cyclic loading program for the samples with different CTR.
Sample IDCTRσmin/MPaσmaxi/MPa∆σ/MPaNfσcf/MPa
RBCS-11:44050530274.4
RBCS-21:44050531175.2
RBCS-31:44050529874.3
RBCS-41:84050547384.1
RBCS-51:84050545684.7
RBCS-61:84050544884.6
RBCS-71:104050537979.1
RBCS-81:104050540079.4
RBCS-91:104050537179.6
RBCS-101:124050527069.3
RBCS-111:124050525470.4
RBCS-121:124050527569.5
Note: σmin is the lower cyclic load; σmaxi is the first upper cyclic load; Nf is fatigue lifetime. i.e. total cycles; σcf—is fatigue strength.
Disclaimer/Publisher’s Note: The statements, opinions and data contained in all publications are solely those of the individual author(s) and contributor(s) and not of MDPI and/or the editor(s). MDPI and/or the editor(s) disclaim responsibility for any injury to people or property resulting from any ideas, methods, instructions or products referred to in the content.

