Article

Geochemical Study of the Osumi Granodiorite, Southwestern Japan

Department of Applied Chemistry for Environment, School of Biological and Environmental Sciences, Kwansei Gakuin University, 1 Gakuen Uegahara, Sanda 669-1330, Japan
*
Author to whom correspondence should be addressed.
Minerals 2024, 14(7), 680; https://doi.org/10.3390/min14070680
Submission received: 31 March 2024 / Revised: 24 June 2024 / Accepted: 26 June 2024 / Published: 29 June 2024
(This article belongs to the Section Mineral Geochemistry and Geochronology)

Abstract

:
The Osumi Granodiorite, located on the Osumi Peninsula in southwest Japan, is an example of outer zone granites that were formed during a limited period (13–15 Ma) in response to the subduction of the Philippine Sea Plate. This event, which is linked to the separation of southwest Japan from continental Asia, resulted in unique igneous activity. The Osumi Granodiorite is the largest Miocene granite body in the region. It intrudes into the Mesozoic to Paleogene accretionary complex of the Shimanto Belt and affects contact metamorphism. Despite considerable research on the Osumi Granodiorite, limited geochemical studies, especially on trace and rare earth element (REE) analyses, have been conducted. Furthermore, there are insufficient data on the Rb–Sr isotopic system, leaving the formation process unclear. This study presents whole-rock geochemical and Rb-Sr isotopic data to investigate the petrogenesis of the Osumi Granodiorite. The results suggest a common magma origin for this pluton, as indicated by linear trends on the Harker diagrams and similar REE patterns. The presence of a relatively large Eu anomaly implies formation under a reducing environment. The AKF diagram indicates predominant contamination by pelitic rocks of the Shimanto Belt during magma formation. The Rb–Sr whole-rock isochron diagram and SrI–1000/Sr diagram suggest that the Osumi Granodiorite body was formed by heterogeneous assimilation of magma into the Shimanto Belt. Furthermore, the whole-rock isochron age is 64.3 Ma, which differs by approximately 50 My from the previously reported biotite K–Ar age (14–22 Ma). This age is considered to be a pseudo-isochron age, rather than the consolidation age. During the middle Miocene, the compressive stress field in the outer zone south of the Butsuzo Tectonic Line made it difficult for magma to rise. As a result, it reacted with the sedimentary rocks of the Shimanto Belt to various degrees. The Osumi Granodiorite underwent magma differentiation upon intrusion into the Shimanto Belt. It subsequently ascended, cooled, and interacted with pelitic rocks under stable geological conditions.

1. Introduction

The southwestern region of Japan, which extends from the Kanto to Kyushu districts, is geologically divided by the Median Tectonic Line into the inner zone of southwestern Japan on the Sea of Japan side and the outer zone of southwestern Japan on the Pacific side. The outer zone of southwestern Japan, which spans approximately 700 km from the Kii Peninsula to Yakushima Island, is characterized by the widespread distribution of granite rocks dating back to the mid-Miocene period. Most of the granitic rocks in the outer zone of southwestern Japan are associated with volcano-plutonic complex bodies [1]. Studies have been conducted on these granitic rocks from various aspects, e.g., [2,3,4,5,6]. These outer zone granites share a common feature: they all formed within a restricted time frame in the mid-Miocene, with a U–Pb age range of 13–15 Ma [7]. This suggests a concurrent and rapid magmatic event. The genesis of these granites is believed to be associated with two major tectonic events. The first event was the expansion of the Shikoku Basin in the Philippine Plate (26–15 Ma), followed by the initiation of subduction below the Eurasian Plate. The second event was the clockwise rotation of the Sea of Japan, which experienced a hiatus at around 15 Ma [7]. The Osumi Peninsula, located in the southern part of Kyushu, is home to the largest exposed area of granite body in the outer zone of southwestern Japan, which is known as the Osumi Granodiorite. This granodiorite intruded discordantly into the Paleogene to early Miocene accretionary complex of the Shimanto Belt and Nichinan Group and has a belt-like distribution extending northeast to southwest [3]. The isotopic age for this body has been extensively reported using the K–Ar method on biotite, including values such as 21 ± 1 Ma, 14 ± 1 Ma [8], 22 Ma [9], 14.4 ± 0.7 Ma, 14.1 ± 0.5 Ma, 13.9 ± 0.6 Ma, 13.4 ± 0.5 Ma [10], and 14.1 ± 0.4 Ma [11]. Although the Osumi Granodiorite has been the subject of numerous studies, its geochemical analysis has been limited since the research by Nishimura and Yanagi (2000) [3]. Specifically, detailed research on trace elements and rare earth elements (REEs) has been lacking. Furthermore, while the K–Ar age has been extensively reported, studies on the Rb–Sr whole-rock isochron age are limited, leaving uncertainties regarding the formation process. Therefore, this study aims to address these gaps by conducting a comprehensive investigation. This will include analyzing the whole-rock chemical composition and conducting Rb–Sr whole-rock isotopic analysis to gain insight into the genesis of the Osumi Granodiorite.

2. Geological Background and Petrography of the Osumi Granodiorite

The Osumi Peninsula is located in southern part of Kyushu Island, Japan, along the eastern coast of Kagoshima Bay (Kinkou Bay), with the Satsuma Peninsula to its west. The Osumi Granodiorite is widely distributed in this region, covering an area of approximately 400 km2, making it the largest mid-Miocene granite body in the outer zone of southwestern Japan. The Osumi Peninsula is located on the Pacific side where the Philippine Sea Plate subducts beneath the Eurasian Plate, specifically in the Nankai Trough and Ryukyu Trench. In the southeast of the peninsula, the Kyushu–Palau Ridge on the Philippine Sea Plate is subducting. The geological map around the Osumi Granodiorite is shown in Figure 1 [12].
The distribution of granodiorite is belt-like and extends mainly in the northeast–southwest direction. To the west, there are Quaternary pyroclastic deposits and rhyolites, while to the southwest, there are sandstone-mudstone interbeds of the Nichinan Group in the Shimanto Belt. Sedimentary rocks of the Shimanto Belt are the accretionary complex formed during the Paleogene to early Miocene period [3]. The Nichinan Group, which is primarily composed of sandstone and shale, is affected by contact metamorphism due to the intrusion of granite [14]. The Osumi Granodiorite is classified into seven rock types based on grain size, type, and relative amounts of mafic minerals [15]. It shows much lithological variation and consists of fine- to coarse-grained granular to porphyritic granodiorite to granite. The boundary between rock types is gradual [16]. Details of the petrography of the Osumi Granodiorite are described by Oba (1961) [17], Nozawa and Ota (1967) [14], Yamamoto and Oba (1983) [18], Karakida et al. (1992) [16], and Nishimura and Yanagi (2000) [3]. The chemical composition of each rock type exhibits distinct characteristics common to outer zone granites of southwestern Japan, such as higher K2O than Na2O and higher FeO than CaO. Although not a typical zoned pluton, the Osumi Granodiorite body forms a structure in which granodiorite constitutes the marginal part and granite forms the central part. The previously reported K–Ar age for the Osumi Granodiorite ranges from 14 Ma to 22 Ma, which is older and more diverse than other rock bodies in the outer zone of southwestern Japan. Orihashi et al. (2015) [7] measured the U–Pb ages of zircons from 15 granite bodies of mid-Miocene granites in Kyushu, indicating a major activity period for this granite body at 14.6–14.1 Ma. The biotite and whole-rock Rb–Sr age [19] is 12 Ma, while the Rb–Sr whole-rock isochron age is 64 ± 11 Ma [20]. The former is interpreted as the age of cooling and consolidation of the rock body, and the latter to be a pseudo isochron age.
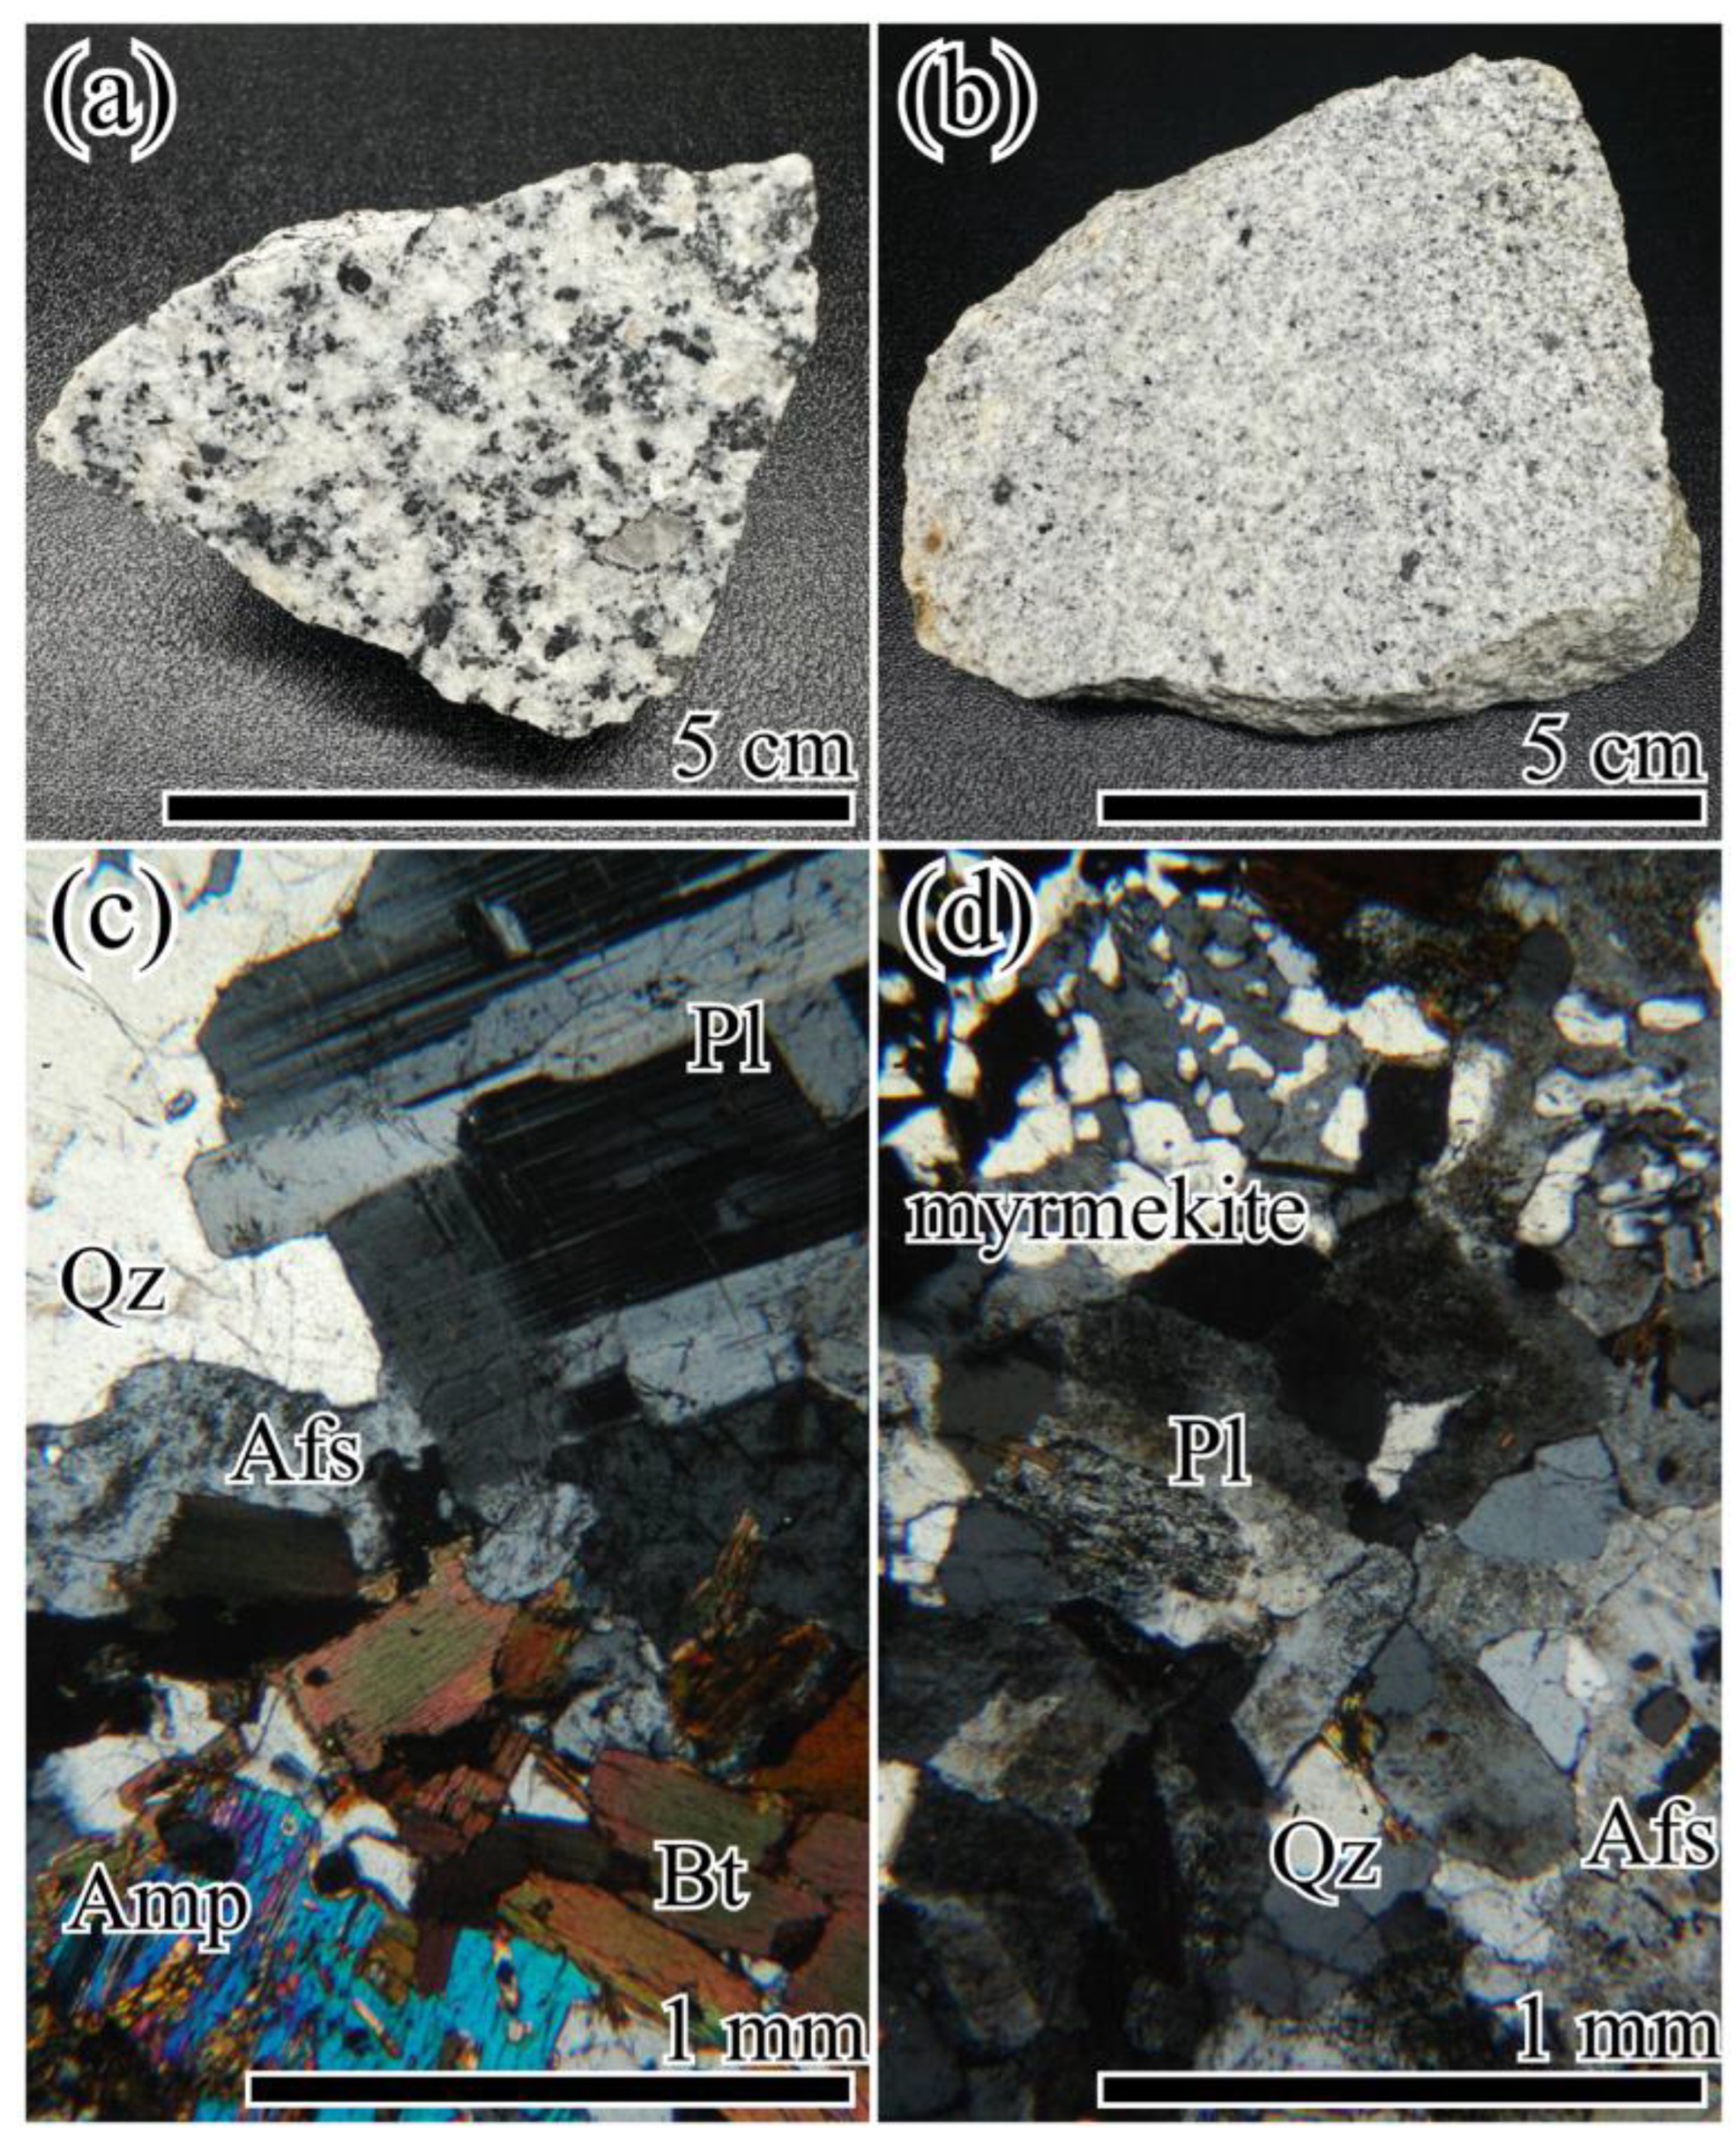
Granodiorite occurs over a 45 km × 30 km area in the southern part of the study area (Figure 1). The granodiorite (OSA26) is mainly composed of plagioclase, quartz, alkali feldspar, biotite, and hornblende; meanwhile, zircon, apatite, and opaque minerals are present as accessory minerals. Plagioclase crystals are euhedral to subhedral, 1.0–2.0 mm long, and show zoned textures with dusty zones and albite twins. Euhedral to subhedral biotite crystals are 0.5–1.5 mm long and often form clusters. Anhedral amphiboles are 0.5–1 mm long and often occur in clusters with biotite. Quartz and alkali feldspar occur as interstitial minerals among the early crystallized minerals (Figure 2a,c).
Granite occurs as a sill or stock within the granodiorite, extending 1.2 km wide (Figure 1). The granite (OSA9A) exhibits a porphyritic texture. The phenocrysts mainly consist of zoned plagioclase, approximately 3 mm in size, and subhedral biotite. The groundmass is composed of plagioclase, quartz, alkali feldspar, and biotite with an average grain size of about 0.5 mm. Zircon, apatite, and opaque minerals are present as accessory minerals. Quartz and alkali feldspar occur as interstitial minerals among the early crystallized minerals. In the granite, myrmekite, which consists of intergrowths of plagioclase and quartz, is characteristically observed (Figure 2b,d).

3. Analytical Methods

3.1. Analysis of Major Elemental Composition and Trace Elemental Composition

Twenty-seven rock samples were collected from the Osumi Peninsula, comprising 24 granodiorite samples and 3 granite samples. The concentrations of 10 major and 15 trace elements were measured by X-ray fluorescence spectrometry (Shimadzu XRF-1800) (Shimadzu Corporation, Kyoto, Japan) with an Rh target using the glass bead method at Kwansei Gakuin University. The rock powder samples and flux (Li2B4O7) were mixed in proportions of 0.7:6.0 g for major elements and 2.0:3.0 g for trace elements and were melted to prepare glass beads. The tube voltage and current were set at 40 kV and 70 mA for major elements and at 40 kV and 95 mA for trace elements, respectively. The analytical method was based on that of Nakazaki et al. (2004) [21].

3.2. Rare Earth Element Composition (REE) Analysis

The concentrations of rare earth elements (REEs) were measured by inductively coupled plasma mass spectrometry (ICP-MS) (Agilent Technologies 7700cx) (Agilent Technologies, Inc., Hachioji, Tokyo, Japan) at Kwansei Gakuin University. The sample for the REE analysis was prepared from the XRF glass beads, a part of which was dissolved with nitric acid. The REEs were separated from the dissolved sample by cation-exchange resin (DOWEX™, 50W×8, 200–400 Mesh (H) Cation Exchange Resin, Thermo Fisher Scientific, Waltham, MA, USA). The analytical method was basically based on those of Koga and Tsuboi (2021) [22] and Kitanaka and Tsuboi (2023) [23].

3.3. Rb-Sr Isotope Analysis

After dissolving a total of 12 rock powder samples in hydrofluoric acid, including 10 samples of granodiorite and 2 sample of granite, cation-exchange resin (DOWEXTM, 50W×8, 200–400 Mesh (H) Cation exchange resin) was applied for Rb–Sr isolation. The Sr fraction was loaded on a single Ta filament. The Sr isotope ratios were measured by thermal ionization mass spectrometry (TIMS, Finnigan MAT262, Thermo Fisher Scientific, Bremen, Germany) at Kwansei Gakuin University. Repeated analyses of NIST SRM 987 during this study yielded 87Sr/86Sr ratios of 0.710245 ± 0.000045 (2SD, n = 5). The concentrations of Rb and Sr were measured by XRF (Shimadzu XRF-1800) at Kwansei Gakuin University, and the 87Rb/86Sr ratio was calculated from these concentration data. The isochron age was calculated using the program IsoplotR 6.2 [24].

4. Result

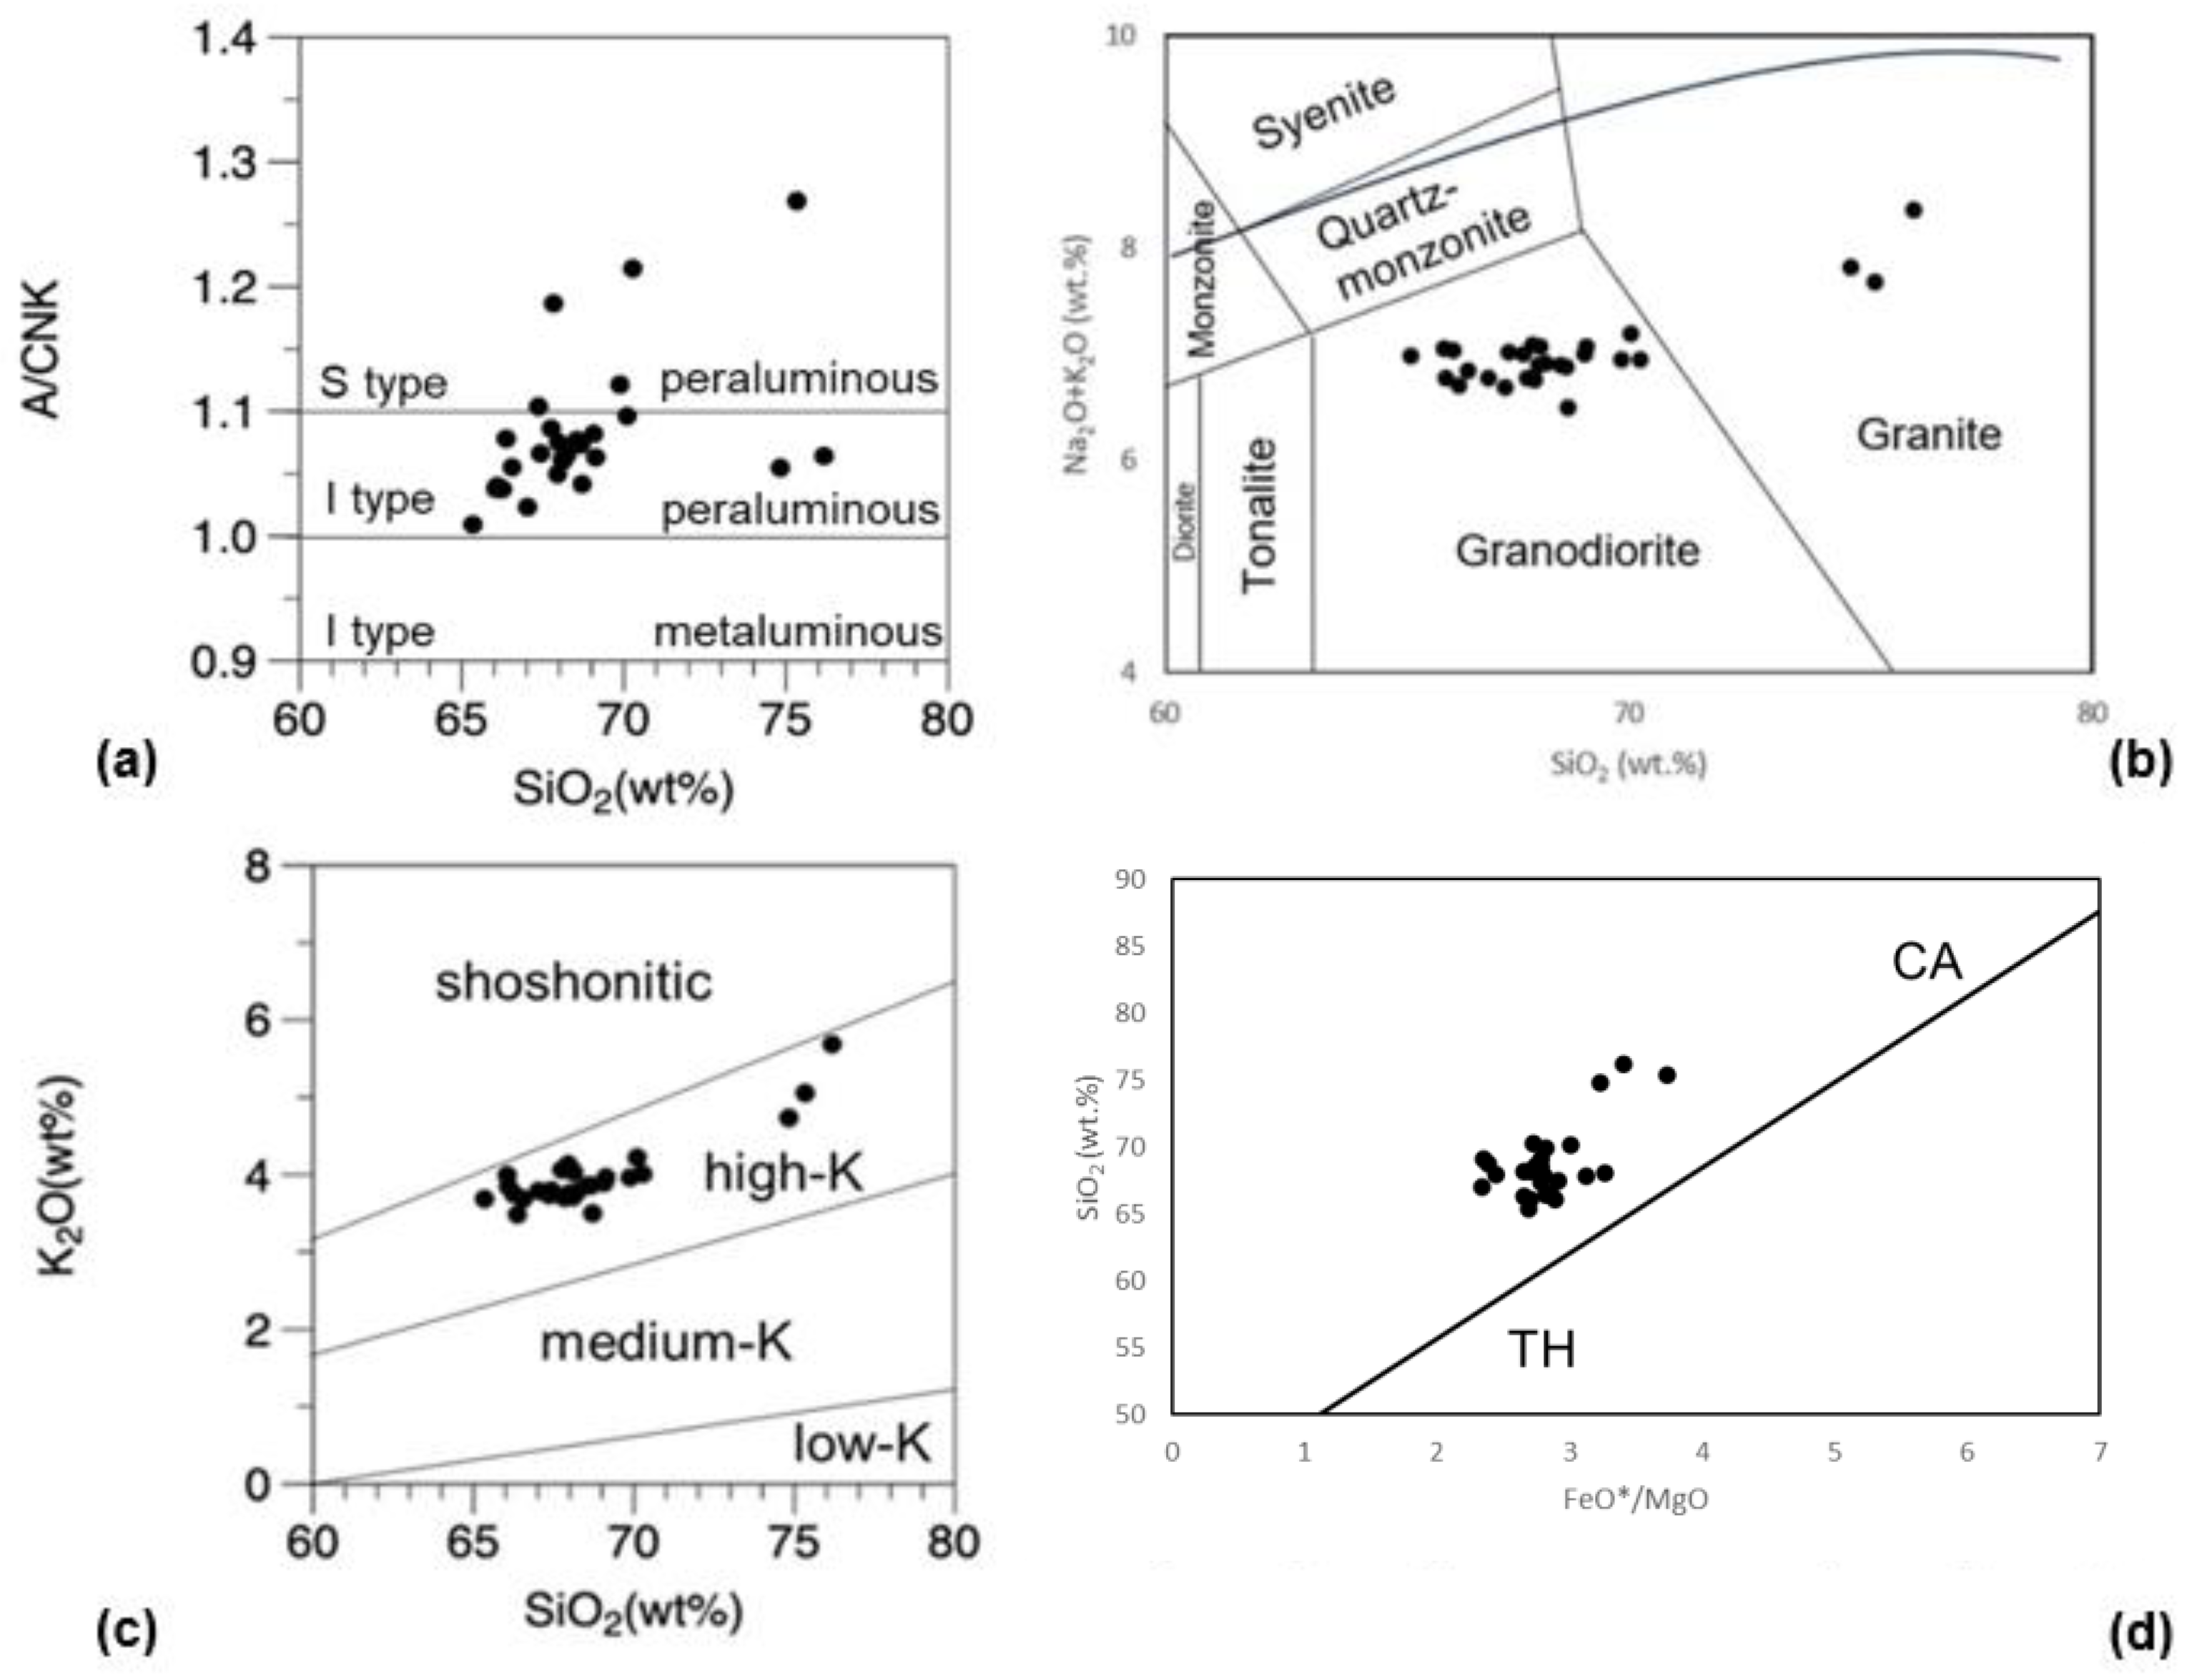
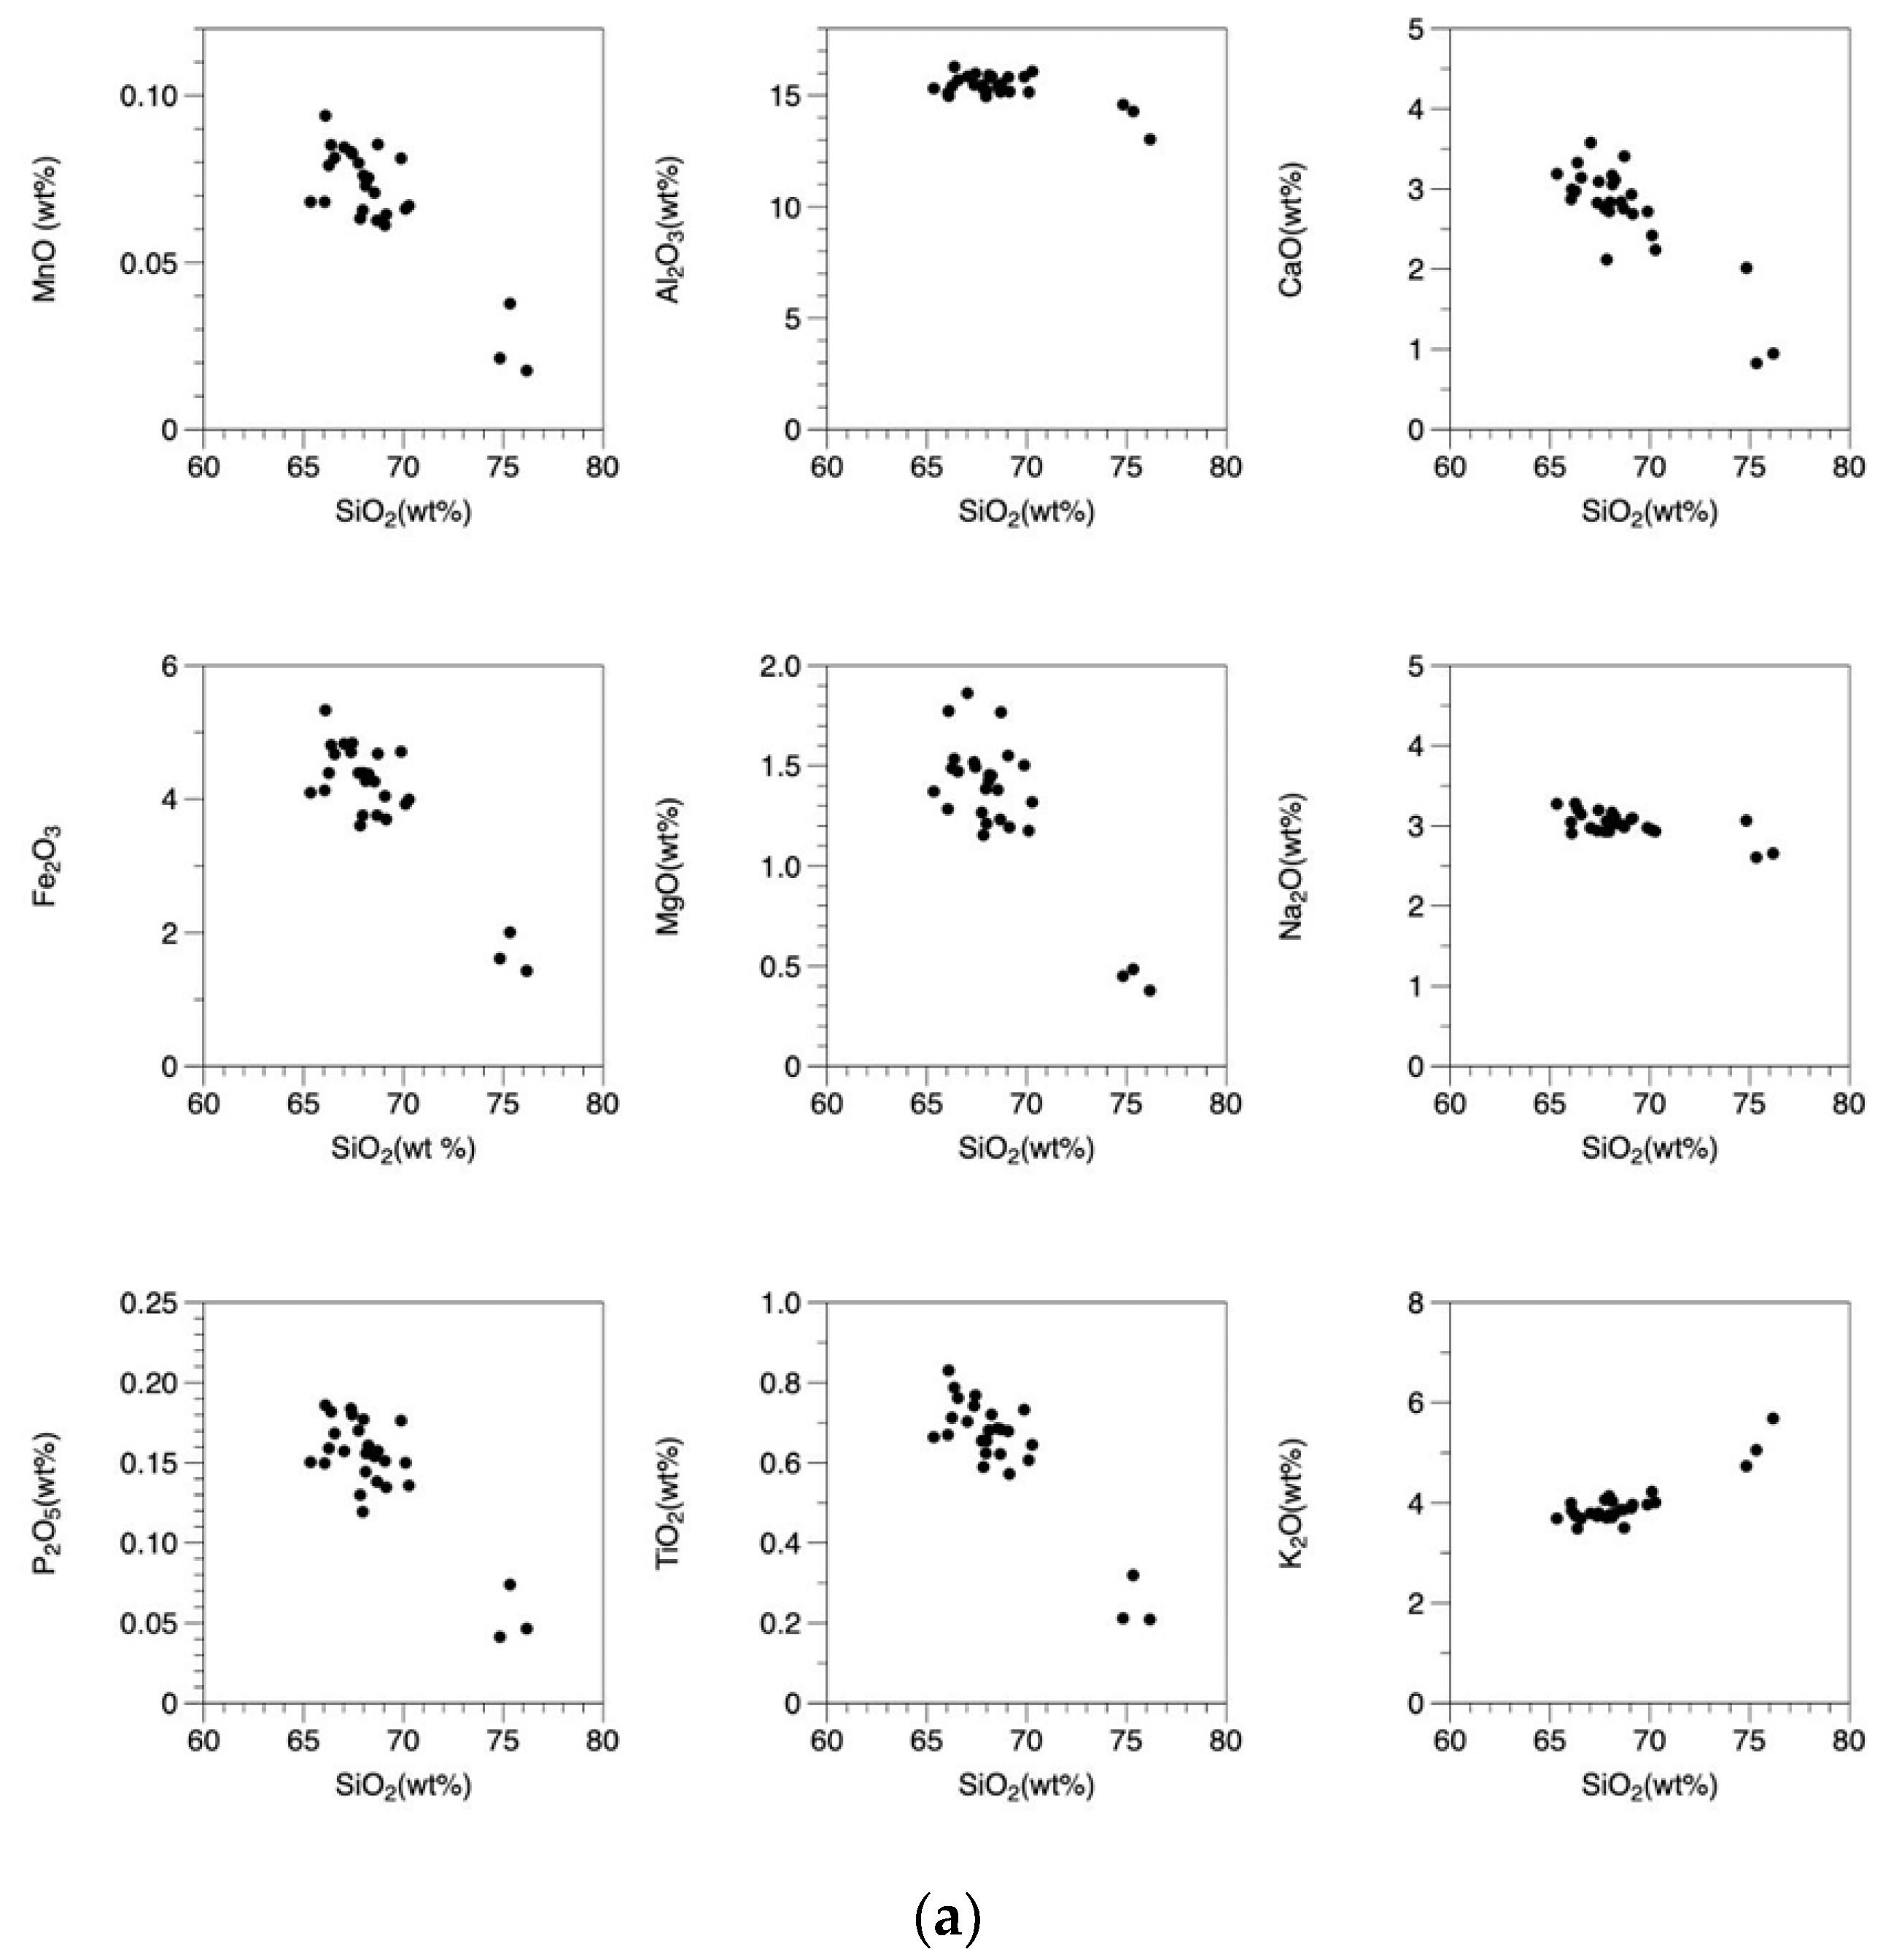
Table 1 presents the results of the analysis of major and trace element compositions of all 27 samples analyzed. Table 2 provides the rare earth element compositions. Figure 3a shows Harker diagrams of the major element composition. The Osumi Granodiorite was broadly classified as granodiorite with SiO2 ranging from 66.1–70.1 wt.% and granite with SiO2 ranging from 74.8–76.2 wt.%. In terms of major element composition, an increase in SiO2 content resulted in decreases in Fe2O3, MnO, TiO2, CaO, P2O5, MgO, and Al2O3 contents, while the K2O content tended to increase. The Na2O content was relatively constant. Figure 4a shows a graph of the alumina saturation index (ASI). As all samples had an ASI greater than 1, they were peraluminous rocks. All samples, except for OSA2, OSA13, OSA14, OSA20, and OSA23, had ASIs smaller than 1.1 and displayed type I compositions.
A classification diagram for igneous rocks using SiO2–Na2O + K2O is shown in Figure 4b. As a result, OSA5B, OSA9A, and OSA13 were classified as granite, and all other samples were classified as granodiorite. Also, as shown in Figure 4c, all samples fell within the high-K region [26]. The common features of outer zone felsic igneous rocks, which are K-rich and peraluminous rocks, were also observed in this granitic rock body. Furthermore, the relationship between FeO*/MgO–SiO2 for all 27 samples is shown in Figure 4d. All samples showed a tendency for FeO*/MgO to not increase much as SiO2 increased significantly, and they were assigned to the calc-alkaline rock series.
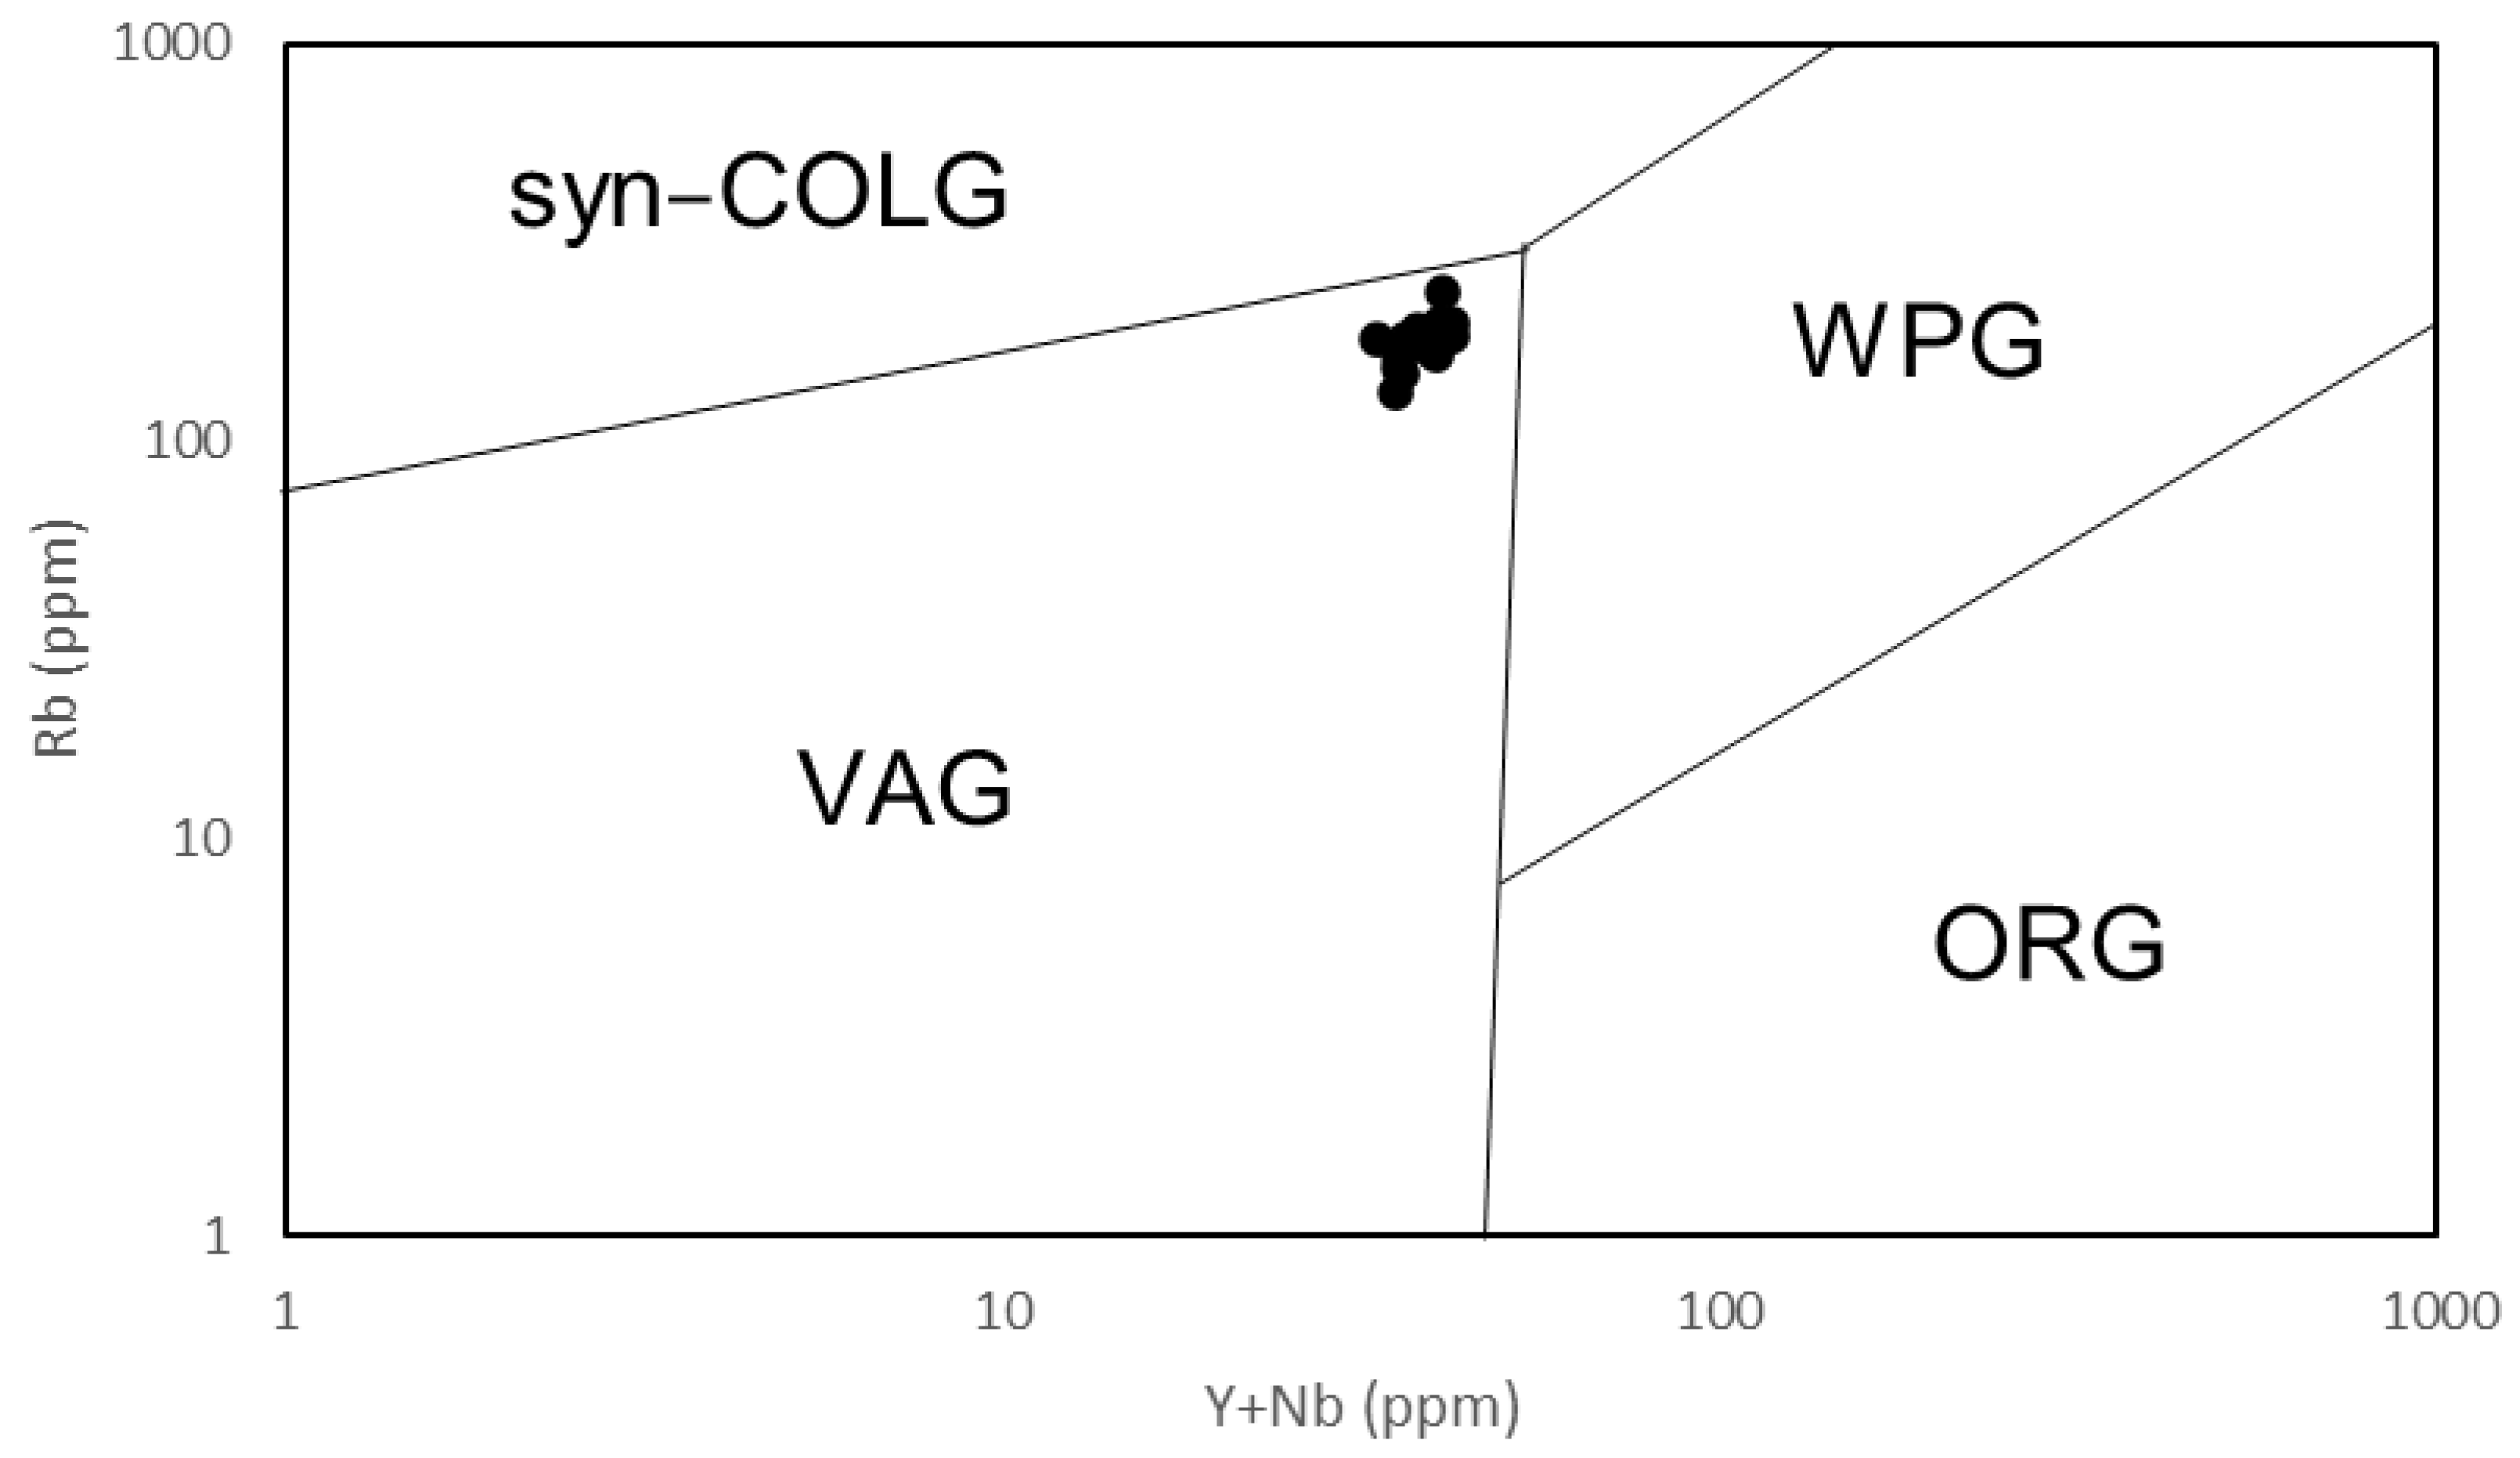
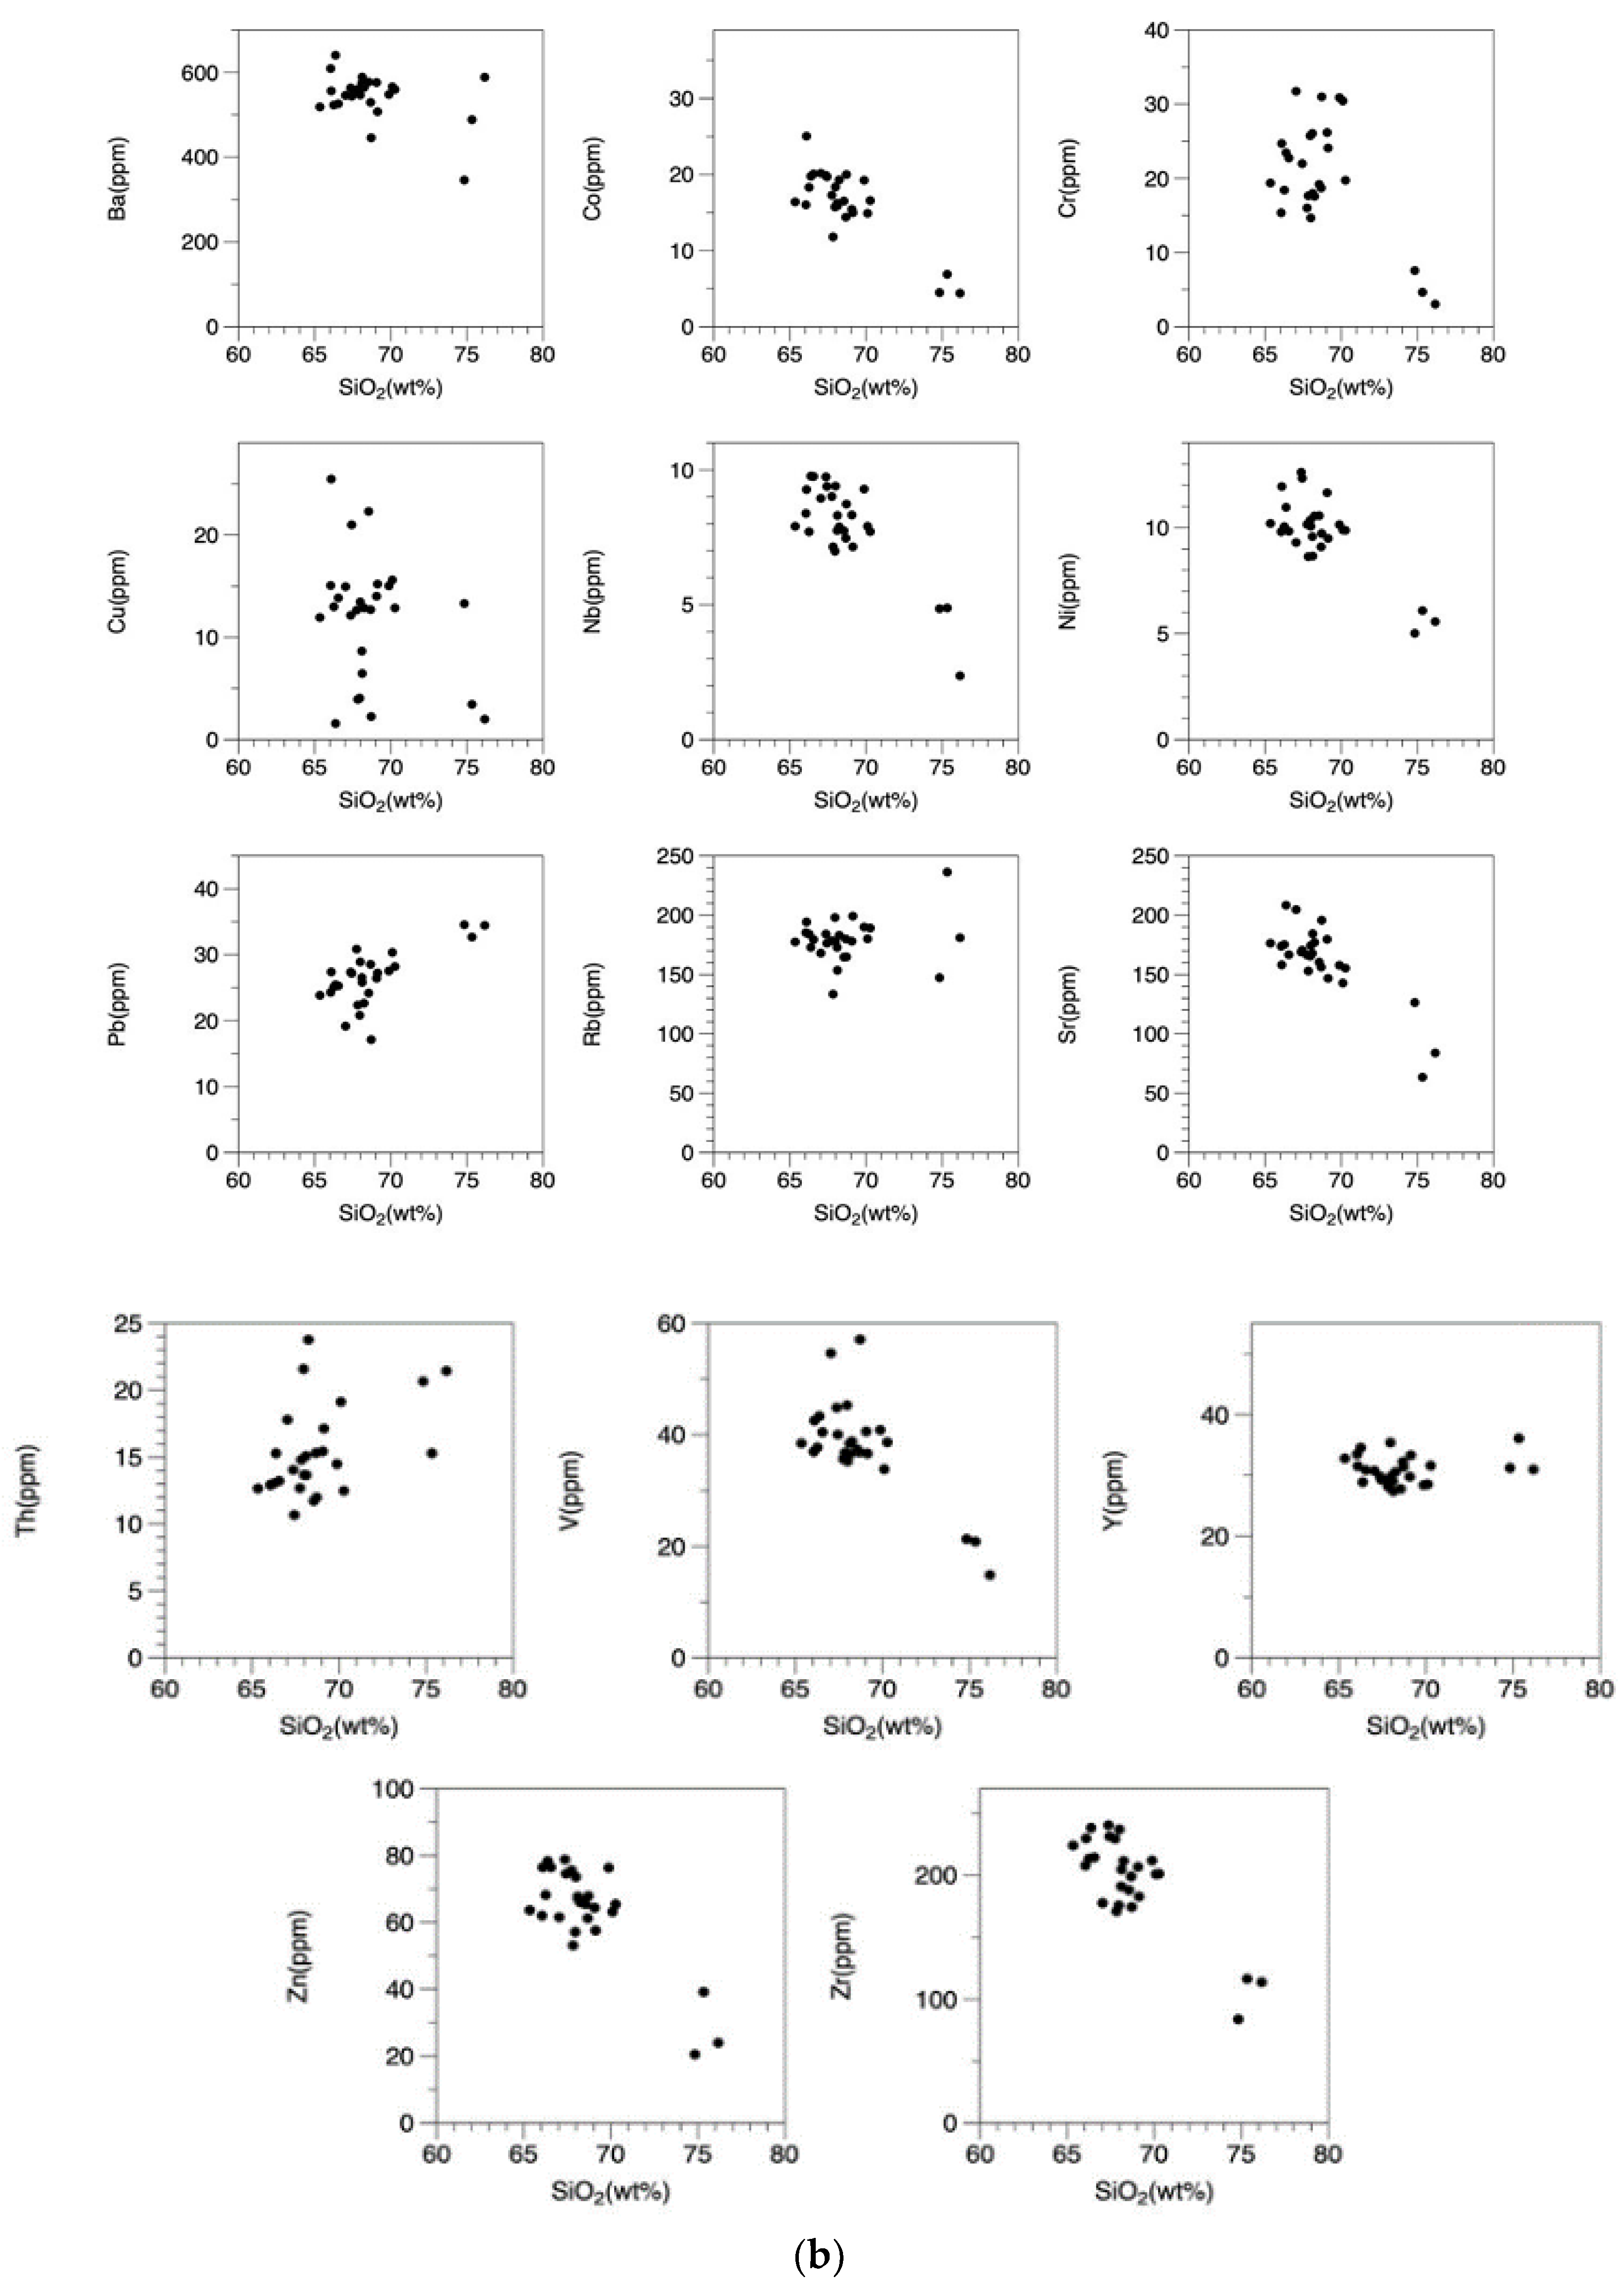
The Harker diagrams of the trace element compositions are shown in Figure 3b. In this figure, as the SiO2 content increases, Th, Rb, Pb, and Y increase, while Cr, Ba, V, Cu, Zr, Co, Ni, Nb, Sr, and Zn decrease. Elements such as Th and Cu are distributed dispersedly on the diagram. A geochemical discriminant diagram based on the trace element composition [27] showed that all samples had the composition of volcanic arc granite (VAG) (Figure 5).
Figure 4. (a) ASI–SiO2 diagram [A/CNK (ASI) = molar Al2O3/(CaO + Na2O + K2O)]. Sample OSA24 is outside the scope on this diagram. (b) TAS (Total Alkali-Silica) diagram. (c) Relationship between SiO2 and K2O content [26]. (d) FeO*/MgO–SiO2 diagram [28]; TH: tholeiitic series, CA: calc-alkalic series. The line that divides CA and TH is a reference line.
Minerals 14 00680 g004
Figure 5. Rb − (Y + Nb) discriminant diagram (Pearce, 198) [27] for syn-collision (syn-COL), volcanic arc (VA), within plate (WP) and normal and anomalous ocean ridge (OR) granites (G).
Minerals 14 00680 g005
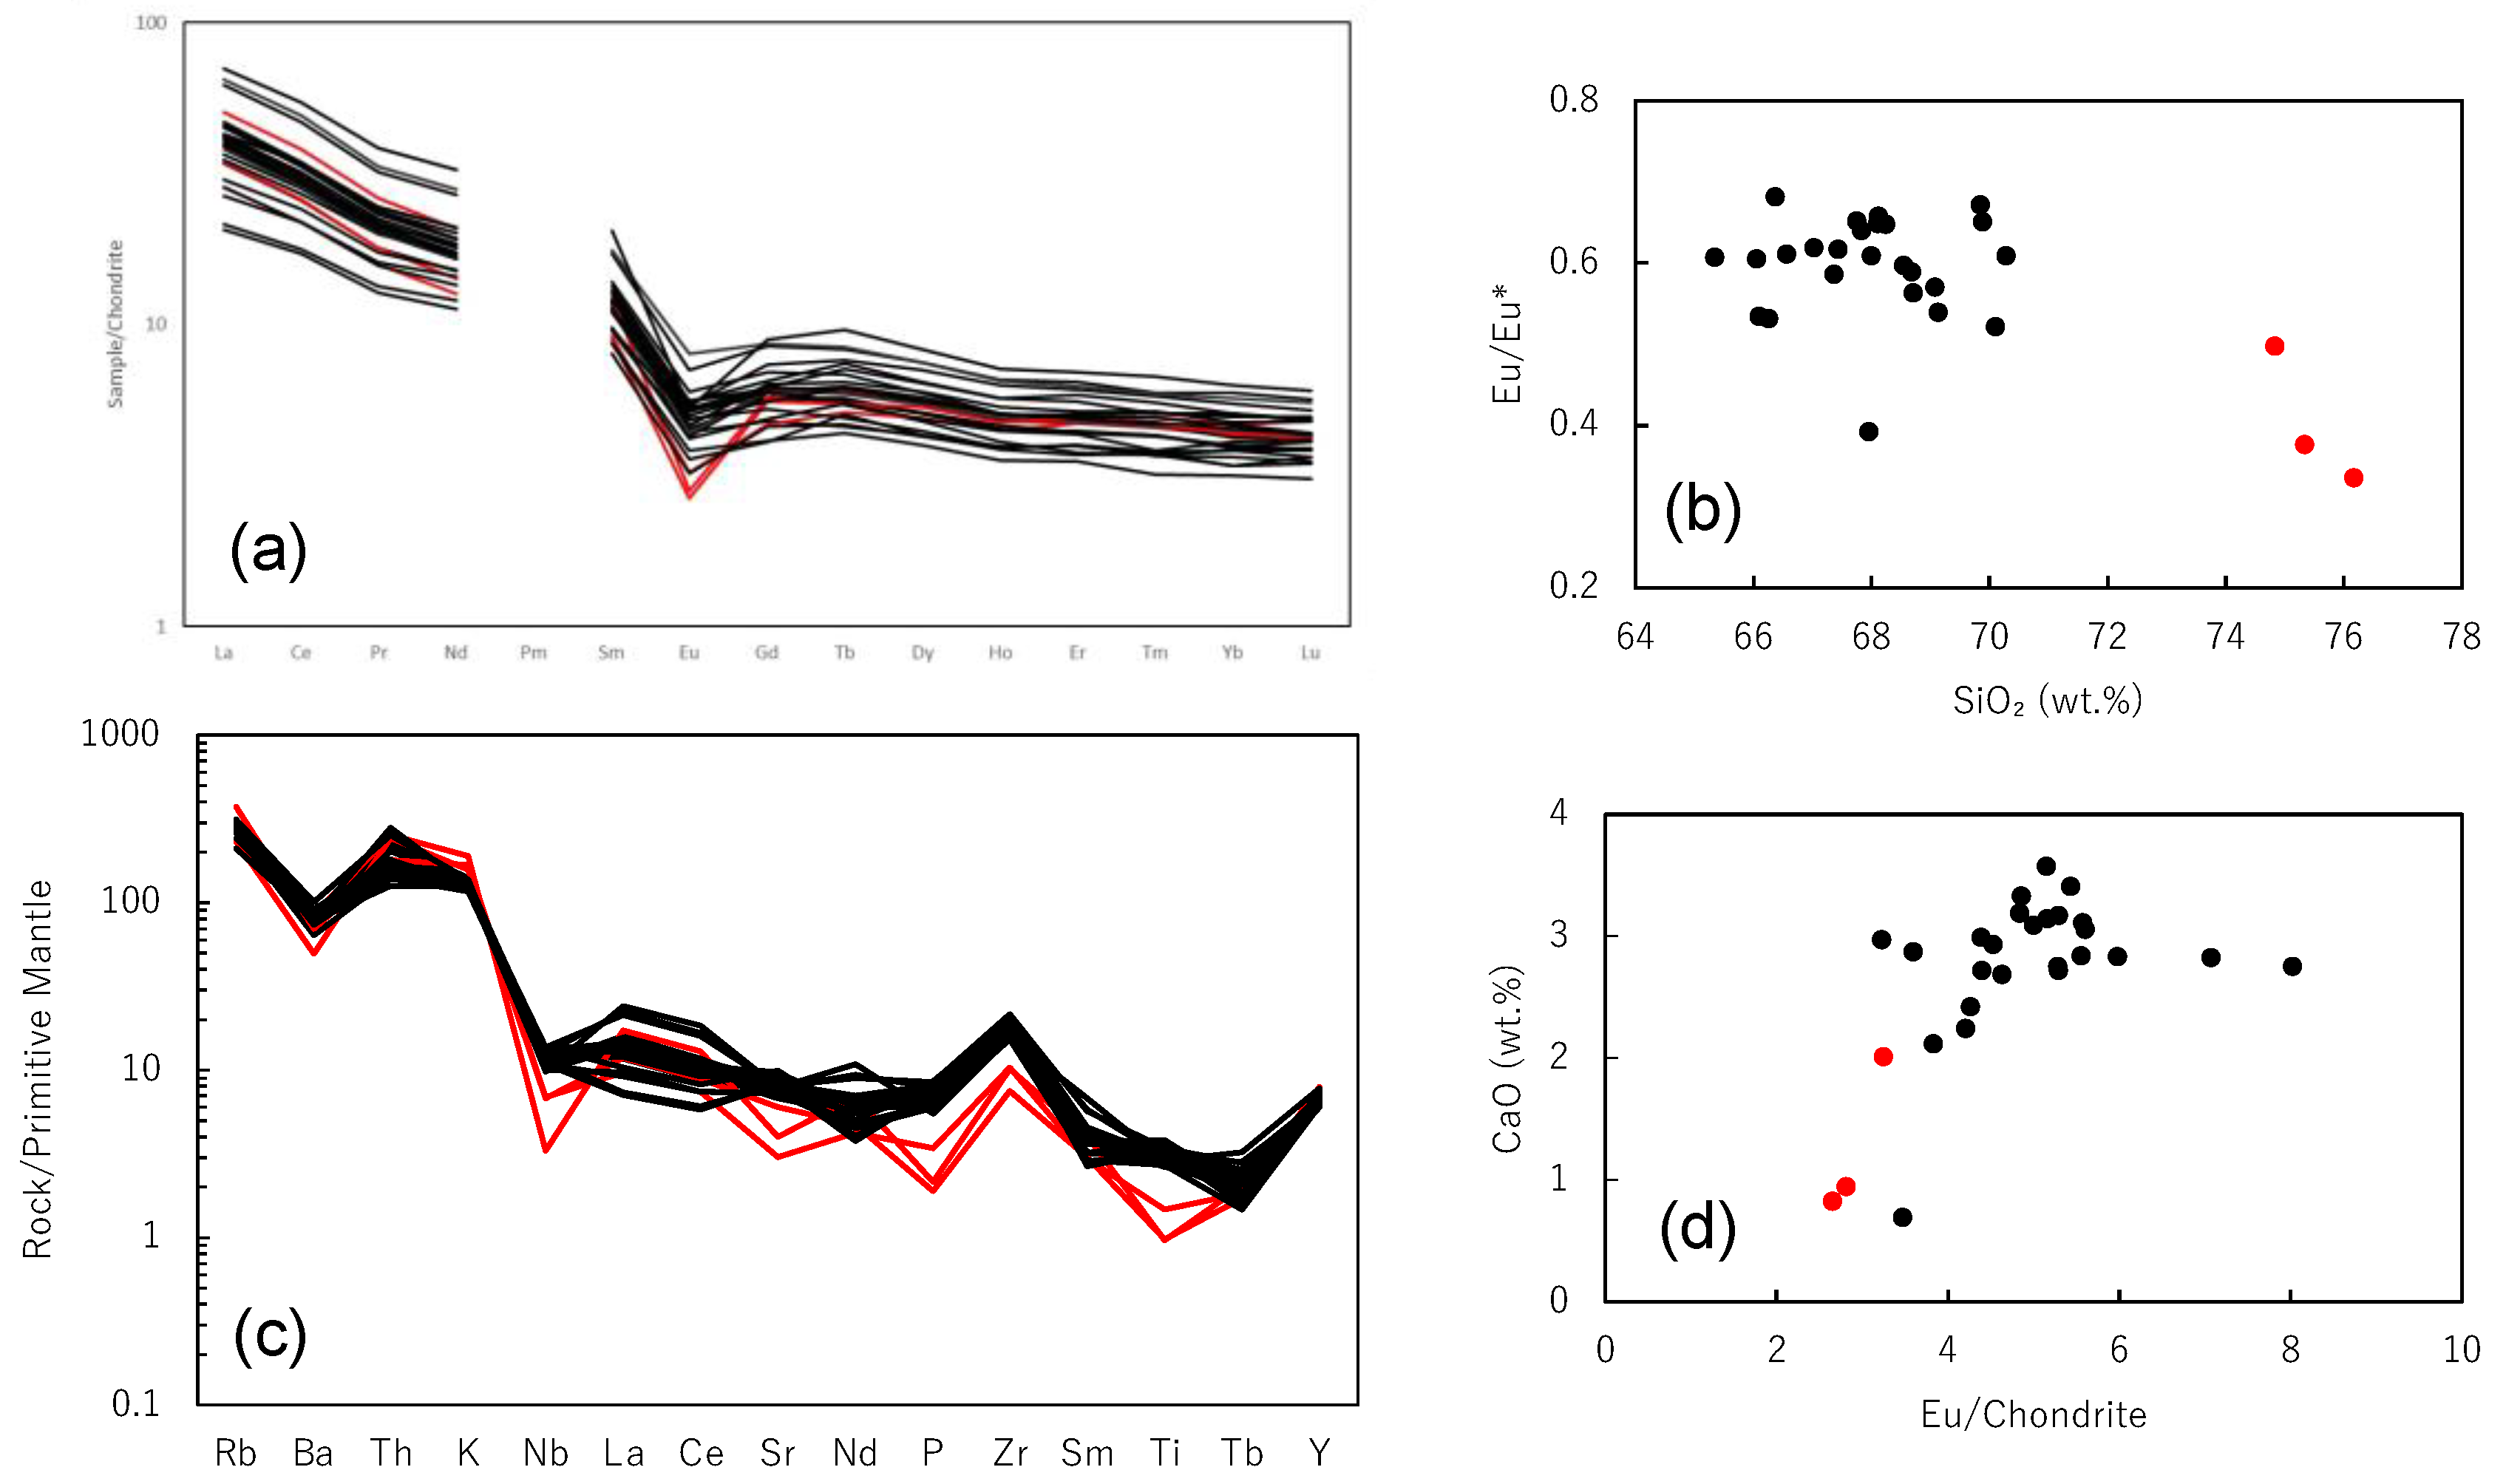
Figure 6a shows the rare earth element composition normalized to the CI chondrite value of Anders and Grevesse [25]. Light rare earth elements (LREEs) were enriched by a factor of c. 10–50, whereas the abundance of heavy rare earth elements (HREEs) was around 5 times that of chondrite, exhibiting a slightly flat downward-sloping trend. Eu anomalies calculated as Eu* [Eu* = (Sm × Gd)^(1/2)] were present in all samples (Figure 6b) and increased with increasing SiO2. Additionally, to confirm the relationship between Eu and magma evolution, we plotted CaO–Eu on a graph (Figure 6d). Eu and CaO exhibited a positive correlation.
Figure 6c shows a spidergram in which elements are arranged in order of incompatibility and normalized by the value of the primary mantle [29]. The samples reported in this study exhibited two distinct patterns on the spidergram, with a particularly pronounced negative anomaly. The difference in the pattern appeared to be due to the difference between granite and granodiorite.
Table 3 shows the Rb–Sr isotope measurement results for whole-rock samples of the Osumi Granodiorite. The corresponding isochron diagram is shown in Figure 7a. The Osumi Granodiorite samples showed a good linear trend except for three samples (OSA5B, OSA9A, and OSA14). These samples were granite (OSA5B and OSA9A) and granodiorite (OSA14). They are marked with red dots and are excluded from the isochron. The Rb–Sr whole-rock isochron age was 64.3 Ma, with an initial strontium isotopic ratio (SrI) of 0.70651. Correcting for the most frequently occurring age value among existing age determinations (14 Ma), such as K–Ar biotite ages and U–Pb ages, the recalculated initial strontium ratio (SrI) for each sample ranged from 0.7083 to 0.7140.
In the 1000/Sr–SrI diagram (Figure 7b), there is an apparent trend of increasing SrI toward the sedimentary rocks of the Shimanto Belt with the rise in 1000/Sr.

5. Discussion

The Harker diagrams in Figure 3a show common features with outer zone granites in southwest Japan, such as FeO being more abundant than CaO and K2O being more abundant than Na2O [31]. Moreover, a trend is observed where Fe2O3, MnO, TiO2, and MgO decrease with an increase in SiO2. These elements are commonly found in mafic minerals such as biotite, suggesting their separation as mafic minerals during magma differentiation, leading to their decrease. The decreasing trend in CaO and P2O5 is likely due to the separation of plagioclase and apatite, respectively. Potassium (K) is considered an incompatible element that tends to concentrate in residual magma, which is thought to be the reason for the increasing tendency seen in the Harker diagrams. Figure 4b indicates that the total alkali content (Na2O + K2O) shows an increasing tendency as SiO2 increases, similar to K2O. Meanwhile, the Na2O content remains constant regardless of the increase in SiO2. Therefore, it is considered that the alkali content in this rock is significantly influenced by K. The linear trends in the Harker diagrams for each element suggest that these rocks have a common magmatic origin. Based on the SiO2 content, granite with lower SiO2 appears less differentiated (granodiorite), while higher SiO2 is indicative of a more evolved composition (granite). This interpretation aligns with field observations where granites intrude into granodiorites.
Based on the ASI, granitoids with A/CNK > 1.1 are classified as S-type, while granitoids with A/CNK < 1.1 are classified as I-type [32]. All samples are peraluminous rocks, with most having an ASI smaller than 1.1, classifying them as I-type igneous rocks. Although some samples have an ASI exceeding 1.1, the overall trend shows an increase in ASI as the amount of SiO2 increases, indicating a highly differentiated I-type rather than a typical S-type. Furthermore, it is recognized that there exists a negative correlation between P2O5 and SiO2 contents in I-type granite as a result of apatite separation [33]. In the case of granitic rocks in the inner part of southwestern Japan, S-type granite is phosphorus-rich, while I-type granitic rocks are phosphorus-poor [34]. Thus, this rock body is suggested to be I-type (referring to P2O5 versus SiO2 plot in Figure 4a). On the other hand, considering the high K2O/Na2O ratios and peraluminous nature of all samples, it is reasonable to classify the studied rock body as a type close to S-type but leaning toward I-type, suggesting it to be a peraluminous I-type granitoid. Regarding the outer zone granites, a zonal distribution has been proposed, indicating the occurrence of S-type granites closer to the trench and I-type granites farther away [35]. The Osumi Granodiorite is located in the transition region, which may explain its possession of characteristics from both types. Furthermore, as the Osumi Granodiorite is located in the outer zone and facing the Pacific, it may be affected by sedimentary rocks from the Shimanto Belt. This could contribute to variations in the chemical composition, providing another possible explanation for the high ASI.
Based on Figure 4d, it can be concluded that the Osumi Granodiorite belongs to the calc-alkaline series, which is commonly associated with subduction zone volcanism, particularly arc volcanism [36]. Therefore, it is probable that this rock body was formed in connection with tectonic events such as the expansion of the Sea of Japan and the subduction of the Philippine Sea Plate. The Harker diagrams in Figure 3b show decreasing trends of Nb, Ni, and Cr with increasing SiO2 content. This trend can be attributed to the relatively high partition coefficients of these elements in biotite/felsic melts (Nb, 4.6–9.1; Cr, 5.233–19.650; Ni, 15.1–23.9: [37,38]). Conversely, Rb and Pb exhibit increasing trends as SiO2 increases. These elements may replace K in feldspar and are thought to exhibit the same increasing trend as K2O. Rb and Pb are associated with the concentrations of biotite and alkali feldspar, respectively, in high-silica granites. Moreover, an increasing trend in Th was observed. As the Th content has a strong correlation with alkali feldspar, the tendency for an increase in Th is also attributed to the concentration of alkali feldspar. Zr and Sr exhibit decreasing trends with increasing SiO2, indicating a probable association with the fractionation of zircon and plagioclase, respectively. This is attributed to the extensive fractionation of zircon, which is dominated by crystallization aggregates with feldspar. Upon examination of the Zr content in the main lithofacies of the studied rock body, it is evident that Zr content decreases from approximately 240.4 ppm in the mafic phase to 83.7 ppm in the leucocratic phase, indicating a decreasing type [39]. This type of granite is common in crustal-derived ilmenite-series magmas. The magma is initially saturated with Zr and gradually loses its Zr content as zircon crystallizes during the later stages of the crystallization process. Therefore, the source material for this rock body is likely of continental crust origin, with an initially high Zr content. The decrease in Zr in the magma is attributed to the crystallization of zircon during magmatic differentiation. The results indicate that the Osumi Granodiorite is a well-differentiated rock. Additionally, based on the geochemical discriminant diagram, this rock body was classified as a volcanic arc granite (VAG), suggesting that the Osumi Granodiorite was formed by the subduction of the Philippine Sea Plate, resulting in felsic magmatism.

5.1. Rare Earth Elements

The REE patterns exhibited a high degree of similarity across all samples (Figure 6a), with an abundance of light rare earth elements (LREEs), that of heavy rare earth elements (HREEs) being approximately 5 times that of chondrite, and a slightly flat downward trend. Additionally, negative Eu anomalies were observed in all samples. This characteristic pattern is commonly observed in outer zone granites [40]. The comparable patterns for all samples suggest a common magmatic origin for this rock body. However, variations in the Eu anomaly indicate potential differences in the differentiation process. The differences in lithologies and chemical composition of the Osumi Granodiorite are likely due to variations in the degree of differentiation. Moreover, variations in the Sr isotopic composition also suggest variations in source rocks or mixing processes. In considering the factors that contribute to the relatively large Eu anomaly in this rock, it is crucial to investigate the reasons for the elevated Eu2+/Eu3+ ratio. A high Eu2+/Eu3+ ratio often viewed as an indicator of magma oxygen fugacity [41,42], which suggests that this rock formation may have occurred in a reducing environment. The formation of granites in a reducing environment is typically linked to the carbonaceous material of sedimentary rocks, such as graphite, in magma formation. Although the sedimentary rocks of the Shimanto Group may have contributed to the formation of the magma, further discussion is required to determine the source material, specifically through isotopic analysis. The comparison between the magnitude of the Eu anomaly and SiO2 content (Figure 6b) shows a tendency for the Eu anomaly to increase with an increase in SiO2 content. The observed correlation suggests a likely association between the Eu anomaly and the differentiation process of granitic magma. Specifically, as the magma differentiates, the separation of feldspar (plagioclase) likely progresses, leading to an increase in the magnitude of the Eu anomaly. Furthermore, Figure 6d shows a trend of increasing Eu with an increase in CaO, indicating that the chemical influence of plagioclase differentiation affects both CaO and Eu. The REE results suggest that the granitic magma of the Osumi Granodiorite was formed by fractional crystallization of granodioritic magma. This is supported by the systematic distribution of the granite and granodiorite data in Figure 6a–d.

5.2. Spidergram

Figure 6c illustrates that each sample displayed a comparable pattern, indicating an overall decreasing trend. Negative anomalies were observed for Ba, Nb, Sr, P, and Ti. This characteristic feature, where high field strength (HFS) elements such as Nb, P, and Ti are depleted compared to other elements, is commonly observed in granitic rocks from island arcs and continental arcs, and might be inherited from the source rocks. The decreases in Sr and Ba are believed to be associated with the differentiation of plagioclase. Additionally, samples OSA5B, 9A, and 13 (all granites) exhibited more pronounced negative anomalies compared to other samples. This could be attributed to the advanced differentiation of high-silica granites, where the separation of minerals such as magnetite, apatite, and plagioclase is more significant. There is also a possibility of influence from sedimentary rocks in the Shimanto Group. On the other hand, this rock is enriched in large ion lithophile (LIL) elements and light rare earth elements (LREEs). These elements have large ionic radii and may have been concentrated in the magma during the differentiation process.

5.3. Rb–Sr Isotopic System

The Osumi Granodiorite samples formed a straight line on the Rb–Sr isochron diagram (Figure 7a). However, three samples (OSA5B, OSA9A, and OSA14) deviated from the isochron. Samples OSA5B and OSA9A were granite, and sample OSA14 was granodiorite. Although OSA14 was classified as granodiorite, it had a high ASI value of 1.10. OSA5B and OSA9A had high SiO2 contents of 74.82 wt.% and 76.17 wt.%, respectively. Similarly, the potassium contents were high at 4.73 wt.% and 5.69 wt.%, respectively. The Sr isotopic ratio of OSA9A (87Sr/86Sr = 0.71521) was significantly higher, strongly suggesting assimilation of the surrounding sedimentary rocks. Two possible explanations were considered for this result. One possibility is that the granitic magma reacted with the surrounding sedimentary rocks of the Shimanto Group upon intrusion, resulting in an increase in the Sr isotope ratio at the outer contact zones. Pelitic sedimentary rocks are typically rich in Rb and have a high 87Sr/86Sr ratio. If magma assimilates them, it is believed that Rb in the magma will increase, as well as the 87Sr/86Sr ratio. Furthermore, pelitic sedimentary rocks are rich in Al2O3. The assimilation of these sediments could potentially increase the alumina saturation index (ASI) of the rock samples. This aligns with the results mentioned earlier in the alumina saturation index section (Figure 4a). Some rock samples, including OSA5B, OSA9A, and OSA14, exhibited ASI values exceeding 1.1 and displayed characteristics of S-type rocks that were distinct from other samples. The second possibility is that these samples were formed from a different magma source. The 1000/Sr-SrI diagram is often used when considering magma mixing or assimilation of wall rocks. If the data form a straight line on this diagram, it strongly suggests the possibility of mixing of the two different components and the isochron age is in reality a mixing line. In the 1000/Sr–SrI diagram (Figure 7b), the SrI of the Osumi Granodiorite increased toward the sedimentary rocks of the Shimanto Group with an increase in 1000/Sr. This may indicate that assimilation occurred between primary magma and sedimentary rocks. Therefore, the first possibility is considered more likely, suggesting that the Osumi Granodiorite was formed through heterogeneous assimilation of sedimentary rocks of the Shimanto Group. The magma that produced the outer-zone felsic igneous rocks likely underwent varying degrees of reaction with Shimanto Group sedimentary rocks during crustal ascent, with greater mixing occurring in the outer margins of the magma.
The initial 87Sr/86Sr ratios, corrected for 14 Ma, ranged from 0.7083 to 0.7140, falling within a similar range as Cretaceous granitic rocks (0.7052–0.7126) [1]. The Osumi Granodiorite often contains migmatitic xenoliths, suggesting that its origin involves the mixing of mafic magma (SrI = 0.7032–0.7040) and Shimanto Group sedimentary rocks or partially melted melts from them [2]. The Rb–Sr mixing line corresponded to a whole-rock isochron with an age of 64.3 Ma, which was very close to the previously reported age of 64 Ma by Yanagi (1971) [20]. Horikoshi (1976) [43] proposed that, in plutonic magmatism, the ascent of magma would be slowed down by the crust being under lithostatic pressure. Furthermore, during the Middle Miocene, a predominantly NNW-directed compressive stress field was reported to exist in the outer belt region south of the Butsuzo Tectonic Line [44,45]. As a part of outer belt of southwestern Japan, the Osumi Peninsula is believed to have experienced difficulty in magma ascent due to this compressive stress field. The magma gradually rose through partial melting in the crust and assimilated crustal materials, which are considered to be sedimentary rocks of the Shimanto Group.

5.4. AKF Diagram

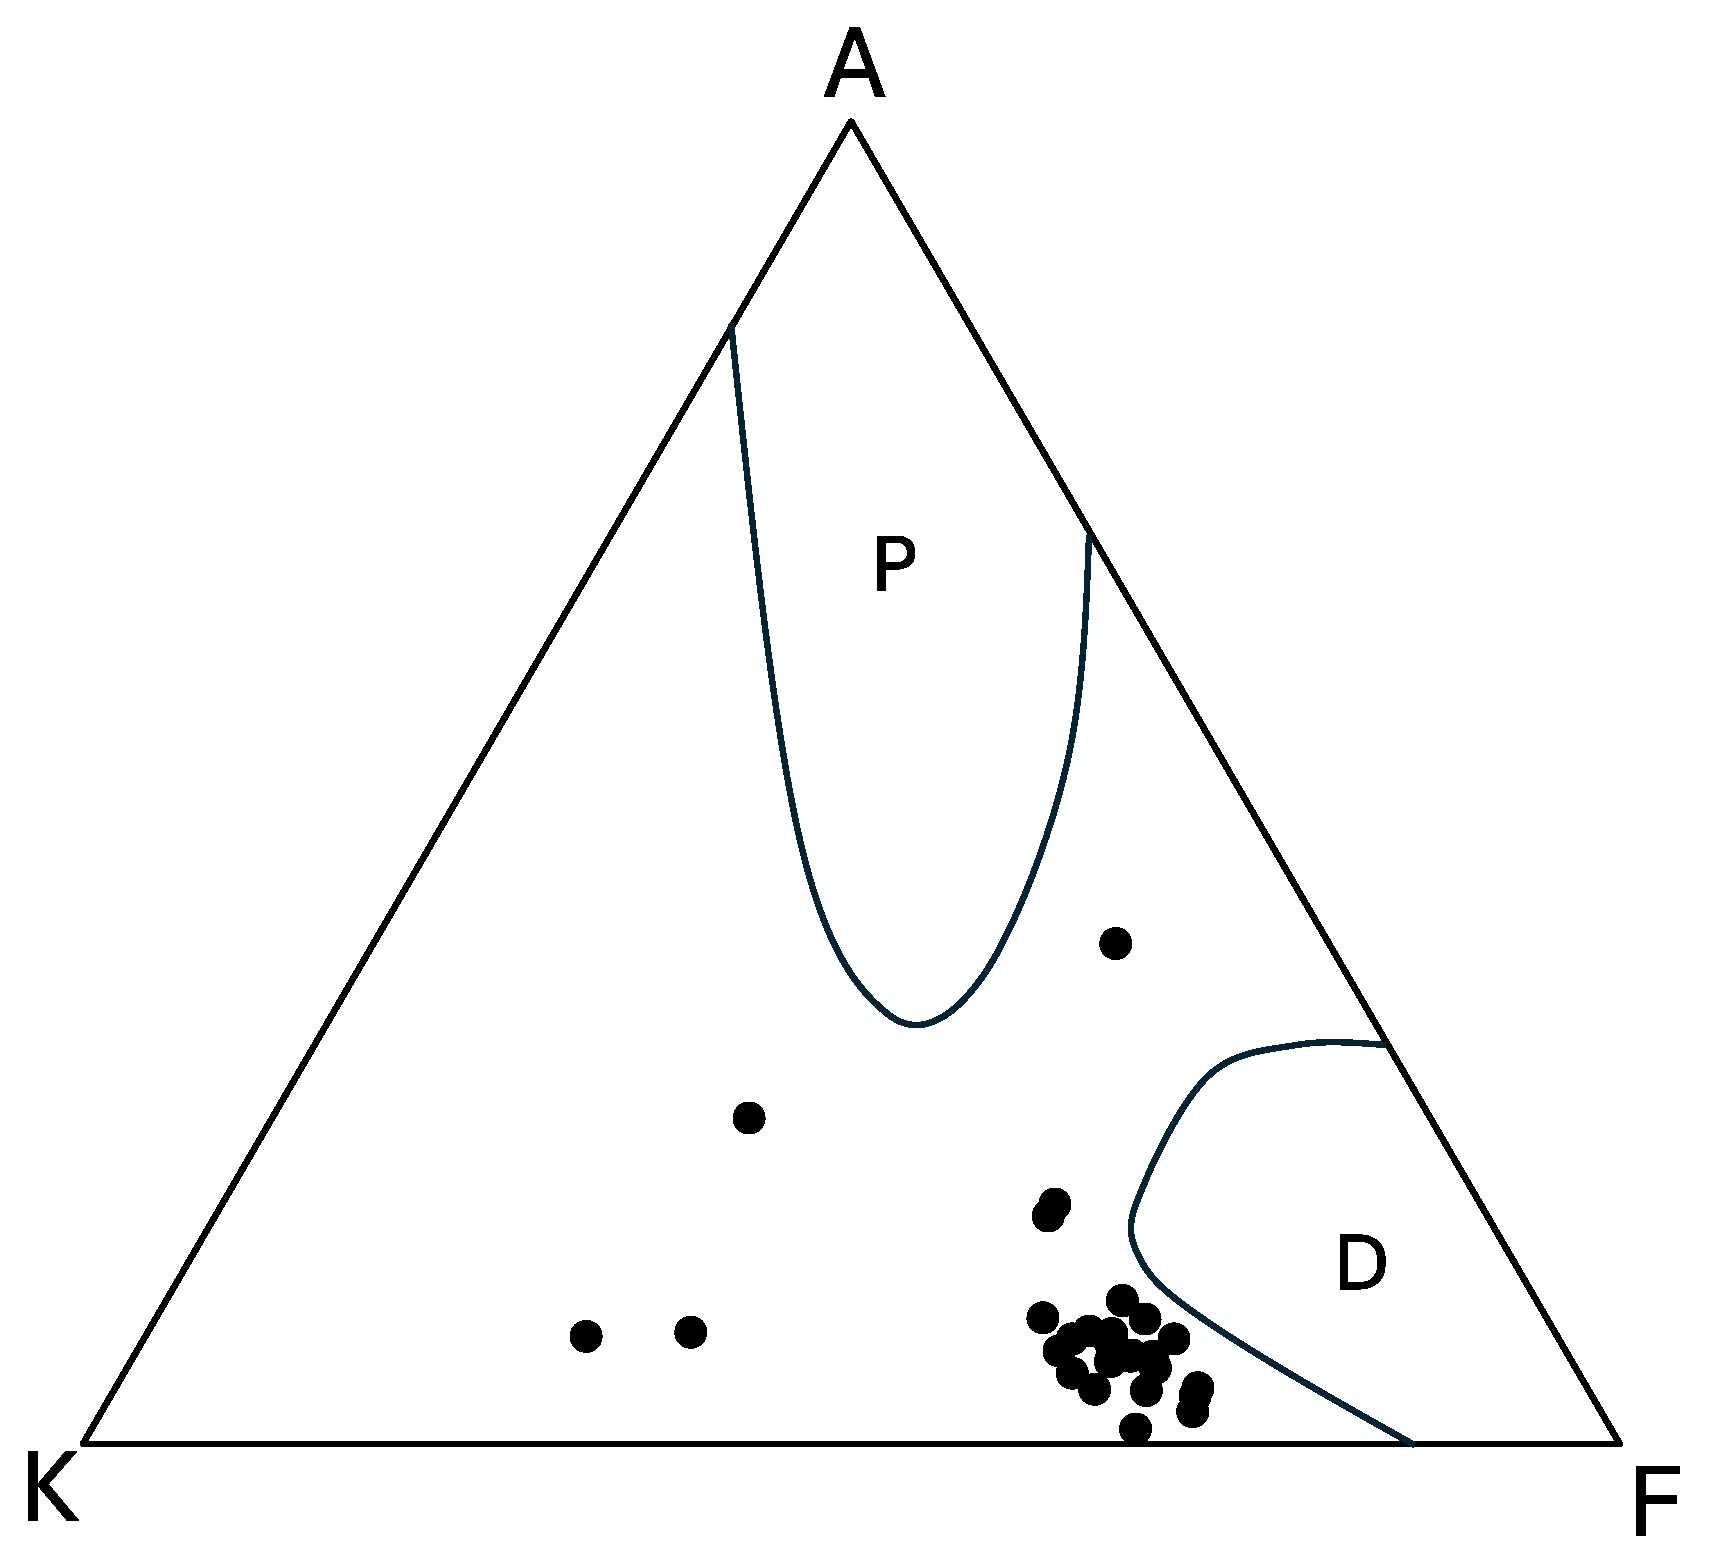
In Oba (1961) [17], the Osumi Granodiorite was examined in relation to sedimentary rocks using AKF diagrams. AKF diagrams are mainly used for the analysis of metamorphic rocks, and it may also provide useful information for granites. In the present study, AKF diagrams were similarly prepared and the influence of sedimentary rocks was examined (Figure 8).
The field P represents the compositions of pelitic rocks from Kyushu, Japan, and worldwide [17] and the field D are those of diabases [17]. AKF diagrams are often used to illustrate contamination (assimilation) trends in granitic rocks. In general, compared to granitic rocks that are uncontaminated or have a low degree of contamination, they differ from those contaminated by pelitic rocks or basic rocks. The former are oriented toward vertex A or the A–K line on the AKF diagram, while the latter are oriented toward point F or the diabases field (D) on the same diagram. The AKF diagram shows that the Osumi Granodiorite is overall biased toward the A–K line. Therefore, it is probable that the Osumi Granodiorite is predominantly contaminated by pelitic rocks. This assimilation process is believed to be due to magmatic stoping during the magma intrusion. The Osumi Granodiorite is thought to have formed through assimilation with pelitic or psammitic materials from Shimanto Group sedimentary rock or its lower formations during the magma intrusion process.

6. Conclusions

The whole-rock chemical compositions and rare earth element (REE) compositions of 27 samples, along with the Rb–Sr isotopes of 12 samples, were reported for the Osumi Granodiorite complex. Based on these analyses, the following conclusions can be drawn:
  • The Osumi Granodiorite complex is broadly divided into two main rock types: granodiorite with an SiO2 content ranging from 66.1 to 70.1 wt.% and granitic rock with a SiO2 content ranging from 74.8 to 76.2 wt.%. The REE patterns are consistently similar across all samples, characterized by enrichment in light REEs and a somewhat flat, rightward-sloping trend of heavy REEs with approximately 5 times the chondrite values. This rock body exhibits common features with outer zone granitic rocks in southwestern Japan, including higher FeO than CaO and higher K2O than Na2O.
  • The Osumi Granodiorite is believed to have originated from a single magma source based on the single trend in the Harker diagrams and similar REE patterns among samples. Geochemical discrimination diagrams and the relationship between FeO*/MgO and SiO2 categorize this rock body as a volcanic arc granite (VAG) belonging to the calc-alkaline series. Therefore, it is inferred that the Osumi Granodiorite formed due to subduction of the Philippine Sea Plate, which triggered felsic magmatic activity.
  • Based on the alumina saturation index (ASI), this rock body exhibits a peraluminous composition. Most of the samples are assigned to I-type, but some show characteristics of S-type, indicating a potential influence of chemical composition from sedimentary rocks of the Shimanto Group. The AKF diagram suggests a higher likelihood of contamination by pelitic rocks. It is proposed that the Osumi Granodiorite formed through assimilation during the intrusion process, involving pelitic or psammitic materials from the Shimanto Belt or its lower formations.
  • Rb–Sr whole-rock isochron and SrI–1000/Sr diagrams suggest that the Osumi Granodiorite formed through heterogeneous assimilation of magma derived from a single source with the sedimentary materials from the Shimanto Group. The original magma might be derived from mantle, which is indicated by the relatively lower Sr isotopic ratios compared with sedimentary rocks.

Author Contributions

Investigation, H.X, K.S. and M.T.; Project administration, M.T.; Supervision, M.T.; Writing—original draft, H.X.; Writing—review & editing, M.T. and K.S. All authors have read and agreed to the published version of the manuscript.

Funding

This research received no external funding.

Data Availability Statement

Data are available on reasonable request.

Acknowledgments

The authors thank Okabayashi for his guidance, including laboratory experiments.

Conflicts of Interest

The authors declare no conflict of interest.

References

  1. Nakajima, T. Granites of Japan: A review at 2017. J. Geol. Soc. Jpn. 2018, 124, 603–625. [Google Scholar] [CrossRef]
  2. Shinjoe, H. Origin of the granodiorite in the forearc region of southwest Japan: Melting of the Shimanto accretionary prism. Chem. Geol. 1997, 134, 237–255. [Google Scholar] [CrossRef]
  3. Nishimura, K.; Yanagi, T. In situ crystallization observed in the Osumi granodiorite batholith. Earth Planet. Sci. Lett. 2000, 180, 185–199. [Google Scholar] [CrossRef]
  4. Takahashi, M. Anatomy of a middle Miocene Valles-type caldera cluster: Geology of the Okueyama volcano-plutonic complex, Southwest Japan. J. Volcanol. Geotherm. Res. 1986, 29, 33–70. [Google Scholar] [CrossRef]
  5. Miura, D. Arcuate pyroclastic conduits, ring faults, and coherent floor at Kumano caldera, southwest Honshu, Japan. J. Volcanol. Geotherm. Res. 1999, 92, 271–294. [Google Scholar] [CrossRef]
  6. Kawakami, Y.; Hoshi, H.; Yamaguchi, Y. Mechanism of caldera collapse and resurgence: Observations from the northern part of the Kumano acidic rocks, Kii peninsula, southwest Japan. J. Volcanol. Geotherm. Res. 2007, 167, 263–281. [Google Scholar] [CrossRef]
  7. Orihashi, Y.; Shinjoe, H.; Anma, R. Elucidation of whole Mid-Miocene granitic magmatism of the outer zone of southwestern Japan, Kyushu province: Constraint from LA-ICPMS U–Pb age determination. Abstr. Annu. Meet. Geochem. Soc. Jpn. 2015, 62, 33. [Google Scholar]
  8. Miller, J.A.; Shibata, K.; Kawachi, Y. Potassium-argon ages of granitic rocks from the Outer Zone of Kyushu, Japan. Bull. Geol. Surv. Jpn. 1962, 13, 712–714. [Google Scholar]
  9. Kawano, Y.; Ueda, Y. KA dating on the igneous rocks in Japan (I). J. Jpn. Assoc. Mineral. Petrol. Econ. Geol. 1964, 51, 127–148. [Google Scholar] [CrossRef]
  10. Shibata, K. Contemporaneity of Tertiary granites in the Outer Zone of Southwest Japan. Bull. Geol. Surv. Jpn. 1978, 29, 551–554. [Google Scholar]
  11. Fabbri, O.; Monié, P.; Fournier, M. Transtensional deformation at the junction between the Okinawa trough back-arc basin and the SW Japan island arc. Geol. Soc. London Spec. Publ. 2004, 227, 297–312. [Google Scholar] [CrossRef]
  12. Geological Survey of Japan, AIST Seamless Digital Geological Map of Japan. Available online: https://gbank.gsj.jp/seamless/ (accessed on 24 June 2024).
  13. Shinjo, R.; Woodhead, J.D.; Hergt, J.M. Geochemical variation within the northern Ryuku Arc: Magma source compositions and geodynamic implications. Contrib. Mineral. Petrol. 2000, 140, 263–282. [Google Scholar] [CrossRef]
  14. Nozawa, T.; Ota, R. Geology of the Uchinoura District. Quadrangle Series, 1:50,000. Geol. Surv. Jpn. 1967, 1–37. [Google Scholar]
  15. Aridome, C.; Yamamoto, H. Joint system in the Osumi granodiorite batholith, southern Kyushu, Southwest Japan. J. Geol. Soc. Jpn. 2021, 127, 489–495. [Google Scholar] [CrossRef]
  16. Karakida, Y.; Hayasaka, S.; Hase, Y. (Eds.) Regional Geology of Japan Part 9 Kyushu; Kyoritsu: Shuppan, Tokyo, 1992; p. 371. [Google Scholar]
  17. Oba, N. Petrochemical Study of Osumi Granite, especially its Heterogeneity and Schistose Structure. Misc. Rep. Res. Inst. Nat. Resour. 1961, 54–55, 191–201. [Google Scholar]
  18. Yamamoto, M.; Oba, N. Geology and Rocks of the Takakumayama Granite and Osumi Granodiorite. 90th Annu. Meet. Geol. Soc. Japan Field excursion guide 1983. 61–79.
  19. Hayase, I.; Ishizaka, K. Rb-Sr dating on the rocks in Japan (I), South Western Japan. J. Jpn. Assoc. Mineral. Petrol. Econ. 1967, 58, 201–212. [Google Scholar]
  20. Yanagi, T.; Yamaguchi, M.; Nozawa, T. Sr whole rock ages of the granites of Minami-osumi and Amami-oshima, South-west Japan. Mem. Fac. Sci. Kyushu Univ. Ser. D Geol. 1971, 21, 163–175. [Google Scholar]
  21. Nakazaki, M.; Tsuboi, M.; Kanagawa, K.; Kato, T.; Suzuki, K. Quantitative chemical analysis of rocks with X-ray fluorescence analyzer XRF-1800. Bull. Nagoya Univ. Museum 2004, 20, 79–91. [Google Scholar]
  22. Koga, K.; Tsuboi, M. Petrogenesis of Granitic Rocks in the Hisakajima Island, Goto Archipelago, Southwestern Japan: A Geochemical Study. Minerals 2021, 11, 248. [Google Scholar] [CrossRef]
  23. Kitanaka, R.; Tsuboi, M.; Ozaki, Y. Biogenic apatitein carbonate concretions with and without fossils investigated in situ by micro-Raman spectroscopy. Sci. Rep. 2023, 13, 9714. [Google Scholar] [CrossRef] [PubMed]
  24. Vermeesch, P. A free and open toolbox for geochronology. Geosci. Front. 2018, 9, 1479–1493. [Google Scholar] [CrossRef]
  25. Anders, E.; Grevesse, N. Abundances of the elements: Meteoritic and solar. Geochim. Cosmochim. Acta 1989, 53, 197–214. [Google Scholar] [CrossRef]
  26. Peccerillo, A.; Taylor, S.R. Geochemistry of Eocene Calc Alkaline Volcanic Rocks from Kastamonu Area, Northern Turkey. Contrib. Mineral. Petrol. 1976, 58, 63–81. [Google Scholar] [CrossRef]
  27. Pearce, J.A.; Harris, N.B.W.; Tindle, A.G. Trace Element Discrimination Diagrams for the Tectonic Interpretation of Granitic Rocks. J. Petrol. 1984, 25, 956–983. [Google Scholar] [CrossRef]
  28. Miyashiro, A. Volcanic rock series in island arcs and active continental margins. Am. J. Sci. 1974, 274, 321–355. [Google Scholar] [CrossRef]
  29. Sun, S.S.; McDonough, W.F. Chemical and isotopic systematics of oceanic basalts: Implications for mantle composition and processes. Geol. Soc. Lond. Spec. Publ. 1989, 42, 313–345. [Google Scholar] [CrossRef]
  30. Terakado, Y.; Shimizu, H.; Masuda, A. Nd and Sr isotopic variations in acidic rocks formed under a peculiar tectonic environment in Miocene Southwest Japan. Contrib. Mineral. Petrol. 1988, 99, 1–10. [Google Scholar] [CrossRef]
  31. Kawano, M.; Takahashi, K.; Nozawa, T. Petrochemistry of Minami-osumi granite in the Uchinoura area, Kyushu, Japan. Bull. Geol. Surv. Jpn. 1966, 17, 533–543. [Google Scholar]
  32. Chapell, B.W.; White, A.J.R. Two contrasting granite types: 25 years later. Aust. J. Earth Sci. 2001, 48, 489–499. [Google Scholar] [CrossRef]
  33. Chappell, B.W. Aluminium saturation in I- and S-type granites and the characterization of fractionated haplogranites. Lithos 1999, 46, 535–551. [Google Scholar] [CrossRef]
  34. Ishihara, S. P2O5 contents vs. S, I, A-type granites in Slovakia and Japan. Chishitsu News 2009, 663, 47–55. [Google Scholar]
  35. Nakada, S.; Takahashi, M. Regional variation in chemistry of the Miocene intermediate to felsic magmas in the Outer Zone and the Setouchi Province of Southwest Japan. J. Geol. Soc. Jpn. 1979, 85, 571–582. [Google Scholar] [CrossRef]
  36. Gorai, M. Some problems in the mantle origin hypothesis of calc alkaline magmas. J. Geol. Soc. Jpn. 1970, 76, 529–536. [Google Scholar] [CrossRef]
  37. Rollinson, H. Using Geochemical Data; Longman: Harlow, UK, 1993; p. 352. [Google Scholar]
  38. Ewart, A.; Griffin, W.L. Application of proton-microprobe data to trace element partitioning in volcanic rocks. Chem. Geol. 1994, 117, 251–284. [Google Scholar] [CrossRef]
  39. Ishihara, S.; Chappell, B.W. Chemical compositions of Miocene granitoids of the Okueyama, Hoei mine and Takakumayama granitoids, Outer Zone of SW Japan. Bull. Geol. Surv. Jpn. 2010, 61, 17–38. [Google Scholar] [CrossRef]
  40. Shinjoe, H.; Sumii, T. Whole rock composition of the Miocene granitic rocks in the Satsuma Peninsula, Kagoshima prefecture. J. Humanit. Nat. Sci. 2006, 121, 13–21. [Google Scholar]
  41. Phlipotts, J.A. Redox estimation from a calculation of Eu2+ and Eu3+ concentrations in natural phases. Earth Planet. Sci. Lett. 1970, 9, 257–268. [Google Scholar] [CrossRef]
  42. Moller, P.; Muecke, G.K. Significance of Europium anomalies in silicate melts and crystal-melt equilibria: A re-evaluation. Contrib. Mineral. Petrol. 1984, 87, 242–250. [Google Scholar] [CrossRef]
  43. Horikoshi, E. Tectonics of Granitic Magma and the Related Mineral Deposits. Soc. Min. Geol. Jpn. 1976, 7, 1–14. [Google Scholar]
  44. Kobayashi, Y. Early and Middle Miocene Dike Swarms and Regional Tectonic Stress Field in the Southwest Japan. Volcanol. Soc. Jpn. 1979, 2, 203–212. [Google Scholar]
  45. Nakamura, K.; Uyeda, S. Stress gradient in arc-back arc regions and plate subduction. J. Geophys. Res. 1980, 85, 6419–6428. [Google Scholar] [CrossRef]
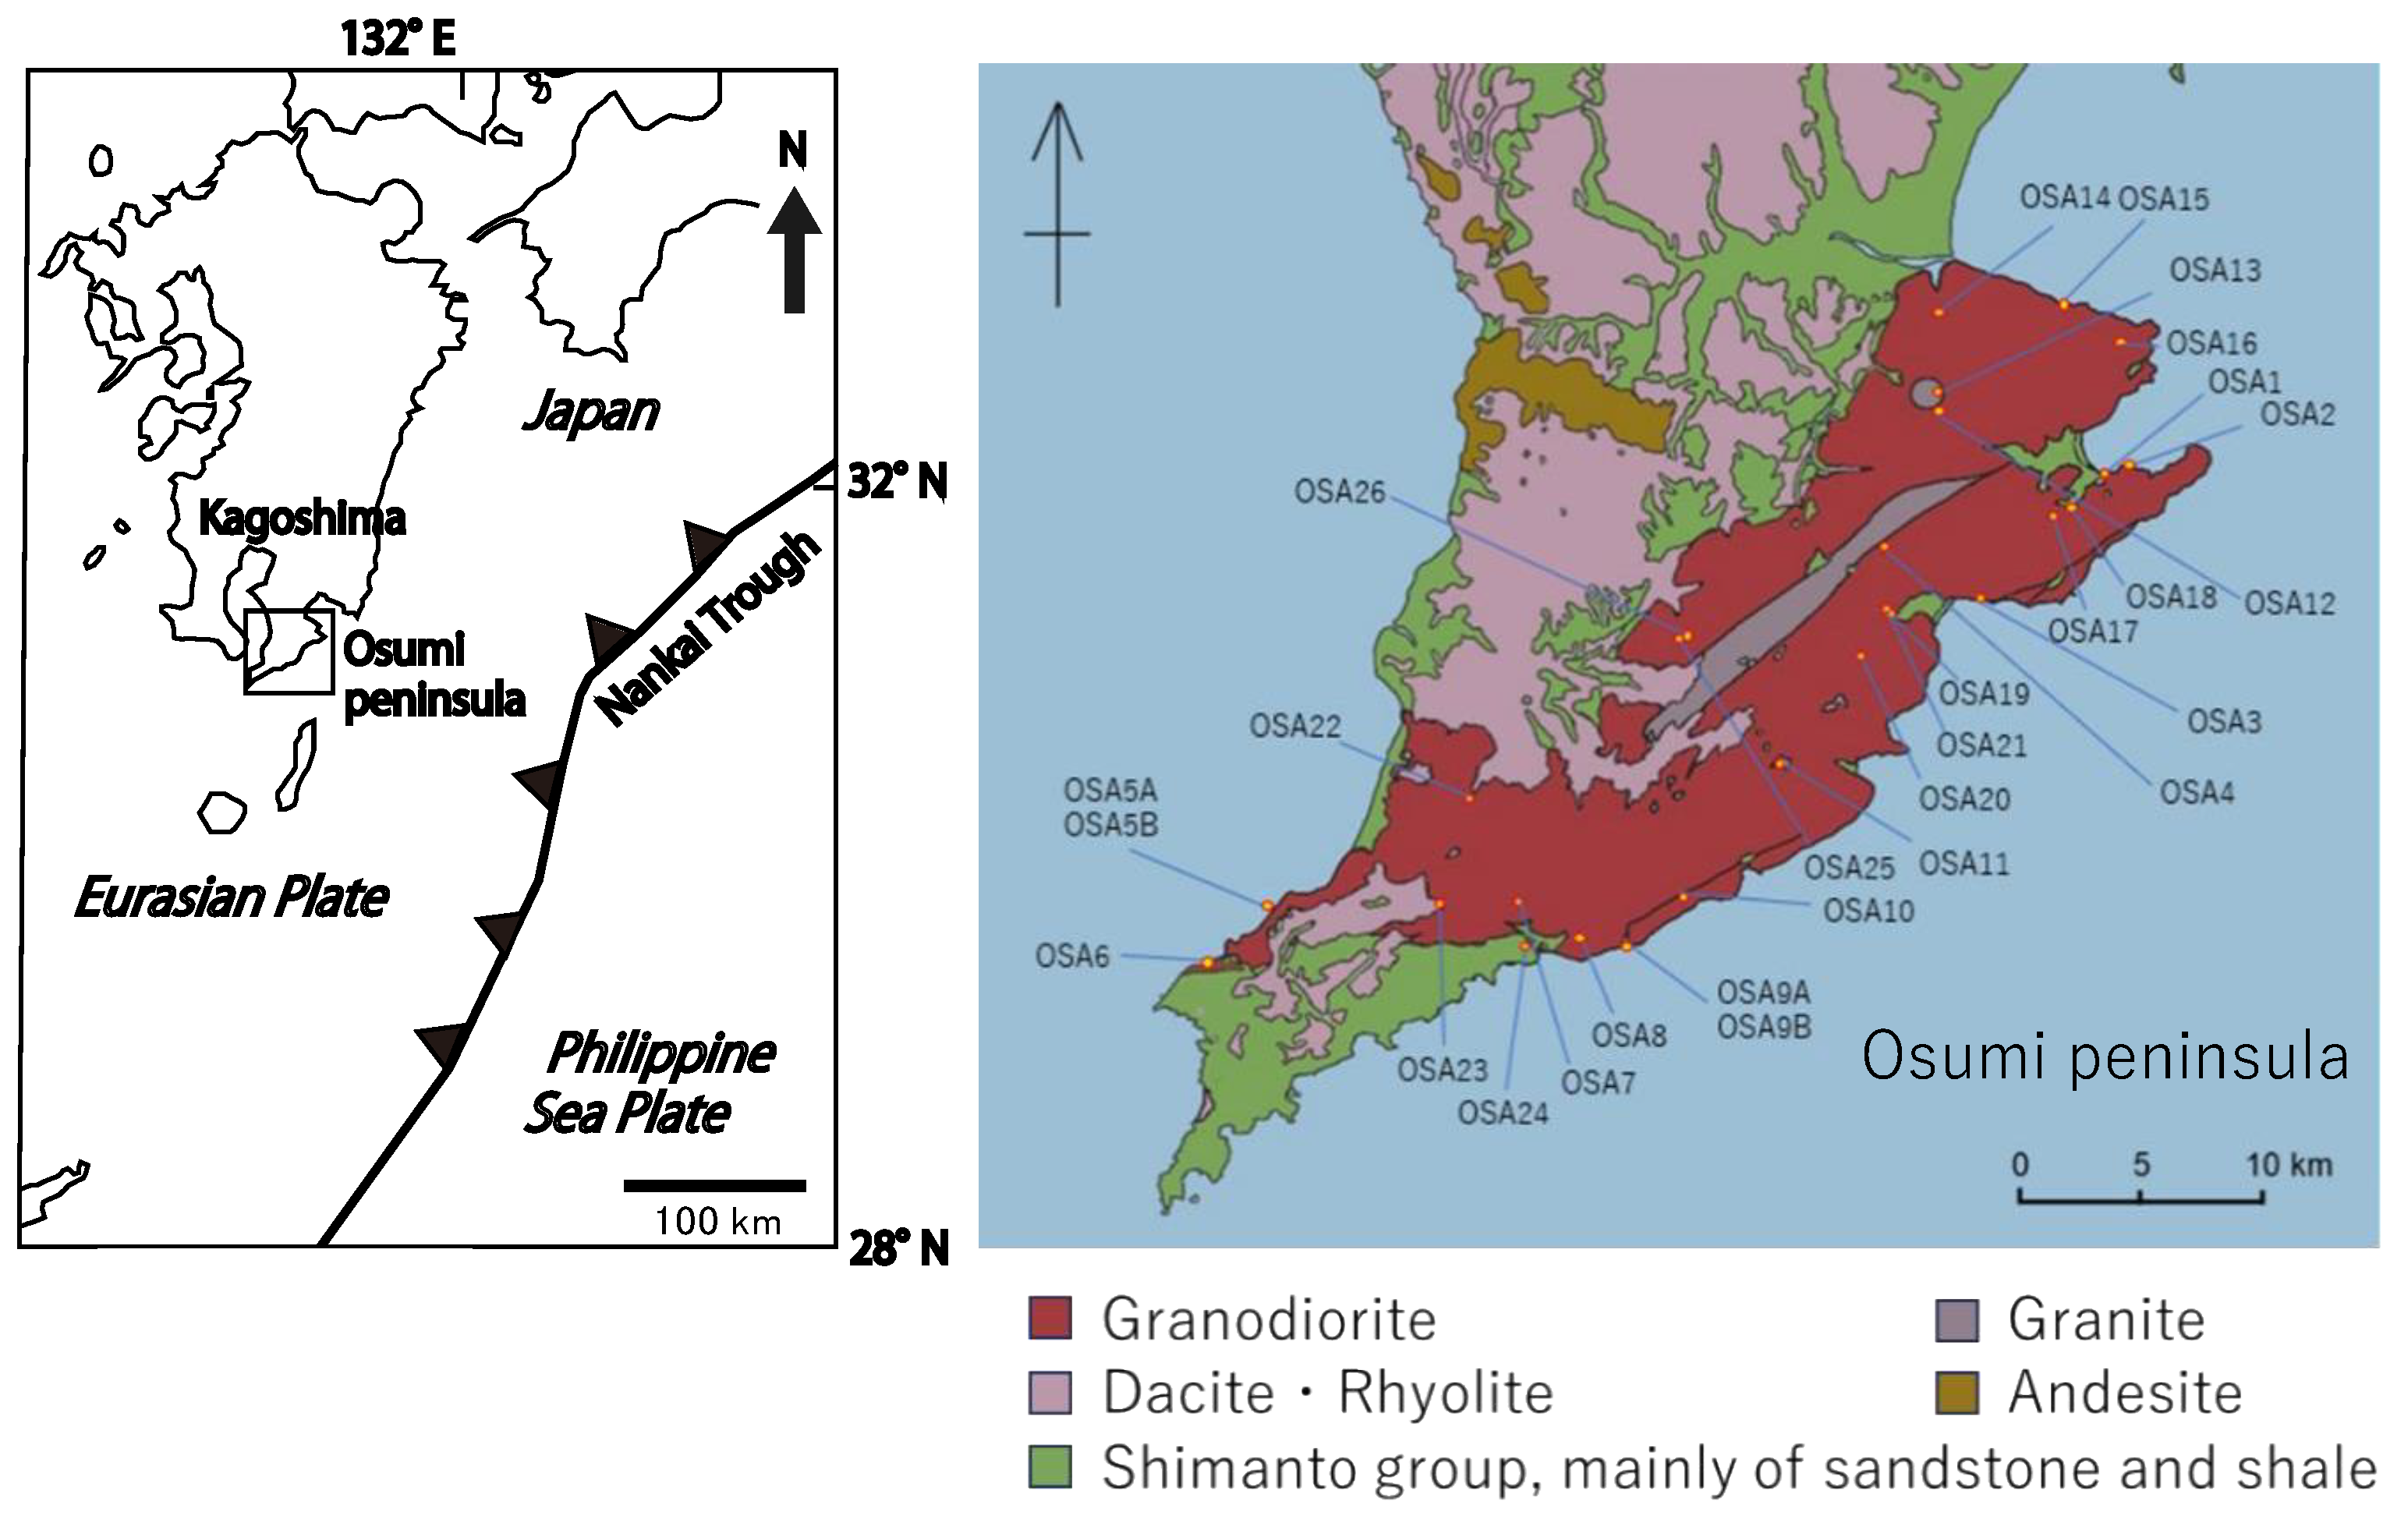
Figure 1. The tectonic setting and geological map around the Osumi Granodiorite [12,13]. Sampling points are shown as yellow circles.
Minerals 14 00680 g001
Figure 2. Hand specimen photographs and photomicrographs of Osumi Granodiorite samples. (a) Hand specimen photographs of granodiorite (OSA26). (b) Photomicrographs of granodiorite. Cross-polarized light. (c) Hand specimen photographs of granite (OSA9A.) (d) Photomicrographs of granite. Cross-polarized light. Qz, quartz; Afs, alkali-feldspar; Amp, amphibole; Pl, plagioclase, Bt, biotite.
Minerals 14 00680 g002
Figure 3. Harker diagrams for major (a) and trace elements (b) of Osumi Granodiorite samples.
Minerals 14 00680 g003aMinerals 14 00680 g003b
Figure 6. (a) Chondrite-normalized REE pattern diagrams for Osumi Granodiorite samples [25]. (b) Eu anomaly versus SiO2 plot [Eu* = (Sm × Gd)^(1/2)]. (c) Spidergram of Osumi Granodiorite samples. (d) CaO versus Eu plot. Red dots indicate granite and black dots granodiorite.
Minerals 14 00680 g006
Figure 7. (a) 87Rb/86Sr versus 87Sr/86Sr diagrams. Red dots (OSA5B: granite, OSA9A: granite and OSA14: granodiorite) are excluded from the isochron. (b) Plot of calculated SrI ratio versus 1000/Sr (T = 14 Ma).
Minerals 14 00680 g007
Figure 8. Distribution of Osumi Granodiorite samples on the AKF diagram [17]. A = Al2O3 − (Na2O + K2O + CaO), K = K2O, F = FeO + MgO + MnO, P: the range of pelitic rocks in Kyushu, Japan, and worldwide, D: the range of diabases [17].
Minerals 14 00680 g008
Table 1. Whole-rock chemical compositions of rocks in the Osumi Granodiorite.
SampleOSA1OSA2OSA3OSA4OSA5AOSA5BOSA6OSA7OSA8OSA9AOSA9BOSA10OSA11OSA12
Fe2O3 (wt.%)3.934.714.054.684.831.614.684.273.701.434.304.385.334.84
MnO0.070.080.060.080.080.020.090.070.060.020.070.080.090.08
TiO20.610.730.680.760.700.210.680.680.570.210.680.720.830.77
CaO2.422.722.933.143.582.013.413.172.690.953.063.113.003.09
K2O4.223.963.893.693.794.733.503.713.975.694.033.783.853.80
P2O50.150.180.150.170.160.040.160.140.130.050.160.160.190.18
SiO270.1069.8769.0766.5567.0374.8268.7168.1069.1376.1768.1268.2466.0967.43
Al2O315.1515.8415.8215.7015.8614.5915.5115.9115.1713.0315.7915.8514.9715.98
MgO1.181.501.551.471.860.451.771.431.190.381.451.451.771.49
Na2O2.952.983.093.142.973.072.983.173.102.663.023.122.913.20
Total100.76102.58101.2999.38100.86101.56101.48100.6699.71100.56100.68100.8999.02100.86
ASI1.101.121.081.061.021.051.041.061.061.061.061.071.041.07
FeO*/MgO3.002.822.352.862.333.232.382.702.793.402.662.712.712.92
Na2O+K2O7.176.946.986.836.767.806.486.887.068.347.056.906.756.99
Th (ppm)19.114.515.413.217.820.712.015.117.121.513.723.813.010.7
Pb30.427.526.425.319.234.517.126.527.234.425.822.727.427.2
Ba565.8547.9576.0526.1545.8345.8445.6575.1507.2588.5588.7564.2556.3543.9
Nb7.99.38.39.88.94.98.77.87.12.48.37.99.39.4
Zr200.9211.9206.7214.5177.683.7174.5191.1182.8113.7204.7211.6229.8231.4
Y28.528.429.830.930.831.231.429.133.331.027.430.531.529.3
Sr142.8157.8179.7166.7204.7126.4195.7167.8146.883.9184.4177.1158.1170.6
Rb180.1190.0178.1179.4168.0147.3164.8172.9199.2181.0153.5183.1194.2176.3
Zn63.276.364.476.561.620.567.967.757.624.067.066.076.574.5
Cu15.615.014.013.814.913.32.38.615.22.06.512.925.521.0
Ni9.910.111.69.89.35.09.79.69.55.68.710.611.912.3
Co14.919.215.420.120.24.520.016.215.04.415.919.325.019.7
Cr30.430.926.222.731.77.631.026.124.13.018.017.624.722.0
V33.840.940.640.554.621.357.138.436.614.836.538.942.640.1
Y+Nb36.437.738.140.639.736.140.136.840.533.335.738.440.838.7
SampleOSA13OSA14OSA15OSA16OSA17OSA18OSA19OSA20OSA21OSA22OSA23OSA24OSA25OSA26
Fe2O3 (wt.%)2.014.704.394.394.264.393.764.004.813.763.604.924.134.10
MnO0.040.080.080.080.070.080.060.070.090.070.060.060.070.07
TiO20.320.740.660.660.690.710.620.640.790.620.590.750.670.66
CaO0.832.832.752.842.842.972.752.243.332.722.120.702.873.19
K2O5.063.744.063.763.863.753.864.013.494.133.702.923.993.69
P2O50.070.180.170.180.150.160.140.140.180.120.130.100.150.15
SiO275.3367.3667.7567.9968.5566.2568.6770.2766.3767.9567.8369.8366.0565.34
Al2O314.2915.4815.4515.2015.4115.4215.1716.0816.2914.9515.3016.0115.1115.31
MgO0.481.521.271.211.381.491.231.321.531.381.151.861.281.37
Na2O2.612.942.932.993.023.283.002.933.212.933.061.783.053.27
Total101.0399.5899.5299.29100.2398.5199.27101.69100.0898.6497.5598.9397.3897.16
ASI1.271.101.091.071.081.041.071.211.081.051.192.171.041.01
FeO*/MgO3.732.793.123.262.782.662.742.732.822.442.812.392.902.69
Na2O+K2O7.666.686.996.756.887.036.876.946.707.076.774.717.046.96
Th (ppm)15.314.012.713.711.713.015.312.515.321.614.812.012.912.7
Pb32.727.430.828.924.225.128.528.225.420.822.428.624.323.8
Ba488.4563.0555.8546.8577.1523.1529.2559.7640.4707.0560.1591.7609.1518.5
Nb4.99.79.09.47.77.77.57.79.87.07.110.18.47.9
Zr116.3240.4229.5237.1188.1213.6199.1201.2238.3175.7170.9184.4207.8224.1
Y36.129.828.929.827.834.632.331.628.935.428.125.533.532.8
Sr63.5169.0166.4174.3160.4175.2156.2155.3208.3165.5152.9134.8173.8176.3
Rb236.3184.1178.6177.8164.6184.1179.9189.1172.9198.0133.4145.6185.3177.5
Zn39.278.875.673.665.568.261.265.478.357.153.197.562.063.6
Cu3.412.112.613.522.313.012.712.91.64.03.929.715.111.9
Ni6.112.610.210.110.610.09.19.911.010.38.617.99.810.2
Co6.919.917.318.416.518.314.416.619.815.711.818.716.016.4
Cr4.645.616.014.719.218.418.719.723.525.717.676.515.419.4
V20.944.935.735.237.437.736.938.743.345.336.889.937.038.5
Y+Nb41.039.637.939.235.542.339.739.338.642.435.335.641.940.7
Note: *: Total Fe as Fe2O3. ASI: molar Al2O3/(Na2O + K2O + CaO).
Table 2. REE compositions of Osumi Granodiorite samples.
SampleOSA1OSA2OSA3OSA4OSA5AOSA5BOSA6OSA7OSA8OSA9AOSA9BOSA10OSA11OSA12
La (ppm)8.568.019.239.649.808.098.2510.999.3711.8210.539.938.909.15
Ce17.0615.5017.9918.6718.7915.7216.3320.8418.2222.9720.0919.2717.3017.59
Pr1.781.601.871.951.901.601.772.111.892.332.061.991.811.82
Nd7.446.777.768.127.846.417.758.697.849.398.688.397.527.55
Pm
Sm1.651.401.641.741.651.341.851.731.711.801.761.781.641.61
Eu0.240.250.250.290.290.180.300.300.260.160.310.310.250.28
Gd1.170.941.121.181.220.921.451.121.251.131.191.211.191.18
Tb0.200.170.210.230.220.190.280.200.230.220.220.220.210.20
Dy1.171.041.231.391.351.191.711.241.461.331.331.361.321.23
Ho0.230.210.250.280.280.250.350.260.300.270.270.280.270.25
Er0.600.590.690.770.800.740.970.700.820.750.750.780.750.71
Tm0.090.090.100.110.120.120.140.100.120.110.110.110.110.10
Yb0.550.560.650.710.810.760.890.640.770.700.690.730.720.63
Lu0.080.090.090.110.120.120.130.100.120.100.100.100.100.09
LaCN36.4934.1539.3241.0741.7434.4535.1546.8139.9250.3544.8642.2937.9138.97
Ce28.2925.7029.8230.9631.1526.0727.0834.5430.2138.0833.3131.9428.6729.16
Pr20.0217.9121.0321.8421.3317.9619.8623.7221.1626.1823.1522.3320.2620.48
Nd16.4414.9717.1517.9617.3414.1717.1419.2117.3220.7519.1818.5416.6316.70
Pm
Sm11.239.5411.1311.8211.199.1112.5911.7411.6312.2311.9712.0911.1610.93
Eu4.264.394.535.165.153.255.435.294.632.815.605.574.384.99
Gd5.964.775.686.036.204.687.385.686.345.756.076.146.036.01
Tb5.444.605.676.226.035.107.605.606.436.025.966.135.875.54
Dy4.804.285.055.725.574.907.065.136.015.495.485.615.445.09
Ho4.093.854.505.045.044.446.284.635.324.804.835.034.904.49
Er3.773.714.364.845.024.696.094.405.174.714.754.894.734.44
Tm3.703.744.274.745.074.935.814.305.144.544.614.694.614.30
Yb3.403.424.004.404.964.685.453.954.744.314.234.514.413.90
Lu3.473.653.854.354.944.805.194.074.804.244.194.304.263.90
Eu/Eu*0.520.650.570.610.620.500.570.650.540.340.660.650.540.62
sampleOSA13OSA14OSA15OSA16OSA17OSA18OSA19OSA20OSA21OSA22OSA23OSA24OSA25OSA26
La (ppm)6.6714.5815.2510.0710.734.8510.646.267.1016.526.666.995.059.79
Ce13.2028.1929.5820.5620.7110.3720.7113.2014.5132.7513.2014.0410.7418.78
Pr1.402.852.982.162.181.132.121.431.543.411.401.431.191.92
Nd5.7312.1912.729.509.495.099.076.526.8514.696.105.875.448.29
Pm
Sm1.322.532.592.031.971.181.901.441.433.011.281.111.271.67
Eu0.150.400.450.330.310.180.300.240.270.300.210.190.200.27
Gd1.091.671.701.371.270.901.220.961.031.760.810.690.801.10
Tb0.200.300.310.250.270.170.260.200.180.350.160.130.180.22
Dy1.291.811.811.451.571.031.561.181.082.010.960.851.041.35
Ho0.260.370.360.280.320.220.320.250.220.400.200.180.220.28
Er0.771.020.990.770.930.630.880.690.631.110.560.520.630.79
Tm0.110.140.140.110.130.090.120.090.090.160.080.080.090.12
Yb0.710.960.930.760.830.620.830.660.591.020.510.550.620.75
Lu0.100.140.130.110.120.090.120.100.090.150.070.080.090.10
LaCN28.4162.1164.9642.9245.7020.6845.3526.6930.2470.4028.3629.7921.5241.72
Ce21.8846.7349.0434.0934.3417.1934.3421.8824.0554.2921.8923.2717.8131.13
Pr15.7531.9733.4624.2624.4812.7423.8116.0217.2938.2815.7216.0213.3421.51
Nd12.6626.9428.1221.0020.9911.2520.0414.4115.1532.4713.4812.9812.0218.32
Pm
Sm8.9617.1717.6013.7913.368.0312.959.789.6920.438.697.578.6111.38
Eu2.657.078.025.975.563.225.284.214.855.293.833.473.594.83
Gd5.558.498.626.976.484.606.214.885.238.934.123.534.095.58
Tb5.458.298.446.857.424.667.115.454.909.644.383.645.036.17
Dy5.317.467.465.966.474.266.424.864.458.273.973.514.305.56
Ho4.736.586.535.075.693.895.684.443.937.153.543.213.965.08
Er4.856.456.244.865.833.975.544.333.996.973.523.263.964.96
Tm4.685.965.914.675.493.805.093.813.676.733.193.233.694.89
Yb4.375.945.714.675.083.825.084.083.656.293.173.363.824.63
Lu4.185.675.524.364.863.814.804.143.516.043.073.203.644.28
Eu/Eu*0.380.590.650.610.600.530.590.610.680.390.640.670.610.61
Note: CN: normalized by CI chondrite [25].
Table 3. Sr isotopic compositions of Osumi Granodiorite samples.
SampleRb (ppm)Sr (ppm)87Rb/86Sr87Sr/86SrSrI (14 Ma)
OSA3178.1179.72.870.708880.7083
OSA5A168.0204.72.370.708750.7083
OSA5B147.3126.43.370.709920.7092
OSA6164.8195.72.440.708750.7083
OSA7172.9167.82.980.709030.7084
OSA8199.2146.83.930.710130.7093
OSA9A181.083.96.250.715210.7140
OSA9B153.5184.42.410.708790.7083
OSA12176.3170.62.990.709210.7086
OSA14184.1169.03.150.709750.7091
OSA22198.0165.53.460.709710.7090
OSA26177.5176.32.910.709010.7084
Sedimentary rocks *
Omine-7153.0124.03.570.712580.7119
Omine-1176.4169.01.310.710810.7105
Wada-2113.0113.02.900.715570.7150
Wada-453.0119.01.290.710850.7106
Miyazaki-5165.0119.04.010.715080.7143
Calculated at 14 Ma, * data of the sedimentary rocks are from Terakado (1988) [30].
Disclaimer/Publisher’s Note: The statements, opinions and data contained in all publications are solely those of the individual author(s) and contributor(s) and not of MDPI and/or the editor(s). MDPI and/or the editor(s) disclaim responsibility for any injury to people or property resulting from any ideas, methods, instructions or products referred to in the content.