Abstract
Cement production may involve excessive use of natural resources and have negative environmental impacts, as energy consumption and CO2 emissions can cause air pollution and climate change. Cement kiln dust (CKD), a by-product waste material, is also a primary issue associated with cement production. Utilizing CKD in mining applications is a pathway to eco-sustainable solutions. Cemented paste backfill (CPB) made with mine tailings is an efficient method for void backfilling in underground mines. Therefore, this study investigated the eco-sustainable utilization of CKD as a co-binder material that can partially replace cement in CPB prepared with copper tailings. At 7, 14, 28, 56, and 90-day curing times, the experimental campaign measured the physical and mechanical parameters of the cured CPB samples, including density, UCS, and elastic modulus (stiffness). Additionally, the CPB-cured mixes were analyzed using XRF, X-ray XRD, SEM, and EDX techniques to link the mineral phases and microstructure to mechanical performance. Four proportions (5, 10, 15, and 20%) of CKD represented in 75 samples were prepared to replace ordinary Portland cement (OPC) in the CPB mixtures, in addition to the reference mix (control) with 0% CKD. As all combinations exceed the compressive strength of CPB required for achieving stability in underground mines, the results showed that CKD could be utilized advantageously as a partial substitute for OPC with a proportion of up to 20% in the CPB mixture. When tested after 90 days, the combination modified with 5% CKD exhibited comparatively higher compressive strength than the control mixture.
1. Introduction
Despite recent technological advancements, cement production has remained one of the world’s key industries for decades. Cement remains the principal binder material in construction projects like buildings, roads, dams, etc., and a critical component in many industrial applications. Global cement production has expanded to more than 4 trillion metric tons from 3.7 trillion in the last six years [1]. Despite the increasing demand for global cement production, cement manufacturing directly overconsumes nonrenewable natural resources, where about 1.5–1.7 tons of basic materials are needed to manufacture one ton of clinker [2]. Moreover, CKD and carbon dioxide (CO2) are by-products that are generated while producing the clinker and they adversely impact the environment.
CKD is a fine-grained material obtained from a dust-collecting system under high temperatures [3]. CKD could include raw and calcined materials with few clinker-related particles [4,5,6]. The amount of CKD material generated ranges from 15 to 20% of the total manufactured clinker [7,8,9]. Unfortunately, to preserve the chemical composition of the finished product, only a tiny percentage of these amounts can be recycled once more in the cement industry. The rest, on the other hand, are taken to landfills, raising concerns about the operating costs and the harm to the air and groundwater in the surrounding area, which contradicts the sustainability goals [10].
Researchers have made numerous attempts because CKD material possesses chemical and physical characteristics that make it practical for various industrial applications [1]. Moreover, the Environmental Protection Agency (EPA), US, reported that no negative impacts on the environment or human health are associated with using CKD in industrial applications [6]. Therefore, various investigations have been conducted for utilizing CKD waste, contributing to reducing its associated economic and environmental negative impacts [11,12,13,14,15,16,17].
In many studies, CKD has been introduced as an economical solution for soil stabilization purposes. For example, Ghorab et al. used CKD to produce building units and road paving [18], Sreekrish et al. used it to treat soil [19], Moon et al. used it to assess the solidification and stability of polluted soil [20], Carlson et al. used it to enhance soil engineering properties [21], Ebrahimi et al. used it to enhance the stiffness of soil [22], Albusoda and Salem used it for dune sand stabilization [23], Okafor and Egbe used it for sub-grade material improvement [24], Gupta et al. used it in regard to inactivating the heavy metal present in contaminated soil [25], Arulrajah et al. used it for aggregate stabilization [26], Mohammadinia et al. used it to enhance the aggregate’s stiffness and strength [27], and Ekpo et al. used it to optimize the plasticity of the tropical soil [28].
In various areas, CKD has also been successfully used as a replacement for cement at different percentages (5%–50%): concrete and mortar [29], concrete production [30], mortar and concrete [31], self-consolidating concrete [32], Concrete [33], concrete paving blocks [34], lightweight concrete [35], and green concrete [36].
Likewise, CKD has been beneficially used in the ceramic and brick industry as a cementitious material in many portions (2%–50%): ceramic wall tile production [37], wollastonite ceramics [38], cement bricks [39], red clay brick manufacturing [40], bricks production [41], unfired building brick [42], and pressed building bricks production [43].
The local CKD generated in Saudi Arabia was utilized by many researchers for different uses: treating problematic soil [44], cement blends modification [45], some cement products [46], soil stabilization [47], concrete cement production [48], underneath road stabilization [49], improving sabkha soil geotechnical properties [50], and recently producing plain concrete and cement blocks [51]. However, attempts have not been made to investigate recycling CKD in the mining industry.
For hundreds of years, mining has been considered one of the largest sectors and is still playing a significant role in the economies of many countries worldwide due to the heavy dependency of various industries on mined minerals [52,53]. Globally, mining operations excavate a million tons of materials from the surface and underground mines, leading to a large volume of ground voids that can negatively impact production, safety, and the environment. In underground mining, extracting valuable minerals can create different hazardous shapes of openings such as stopes, rooms, caves, etc. [54]. Therefore, many efforts have been made through the historical development of mining to generate ground support and maintain stability using backfill [55].
Cemented paste backfill (CPB) is a relatively new method used in modern mines for backfilling in developed countries, designed with mining mill tailing materials, a small proportion of binders, and water [56]. However, the cost of cemented paste backfill (CPB) significantly impacts underground mining operations. It takes 10 to 20% of the gross operating cost. At the same time, the binder (cement) alone costs around 75% of the CPB [57]. Regarding the binder cost reduction, which may reach 180 USD/t in some cases, Ordinary Portland cement (OPC) can be partially substituted by supplementary cementitious by-product materials such as CKD to save 10%–37% of the binder cost [58]. In cemented paste backfill technology, CKD has been utilized as a partial substitute for cement [59]; another study also used it for the same purpose [60].
In the same context, this research aimed to utilize CKD as a partial substitute for OPC with percentages of 5, 10, 15, and 20% in CPB made with copper tailings. Accordingly, seventy-five cylindrical samples with various ingredients were prepared to represent five mixtures according to the recognized international standards procedures to examine, analyze, compare, and evaluate their properties at different curing times.
2. Materials and Methods
2.1. Raw Materials
In this research, the raw materials, CKD and copper tailings (coarse and fine), were collected from Yanbu Cement Company (YCC), Yanbu, Saudi Arabia, and Maaden Barrick Copper Company (Maaden), Madinah, Saudi Arabia. Both locations of collected materials are in the western region of Saudi Arabia. The Type 1 OPC was utilized as the main binder in CPB that provides cementitious properties for backfilling applications in underground mines [61]. The used OPC was produced locally with specifications according to ASTM C150-07 and Saudi Standards: SASO-GSO 1914/2009(E) [62]. Tap water with a pH of 7.5 was used to ensure the proper hydration process of cement through a chemical reaction after being mixed.
2.1.1. Water Analysis
Based on the many physical and chemical specifications, the water utilized in this study was evaluated to determine its quality [63]. The water analysis was conducted locally in a certified laboratory following recognized procedures such as the Standard Method for the Examination of Water and Wastewater, Water Environment Federation (WEF), and Environmental Protection Agency Method (EPA), USA. Tap water analysis is summarized in Table 1.

Table 1.
The physical and chemical parameters of the mixing water used in the experimental investigation.
2.1.2. Chemical Composition
The X-ray fluorescence (XRF) technique was applied to characterize and analyze the chemical compositions of CKD, OPC, and two types of copper tailings (fine and coarse). According to the XRF data, the main components of the CKD material are SiO2, CaO, SO3, Na2O, Cl, and free lime (F-Cao). SiO2, Al2O3, Fe2O3, CaO, MgO, and SO3 could be considered the significant contents of copper tailings. The major components of OPC are CaO and SiO2, as shown in Table 2.
Table 2.
The chemical compositions of CKD, tailing materials, and cement using XRF analysis.
2.1.3. XRD Analysis
Figure 1a–d show the mineral phases of raw materials used in preparing the mixtures investigated in this study. According to the XRD analysis, Portlandite and larnite are the main phase peaks in the CKD sample. Meanwhile, fine copper tailing showed chlorite, silica (SiO2), and pyrite (FeS2) as the primary phases. Silica (SiO2) and calcite (CaCO₃) were the main phases of the coarse tailing sample. At the same time, alite and larnite were identified in the cement (OPC).
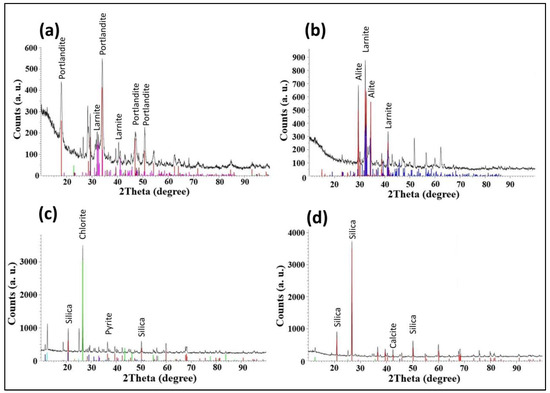
Figure 1.
Different peaks of the detected primary mineral phases: (a) CKD; (b) OPC; (c) fine tailing; (d) coarse tailing.
2.1.4. Particle Size Distribution
The chemical composition and particle size distribution of raw materials significantly impacted the strength of the prepared samples of CPB [64]. This study used the particle size analyzer, model MASTERSIZER 3000, to achieve an accurate size distribution of the collected powder materials based on laser diffraction technology. The results showed that most CKD particle sizes were below 35 μm. At the same time, most tailings were below 20 μm and 250 μm for fine and coarse materials, respectively. Meanwhile, the particle size of OPC material was between 1 and 80 μm, as shown in Figure 2.
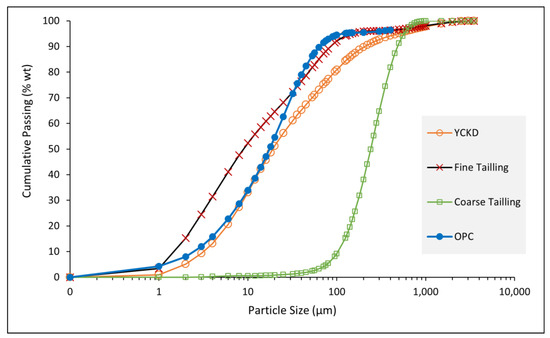
Figure 2.
Particle size distribution of CKD, tailing materials, and cement (OPC).
2.1.5. Specific Surface Area
The specific surface area of materials is a vital engineering parameter and significantly impacts the physical properties, such as strength [61]. The air-permeability apparatus was adjusted and applied to determine the fineness of powder materials for this study, according to ASTM C 204 [65]. Compared to coarse tailing, which had a specific area of 139 m2/kg, fine tailing had a greater specific area of 540 m2/kg, demonstrating the high fineness of the particles. At the same time, CKD exhibited values of 192 and 366 m2/kg achieved by CKD material and OPC, respectively (Table 3).
Table 3.
The bulk density, specific surface area, and moisture content of raw materials.
2.1.6. Bulk Density
The mass of powder material per unit volume is indicated by bulk density. According to ASTM D7481-18, the procedure of pouring bulk-density material into a graduated cylinder was utilized to calculate the bulk density of the powder materials [66]. The findings showed that coarse tailing has a greater bulk density (1690 kg/m3) than fine tailing, CKD materials, and OPC, with values of 1690, 620, and 1480 kg/m3, respectively (Table 3).
2.1.7. Moisture Content
Moisture content is a significant factor that may affect the engineering properties of materials, and it should be monitored and determined in the geotechnical field as a primary step before conducting the experimental work [67]. Moreover, moisture content should be carefully considered before mixing the raw materials to maintain the percentage of mixing water. The samples were dried in a laboratory oven for 24 h, following [68], to determine the water content of the investigated materials. Tailing materials showed higher moisture content, with percentages ranging from 17.26 to 17.70%, compared to CKD and OPC (Table 3).
2.1.8. Scanning Electron Microscopy Analysis
One powerful technique for studying surface topography is scanning electron microscopy (SEM), which employs a focused electron beam to produce images at various magnifications. CKD material was subjected to the SEM technique to investigate the shape and size of the particle. The analysis used (SEM; model JSM-7600F, JOEL, Tokyo, Japan; SEM; at various magnifications) (Figure 3).
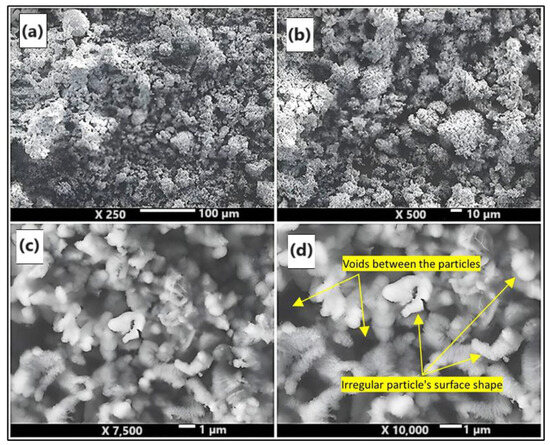
Figure 3.
SEM micrographs showing the size and shape of CKD material particles at different magnifications: ×250 (a); ×500 (b); ×7500 (c), and ×10,000 (d).
2.2. Sample Preparation
2.2.1. Mixture Design
The CPB mixtures were designed based on the water, binder, and tailing proportions according to Equations (1)–(3)
MW, MB, and MT denote the mass of water, binder, and tailings.
Accordingly, the CPB recipes were designed involving five mixtures represented in seventy-five samples, with different proportions for the binder (ordinary Portland cement) and the partial replacement (cement kiln dust), starting from 9.24 to 7.39% for OPC and from 0 to 1.85% for CKD. OPC was gradually replaced by CKD in percentages of 5, 10, 15, and 20% in order to pay more attention to the impact of utilizing this material in CPB applications and to maintain the chemical and mechanical properties of the investigated cured mixtures. At the same time, the proportions of water and tailing were fixed at 23 and 67.76%, respectively, as shown in Table 4. This study considered a recipe with 9.24% OPC and 0% CKD as a control mixture (reference).
Table 4.
Recipe ingredients of CPB and prepared sample count over the curing periods.
For quality control, a set that included three samples for all mixtures was prepared; each was tested three times over each curing period, and the calculated average of the three tested samples was then considered.
2.2.2. Sample Preparation
The ASTM C31-compliant concrete mixing and casting lab received the required ingredients after they were gathered, weighed using a digital balance, and transported. Then, a handled cement mixer was used for 10 min to combine the entire mixture recipe in the prescribed proportion, creating a homogeneous paste [69]. A cylindrical mold sized 100 × 50 mm was filled with the paste. At 7, 14, 28, 56, and 90 days, all prepared samples (15 samples of each recipe) were cured at room temperature (Figure 4a). Before the experimental test, the samples were finished at the bottom and top using a surface grinder (Figure 4b).
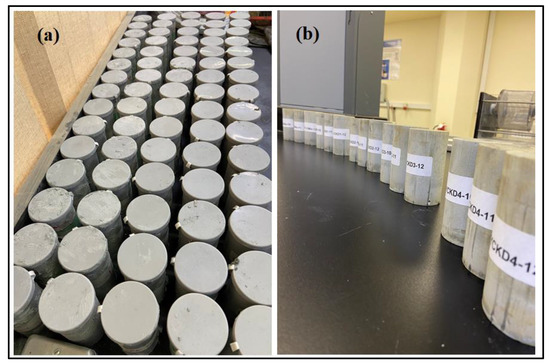
Figure 4.
Preparation of CPB samples: (a) seventy-five prepared samples in the molds during curing time; (b) surface-finished cylindrical CPB samples.
2.3. Experimental Methods
2.3.1. Density
The cured specimen’s compressive strength and elastic modulus might change depending on their density; higher strengths are linked to denser materials that have less porosity and voids [70]. Moreover, it is important to investigate the effects of adding fine-grained cement kiln dust on the density of cured cemented paste backfill samples. To carry out the experimental test following ASTM C642-97, it is necessary first to determine the density of the cured samples at room temperature for each curing time to ensure no adverse effects on the obtained results [71].
2.3.2. Uniaxial Compressive Strength (UCS) Test
After each cured specimen was pushed out of the cylindrical mold utilizing air pressure injected through a predrilled hole at the bottom of the mold [72]. The heights and diameters of the samples were measured to make sure that they complied with ASTM D2166’s recommended range of 2 to 2.5 [73]. An unconfined compression tester with a load capacity of up to 100 kN, manufactured by ELE International Company in the UK, was used to conduct the UCS test. The specimen was loaded at 1.25 mm/min until compressive failure was reached. The stress–strain curve was also plotted using measurements of axial deformation.
2.3.3. Elastic Modulus
The elastic modulus (Young’s modulus) measures stiffness, reflecting the material’s resistance to deformation. The elastic modulus was determined by calculating the slope of the stress–strain curve at the straight line (Equation (4)).
2.3.4. Slump Test
The slump test was applied to assess the flowability or rheology of the modified mixtures with CKD. It is a simple and speedy technique that can mirror the consistency of the produced paste. The paste flow is a significant parameter and can affect the pipeline operation while transporting the material through the cemented paste backfill system. This test involved a 77 mm long and 77 mm diameter ASTM cylinder-shaped metallic mold provided by Paterson and Cooke, South Africa. Accordingly, four mixtures were subjected to the slump tests (0, 5, 10, and 15% CKD). The paste was gradually filled into the metallic cylinder and each layer was packed separately. The metallic mold was then carefully removed in the vertical direction. The measured distance by which the paste sloughed from its initial shape was used to evaluate the subsidence, as shown in Figure 5.
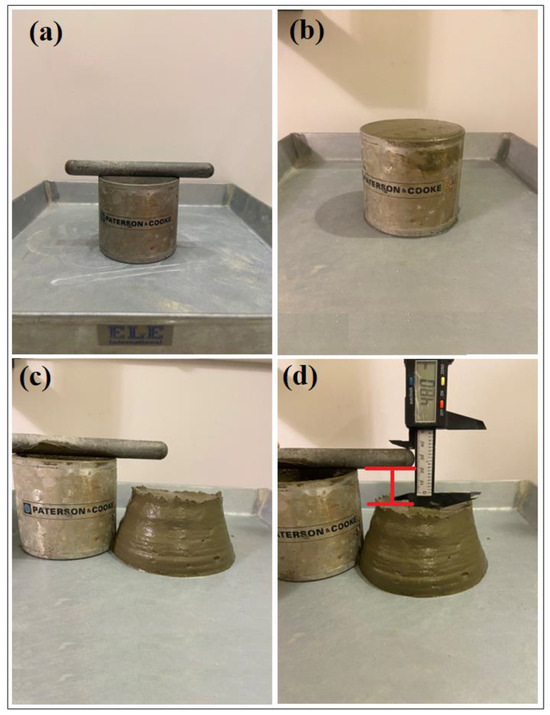
Figure 5.
Paste slump test: (a) slump test tools include a tamping rod, metallic mold, and metallic steel plate; (b) paste poured and leveled into the iron cylinder; (c) paste after removing the mold; (d) measured distance that the paste sloughed from its original shape.
2.3.5. Microscopic and Spectroscopic Investigations
Three CPB samples, each representing a different recipe, were subjected to microscopic investigations at 90 days: a cemented paste backfill (CPB) without cement replacement by cement kiln dust (CKD), a CPB with 5% CKD replacement of cement, and a CPB with 20% CKD replacement of cement. The samples were labeled M-14 (0% CKD), 1–14 (5% CKD), and 4–14 (20% CKD).
(EDX; Oxford Instruments, Abington, Oxfordshire, UK) and (SEM; model JSM-7600F, JOEL, Tokyo, Japan) were used to analyze the elemental compositions and microstructures of the CPB-cured samples [74]. Fourier transform infrared (FTIR; Nicolet iS50, Thermo Scientific, Waltham, MA, USA) spectroscopy and X-ray diffractometer (Regaku, Ultima IV, Tokyo, Japan) were also employed to investigate the different peaks of mineral phases.
3. Results and Discussions
3.1. Density
Density results for the cured cemented paste backfill samples showed a relative increase in the density value of the specimens containing cement kiln dust material (CKD) in the mixture at seven days into the curing period, where the control sample (0% CKD) exhibited a density average of 2.044 g/cm3 compared to 2.067, 2.058, 2.070, and 2.081 g/cm3 for samples that replaced cement with 5, 10, and 15% CKD, respectively (Figure 6a), demonstrating that the denser samples are related to mixtures modified with CKD material. While at 14 days into the curing period, the average density of samples mixed with 15% CKD exhibited a higher density with a value of 2.77 g/cm3 compared to others, including the control sample (0% CKD), which gained only 2.063 g/cm3 (Figure 6b). Also, at a curing period of 28 days, samples prepared with 15% CKD as a partial replacement for cement achieved an average density of 2.054 g/cm3, higher than all sample mixtures utilizing CKD, even the control mix (0% CKD), which showed an average density of 2.026 g/cm3 (Figure 6c). Specimens of 10% CKD achieved the highest average density in the mixtures using CKD, with an average of 2.075 g/cm3 at 56 days into the curing period; meanwhile, the control mix’s average density was 2.047 g/cm3 (Figure 6d).
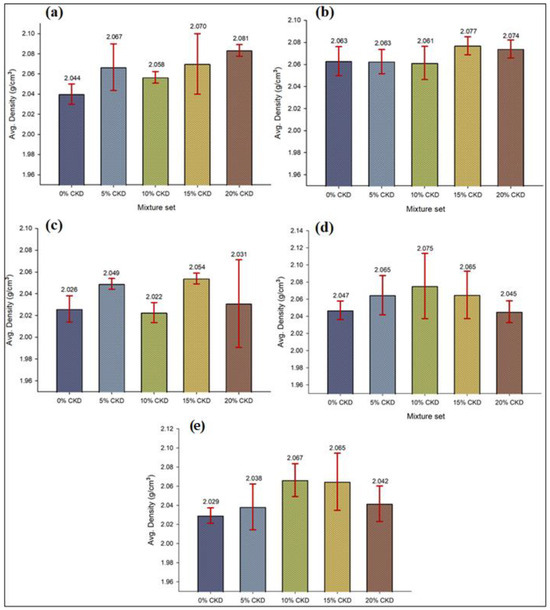
Figure 6.
The average density of CPB samples with error bars showing different CKD proportions at various curing periods: (a) 7 days; (b) 14 days; (c) 28 days; (d) 56 days; and (e) 90 days.
During the long-term curing period (90 days), The control samples (reference) recorded a significant decrease in the average density, as they achieved 2.029 g/cm3 as the lowest value compared to the rest of the mixtures that used CKD as a partial replacement binder for cement (Figure 6f). The increase in the density of the mixes that utilized cement kiln dust in their ingredients can be attributed to the chemical and physical properties of this fine-grained material (the fine particles can fill the cured CPB’s tiny pores and then form a denser microstructure upon hydration). The same outcomes were also obtained after adding CKD to improve the durability and mechanical properties of the copper tailings in the geopolymer brick industry [75]. Statistically, the obtained average density for each mixture showed almost limited variations in the datasets, reflecting the level of confidence and precision, represented graphically by error bars in the graphs (see Figure 6a–e).
3.2. Uniaxial Compressive Strength (UCS)
Figure 7 and Figure 8 illustrate the results from the UCS tests, which indicate a significant increase in the compressive strength of all prepared cemented paste backfill mixtures over curing periods up to 90 days [60,61]. These results exceeded the minimum required USC strength in the mine stope stability, which ranged from 700 to 2000 kPa at 28 days into the curing period [61,76]. At an early curing period (7 days), the control mix (OPC-CMIX) achieved a relatively higher compressive strength with a value of 1.037 MPa compared to 1.021 (−1.5%), 0.854 (−17.6%), 0.885 (−14.6%), and 0.686 (−33.8%) MPa achieved by mixtures with 5, 10, 15, and 20% cement replaced by CKD, respectively. This is due to the chemical bonds the Portland cement compounds formed immediately upon hydration, which helped create early high strength in the cured samples [60].
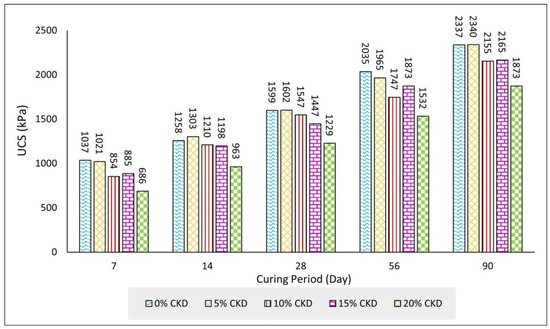
Figure 7.
The increase in the obtained compressive strength of the CPB mixtures prepared with different proportions of CKD over the curing period.
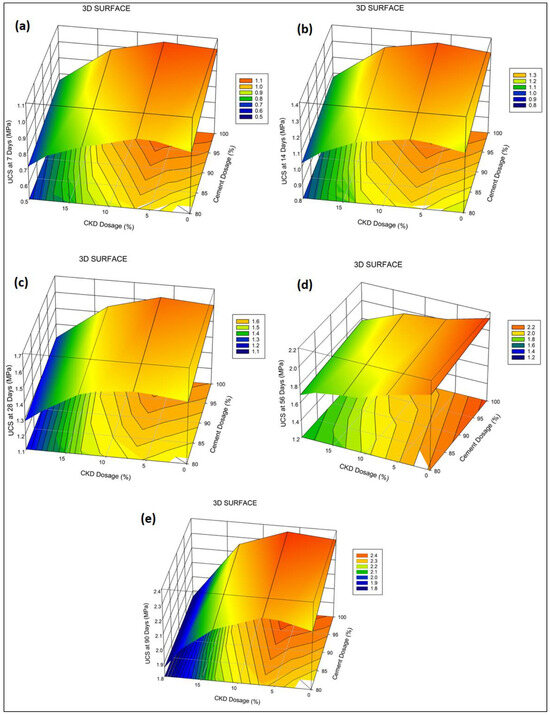
Figure 8.
The 3D surfaces of the compressive strength of CPB mixtures at various curing periods: (a) 7 days; (b) 14 days; (c) 28 days; (d) 56 days; (e) 90 days.
The compressive strength of the tested samples at 14 days showed a noticeable increase, where specimens modified with 5, 10, 15, and 20% CKD showed improvements of 28, 42, 35, and 40%, respectively, compared to only 21% in the control mix. That comes from the slow chemical reaction between CKD and tailing materials, as CKD can provide silica, alumina, and Ca to the prepared mixture [75]. At 28 days, CPB specimens modified with CKD exhibited a higher improvement rate than the control mix based on gained strength at seven days. The percentage reached 81% in the mixture that utilized 10% CKD as a partial replacement for cement; meanwhile, the control mix showed the lowest improvement rate at 54%. Tested samples prepared with 15 and 20% CKD and cured at 56 days showed higher improvement rates of up to 112 and 123%, respectively. At the same time, the reference sample achieved 96%. Specimens subjected to the UCS test at a long-term curing time (90 days) also demonstrated the same gradual improvement in compressive strength, where CKD-incorporated mixtures exhibited a higher rate, which means a continued chemical reaction in those mixtures over the curing time (Figure 9). In addition, when comparing the 90-day compressive strength with 56 days, there was an improvement in the CKD mixtures more than the control mix (Figure 10).
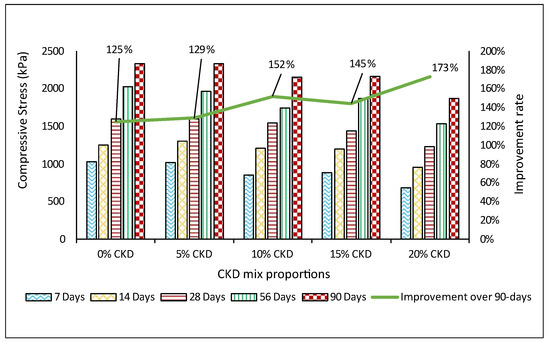
Figure 9.
Improvement rate in the compressive strength of CPB mixtures over 90 days relative to seven days of achieved value.
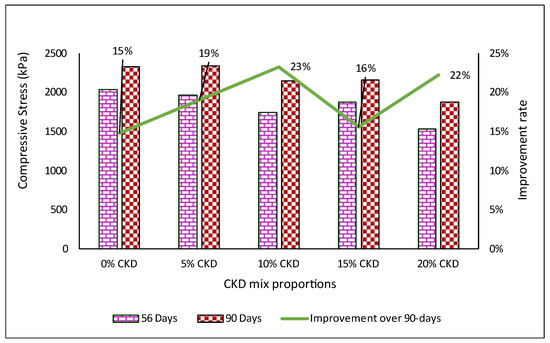
Figure 10.
Improvement rate in the compressive strength of CPB mixtures over 90 days of curing relative to 56 days of the achieved value.
Finally, at a late curing time (90 days), the strength improvement resulted in the CPB mixture containing 5% CKD achieving a relatively higher compressive strength with a value of 2.340 MPa compared to the control mix, which used only cement as a sole binder. The results agree with investigative outcomes that introduced CKD as an agent to improve long-term durability and strength [60,75]. Moreover, this study found that the USC results at 90 days showed higher values for all mixtures compared to the long-term compressive strength of cemented paste backfill prepared only by the original copper tailing and 10% binder, which exhibited around 1.4 MPa [77]. Meanwhile, current outcomes demonstrated a minimum of 1.87 MPa when 20% CKD replaced the cement (OPC) and reduced the main binder to 7.39%. From the compressive strength test findings, one can see that cemented paste backfill (CPB) mixtures prepared with various proportions of cement kiln dust (up to 20%) can meet the required USC of underground mine backfill. This can beneficially influence CPB operating costs by reducing 20% of the main binder (cement) direct cost, which accounts for around 75% of CPB production costs [57].
Additionally, using CKD in CPB manufactured with copper tailings can have several benefits, including lowering the amount of waste sent to landfills and reducing the cost of associated transportation. Similarly, CKD and tailing dumping may make mitigating the detrimental effects on the local environment and surface/groundwater more challenging. In addition to promoting sustainability by reducing CO2 emissions from cement production, energy efficiency and protecting non-renewable natural resources to produce cement are also important; it takes 1.7 tons of these materials to make just one ton of clinker.
3.2.1. Coefficient of Variation (CV)
The coefficient of variation (CV) is a statistical tool that measures data dispersion. CV is calculated via the ratio of the standard deviation to the mean. This study determined the coefficient of variation (CV) of the compressive strength of each mixture for quality control. The results showed a minor variation in the datasets, where the maximum CV value was 14.5%, which lies within the acceptable limit (less than 15%) [76], as shown in Table 5, and represented graphically by error bars in Figure 11a–e.
Table 5.
Coefficient of variation (CV) analysis of the compressive strengths of all mixtures.
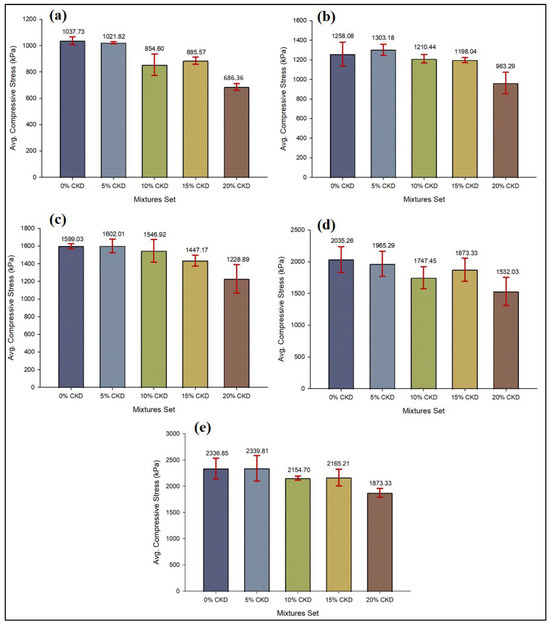
Figure 11.
The average compressive strengths of CPB mixtures with error bars using different CKD proportions at various curing periods: (a) 7 days; (b) 14 days; (c) 28 days; (d) 56 days; and (e) 90 days.
3.2.2. Strength Development Model
The curing period significantly influences the compressive strength development rate for all prepared CPB mixtures (Figure 12); there is a direct relationship between the increase in curing time and strength. This relationship trend has been modeled using various fitting curves (linear, logarithmic, exponential, polynomial, and power) to achieve the best correlation between the UCS CPB sample and curing time [78]. This study obtained results showing that the highest value for the correlation coefficient (R2) was associated with the power-fitting trendline because this type of curve is suitable for datasets that increase at a specific rate. The general equation that describes the relationship between the UCS and curing time is as follows:
where UCS denotes CPB compressive strength (MPa); t is the curing time in days (up to 90 days); a and b are fitting coefficients.
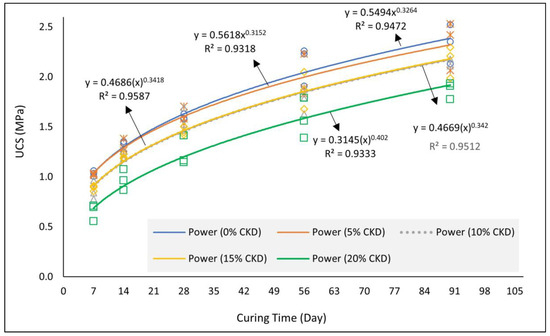
Figure 12.
UCS increase of cemented paste backfill mixtures over curing time.
The results also show a significant agreement between the curves of mixtures using 10 and 15% CKD, as shown in Figure 12.
3.3. Elastic Modulus
Figure 13 shows a relative increase in the elastic modulus (stiffness) of CPB mixtures over the curing time. However, at 14 days, a slight reduction occurred in the stiffness behaviors of the tested samples, except for those prepared with 15 and 20% CKD, as shown in Figure 14. This comes from the rapid cement reaction, unlike CKD materials, which react slowly over the curing days. Thus, the mixtures prepared with 15 and 20% CKD achieved a growth rate in the elastic modulus of 80 and 49% at 90 days compared to the results achieved during the early curing period (7 days). The control sample showed an improvement rate of only 18%. Results at 28 days showed that mixtures with 15 and 10% CKD exhibited higher stiffness with values of 92.22 and 91.49 MPa, respectively. Meanwhile, the control mix achieved 88.59 MPa. The 56-day curing period also showed a noticeable increase in the stiffness of the 5% CKD mixture, which reached 97.22 MPa compared to 94.4 for the reference mix. In general, the results of the tests at 90 days showed slight differences in material stiffness for all mixtures; the three mixtures containing 0, 5, and 10 CKD achieved more than 100 MPa, which confirms that there were no adverse effects from the use of CKD materials on the elastic modulus of CPB, as shown Figure 15.
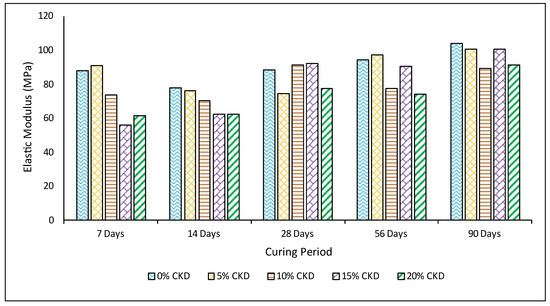
Figure 13.
The relative increase in the obtained elastic modulus of the CPB mixtures prepared with different proportions of CKD over the curing period.
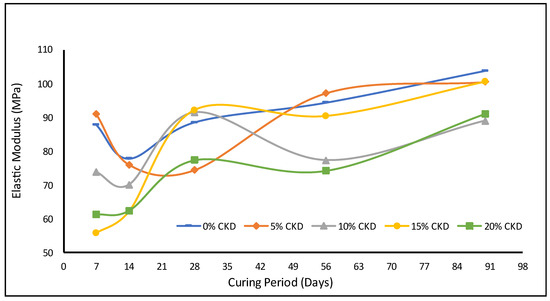
Figure 14.
Stiffness behaviors of prepared CPB mixtures over curing times of up to 90 days.
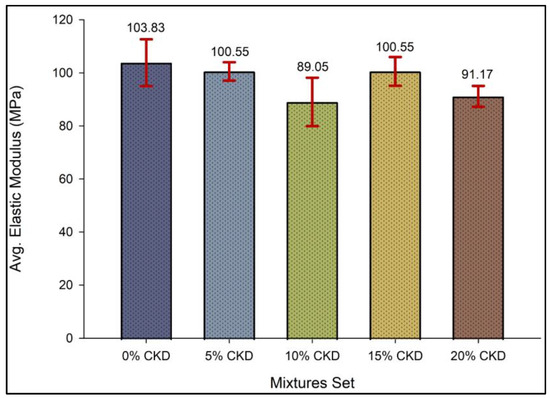
Figure 15.
Stiffness values of prepared CPB mixtures over a curing time of 90 days with a minor variation in the datasets represented by error bars.
3.4. Slump Yield Stress
This investigation conducted slump tests on four mixtures, including the control mix (0% CKD), where CKD gradually replaced the OPC at 5, 10, and 15%. Given the significance of the water content, chemical composition, and physical properties in determining yield stress, this investigation considered 27% water content for all investigated mixtures to assess the impact of adding CKD on the rheological and flowability properties of the modified CPB mixtures. The outcomes showed slight variations once the CKD material was gradually utilized: the values of the yield stress ranged between 154 and 175 Pa, as shown in Figure 16.
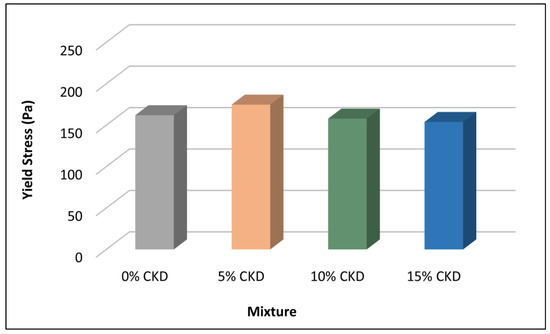
Figure 16.
Variations in yield stress values of cemented paste backfill mixtures prepared in the investigation and subjected to the slump test.
3.5. Microscopic and Spectroscopic Analyses
3.5.1. SEM-EDX Analysis
Figure 17 presents the weight (%) composition of the elements in the studied cemented paste backfill samples. The results indicate that oxygen (O), silicon (Si), sulfur (S), calcium (Ca), and iron (Fe) are significant elements in all the investigated samples, suggesting that they may contain similar molecular compositions. At the same time, despite the utilization of 20% CKD, the control mix (M-14) and the mixture (4–14) prepared with 20% CKD as a partial replacement for cement showed remarkable similarity in the weight elements. This indicates that there are no effects on the element’s chemical composition due to using CKD as a partial substitute in cemented paste backfill. There was a small amount of chloride (Cl) in the chemical analysis results after 90 days of curing. This may occur as the free chloride ions are bound by hydration products, which leads to a decrease and stabilization of the free chloride content over curing time [79]. The potassium (K) weight also showed a minor presence, underscoring the element’s importance in the cured mixtures over 90 days of curing.
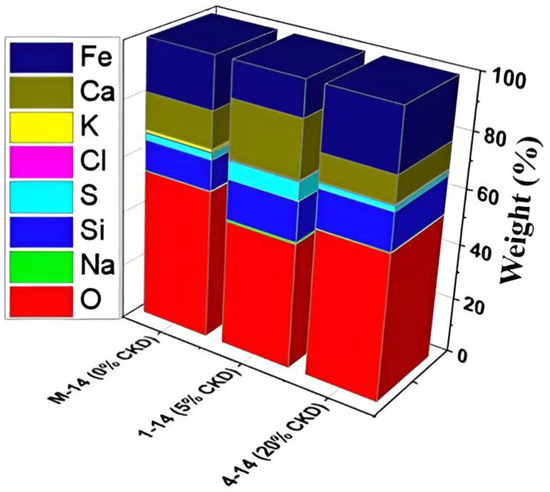
Figure 17.
Composition of elements in the studied samples: reference sample (M-14); 5% CKD (sample 1–14); 20% CKD (sample 4–14).
Figure 18a–f depicts the SEM and corresponding EDX images of the SEM-EDX analysis. The SEM images in Figure 18a,c,e, and Figure 18b,d,f present EDX images that indicate the elements in the analyzed samples. It is evident that needle-like ettringite crystals in Figure 17 and cement replacement with CKD caused structural changes in the mixture, as shown in Figure 18b,c.
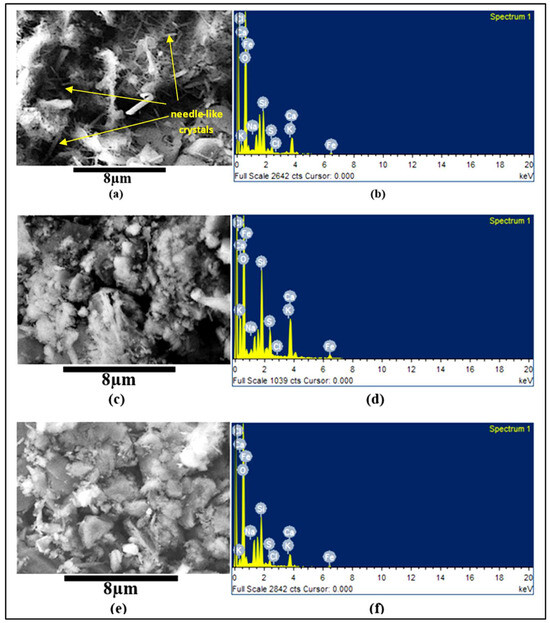
Figure 18.
Combined SEM-EDX analysis: SEM images (a,c,e); EDX images (b,d,f); (a,b) control mix; (c,d) 5% CKD; (e,f) 20% CKD.
3.5.2. FTIR Analysis
Figure 19 presents the FTIR results of the investigated samples. Numerous infrared (IR) peaks can be distinguished at different frequency bands. The peaks at 658 and 2980 cm−1 are associated with sylvite [35]. While those at 780 and 980 cm–1 represent the symmetric vibrations of Si-O, which are related to the quartz mineral [74]. The peaks at frequency bands 880 cm−1, 1110, and 1423 cm−1 indicate the presence of Portlandite, ettringite, and calcite in the investigated samples, respectively [35,80]. Meanwhile, other obtained peaks (green color; Figure 19) are associated with O-H groups that can be linked to Portlandite and ettringite. Previous studies have shown that O-H vibration at 3750 can be attributed to the crystal structure of ettringite [81].
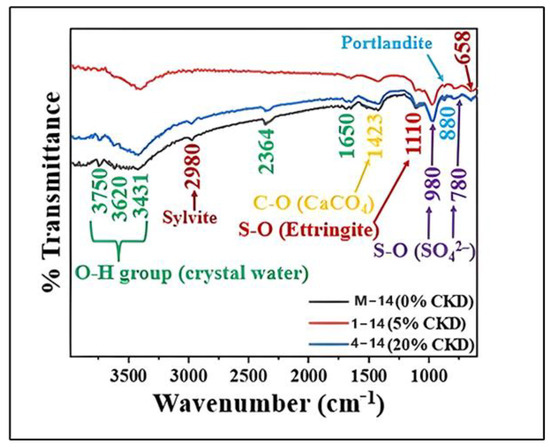
Figure 19.
FTIR results of the investigated cemented paste backfill samples.
3.5.3. XRD Analysis
Figure 20 illustrates the diffraction pattern of the investigated samples. It is evident that five mineral phases are identified: ettringite, quartz, Portlandite, sylvite, and calcite. Despite ettringite having dominant diffraction peaks, its peaks are not as strong as those of quartz, suggesting that quartz is the primary mineral in the studied samples. It is worth noting that despite the CKD replacement of cement (1–14; sample with 5% CKD replacement of cement, 4–14; sample with 20% CKD replacement of cement), the diffraction peaks remain nearly the same compared to the control sample (M-14; reference sample). The results of the quantitative analysis of the diffraction peaks are presented in Table 6. The results indicate that quartz is the primary mineral, while the quantity of calcite (CaCO3) in the investigated sample is relatively small, below the quantifiable value.
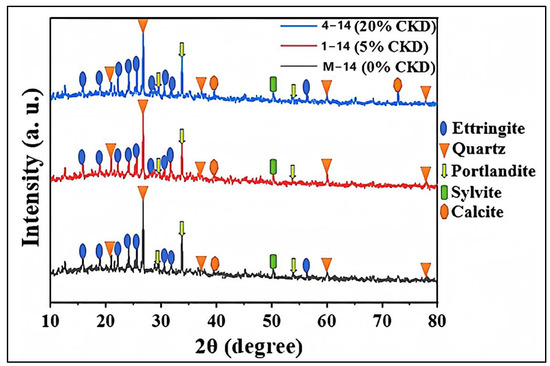
Figure 20.
XRD analysis of the investigated cemented paste backfill samples.
Table 6.
Mineral phases and their weights (%) in the studied samples.
By comparing the results of the analytical methods employed in this study, it is evident that FTIR and XRD results are in good agreement.
The results obtained from the microscopic and spectroscopic investigation showed that, although tricalcium silicate (Ca3SiO5) and dicalcium silicate (Ca2SiO4) were present in the OPC used in preparing the different mixtures, the small percentage of cement in mixes (7.39 to 9.24%) prevented the formation of calcium silicate hydrate (CSH) in the CPB-tested samples. CSH works as a bonding agent and contributes to achieving high compressive strength. The existence of portlandite in the investigated samples as a bonding agent showed a strength of no more than 2.34 MPa at 90 days into the curing period due to the weak bonds created. Therefore, additional material such as slag is suggested to improve compressive strength. In the overall mixtures, silica was the primary mineral phase (47 to 60%) due to the high silica content (SiO2) in the raw materials from copper tailings, which led to limitations in the strengths of the cured samples. Needle-like crystals of hydrated calcium aluminum sulfate hydroxide (secondary ettringite) were also encountered in the air voids at 90 days. The secondary ettringite may negatively crack the created bonds over long curing periods and impact the mechanical behavior.
4. Conclusions
Cement kiln dust (CKD) is a fine-grained material with chemical and physical properties that allow it to be efficiently used in underground mining applications. This research evaluated the utilization of CKD as a co-binder material in cemented paste backfill (CPB) made with copper tailings. The results showed that CKD could be used beneficially in the CPB mixture to replace ordinary Portland cement with a proportion of up to 20%. The fine particles can fill the cured CPB’s tiny pores and then form a denser microstructure upon hydration, increasing the cured specimen density compared to the reference sample.
Mechanically, the mix modified with 5% CKD exhibited higher compressive strength than the control mixture when tested at 90 days due to the chemical and physical properties of CKD that added value to the CBP mixtures. Moreover, the elastic modulus results at a 90-day curing period indicated slight differences in material stiffness for all combinations, as three mixtures (0, 5, and 10 CKD) achieved more than 100 MPa, confirming that there were no adverse effects from using CKD materials on the elastic modulus of CPB.
Microscopic and spectroscopic investigations showed remarkable similarity in the weight elements. Using CKD as a partial substitute in cemented paste backfill also showed no effects on the chemical composition of the elements. Oxygen (O), silicon (Si), sulfur (S), calcium (Ca), and iron (Fe) were the significant elements in all the investigated samples, suggesting that they may contain similar molecular compositions. Also, five mineral phases were identified: ettringite, quartz, Portlandite, sylvite, and calcite. Despite ettringite having the dominant diffraction peaks, its peaks are not as strong as those of quartz, suggesting that quartz is the primary mineral due to the silica content in the copper tailing materials. Meanwhile, the absence of calcium silicate hydrate (CSH) in the CPB led to relatively low compressive strength, where Portlandite acted as a bonding agent with weak bonds. Moreover, the high silica content in the copper tailings negatively impacted the strength of the cured CPB samples.
Author Contributions
Writing the original draft of the manuscript, A.Y.A.-B.; supervising this work, H.M.A. and M.A.H.; reviewing and approving the final version of manuscript, A.Y.A.-B., H.M.A. and M.A.H. All authors have read and agreed to the published version of the manuscript.
Funding
This research received no external funding.
Data Availability Statement
The data presented in this review are available within the manuscript.
Conflicts of Interest
The authors declare no conflicts of interest.
References
- Al-Bakri, A.Y.; Ahmed, H.M.; Hefni, M.A. Cement Kiln Dust (CKD): Potential Beneficial Applications and Eco-Sustainable Solutions. Sustainability 2022, 14, 7022. [Google Scholar] [CrossRef]
- Al-Bakri, A.Y.; Ahmed, H.M.; Hefni, M.A. Eco-Sustainable Recycling of Cement Kiln Dust (CKD) and Copper Tailings (CT) in the Cemented Paste Backfill. Sustainability 2023, 15, 3229. [Google Scholar] [CrossRef]
- Siddique, R. Utilization of Cement Kiln Dust (CKD) in Cement Mortar and Concrete-an Overview. Resour. Conserv. Recycl. 2006, 48, 315–338. [Google Scholar] [CrossRef]
- Kessler, G.R. Cement Kiln Dust (CKD) Methods for Reduction and Control. IEEE Trans. Ind. Appl. 1995, 31, 407–412. [Google Scholar] [CrossRef]
- Abdalla, A.A.; Salih Mohammed, A. Theoretical Models to Evaluate the Effect of SiO2 and CaO Contents on the Long-Term Compressive Strength of Cement Mortar Modified with Cement Kiln Dust (CKD). Arch. Civ. Mech. Eng. 2022, 22, 105. [Google Scholar] [CrossRef]
- Ranjkesh Adarmanabadi, H.; Rasti, A.; Razavi, M. Long-Term Effects of Cement Kiln Dust (CKD) on Erosion Control of a Soil Slope. Int. J. Geotech. Eng. 2021, 16, 225–238. [Google Scholar] [CrossRef]
- EPA United States Environmental Protection Agency. Report to Congress on Cement Kiln Dust (Report:EPA/530-R-94-001); EPA: Washington, DC, USA, 1993. [Google Scholar]
- Kunal; Siddique, R.; Rajor, A. Use of Cement Kiln Dust in Cement Concrete and Its Leachate Characteristics. Resour. Conserv. Recycl. 2012, 61, 59–68. [Google Scholar] [CrossRef]
- Seo, M.; Lee, S.Y.; Lee, C.; Cho, S.S. Recycling of Cement Kiln Dust as a Raw Material for Cement. Environments 2019, 6, 113. [Google Scholar] [CrossRef]
- Ghavami, S.; Jahanbakhsh, H.; Saeedi Azizkandi, A.; Moghadas Nejad, F. Influence of Sodium Chloride on Cement Kiln Dust-Treated Clayey Soil: Strength Properties, Cost Analysis, and Environmental Impact. Environ. Dev. Sustain. 2021, 23, 683–702. [Google Scholar] [CrossRef]
- Pedraza, J.; Zimmermann, A.; Tobon, J.; Schomäcker, R.; Rojas, N. On the Road to Net Zero-Emission Cement: Integrated Assessment of Mineral Carbonation of Cement Kiln Dust. Chem. Eng. J. 2021, 408, 127346. [Google Scholar] [CrossRef]
- Mohamed, A.M.O.; El Gamal, M.M. Solidification of Cement Kiln Dust Using Sulfur Binder. J. Hazard. Mater. 2011, 192, 576–584. [Google Scholar] [CrossRef] [PubMed]
- Lachemi, M.; Hossain, K.M.A.; Shehata, M.; Thaha, W. Controlled Low Strength Materials Incorporating Cement Kiln Dust from Various Sources. Cem. Concr. Compos. 2008, 30, 381–392. [Google Scholar] [CrossRef]
- Abdel-wahed, T.; Dulaimi, A.; Shanbara, H.K.; Nageim, H. Al The Impact of Cement Kiln Dust and Cement on Cold Mix Asphalt Characteristics at Different Climate. Sustainability 2022, 14, 4173. [Google Scholar] [CrossRef]
- Abbas, R.A.H.; Shehata, N.; Elrahman, E.A.; Salah, H.; Abdelzahera, M.A. Environmental Safe Disposal of Cement Kiln Dust for the Production of Geopolymers. Egypt. J. Chem. 2021, 64, 7429–7437. [Google Scholar] [CrossRef]
- Lima, M.S.S.; Hajibabaei, M.; Thives, L.P.; Haritonovs, V.; Buttgereit, A. Environmental Potentials of Asphalt Mixtures Fabricated with Red Mud and Fly Ash. Road Mater. Pavement Des. 2021, 22, S690–S701. [Google Scholar] [CrossRef]
- Abdel-Wahed, T.; AL Nageim, H. Investigating the Effects of Cement and Cement Kiln Dust as a Filler on the Mechanical Properties of Cold Bituminous Emulsion Mixtures. Int. J. Civ. Eng. Technol. 2016, 7, 441–453. [Google Scholar]
- Ghorab, H.Y.; Anter, A.; El Miniawy, H. Building with Local Materials: Stabilized Soil and Industrial Wastes. Mater. Manuf. Process. 2007, 22, 157–162. [Google Scholar] [CrossRef]
- Sreekrishnavilasam, A.; Rahardja, S.; Kmetz, R.; Santagata, M. Soil Treatment Using Fresh and Landfilled Cement Kiln Dust. Constr. Build. Mater. 2007, 21, 318–327. [Google Scholar] [CrossRef]
- Moon, D.H.; Wazne, M.; Yoon, I.H.; Grubb, D.G. Assessment of Cement Kiln Dust (CKD) for Stabilization/Solidification (S/S) of Arsenic Contaminated Soils. J. Hazard. Mater. 2008, 159, 512–518. [Google Scholar] [CrossRef]
- Carlson, K.; Sariosseiri, F.; Muhunthan, B. Engineering Properties of Cement Kiln Dust-Modified Soils in Western Washington State. Geotech. Geol. Eng. 2011, 29, 837–844. [Google Scholar] [CrossRef]
- Ebrahimi, A.; Edil, T.B.; Son, Y.-H. Effectiveness of Cement Kiln Dust in Stabilizing Recycled Base Materials. J. Mater. Civ. Eng. 2012, 24, 1059–1066. [Google Scholar] [CrossRef]
- Albusoda, B.S.; Salem, L.A.K. Stabilization of Dune Sand By Using Cement Kiln Dust (CKD). J. Earth Sci. Geotech. Eng. 2012, 2, 131–143. [Google Scholar]
- Okafor, F.O.; Egbe, E.A. Potentials of Cement Kiln Dust in Sub-Grade Improvement. Niger. J. Technol. 2013, 32, 109–116. [Google Scholar]
- Gupta, S.; Pandey, M.K.; Srivastava, R.K. Evaluation of Cement Kiln Dust Stabilized Heavy Metals Contaminated Expansive Soil-A Laboratory Study. Eur. J. Adv. Eng. Technol. 2015, 2, 37–42. [Google Scholar]
- Arulrajah, A.; Mohammadinia, A.; D’Amico, A.; Horpibulsuk, S. Cement Kiln Dust and Fly Ash Blends as an Alternative Binder for the Stabilization of Demolition Aggregates. Constr. Build. Mater. 2017, 145, 218–225. [Google Scholar] [CrossRef]
- Mohammadinia, A.; Arulrajah, A.; D’Amico, A.; Horpibulsuk, S. Alkali-Activation of Fly Ash and Cement Kiln Dust Mixtures for Stabilization of Demolition Aggregates. Constr. Build. Mater. 2018, 186, 71–78. [Google Scholar] [CrossRef]
- Ekpo, D.U.; Fajobi, A.B.; Ayodele, A.L.; Etim, R.K. Potentials of Cement Kiln Dust-Periwinkle Shell Ash Blends on Plasticity Properties of Two Selected Tropical Soils for Use as Sustainable Construction Materials. In Proceedings of the IOP Conference Series: Materials Science and Engineering, Ota, Nigeria, 27–28 July 2020; IOP Publishing: Bristol, UK, 2021; Volume 1036, p. 012033. [Google Scholar]
- Al-Harthy, A.S.; Taha, R.; Al-Maamary, F. Effect of Cement Kiln Dust (CKD) on Mortar and Concrete Mixtures. Constr. Build. Mater. 2003, 17, 353–360. [Google Scholar] [CrossRef]
- Mohammad, A.M.; Hilal, N. Re-Using The By-Product of Cement Industry (Cement Kiln Dust) To Produce The Concrete. Anbar J. Eng. Sci. 2010, 3, 1–14. [Google Scholar] [CrossRef]
- Marku, J.; Dumi, I.; Lico, E.; Dilo, T.; Çakaj, O. Ckd in Mortar & Conc Prodctn. Mater. Prot. 2012, 53, 334–345. [Google Scholar]
- El-Mohsen, M.A.; Anwar, A.M.; Adam, I.A. Mechanical Properties of Self-Consolidating Concrete Incorporating Cement Kiln Dust. HBRC J. 2015, 11, 1–6. [Google Scholar] [CrossRef]
- Hussain, G.S.; Rao, R. Experimental Studies on Concrete Containing Cement Kiln Dust and Fly Ash. Singaporean J. Sci. Res. 2014, 6, 85–88. [Google Scholar]
- Sadek, D.M.; El-Attar, M.M.; Ali, A.M. Physico-Mechanical and Durability Characteristics of Concrete Paving Blocks Incorporating Cement Kiln Dust. Constr. Build. Mater. 2017, 157, 300–312. [Google Scholar] [CrossRef]
- Saleh, H.M.; Salman, A.A.; Faheim, A.A.; El-Sayed, A.M. Sustainable Composite of Improved Lightweight Concrete from Cement Kiln Dust with Grated Poly(Styrene). J. Clean. Prod. 2020, 277, 123491. [Google Scholar] [CrossRef]
- Bagheri, S.M.; Koushkbaghi, M.; Mohseni, E.; Koushkbaghi, S.; Tahmouresi, B. Evaluation of Environment and Economy Viable Recycling Cement Kiln Dust for Use in Green Concrete. J. Build. Eng. 2020, 32, 101809. [Google Scholar] [CrossRef]
- Aydin, T.; Tarhan, M.; Tarhan, B. Addition of Cement Kiln Dust in Ceramic Wall Tile Bodies. J. Therm. Anal. Calorim. 2019, 136, 527–533. [Google Scholar] [CrossRef]
- Ewais, E.M.M.; Ahmed, Y.M.Z.; El-Amir, A.A.M.; El-Didamony, H. Cement Kiln Dust-Quartz Derived Wollastonite Ceramics. J. Ceram. Soc. Jpn. 2015, 123, 527–536. [Google Scholar] [CrossRef]
- Ali, M.A.M.; Yang, H.S. Utilization of Cement Kiln Dust in Industry Cement Bricks. Geosystem Eng. 2011, 14, 29–34. [Google Scholar] [CrossRef]
- Ogila, W.A. Recycling of Cement Kiln Dust in Red Clay Bricks and Its Impact on Their Physico-Mechanical Behaviors. Int. J. Sci. Eng. Res. 2014, 5, 1072–1080. [Google Scholar]
- El-Attar, M.M.; Sadek, D.M.; Salah, A.M. Recycling of High Volumes of Cement Kiln Dust in Bricks Industry. J. Clean. Prod. 2017, 143, 506–515. [Google Scholar] [CrossRef]
- Abdel-Gawwad, H.A.; Rashad, A.M.; Mohammed, M.S.; Tawfik, T.A. The Potential Application of Cement Kiln Dust-Red Clay Brick Waste-Silica Fume Composites as Unfired Building Bricks with Outstanding Properties and High Ability to CO2-Capture. J. Build. Eng. 2021, 42, 102479. [Google Scholar] [CrossRef]
- Abdulkareem, A.H.; Eyada, S.O. Production of Building Bricks Using Cement Kiln Dust CKD Waste. In Proceedings of the Sustainable Civil Infrastructures, Cairo, Egypt, 24–28 November 2018; Springer: Cham, Switzerland, 2018; pp. 102–113. [Google Scholar]
- Al-Refeai, T.O.; Al-Karni, A.A. Experimental Study on the Utilization of Cement Kiln Dust for Ground Modification. J. King Saud Univ.-Eng. Sci. 1999, 11, 217–231. [Google Scholar] [CrossRef]
- Daous, M. Utilization of Cement Kiln Dust and Fly Ash in Cement Blends in Saudi Arabia. J. King Abdulaziz Univ. Sci. 2004, 15, 33–45. [Google Scholar] [CrossRef]
- Maslehuddin, M.; Al-Amoudi, O.S.B.; Shameem, M.; Rehman, M.K.; Ibrahim, M. Usage of Cement Kiln Dust in Cement Products—Research Review and Preliminary Investigations. Constr. Build. Mater. 2008, 22, 2369–2375. [Google Scholar] [CrossRef]
- Mahyoup, G. Stabilization of Eastern Saudi Soils Using Heavy Fuel Oil Fly Ash and Cement Kiln Dust. Master’s Thesis, King Fahd University of Petroleum and Minerals, Dhahran, Saudi Arabia, 2009. [Google Scholar]
- Ghazaly, M.; Almaghrabi, N.; Ebrahiem, E. Study on the Reuse of Cement Kiln Dust in the Production of Cement Concerts. Minia J. Eng. Technol. 2012, 31, 63–68. [Google Scholar]
- Alawi, M. Utilization of Using Cement Kiln Dust (Ckd) As a Surfacial Clay Soil Stabilizer Underneath Roads. J. Al-Azhar Univ. Eng. Sect. 2016, 11, 1101–1111. [Google Scholar] [CrossRef]
- Al-Homidy, A.A.; Dahim, M.H.; Abd El Aal, A.K. Improvement of Geotechnical Properties of Sabkha Soil Utilizing Cement Kiln Dust. J. Rock Mech. Geotech. Eng. 2017, 9, 749–760. [Google Scholar] [CrossRef]
- Alharthi, Y.M.; Elamary, A.S.; Abo-El-wafa, W. Performance of Plain Concrete and Cement Blocks with Cement Partially Replaced by Cement Kiln Dust. Materials 2021, 14, 5647. [Google Scholar] [CrossRef]
- Badri, A.; Nadeau, S.; Gbodossou, A. A Mining Project Is a Field of Risks: A Systematic and Preliminary Portrait of Mining Risks. Int. J. Saf. Secur. Eng. 2012, 2, 145–166. [Google Scholar] [CrossRef]
- Ivanova, G. The Mining Industry in Queensland, Australia: Some Regional Development Issues. Resour. Policy 2014, 39, 101–114. [Google Scholar] [CrossRef]
- Sheshpari, M. A Review of Underground Mine Backfilling Methods with Emphasis on Cemented Paste Backfill. Electron. J. Geotech. Eng. 2015, 20, 5183–5208. [Google Scholar]
- Qi, C.; Fourie, A. Cemented Paste Backfill for Mineral Tailings Management: Review and Future Perspectives. Miner. Eng. 2019, 144, 106025. [Google Scholar] [CrossRef]
- Tariq, A.; Yanful, E.K. A Review of Binders Used in Cemented Paste Tailings for Underground and Surface Disposal Practices. J. Environ. Manag. 2013, 131, 138–149. [Google Scholar] [CrossRef] [PubMed]
- Belem, T.; Benzaazoua, M. Design and Application of Underground Mine Paste Backfill Technology. Geotech. Geol. Eng. 2008, 26, 147–174. [Google Scholar] [CrossRef]
- Peyronnard, O.; Benzaazoua, M. Alternative By-Product Based Binders for Cemented Mine Backfill: Recipes Optimisation Using Taguchi Method. Miner. Eng. 2012, 29, 28–38. [Google Scholar] [CrossRef]
- Lutyński, M.; Pierzyna, P. Reuse of Cement Kiln Dust for Backfilling and CO2 Carbonation. In Proceedings of the Mineral Engineering Conference MEC2017, Wisla, Poland, 20–23 September 2017; Volume 18. [Google Scholar]
- Beltagui, H.; Sonebi, M.; Maguire, K.; Taylor, S. Feasibility of Backfilling Mines Using Cement Kiln Dust, Fly Ash, and Cement Blends. In Proceedings of the 2nd International Congress on Materials & Structural Stability (CMSS-2017), Rabat, Morocco, 22–25 November 2017; Volume 149, pp. 1–5. [Google Scholar]
- Zhao, Y.; Soltani, A.; Taheri, A.; Karakus, M.; Deng, A. Application of Slag–Cement and Fly Ash for Strength Development in Cemented Paste Backfills. Minerals 2019, 9, 22. [Google Scholar] [CrossRef]
- ASTM C150-07; Standard Specification for Portland Cement. ASTM International: West Conshohocken, PA, USA, 2012. [CrossRef]
- Alsawalha, M. Assessing Drinking Water Quality in Jubail Industrial City, Saudi Arabia. Am. J. Water Resour. 2017, 5, 142–145. [Google Scholar]
- Hu, J.; Ding, X.; Ren, Q.; Luo, Z.; Jiang, Q. Effect of Incorporating Waste Limestone Powder into Solid Waste Cemented Paste Backfill Material. Appl. Sci. 2019, 9, 2076. [Google Scholar] [CrossRef]
- ASTM C204-0; Standard Test Method for Fineness of Hydraulic Cement by Air Permeability Apparatus. ASTM International: West Conshohocken, PA, USA, 2017. [CrossRef]
- ASTM D7481-18; Standard Test Methods for Determining Loose and Tapped Bulk Densities of Powders Using a Graduated Cylinder (Withdrawn 2018). ASTM International: West Conshohocken, PA, USA, 2018. [CrossRef]
- Arezou, R.; Maria, P.; Mehrdad, R. Assessment of Soil Moisture Content Measurement Methods: Conventional Laboratory Oven versus Halogen Moisture Analyzer. J. Soil Water Sci. 2020, 4, 151–160. [Google Scholar] [CrossRef]
- ASTM D2216-19; Standard Test Methods for Laboratory Determination of Water (Moisture) Content of Soil and Rock by Mass. ASTM International: West Conshohocken, PA, USA, 2019. [CrossRef]
- Hefni, M.; Ahmed, H.A.M.; Omar, E.S.; Ali, M.A. The Potential Re-use of Saudi Mine Tailings in Mine Backfill: A Path towards Sustainable Mining in Saudi Arabia. Sustainability 2021, 13, 6204. [Google Scholar] [CrossRef]
- Thiam, M.; Fall, M.; Diarra, M.S. Mechanical Properties of a Mortar with Melted Plastic Waste as the Only Binder: Influence of Material Composition and Curing Regime, and Application in Bamako. Case Stud. Constr. Mater. 2021, 15, e00634. [Google Scholar] [CrossRef]
- ASTM C642-97; Standard Test Method for Density, Absorption, and Voids in Hardened Concrete. ASTM International: West Conshohocken, PA, USA, 2017. [CrossRef]
- Hefni, M.; Hassani, F. Effect of Air Entrainment on Cemented Mine Backfill Properties: Analysis Based on Response Surface Methodology. Minerals 2021, 11, 81. [Google Scholar] [CrossRef]
- ASTM D2166-06; Standard Test Method for Unconfined Compressive Strength of Cohesive Soil. ASTM International: West Conshohocken, PA, USA, 2010. [CrossRef]
- Adewuyi, S.O.; Ahmed, H.A.M. Grinding Behaviour of Microwave-Irradiated Mining Waste. Energies 2021, 14, 3991. [Google Scholar] [CrossRef]
- Ahmari, S.; Zhang, L. Utilization of Cement Kiln Dust (CKD) to Enhance Mine Tailings-Based Geopolymer Bricks. Constr. Build. Mater. 2013, 40, 1002–1011. [Google Scholar] [CrossRef]
- Niroshan, N.; Yin, L.; Sivakugan, N.; Veenstra, R.L. Relevance of SEM to Long-Term Mechanical Properties of Cemented Paste Backfill. Geotech. Geol. Eng. 2018, 36, 2171–2187. [Google Scholar] [CrossRef]
- Ercikdi, B.; Baki, H.; Izki, M. Effect of Desliming of Sulphide-Rich Mill Tailings on the Long-Term Strength of Cemented Paste Backfill. J. Environ. Manag. 2013, 115, 5–13. [Google Scholar] [CrossRef]
- Xu, W.; Cao, P.; Tian, M. Strength Development and Microstructure Evolution of Cemented Tailings Backfill Containing Different Binder Types and Contents. Minerals 2018, 8, 167. [Google Scholar] [CrossRef]
- Sun, C.; Sun, M.; Tao, T.; Qu, F.; Wang, G.; Zhang, P.; Li, Y.; Duan, J. Chloride Binding Capacity and Its Effect on the Microstructure of Mortar Made with Marine Sand. Sustainability 2021, 13, 4169. [Google Scholar] [CrossRef]
- Zarzuela, R.; Luna, M.; Carrascosa, L.M.; Yeste, M.P.; Garcia-Lodeiro, I.; Blanco-Varela, M.T.; Cauqui, M.A.; Rodríguez-Izquierdo, J.M.; Mosquera, M.J. Producing C-S-H Gel by Reaction between Silica Oligomers and Portlandite: A Promising Approach to Repair Cementitious Materials. Cem. Concr. Res. 2020, 130, 106008. [Google Scholar] [CrossRef]
- Gastaldi, D.; Canonico, F.; Boccaleri, E. Ettringite and Calcium Sulfoaluminate Cement: Investigation of Water Content by near-Infrared Spectroscopy. J. Mater. Sci. 2009, 44, 5788–5794. [Google Scholar] [CrossRef]


Disclaimer/Publisher’s Note: The statements, opinions and data contained in all publications are solely those of the individual author(s) and contributor(s) and not of MDPI and/or the editor(s). MDPI and/or the editor(s) disclaim responsibility for any injury to people or property resulting from any ideas, methods, instructions or products referred to in the content. |
© 2024 by the authors. Licensee MDPI, Basel, Switzerland. This article is an open access article distributed under the terms and conditions of the Creative Commons Attribution (CC BY) license (https://creativecommons.org/licenses/by/4.0/).