Article

Methodology for the Identification of Moisture Content in Tailings Dam Walls Based on Electrical Resistivity Tomography Technique

1
Department of Innovation and Development, Geosinergia Ingeniería y Medioambiente, Av. Apoquindo 6433 of. 214, Las Condes 7570014, Chile
2
Advanced Mining Technology Center (AMTC), Facultad de Ciencias Físicas y Matemáticas, Universidad de Chile, Tupper, Santiago 8370451, Chile
3
Department of Geophysics, Facultad de Ciencias Físicas y Matemáticas (FCFM), Universidad de Chile, Av. Blanco Encalada, Santiago 8370449, Chile
*
Author to whom correspondence should be addressed.
Minerals 2024, 14(8), 760; https://doi.org/10.3390/min14080760 (registering DOI)
Submission received: 11 June 2024 / Revised: 19 July 2024 / Accepted: 22 July 2024 / Published: 27 July 2024
(This article belongs to the Section Mineral Processing and Extractive Metallurgy)

Abstract

:
The design of tailings dams has improved significantly in recent decades due to experience and advances in applied research. However, there are still several environmental and geomechanical uncertainties associated with the response of these structures. Failures on the wall of tailings dams are well documented, where the most common causes are related to the action of water overtopping, slope instability, seepage, and foundation failure. Measuring the humidity or the saturation level at tailings dam walls has become a must do in the recent years. Resistivity monitoring using electrical resistivity tomography (ERT) techniques has proven to be one of the tools that provide good subsurface characterization for internal erosion detection and seepage assessment to evaluate potential environmental risks and the physical stability of tailings dams. Also, the integrated techniques of geotechnical, geophysical, and geochemical data have been used to correlate, coordinate, and improve the characterization. In this research, a procedure to guide us to a new methodology of acquiring and monitoring humidity content is presented, in which 2D electrical resistivity tomography (ERT) profiles are linked to the degree of soil saturation, using moisture sensors installed in a nearby well. The ERT profiles provide a 2D resistivity profile, and the moisture sensors can measure resistivity and volumetric water content (VWC) at a given installation depth. This second measure (VWC), with a defined total porosity, can be combined with Archie’s empirical law to obtain the degree of saturation, allowing the possibility to create remote monitoring suitable for mining operations without excessive laboratory testing.

1. Introduction

Mining has been one of the most important economic activities throughout Chile’s history. However, the growing global demand for metals, coupled with declining mineral grades in extraction deposits, has led to an increase in the volume of processed material. This, in turn, results in an increase in waste generated because of mineral recovery processes [1].
The main strategy adopted worldwide for the management of mining waste has been the construction of large tailings dams. The design of these structures has improved significantly in recent decades due to experience and advances in applied research. However, there are still several environmental and geomechanical uncertainties associated with the response of these structures [2].
The physical stability of tailings dams can be affected by various factors and processes associated with the presence of water in the wall, such as leaching, water table fluctuations, infiltration, internal wall saturation, and liquefaction. Examples of tailings dam wall collapses include the Cadia Valley [3] and Bento Rodrigues [4] dam collapses. Subsequent studies of these collapses indicate that regular and more precise monitoring aimed at maintaining safe and stable conditions of the tailings deposit is essential to prevent their failure.
Various technological implementations have been used to monitor subsurface saturation levels in different contexts. Within tailings dams, the assessment of hydrogeological parameters is often carried out by direct sensors strategically placed in boreholes within the structures. Most commonly, however, they are used to monitor groundwater levels.
The use of direct moisture sensors in tailings could play a pivotal role in operational safety by overcoming the limitation of other monitoring techniques such as electrical resistivity tomography (ERT), which requires a correlation with moisture content at depth. These devices, in addition to tailings monitoring, facilitate the continuous and accurate monitoring of moisture levels within the tailings, a critical aspect in averting landslides and preventing the seepage of hazardous materials into the surrounding soil and water.
The use of these sensors is an integral part of a holistic approach to tailings management, requiring potential integration with other technologies and monitoring methods to provide a comprehensive assessment of tailings quality and safety.
The use of tomographic systems to monitor electrical resistivity has proven to be a powerful tool for subsurface characterization. This approach is characterized by its effectiveness in detecting internal erosion and assessing potential environmental hazards and contributes significantly to the assessment of the physical stability of tailings dams [5,6,7,8].
ERT is a geophysical method that uses artificial currents to detect horizontal and vertical discontinuities in the electrical properties of the subsurface [9]. Unlike the methods commonly used in tailings monitoring, ERT is an extensive technique capable of making measurements over two-dimensional sections of tens to hundreds of meters, depending on the instrument setup. Importantly, it is non-invasive, eliminating the need for civil works that may affect the physical stability of the tailings dam wall. However, its application requires careful consideration of resolution and placement to effectively correlate observations with moisture and saturation values.
Archie’s empirical law [10,11] has been used extensively to correlate electrical resistivity values with subsurface moisture content. This relationship, which is characterized by its nonlinear nature, depends on additional factors such as porosity and conductive phase properties. The result is the potential for obtaining similar saturation values for different subsurface configurations, raising the concern of introducing artifacts or errors in data interpretation [12].
The objective of this study is to develop a methodology for assessing the moisture content within the wall of a tailings dam using ERT and its comparative analysis with direct measurement sensors located in wells [13]. The use of moisture sensors could improve accuracy and find a direct relationship with soil saturation compared to ERT profiles.

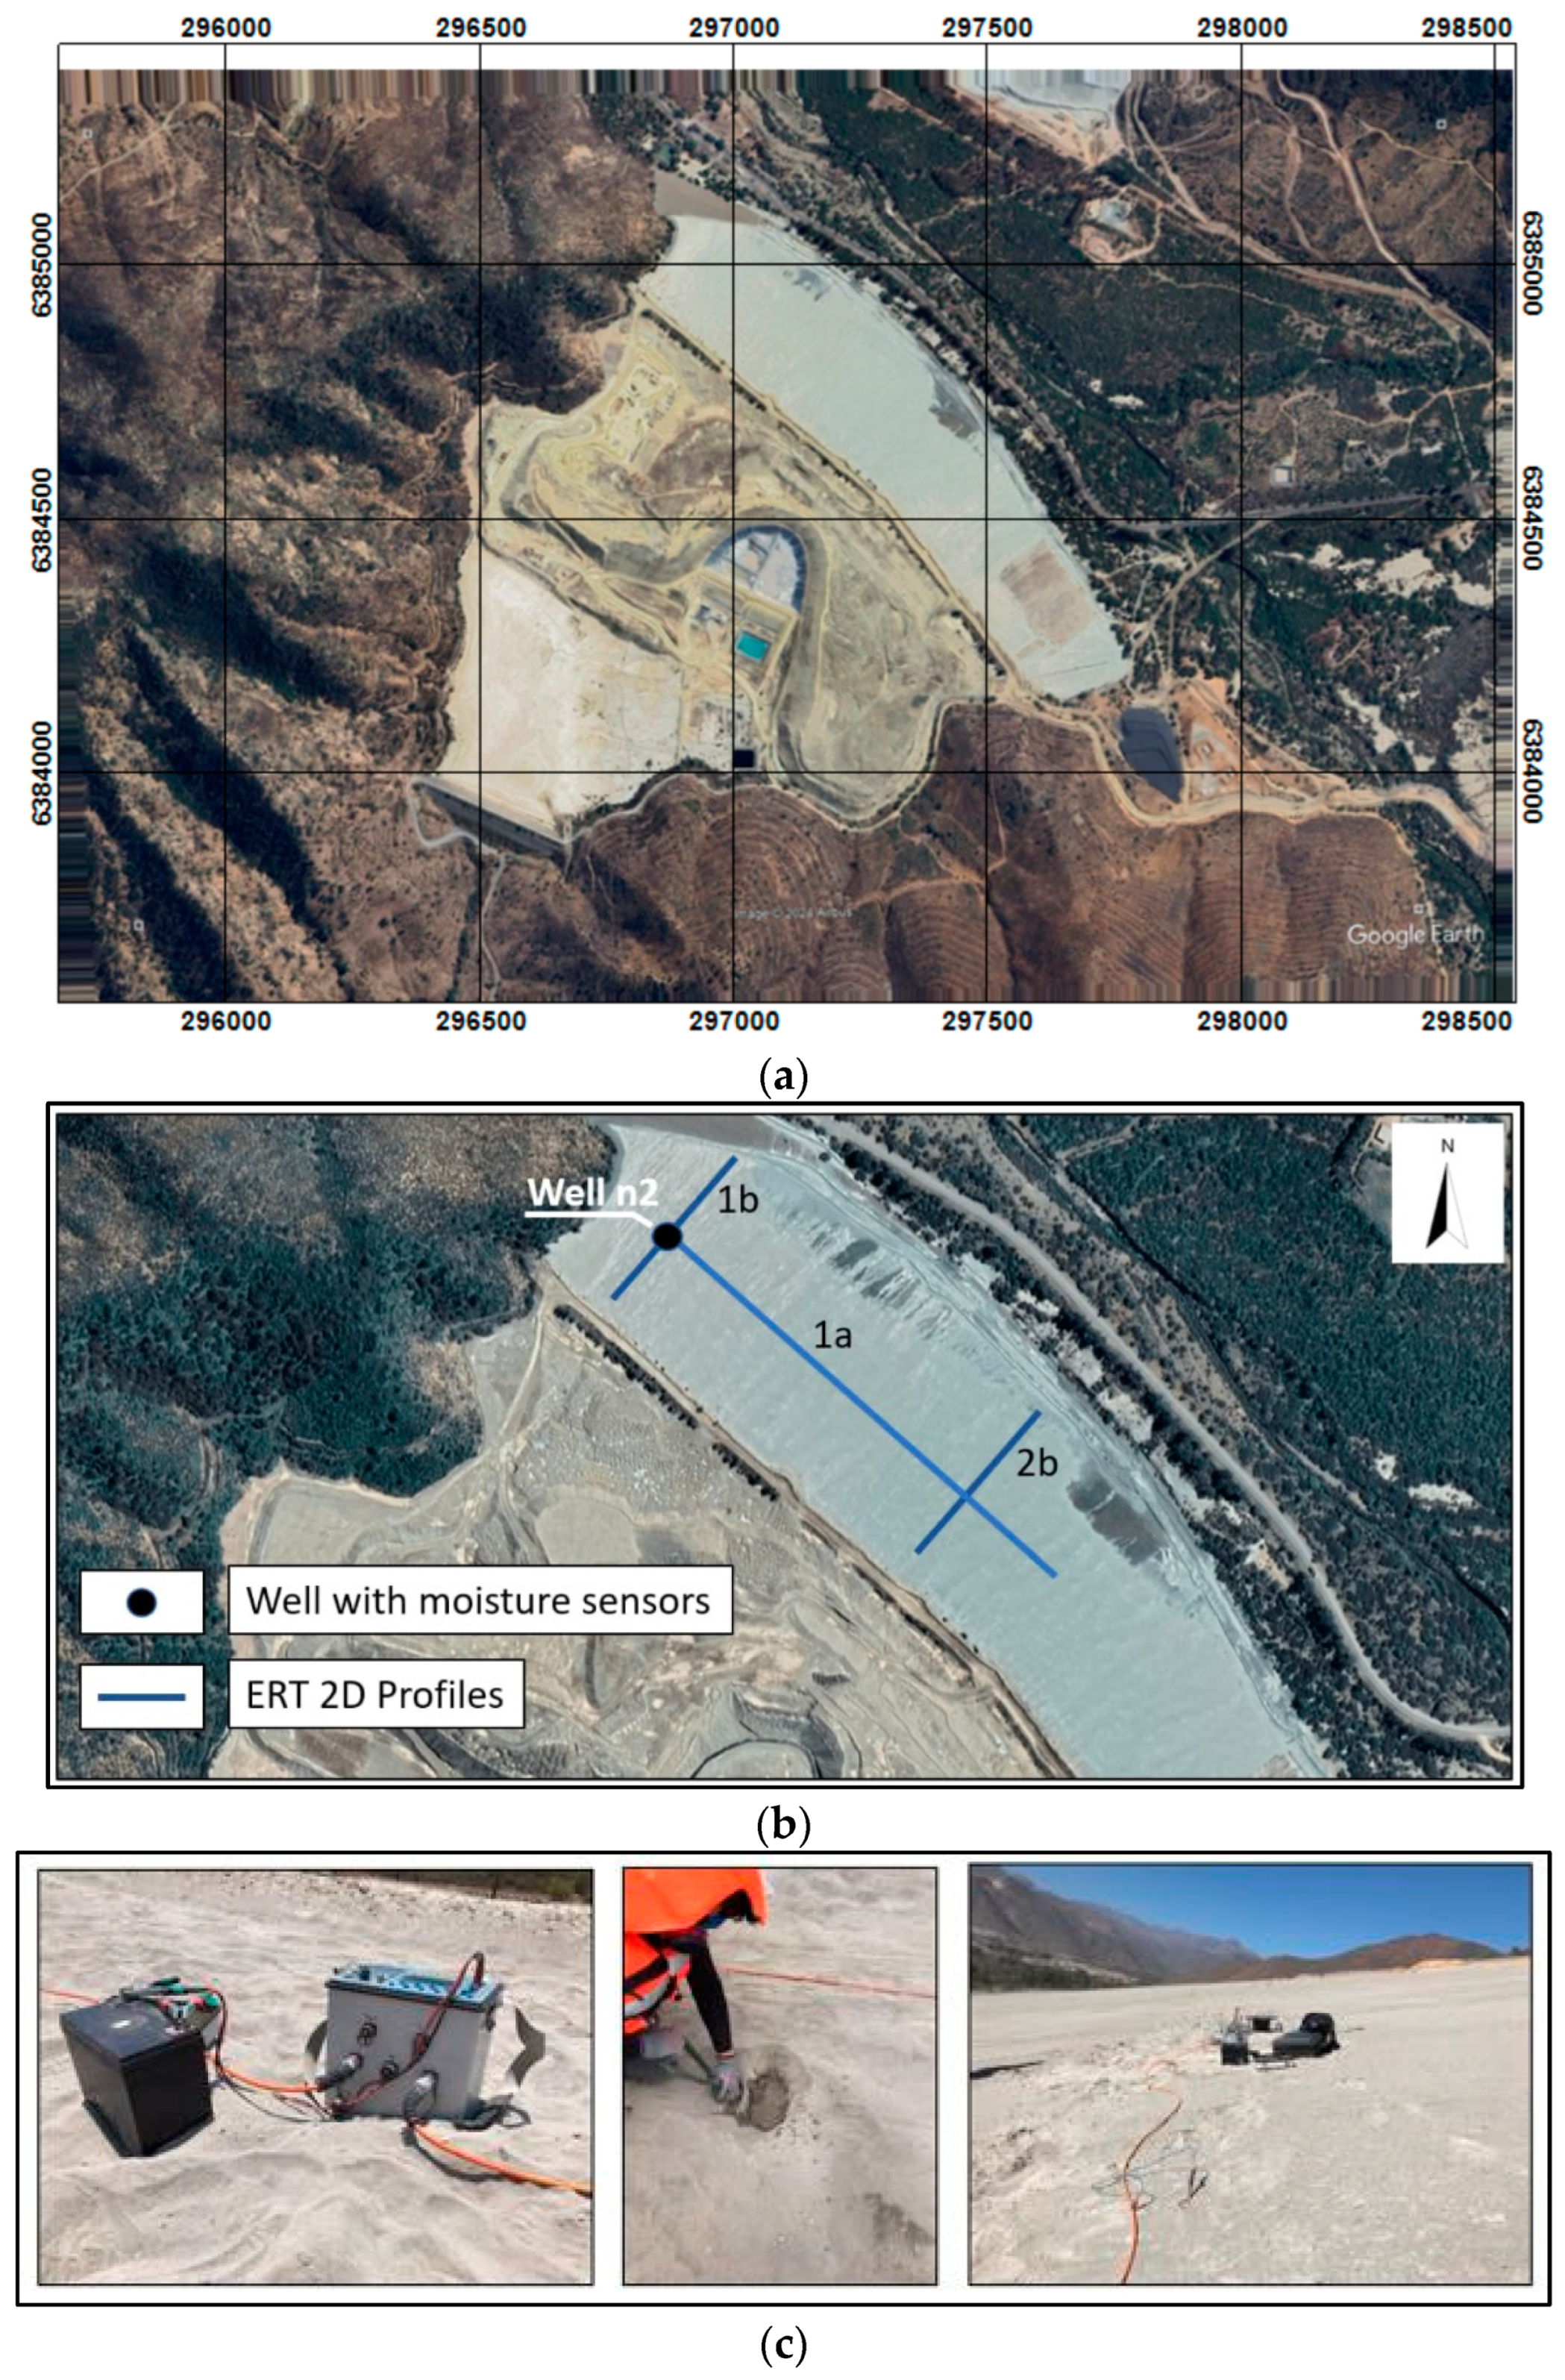
2. Data Acquisition and Methodology

The methodology outlined in this study was intended to be validated through a field campaign in which we performed electrical resistivity tomography on the wall of a tailing’s storage facility located in central Chile (Valparaiso Region, Chile) and deployed depth moisture sensors. Their locations are summarized in Figure 1.
ERT involves measuring the electrical resistivity parameter by analyzing the electric field generated by an artificial current injected into the subsurface through a set of electrodes. The resulting current is measured by recording the potential difference observed at a second set of electrodes. The geometric arrangement and spacing of these electrode sets determine the spatial characteristics of the resistivity data obtained [5,14].
Data acquisition consisted of three electrical resistivity profiles, both parallel and transverse to the tailings dam wall. For this study, we focused on profile 1b (Figure 1b), which was selected due to the presence of a borehole equipped with moisture sensors. This profile has a total length of 240 m and is transverse to the orientation of the dam.
The resistivity data were acquired using the IRIS Syscal Pro tomograph, which is equipped with 48 channels and performs point measurements using a dipole–dipole configuration with 5 m electrode spacing. The selected configuration aimed to achieve a minimum resolution of 2.5 × 2.5 m over a length of 240 m, with a maximum depth capability of 40 m.
The acquired field data were processed using the Res2DInv software 4.10.4 to derive two-dimensional profiles. An iterative approach was used to build a model that effectively minimized the differences between the measured data and the initial model.
A grid of rectangular blocks was used, delineated by the finite element method, where the cell geometry was determined based on the number of electrodes, their spacing, and the amalgamation of collected measurements.
In the case of a data set, there are several equivalent models, all of which produce calculated apparent resistivity values within a reasonable margin of error when compared to the measured values. A commonly used iterative inversion method is limited to gradual variations in the model [15], mathematically defined as follows:
J T J + u F d = J T g
where F is the smoothing matrix, J is the Jacobian matrix, u is a damping factor, d is the model perturbation vector, and g is the discretization vector. The Jacobian matrix J represents the sensitivity of each model value to each measured value, indicating whether the response of each element varies subtly or substantially. This analysis helps assess the extent to which changing a value in the model significantly affects its response or whether adjustments can be made without significantly altering its behavior.
This equation is designed to minimize the spatial variations, commonly referred to as roughness, of the resistivity values within the model. This optimization process results in a model characterized by gradual variations in resistivity values, which is appropriate for scenarios where the subsurface resistivity exhibits relatively smooth transitions. However, in cases where the geological structure consists of a series of internally quasi-homogeneous regions with abrupt boundaries between them, better results can be achieved by using an inversion technique that minimizes the absolute changes in the model’s resistivity values. This approach is known as robust inversion and is particularly effective in such geological settings.
Data processing was conducted using a conventional smoothness-constrained least-square method L2-norm inversion. This inversion corresponds to the quasi-Newton method included in the software RES2DInv.
We sought access to relevant data from the boreholes and geotechnical monitoring wells associated with the reservoir. Our goal was to establish correlations between electrical resistivity profiles, groundwater levels, and materials. In addition, we conducted a comprehensive review of the geological data available to us, with particular emphasis on the core samples taken from the study area, covering the first 30 m of depth.
Two TEROS 12 moisture sensors (Figure 2a) were strategically placed within a borehole at depths of 20 and 25 m below the surface. These sensors were used to apply the proposed methodology in which the acquisition of critical parameters, including electrical conductivity (EC) and volumetric water content (VWC), could be correlated with the results of the ERT2D and applied as a direct measurement to convert resistivity to VWC and correct ERT resistivity with the EC parameter of the well.
According to the design specifications of the sensor, the degree of saturation can be calculated by evaluating the relationship between VWC and total porosity, as described by the following formula:
D e g r e e   o f   S a t u r a t i o n = V W C φ
The VWC raw data are obtained by reading the chargeability capacity of the surrounding soil when it is activated with a high-frequency pulse of 70 MHz. The electrical circuit that represents the soil and the sensor action is shown in Figure 2b, where the sensor calculates the capacitance of the soil and therefore the dielectric constant ( ε ).
V W C = a ε + b C x = δ ε
According to the sensor manufacturer, the following applies:
V W C m 3 m 3 = 3.879 × 10 4 × R A W 0.6956
To estimate the total soil porosity (ϕ), we relied on density data from previous studies, but the porosity changed with depth and other factors. Therefore, we prefer to study its direct relationship with VWC.
In order to establish correlations between the electrical resistivity data obtained by ERT and the volumetric water content (VWC) values via the TEROS 12 moisture sensor, these moisture sensors were subjected to laboratory tests.
A 2 m high PVC pipe column packed with tailings material was constructed. TEROS 12 sensors were placed at heights of 0.5, 1, and 1.5 m inside the column. The tailings were saturated by introducing water through the bottom of the column until visible saturation was achieved at the surface. This process took one day. The PVC pipe then undergoes gravitational dewatering and gradually loses water from its bottom. The column loses mass until the retained water can no longer be removed by gravity (capillary retention) over a total period of eight months.
The moisture sensors provided continuous measurements for 1 year, documenting both the saturation and drainage phases of the tested material.
Archie’s empirical law was used to establish a correlation between electrical resistivity parameters and water content in the tailings. This law relates material saturation to electrical transmission properties for porous granular materials [11]. For a water-saturated two-phase material, the relationship is expressed as follows:
ρ = α   ρ w φ m   S r p
where ρ : medium electrical resistivity [Ohm-m]; α : tortuosity factor; ρ w : fluid electrical resistivity [Ohm-m]; φ : porosity [%]; m : cementation exponent; S r : fluid saturation [%]; and p : saturation index.
To apply the relationship, we express Archie’s law equation in terms of the VWC which is acquired by the humidity sensors.
P o r o s i t y = φ = ρ b ρ s = M e d i u m   d e n s i t y S o l i d   p h a s e   d e n s i t y S r = V W C φ
Expressing Archie’s law in terms of the VWC, the formula is as follows:
ρ = k S r p = k φ p · V W C p = K · V W C p
obtaining an expression that relates the acquired VWC with the electrical resistivity of the material. Through curve fitting to estimate the factors, the aim is to propose an expression that enables the interpretation of electrical resistivity data obtained by ERT into VWC values.

3. Results and Discussion

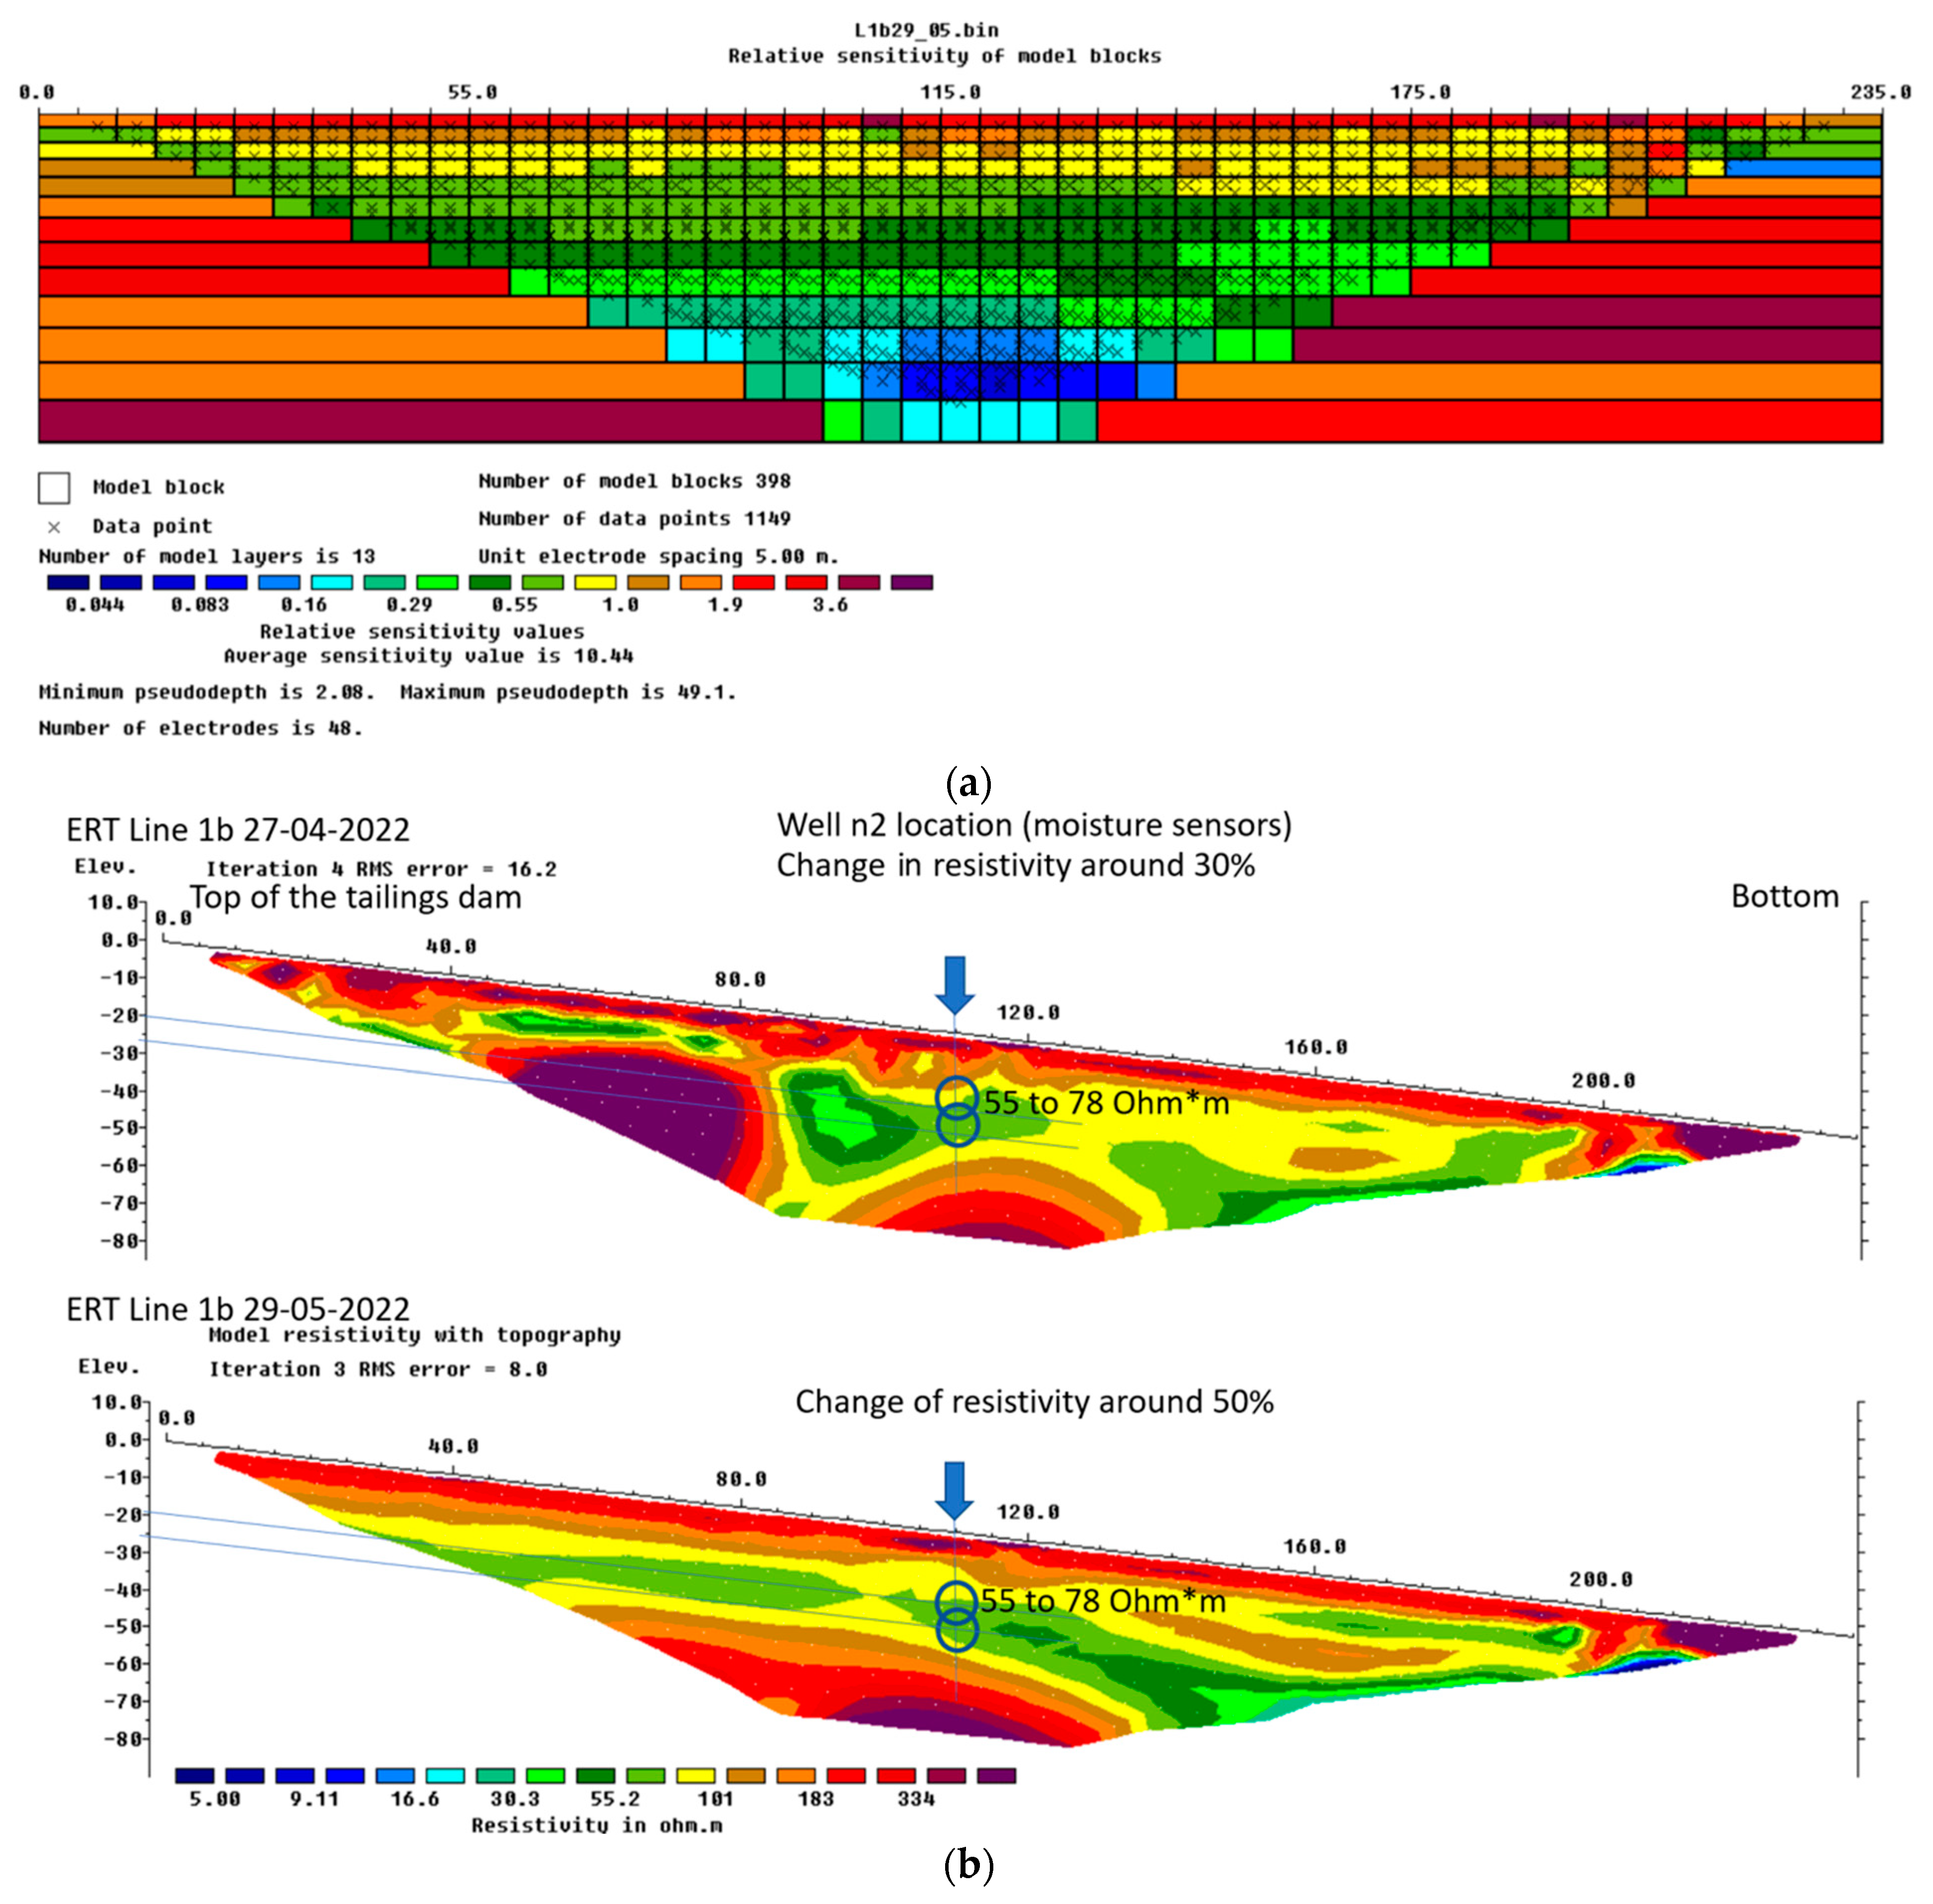
3.1. Electrical Resistivity Values

The ERT2D data of profile 1b was inverted using the quasi-Newton method [16] built in the RES2DINV software.
Conducted tomographic inversion has a margin of error of 5% to 10% when comparing the initial inversion model, represented by a semi-space of constant electrical resistivity, with the actual measurements.
The sensitivity is the amount of perturbation in the stress measurement due to a small perturbation in the subsurface resistivity distribution [17]. The sensitivity maps define how sensitive the modeled data are to small perturbations in the model variables (details on the calculation and estimation of the sensitivity maps can be found in [18]). As shown in Figure 3, the sensitivity within profile 1b gradually decreases with depth in a range between 0.3 and 3. This suggests that profile 1b is largely sensitive to variations in resistivity in the first 5 m and moderately sensitive to resistivity changes until 30 m. Beneath that depth, there is no sensitivity to recognize changes, which means that we reach a baseline resistivity change or basement.
ERT profile 1b (Figure 3) shows the presence of three distinct resistivity zones. This profile has been taken before and after rainfall, showing in both results a high-resistivity zone near the surface within a depth range of 0 to 5 m, characterized by resistivity values ranging from 135 to 300 ohms. This is followed by a medium resistivity layer at depths of 5 to 30 m, with resistivity values ranging from 45 to 100 ohms. Finally, at depths greater than 30 m, a third zone is identified, with resistivity values ranging from 135 to 300 ohms. The difference between the profile before rainfall and after rainfall is mainly in the middle layer (between 5 and 30 m depth), where there is a more homogeneous and less resistive content in the profile after rainfall.
The ERT results were compared with previous studies, and our resistivity values showed a correlation with the central sample survey conducted at the dam in 2019 (Figure 4). In the top 5 m, the composition is predominantly gravel, clayey sand, and silty sand. Between 5 and 30 m, there is a shift in facies composition, with sand mixtures dominating. At greater depths, there is a transition to harder facies characterized by increased silt content. From 25 to 30 m of depth, a basement begins to appear.
Reviewing the order of magnitude of the resistivity results for these silt and sand materials at the dam [19,20], we can deduce that given the inactivity of this tailings dam in recent years, the dry clayey silt is expected to have elevated resistivity values (greater than 100 Ohm-m). This is followed by the cyclone tailings material (consisting of sand mixtures ranging from 20 to 100 Ohm-m), with a compacted silt mixture below (exceeding 100 Ohm-m).

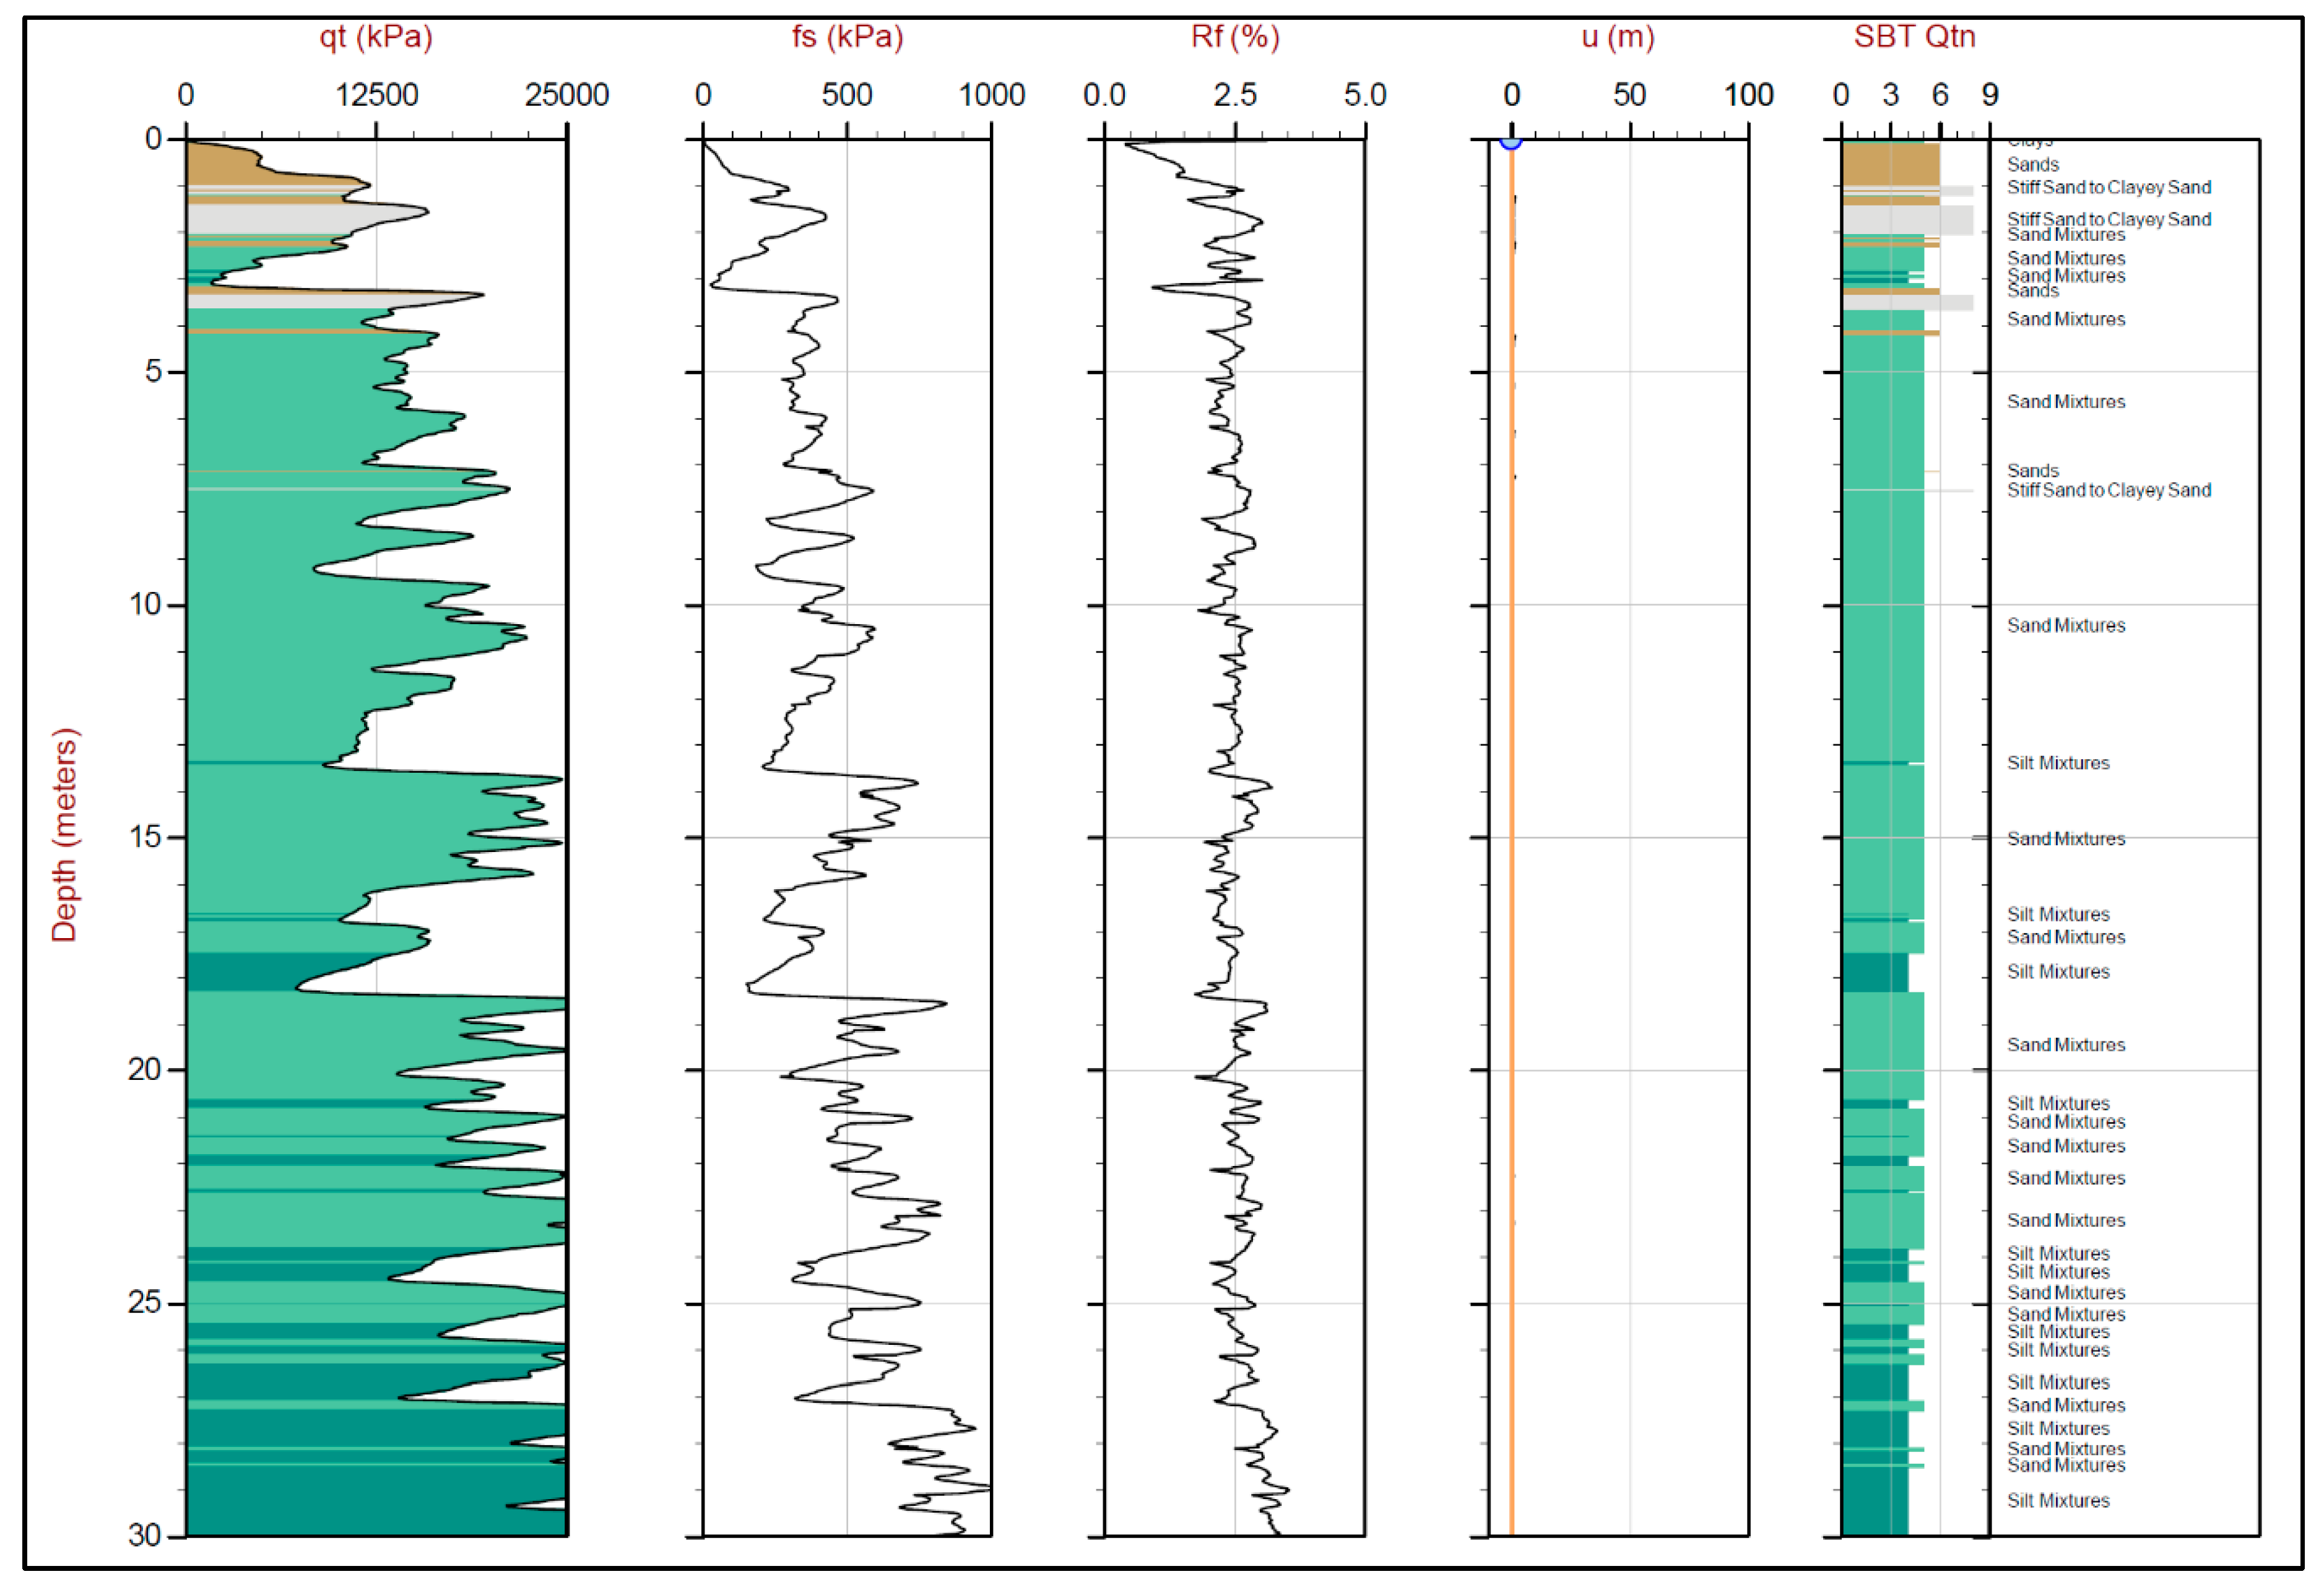
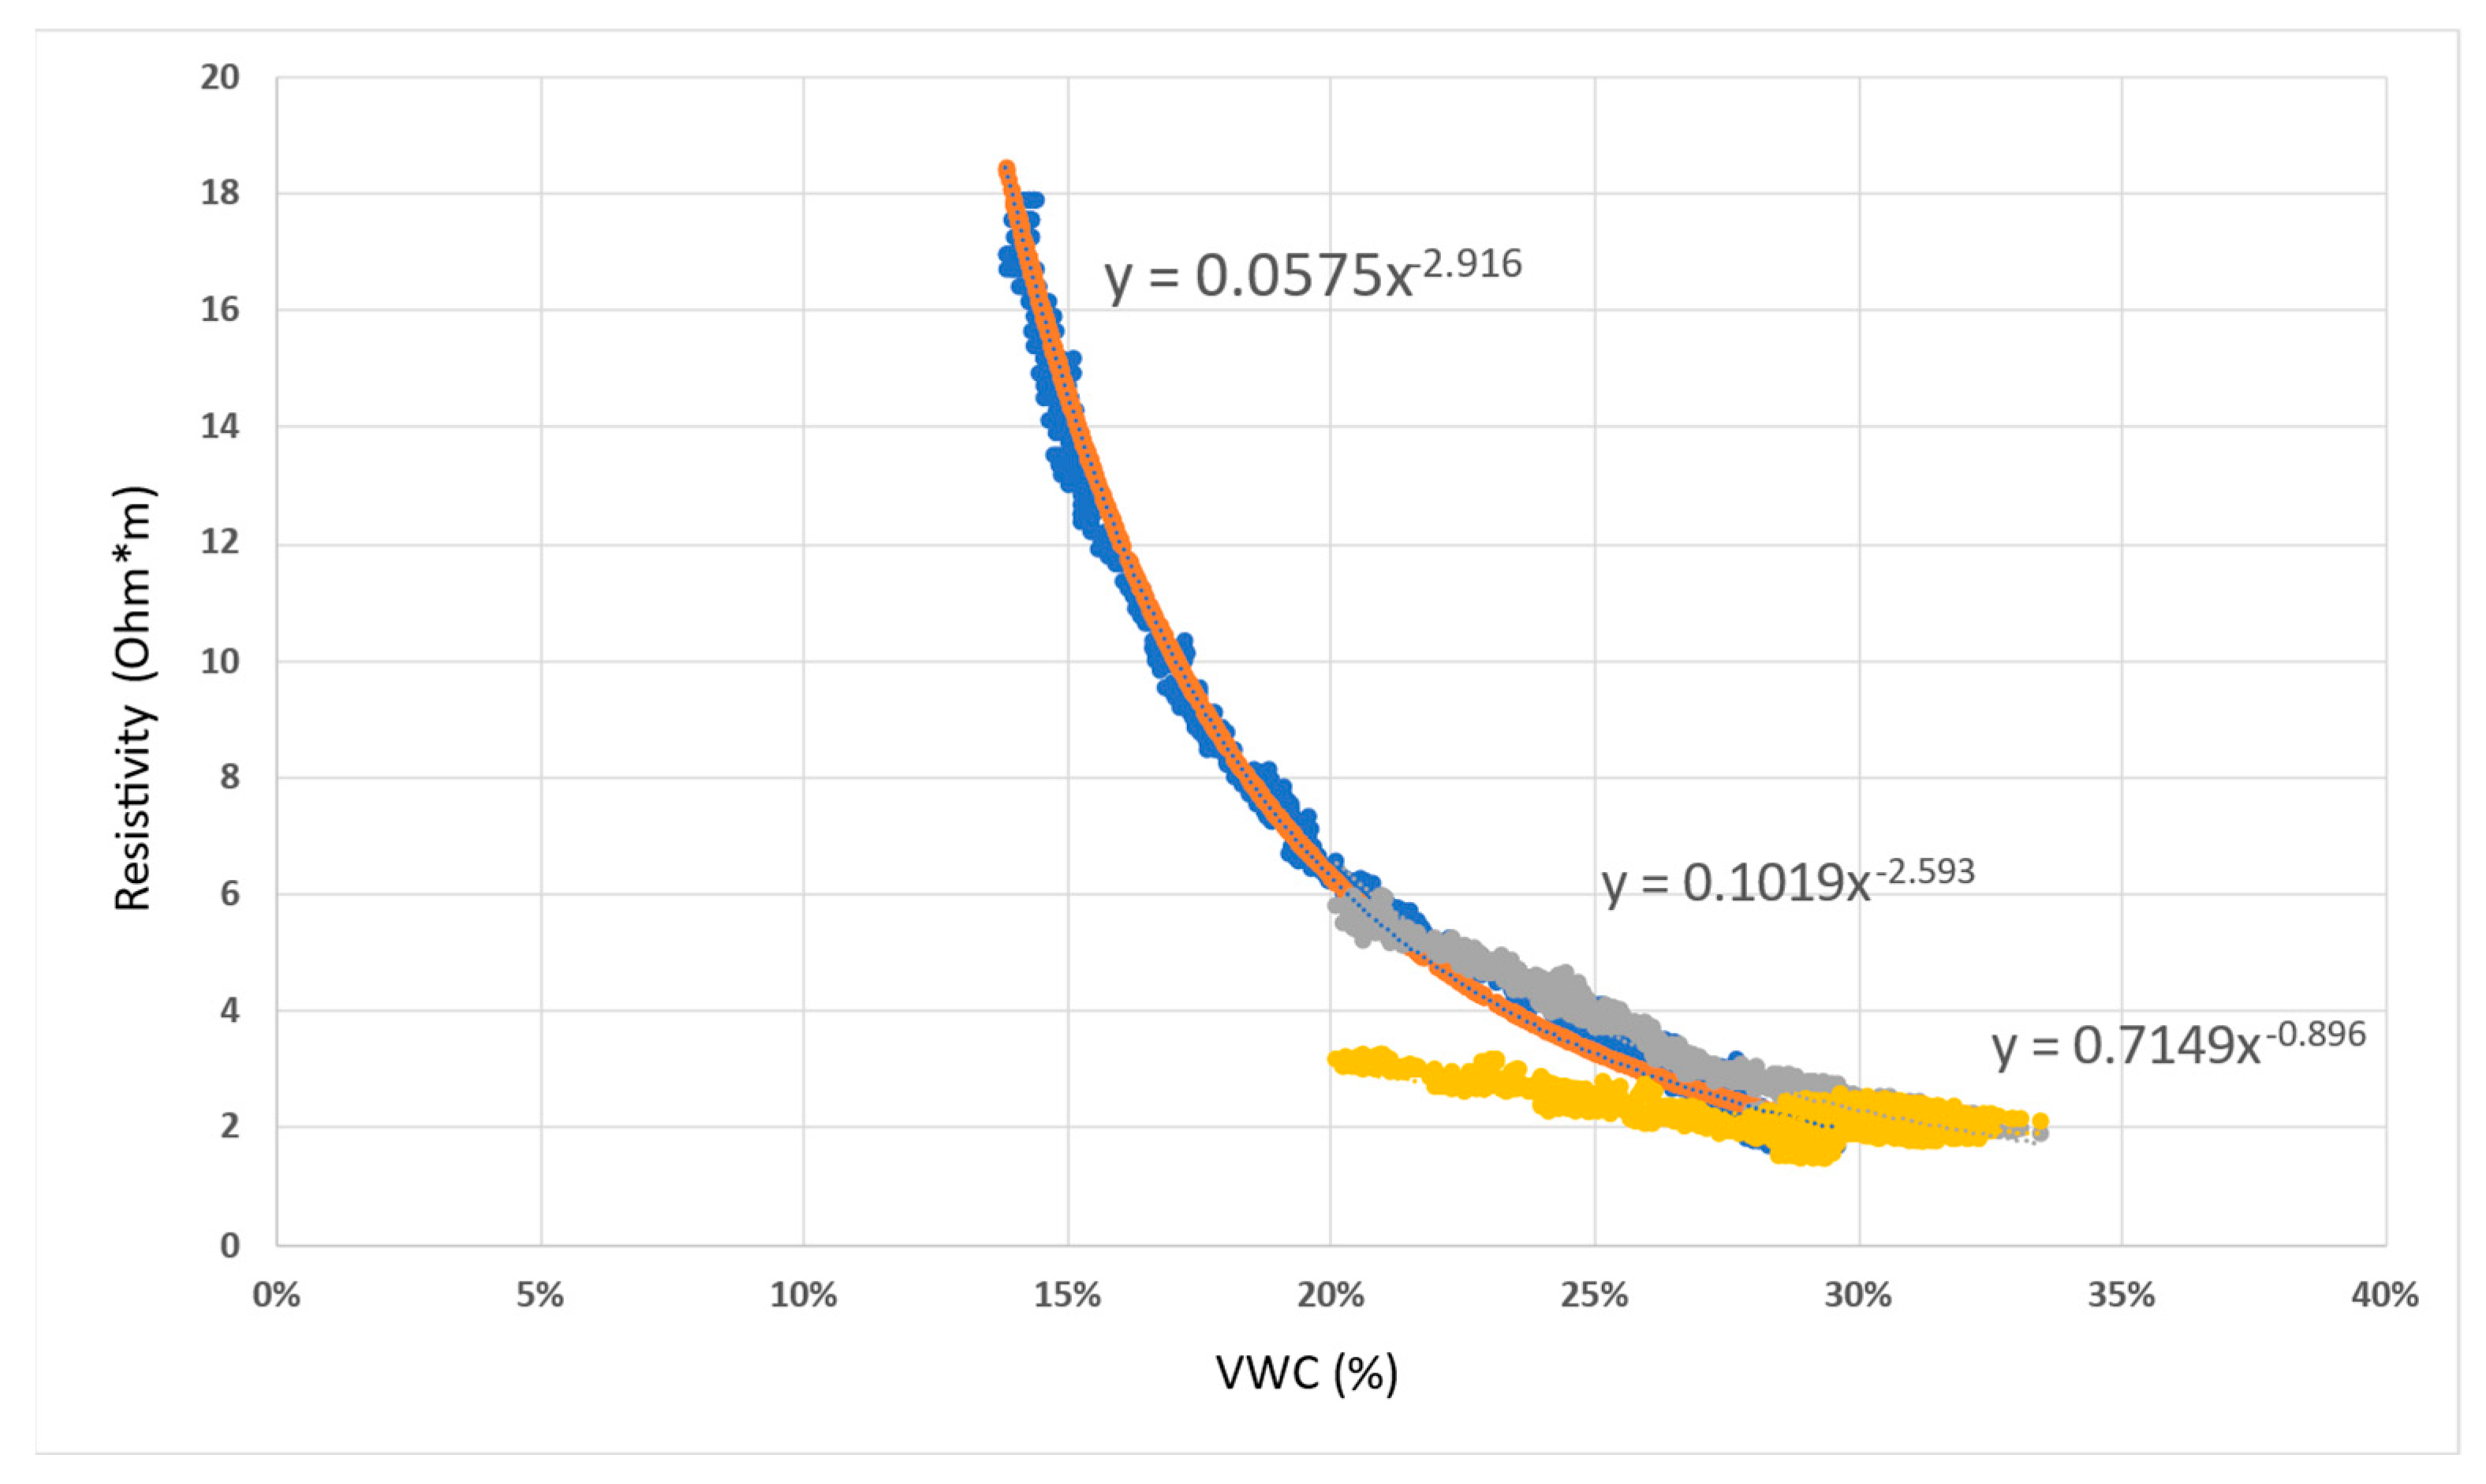
3.2. Laboratory Tests

The results of laboratory experiments on PVC test tube samples are shown in Figure 5. Initially, the material is saturated with water to perform slow gravitational drying over time. The electrical resistivity values of the moisture sensors placed at three different depths change in the range of 2 to 18 ohm-m in 1 year of drying. The shallowest sensor (1.5 m) shows a more pronounced exponential increase in resistivity.
With these data, we can model the form of Archie’s law equation presented in the previous section. Figure 5 shows the modeled equations that fit the data for each sensor in the drying process. The approximate factors obtained from the plot fit are shown in Table 1.

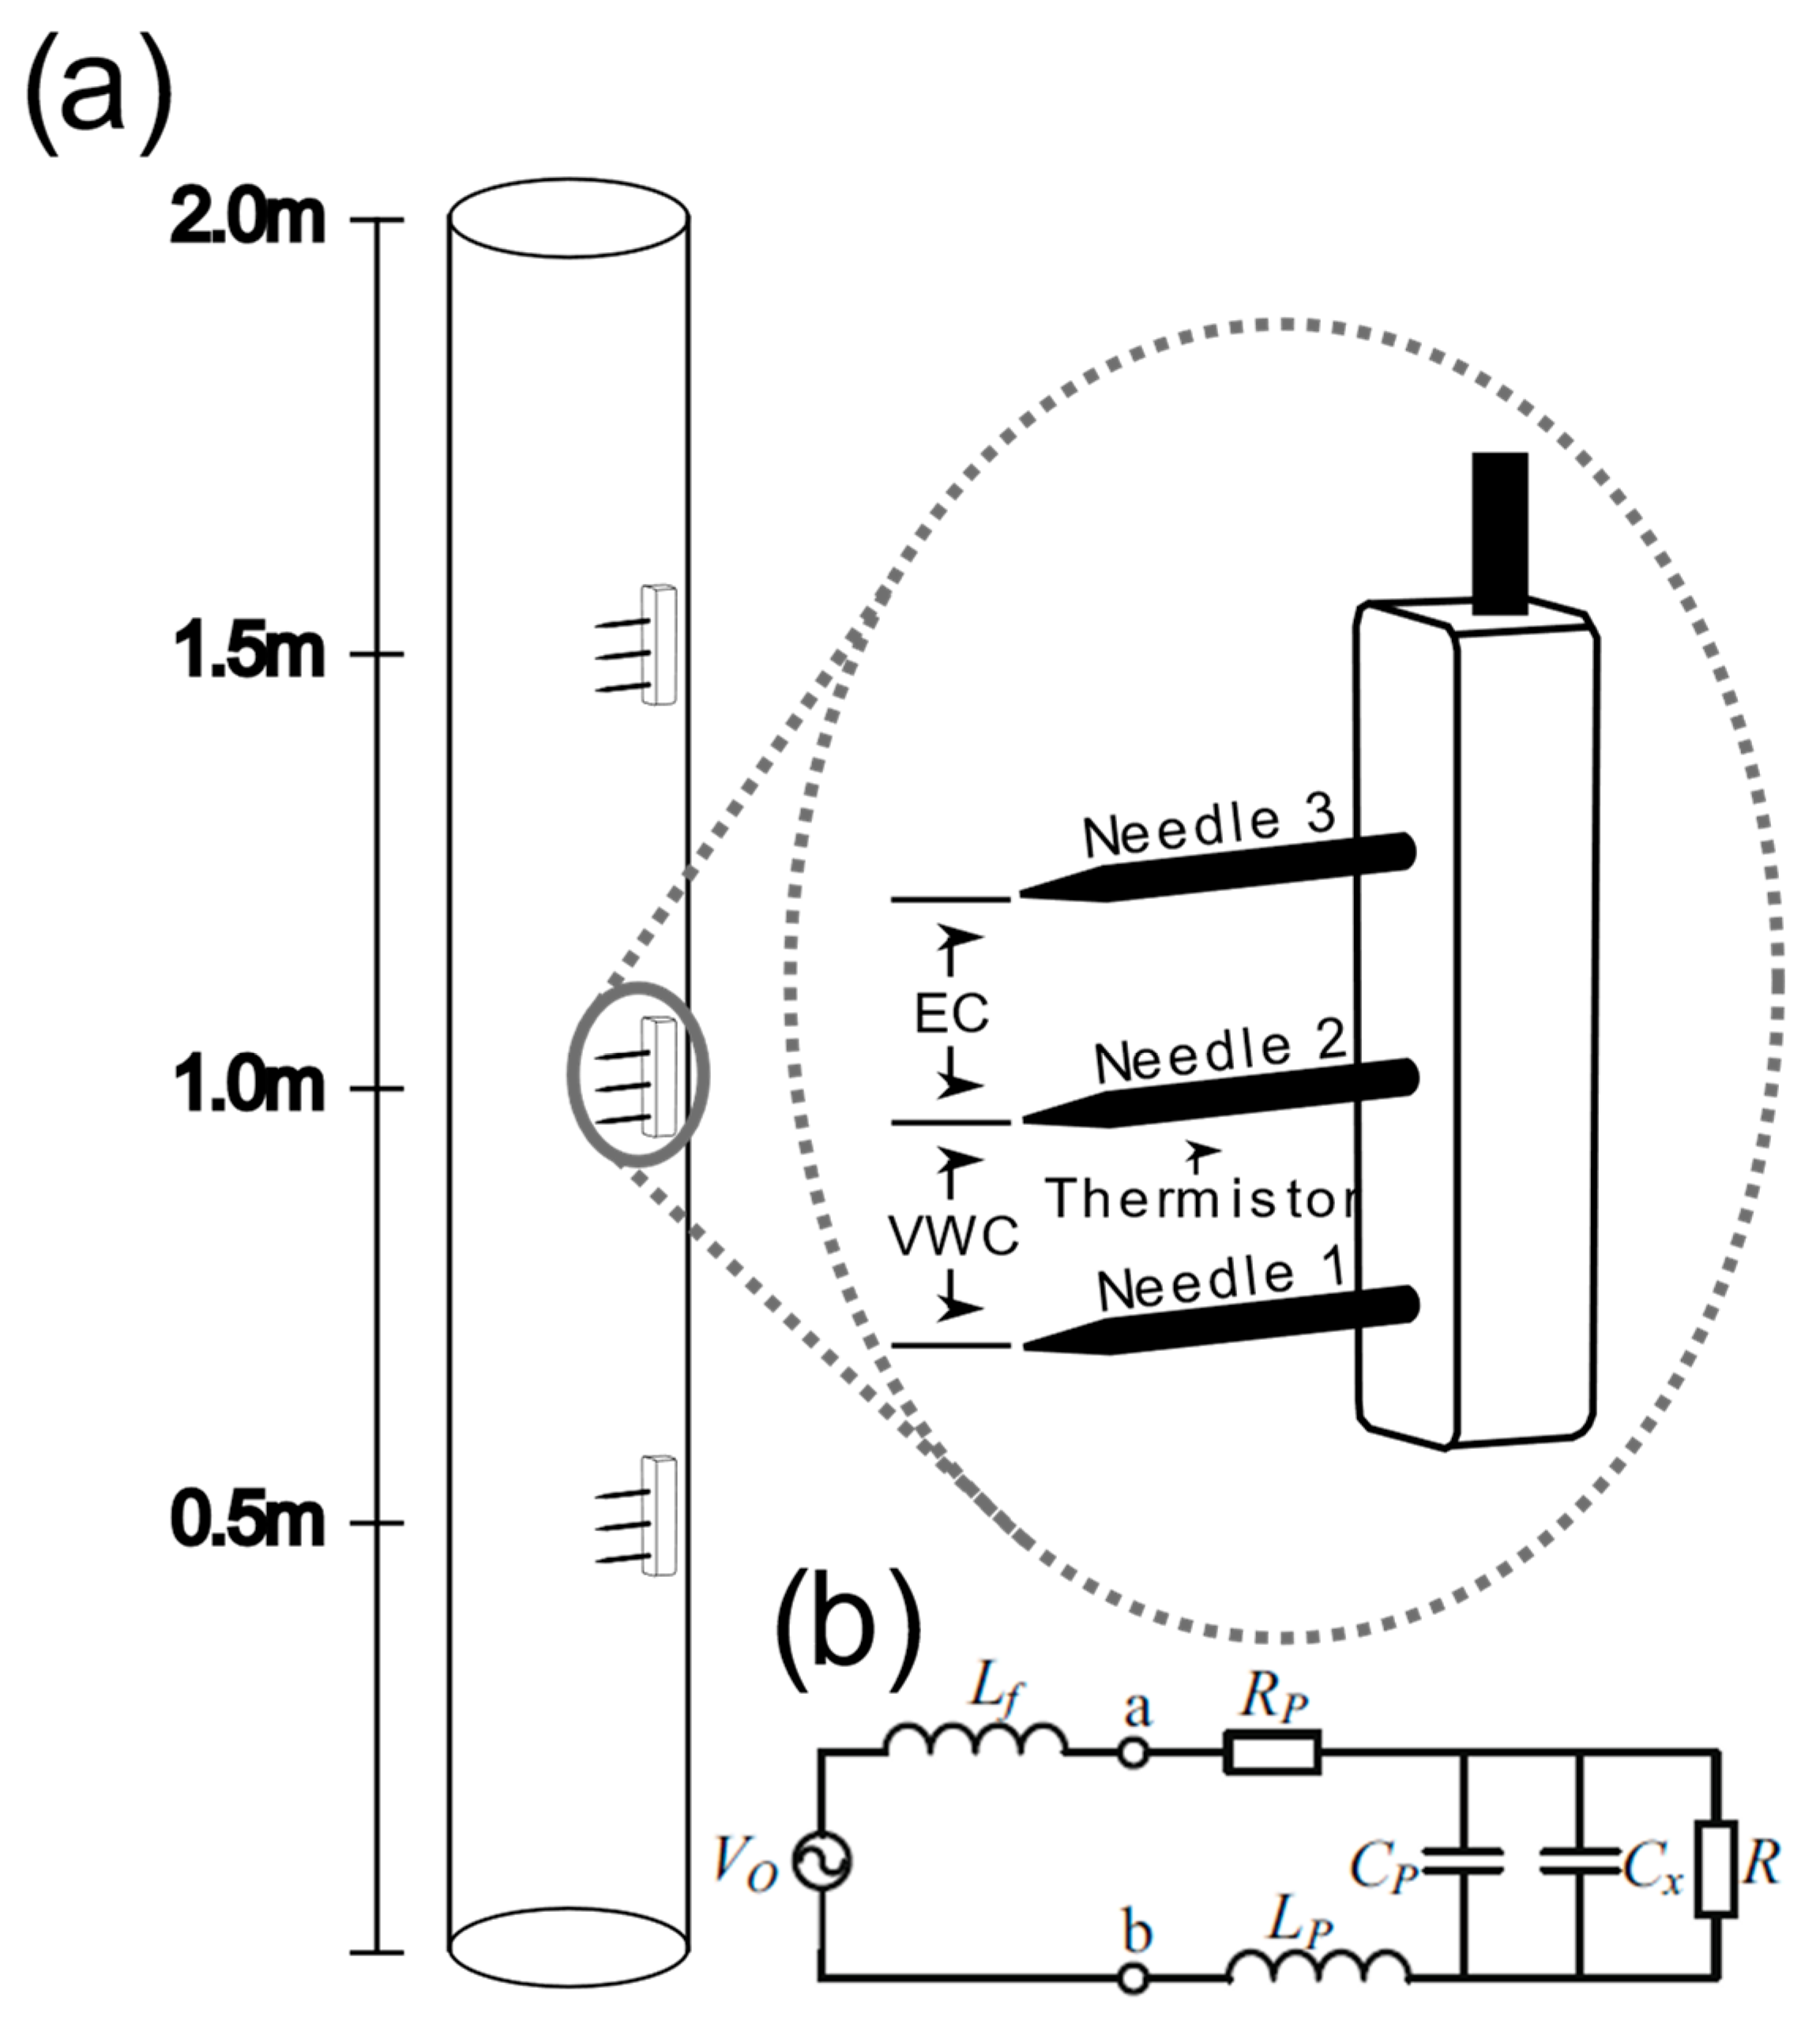
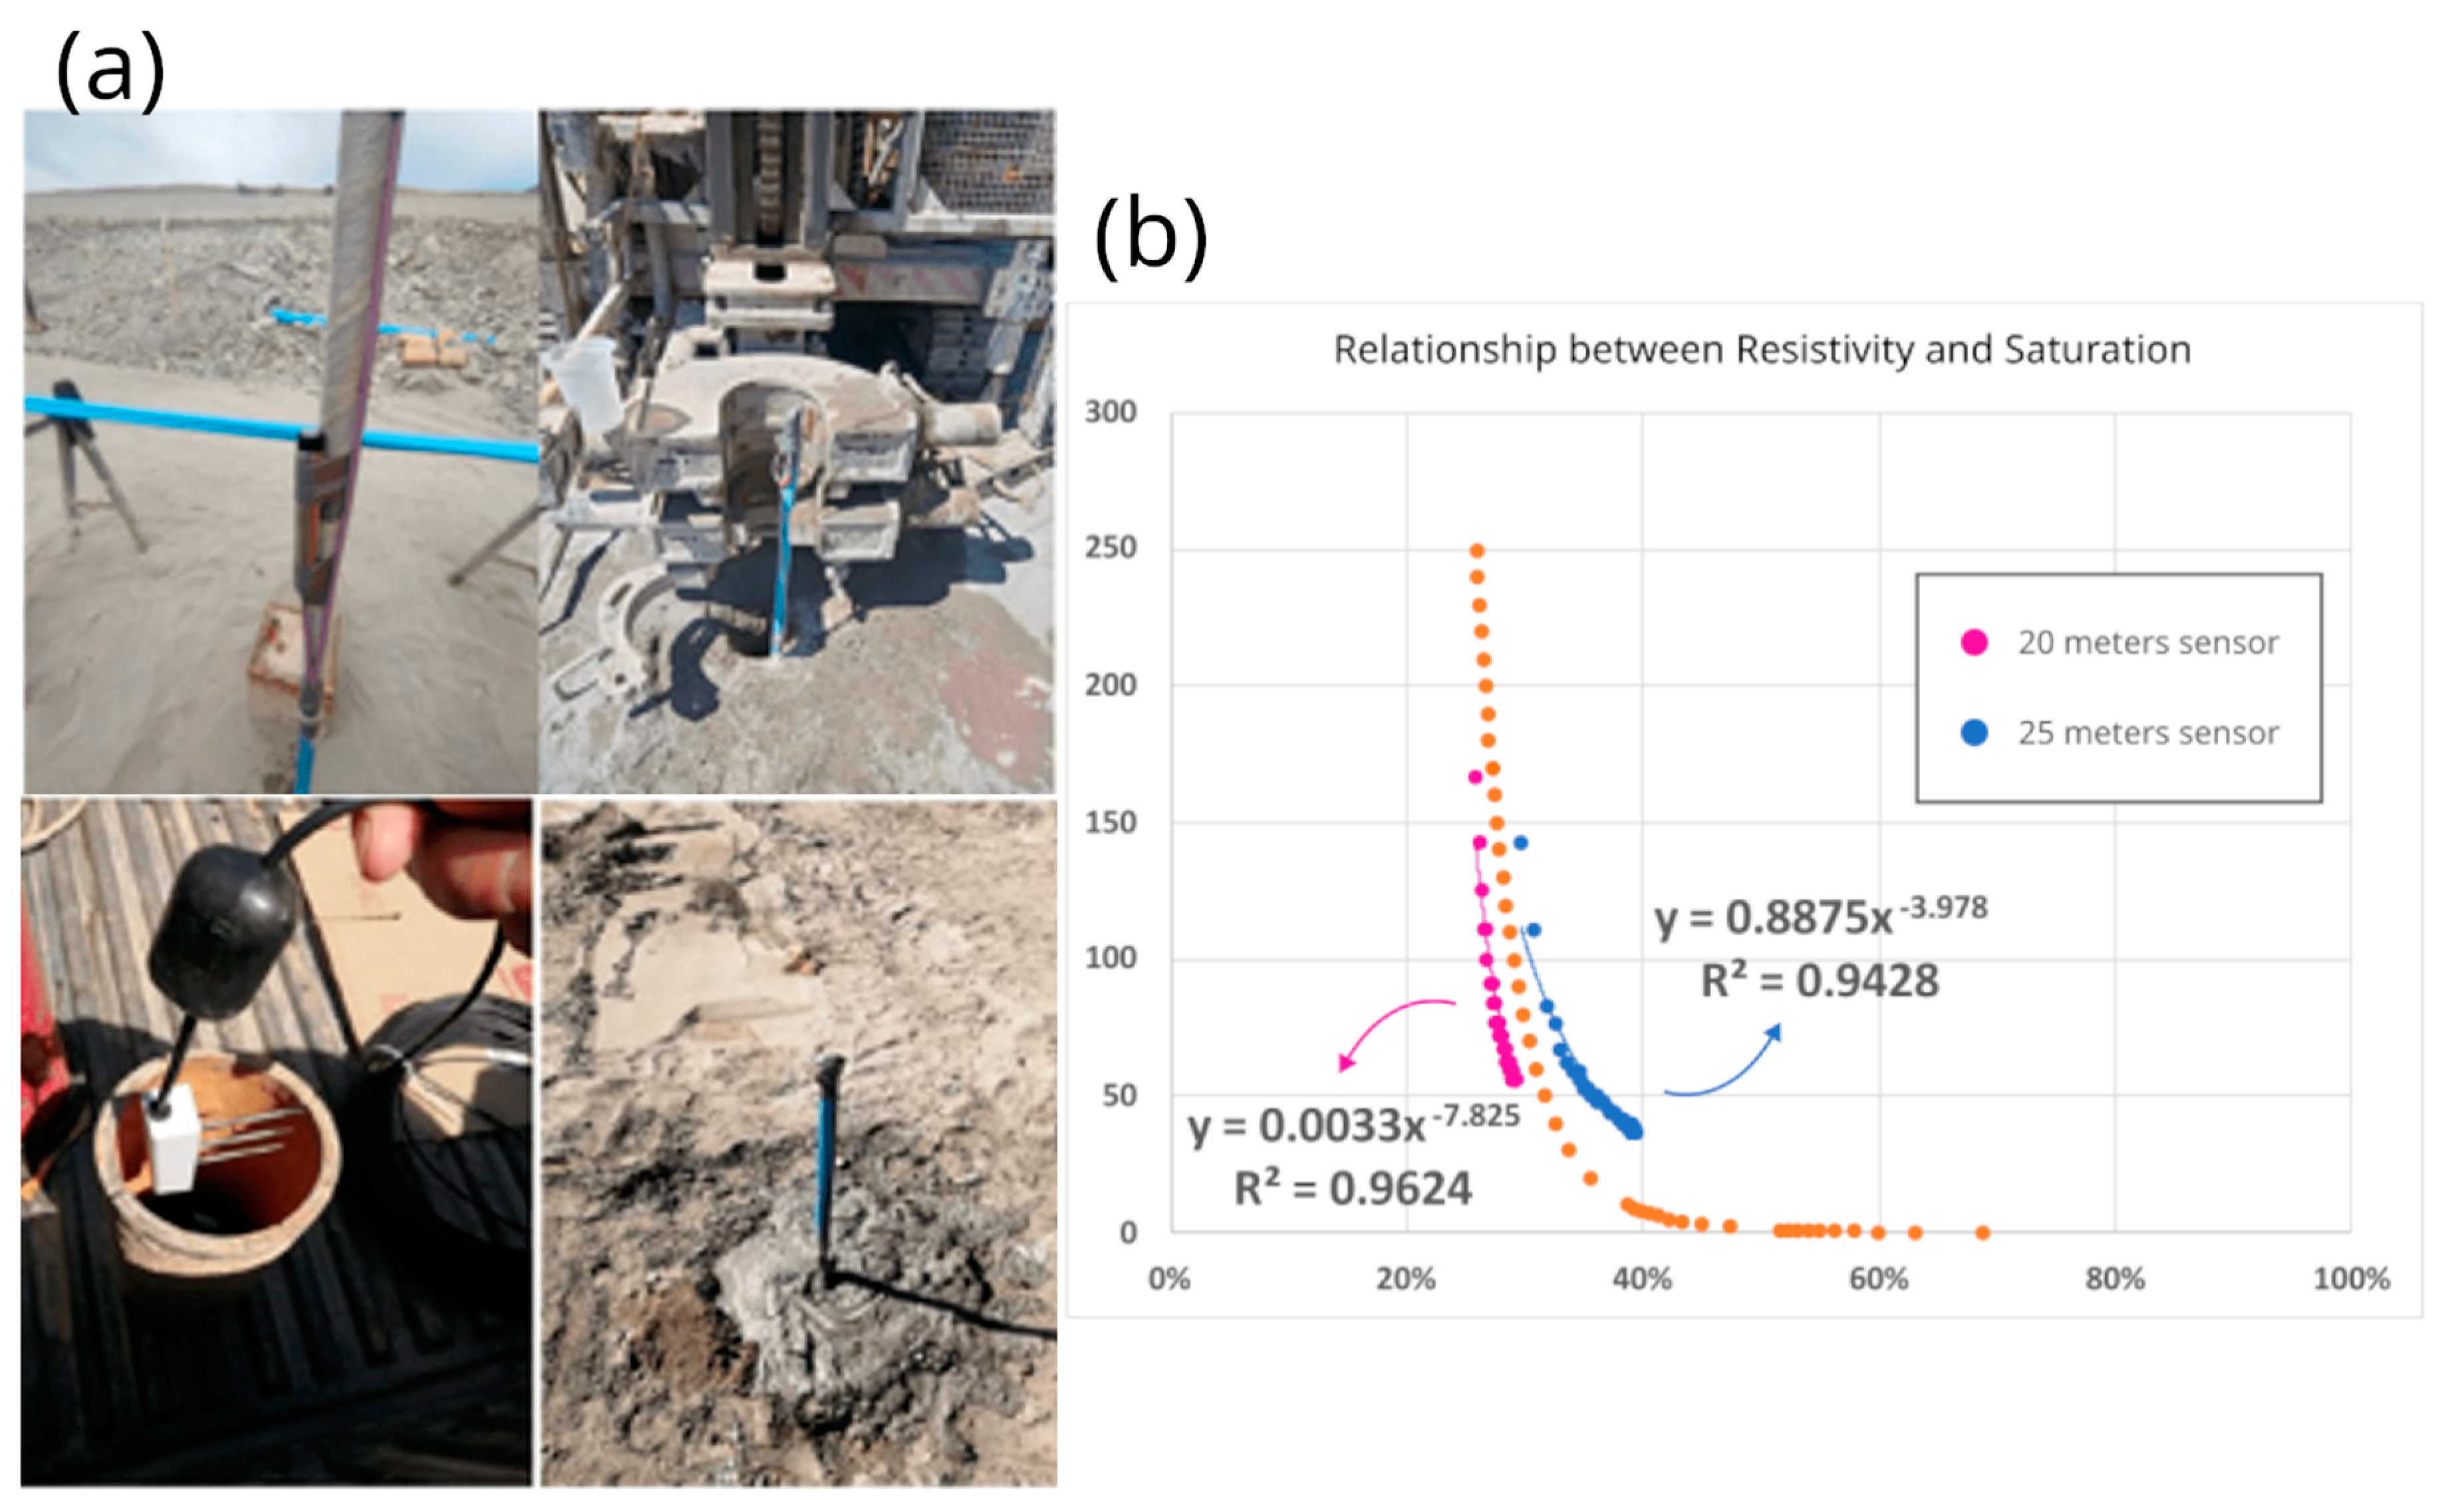
3.3. Field-Deployed High-Frequency Humidity Sensors

In the case of the moisture sensors installed in Well n2, this study utilized the EC resistivity relationship as described in Section 2. Over the approximately 6-month measurement period for both sensors, a subtle upward trend in moisture saturation values is evident. However, this limited variability is consistent with the inactive status of the tailings deposit. For the sensor located at a depth of 20 m, the VVW values (related to saturation) are in the range of 25% to 30%. Conversely, the sensor located at a depth of 25 m shows values ranging from 30% to 40%.
Using the same procedure as for the laboratory tests, the resistivity values are plotted against the percentage of saturation (Figure 6b). The moisture curves obtained by exponentially fitting the measurements from the TEROS sensors placed in the field allowed us to determine the parameters that best fit this behavior according to Archie’s empirical law. (shown in Table 2).
Then, from the Archie law equation, we can obtain the VWC (related with saturation) for this depth as follows:
S r · φ = V W C = ρ K 1 p = ρ 0.005 1 8

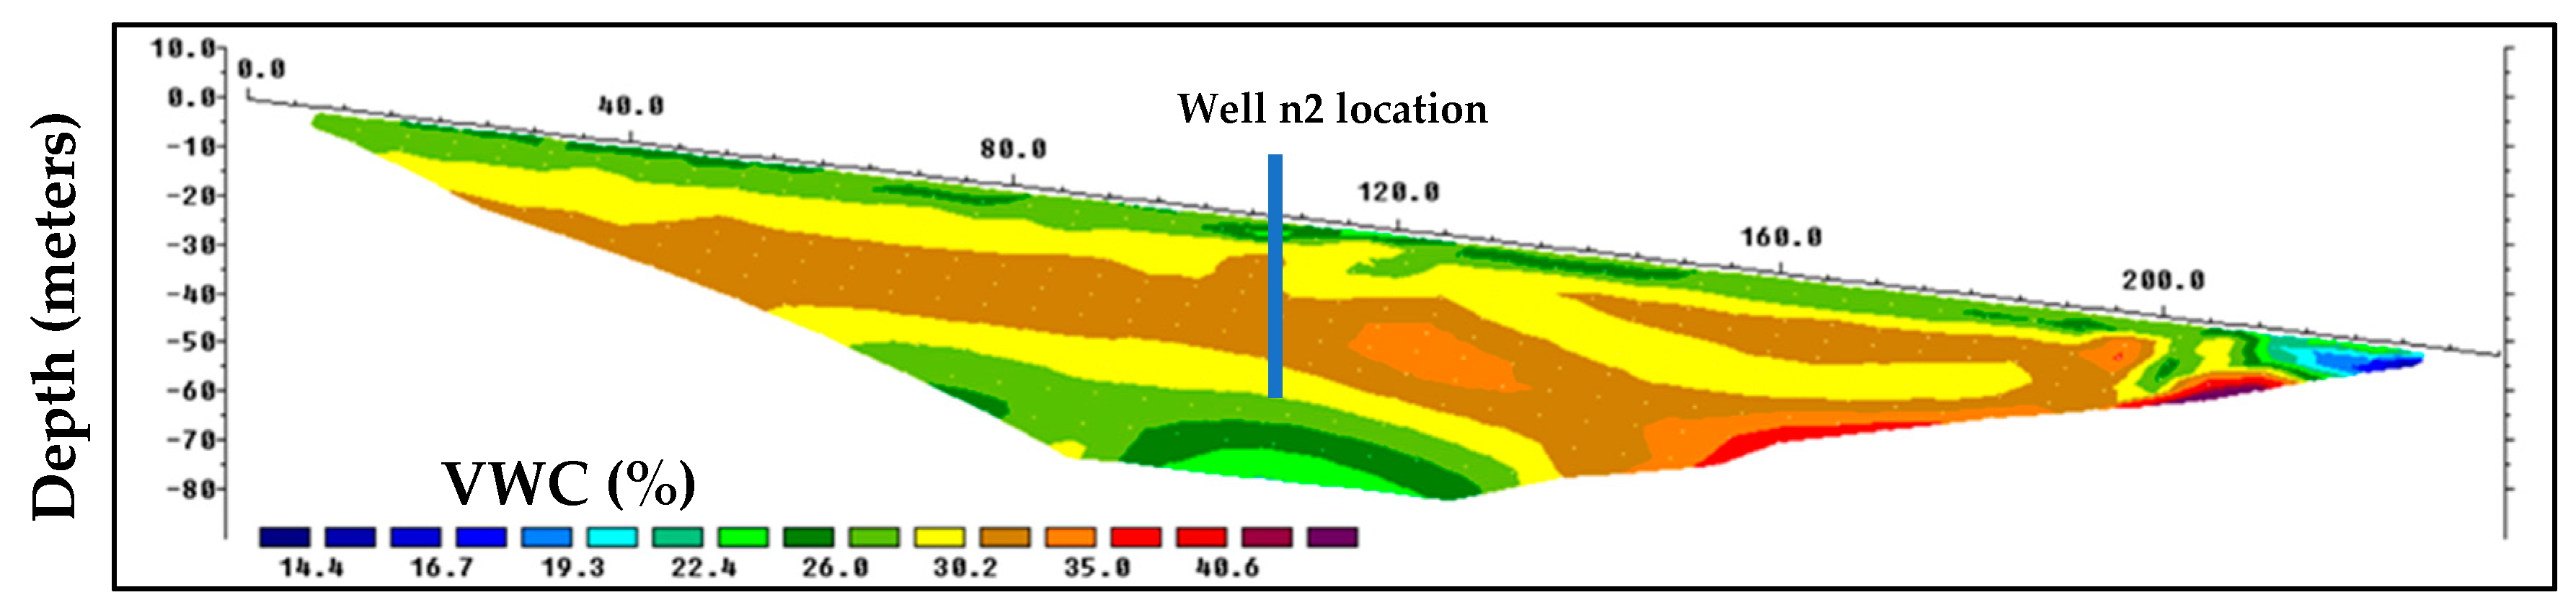
3.4. Comparative Results

The depth gradient in resistivity, as shown in the ERT profiles in Figure 3b, is consistent with the moisture sensor data. The resistivity values decrease from 78 to 55 [ohms] in the ERT profiles and from 65 to 45 [ohms] in the moisture sensors within this specific area. This observed shift corresponds to an approximate 30% reduction in resistivity in both instrument readings. Crucially, the moisture sensor readings show a direct correlation with the instrument’s second measurement (VWC).
While we have observed comparable values at both sensor locations, it is pertinent to recognize a limitation associated with escalating material pressure as observations extend to greater depths. Therefore, it is prudent to include the effects of this confinement in subsequent studies. This is expected to result in reduced total porosities for deeper targets [21], resulting in shifts in saturation levels influenced not only by the instrument-measured VWC but also by a decrease in porosity and an increase in pore volume pressure.
Applying the proposed methodology to extrapolate the relationship obtained for the depth sensors (Figure 6b) to ERT profile 1b obtained (Figure 3), an approximation of the VWC is derived from the inverted resistances using Archie’s equation. The result is shown in Figure 7. The resistivity values were adjusted according to the proportionality found by ERT and the sensors as follows:
ρ E R T = k   ρ T E R O S 12 = 1.2 ρ T E R O S 12
It is important to note that the values shown in Figure 7 are adjusted to the target depth, which coincides with the position of the TEROS12 sensors. Therefore, the estimated VWC may have progressively higher uncertainties as we move away from this depth.

4. Conclusions

This research presented an approach to a new methodology for moisture identification using soil moisture sensors and ERT profiles, installed on the front wall of a tailings dam.
A non-traditional method of determining the moisture content of the tailings dam wall was successfully implemented without the need for excessive laboratory sampling (as with dry samples, measuring mass, and calculating Archie’s law in the lab).
Moisture sensor transducers provide a direct measurement of soil parameters of VWC and EC, obtaining depth-specific saturation levels for a point in a borehole. ERT profiles derive an indirect measurement of soil resistivity parameters at depth for a wide area. The results are presented where the relationship between VWC and resistivity can be modeled by Archie’s Law equation and used to convert the ERT profile to a saturation profile.
This integration of field instrumentation is a promising technique for developing an innovative and practical methodology for monitoring moisture in tailings dams. The demonstration of its utility requires testing it on more sites for it to become a well-documented methodology where we can take statistics with clear uncertainties. Nevertheless, the proof of concept was an important step achieved during this research on a tailings dam, where one of the main issues was the possibility of building a remote moisture monitoring system. Other sites are being explored to continue the investigation.

Author Contributions

Conceptualization, D.C.; methodology, L.C.; validation, L.C. and A.M.; investigation, L.C. and A.M.; resources, D.C. and I.B.; writing—original draft preparation, A.M.; writing—review and editing, D.C. and A.M.; supervision, D.C.; project administration, D.C.; funding acquisition, D.C. and I.B. All authors have read and agreed to the published version of the manuscript.

Funding

This research was funded by Advanced Mining Technology Center ANID grants AFB180004, AFB220002, and AFB230001.

Data Availability Statement

Data are available at https://drive.google.com/drive/folders/12PEt2Rcq6j_TK93VQ2P-AocrsWdh7TRq (accessed on 21 July 2024).

Acknowledgments

This work was carried out within the framework of the Advanced Mining Technology Center ANID Projects AFB180004, AFB220002, and AFB230001.

Conflicts of Interest

Authors Leopoldo Córdova and Igor Bravo were employed by the company Geosinergia Ingeniería y Medioambiente. The remaining authors declare that the research was conducted in the absence of any commercial or financial relationships that could be construed as a potential conflict of interest.

References

  1. Dimech, A.; Cheng, L.; Chouteau, M.; Chambers, J.; Uhlemann, S.; Wilkinson, P.; Meldrum, P.; Mary, B.; Fabien-Ouellet, G.; Isabelle, A. A Review on Applications of Time-Lapse Electrical Resistivity Tomography Over the Last 30 Years: Perspectives for Mining Waste Monitoring. Surv. Geophys. 2022, 43, 1699–1759. [Google Scholar] [CrossRef] [PubMed]
  2. Aracil Ávila, E.; Maruri Brouard, U.; Vallés Iriso, J.; Martínez Pagán, P.; Porres Benito, J.Á. Evaluación de Problemas Medioambientales Mediante Tomografía Eléctrica. 2003. Available online: https://repositorio.upct.es/handle/10317/1993 (accessed on 21 July 2024).
  3. Jefferies, M.; Morgenstern, N.R.; Van Zyl, D.; Wates, J. Report on NTSF Embankment Failure. Cadia Valley Operations for Ashurst Australia; H356804-00000-22A-230–0001; Newcrest: Subiaco, Australia, 2019; p. 119. [Google Scholar]
  4. Segura, F.R.; Nunes, E.A.; Paniz, F.P.; Paulelli, A.C.C.; Rodrigues, G.B.; Braga, G.Ú.L.; dos Reis Pedreira Filho, W.; Barbosa, F., Jr.; Cerchiaro, G.; Silva, F.F. Potential risks of the residue from Samarco’s mine dam burst (Bento Rodrigues, Brazil). Environ. Pollut. 2016, 218, 813–825. [Google Scholar] [CrossRef] [PubMed]
  5. Camarero, P.L.; Moreira, C.A.; Pereira, H.G. Analysis of the Physical Integrity of Earth Dams from Electrical Resistivity Tomography (ERT) in Brazil. Pure Appl. Geophys. 2019, 176, 5363–5375. [Google Scholar] [CrossRef]
  6. Perri, M.T.; Boaga, J.; Bersan, S.; Cassiani, G.; Cola, S.; Deiana, R.; Simonini, P.; Patti, S. River embankment characterization: The joint use of geophysical and geotechnical techniques. J. Appl. Geophys. 2014, 110, 5–22. [Google Scholar] [CrossRef]
  7. Sjödahl, P.; Dahlin, T.; Johansson, S. Detection of internal erosion and seepage evaluation using resistivity monitoring. WasserWirtschaft 2007, 97, 54–56. [Google Scholar]
  8. Loke, M.H. Electrical imaging surveys for environmental and engineering studies. Pract. Guide 1999, 2, 70. [Google Scholar]
  9. Telford, W.M.; Geldart, L.P.; Sheriff, R.E. Applied Geophysics; Cambridge University Press: Cambridge, UK, 1990. [Google Scholar]
  10. Archie, G.E. The electrical resistivity log as an aid in determining some reservoir characteristics. Trans. AIME 1942, 146, 54–62. [Google Scholar] [CrossRef]
  11. Hou, H.; Han, W.; Li, T.; Wang, H.; Du, X.; Liu, Z.; Wang, L. Experimental Study on the Electrical Resistivity Characteristics of Uniformly Graded Calcareous Sand. Appl. Sci. 2023, 13, 11467. [Google Scholar] [CrossRef]
  12. Descloitres, M.; Ribolzi, O.; Le Troquer, Y.; Thiébaux, J.P. Study of water tension differences in heterogeneous sandy soils using surface ERT. J. Appl. Geophys. 2008, 64, 83–98. [Google Scholar] [CrossRef]
  13. Córdova, L.; Comte, D.; Diaz, D.; Bravo, I. ERT Methodology for Identifying Humidity Content in Tailings Dams. In AGU Fall Meeting Abstracts; 2022; Volume 2022, p. NS41A–01. Available online: https://agu.confex.com/agu/fm22/meetingapp.cgi/Paper/1094870 (accessed on 21 July 2024).
  14. Díaz, E.E.; Díaz, D.; Montes, G.; Vera, E. Estimación del grado de saturación a partir de resistividades eléctricas, aplicados al caso de una pila de lixiviación: Minera Amalia, Región de Valparaíso. Master’s Thesis, Universidad de Chile, Santiago, Chile, 2019. [Google Scholar]
  15. Sasaki, Y. Resolution of resistivity tomography inferred from numerical simulation 1. Geophys. Prospect. 1992, 40, 453–463. [Google Scholar] [CrossRef]
  16. Loke, M.H.; Barker, R.D. Rapid least-squares inversion of apparent resistivity pseudosections by a quasi-Newton method1. Geophys. Prospect. 1996, 44, 131–152. [Google Scholar] [CrossRef]
  17. Furman, A.; Ferré, T.P.; Warrick, A.W. A sensitivity analysis of electrical resistivity tomography array types using analytical element modeling. Vadose Zone J. 2003, 2, 416–423. [Google Scholar] [CrossRef]
  18. Binley, A.; Kemna, A. DC resistivity and induced polarization methods. In Hydrogeophysics; Springer: Dordrecht, The Netherlands, 2005; pp. 129–156. [Google Scholar] [CrossRef]
  19. Martínez, J.; Mendoza, R.; Rey, J.; Sandoval, S.; Hidalgo, M.C. Characterization of Tailings Dams by Electrical Geophysical Methods (ERT, IP): Federico Mine (La Carolina, Southeastern Spain). Minerals 2021, 11, 145. [Google Scholar] [CrossRef]
  20. Peixoto AS, P.; Pregnolato, M.C.; Silva, A.; Yamasaki, M.T.; Conte Junior, F. Development of an electrical resistivity measure for geotechnical and geoenvironmental characterization. In Proceedings of the 2nd International Symposium on Cone Penetration Testing, Huntington Beach, CA, USA, 9–11 May 2010; pp. 63–70. Available online: https://www.geoengineer.org/storage/publication/18335/publication_file/2574/1-09Peieoa.pdf (accessed on 21 July 2024).
  21. Zimmerman, R.W. Pore Volume and Porosity Changes under Uniaxial Strain Conditions. Transp. Porous Media 2017, 119, 481–498. [Google Scholar] [CrossRef]
Figure 1. (a) Georeferenced map of the front wall of Tranque 4 in El Soldado mine (coordinates in WGS84, 19S). (b) Top view of the tailings dam wall with ERT profiles in blue lines and the location of the moisture sensors in Well n2. (c) Photos of the ERT installation profile 1b.
Minerals 14 00760 g001
Figure 2. (a) Experimental setup of the PVC pipe with the three TEROS 12 moisture sensors and its details. The moisture sensor calculates two parameters directly in the surrounding soil, volume water content (VWC) between needles 1 and 2, and electrical conductivity (EC) between needles 2 and 3. (b) Electrical circuit diagram of the interaction between the sensor and the soil to find the VWC through the soil charge capacity.
Minerals 14 00760 g002
Figure 3. (a) The first image is the sensitivity map of profile 1b after rainfall with acquired data from 29 May 2022. (b) The second image present the inverted results of ERT profile 1b in two different acquisition dates (with the location of the moisture sensors in Well n2), 27 April 2022, acquired before rainfall, and 29 May 2022, acquired after rainfall.
Minerals 14 00760 g003
Figure 4. CPTc well core study near Well n2 in 2019, SCPT 19-03B.
Minerals 14 00760 g004
Figure 5. Laboratory test of moisture sensors in a PVC column reveals the evolution of VWC vs. Resistivity through time. In the graph, a second dry out test has been performed, with the calculation and adjustment of the Archie’s law equation. The yellow, gray, and blue graphs correspond to the data acquired from each TEROS 12 sensors in the lab column at 0.5, 1.0, 1.5 m height. The orange graph is the modeled curve through the potential equation for the TEROS 12 results at 1.5 m height sensor.
Minerals 14 00760 g005
Figure 6. (a) Photos of the moisture sensor installation in Well n2. (b) Measurement results of VWC vs. electrical resistivity for the moisture sensor at 25 m (blue dots) and 20 m (pink dots) and the fitting of Archie’s law (orange dots).
Minerals 14 00760 g006
Figure 7. Profile 1b converted to percent water content. The data used for this conversion are the ERT2D data from 29-05-2022 after rainfall. The location of Well n2 where the TEROS12 sensors were positioned is shown.
Minerals 14 00760 g007
Table 1. Parameters of Archie’s equation fitted for TEROS 12 sensors in lab column.
K p
Sensor at 1.5 m height0.71490.896
Sensor at 1 m height0.10192.593
Sensor at 0.5 m height0.05752.916
Table 2. Parameters of Archie equation fitted for results of TEROS 12 sensors in Well n2.
K p
Field-deployed TEROS12 Sensors in Well n20.0058
Disclaimer/Publisher’s Note: The statements, opinions and data contained in all publications are solely those of the individual author(s) and contributor(s) and not of MDPI and/or the editor(s). MDPI and/or the editor(s) disclaim responsibility for any injury to people or property resulting from any ideas, methods, instructions or products referred to in the content.

