Article

Location Prediction Study of Fluorite Ore in Shallow Cover Area: Evidence from Integrated Geophysical Surveys

1
Xi’an Center of Mineral Resources Survey, China Geological Survey, Xi’an 710100, China
2
School of Geophysics and Information Technology, China University of Geosciences, Beijing 100083, China
3
Technology Innovation Center for Gold Ore Exploration, China Geological Survey, Xi’an 710100, China
*
Author to whom correspondence should be addressed.
Minerals 2024, 14(8), 838; https://doi.org/10.3390/min14080838
Submission received: 29 June 2024 / Revised: 8 August 2024 / Accepted: 15 August 2024 / Published: 19 August 2024

Abstract

:
The Beishan region is a vital fluorite metallogenic belt in northwest China, characterized by favorable geological conditions for fluorite mineralization. However, being located in the Gobi Desert and affected by shallow cover layers, only a few outcrops can be observed on the surface. Therefore, comprehensive geophysical research is necessary to locate and predict regional metallogenic potential and the spatial distribution of veins beneath the cover. This study conducted a combination of ground magnetic method (GM), induced polarization (IP) surveys, portable gamma-ray (PGR), portable X-ray fluorescence analyses (PXRF), and audio Magnetotelluric (AMT) to conduct comprehensive exploration. The IP and GM effectively identified concealed ore-bearing space distributions and ground PGR- and PXRF-constrained mineralization anomalies, while AMT surveys constructed deep electrical structure models for ore deposits. This approach delineated concealed fluorite deposit locations as well as potential magmatic–hydrothermal migration pathways. Engineering verification confirmed the effectiveness of this method combination. This study established a comprehensive geological–geophysical positioning prediction technique that can serve as a reference for locating and predicting fluorite deposits in shallow-covered areas within the Gobi Desert.

1. Introduction

Currently, the majority of global mineral resources exploration efforts have shifted towards the deep continent and the covering layer. The traditional mineral exploration space is no longer sufficient to meet the increasing resource demands of humanity, prompting the need to broaden the search for new mineral spaces. As a result, mineral exploration has increasingly emphasized concealed exploration targets, with geophysics playing an increasingly vital role in the exploration process.
The China–Pacific region is a significant producer of fluorite, second only to Mexico in terms of reserves [1]. Currently, fluorite deposits in China are primarily exploited from surface and near-surface resources in the eastern region. However, as shallow fluorite resources are gradually depleted, future efforts are expected to focus on exploring fluorite deposits in the deeper and semi-arid to arid areas of the central and western parts of the country [2,3].
Drawing on the ample successful exploration experiences in covered terrains [4,5,6,7] and considering the current status of mineral resource development, it is evident that conducting mineral exploration and comprehensive prediction work in Cenozoic-covered areas such as Gobi Desert-covered areas is undeniably one of the best choices. Previous researchers have conducted theoretical studies and practical explorations on mineral deposits in covered terrains [8,9,10,11,12], primarily focusing on polymetallic deposits enriched with sulfides, where the mineralization location is intricately linked to the polarization parameters obtained from induced polarization methods. Additionally, based on density and magnetization anomalies, researchers have identified concealed rock body positions and forms using large-scale gravity and magnetic data to determine prospective exploration areas [13,14,15], showcasing a clear research direction. However, research on ore deposit prediction for concealed fluorite deposits still appears relatively weak. Given the insignificant differences in physical properties of fluorite and the limited scale of near-surface ore bodies typically exhibiting vein-like distributions, exploration techniques have predominantly focused on geochemical analysis and remote sensing interpretation [6,7,16,17]. Consequently, no notable geophysical exploration achievement currently targets concealed fluorite deposits. Deep-seated prediction of fluorite deposits is highly significant. Large to super-large fluorite deposits exhibit significant differences in deep-seated morphology compared to surface outcrops [18], suggesting substantial mineralization potential at depth. This underscores the necessity for penetrating geophysical methods to provide effective information regarding the occurrence of fluorite deposits beneath the Gobi Desert-covered area.
Due to the complexity of geological features, relying solely on individual geophysical, geochemical, or remote sensing anomalies makes it challenging to draw reliable conclusions in mineral resource prediction. In the case of epithermal vein-type fluorite deposits in the Gobi Desert shallow-covered areas, using integrated exploration methods primarily focusing on geophysical methods for ore body location prediction research is imperative. Moreover, characterizing the three-dimensional distribution of deep-seated fluorite deposits holds significant importance in the quest for concealed non-metallic sulfide mineral deposits.

2. Regional Geological and Geophysical Characteristics

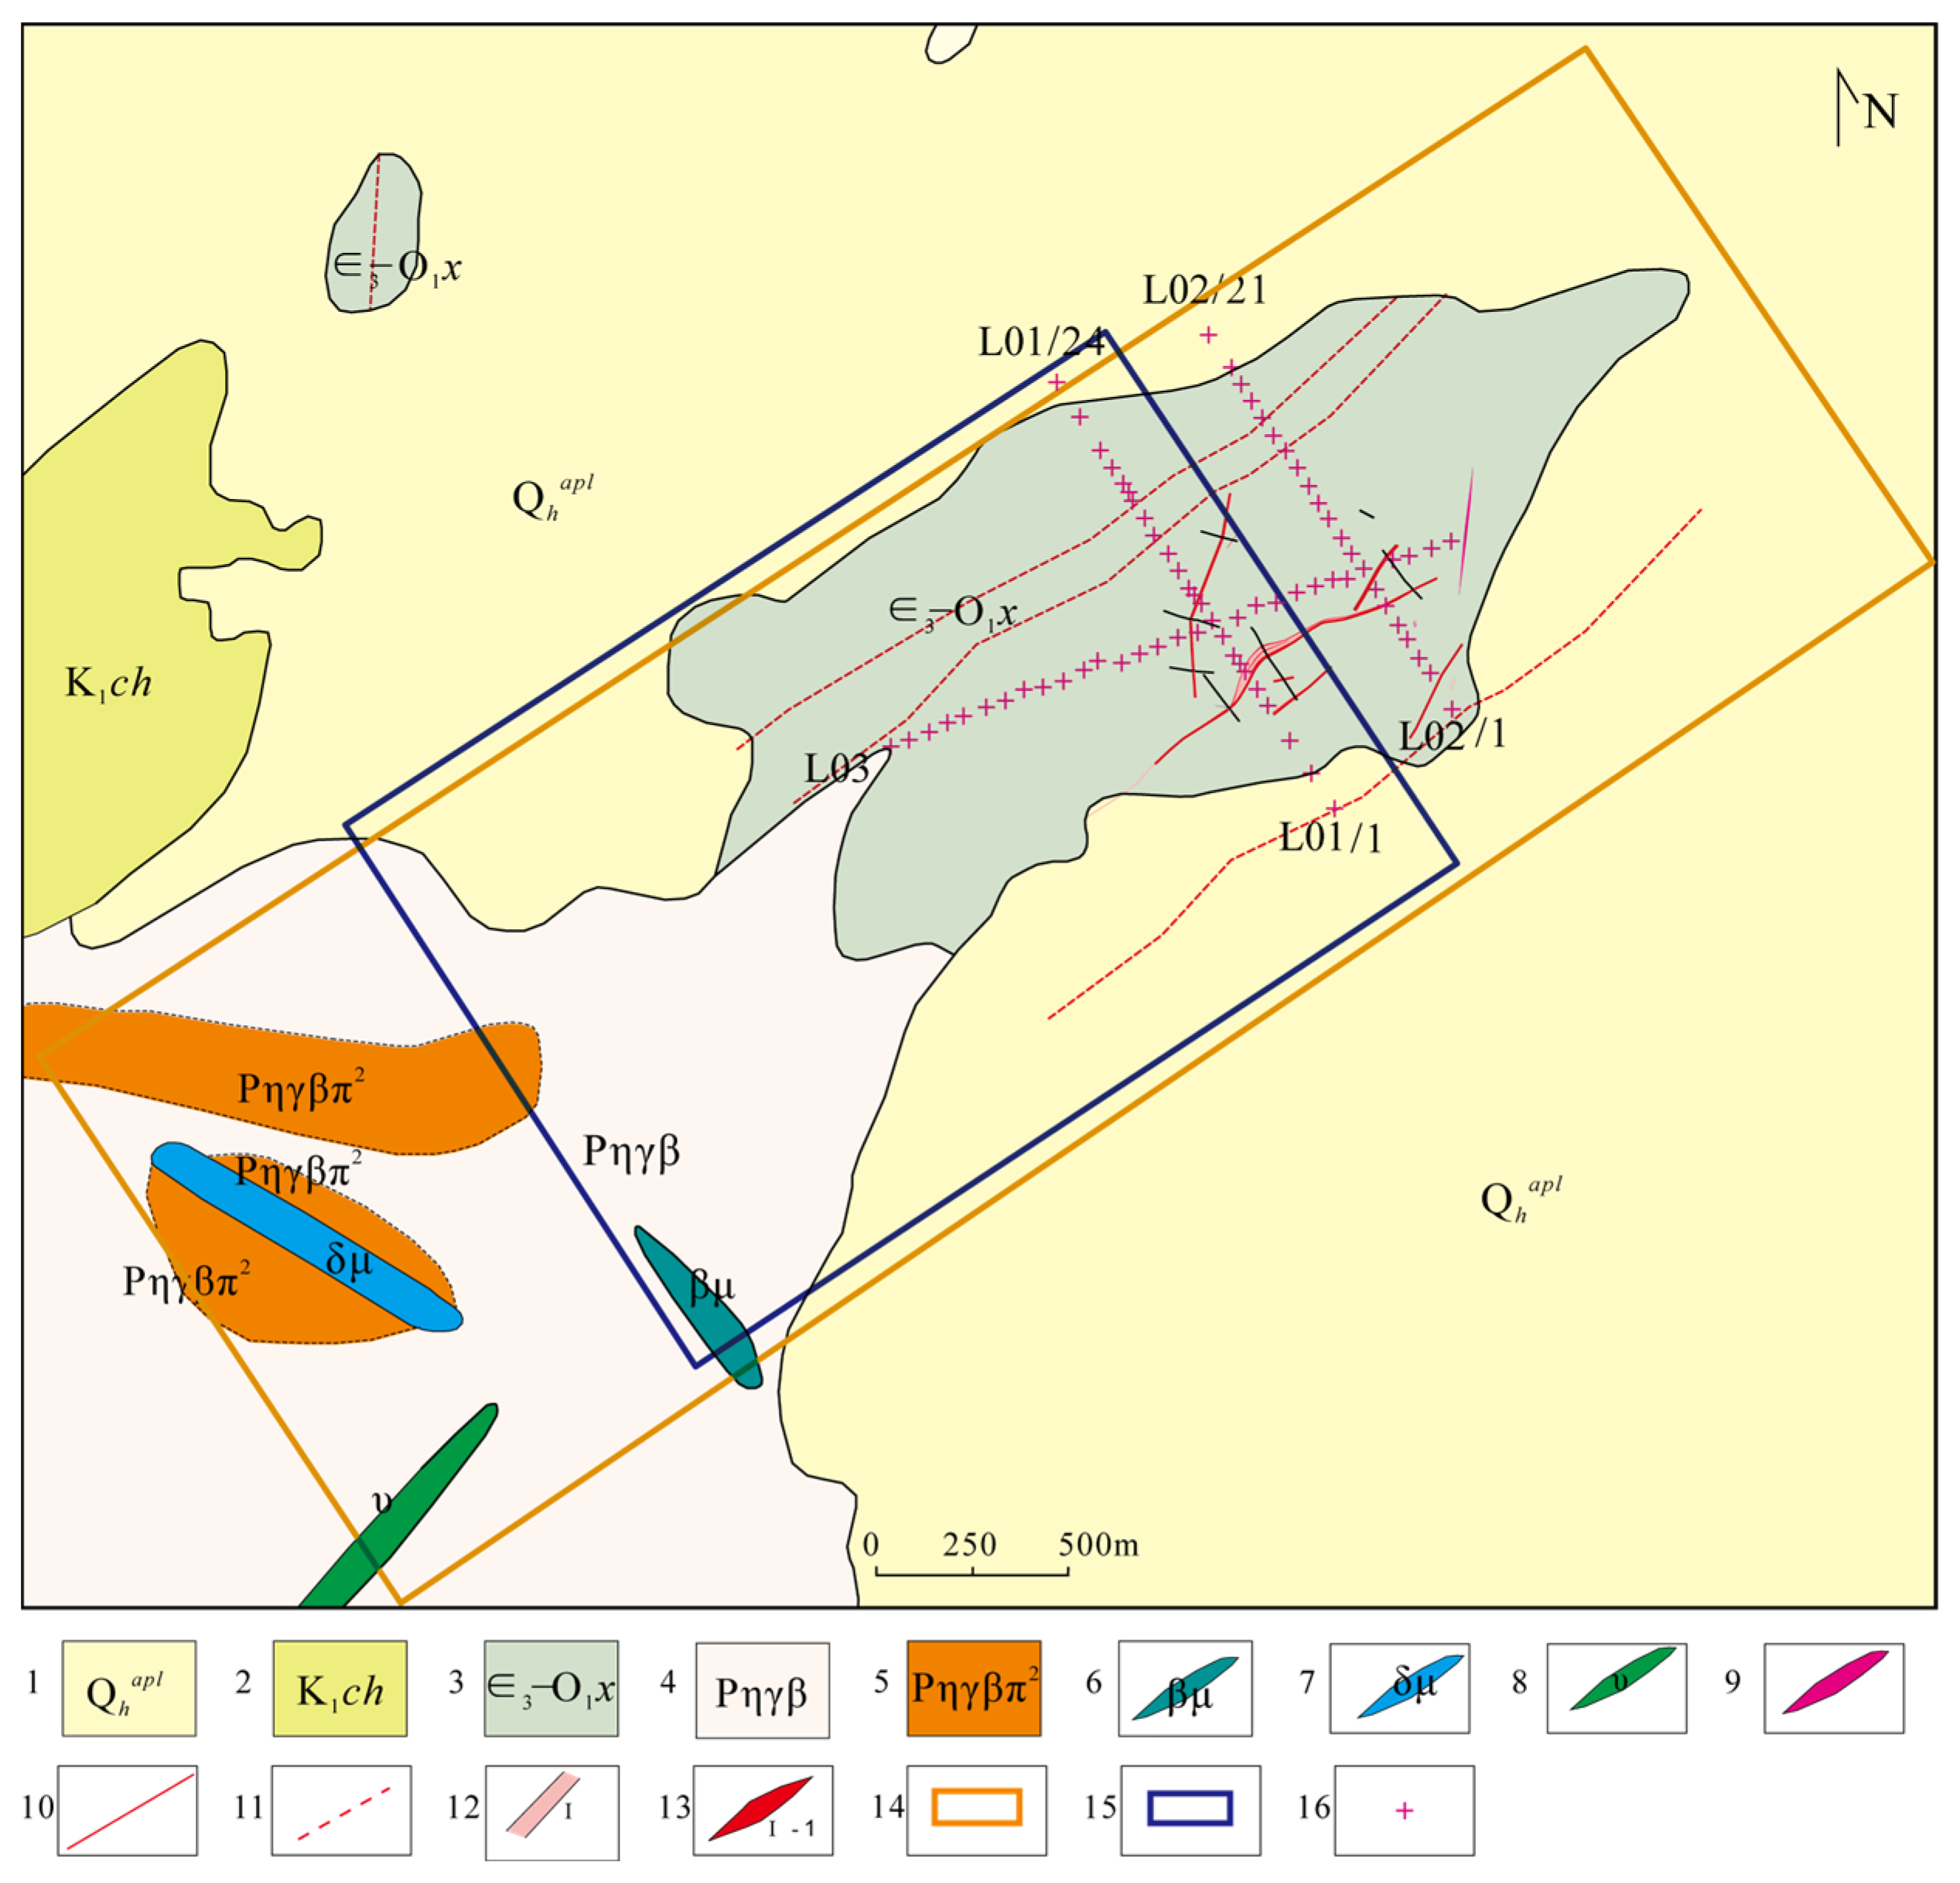
2.1. Regional Geology

The research area is located in the eastern part of the Beishan metallogenic belt (refer to Figure 1). Positioned in the tectonic setting of the Tarim–Mongolia Plate, Siberian Plate, and Kazakhstan Plate intersection, the area lies within the middle section of the Tianshan–Xingmeng Orogenic Belt, a globally typical accretionary orogenic belt formed by subduction–collision processes from the early Neoproterozoic to Paleozoic eras [19,20,21]. The eastern segment of the Beishan region is characterized by a series of near-EW trending major faults, as well as NE trending faults [22]. Magmatic rocks of various ages generally exhibit northwest or near east–west-oriented band-like distributions consistent with regional tectonic lineaments. Fluorite deposits (points) in the region predominantly belong to the meso-low temperature magmatic–hydrothermal type, occurring in the area south of Huashitoushan–Gudongjing–Shahongshan. These deposits are mainly controlled by northeast, near north–south, and northwest-trending fault structures, displaying diverse host rocks, with the Yanshan period being predominant. Deposits such as the Jiaochigou fluorite deposit and the large tungsten–tin–rubidium fluorite deposit at Dongqiyi Mountain have been identified in the area, establishing it as a significant concentration zone for fluorite, tungsten, tin, rubidium, and beryllium mineralization within the Beishan metallogenic belt [23,24]. The study of the distribution patterns of fluorite deposits in the eastern Beishan area indicates a close association between the formation of fluorite deposits (points) and calcareous constructions, as well as intermediate-acidic volcanic or intrusive rocks. The northeast, near north–south, near east–west, and northwest-trending fault structures constitute the primary ore-hosting and ore-controlling structures for fluorite mineralization in the region, where the northeast and near north–south extensional structures are particularly favorable for mineralization. Moreover, the fluorite deposits in the area are predominantly hydrothermal infill-type deposits. Therefore, the detection of deep-seated fault structures and concealed rock bodies in the desert shallow-covered area is crucial for predicting the location and occurrence of structures that control hydrothermal solution movement within the region.

2.2. Deposit Geology

The research area is situated on the northern side of the Xichangjing suture zone, at the southeastern margin of the early Paleozoic active continental margin of Gongpoquan–Dongqiyi Mountain, within the Gongpoquan–Dongqiyi Mountain metallogenic subzone. The fluorite deposits are found at the contact zone between rock bodies and strata, with the limited outcrop of strata in the area covered mainly by Quaternary deposits. In the northern part of the Suosuo Well rock body, the Cambrian–Ordovician West Shuangyingshan Formation strata are exposed, hosting ore structures that are lenses of sandstone interbedded with limestone within the West Shuangyingshan Formation. The area is characterized by a developed fault system, primarily trending northeast at around 55°, clearly visible on remote sensing images as a continuous negative topography. Additionally, a group of near-north–south-trending faults is also present, showing a lesser extent of extension [25]. The ore-controlling structures consist of two sets of northeast-trending faults forming a fault zone with strike-slip characteristics, with the near north–south-trending faults acting as secondary extensional faults sandwiched between the two northeast-trending faults. In the southern part, there are porphyritic biotite monzonitic granite rocks, with surrounding rocks showing alteration mainly characterized by hematization, limonitization, silicification, and gypsumization. The Suosuo Well rock body is exposed in the southern part, appearing as a rock mass outcrop, initially intrusive with fine-grained granite diorite in the late Silurian and later intruded by medium-grained porphyritic biotite monzonitic granite in the late Permian. The northeast-trending fault zone and the near evenly spaced north–south-trending fault structures between them collectively control the occurrence of structurally hydrothermal-type fluorite ore points at Huashitou Mountain (refer to Figure 1). The terrain in the area is relatively flat, with different degrees of surface covered by aeolian erosion material. Except for some exposed strata, the regional geological conditions are unclear, emphasizing the urgent need for penetrating methods to assess the mineralization potential and possible occurrence locations of fluorite deposits in the area.

2.3. Geophysical Characteristics of the Deposit

The predominant fluorite ore type in this area is the quartz–fluorite type, found in tectonic fault zones within rock bodies and formations without specific selectivity towards the surrounding rocks [26]. The surrounding rocks in the study area mainly consist of sandstone formations, with extensive Quaternary cover to the north and south. The extent of westward intrusion of rock bodies and the temporal–spatial relationships between the rock bodies and known mineral veins are not well defined. In several typical fluorite ore research areas, including this one, previous studies have indicated that fluorite ores exhibit minimal magnetism and typically manifest as negative magnetic anomalies in magnetic exploration results [27,28]. Quartz and ore-bearing quartz veins display weak magnetism, appearing as low magnetic anomalies (Table 1). If significant positive magnetic anomalies are generated by large-scale rock intrusions beneath the Quaternary cover in the study area, it could serve as compelling evidence for the source of fluorite mineralization and the mineralization mechanism. Statistical data on the physical properties of various fluorite ore regions indicate that, whether in magmatite, metamorphic, or sedimentary areas, the radioactive element content of fluorite is much lower than that of the host rock [29,30].

3. Integrated Geophysical Exploration and Processing

The majority of the study area is covered by varying degrees of aeolian erosion deposits, great surveys, and remote sensing technologies. Notably, the information provided by remote sensing techniques harbors numerous uncertainties, with their penetration capabilities in shallow-covered areas significantly inferior to geophysical exploration. Furthermore, the study area is situated in a desert environment characterized by a dry climate and high evaporation rates, leading to the formation of calcareous layers near the surface, posing challenges to mineral exploration primarily relying on geochemical methods. Although the fluorite ore exhibits limited differences in physical properties compared to the surrounding rocks [31,32], the geophysical targets that control hydrothermal solution movement are relatively well-defined based on their relationship with the deposit’s location. Previous studies on existing fluorite deposits have indicated that fluorite mineralization shows no selectivity towards its surrounding rocks [7], predominantly occurring in several sets of parallel vein-like structures within breccias and shallow shear zones (faults) [26]. This provides explicit and detectable targets for deep-seated positioning predictions, making the corresponding geophysical detection targets more discernible. The desert mentioned above, with shallow cover, is an ideal area for experimenting with different geophysical exploration techniques.
Regarding mineral exploration, the most critical issue is not where minerals come from but rather the positions within the upper crust where minerals concentrate to form economic ore deposits [33,34]. The prediction and localization of fluorite deposits in shallow-covered desert areas based on comprehensive geophysical exploration mainly involves three levels of issues. Firstly, it is essential to determine potential occurrences of fluorite deposits within the region, explicitly identifying structures that control hydrothermal solution movement. Secondly, evaluating the mineralization potential of these structures is crucial. Lastly, locating and exploring the deep morphology and distribution of verified shallow fluorite veins to establish a reliable geological–geophysical model for guiding mineral development.

3.1. Ground Magnetic Method (GM)

As a rapid and cost-effective geophysical method, ground magnetic surveying can comprehensively reflect the magnetic anomalies of geological bodies to indicate the magnetic anomaly features of ore-controlling structures and fault zones, thereby revealing the presence and approximate distribution of structural mineralization alteration zones [35]. The magnetic properties of quartz and mineral veins are weak, resulting in low magnetic anomalies. This is especially evident in areas where host rocks comprise magmatic rocks, which display strong positive magnetic anomalies [28,36].
The magnetic survey data were obtained from multiple NW-oriented survey lines traversing the study area, with a spacing of 50 m between the magnetic survey lines. The spacing between magnetic survey points ranges from 5 to 20 m, densifying near known geological clues. Covering the entire study also expands the scope appropriately to the southwest-exposed biotite granite body to establish a sufficient background field. The magnetic survey employed the GSM-19T (GEM System, Canada) for magnetic measurements. Generally, the method of reduction to the pole is used to align the center of the magnetic anomaly to the top of the magnetic body. Reduction to the pole requires magnetic inclination, magnetic declination, and other geomagnetic parameters, which vary with latitude, longitude, and time.
The regional magnetic field distribution of the study area (Figure 3) is divided into four parts from west to east. Combined with the results of previous physical property parameter determinations (Table 1), the magnetism of the surrounding rocks, such as sandstone and quartz veins, is relatively weak, corresponding to low magnetic anomalies. Intrusive rocks exhibit distinct positive magnetic anomalies compared to fluorite and quartz. Although fluorite has the weakest magnetism due to its limited scale, it predominantly manifests as a composite response after being filled fault zone with hydrothermal fluids, resulting in a weak positive anomaly. The southwest side is characterized by a high-value positive anomaly area exceeding 100 nT. The high magnetic anomaly on the southwest side of the study area is inferred to be the manifestation of secondary intrusion of mafic rock veins such as diabase veins. Combining the magnetic parameter determinations of specimens, the more widely exposed biotite granite exhibits a weak positive anomaly. The eastern side features a relatively stable magnetic field and is also the primary region where hidden fluorite vein mineralization was discovered in this study. Considering surface outcrops, it is evident that the host rocks of fluorite ore are predominantly sandstone, which is weakly magnetic to non-magnetic. Fluorite ore is nearly non-magnetic, with a minimal difference in magnetism between the two. The magnetic anomalies of the fluorite and the quartz veins are weak in the positive anomaly transition zone.
The magnetic anomalies in the calm field and trench exploration indicate no traces of intrusive bodies on the south side of the critical working area of the Huashitoushan fluorite mine. Currently, the overall mining area appears to be situated within faults of sandstone formations. There is a noticeable difference in magnetic field values between the eastern side of the region and the verified mineralized area. Therefore, it is speculated that the location of the white line in the figure represents a geological interface. To the east of the white dashed line, hidden, weakly magnetic granitic rock masses may exist beneath the sandstone formations. The magnetic anomaly effectively indicates the extent of hidden fluorite mineralization within the area. In particular, the use of the vertical first derivative of the magnetic anomaly (VFDMA) modulus can better determine the horizontal projection position and distribution scale of anomalous bodies (Figure 3b). This method is particularly effective in identifying structures that control hydrothermal activity in areas with less pronounced magnetic contrasts.

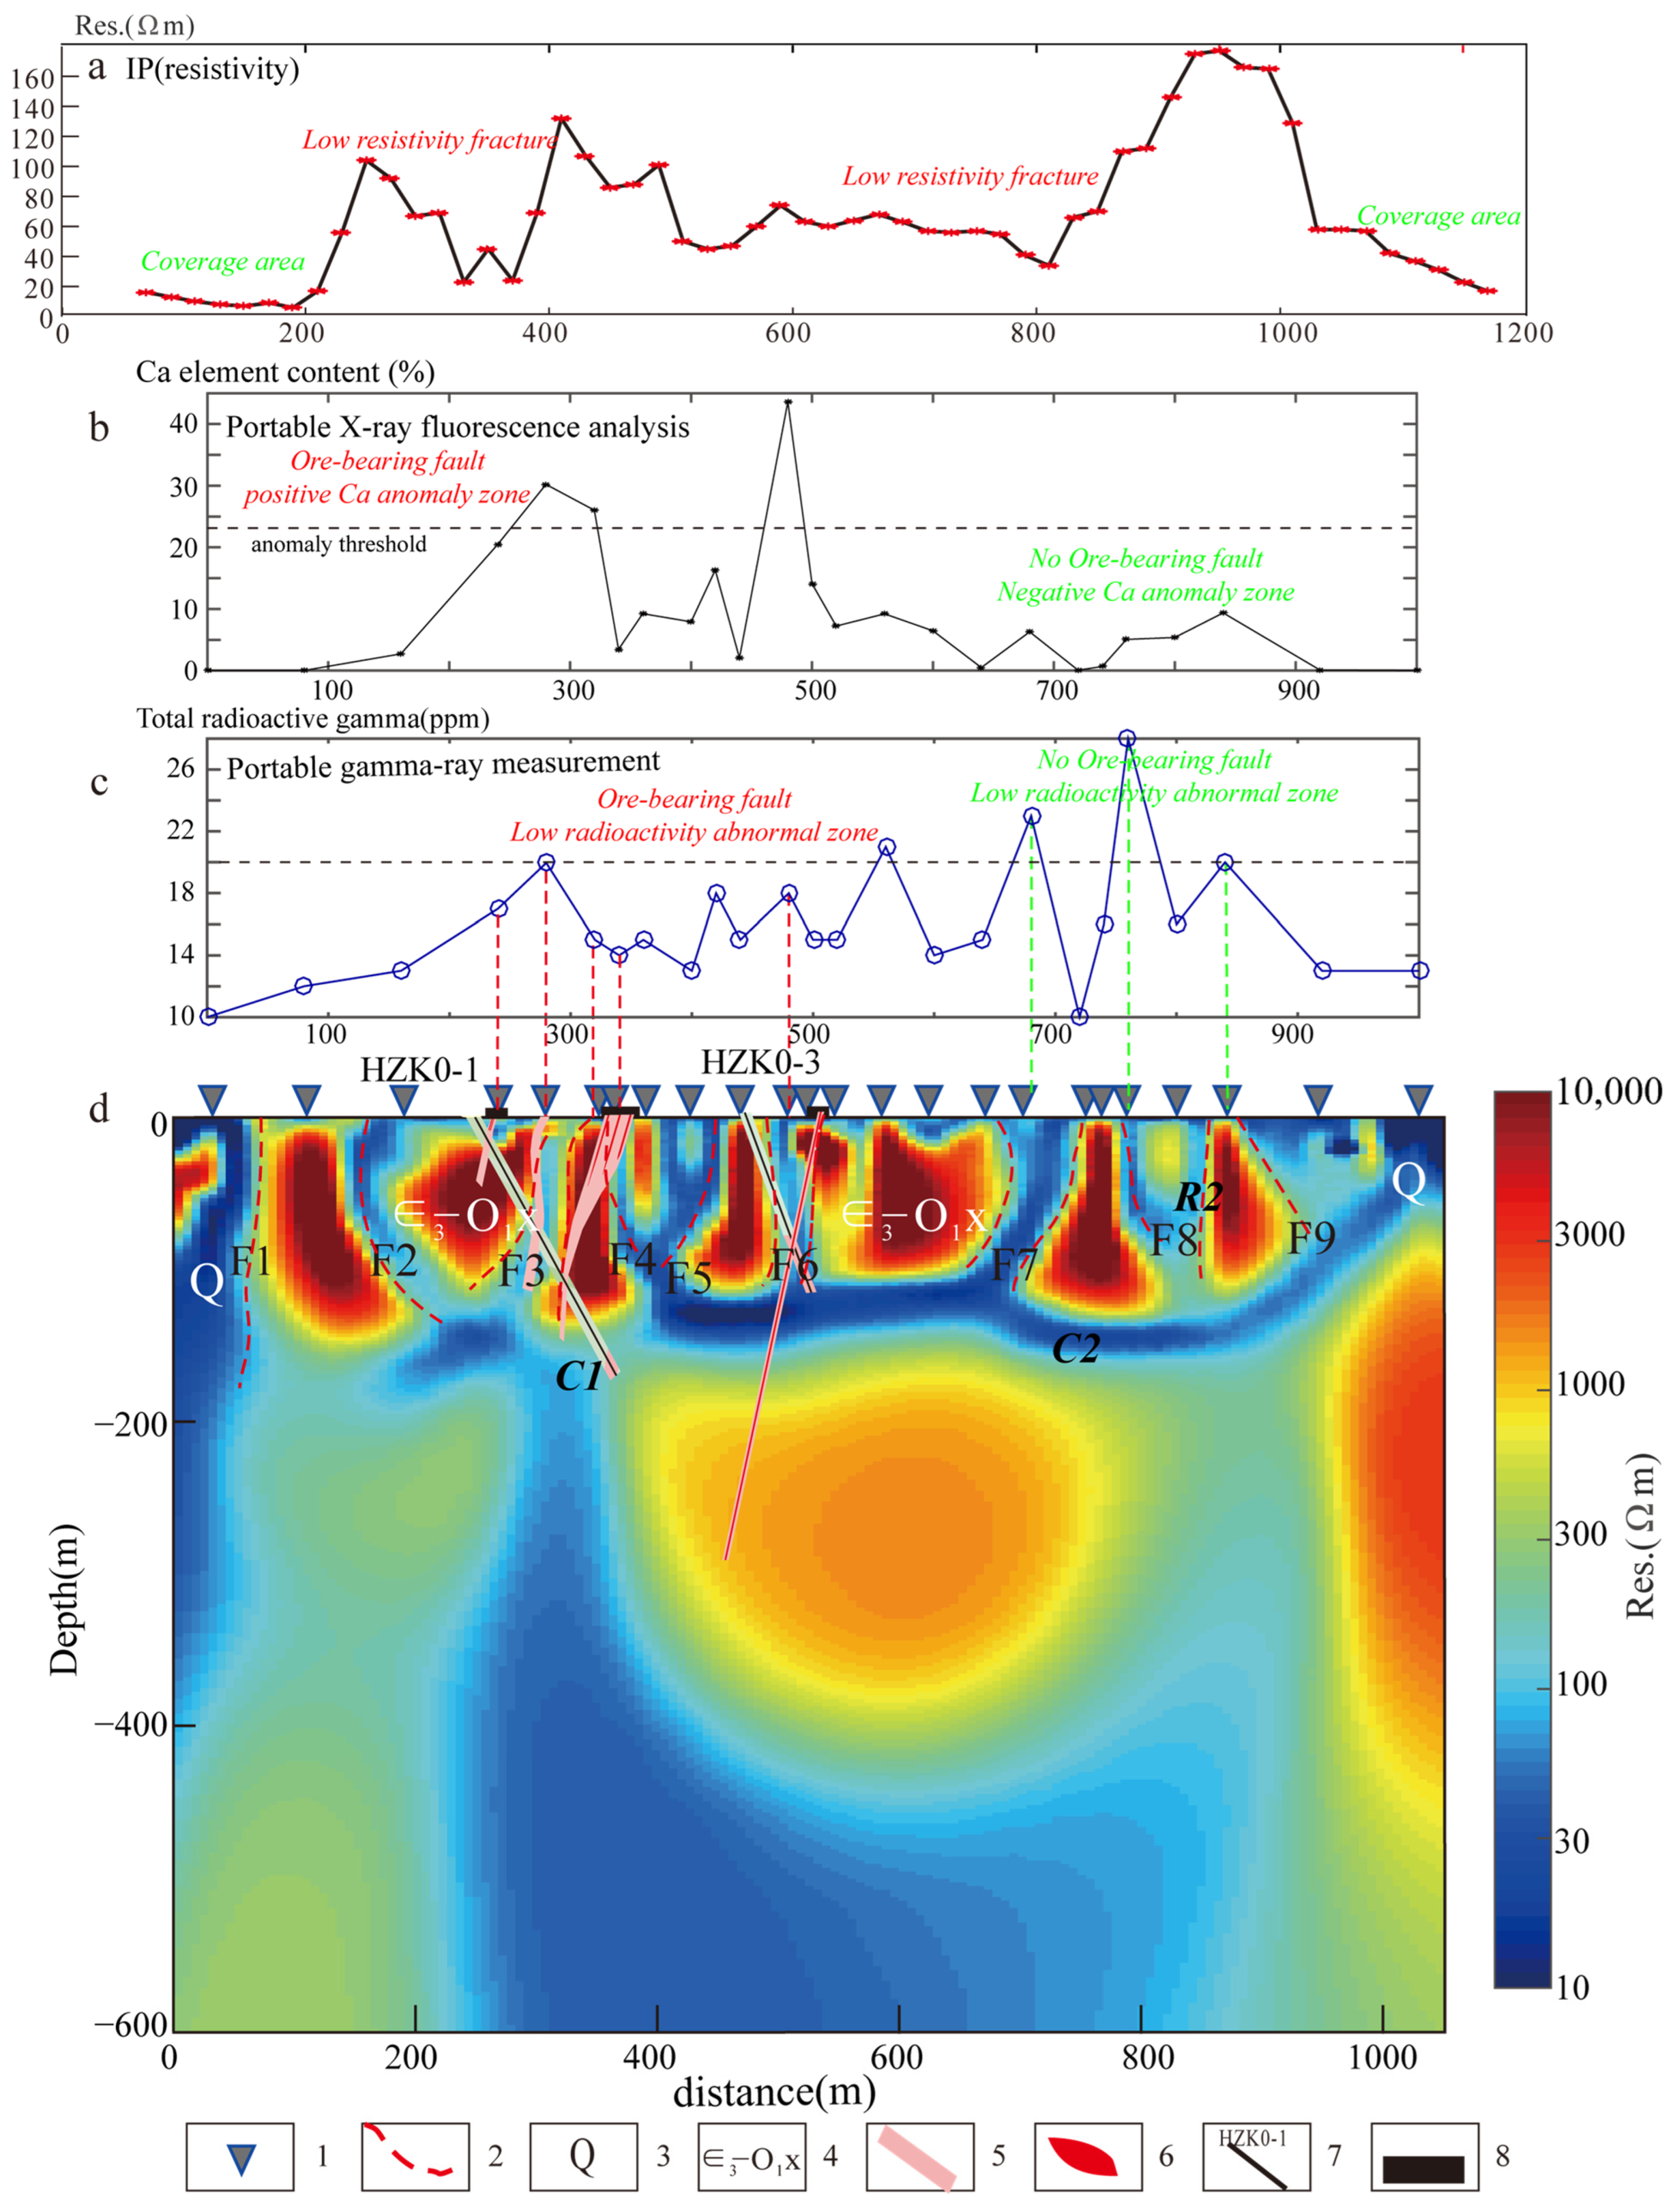
3.2. Induced Polarization Method

The induced polarization method is primarily based on the low-resistivity anomalies of fluorite veins occurring within fault/fracture. Previous studies in fluorite mineral detection often utilized similar techniques, such as very low-frequency electromagnetic methods (VLF-EM) [37,38,39,40,41]. The shape and boundaries of various geological bodies can be ascertained by measuring their electrical resistivity. The resistivity of geological bodies is influenced by rocks’ composition, structure, porosity, and water content. In contrast to intact dense rocks, fault zones usually have lower resistivity because of higher water content from groundwater evaporation or substantial mineral/sulfide enrichments. Hence, the induced polarization method can effectively identify weak areas such as faults and other structural weaknesses (Table 2).
The induced polarization survey coincided with GM surveys with a spacing of 20 m. The resistivity anomalies in the study area vividly delineate the resistivity structure. In Figure 4, significant low-resistivity anomalies are observed along the survey lines on both the north and south sides. Combined with the trench exploration revealing the absence of salt–alkali weathering shell shielding, the anomalies comprehensively reflect the Quaternary sand–gravel cover layer. The red dashed line on the southern side marks a distinctive resistivity gradient zone, representing not only the rapid thinning of desert cover but also corresponding to a hidden structural zone, verified by the trench exploration as the main fluorite ore-forming fault within the area. Within the central part of the profile, a series of low-resistivity anomalies oriented in a northeast direction appear in the sandstone formation. A wide low-resistivity belt extending eastward on the northern side, nearly a hundred meters wide and still open-ended, likely reflecting earlier geological work identifying the main fault. However, the induced polarization work indicates the main fault direction lies to the south, with the identified fault here being a secondary parallel fault. Apart from the primary NE-oriented fault, the presence of an NNE-oriented hidden secondary fault inferred from low-resistivity anomalies was also confirmed by trench exploration. Given the relatively flat terrain of the desert region, the resistivity parameters obtained from the induced polarization method are minimally affected by topography, providing a genuine reflection of underground resistivity structure features at specific depths. The method proves to be sensitive in detecting hidden faults exhibiting low-resistivity anomalies.

3.3. Ore-Bearing Potential Detection Technology of Fluorite Ore in Shallow Covering Area

Portable gamma-ray (PGR) measurements infer the position of concealed ore bodies by measuring the overall variation trend in radioactive elements within different geological formations. In evaluating the mineral potential of fluorite deposits, ore-bearing structural zones hinder the upward migration of radioactive elements due to vein fillings, resulting in differences in radioactivity between these locations and faults with open channels. Additionally, the radioactivity of vein-like fluorite minerals is generally lower than that of the surrounding rock properties, whether the surrounding rock is sedimentary strata or rock mass (Table 3). Based on other technical means, such as detecting hidden faults in shallow-covered areas of the Gobi Desert, rapid judgment of the metallogenic potential of favorable locations can be made after initial favorable positions for ore formation exploration [29,30].
Portable X-ray fluorescence analyses (PXRF) determine element types and their respective concentrations based on characteristic X-rays emitted from samples; however, this technique is currently limited to detecting Ca-related elements closely associated with fluorite and cannot analyze F-element content directly [16,43]. Ground gamma-ray spectrometry measurements and portable X-ray fluorescence analysis complement existing ground high-precision magnetic surveys and induced polarization (IP) surveys. Soil samples are collected from beneath a 10 cm layer of surface erosion material to avoid interference from Quaternary gravel cover layers. For exposed bedrock or thin covering layers, measurement points are adjusted to ensure uniformity in measurement media.

3.4. Audio Magnetotelluric Sounding

The methods mentioned above are primarily focused on predicting the planar distribution of concealed fluorite deposits. Due to the close relationship between the spatial occurrence of hydrothermal solution movement and fault structures, it is challenging to assess their occurrences and variations in deep-seated areas using conventional surface methods. Furthermore, within expanded spaces of fractured zones at depth, there is a tendency for significant enlargement of high-grade fluorite ore bodies [6]. Electromagnetic exploration methods play an irreplaceable role in mineral exploration by utilizing high-frequency electromagnetic signals to probe underground electrical structures, providing abundant electrical information for exploring deep-seated concealed mineral deposits and complex structural regions [44,45,46]. In the Gobi Desert region, where artificial electromagnetic interference is minimal, obtaining good data can be easily achieved by effectively reducing ground resistance. The resistivity distribution obtained through inversion can be translated into lithological units related to rock resistivity.

3.4.1. Data Acquisition and Processing

The audio Magnetotelluric method is an effective method for studying underground resistivity structures. In 2022–2023, the Institute of Xi’an Center of Mineral Resources Survey conducted audio Magnetotelluric surveys at 73 points in the Huashitoushan of the Beishan metallogenic belt, with a distance of approximately 20–40 m. The Crystal Global Aether instrument was used. At each measuring point, two horizontal electric field components (Ex and Ey) and two magnetic field components (Hx, Hy) were recorded for more than 0.5 h with a frequency band range of 10k Hz~5Hz, which corresponds roughly to the depth range of 0~2 km in a homogeneous half-space with a resistivity of 100 Ω·m. The study area exhibits favorable terrain conditions and low levels of interference. However, certain regions are affected by surface aridity, with some even being covered by desert. Consequently, the grounding conditions during data collection were suboptimal. To address this issue, deep excavation followed by clay filling and watering, deep burial, and moisture retention through plastic film coverage can effectively reduce ground resistance and enhance data reliability. We use the prMT software (v1.0.3.5) to process the collected audio Magnetotelluric data. The collected Magnetotelluric data were converted from the time domain to the frequency domain through a standard robust algorithm [47]. The impedance tensor was obtained, and the power spectrum was selected interactively for better results. Thanks to the relatively low electromagnetic interference in the Gobi Desert shallow-covered area, most of the data quality at most stations is excellent (Figure S1), with only a few points (L03P18) showing higher-than-normal resistivity values in the high-frequency range due to arid surface conditions.

3.4.2. Two-Dimensional Inversion and Results

This paper adopts the two-dimensional NLCG algorithm [48] for data inversion. Theoretically, the joint inversion mode of TE+TM can yield optimal results; however, the strict requirement of two-dimensionality for subsurface media limits the applicability of TE mode [49,50], thus making TM mode data the primary basis for inversion. Phase data are subject to minimal distortion, with an assumed error of 20% in apparent resistivity and 10% in phase for TM mode, while for TE mode, errors are set at 80% in apparent resistivity and 60% in phase. The frequency range during the inversion process spans from 5 to 10k Hz, with a regularization factor τ set at 3. The final fitting error after inversion is determined as 0.89.
Based on the completed vital profile of the two-dimensional electrical structure, it is evident that the central part of the profile exhibits a series of alternating high and low resistivity anomalies. Combining these results with induced polarization (IP) surveys, multiple significant faults within the sandstone formations, labeled F1–F9 from south to north, have been identified. Among these faults, F1 and F9 represent the sandstone formation’s southern and northern boundaries, respectively. The low-resistivity anomalies within 100 m near-surface depth at both ends in the north–south direction are attributed to Quaternary cover layers. This confirms that large-scale low-resistivity anomalies observed during IP surveys are not caused by shallow saline–alkali layers or massive, intrusive bodies beneath desert cover layers in the south. It further negates the possibility of extensive rock intrusion below desert cover layers in the south. Magmatic–hydrothermal activity related to regional mineralization is likely sourced from deep-seated F2 faults or high-resistivity anomalies on this section’s northern side.
Audio Magnetotelluric (AMT) results indicate numerous low-resistivity anomalies associated with fault zones provide ample space for fluorite mineralization. Faults such as F2, F3, F4, and F6 have all been exposed through trench exploration activities, confirming their existence as concealed fault zones. Additionally, known faults such as F7 and F8 established during previous geological work align with electric resistivity models obtained through two-dimensional inversion techniques. The known vein locations extend to considerable depths underground, reaching approximately 400 m below ground level; meanwhile, two high-resistivity anomalies appearing in both central and northern parts below a depth of 400 m are speculated to reflect intermediate-acidic rock formations within this region, which may serve as sources for material and energy contributing to regional mineralization.

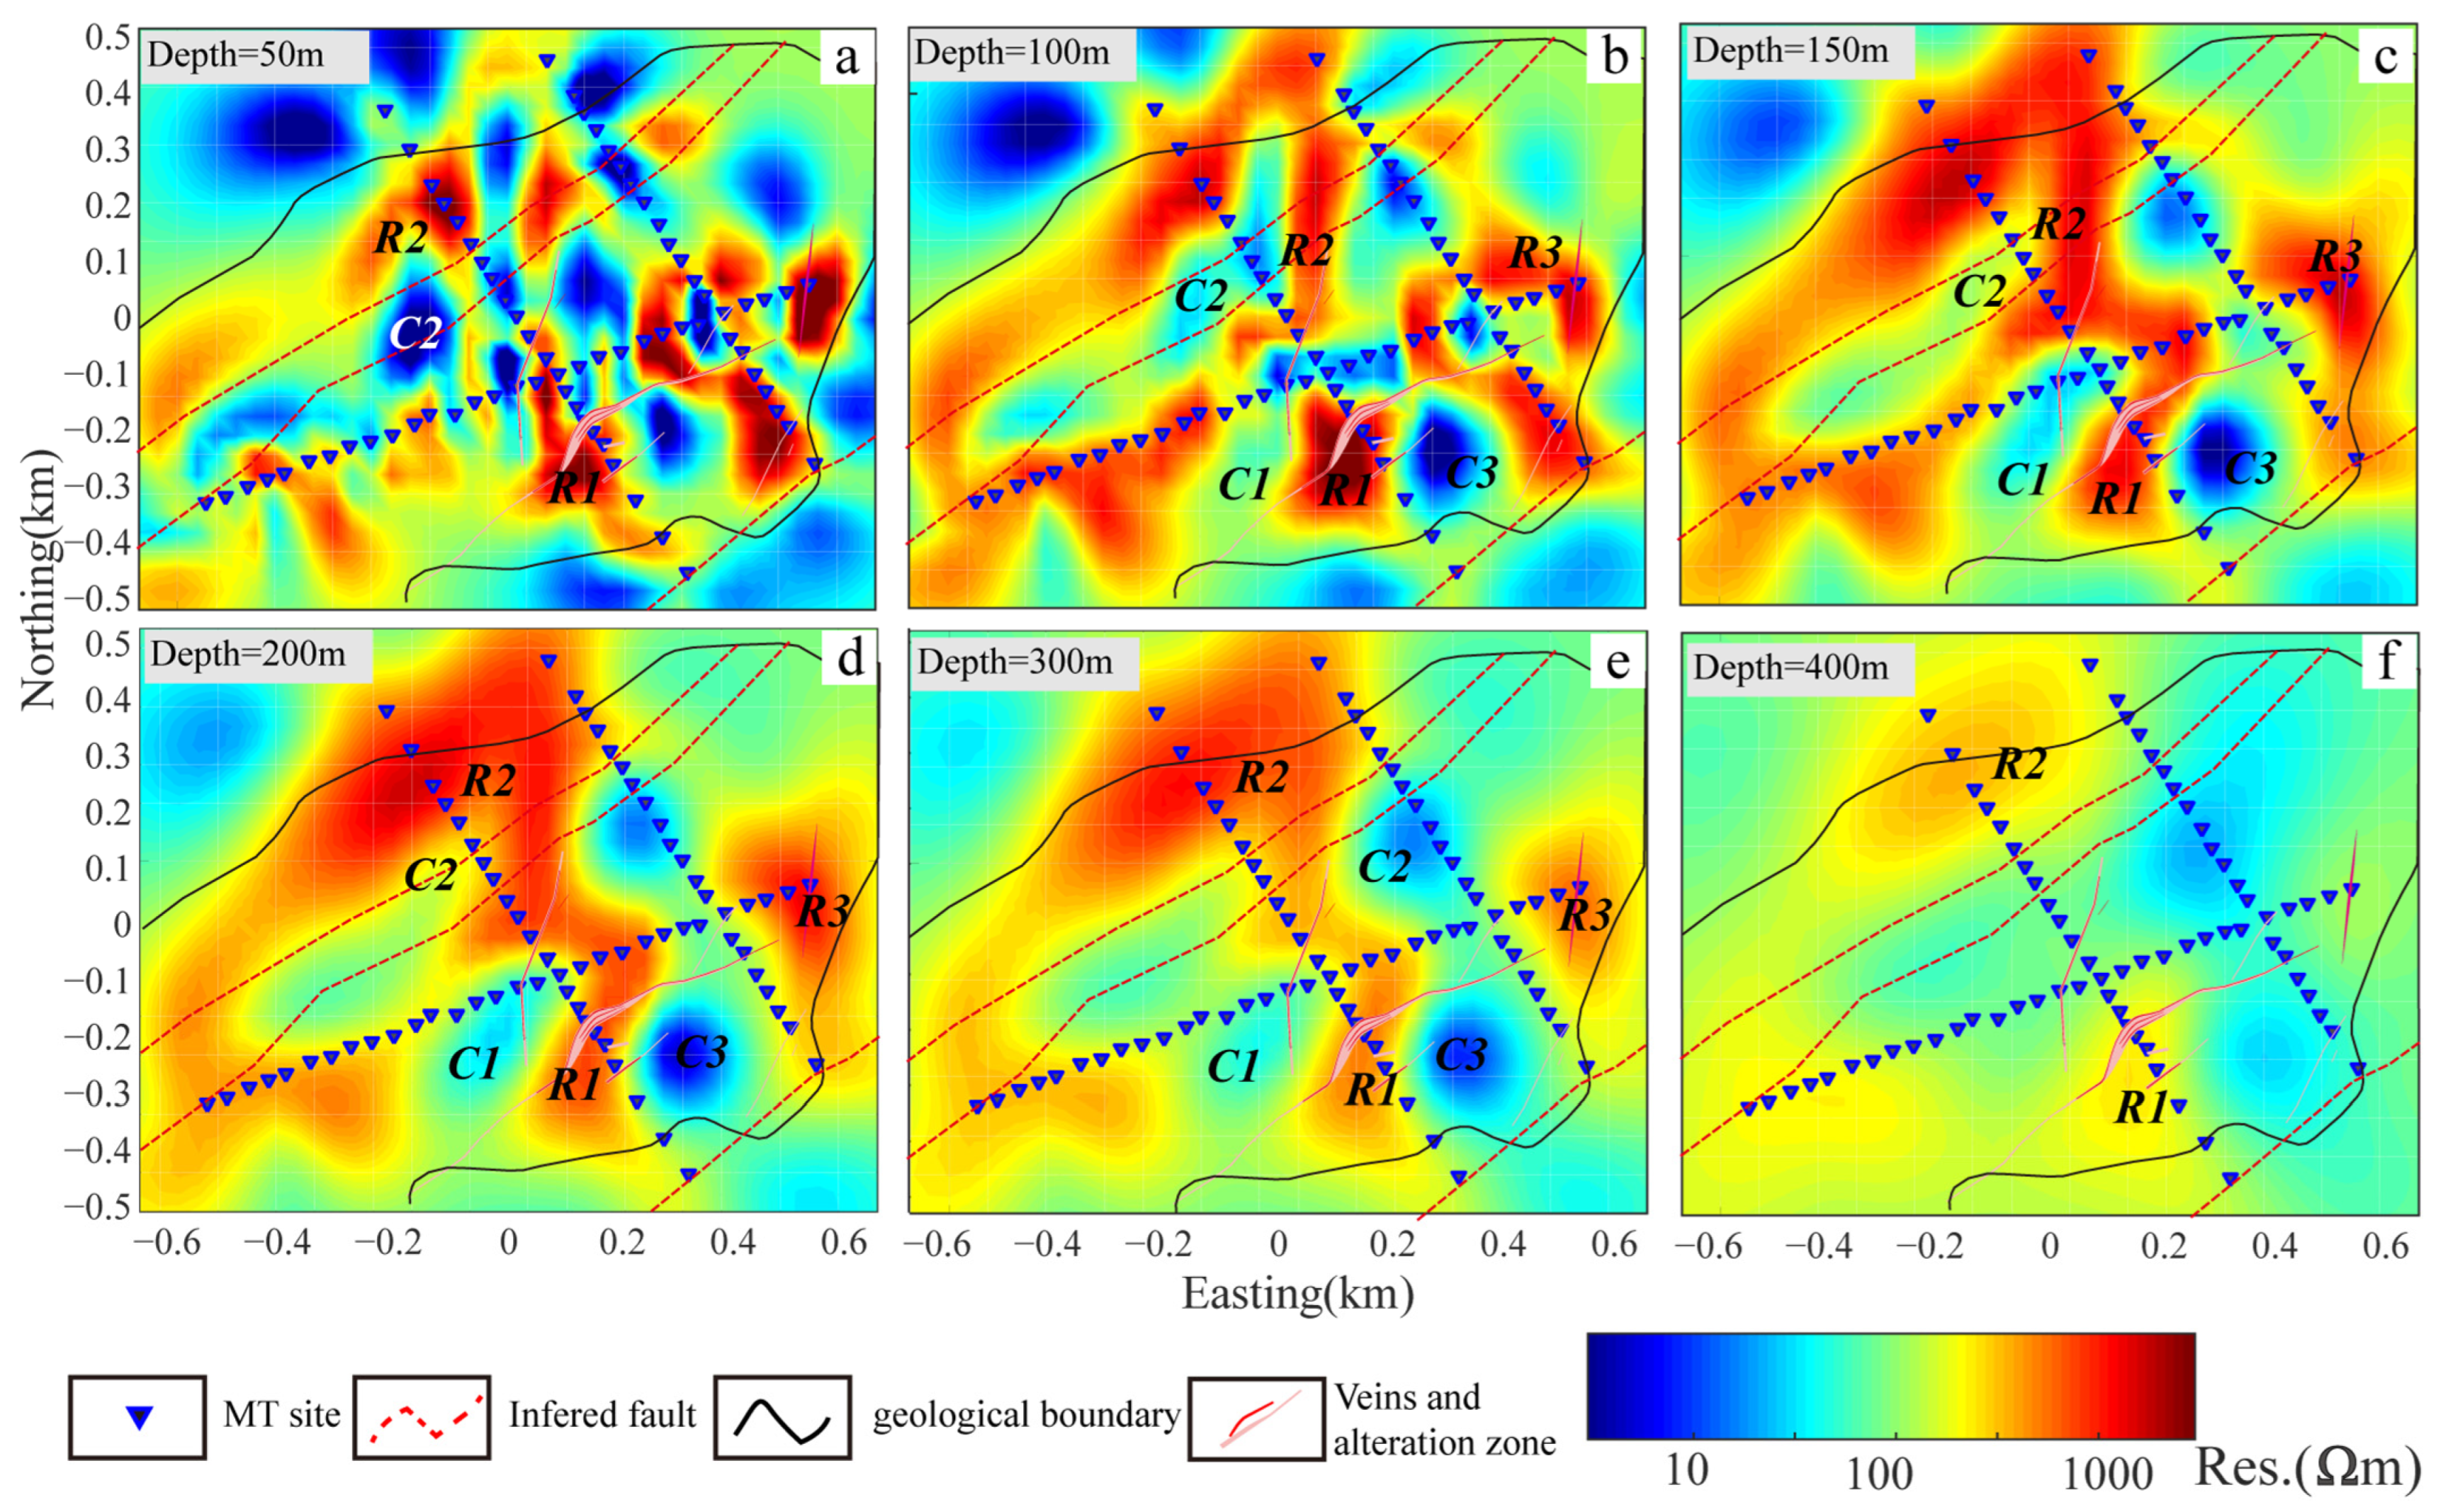
3.4.3. Three-Dimensional Inversion and Results

With the widespread adoption of the ModEM program [51,52], there has been a significant reduction in memory requirements and an improvement in inversion speed. As a result, three-dimensional inversion techniques for Magnetotelluric (MT) data have gradually gained wide application in scientific research. In recent years, advancements in algorithm technology and computational capabilities have led to three-dimensional inversion replacing two-dimensional inversion as the mainstream MT inversion technique.
The inversion grid design is as follows: the unit grid widths in the x and y directions are 25 m, with nine grids extended in the x and y directions and an extension step size of 1.5 times. The total number of inversion grids is 61 (x direction) × 67 (y direction). The vertical depth of the first layer is 10 m, with a layer thickness increment factor of 1.1. There are five expanded grids, an external expansion factor of 1.5, with 40 grids total, and the bottom grid node is located at 12 km z-direction). The final number of AMT measurement points used in the inversion calculation is 73, with 22 frequencies utilized in the inversion process ranging from 5 to 10k Hz. The data selected for inversion consists of the off-diagonal apparent resistivity components (ρxy and ρyx) and phase (θxy and θyx). In the inversion, we set a lower error limit of 5% for the Zxy and Zyx impedance components. In terms of inversion parameter settings, the regularization factor is adaptively reduced in the ModEM program. Therefore, during the inversion process, we set its initial value to 1000, and when the change in fitting difference is less than 2 × 10⁻³, the value is updated by dividing by 10. When the regularization factor is less than 10−8, or the fitting difference is less than 1.05, the inversion is stopped. After 84 iterations, nRMS reached 1.86 (The sensitivity test process and corresponding results are shown in Supplementary Documents and Figures S3 and S4).
The horizontal slices of the 3D resistivity model (Figure 5) reveal a general low-resistivity characteristic beneath the shallow cover layers in the Gobi Desert, with deep electrical structures primarily composed of high-resistivity sandstone formations and associated fault structures. Cross-sections at the location of each AMT line of 3D inversion (Figure S2) are similar to 2D inversion results (Figure 6); both exhibit electrical, structural features of relatively high-resistivity sandstone horizons divided by several sets of low-resistivity anomaly faults. The high-resistivity anomalies R1 and R2 represent the sandstone formations beneath the shallow cover layers, while the intervening low-resistivity anomalies correspond to the fault system. The low-resistivity anomalies C2 and those on the southern side of the study area collectively form a main structural trend-oriented NEE (northeast–east), whereas C1 and C3 low-resistivity anomalies constitute a set of nearly NE-trending faults. Given that there are no magnetic anomalies, as previously mentioned, it is inferred that continuous high-resistivity anomalies R1 and R2 represent intact sandstone formations within this region. Additionally, in the eastern parts of the study area, high-resistivity anomaly R3 exhibits weak positive magnetic anomaly characteristics likely related to intrusive rocks.

4. Discussion

4.1. Constraints of Integrated Geophysical Exploration Results on Hidden Fluorite Deposits

Combining the more sensitive AMT two-dimensional inversion resistivity model for shallow details [53] with the previously mentioned fluorite ore potential detection technology, the central part of the profile displays a series of alternating high and low resistivity anomalies. In conjunction with induced polarization (IP) survey results, a series of significant faults, labeled F1–F9, are observed from south to north within the sandstone formations. F1 and F9 represent the southern and northern boundaries of the sandstone formations, with low resistivity anomalies within 100 m of the surface at the south and north ends, indicating Quaternary cover layers. This confirms that the large-scale low resistivity anomalies observed during the IP surveys are not due to shallow saline–alkali layers, further negating the possibility of large-scale intrusive rock formations beneath the desert cover layer to the south. Magmatic–hydrothermal activity related to regional mineralization is likely to originate from the deep parts of the F2 fault or the high resistivity anomalies to the north of the profile. The AMT results indicate that the multiple low resistivity anomalies represent fault zones with abundant fluorite mineralization potential. The presence of concealed fault zones has been verified by the exposure of the F2, F3, F4, and F6 faults through trenching. F7 and F8 correspond to known faults delineated in previous geological work, consistent with the resistivity model obtained from the two-dimensional inversion. It is currently known that mineral veins extend to depth, with mineralization occurring at depths of approximately 200 m underground. Two high-resistivity anomalies in the central and northern parts of the study area below a depth of 200 m are speculated to reflect intermediate-acidic rock formations within the region, providing material and energy sources for regional metallogenic.
The metallogenic potential of the faults mentioned above varies, and the zonation of fluorite ore bodies is determined by the process of ore-bearing hydrothermal fluids rising along specific negative pressure structures and filling fractured spaces. The magmatic activity provides energy and material sources, while secondary faults and dense fissures within the surrounding rock provide space for the aggregation of ore-forming hydrothermal fluids and material exchange. Geophysical surveys utilizing TDIP and GM methods can effectively locate favorable mineralized positions. However, uniformly distributed mineralization is extremely rare, and the selective distribution of ore bodies still requires further constraint through the combination of PGR and PXRF. PGR can rapidly obtain near-surface radioactivity. The gamma radiation in the soil originates from the decay of K, U, and Th elements in deep geological bodies [54], with the fundamental rule being that volcanic rocks exhibit higher radioactivity than sedimentary and metamorphic rocks [29]. The mineralization process of fluorite is related to volcanic rocks’ energy and material sources. As fluorite ore and its associated quartz veins are present within structural faults, this hinders the upward migration of deep-seated radioactivity. Consequently, high-value anomalies correspond to polymetallic alteration in the surrounding rock, while low-value anomalies correspond to quartz veins and fluorite ore bodies.
The results from profile line 0 indicate that the total radioactivity levels at the measurement points near the F3, F4, and F6 faults associated with mineralization are all below the lower limit of 20 ppm, while the non-mineralized fault zones F7, F8, and F9 exhibit high anomalies. However, the F1 and F2 faults where the cover is thicker also show low total radioactivity levels, making it challenging to make judgments using a single method. It is imperative to integrate geological conditions with other methods to ensure the accuracy of interpretation. Although portable X-ray fluorescence analysis cannot directly detect the content of fluorine (F) elements, it can directly determine the calcium (Ca) elements closely related to fluorite minerals on-site, avoiding the lengthy chemical analysis cycle and providing constraint conditions rapidly. The data show that the Ca element content at measurement points near F3, F4, and F6 is all above 20%, while the Ca element content at measurement points near fault zones known not to have fluorite mineralization is below 10%. Therefore, high Ca element values can effectively indicate the possibility of fluorite mineralization.
Based on the deployment of drilling verification in conjunction with integrated geophysical exploration for positioning and prediction, the preliminary control of the ore body ranges from 100 to 657 m in length, with a thickness of 0.71 to 1.74 m and an inclination depth down to 47.88 m, exhibiting CaF2 grades ranging from 15.64% to 60.64%. A comparison between surface and deep borehole mineral characteristics reveals a trend in varying thickness, gradual enrichment, and increasing richness within the fluorite deposits at depth, consistent with the well-matched spatial distribution revealed by AMT resistivity inversion models (Figure 7). Currently, verified mineral deposit locations almost correspond to the boundaries of high resistivity anomalies, displaying a solid spatial correlation with intact sandstone formations. Conversely, no more significant fluorite deposits have been found within large-scale low-resistivity anomalies. The application of 3D inversion provides a basis for the different occurrences of mineral deposits in various regions of the ore body. Preliminary estimates indicate approximately 109,800 tons of fluorite mineral resources within depths shallower than 50 m, demonstrating significant resource potential. The discovery of fluorite deposits at Huashitou Mountain—particularly the constraints imposed by comprehensive geophysical exploration results on deep-seated mineralization space and its associated state—holds valuable implications for prospecting similar genetically related fluorite deposits in shallow-covered areas such as the Gobi Desert.

4.2. Method System of Shallow Coverage Area Positioning Prediction Technology

Various geophysical exploration methods possess distinct characteristics, application limitations, and corresponding conditions. When conducting work in the shallow-covered areas of the Gobi Desert, the shielding effect of near-surface cover layers impacts all technical methods to a certain extent. Therefore, it is essential to explore the optimal combination of techniques for exploring concealed fluorite deposits and locating their positions primarily controlled by faults.
This study employed GM surveys and induced polarization (IP) to detect structures that control hydrothermal solution movement. Previous research also incorporated high-resolution multispectral remote sensing, or VLF. While satellite remote sensing can rapidly identify large-scale fault locations and dimensions within a region—serving as an indispensable tool for preliminary positioning predictions—it is crucial to rely on penetrating geophysical methods for detecting faults that may host fluorite deposits due to favorable passage conditions in the Beishan metallogenic belt. The effectiveness of GM surveys exhibits selectivity for surrounding rocks hosting fluorite deposits; it performs better when magmatic rocks are present but shows limited differentiation in sedimentary rock environments. The completed IP survey effectively reflects potential fault structures hosting fluorite deposits, compared to VLF commonly used in previous studies, which exhibit weaker signal strength and less prominent anomalies than the IP method [55,56]. Although the low association between fluorite deposits and sulfides results in insignificant polarization anomalies, IP remains an effective prospecting method, especially in topographically stable regions such as the Gobi Desert. Overall, considering these factors will aid in determining suitable combinations of geophysical techniques for exploring concealed mineral resources under similar geological settings.
Detecting the mineral potential of fluorite deposits is a challenging research task. Based on the physical properties discussed earlier, fluorite deposits are relatively small in scale and exhibit limited variations in physical properties. The utilization of PGR and PXRF can enhance prediction precision. Both methods are influenced by the thickness of the surface cover, as evidenced by the stable low anomalies of both the ground gamma-ray total counts and the Ca element content in the heavily covered regions on the north and south sides of the study area, as shown in the figure above. PGR requires comprehensive assessment with the inferred fault positions from other methods. The factors causing anomalies are complex, but they hold unique indicative significance for the occurrence of hydrothermal solution movement. PXRF can effectively provide evidence of the Ca content, providing direct evidence for the mineral potential in concealed faults. However, it is worth noting that external alluvial sediments or drift loads in high-calcium background areas necessitate comprehensive analysis combined with geological surveys and other technologies.
Although a set of convenient and effective geophysical methods for the shallow-covered desert areas has been summarized through comprehensive geophysical surveys, the inherent ambiguity in the inversion and interpretation of individual methods often leads to conflicting results in integrated interpretations. This issue is particularly pronounced when dealing with non-metallic sulfide deposits such as fluorite, where there is a weak correlation between the occurrence location and mineralization potential. By utilizing a joint inversion and interpretation approach integrating seismic velocity structure with magnetic, electrical, and radiometric data, an organically unified geological–geophysical model with mutually constrained physical parameters, including magnetism, resistivity, and radioactivity, can more effectively predict the location of concealed fluorite deposits.

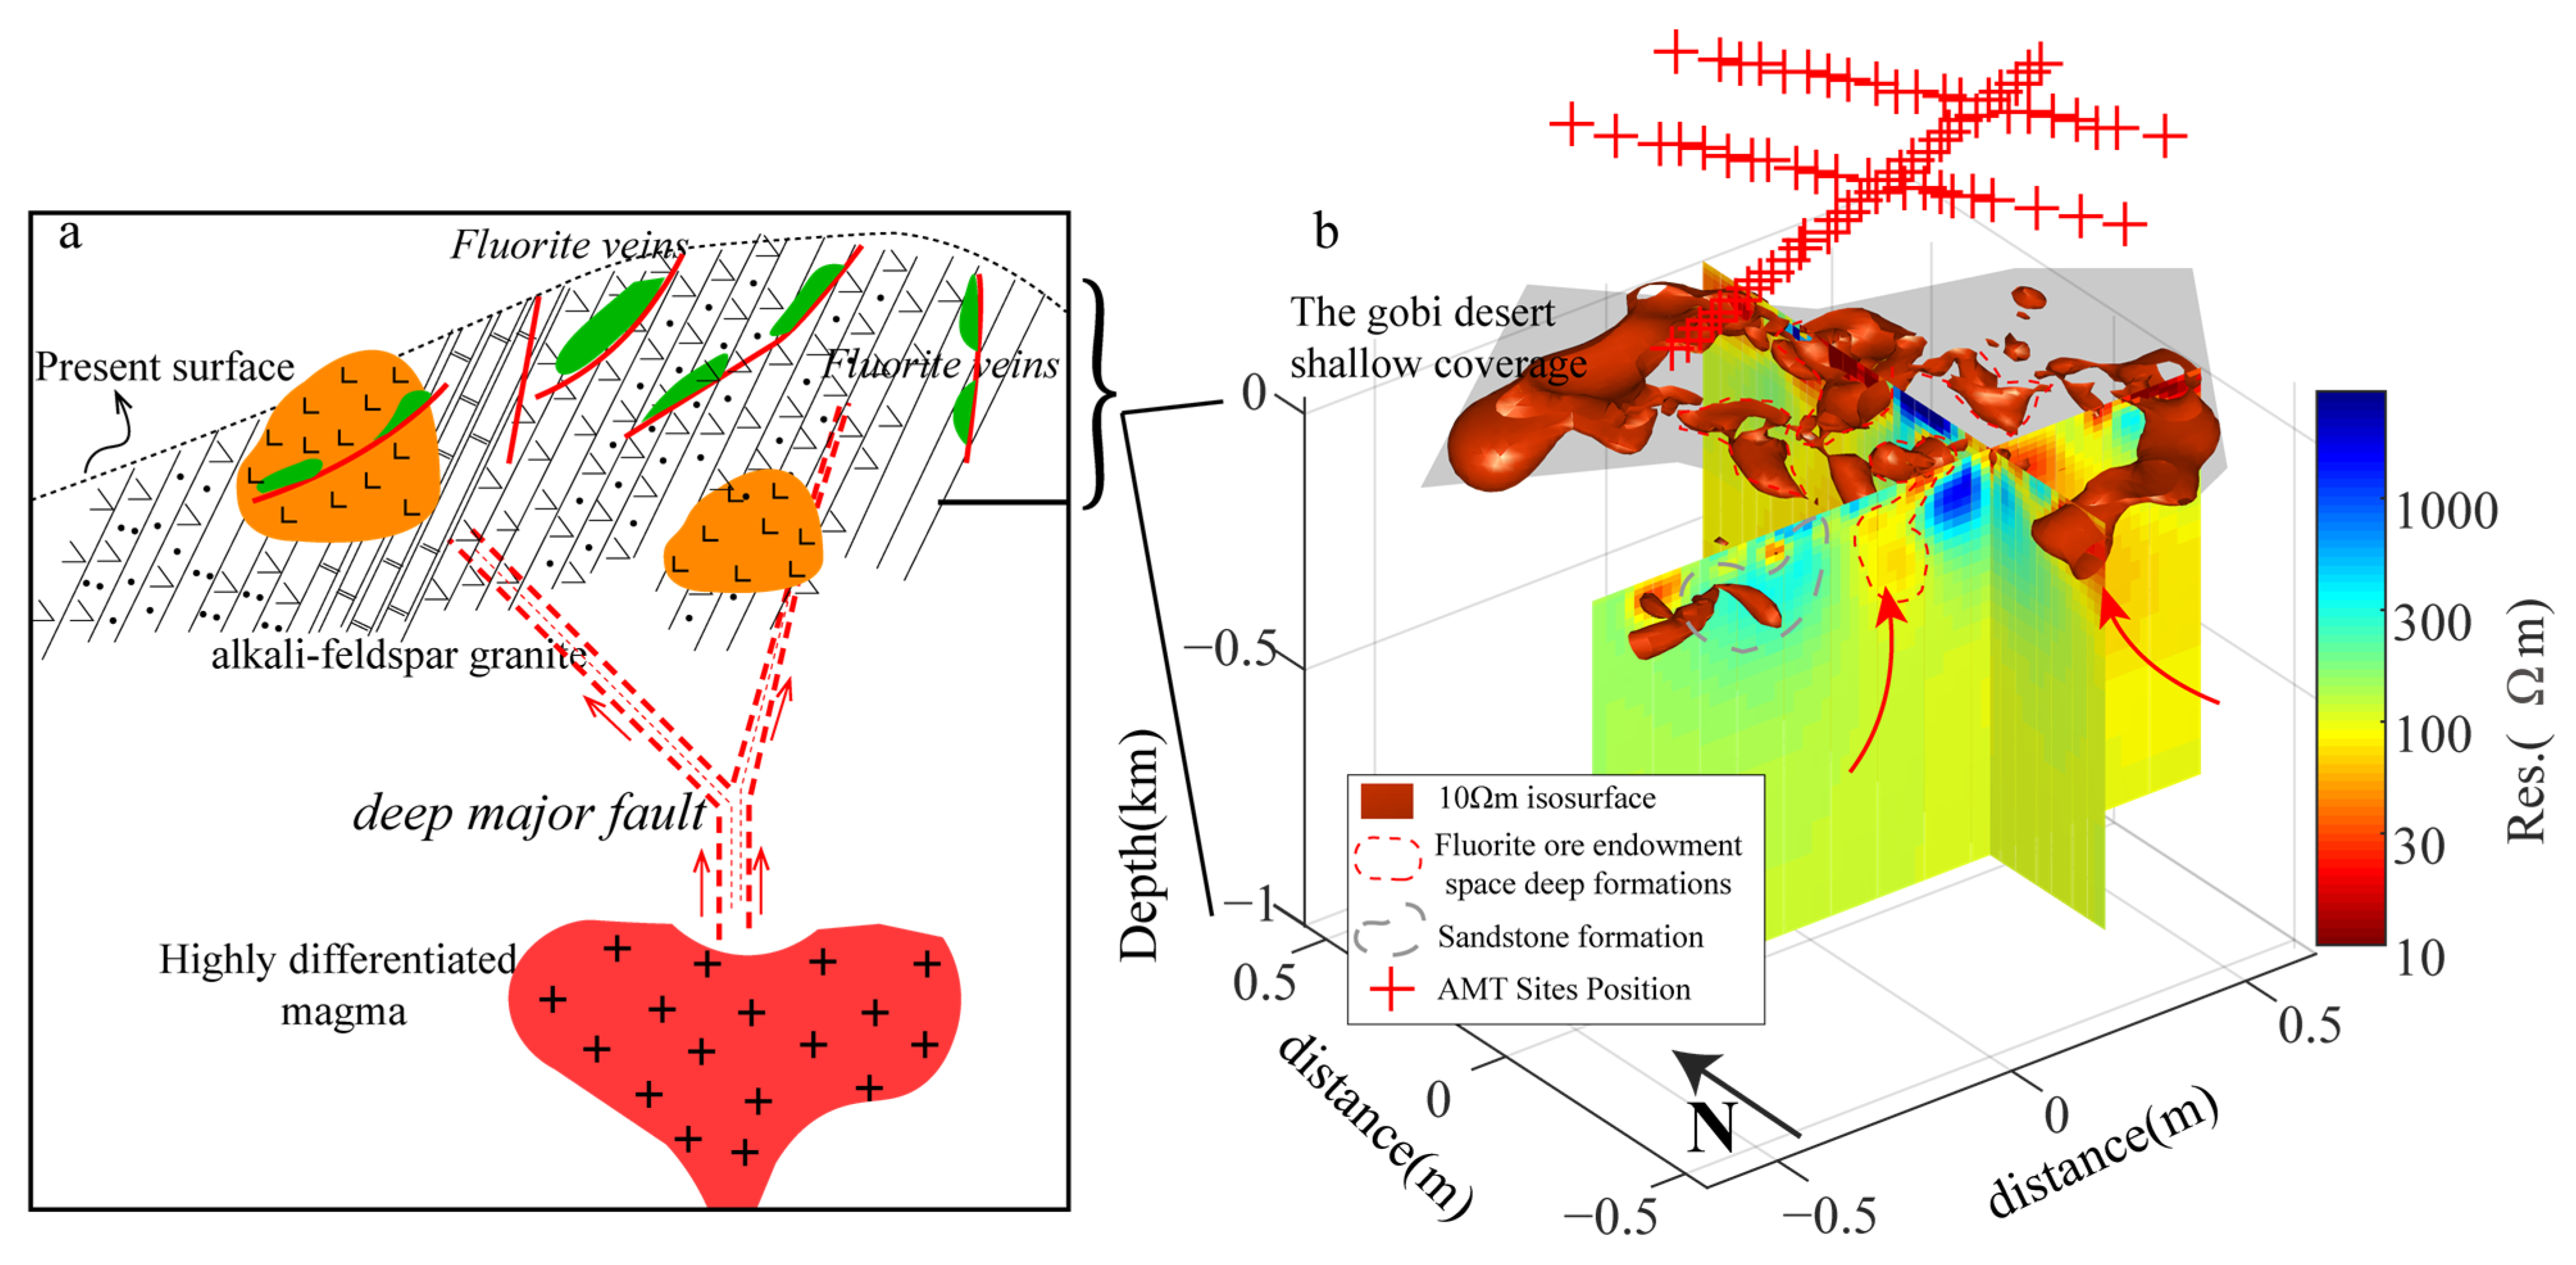
4.3. Formation Mechanism of Mineral Deposits

By combining the GM, TDIP, PGR, and AMT, we studied the geophysical–geologic structure of the study area from shallow to deep layers to identify potential ore targets in the Huashitoushan area. The lithology in the drilling confirms the results. Further analysis of the deposit’s formation mechanism will support additional work. In particular, the AMT three-dimensional inversion resistivity model provides a geophysical basis for imaging the deep formation of the mineralization space of the deposit in the near-surface small-scale sporadic distribution and the deep morphology of the deep metallogenic material transportation channels within the deposit (Figure 8).
Fluorite is primarily composed of F and Ca, exhibiting characteristics of in situ mineralization. Based on this, it is believed that the fluorite deposit at Huashitou Mountain may have originated mainly from medium-grained porphyritic biotite monzogranites for F and sandstone formations for Ca. In the eastern part of Beishan, a certain depth of crustal material melting exists to form an acidic magma chamber. During differentiation and evolution, fluoride-rich magmatic–hydrothermal fluids intrude along deep-seated faults and encounter relatively “cooler” atmospheric precipitation within the identified fault system through comprehensive geophysical detection. In shallow, near-surface areas, fluoride-rich fluids undergo water–rock reactions with surrounding rocks, continuously extracting Ca elements from the surrounding rock mass to enrich precipitates, forming early-stage fluorite deposits when temperature decreases further while pH increases [31,57]. The mineral fluid accumulates in favorable spaces (fault zones, cavities), forming fluorite deposits. The distribution of fluorite deposits within the mining area strictly follows control by faults and silicified fault zones, displaying characteristics typical of fill-type deposits. Fluorite deposition occurs under conditions where magma has fully differentiated and calcium and volatile components have been sufficiently enriched; these conditions lead to mineral precipitation within sandstone formations along northeast-trending or secondary north–south-trending fault structures.

5. Conclusions

Ground magnetic method, IP intermediate gradient scanning, audio Magnetotelluric, portable gamma-ray, and portable X-ray fluorescence analyses were carried out successively in the Huashitoushan fluorite deposit and Beishan metallogenic belt, and the different working methods attained several achievements.
  • Summarized the phased fluorite deposit positioning and prediction technology process in the shallow-covered areas of the Gobi Desert. Initially, GM and IP surveys were utilized to identify potential concealed ore-bearing fault structures, representing possible structures that control hydrothermal solution movement. Subsequently, PGR and PXRF were employed to constrain anomalies associated with potential mineralization within spatial occurrences of fluorite deposits. Finally, combining deep-seated information provided by electromagnetic detection with drilling and trenching verification led to discovering multiple concealed fluorite deposits, providing valuable references for positioning and predicting fluorite deposits in shallow-covered areas.
  • The resistivity model constrained by the audio Magnetotelluric method, especially 3D inversion, was used to constrain the deep subsurface structures of known mineralized faults. The fluorite ore bodies of Huashitoushan are mainly located at the junction regions of high-resistivity sandstone formation and relatively high-conductivity fault/fissure alteration zones.
  • Unlike the traditional geophysical detection of metal–sulfide deposits in shallow coverage areas, the physical properties of the ore body and the surrounding rocks are significantly different, and the prediction of fluorite ore positioning needs to be constrained by the combination of two phases of spatial detection of endowment and metallogenetic potential, as well as by a combination of various technological methods.

Supplementary Materials

The following supporting information can be downloaded at: https://www.mdpi.com/article/10.3390/min14080838/s1, Figure S1: Observed apparent resistivity-phase curves for four representative AMT stations (L01P08, L01P19, L02P04 and L03P18); Figure S2. cross-sections at the location of each AMT line of 3D inversion; Figure S3. The sensitivity test of the resistivity structure corresponds to the example shown along the L01 and L02 profiles in the 3D resistivity model. The resistivity of the fixed block in the initial model was replaced at 0–200 m; Figure S4. shows the response curve after the forward simulation of the sensitivity test compared with the originally proposed curve.

Author Contributions

Conceptualization, L.C.; methodology, Y.K. and L.H.; software, L.C. and L.H.; validation, L.H., T.W. and Y.C.; investigation, L.C., Y.K. and T.W.; resources, G.Y. and T.W.; data curation, L.C.; writing—original draft preparation, L.C.; writing—review and editing, G.Y.; visualization, Y.K. and L.H.; supervision, G.Y.; project administration, L.C. and T.W.; funding acquisition, L.C. All authors have read and agreed to the published version of the manuscript.

Funding

This research was funded by the Natural Science Basic Research Program of Shaanxi (grant No. 2023-JC-QN-0365) and the China Geological Survey Project (grant Nos. DD20243342, DD20243333, DD20211552, and DD20240019).

Data Availability Statement

The model and data files of 3D inversion were compressed and uploaded as Supplementary Files.

Acknowledgments

We thank Gary Egbert and his group members for sharing their 3D inversion code. We thank Alan Jones and Gary NcNeice for using their tensor decomposition codes. We thank Dong Hao for using their EM3dvp code.

Conflicts of Interest

The authors declare no conflicts of interest.

References

  1. Summaries, M.C. Mineral Commodity Summaries; US Geological Survey: Reston, VA, USA, 2021; p. 200.
  2. Camprubí, A.; González-Partida, E.; Richard, A.; Boiron, M.-C.; González-Ruiz, L.E.; Aguilar-Ramírez, C.F.; Fuentes-Guzmán, E.; González-Ruiz, D.; Legouix, C. MVT-like fluorite deposits and oligocene magmatic-hydrothermal fluorite–Be–U–Mo–P–V overprints in northern Coahuila, Mexico. Minerals 2019, 9, 58. [Google Scholar] [CrossRef]
  3. Castorina, F.; Masi, U.; Gorello, I. Rare earth element and Sr-Nd isotopic evidence for the origin of fluorite from the Silius vein deposit (southeastern Sardinia, Italy). J. Geochem. Explor. 2020, 215, 106535. [Google Scholar] [CrossRef]
  4. Hosseini-Dinani, H.; Aftabi, A. Vertical lithogeochemical halos and zoning vectors at Goushfil Zn–Pb deposit, Irankuh district, southwestern Isfahan, Iran: Implications for concealed ore exploration and genetic models. Ore Geol. Rev. 2016, 72, 1004–1021. [Google Scholar] [CrossRef]
  5. Shah, A.K.; Bedrosian, P.A.; Anderson, E.D.; Kelley, K.D.; Lang, J. Integrated geophysical imaging of a concealed mineral deposit: A case study of the world-class Pebble porphyry deposit in southwestern Alaska. Geophysics 2013, 78, B317–B328. [Google Scholar] [CrossRef]
  6. Tang, L.; Zhang, S.; Wang, L.; Pei, Q.; Fang, Y.; Cao, H.; Zou, H.; Yin, S. Exploration of concealed fluorite deposit in shallow overburden areas: A case study in Elimutai, Inner Mongolia, China. Earth Sci. Front. 2021, 28, 208. [Google Scholar]
  7. Zou, H.; Pei, Q.; Li, X.; Zhang, S.; Ware, B.; Zhang, Q.; Fang, Y.; Yu, H. Application of field-portable geophysical and geochemical methods for tracing the Mesozoic-Cenozoic vein-type fluorite deposits in shallow overburden areas: A case from the Wuliji’Oboo deposit, Inner Mongolia, NE China. Ore Geol. Rev. 2022, 142, 104685. [Google Scholar] [CrossRef]
  8. Schamper, C.; Rejiba, F.; Guérin, R. 1D single-site and laterally constrained inversion of multifrequency and multicomponent ground-based electromagnetic induction data—Application to the investigation of a near-surface clayey overburden. Geophysics 2012, 77, WB19–WB35. [Google Scholar] [CrossRef]
  9. Meng, Y.; Zhang, R.; Liu, R.; Lin, T.; Wang, W. Application of Multiple Geophysical Methods to Prospect Concealed Ores Beneath Quaternary Cover: A Case Study from a Copper-Polymetallic Deposit. In Technology and Application of Environmental and Engineering Geophysics, Proceedings of the 7th International Conference on Environmental and Engineering Geophysics, ICEEG, Beijing, China, 26–29 June 2016; Di, Q., Xue, G., Xia, J., Eds.; Springer: Singapore, 2017; pp. 243–249. [Google Scholar]
  10. Xue, G.; Zhang, L.; Hou, D.; Liu, H.; Ding, Y.; Wang, C.; Luo, X. Integrated geological and geophysical investigations for the discovery of deeply buried gold–polymetallic deposits in China. Geol. J. 2020, 55, 1771–1780. [Google Scholar] [CrossRef]
  11. Xue, G.; Gelius, L.-J.; Sakyi, P.; Zhou, N.; Chen, W.; Su, B.; Li, H.; Zhong, H.; Su, Y. Discovery of a hidden BIF deposit in Anhui province, China by integrated geological and geophysical investigations. Ore Geol. Rev. 2014, 63, 470–477. [Google Scholar] [CrossRef]
  12. Fu, J.; Jia, S.; Wang, E. Combined magnetic, transient electromagnetic, and magnetotelluric methods to detect a BIF-type concealed iron ore body: A case study in gongchangling iron ore concentration area, southern liaoning province, China. Minerals 2020, 10, 1044. [Google Scholar] [CrossRef]
  13. Fu, G.; Yan, J.; Chen, H.; Meng, G.; Yu, H.; Fan, L.; Luo, L.; Tao, X. 3D inversion of audio-magnetotelluric data for mineral exploration: A case study of Layikeleke buried porphyry copper deposit, Xinjiang, China. Appl. Geophys. 2020, 17, 576–588. [Google Scholar]
  14. Meng, G.; Lv, Q.; Yan, J.; Deng, Z.; Qi, G.; Xue, R. The research and application of explorational technology of “Penetrating” to geology and mineral investigation in overburden area. Acta Geosci. Sin 2019, 40, 637–650. [Google Scholar]
  15. Yan, J.; Meng, G.; Lv, Q.; Deng, Z.; Qi, G.; Tang, H.; Zhao, J.; Xue, R.; Wang, X. Prediction and location of concealed deposits in desertgobi coverage areas using integrated geophysics: An example of the Layikeleke copper polymetallic deposit in Xinjiang, Northwest China. Chin. J. Geophys. 2021, 64, 4117–4133. [Google Scholar]
  16. Wang, L.; Zhang, S.; Fang, Y.; Tang, L. Integrated Exploration Model for Concealed Ore Deposit: A Case Study from Shuitou Fluorite Deposit, Inner Mongolia, North China. J. Earth Sci. 2021, 32, 370–389. [Google Scholar] [CrossRef]
  17. Fang, Y.; Zhang, S.; Zou, H.; Zhang, P.; Zeng, Z.; Gao, F. Comprehensive exploration method for fluorite deposits in grasslands covered area: A case study of the Saiboluogoumen fluorite deposit in Linxi, Inner Mongolia. J. Chengdu Univ. Technol. (Sci. Technol. Ed.) 2014, 41, 94–101. [Google Scholar]
  18. Zou, H.; Li, M.; Santosh, M.; Zheng, D.; Cao, H.; Jiang, X.; Chen, H.; Li, Z. Fault-controlled carbonate-hosted barite-fluorite mineral systems: The Shuanghe deposit, Yangtze Block, South China. Gondwana Res. 2022, 101, 26–43. [Google Scholar] [CrossRef]
  19. Wang, B.; Yang, X.; Li, S.; Teng, C.; Yang, X.; Huang, F.; Zhang, X.; Cao, J.; Zhou, Y.; Zhang, H. Geochronology, geochemistry, and tectonic implications of early Neoproterozoic granitic rocks from the eastern Beishan Orogenic Belt, southern Central Asian Orogenic Belt. Precambrian Res. 2021, 352, 106016. [Google Scholar] [CrossRef]
  20. Wang, Y.; Zhang, F.; Li, B.; Xue, C.; Liu, J.; Zhao, Y.; Zhang, W. Geology and genesis of the Cihai mafic intrusions in Beishan Terrane, Xinjiang, Northwest China: Implication for iron mineralization and tectonic setting. Ore Geol. Rev. 2020, 121, 103573. [Google Scholar] [CrossRef]
  21. Ruan, B.; Wei, W.; Yu, Y.; Lv, X. Geology, geochronology, mineral chemistry and geochemistry of the Hongnieshan mafic–ultramafic complex in the Beishan area, southern Central Asian orogenic Belt, NW China: Implications for petrogenesis and regional Ni mineralization. Ore Geol. Rev. 2021, 139, 104423. [Google Scholar] [CrossRef]
  22. Yang, J.; Wang, L.; Wang, X.; Xie, X.; Jiang, A. SHRIMP zircon U-Pb dating of the Xiaohongshan vanadium-titanium magnetite deposit, Ejin Banner, Beishan, Inner Mongolia, and its geological implications. Geol. Bull. China 2015, 34, 1699–1705. [Google Scholar]
  23. Zhi, J.; Lei, R.; Chen, B.; Muhtar, M.; Feng, Z.; Zhang, K.; Cai, Y.; Wu, C. Zircon genesis and geochronology for the Zhangbaoshan super-large rubidium deposit in the Eastern Tianshan, NW China: Implication to magmatic-hydrothermal evolution and mineralization processes. Front. Earth Sci. 2021, 9, 682720. [Google Scholar] [CrossRef]
  24. Zhang, Z.; Feng, X.; Zhao, G.; Tan, W. The Metallogenic Rule of Mesozoic Hypogene Deposits in the Eastern Tianshan-Beishan Area. Northwest Geol. 2022, 55, 280–299. [Google Scholar]
  25. Huo, M.; Lu, K.; Si, X.; Dai, S.; Lu, M.; Xue, Y.; Yao, L.; Liu, D.; Xie, G. Geological structural features and copper-gold prospecting direction of the northern Hutoushan in the eastern section of the Beishan Orogenic Belt, Inner Mongolia. Miner. Explor. 2020, 11, 2117–2125. [Google Scholar]
  26. Pei, Q.; Zhang, S.; Hayashi, K.I.; Wang, L.; Cao, H.; Zhao, Y.; Hu, X.; Song, K.; Chao, W. Nature and genesis of the Xiaobeigou fluorite deposit, Inner Mongolia, northeast China: Evidence from fluid inclusions and stable isotopes. Resour. Geol. 2019, 69, 148–166. [Google Scholar] [CrossRef]
  27. Li, K.; Shang, P.; Han, Z.; Wang, C.; Jiao, S.; Wang, G.; Yuan, C.; Zhang, Q.; Liu, Z.; Yan, X. Comprehensive Information Prospecting Method for Fluorite Deposits in Shaowu Area, Northern Fujian Province. Acta Geosci. Sin. 2022, 43, 404–410. [Google Scholar]
  28. Li, K.; Chen, X.; Shang, P.; Yu, X.; Han, Z.; Wei, F.; Liu, Z. Application of the prospecting method of geophysical and geochemical integrated information in the exploration of fluorite deposits. Geol. Surv. China 2019, 6, 98–104. [Google Scholar]
  29. Gao, F.; Zhang, S.; Zou, H.; Cao, H.; Wang, G.; Zeng, Z. The application of the field gamma ray spectrometry to the prospecting for fluorite deposits in LinXi area of Inner Monggolia. Geophys. Geochem. Explor. 2013, 37, 206–211. [Google Scholar]
  30. Zou, H.; Zhang, S.; Fang, Y.; Chen, A.; Gao, F.; Tang, L.; Deng, M. The radioactive elements content of natural fluorite and its influence. Geophys. Geochem. Explor. 2014, 38, 478–484. [Google Scholar] [CrossRef]
  31. Han, B.; Shang, P.; Gao, Y.; Jiao, S.; Yao, C.; Zou, H.; Li, M.; Wang, L.; Zheng, H. Fluorite deposits in China: Geological features, metallogenic regularity, and research progress. China Geol. 2020, 3, 473–489. [Google Scholar]
  32. Orešković, J.; Milošević, A.; Kolar, S.; Borojević Šoštarić, S. The Žune Ba-F epithermal deposit: Geophysical characterization and exploration perspective. Geol. Croat. 2023, 76, 47–56. [Google Scholar] [CrossRef]
  33. Müller, D.; Kwan, K.; Groves, D.I. Geophysical implications for the exploration of concealed orogenic gold deposits: A case study in the Sandy Lake and Favourable Lake Archean greenstone belts, Superior Province, Ontario, Canada. Ore Geol. Rev. 2021, 128, 103892. [Google Scholar] [CrossRef]
  34. Hronsky, J.M.; Groves, D.I. Science of targeting: Definition, strategies, targeting and performance measurement. Aust. J. Earth Sci. 2008, 55, 3–12. [Google Scholar] [CrossRef]
  35. Adagunodo, T.; Sunmonu, L.; Adeniji, A. An overview of magnetic method in mineral exploration. J. Glob. Ecol. Environ. 2015, 3, 13–28. [Google Scholar]
  36. Yu, W.; Wang, M.; Shang, P.; Huang, J.; Wang, Y. Application of high-accuracy ground magnetic survey to the exploration of fluorite deposits. J. Geol. 2019, 3, 428–433. [Google Scholar]
  37. Sharma, S.; Biswas, A.; Baranwal, V. Very low-frequency electromagnetic method: A shallow subsurface investigation technique for geophysical applications. In Recent Trends in Modelling of Environmental Contaminants; Sengupta, D., Ed.; Springer: New Delhi, India, 2014; pp. 119–141. [Google Scholar]
  38. Fang, Y.; Zhang, S.; Zou, H.; Wang, G.; Cao, H.; Li, H. The application of VLF and AMT to the exploration of fluorite deposit. Geophys. Geochem. Explor. 2013, 37, 800–803. [Google Scholar]
  39. Zhang, Y.; Wang, L.; Gao, Y. Geological characteristics, types and development and utilization value of Shuitou fluorite deposit in Linxi, Inner Mongolia. Geol. China 2023, 50, 795–805. [Google Scholar]
  40. Chen, W.; Hao, Q.; Chu, S.; Liu, J.; Liu, H.; Jiang, X. Application of very low frequency electromagnetic method to positioning of concealed metal deposits: An example of copper polymetallic ore occurrences in the southwest greater Hinggan mountains. Geol. Explor. 2017, 53, 528–532. [Google Scholar]
  41. Xia, B.; Cao, H.; Pei, Q.; Yang, B.; Wu, Z.; Xu, T.; Han, S. Exploration of fluorite deposit by the combination of VLF-EM and EH4 on shallow-covered area. J. Guilin Univ. Technol. 2016, 36, 228–233. [Google Scholar]
  42. Liu, P.; Li, Z.; Sang, J.; Zhao, L.; Tie, W. Radioactive characteristics and prospecting significance of fluorite deposits in Southern Song County of Western Henan Province. Miner. Explor. 2024, 15, 1015–1024. [Google Scholar] [CrossRef]
  43. Ge, L.; Li, F. Review of in situ X-ray fluorescence analysis technology in China. X-ray Spectrom. 2020, 49, 458–470. [Google Scholar] [CrossRef]
  44. Liu, C.; Sun, B.; Wei, L.; Li, H.; Meng, F.; Dong, F. Application of the integrated electrical method to exploration in the Zhaishang gold deposit, West Qinling. Geol. Explor. 2020, 56, 1226–1237. [Google Scholar]
  45. Liu, C.; Li, H.; Sun, B.; Ye, G.; Hao, Z.; Xue, D.; Deng, A. Comprehensive geophysical study of Zhaishang Gold deposit, West Qinling. Geol. Rev. 2022, 68, 658–672. [Google Scholar] [CrossRef]
  46. Pitiya, R.; Lu, M.; Chen, R.; Nong, G.; Chen, S.; Yao, H.; Shen, R.; Jiang, E. Audio Magnetotellurics Study of the Geoelectric Structure across the Zhugongtang Giant Lead–Zinc Deposit, NW Guizhou Province, China. Minerals 2022, 12, 1552. [Google Scholar] [CrossRef]
  47. Egbert, G.D. Robust multiple-station magnetotelluric data processing. Geophys. J. Int. 1997, 130, 475–496. [Google Scholar] [CrossRef]
  48. Rodi, W.; Mackie, R.L. Nonlinear conjugate gradients algorithm for 2-D magnetotelluric inversion. Geophysics 2001, 66, 174–187. [Google Scholar] [CrossRef]
  49. Cai, J.; Chen, X. Refined techniques for data processing and two-dimensional inversion in magnetotelluric II: Which data polarization mode should be used in 2D inversion. Chin. J. Geophys. 2010, 53, 2703–2714. [Google Scholar]
  50. Wang, G.; Fang, H.; Qiu, G.; Huang, J. The deep electrical structure across Anqing-Guichi ore concentration area. Geol. China 2019, 46, 795–806. [Google Scholar]
  51. Egbert, G.D.; Kelbert, A. Computational recipes for electromagnetic inverse problems. Geophys. J. Int. 2012, 189, 251–267. [Google Scholar] [CrossRef]
  52. Kelbert, A.; Meqbel, N.; Egbert, G.D.; Tandon, K. ModEM: A modular system for inversion of electromagnetic geophysical data. Comput. Geosci. 2014, 66, 40–53. [Google Scholar] [CrossRef]
  53. Jiang, F.; Chen, X.; Unsworth, M.; Cui, T.; Sun, X.; Han, B. Comparison of 2D and 3D inversion results: A case study of an MT profile. In Proceedings of the 24th EM Induction Workshop, Helsingør, Denmark, 12–19 August 2018. [Google Scholar]
  54. Singh, S.; Rani, A.; Mahajan, R.K. 226Ra, 232Th and 40K analysis in soil samples from some areas of Punjab and Himachal Pradesh, India using gamma ray spectrometry. Radiat. Meas. 2005, 39, 431–439. [Google Scholar] [CrossRef]
  55. Yang, Y.; Zhang, G.; Yao, C.; Deng, Z.; Ren, Z.; Li, C. Application of Induced Polarization Method in Mineral Resource Exploration. Sustainability 2023, 15, 3840. [Google Scholar] [CrossRef]
  56. Zhang, C.; Li, S.; Bai, D.; Cheng, H.; Cao, J.; Zhang, A.; Sun, J.; Zhao, H. Application of the time—Domain IP method to the exploration of concealed fluorite deposits:A case study of the Tielu fluorite deposit in Fangcheng County, Henan Province. Geol. Explor. 2022, 58, 369–380. [Google Scholar]
  57. Wang, J.; Shang, P.; Xiong, X.; Yang, H.-Y.; Tang, Y. Metallogenic regularities of fluorite deposits in China. Geol. China 2015, 42, 18–32. [Google Scholar] [CrossRef]
Figure 1. (a) Simplified tectonic subdivision map of the study area; the red box shows the study area. (b) Tectonic setting of eastern Tien Shan and Beishan Gobi Desert areas. (c) The geological map of the Beishan region, in which the blue box is the Gobi Desert shallow-covered area, is a hidden fluorite ore localization prediction technology test area, as shown in Figure 2.
Minerals 14 00838 g001
Figure 2. Mineral geological map of the study area and location of integrated geophysical exploration. 1. Quaternary gravel; 2. Lower Cretaceous Chijinbao Formation; 3. Upper Cambian–Lower Ordovician Xishuangyingshan Formation; 4. Late Permian biotite monzonitic granite; 5. Porphyritic biotite monzonitic granite; 6. Diabase dikes; 7. Diorite porphyrite veins; 8. Gabbro dikes; 9. Quartz veins; 10. Fault of unknown nature; 11. Inferred faults; 12. Location and number of mineralized alteration zones; 13. Location and number of ore bodies; 14. The working range of ground magnetic survey measurement is 15. The working range of the IP intermediate client method is 16. AMT sites.
Minerals 14 00838 g002
Figure 3. The map of reduction to the pole magnetic anomalies in the Huashitoushan, as well as the regional geological map (a) and contour of VFDMA (b). 1. Geological boundaries; 2. Prediction of geological boundaries; 3. Prediction of structural zones; 4. Mineralized alteration zone; 5. Fluorite ore body; 6. diabase veins; 7. Trenching position; 8. Late Permian biotite monzonitic granite; 9. Quaternary sand gravel; 10. Lower Cretaceous Chirinabe Formation.
Minerals 14 00838 g003
Figure 4. Induced polarization (IP) resistivity anomaly diagram of the detection area in the Huashitoushan and the regional geological map. 1. Geological boundaries; 2. Prediction of structural zones; 3. Mineralized alteration zone; 4. Fluorite ore body; 5. Quartz veins; 6. Diabase dikes; 7. Late Permian biotite monzonitic granite; 8. Quaternary sand gravel; 9. Lower Cretaceous Chijinbao Formation; 10. Upper Cambian–Lower Ordovician West Shuangyingshan Formation.
Minerals 14 00838 g004
Figure 5. Horizontal slices of the 3D inversion model at depths of 50, 100, 150, 200, 300, and 400 m (af), respectively. The superposed geological features are the same as in Figure 2. Warm and cold colors indicate high and low resistivity, respectively.
Minerals 14 00838 g005
Figure 6. Line 1 integrated geophysical profile ((a) IP resistivity; (b) PXRF; (c) PGR; (d) AMT 2d inversion).
Minerals 14 00838 g006
Figure 7. Comparison diagram of the AMT comprehensive profile.
Minerals 14 00838 g007
Figure 8. An integrated sketch diagram illustrating possible formation mechanisms of fluorite deposit in the Beishan metallogenic belt (a) and a perspective display of the 3D resistivity model and schematic geological interpretation (b).
Minerals 14 00838 g008
Table 1. The physical property parameters of the rocks and ores in the Huashitoushan working area.
Rock TypesSamplesMagnetic Susceptibility SI (10−6)
RangeAverage
Altered cataclastic rock101~53.34
Fluorite veins150~51.06
Granite1036~17981.3
Quartz sandstone163~208.7
Table 2. The electrical parameters of the rocks and ores in the Huashitoushan working area.
Rock TypesSamplesρ (Ω·m)η (%)
MinimumMaximumAverageMinimumMaximumAverage
Quartz sandstone54722939870370.8952.2761.74
Quartz vein5197810,71255980.3061.4260.77
Tectonic breccia55403.35403.35403.31.022.821.82
Altered cataclastic rock56822.016,830.511,223.30.751.701.12
quaternary2035218.72
Table 3. Statistics of lithologic radioactivity content in some fluorite deposits (modified from [30,42]).
LithologyTc/10−6Deposit Location
Variation IntervalMean Value
granite35.4~99.365.9Southern Songxian County, Henan Province, China
Rhyolite porphyry25.6~70.350.1
Altered granite40.6~95.162.3
Altered rhyolite21.0~72.348.9
Massive fluorite ore11.2~40.023.0
Cemented fluorite ore13.0~48.325.8
Banded fluorite ore14.2~45.527.3
Quartz–fluorite ore15.8~50.426.5
Fine vein fluorite ore14.1~73.437.6
sand slate9.4~25.015.9Linxi County, Inner Mongolia, China
fluorite ore4.5~8.96.3
limestone6.7~20.011.03Pengshui County, Chongqing, China
fluorite ore0.9~7.43.86
Disclaimer/Publisher’s Note: The statements, opinions and data contained in all publications are solely those of the individual author(s) and contributor(s) and not of MDPI and/or the editor(s). MDPI and/or the editor(s) disclaim responsibility for any injury to people or property resulting from any ideas, methods, instructions or products referred to in the content.

