Abstract
Successful geophysical exploration projects in the Gucheng–Yaxi area located in Gaochun District, Jiangsu Province, China, have been limited partly due to the complex geological conditions of the area and high artificial noise in data acquired using electrical and electromagnetic methods. In this study, we deployed the new anti-interference spread-spectrum-induced polarization method (SSIP) and the audio-magnetotelluric (AMT) method to detect a copper–polymetallic deposit in the area. Two-dimensional inversion results in the Gucheng–Yaxi area revealed a high chargeability anomalous zone on the SSIP profile that coincided with a zone of moderate resistivity located between two resistor bodies on the AMT profile. A follow-up 1200 m drill hole was established at this high-chargeability, moderate-resistivity zone which encountered polymetallic (copper, lead, zinc, gold, and silver) mineralization at a depth of ≥400 m. Drill hole data analysis showed that mineralization occurred interspaced in the marble rock mass at varying depths. Furthermore, several low-resistivity, weak-chargeability sections were revealed and attributed to Cretaceous sediments and faults. These faults are thought to have played a critical role in the polymetallic mineralization genesis. In summary, this study demonstrated the successful of application of SSIP and AMT in detecting a metallic deposit in an area with high artificial noise. Hence, the geophysical prospection potential of the Gucheng–Yaxi area is great.
1. Introduction
The need for essential mineral resources including copper, cobalt, lithium, and nickel, among others, will persist due to ongoing global attempts to shift from fossil fuel energy to more eco-friendly energy technology [1,2,3]. Ensuring the reliable supply of essential minerals is a significant concern for our society in order to facilitate a sustainable future through the mitigation of climate change [4,5]. Although recycling efforts are on the rise, it is certain that primary resources will continue to be required in order to meet demand in the foreseeable future [6]. The identification of such reserves of raw materials is achieved through a sequential process that involves escalating investment and mitigating assumed risks [7]. The initial stage of this intricate procedure involves identifying surface indications of mineralization that could potentially be connected to an underground mining deposit [8]. Following this phase is the target detailing phase, in which a series of indirect investigative techniques are employed as a rapid and cost-effective alternative [9]. The emphasis on geophysics in this scenario is due to frequent discrepancies regarding the physical qualities of mineral and country rock deposits, which may be measured in the field using instruments [10,11]. Electromagnetic (EM) and electrical geophysical methods have been extensively applied successfully in the study and discovery of new mineral deposits [12,13,14,15]. For instance, controlled-source magnetotelluric (CSAMT), audio-magnetotelluric (AMT), and induced polarization methods have been applied to study the shallow part of a deeper mineralization deposit [16,17,18,19]. The magnetotelluric (MT) sounding and the wide-field electromagnetic (WFEM) methods are being increasingly applied to meet the demands for deep resource exploration [20,21,22]. A novel technique called spread-spectrum-induced polarization (SSIP) has been suggested in recent times. This method utilizes ZigBee wireless sensor networks and GPS timing to achieve simultaneous, real-time, and complete waveform acquisition. Additionally, it enables the monitoring of data quality in real-time for a large number of SSIP receivers [18,23,24].
In this paper, we present new AMT and SSIP data from a potential Cu–polymetallic mineralization deposit in the Gucheng–Yaxi area, Gaochun District, Jiangsu, China. Our exploration in Gaochun draws inspiration from the Chating deposits, as both areas share the same metallogenic belt.
2. Geological Background
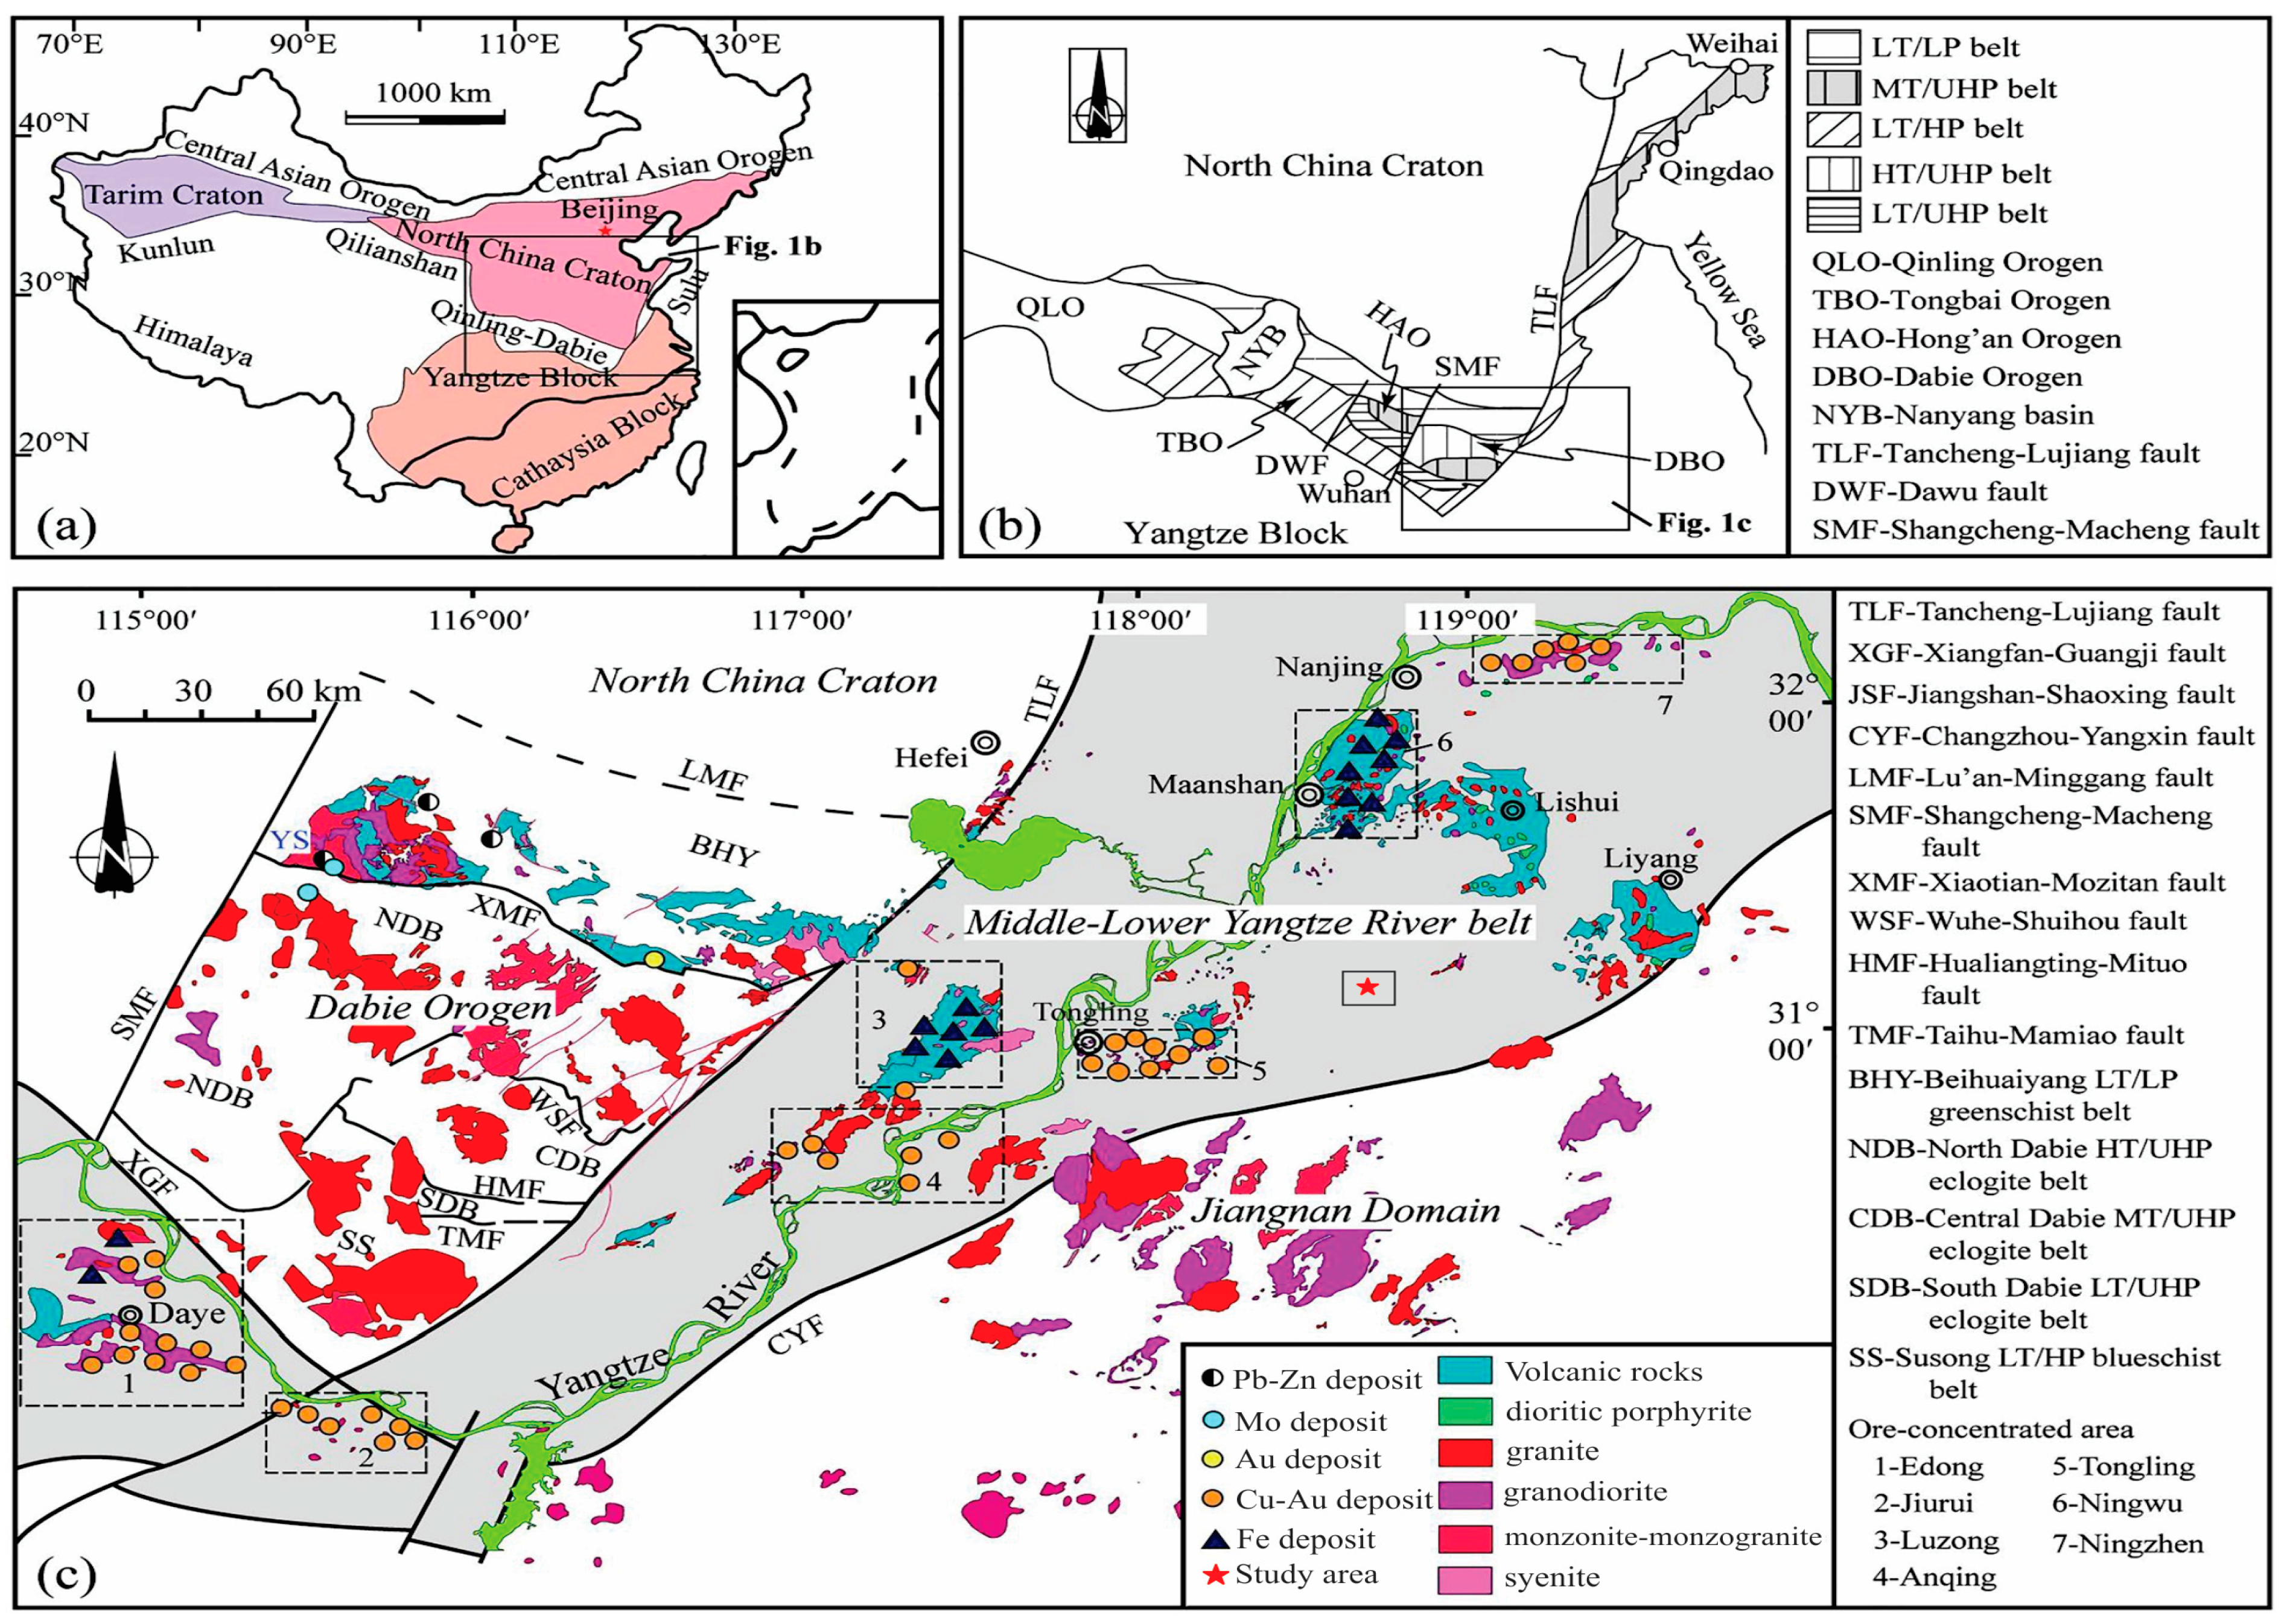
Eastern China consists of three primary tectonic blocks: the North China Craton (NCC), the Yangtze Block, and the Cathaysia Block (Figure 1a). The Tongbai–Hong’an–Dabie Orogenesis occurred due to the subduction and collisions of the South China Block (SCB), which includes the Yangtze and Cathaysia blocks, with the North China Craton (NCC) during the Triassic period. This mountain range stretches for a distance of 500 km, starting from the Nanyang Basin in Henan Province and ending at the Tan-Lu regional strike-slip fault in Anhui Province (Figure 1b). The Middle-Lower Yangtze River Basin (MLYRB) has abundant late-Mesozoic magmatic rock and ore deposits, making it a highly significant area for studying large-scale Mesozoic magmatic activity and mineralization in eastern China (Figure 1c) [1].
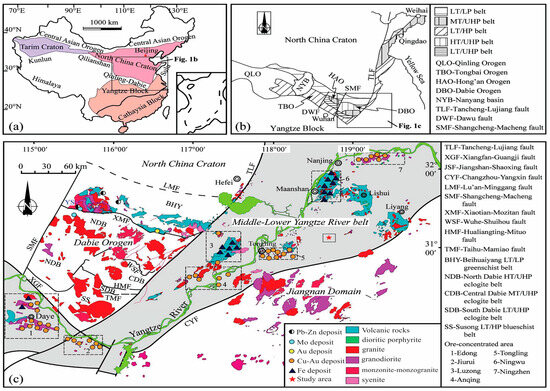
Figure 1.
Geological sketch map, showing (a) the tectonic locations of the DBO and (b) the MLYRB, and (c) the distribution of late-Mesozoic magmatic rocks and polymetallic deposits. Modified from [1].
The geological characteristics of the Gucheng–Yaxi area remain largely unexplored, with no prior investigations having been conducted. However, based on our field data, the geological conditions surrounding the survey area primarily consist of Quaternary strata covered by the Lower Cretaceous Ganhe Formation (K1g) in the Gucheng Lake West survey area. The adjacent Quaternary strata include the Early Cretaceous Yixian Formation (K1y) and the Middle Silurian Fentou Formation (S2f). These strata exhibit a general northeast-to-southwest distribution with an overall northwest trend. Gaochun District can be divided into two tectonic layers on a regional scale. The lower tectonic layer is composed of the Silurian to Triassic systems. The various stratigraphic units (groups and formations) are in conformable or paraconformable contact. The Indosinian Movement caused the lower tectonic layer to undergo relatively strong folding, and at the same time produced two sets of longitudinal and transverse faults with northeast and northwest directionalities (Figure 2). The upper tectonic layer is composed of the Jurassic and Cretaceous systems. It is a set of continental volcanic rocks and inland depression red strata. The strata between the layers are in unconformable contact, and the folding structure is weak. The main faults developed in the area are the northeast-trending Maodong and Maoxi faults (Figure 2). Fault structures are developed, and the phenomena of faulting, missing strata, etc. are relatively common [25].
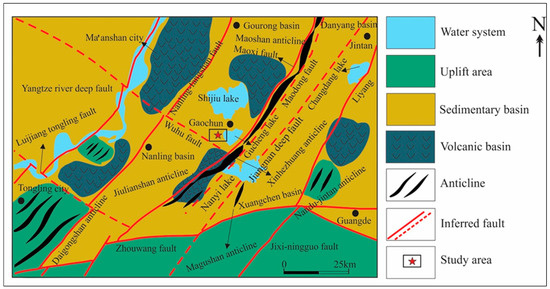
Figure 2.
Regional tectonic outline map of Gaochun area modified from [25].
About 5 km southwest of the Gucheng–Yaxi prospecting area, a large porphyry copper–gold deposit called Chating was discovered in recent years, which is taken here as a reference. The Chating deposit is lightly laden, and the exposed layer of the deposit, as shown through the drill holes, is composed of Quaternary layers with a thickness ranging from three to ten meters, and Lower Cretaceous strata with a thickness that varies from a few to a few hundred meters [24]. The sedimentary strata encompassing the deposit are part of the Lower Triassic Helongshan Formation, characterized by a prevalence of limestone with a smaller proportion of argillaceous limestone and mudstone [26]. The Chating deposit has ore-bearing rocks that are disguised within a quartz diorite porphyry stock. The structure that hosts the ore is composed of breccias located inside the porphyry stock [27]. The ore-bearing rocks and the hosting structures are overlaid directly by volcanic rocks, while the wall rocks are marble rocks [28]. The presence of copper mineralization is believed to have a strong connection to the alteration of the porphyry, with the primary ore deposits found within the potassic and phyllic alteration zones [29].
3. Method
3.1. Audio-Magnetotellurics
The audio-magnetotelluric (AMT) method is a geophysical technique that investigates the electrical properties of the subsurface by utilizing natural electromagnetic (EM) fields generated by global lightning or sferics (short period signals) and solar wind activity in the ionosphere (long-period signals). The AMT method utilizes the segment of electromagnetic fields that commonly fall between the frequency range of 10,000 Hz to 1 Hz. Additional information can be found in [30], The Magnetotelluric Method: Theory and Practice, Cambridge University Press, Cambridge UK, and “Simpson, F. & Bahr, K., 2005 [31]. Practical Magnetotellurics, Cambridge University Press, Cambridge, UK”. For more information [32,33,34]. Conceptually, the earth is considered to be a flat medium, while magnetotelluric fields are regarded as electromagnetic waves that are projected vertically onto the ground [35]. When these waves strike the ground, a significant percentage of them is reflected, while only a small component is transmitted into the subsurface [34]. Electromagnetic induction generates telluric currents in the subsurface, the strength of which is determined by the electrical resistivity of the materials in the subsurface. Signal transmission by diffusion occurs, leading to a decrease in signal strength as the distance increases [36]. The skin depth (δ) is a measure of the depth (in meters) at which an electromagnetic (EM) wave decays to 1/e of its original amplitude at the surface [37].
Measurements are taken of the orthogonal components of the electromagnetic field on the ground. The frequency response indicates the way in which the electrical properties of the subsurface medium are distributed. The temporal fluctuation of the electromagnetic field component is transformed into a frequency spectrum. Electromagnetic frequency domain responses, such as apparent resistivity and impedance phase, can be calculated. The expression used to compute apparent resistivity is as follows:
Substitute the orthogonal electromagnetic field components , , , and obtained from field measurements into Equations (1) and (2). Use the least squares method to determine , , and . Subsequently, substitute the impedance Z into Equation (3) to calculate the Cagniard apparent resistivity, where the term in Equation (3) represents the frequency.
3.2. Spread-Spectrum-Induced Polarization Method
The SSIP method is a novel technique for conducting induced polarization (IP) measurements in the frequency domain [38]. The method uses spread spectrum communication for geophysical instruments. This system has the characteristics of large depth, high precision, anti-interference, low cost, and high efficiency. It is currently widely used and has produced significant social and economic benefits [24]. The key distinction between the FDIP and SSIP methods lies in the nature of the signal employed for the injected current. The SSIP system sends M-sequence pseudo-random spread-spectrum signals through the transmitter as the primary source current [39,40,41]. In classic FDIP, rectangular current waves with constant durations are employed as the type of signal for the injected (main) current. In SSIP surveying, a comparison is made between the voltage signals measured on the potential electrodes and the signals transmitted through the current electrodes over several frequencies (i.e., a spectrum of frequency) [18]. The frequency band of SSIP acquisition is 1/16–1 Hz, and the amplitude of the primary injected current depends on the strength of EM interferences in the area under survey. For example, in regions with robust electromagnetic interferences resulting from cultural activities like mining operations and drilling activities, large primary current amplitudes are transmitted [39]. The apparent complex resistivity for a set of frequencies can be acquired using a method that closely resembles classic FDIP techniques:
The symbol ρ() represents the frequency-dependent apparent resistivity, represents the frequency spectrum of the potential difference data, represents the frequency spectrum of the synchronous primary current data, and represents the geometric factor of the array.
The equation represents a system with voltage electrodes and , and current electrodes and . The values , , , and represent the distance between the individual electrodes.
In SSIP, a comparison is made between the voltage signals measured on the potential electrodes and the signals transmitted through the current electrodes over several frequencies (i.e., a spectrum of frequency).
3.3. Audio-Magnetotelluric Instruments
The time series data were recorded with a GSEM-W10 system. This is an acquisition system that is produced by Giant Sequoia Artificial Intelligence Technology Co., Ltd., Changsha, China [38]. The Internet of Things (IoT) Wideband Ground Electromagnetic Instrument GSEM-W10 integrates audio-magnetotelluric (AMT) and magnetotelluric (MT or LMT) capabilities. It features portability, low power consumption, low noise, and high exploration efficiency. Particularly noteworthy is its support for networking observations with hundreds of IoT wideband ground electromagnetic instruments, significantly enhancing exploration accuracy and efficiency while reducing exploration costs. The optimal exploration depth for the AMT mode is approximately 1000 m, while the MT mode can achieve a maximum exploration depth of up to 150 km. This allows for simultaneous consideration of exploration depth and accuracy, ultimately reducing user costs.
3.4. SSIP Working Principles and Parameters
The transmission subsystem provides precise synchronous transmission of spread-spectrum waves by utilizing cutting-edge technology including high-precision GPS synchronization and a high-power IGBT inverter [14]. The apparatus can broadcast spread-spectrum waves with orders between 3 and 9 at frequencies between 1/256 Hz and 8192 Hz. A maximum voltage transmission of 1000 V, a maximum current transmission of 10 A, and a maximum frequency transmission of 256 frequencies are the characteristics of the frequency wave. Modular series or parallel technologies can be used to increase the sending voltage or sending current with flexibility. Through the use of wireless dispersed network observation, the receiving subsystem is able to achieve multi-device combination reception and high-density power supply along the measuring line.
The exploration array used for SSIP deep sounding is a double-sided pole–dipole array, as shown in Figure 3. During construction, the number of measurement points is first calculated based on the profile length and point spacing. Subsequently, all potential electrodes and acquisition stations are arranged simultaneously along the entire profile. Power is then supplied point by point according to the designated power supply points. During each power supply, all channels measure simultaneously. Once all the designated power supply points are completed, the measurement for the entire profile is finished.
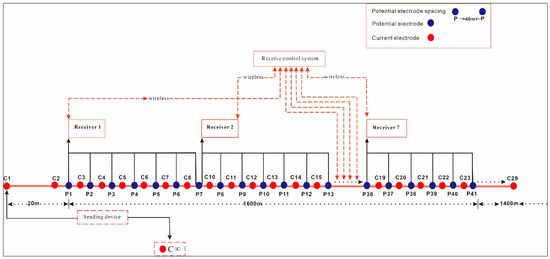
Figure 3.
Schematic diagram of SSIP for pole–dipole sounding.
During the acquisition, the initial current electrode spacing is set to be 80 m. Then, the spacing is increased to 200 m from C23 up to C27, and then to 250 m from between C27 and C28 up to C29. The spacing between potential electrodes is a constant 40 m as shown in Figure 4. To ensure the high resolution of near-surface structures, there are a total of 29 current injections both inside and outside the receiver array.

Figure 4.
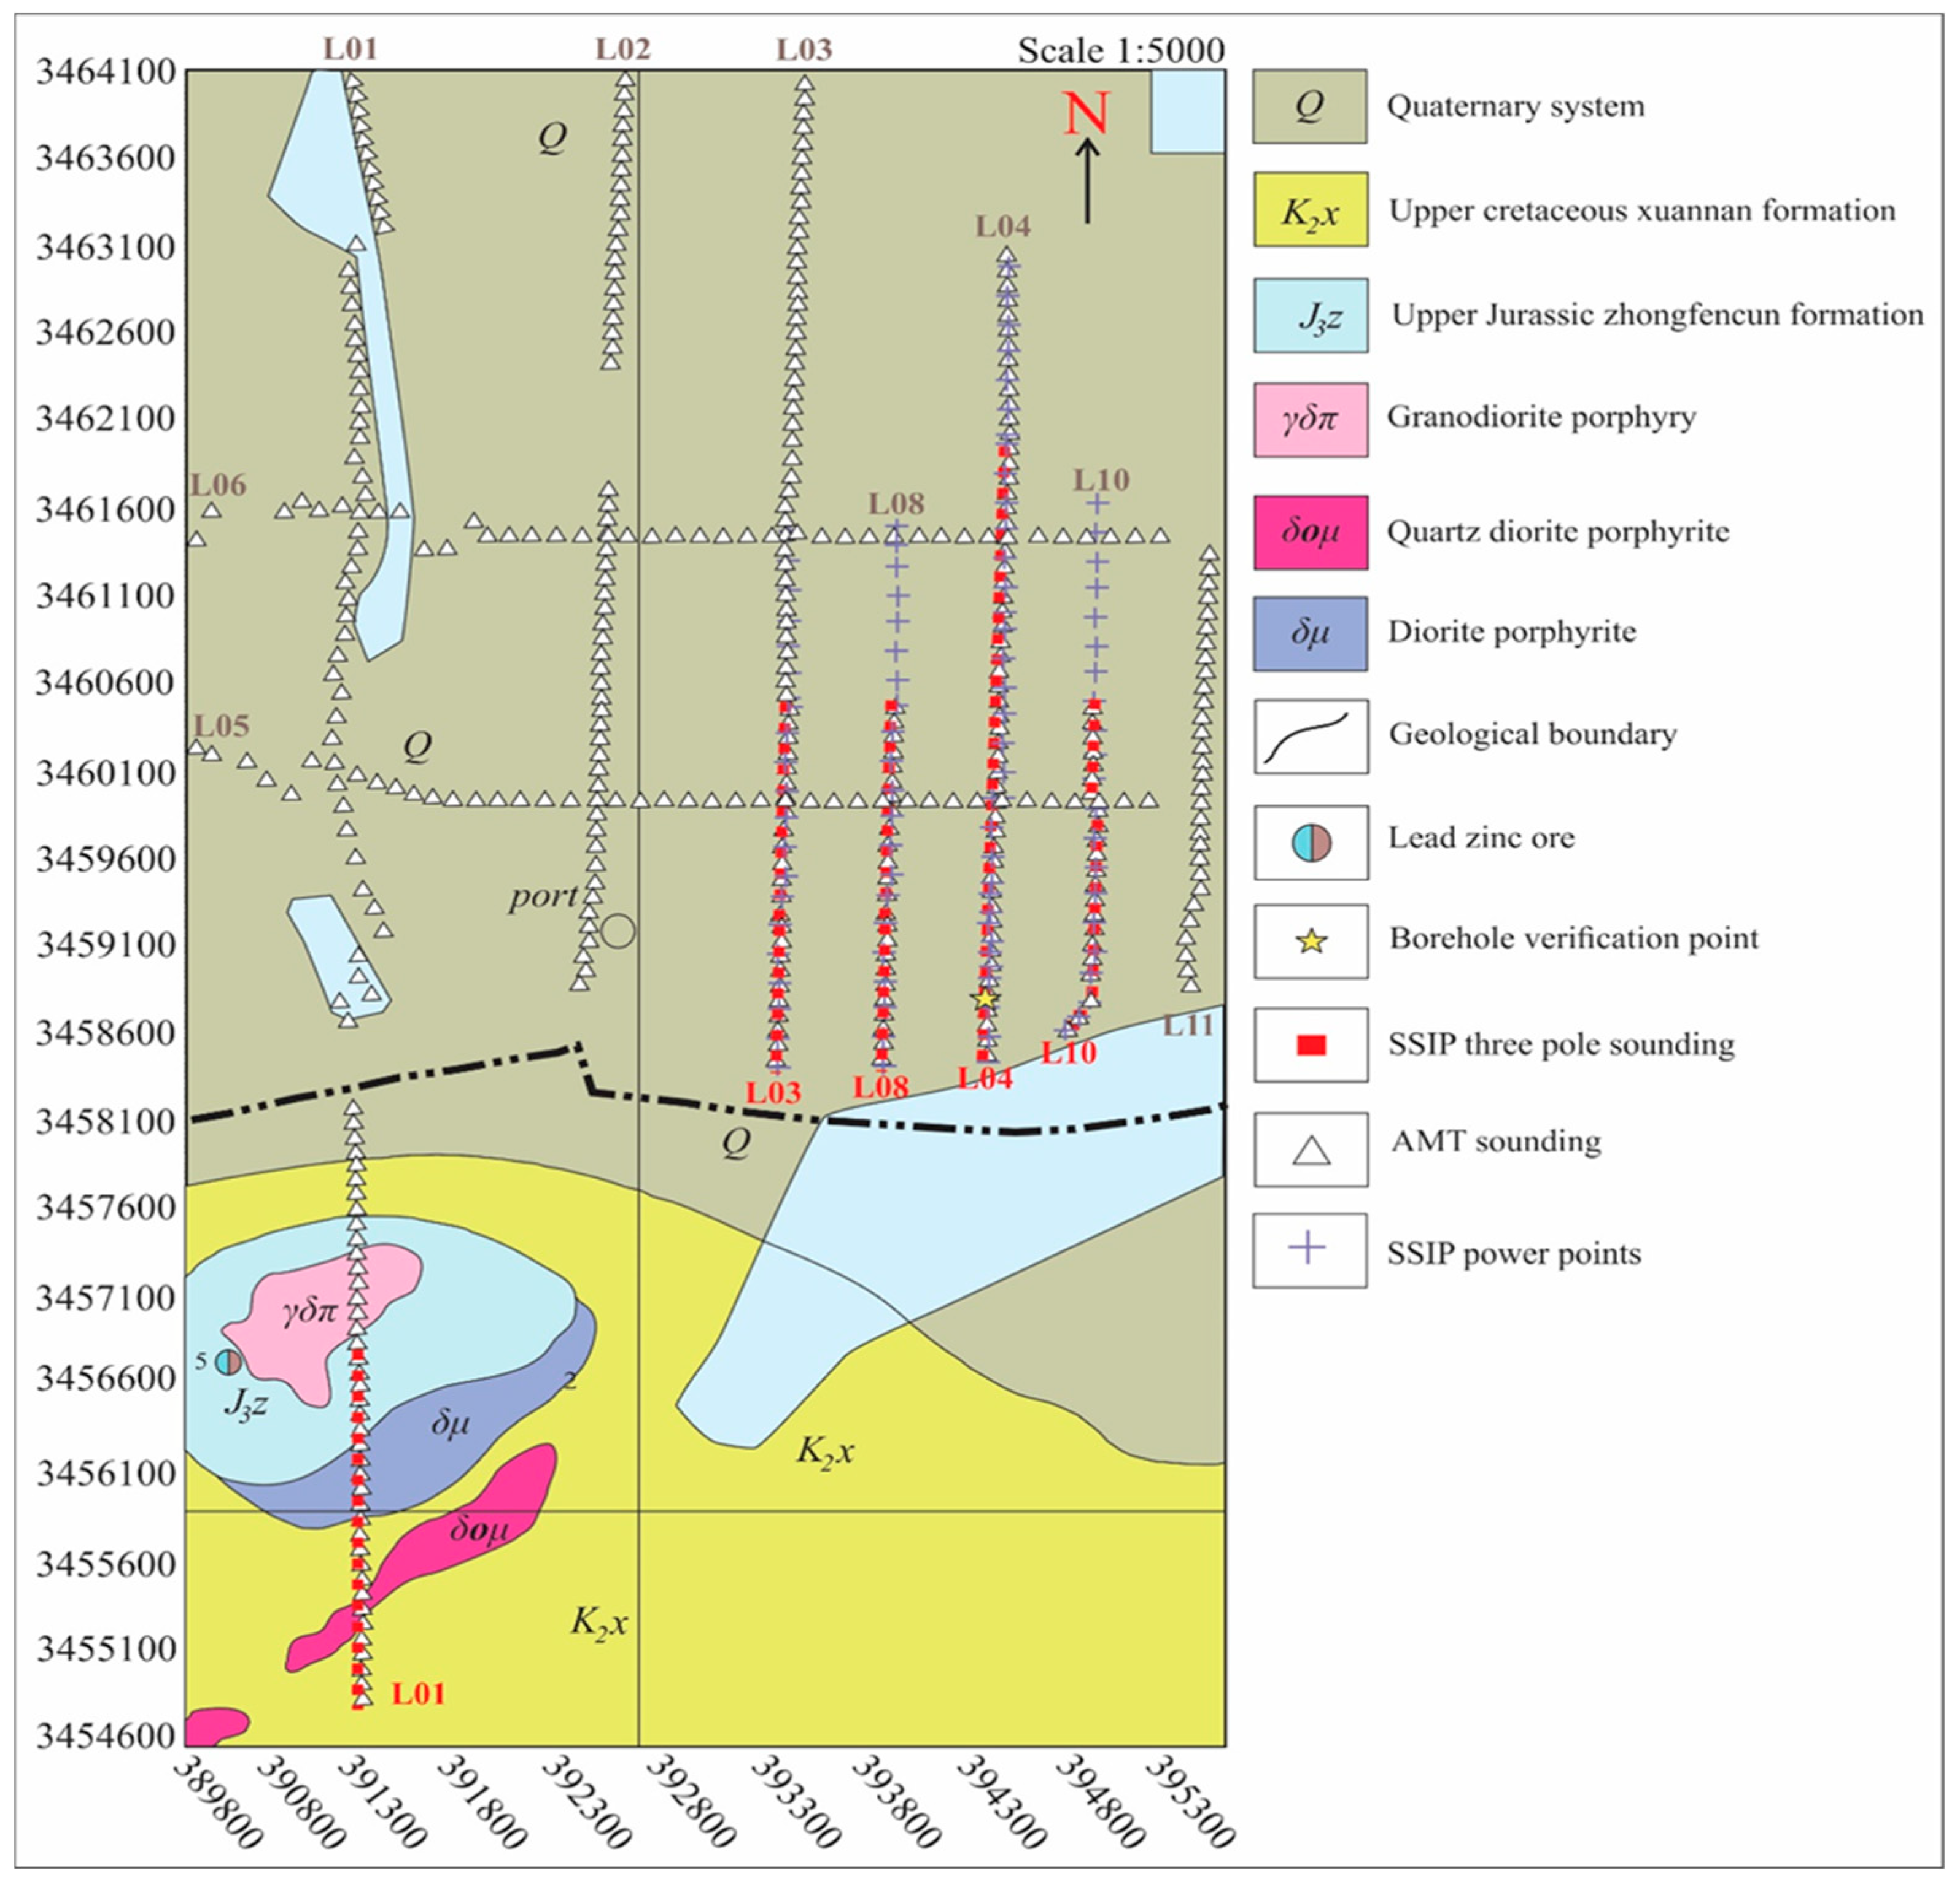
Map showing the AMT and SSIP survey lines on top of an interpretation of the geology across Chating copper–gold deposit L01 and the newly explored Cu–polymetallic deposit in Gucheng.
The GS2IP-FW10 was utilized for data acquisition. This system, created by Giant Sequoia Artificial Intelligence Technology Co., Ltd. in Changsha, China, is an acquisition system. This device achieves simultaneous, real-time collection of complete waveform data and real-time monitoring of data quality for large-scale SSIP receivers. It utilizes a ZigBee wireless sensor network and GPS timing [38].
4. Data Acquisition and Processing
4.1. AMT Data Acquisition
In June 2022, we conducted an AMT survey in the Gucheng–Yaxi area of Gaochun District, Jiangsu Province, China. The survey involved a single 5000-m-long line oriented in a South–North direction with 60 stations spaced approximately 100 m apart. The line was positioned perpendicular to the assumed geological strike, with the y-axis aligned parallel to the strike and the x-axis along the profile (S–N).
The GSEM-W10 system, built by Giant Sequoia Artificial Intelligence Technology Co., Ltd. in Changsha, China, was used to collect AMT time-variant field data [38]. The dataset comprised time series data from 53 frequencies spanning a range of 1 Hz to 10,400 Hz. Induction coil magnetometers (ICM) were used to measure the two horizontal components of the electric field (Ex and Ey) and the two orthogonal components of the magnetic field (Hx and Hy). In order to measure the electric field, two sets of non-polarizable lead chloride (Pb–PbCl2) electrodes were used. Each measuring location was soaked in water beforehand to minimize contact resistance.
Data recording occurred during the daytime, with each station measuring for 35 to 40 min. Raw data visualization, quality checks, and processing were carried out using the GSEM-Pros software [42]. The processing entailed converting time series data into the frequency domain using a statistical Discrete Fourier Transform (DFT) within the GSEM-Pros program.
The cross-power spectra derived from this procedure enabled the determination of the impedance tensor based on frequency, yielding insights into the dimensionality and orientation of subterranean formations. In general, the data quality was considered satisfactory at all the sites that were surveyed.
4.2. SSIP Data Acquisition
The spread-spectrum IP collection settings were developed based on current work area data and the designated exploration depth. The distance from the place of reception was 40 m.
The maximum length of an individual profile is 2000 m, which may be adjusted based on the specific characteristics of the terrain. In the western work area of Guchenghu, there existed a vertical gap of 5 km between the measuring line and power supply point B, which was located at an out-of-bounds distance. The maximum distance for transmitting and receiving signals in the Guchenghu western work area was 3 km. The waveform being sent was a 5th-order spread-spectrum wave, which consisted of four frequencies that have been merged. The fundamental frequency was 1/16 Hz. The measurement parameters consisted of four parameters related to resistivity, three parameters related to relative phase, and one parameter related to frequency dispersion.
The acquisition of the induced polarization field in the spread spectrum required preprocessing in order to obtain parameters such as apparent resistivity, relative phase, and dispersion. However, these parameters were stored in multiple binary files, with each file corresponding to a specific power supply. It is important to note that these files did not contain any elevation information. In order to perform inversion, it was vital to consolidate all the observable resistivity, relative phase, and dispersion values of the corresponding frequency into a single file. Concurrently, the elimination of erroneous data points and the inclusion of elevation data were essential steps. The use of the SipProc software latest version may make these activities easier to carry out.
5. Data Analysis
We utilized the MTPy software package to perform data analysis and visualization on the processed AMT data that were observed. This analysis focused on the resistivity-phase curves, dimensionality, and geoelectric strike of the plot. The MTPy is a Python library for magnetotelluric data analysis that is open source and was created by Geoscience Australia [43,44].
5.1. Apparent Resistivity-Phase Curves and Pseudo-Sections
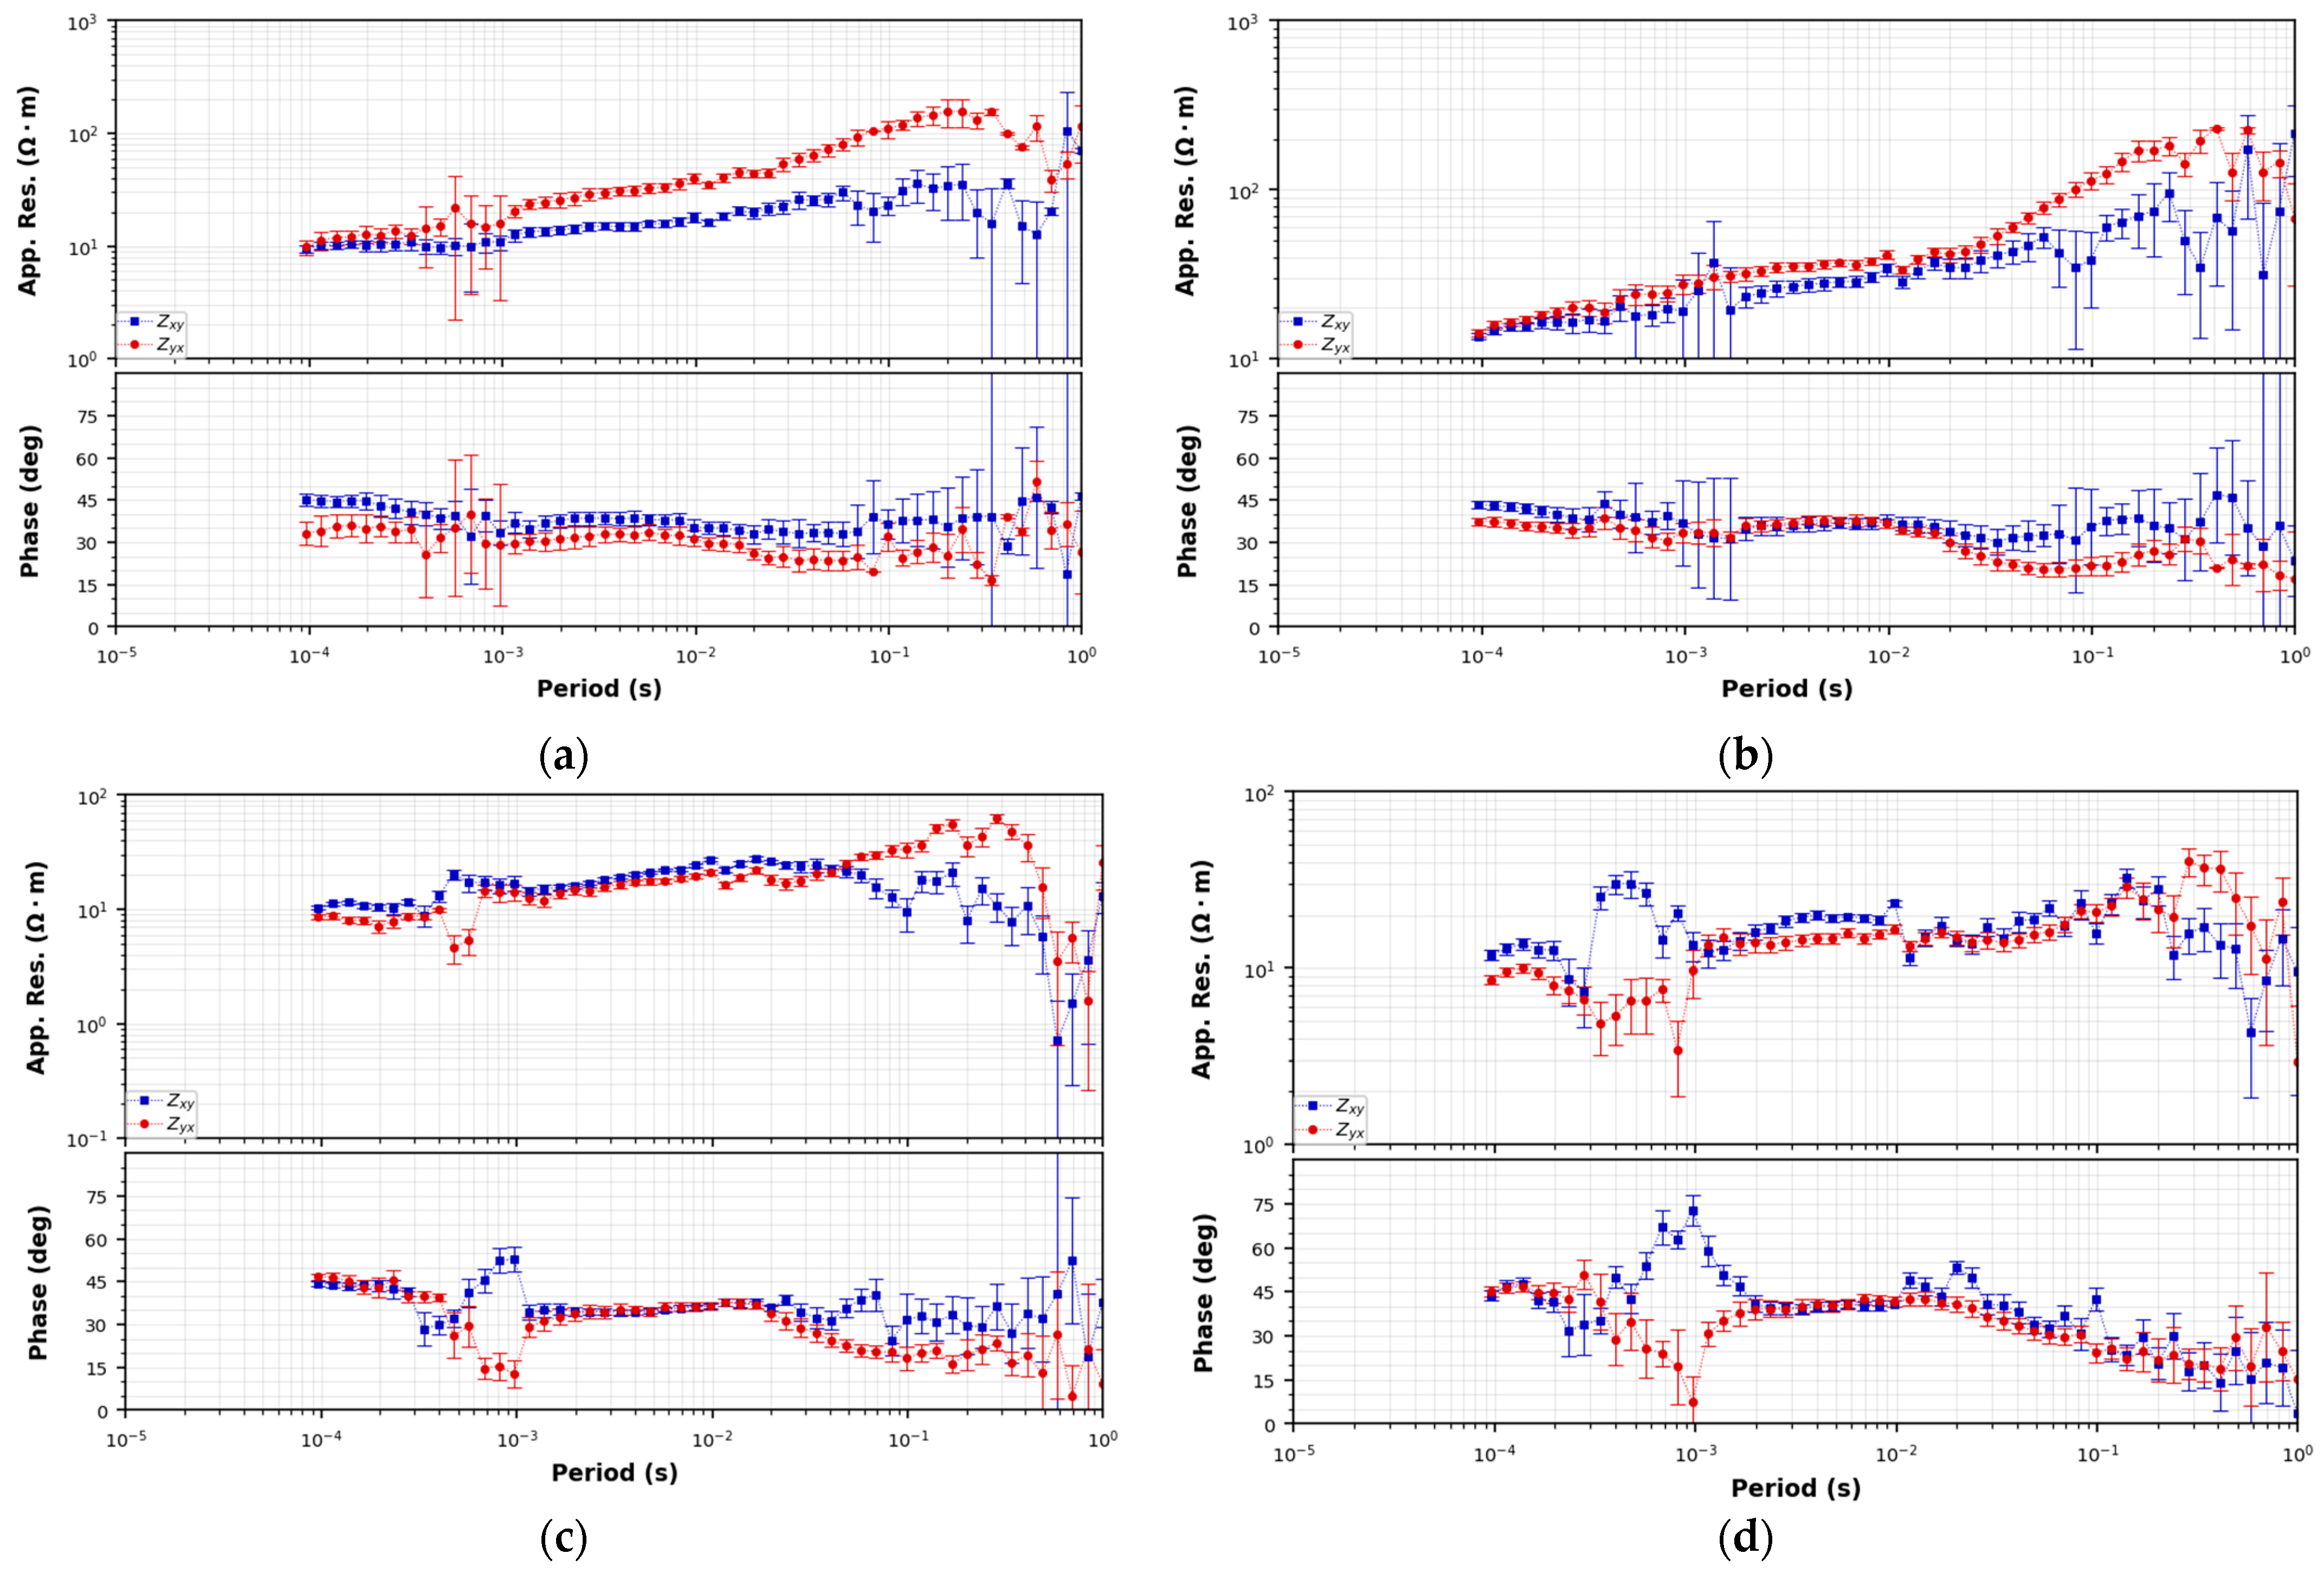
The resistivity-phase curves (Figure 5) show the quality of the acquired AMT data for four selected representative sounding stations. The resistivity structure of the study area shows low resistivity at short period with a phase angle asymptotic to but greater than 45°, and high resistivity at long period with a phase angle below 45°. Hence, the subsurface can be generally categorized into a shallow conductive layer and a deep resistive layer (Figure 5).
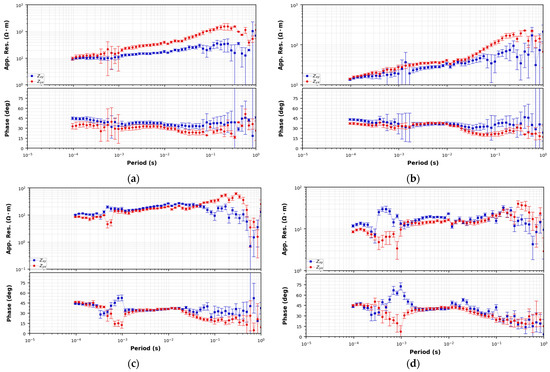
Figure 5.
Observed apparent resistivity-phase curves for four typical AMT stations, (a) L04-183, (b) L04-193, (c) L04-236, and (d) L04-311.
5.2. Dimensionality Analysis
Prior to conducting inversion, we assessed the dimensionality of the AMT data to determine whether the phases at a specific frequency, computed impedance tensors, and apparent resistivity aligned with one-dimensional (1D), two-dimensional (2D), or three-dimensional (3D) geoelectrical structures. Due to the fact that galvanic distortions do not have an impact on the phase tensor, we utilized it to examine dimensionality [45].
The parameter β, known as the phase tensor skew, is essential for obtaining detailed information on the complexity and dimensionality of the AMT data related to the subsurface structure. The phase tensor in a one-dimensional Earth or layered subsurface exhibits a circular shape, indicating a small skew angle (β) [45]. The phase tensor has an elliptical distribution when considering a two-dimensional regional resistivity structure. When analyzing a two-dimensional regional resistivity structure, the phase tensor has an elliptical shape. In order to achieve data that are free from errors, the value of β decreases to zero [46]. The phase tensor in a three-dimensional Earth has huge β values and is non-symmetric. It has also been demonstrated that a quick lateral shift in the phase tensor’s primary axis indicates the presence of three-dimensional structures [45]. Typically, when β is less than or equal to 5°, it is approximately a two-dimensional (2D) structure. Conversely, when β is greater than 5°, it is considered a three-dimensional (3D) structure [47]. Hence in this study, a criterion for |β| ≤ 5° is used to identify a 2D structure.
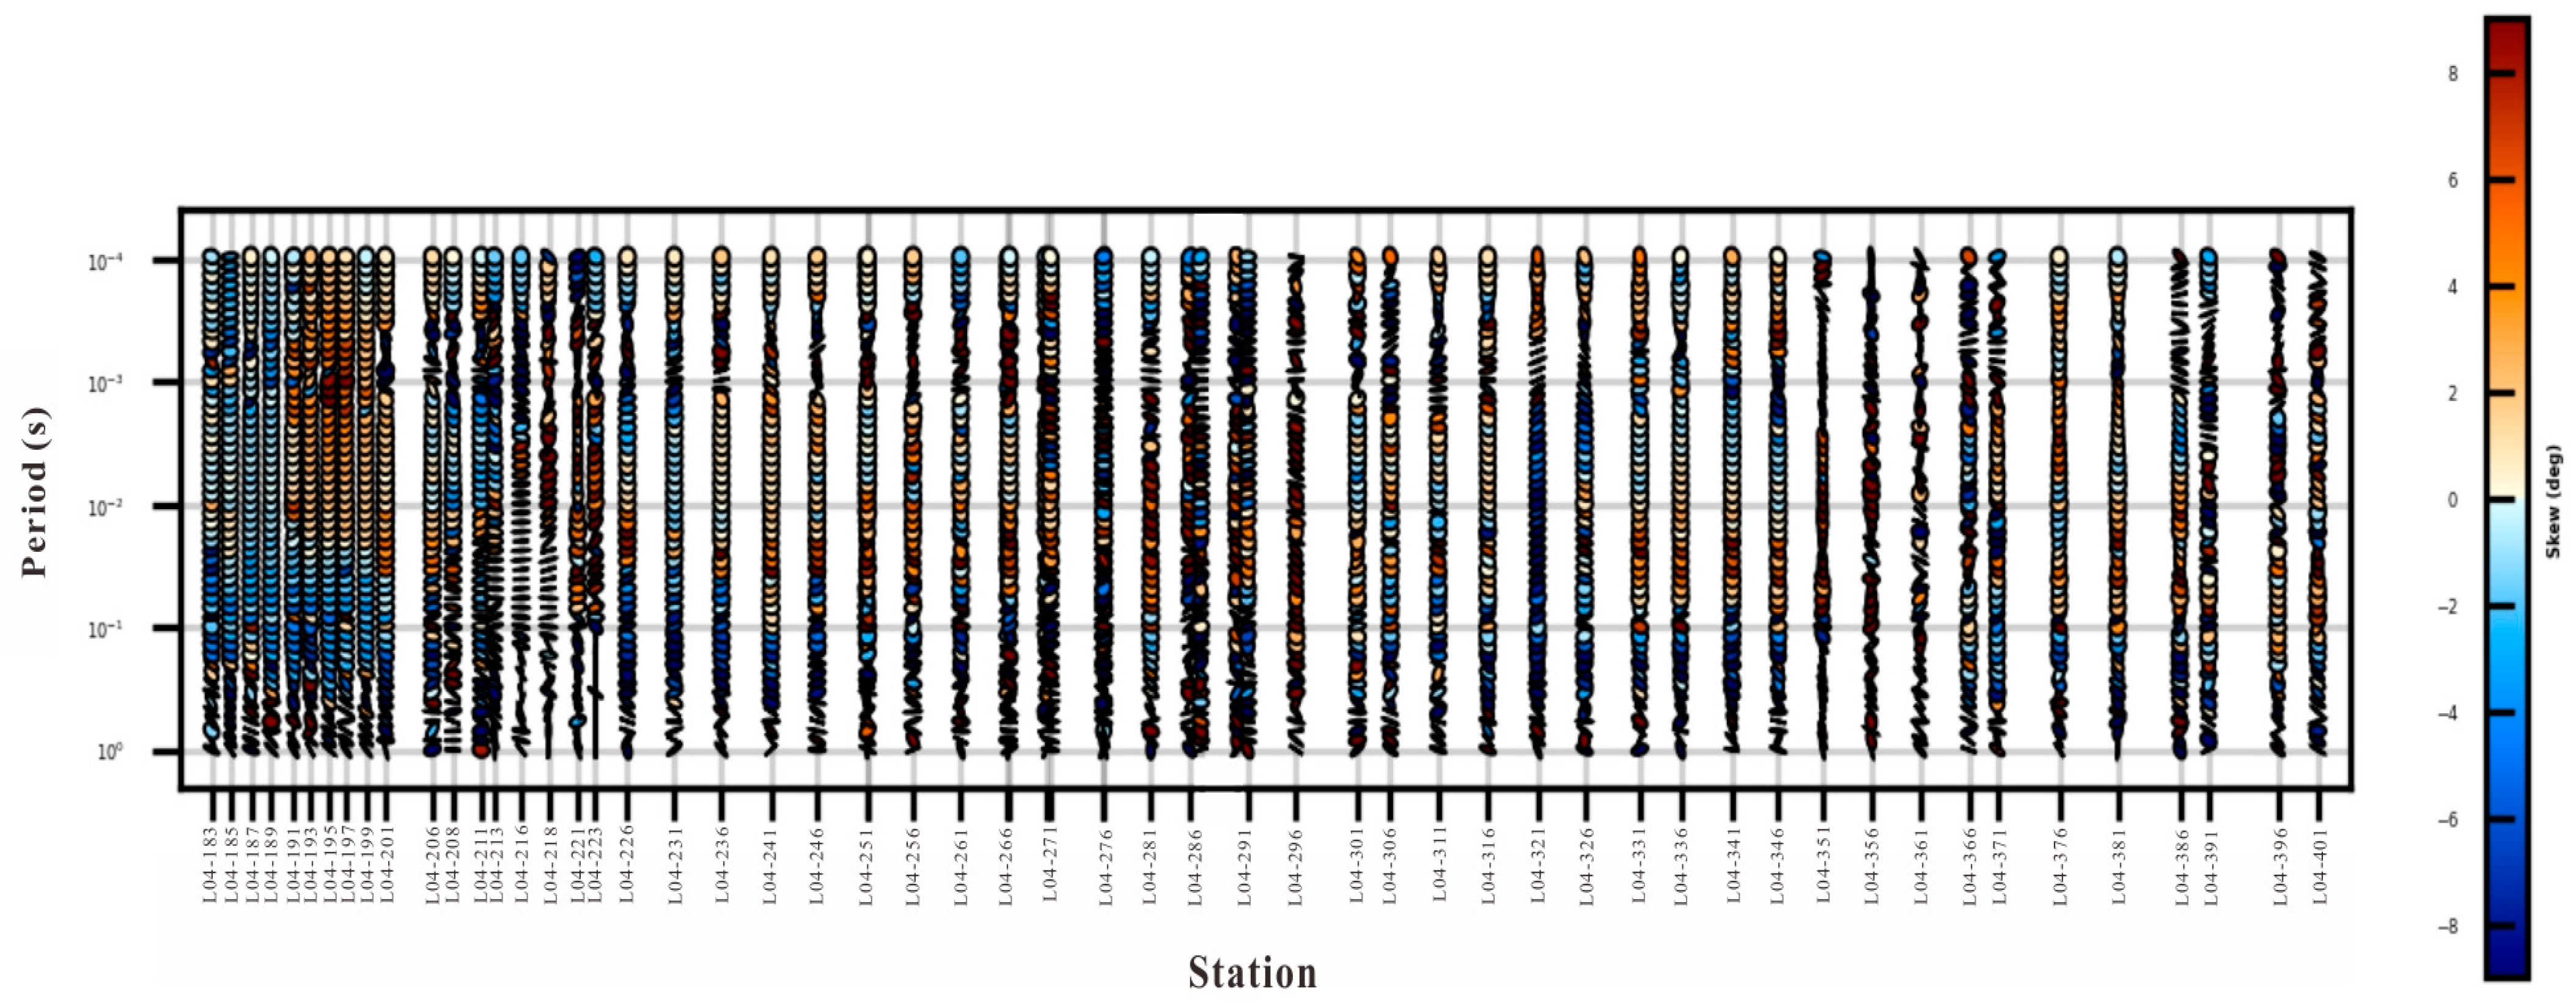
Figure 6 displays the pseudo-section of the phase tensor analysis along the L04 profile. The study primarily focused on a two-dimensional dimensionality, but also incorporated three-dimensional impacts. Almost all sounding stations experienced three-dimensional effects within a time span of around 10−3 s, as well as between 10−1 s and 1 s. The stations ranging from 208U to 223U and 351U to 371B were significantly impacted by three-dimensional impacts during most time periods. To summarize, our AMT data indicate significant β-values, and the phase tensors exhibit an oval form that is not symmetrical. Due to the prevalence of 2D and 3D structures in the study area, it is preferable to use 2D inversion for determinant data [48].
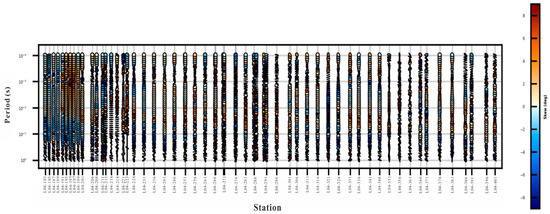
Figure 6.
Phase tensor ellipses for the AMT survey line L04 in Gucheng–Yaxi area for all periods.
5.3. Geoelectric Strike Estimation
Geoelectric estimation provides important information for the joint interpretation of geological data and AMT data. Hence, before AMT data modeling, geoelectric strike estimation is an important step. According to [49], the geoelectric strike is determined by the preferred direction of electric current flow in the subsurface, which is caused by the lateral variation in electric conductivity on Earth. The geoelectric strike also yields insights into the Earth’s strata and its profound patterns. For this study, we utilize the invariants of the impedance tensor (Z) parameter to determine the geoelectric strike of the subsurface structure [49]. The resulting strikes are depicted in Figure 7 as rose diagrams throughout various decades and all time intervals. The determined strikes had an uncertainty range of 90°, spanning from N42.5° E to N67.5° E. The strike values exhibit a declining pattern as the period increases, indicating a shift in direction with increasing depth in the studied area. The results obtained from the entire time range (10−4 s to 1s) indicate a distinct geoelectric strike path towards the northeast, which aligns well with the regional structure of the area, specifically the Maoxi fault shown in Figure 2.
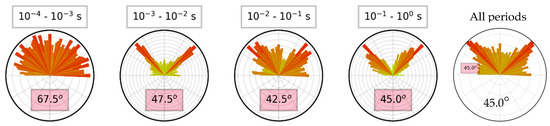
Figure 7.
Multi-period rose plot for the geoelectrical strike determined by impedance tensor invariants (Z) at decades and all periods. The reference direction for North (N) is considered as 0°, and the striking angle is measured in a positive direction clockwise.
6. Two-Dimensional Inversion
6.1. Audio-Magnetotellurics
The process of AMT inversion involves the conversion of impedance values determined at different locations and frequencies into resistivity values at various spatial locations. The project utilizes the ZondMT2D inversion program, a product of Moscow University in Russia. This software is known for its exceptional dependability in inversion, rapid processing capabilities, and impressive precision.
6.2. SSIP
The polarization inversion program used for the spread spectrum data employed the ZondRes2D inversion software, which was created by Moscow University in Russia. The software’s inventor has been engaged in a longstanding collaboration with Professor Chen Rujun from Central South University for over a decade. Throughout this partnership, they have diligently worked together to enhance the collection techniques and refine the data features pertaining to spread-spectrum-induced polarization. The use of this method in mineral exploration activities carried out in numerous regions, including Tibet, Yunnan, Guizhou, Henan, Gansu, and others, has demonstrated its dependability and precision. The outcomes of these endeavors have garnered significant recognition from collaborating entities. The input format used by ZondRes2D corresponds to the standard Res2Dinv format generated by the SipProc program. The particular details of the data content may be seen in Figure 8 The dataset encompasses many metrics, including frequency, location, elevation, resistivity, relative phase, and error, specifically pertaining to a single frequency point. The inversion input file may be generated by defining the parameters for each frequency point in the spread-spectrum-induced polarization measurement. ZondRes2D software enables the inversion of measurement data obtained at various frequencies. By comparing the inversion outcomes, it becomes possible to assess the trustworthiness of the resistivity findings and ascertain the trends in the induced polarization information. The operational procedures and settings associated with this interface exhibit a certain level of complexity.

Figure 8.
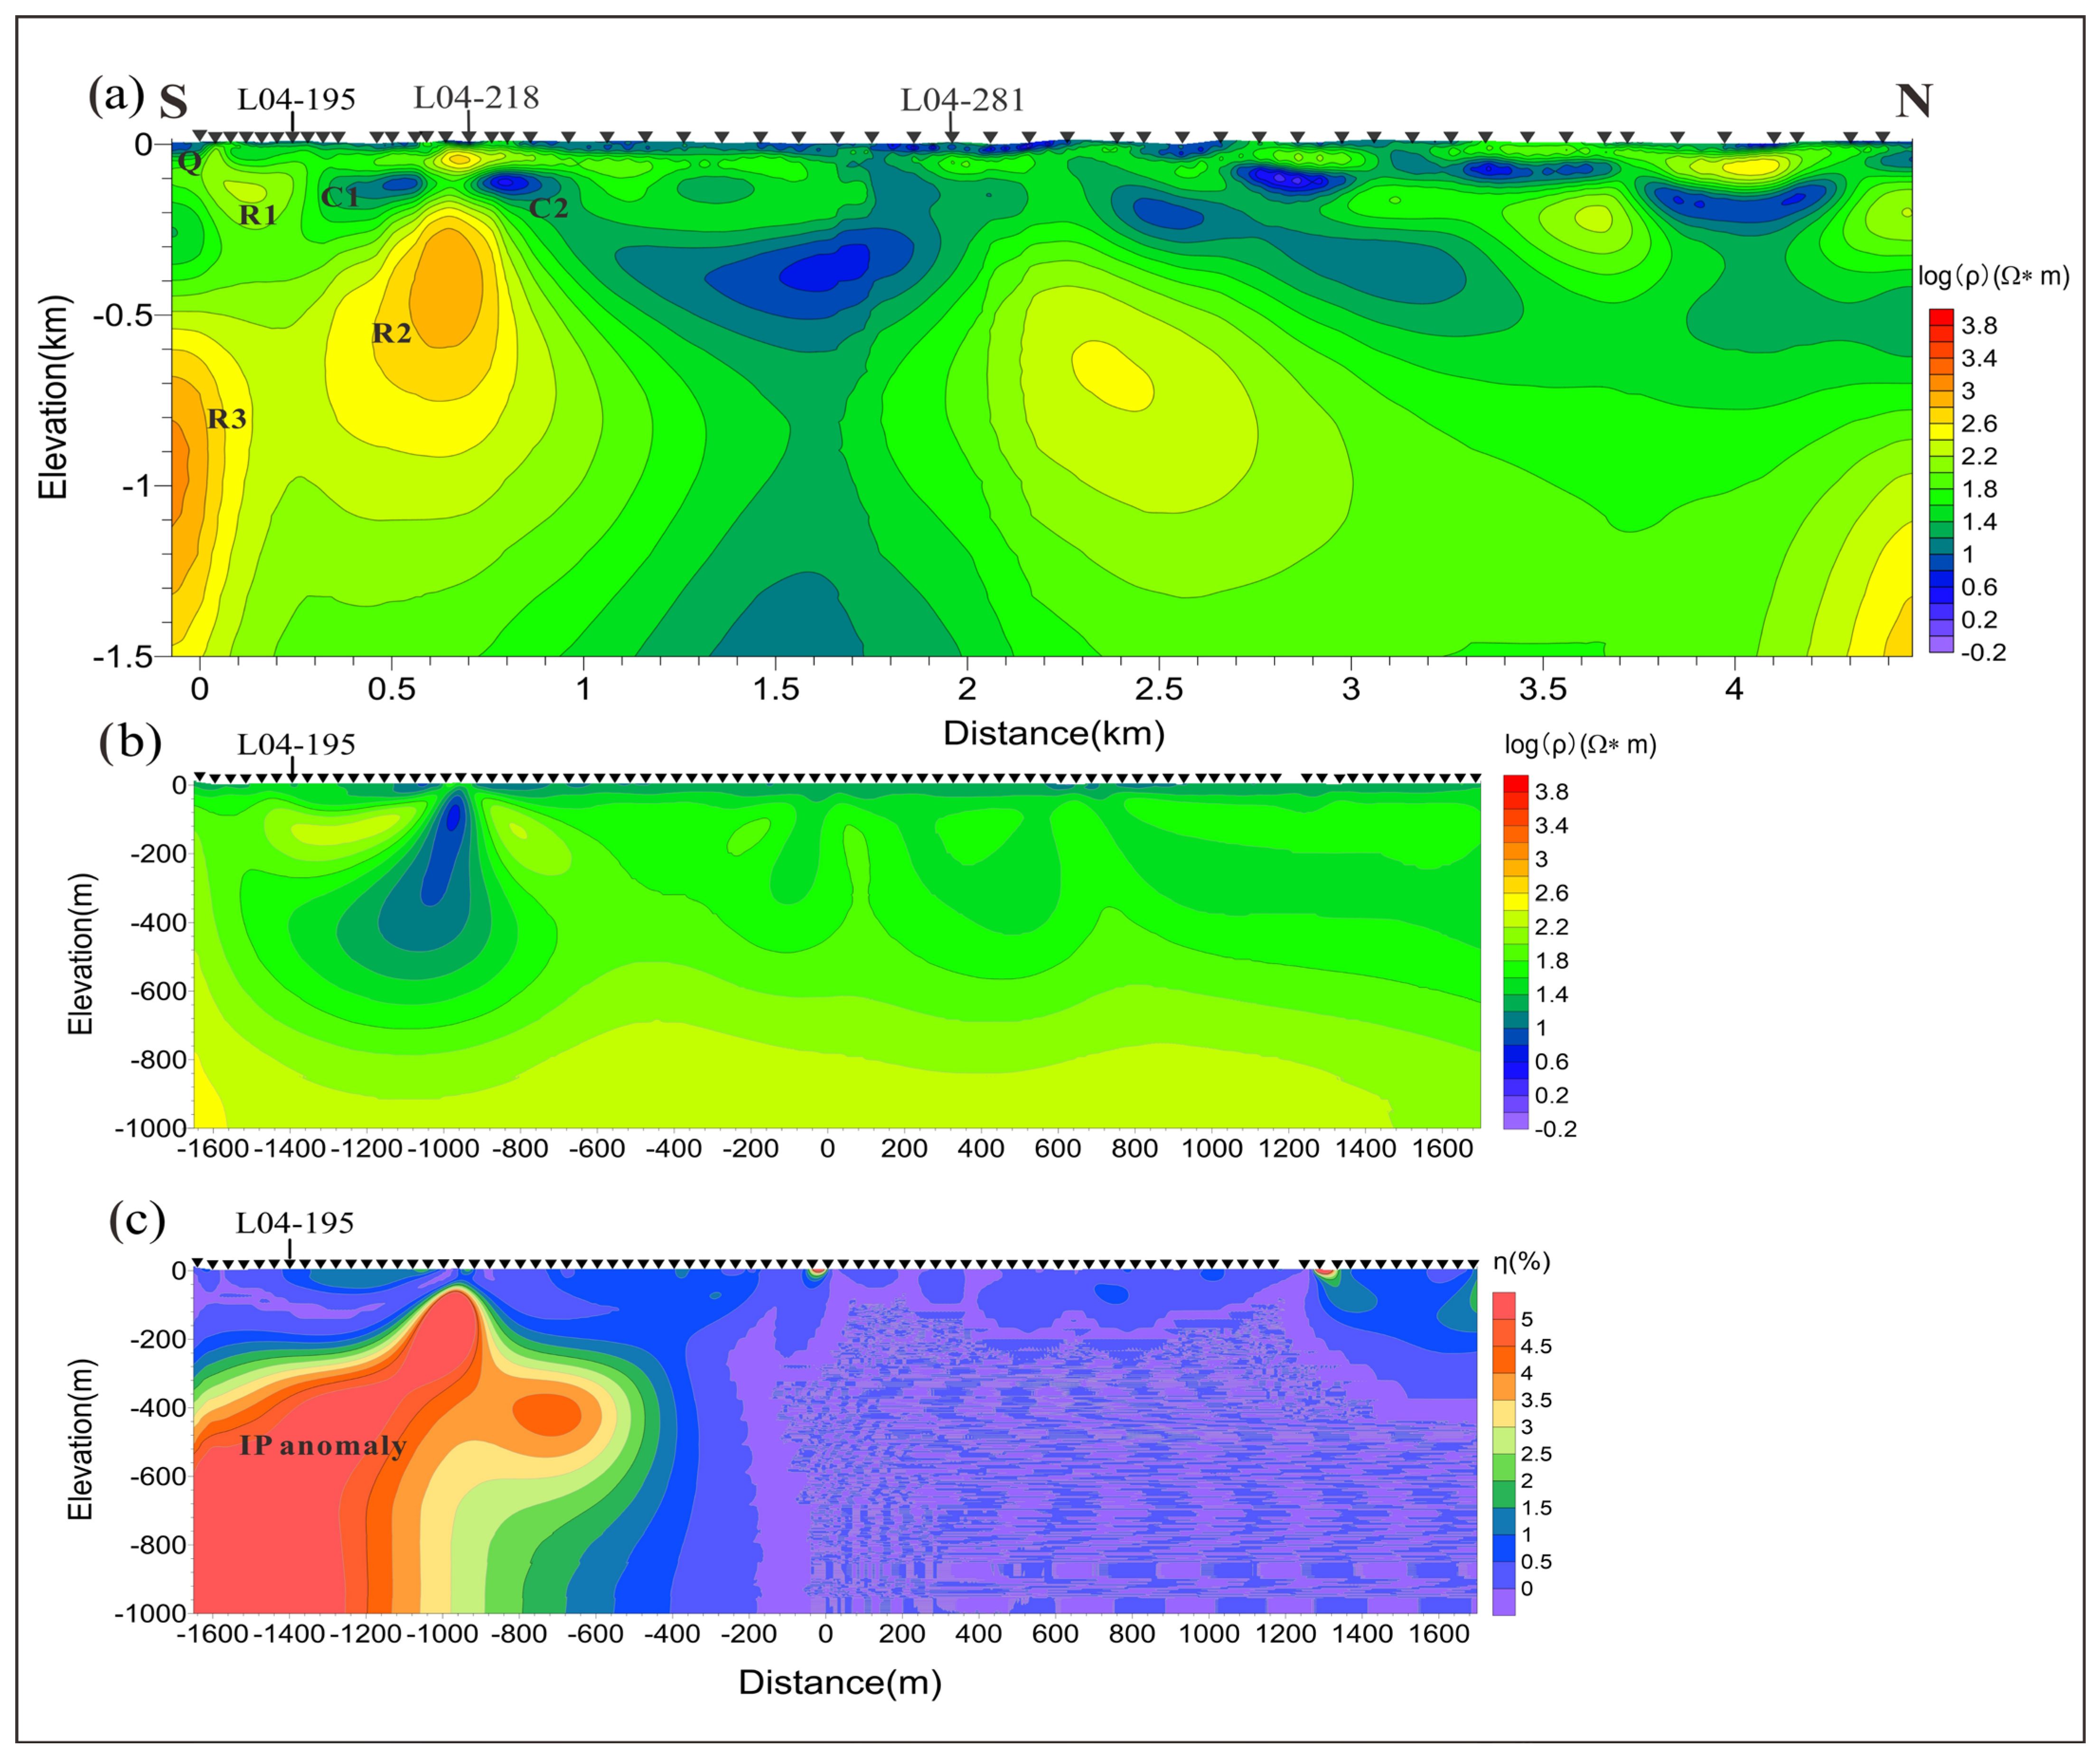
Two-dimensional inversion results for (a) AMT resistivity data, (b) SSIP resistivity data, and (c) SSIP chargeability data.
7. Results and Discussion
7.1. AMT and SSIP
Figure 8 displays the 2D resistivity models of L04, which indicate that the electrical structures of the Guchen area do not exhibit layering. The shallow part of the AMT profile (Figure 8a) shows generally low resistivity; the thickness gradually increases to the north, and the northward fault sediments in the region also gradually thicken. Combined with the regional geology, it is inferred that the shallow low-resistivity zone corresponds to an extremely thick deposit of Jurassic–Cretaceous clastic rocks and volcanic rock covers. Between the southern end of the profile and the 236-measurement point, there are two regions exhibiting notable high-resistivity abnormalities. The depth of the first anomaly is 500 m from the surface, located in the southern end reaching the bottom of the profile. The depth of the second high-resistivity anomaly is from 200 to 800 m below the 218-measurement point. A transition zone exists between the two anomalous structures with moderate-high resistivity within a depth range of roughly 300–1200 m.
The R1 resistive body is located between the coordinates L04-195 and L04-218, at an elevation of around −0.5 km (Figure 8a). The R2 resistive body is located within the marble limestone lithology, between the coordinates L04-218 and L04-281. Within this marble limestone unit, there appear to be copper and gold mineralization veins associated with the R2 resistive body. The R3 resistive body is also located within the marble limestone lithology, between coordinate L04-281 and the edge of the model, at an elevation of around −1.2 km. The R3 resistive body is likely associated with lead and zinc mineralization within the marble limestone unit. The C1 conductive body is located between the coordinates L04-195 and L04-218, at an elevation of around −0.2 km. The C2 conductive body is located between the coordinates L04-218 and L04-281, at an elevation of around −0.5 km.
The geological model in the lower part of the section provides the lithological context for the resistive (R) and conductive (C) bodies identified in the upper sections. The marble limestone unit, labeled as “M & LS”, appears to be the host rock for the R2 and R3 resistive bodies and their associated mineral deposits.
The SSIP models of line L04 (Figure 8b,c) correspond to the horizontal relative AMT profile coordinates of 0–3.4 km. The transition zone on the AMT profile between the high-resistance bodies is characterized by low resistivity and high chargeability (IP) in the SSIP profile (Figure 8c). Taking test AMT and SSIP results obtained from the nearby Chating mining area that have borehole verification as a guide, it is inferred that the L04 line section is granodiorite porphyry from the southern end to the 236-measurement point. This area is a favorable mineralization site similar to the Chating deposit, so based on comprehensive considerations, the area at a depth of around 400 m to 1200 m at the southern end of the 195-measurement point on the L04 profile (Figure 8) located west of Gucheng Lake is consistent with the target anomaly feature area. It is recommended to drill at this location to a depth of 1200 m. Hence, a borehole (ZK001) was established for verification (Figure 9), which is discussed later.
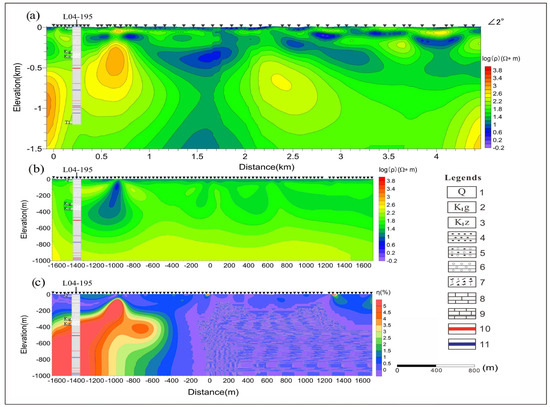
Figure 9.
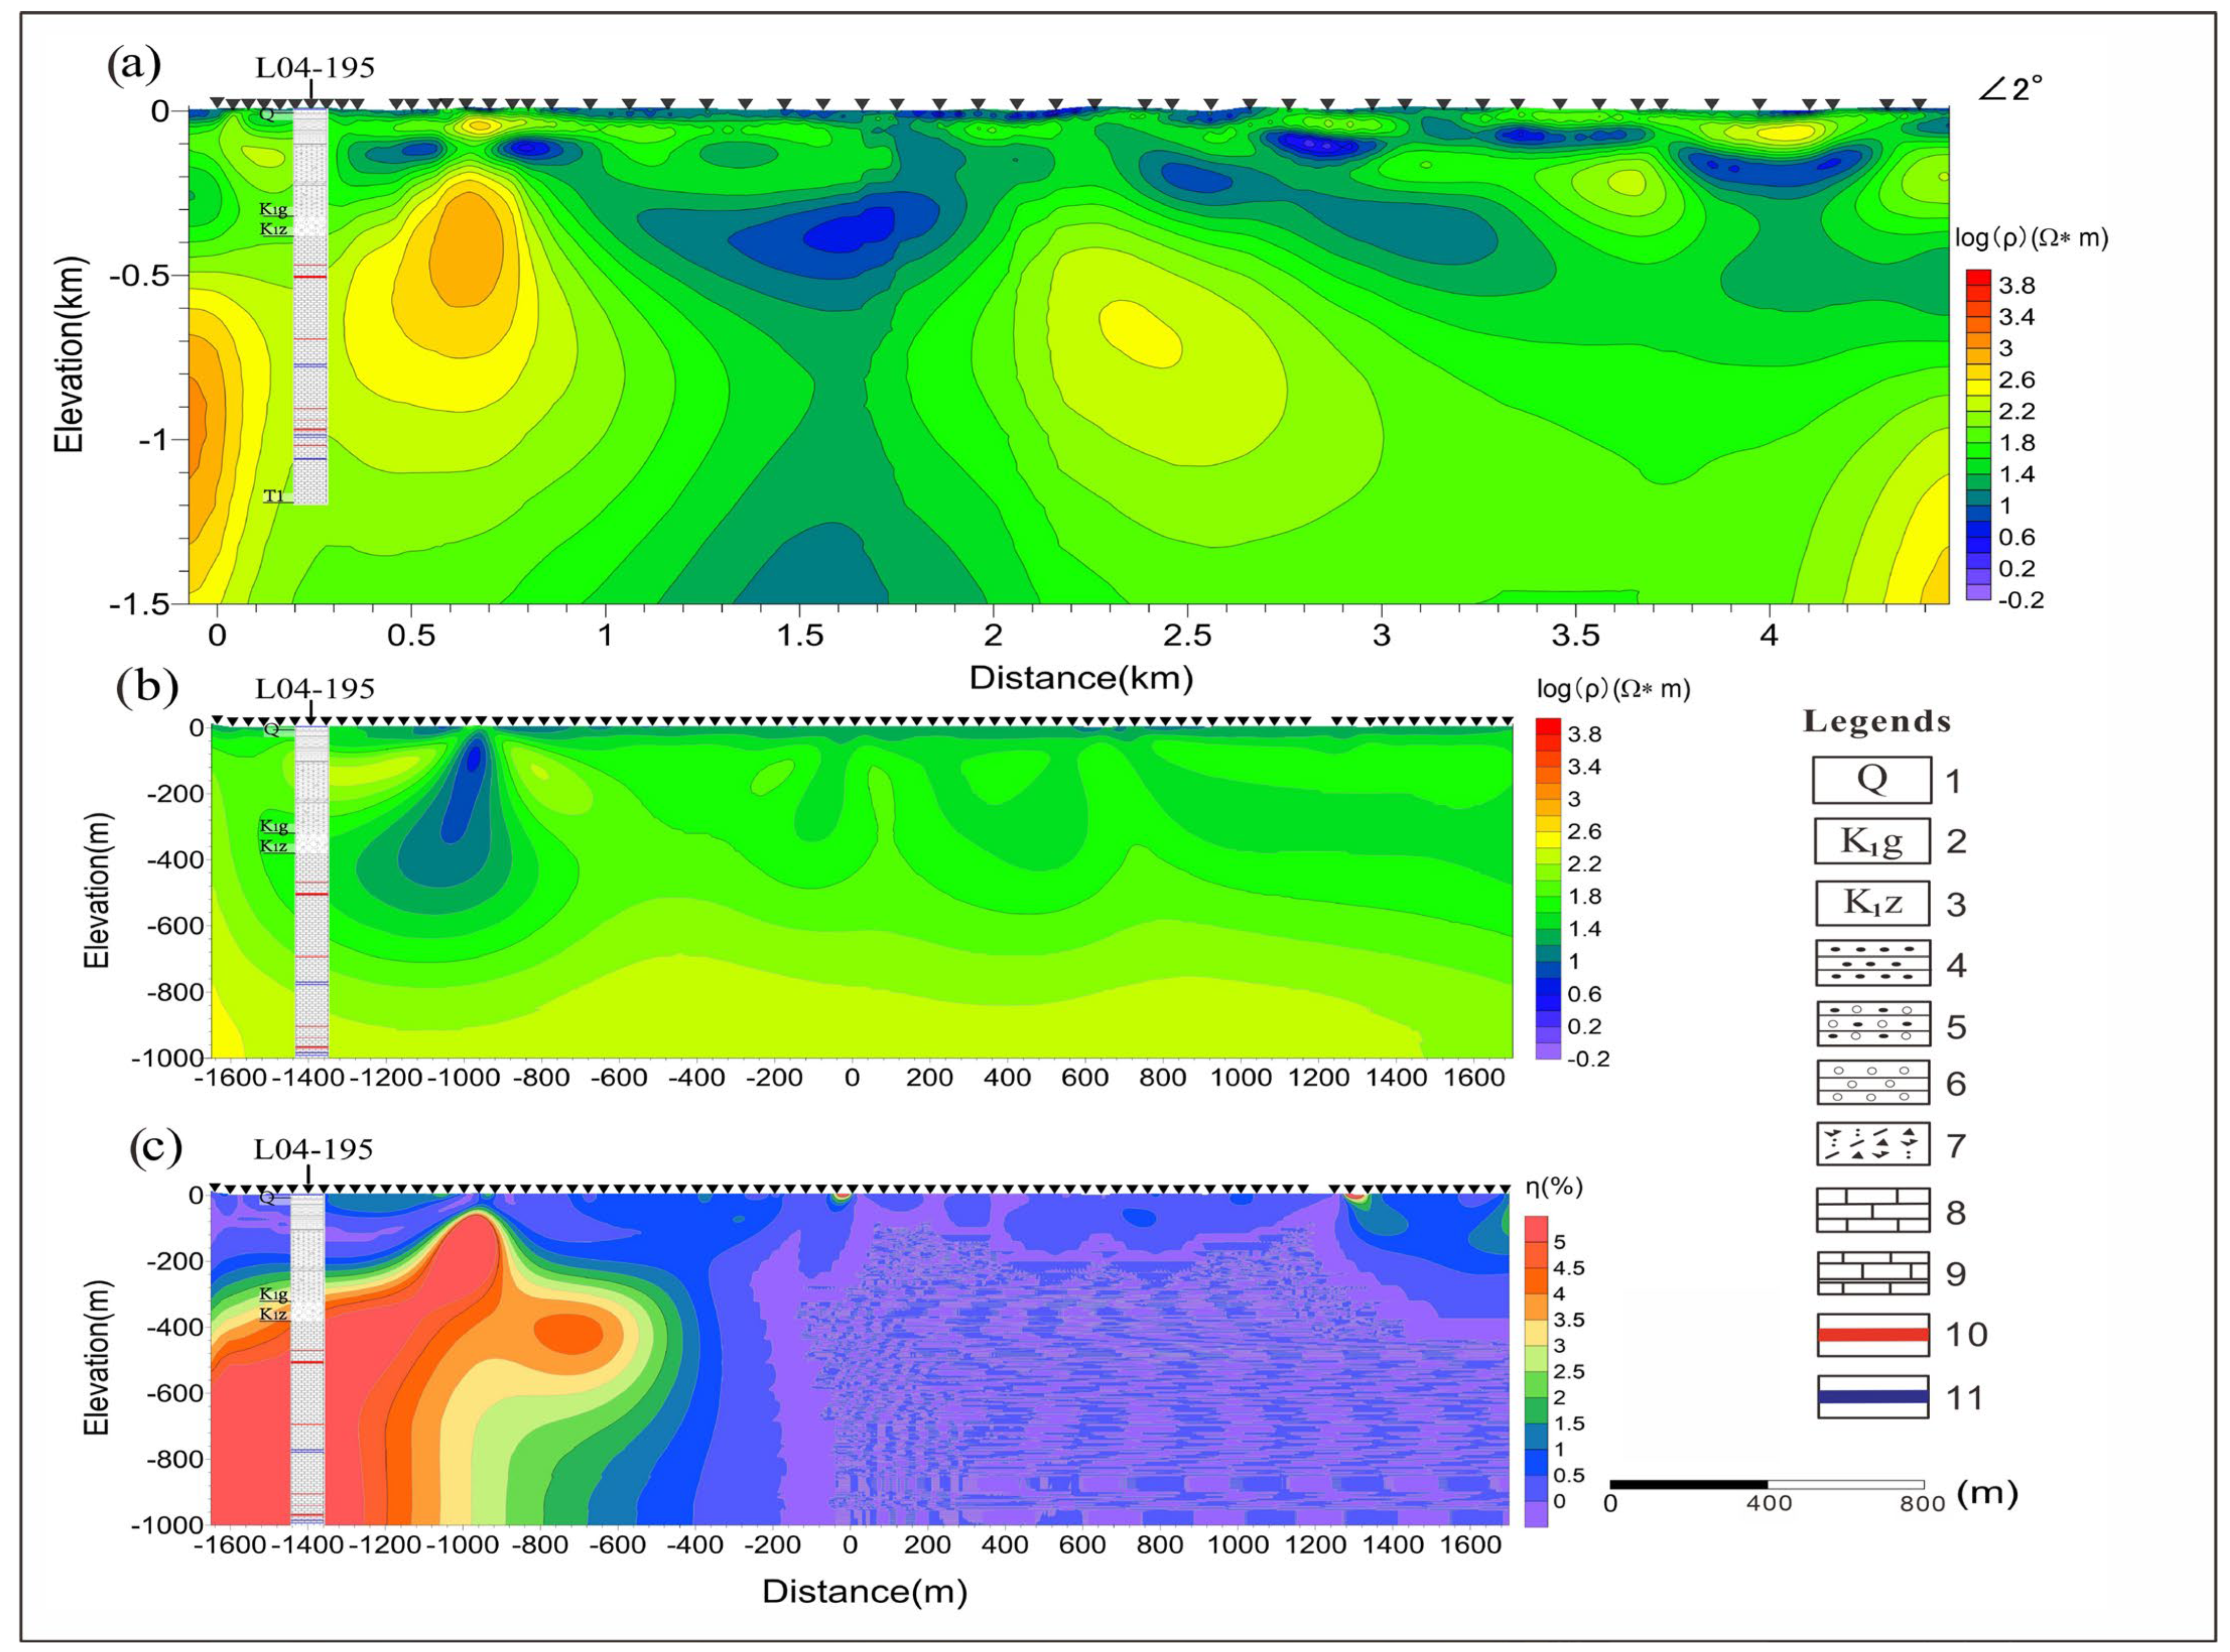
Drilling verification results of AMT resistivity (a) profile and SSIP resistivity (b) and chargeability (c) Profile. 1; Quaternary, 2; Lower Cretaceous Ganhe Formation, 3; Lower Cretaceous Zhongfencun Formation, 4; Silt stone, 5; Glutenite, 6; Conglomerate, 7; Dacite volcanic breccia, 8; Limestone, 9; Marble, 10; Pb–Zn ore body, 11; Cu–Au ore body.
Continuing to the north along the survey line, the high-resistance body at 500–1000 m in the middle of the AMT profile of line L04 does not reflect the polarization anomaly in the SSIP inversion profile, and it is inferred to be granodiorite. There is an obvious low-resistance zone near the 281-measurement point, which extends to the south in the deep part and has a large cutting depth, which is inferred to be the location of the regional fault. Based on the regional tectonic data, the low-resistivity areas that spread toward the north are speculated to be Lower Triassic carbonate rocks and faults. Meanwhile, the deeper moderate- to high-resistivity section from the 281-measurement point toward the north is inferred to be granodiorite porphyry.
Based on the observed morphology of the high-resistivity anomaly, it can be deduced that the geological structure of the L04-line mineralization potential area and the test section at Chating mining area are characterized by a northward intrusion of the southern granodiorite porphyry. This intrusion process may lead to alterations, metasomatism, and mineralization within the area. Porphyry deposits exhibit the presence of fine-grained disseminated pyrite and fine vein pyrite, which have the potential to induce notable induced polarization (IP) anomalies.
7.2. Borehole Verification
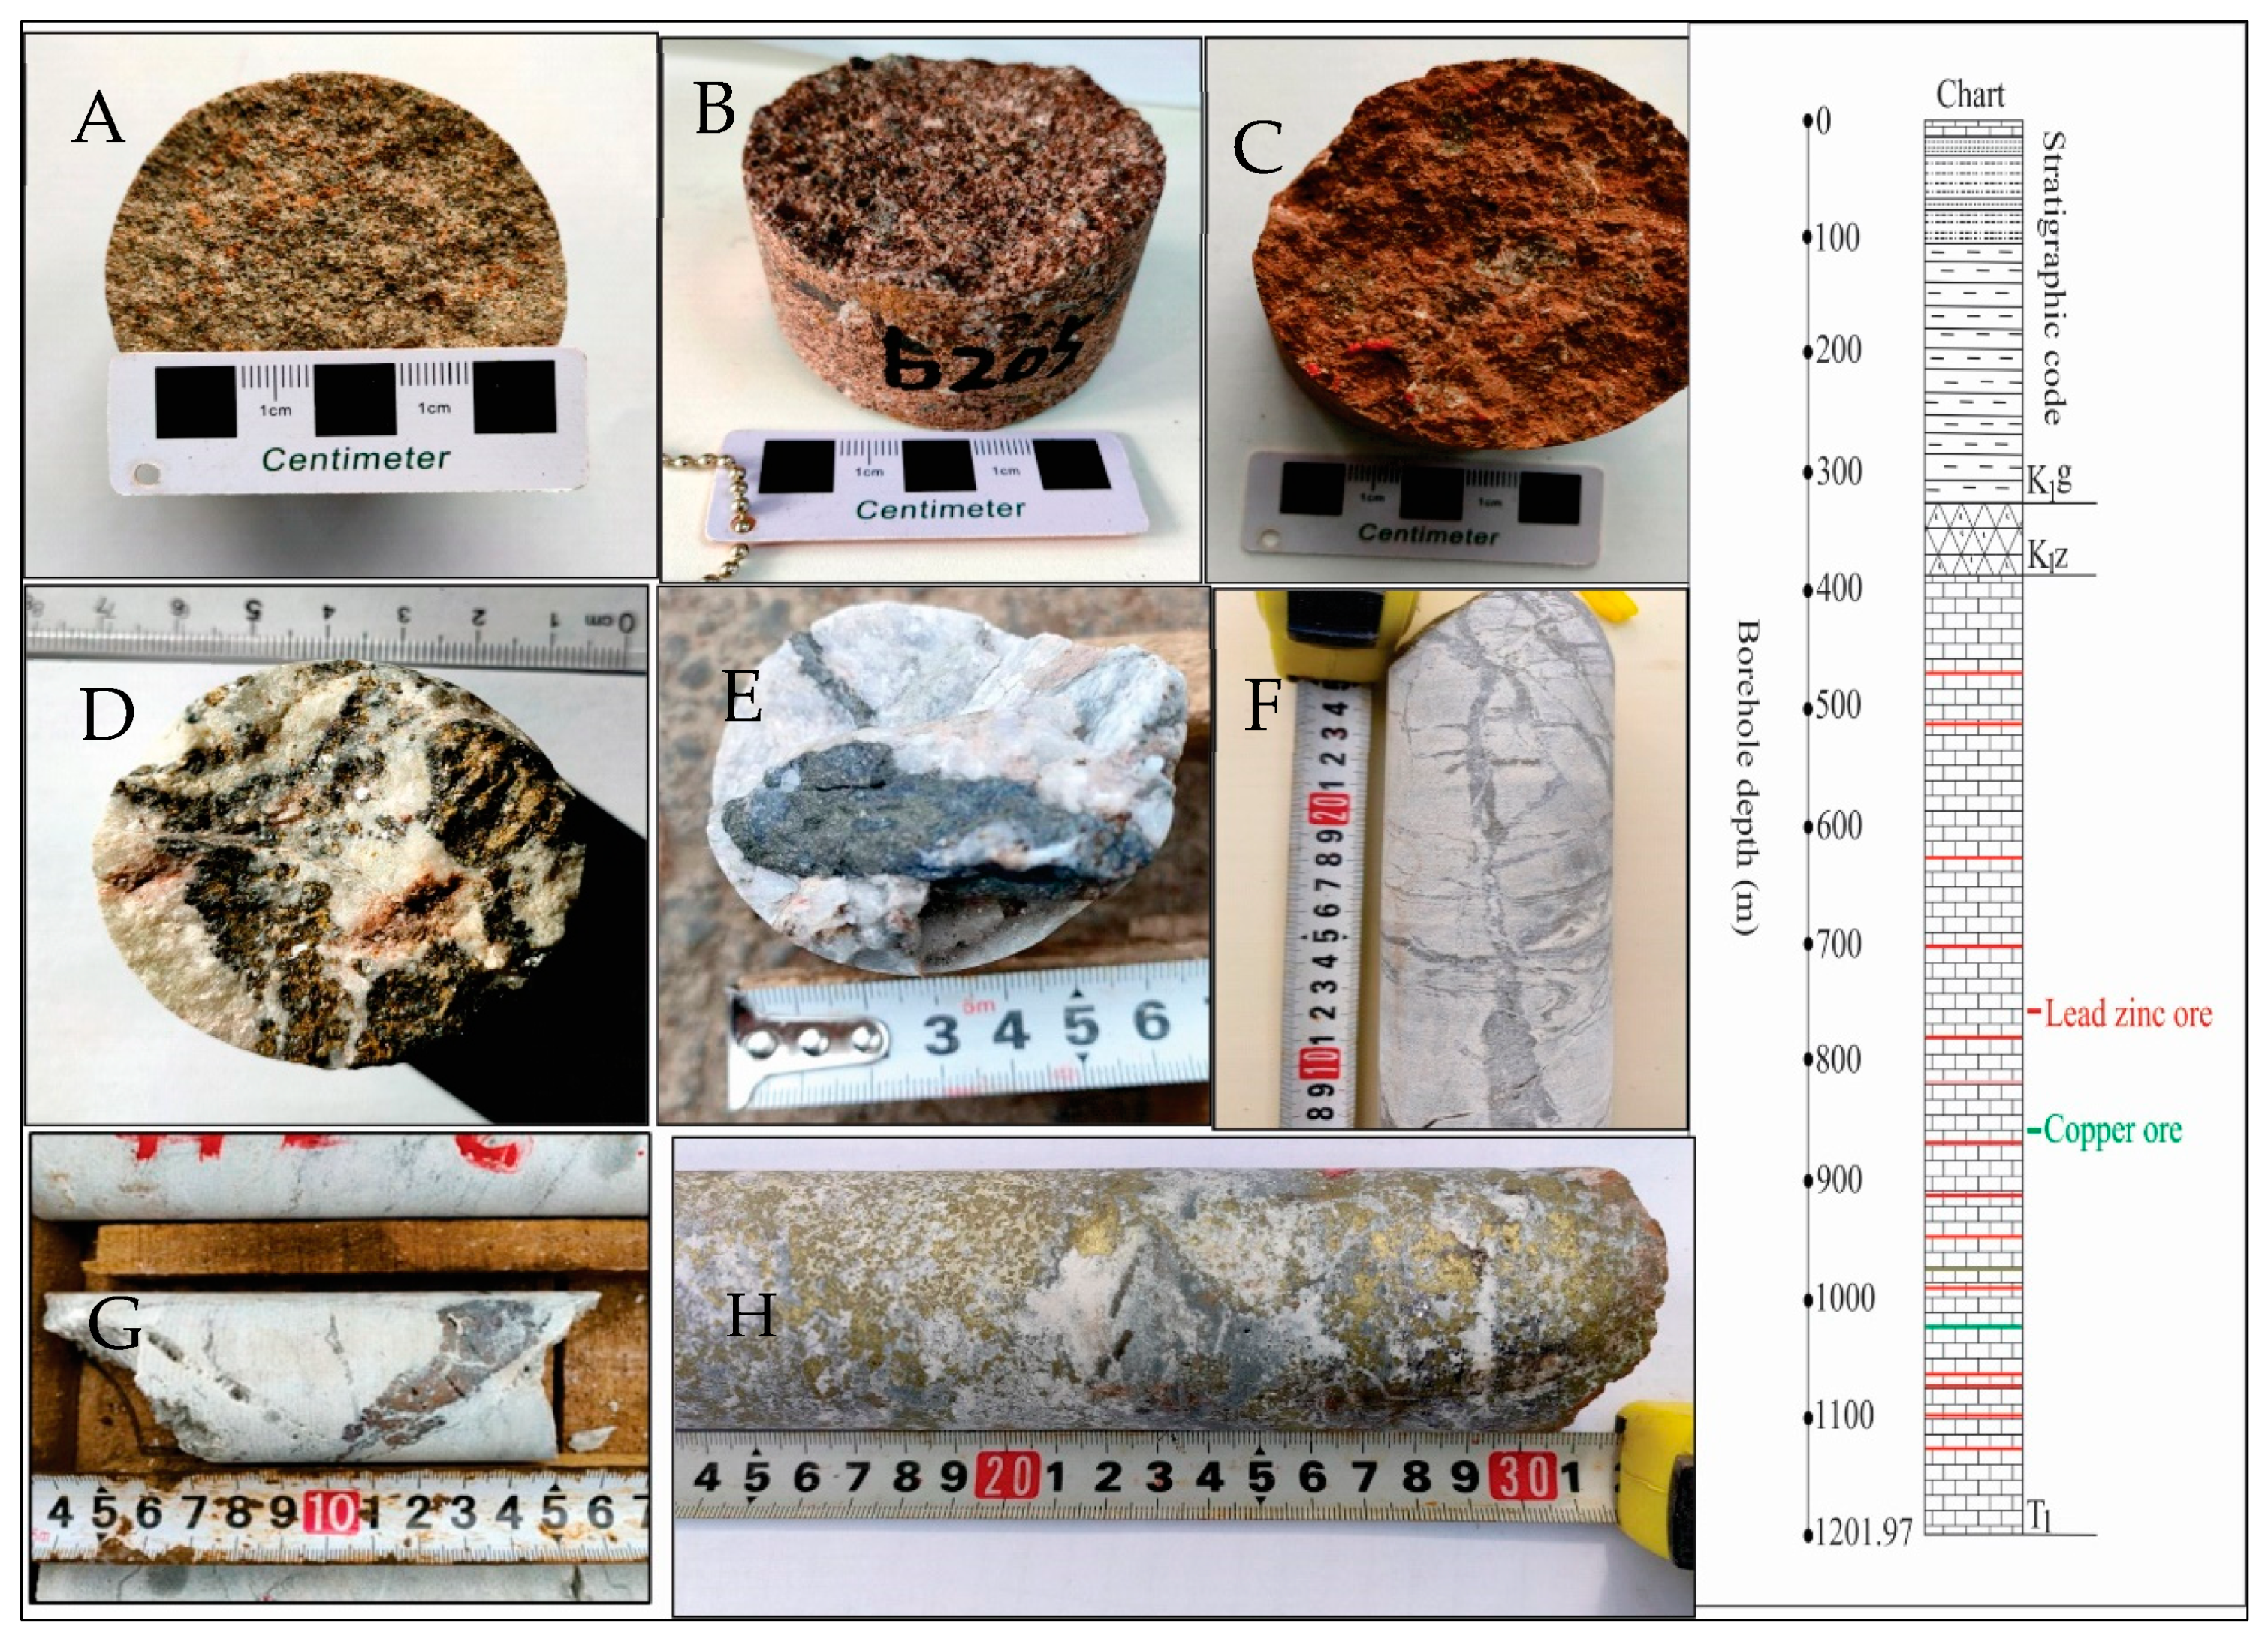
The stratigraphic column obtained from drill hole ZK001 is shown in (Figure 10) to a maximum depth of 1201.97 m. Through verification, a thick mineralized dolomite zone was revealed, and 13 polymetallic veins containing copper, lead, zinc, gold, and silver were newly discovered, with individual vein thickness ranging from approximately 0.15 m to 3.4 m and a cumulative thickness of 17.03 m. Laboratory analysis confirmed the presence of one lead–zinc ore body with a thickness of 3.40m and average grades of Zn 3.13% and Pb 0.58%; one lead–zinc–gold polymetallic ore body with a thickness of 1.25 m and grades of Zn 7.45%, Pb 8.14%, Ag 41.52 g/t, Au 1.29 g/t, and Cu 0.16%; one lead–polymetallic ore body with a thickness of 1.20 m and grades of Pb 0.83%, Zn 0.87%, and Au 0.69 g/t; one zinc ore body with a thickness of 0.55 m and a grade of Zn 1.75%; one copper–gold–lead–zinc ore body with a thickness of 1.70 m and grades of Cu 3.53%, Zn 2.03%, Pb 2.45%, Ag 114 g/t, and Au 1.60 g/t; four low-grade gold ore bodies; one low-grade silver ore body; and two low-grade zinc ore bodies.
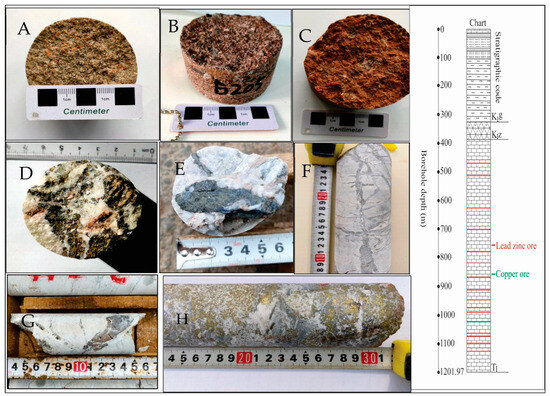
Figure 10.
Drill core samples from borehole ZK001 on line 04, (A); 67.72 m coarse- and medium- grained lithic quartz sandstone, (B); 204.42 m gravelly coarse-grained lithic sandstone, (C); 362.18 m altered rhyolite tuff, (D); Massive sphalerite galena at 510 m, (E); Veined pyrite, sphalerite, and galena at 626 m, (F); Vein-like pyrite sphalerite ore at 976 m, (G); Massive sphalerite ore at 982 m, (H); Massive chalcopyrite galena sphalerite ore at 1025 m.
The main lithology in the order from the surface is as follows: Quaternary layer with a thickness of about 100 m, K1g with 200 m thickness, K1z with a thickness of about 100 m, and from 400 m to 1201.97 m is marble from the Triassic (T1). Copper, lead, and zinc ores mainly occur interspaced in the marble layer between 400 m and 1201.97 m depth. Core samples from the drill hole are presented in Figure 10.
8. Conclusions
This article presented new AMT and SSIP data from a potential Cu–polymetallic mineralization in the Gucheng–Yaxi area of Gaochun District, Jiangsu, China. 2D interpretation was facilitated by independently inverting the two data sets, which provided the most favorable mineralization location for a drill hole for verification. The location of proven Cu–polymetallic mineralization on the AMT profile occurred in the transition zone between two resistivity structures attributed to unmineralized marble. On the SSIP profile, the mineralized zone exhibited the highest chargeability that was distinct from the sounding area. The ore-bearing rock is mainly marble rock mass in which mineralization occurs interspaced at various depths. Several low-resistivity zones with weak-chargeability anomalies were revealed and inferred to be caused by faults that are thought to have played a vital role during the mineralization process. In summary, this project, using new methods and technologies, achieved a significant breakthrough in the exploration of deeply concealed ore deposits in high-interference areas. It confirmed that the combination of these exploration techniques can identify ore and non-ore bodies at great depths in high-interference areas, providing an advanced combination of mineral exploration technologies for Jiangsu’s new round of strategic breakthroughs in mineral exploration. This study demonstrated the successful application of the electrical SSIP method and the electromagnetic AMT method in detecting a new polymetallic deposit under a thick cover in an area with high cultural noise.
Author Contributions
F.U. conceptualized and designed the study, collected and analyzed the data, and wrote the manuscript. X.Z. contributed to the study design and data analysis and critically revised the manuscript for important intellectual content. X.Z. and R.C. provided technical support and expertise in the data analysis and contributed to the interpretation of the results. L.Y., H.Y., H.H., S.C. and Q.W. contributed to the data collection process. All authors have read and agreed to the published version of the manuscript.
Funding
Jiangsu Province Natural Resources Special Fund Project (No. Sucai-zihuan 2023-30); Basic Science Center Project of the National Natural Science Foundation of China, Grant Number 72088101.
Data Availability Statement
The data generated in this study may be obtained on request by contacting the corresponding author.
Conflicts of Interest
The authors declare no conflicts of interest.
References
- Yan, J.; Liu, X.; Wang, S.; Xie, J.; Liu, J. Metallogenic type controlled by magma source and tectonic regime: Geochemical comparisons of Mesozoic magmatism between the Middle–Lower Yangtze River Belt and the Dabie Orogen, eastern China. Ore Geol. Rev. 2021, 133, 104095. [Google Scholar] [CrossRef]
- Calvo, G.; Valero, A. Strategic mineral resources: Availability and future estimations for the renewable energy sector. Environ. Dev. 2022, 41, 100640. [Google Scholar] [CrossRef]
- Nate, S.; Bilan, Y.; Kurylo, M.; Lyashenko, O.; Napieralski, P.; Kharlamova, G. Mineral policy within the framework of limited critical resources and a green energy transition. Energies 2021, 14, 2688. [Google Scholar] [CrossRef]
- Sovacool, B.K.; Ali, S.H.; Bazilian, M.; Radley, B.; Nemery, B.; Okatz, J.; Mulvaney, D. Sustainable minerals and metals for a low-carbon future. Science 2020, 367, 30–33. [Google Scholar] [CrossRef] [PubMed]
- Ali, S.H.; Giurco, D.; Arndt, N.; Nickless, E.; Brown, G.; Demetriades, A.; Durrheim, R.; Enriquez, M.A.; Kinnaird, J.; Littleboy, A. Mineral supply for sustainable development requires resource governance. Nature 2017, 543, 367–372. [Google Scholar] [CrossRef]
- Fan, E.; Li, L.; Wang, Z.; Lin, J.; Huang, Y.; Yao, Y.; Chen, R.; Wu, F. Sustainable recycling technology for Li-ion batteries and beyond: Challenges and future prospects. Chem. Rev. 2020, 120, 7020–7063. [Google Scholar] [CrossRef]
- Nickless, E. Resourcing future generations: A contribution by the earth science community. Nat. Resour. Res. 2018, 27, 143–158. [Google Scholar] [CrossRef]
- Mikhailov, A.G.; Vashlaev, I.I. The Technology of Upward Capillary Formation of Waste for Creating a Deposit before Land Reclamation. Adv. Environ. Eng. Res. 2022, 3, 15. [Google Scholar] [CrossRef]
- Embeng, S.B.N.; Meying, A.; Ndougsa-Mbarga, T.; Moreira, C.A.; Amougou, O.U.O. Delineation and Quasi-3D Modeling of Gold Mineralization Using Self-Potential (SP), Electrical Resistivity Tomography (ERT), and Induced Polarization (IP) Methods in Yassa Village, Adamawa, Cameroon: A Case Study. Pure Appl. Geophys. 2022, 179, 795–815. [Google Scholar] [CrossRef]
- Cortês, A.R.P.; Moreira, C.A.; Paes, R.A.S.; Veloso, D.I.K. Geophysical and metalogenetic modelling of the copper occurrence in Camaquã Sedimentary Basin, Brazilian Southern. Pure Appl. Geophys. 2019, 176, 4955–4968. [Google Scholar] [CrossRef]
- Parasnis, D.S. Principles of Applied Geophysics; Springer Science & Business Media: Berlin/Heidelberg, Germany, 2012. [Google Scholar]
- Guo, Z.; Xue, G.; Liu, J.; Wu, X. Electromagnetic methods for mineral exploration in China: A review. Ore Geol. Rev. 2020, 118, 103357. [Google Scholar] [CrossRef]
- Smith, R. Electromagnetic induction methods in mining geophysics from 2008 to 2012. Surv. Geophys. 2014, 35, 123–156. [Google Scholar] [CrossRef]
- Xi, X.; Yang, H.; He, L.; Chen, R. Chromite mapping using induced polarization method based on spread spectrum technology. In Proceedings of the Symposium on the Application of Geophysics to Engineering and Environmental Problems 2013, Denver, CO, USA, 17–21 March 2013; pp. 13–19. [Google Scholar]
- He, L.; Chen, L.; Dorji; Xi, X.; Zhao, X.; Chen, R.; Yao, H. Mapping the geothermal system using AMT and MT in the Mapamyum (QP) field, Lake Manasarovar, Southwestern Tibet. Energies 2016, 9, 855. [Google Scholar] [CrossRef]
- Lv, H.; Xu, L.; Yang, B.; Su, P.; Xu, H.; Wang, H.; Yao, C.; Su, P. Mineralization Based on CSAMT and SIP Sounding Data: A Case Study on the Hadamengou Gold Deposit in Inner Mongolia. Minerals 2022, 12, 1404. [Google Scholar] [CrossRef]
- Zonge, K.L.; Hughes, L.J. Controlled Source Audio-Frequency Magnetotellurics. 1991. Available online: https://pubs.geoscienceworld.org/ (accessed on 24 January 2024).
- Revil, A.; Vaudelet, P.; Su, Z.; Chen, R. Induced polarization as a tool to assess mineral deposits: A review. Minerals 2022, 12, 571. [Google Scholar] [CrossRef]
- He, L.; Chen, L.; Dorji; He, Z.; Wang, X.; Xiao, B.; Xu, L.; Zhao, X.; Xi, X.; Yao, H. Mapping chromite deposits with audio magnetotellurics in the Luobusa ophiolite of southern Tibet. Geophysics 2018, 83, B47–B57. [Google Scholar] [CrossRef]
- Yan, L. Advancements in controlled source electromagnetic methods for prospecting unconventional hydrocarbon resources in China. Surv. Geophys. 2023, 45, 239–276. [Google Scholar] [CrossRef]
- Xue, G.-Q. The development of near-source electromagnetic methods in China. J. Environ. Eng. Geophys. 2018, 23, 115–124. [Google Scholar] [CrossRef]
- Ahmed, I.; Liu, H.; Chen, R.; Ahmad, J.; Shah, S.A.; Fahad, S.; Rahim, O.A.; Ullah, F.; Rui, L. Geothermal Resource Exploration in Reshi Town by Integrated Geophysical Methods. Energies 2024, 17, 856. [Google Scholar] [CrossRef]
- Liu, W.; Chen, R.; Cai, H.; Luo, W. Robust statistical methods for impulse noise suppressing of spread spectrum induced polarization data, with application to a mine site, Gansu province, China. J. Appl. Geophys. 2016, 135, 397–407. [Google Scholar] [CrossRef]
- XiaoChun, X.; XinYue, X.; QiaoQin, X.; ZhongYang, F.; ShiLong, Q.; Zujun, X. Geological and geochemical characteristics and genesis of the Chating copper-gold deposit in Xuancheng City, Anhui Province. Acta Petrol. Sin. 2019, 35, 3659–3676. [Google Scholar] [CrossRef]
- Xu, X.-y.; Xu, X.-c.; Xie, Q.-q.; Fu, Z.-y.; Lu, S.-m.; Zhao, L.-l. Geological features and ore-forming mechanisms of the Chating Cu–Au deposit: A rare case of porphyry deposit in the Middle–Lower Yangtze River metallogenic belt. Ore Geol. Rev. 2022, 144, 104860. [Google Scholar] [CrossRef]
- Qi, H.; Lu, S.; Yang, X.; Zhao, L.; Zhou, Y.; Deng, J.; Li, J. Genesis of Cretaceous igneous rocks and its related large scale porphyry Cu-Au mineralization in Chating, the Middle-Lower Yangtze River Metallogenic Belt: The geochemical constrains. Ore Geol. Rev. 2020, 127, 103793. [Google Scholar] [CrossRef]
- Lu, S.; Yang, Q.; Qi, H.; Li, J.; Qian, S.; Zhao, L. A geological-geophysical model for the Chating copper-gold deposit, Xuancheng, Anhui Province. Acta Geol. Sin.—Engl. Ed. 2019, 93, 243–244. [Google Scholar] [CrossRef]
- Xiao, Q.; Zhou, T.; Hollings, P.; Wang, S.; Liu, J.; White, N.; Fu, B.; Yuan, F. The role of porphyry-related skarns in the Chating porphyry copper and gold deposit, eastern China. Ore Geol. Rev. 2021, 133, 104096. [Google Scholar] [CrossRef]
- Tikhonov, A. On determining electrical characteristics of the deep layers of the Earth’s crust. Dokl. Akad. Nauk. SSSR 1950, 73, 295–297. [Google Scholar]
- Cagniard, L. Basic theory of the magneto-telluric method of geophysical prospecting. Geophysics 1953, 18, 605–635. [Google Scholar] [CrossRef]
- Cantwell, T. Detection and Analysis of Low Frequency Magnetotelluric Signals. Ph.D. Thesis, Massachusetts Institute of Technology, Cambridge, MA, USA, 1960. [Google Scholar]
- Cantwell, T.; Madden, T. Preliminary report on crustal magnetotelluric measurements. J. Geophys. Res. 1960, 65, 4202–4205. [Google Scholar] [CrossRef]
- Vozoff, K. The magnetotelluric method in the exploration of sedimentary basins. Geophysics 1972, 37, 98–141. [Google Scholar] [CrossRef]
- Price, A. The theory of magnetotelluric methods when the source field is considered. J. Geophys. Res. 1962, 67, 1907–1918. [Google Scholar] [CrossRef]
- Chave, A.D.; Jones, A.G. The Magnetotelluric Method: Theory and Practice; Cambridge University Press: Cambridge, UK, 2012. [Google Scholar]
- Nabighian, M.N. Electromagnetic Methods in Applied Geophysics: Voume 1, Theory; Society of Exploration Geophysicists: Houston, TX, USA, 1988. [Google Scholar]
- GSAI. Internet of Things Broadband Magnetotelluric Instrument GSEM-W10. Available online: https://www.gs-ait.com/en/ (accessed on 24 January 2024).
- Liu, W.; Chen, R.; Cai, H.; Luo, W.; Revil, A. Correlation analysis for spread-spectrum induced-polarization signal processing in electromagnetically noisy environments. Geophysics 2017, 82, E243–E256. [Google Scholar] [CrossRef]
- Chun, S.-h.; Chen, R.-j.; Geng, M.-h. Review of the pseudo-random m sequence and its application in electrical prospecting of exploration geophysics. Prog. Geophys. 2014, 29, 439–446. [Google Scholar]
- He, S.; Guan, J.; Chen, D.; Xu, H.; Wang, Y. A fusion approach for suppression of environmental noise in spread spectrum induced polarization data. Pure Appl. Geophys. 2021, 178, 3619–3628. [Google Scholar] [CrossRef]
- GSAI Geophysics. Electromagnetic Data Processing Software GSEM-Pros; GSAI: Changsha, China, 2024. [Google Scholar]
- Kirkby, A.L.; Zhang, F.; Peacock, J.; Hassan, R.; Duan, J. The MTPy software package for magnetotelluric data analysis and visualisation. J. Open Source Softw. 2019, 4, 1358. [Google Scholar] [CrossRef]
- Krieger, L.; Peacock, J.R. MTpy: A Python toolbox for magnetotellurics. Comput. Geosci. 2014, 72, 167–175. [Google Scholar] [CrossRef]
- Caldwell, T.G.; Bibby, H.M.; Brown, C. The magnetotelluric phase tensor. Geophys. J. Int. 2004, 158, 457–469. [Google Scholar] [CrossRef]
- Booker, J.R. The magnetotelluric phase tensor: A critical review. Surv. Geophys. 2014, 35, 7–40. [Google Scholar] [CrossRef]
- Ren, W.; Ren, Z.; Xue, G.; Chen, W.; Zhao, P.; Liu, J. Three-dimensional audio magnetotelluric imaging of the Yangyi geothermal field in Tibet, China. J. Appl. Geophys. 2023, 211, 104966. [Google Scholar] [CrossRef]
- Pedersen, L.B.; Engels, M. Routine 2D inversion of magnetotelluric data using the determinant of the impedance tensor. Geophysics 2005, 70, G33–G41. [Google Scholar] [CrossRef]
- Niasari, S.W. A short introduction to geological strike and geo-electrical strike. AIP Conf. Proc. 2016, 1755, 100002. [Google Scholar]
- Weaver, J.T.; Agarwal, A.K.; Lilley, F. Characterization of the magnetotelluric tensor in terms of its invariants. Geophys. J. Int. 2000, 141, 321–336. [Google Scholar] [CrossRef]


Disclaimer/Publisher’s Note: The statements, opinions and data contained in all publications are solely those of the individual author(s) and contributor(s) and not of MDPI and/or the editor(s). MDPI and/or the editor(s) disclaim responsibility for any injury to people or property resulting from any ideas, methods, instructions or products referred to in the content. |
© 2024 by the authors. Licensee MDPI, Basel, Switzerland. This article is an open access article distributed under the terms and conditions of the Creative Commons Attribution (CC BY) license (https://creativecommons.org/licenses/by/4.0/).