Article

Effect of Fine Particle Content on Solution Flow and Mass Transfer of Ion-Adsorption-Type Rare Earth Ores

1
Ganjiang Innovation Academy, Chinese Academy of Sciences, Ganzhou 341119, China
2
Rare Earth Institute, University of Science and Technology of China, Hefei 230026, China
3
School of Resources and Environment Engineering, Jiangxi University of Science and Technology, Ganzhou 341000, China
*
Authors to whom correspondence should be addressed.
Minerals 2024, 14(9), 879; https://doi.org/10.3390/min14090879
Submission received: 21 July 2024 / Revised: 23 August 2024 / Accepted: 26 August 2024 / Published: 28 August 2024
(This article belongs to the Special Issue Green and Efficient Recovery/Extraction of Rare Earth Resources)

Abstract

:
Fine particle content significantly affects the in situ leaching of ion-adsorption-type rare earth ores. This study investigated the effect of fine particle content on solution flow and mass transfer in leaching. The results showed that with the increase in fine particle content, the peak concentration and peak time of rare earth increased. When the fine particle content exceeded 20%, all ion-exchangeable-phase rare earth ions could be replaced with a low dosage of the leaching solution. The leachate flow rate exhibited multi-stage variation, influenced by solution permeation, ion exchange, and fluctuations in accumulated liquid height. A mass transfer analysis showed that a higher fine particle content corresponded to a smaller plate height and a larger plate number of theoretical plates. As fine particle content increased, the final rising height of capillary water decreased, with rising rates varying across different stages for the samples. Moreover, an increase in fine particle content from 5% to 20% resulted in a 94% decrease in the samples’ permeability coefficients. A mechanism analysis showed that when the fine particle content was higher, the fine particles were embedded in the gaps between coarse particles, and the ore particles in the sample were arranged continuously, resulting in a lower permeability coefficient. Then, the leaching solution could penetrate uniformly, which was beneficial for reducing leaching blind spots and improving leaching efficiency. However, excessive fine particle content might have detrimental effects. Based on these results and considering actual mining conditions, the optimal fine particle content for rare earth leaching is 20%.

1. Introduction

Rare earth elements (REEs) comprise 17 chemical elements, including scandium (Sc), yttrium (Y), and 15 lanthanide elements (Ln), which are widely used in many high-technology industries (such as new energy vehicles, communication engineering, high-temperature superconductivity, aerospace, national defense, etc.) due to their unique physical and chemical natures [1,2,3]. Therefore, REEs have earned the title of “industrial vitamins”, and they have also been regarded as a national strategic resource by various countries [4,5]. China has always been the major producer of REEs, providing over 80% of the global supply of rare earth raw materials, especially heavy REEs, for which China provides over 90% of the global supply [6]. Heavy REEs are mainly derived from the ion-adsorbed-type rare earth ores in southern China, also known as weathered crust elution-deposited rare earth ores [7]. The occurrence state of REEs in this deposit mainly includes the water-soluble phase, ion-exchangeable phase, colloidal-sedimentary phase, and mineral phase [8,9]. Ion-exchangeable-phase rare earth has the highest economic value, and its content can reach from 50% to 90% [10]. Suitable cations (NH4+, Mg2+, Al3+, etc.) can exchange and wash out these rare earth ions through a solution with a specific concentration [11,12,13]. Currently, in situ leaching technology is the preferred technology for recovering rare earth resources in mines with favorable permeability and recovery conditions for leaching solutions [14]. The main process involves injecting the leaching solution into the orebody through a hole, and then the solution diffuses within the orebody and flows downward under the combined effects of capillary force, adsorption force, and pore water pressure [15]. The rare earth ions adsorbed on the surface of the minerals are exchanged during the diffusion of the solution and collected with the solution flowing out of the orebody [16].
Rare earth deposits are hosted in the weathered crust of granite or volcanic rocks, which are loose materials mainly composed of quartz, feldspar, and clay minerals [17]. The ore particles are carriers of REEs, and their size and gradation composition are fundamental physical properties of the orebody, playing a crucial role in solution flow, mass transfer, and the migration of fine particles [18,19]. The unclear flow of the leaching solution in the orebody is one of the fundamental problems faced by the application and promotion of the in situ leaching technology. The different sizes and gradation compositions of ore particles can change the pore structure of the orebody and the flow path of the leaching solution. As a result, this ultimately affects their permeability and leaching efficiency [20]. On the one hand, when the orebody contains many large particles, the leaching solution tends to flow along the pores between the large particles rather than fully contacting the orebody, resulting in low leaching efficiency [21]. On the other hand, when the orebody contains a high content of fine particles, the leaching solution can diffuse outwards. But when the leaching solution penetrates to a certain extent, the difficulty of continuing to penetrate downwards increases. Vortices and a large number of leaching blind spots are easily formed in leaching. As a result, the leachate still contains a large amount of REEs in the later re-leaching process, negatively affecting the recovery and utilization of REEs [22].
Many researchers have conducted extensive research on the effect of ore particle size and particle size distribution on the permeability characteristics of rare earth orebodies [23,24]. Yin et al. [25] studied the seepage characteristics of the rare earth orebody with different pore ratios. They found that the bound water film of rare earth ore particles occupied the effective pores when the pore ratio was small, which had a great viscous effect on the solution flow. Guo et al. [26] studied the effects of ore particle size and particle size distribution on the shape of the wetting body and the wetting peak transport distance within the ore body at a two-dimensional scale. They found that as the fine particle content increased, the wetting front transport distance gradually decreased, and the infiltration curve became smoother. During the leaching process, the infiltration process of the solution must bypass more ore particles and flow for a longer distance with the increasing content of fine particles, which enhances the viscous effect and worsens the permeability of the orebody [27]. Moreover, research has shown that ore particles smaller than 0.075 mm have the greatest impact on orebody permeability in leaching [28]. When the content of particles smaller than 0.075 mm is within the range of 0%–8%, the migration ability of particles is strong. We studied the particle size distribution of different rare earth mines and found that there are significant differences in the particle size distribution of different ore points in the same mining area, especially for the content of particles smaller than 0.075 mm, which ranges from 8% to 57% [29,30,31]. Therefore, we obtained rare earth samples with a single particle size by screening rare earth raw ores and performed column leaching experiments to study the seepage and mass transfer characteristics of ore particles with single grading. The results showed that the proportion of ore particles smaller than 0.075 mm plays a key role in solution flow and mass transport during the leaching process [32].
Based on the solution flow and mass transfer characteristics of a rare earth orebody with single grading, this study further researched the effect of different fine particle contents (fine particles refer to a particle size less than 0.075 mm in this study) with continuous grading on the leaching process and permeability characteristics of the orebody. This research is crucial for calculating injection strength during the in situ leaching process, and the results are helpful for people to predict and timely regulate the leaching process, which can provide a theoretical basis for the efficient mining of ion-adsorption-type rare earth ores.

2. Materials and Methods

2.1. Materials

2.1.1. Properties of Rare Earth Raw Ores

The rare earth ores used in this study were obtained from an ion-adsorption-type rare earth mine in Ganzhou City, Jiangxi Province, southern China. After the ores were taken back, their basic physical and chemical properties (e.g., bulk density, dry density, specific gravity, moisture content, and ore grade) were determined according to the methods in the standard for geotechnical testing [33]. The results are shown in Table 1. The total content of the ion-exchangeable-phase rare earth in the raw ores was measured by the PQ9000 inductively coupled plasma-optical emission spectrometer (ICP-OES) made in Germany. Firstly, an appropriate amount of rare earth ores was ground to a particle size of less than 1 mm by the quartering method, dried at 105 °C for 1 h in a dry oven, and then cooled to room temperature (23–26 °C) in a dryer. Next, 20 g of the rare earth ores was added to a conical flask containing 100 mL of a 2 wt.% (NH4)2SO4 solution. The conical flask was placed in a shaker and vigorously shaken for 2 h to allow for ion exchange between the rare earth ions and NH4+. The mixture was then incubated for 30 min to obtain the supernatant. Finally, the rare earth concentration of the supernatant was analyzed. Table 2 shows the total content and partitioning of the ion-exchangeable-phase rare earth in the raw ores. It can be seen that 83.54 wt.% of the REEs were light REEs, and the middle and heavy REEs were 16.46 wt.%; therefore, the raw ores belong to the light rare-earth-enriched pattern ore.

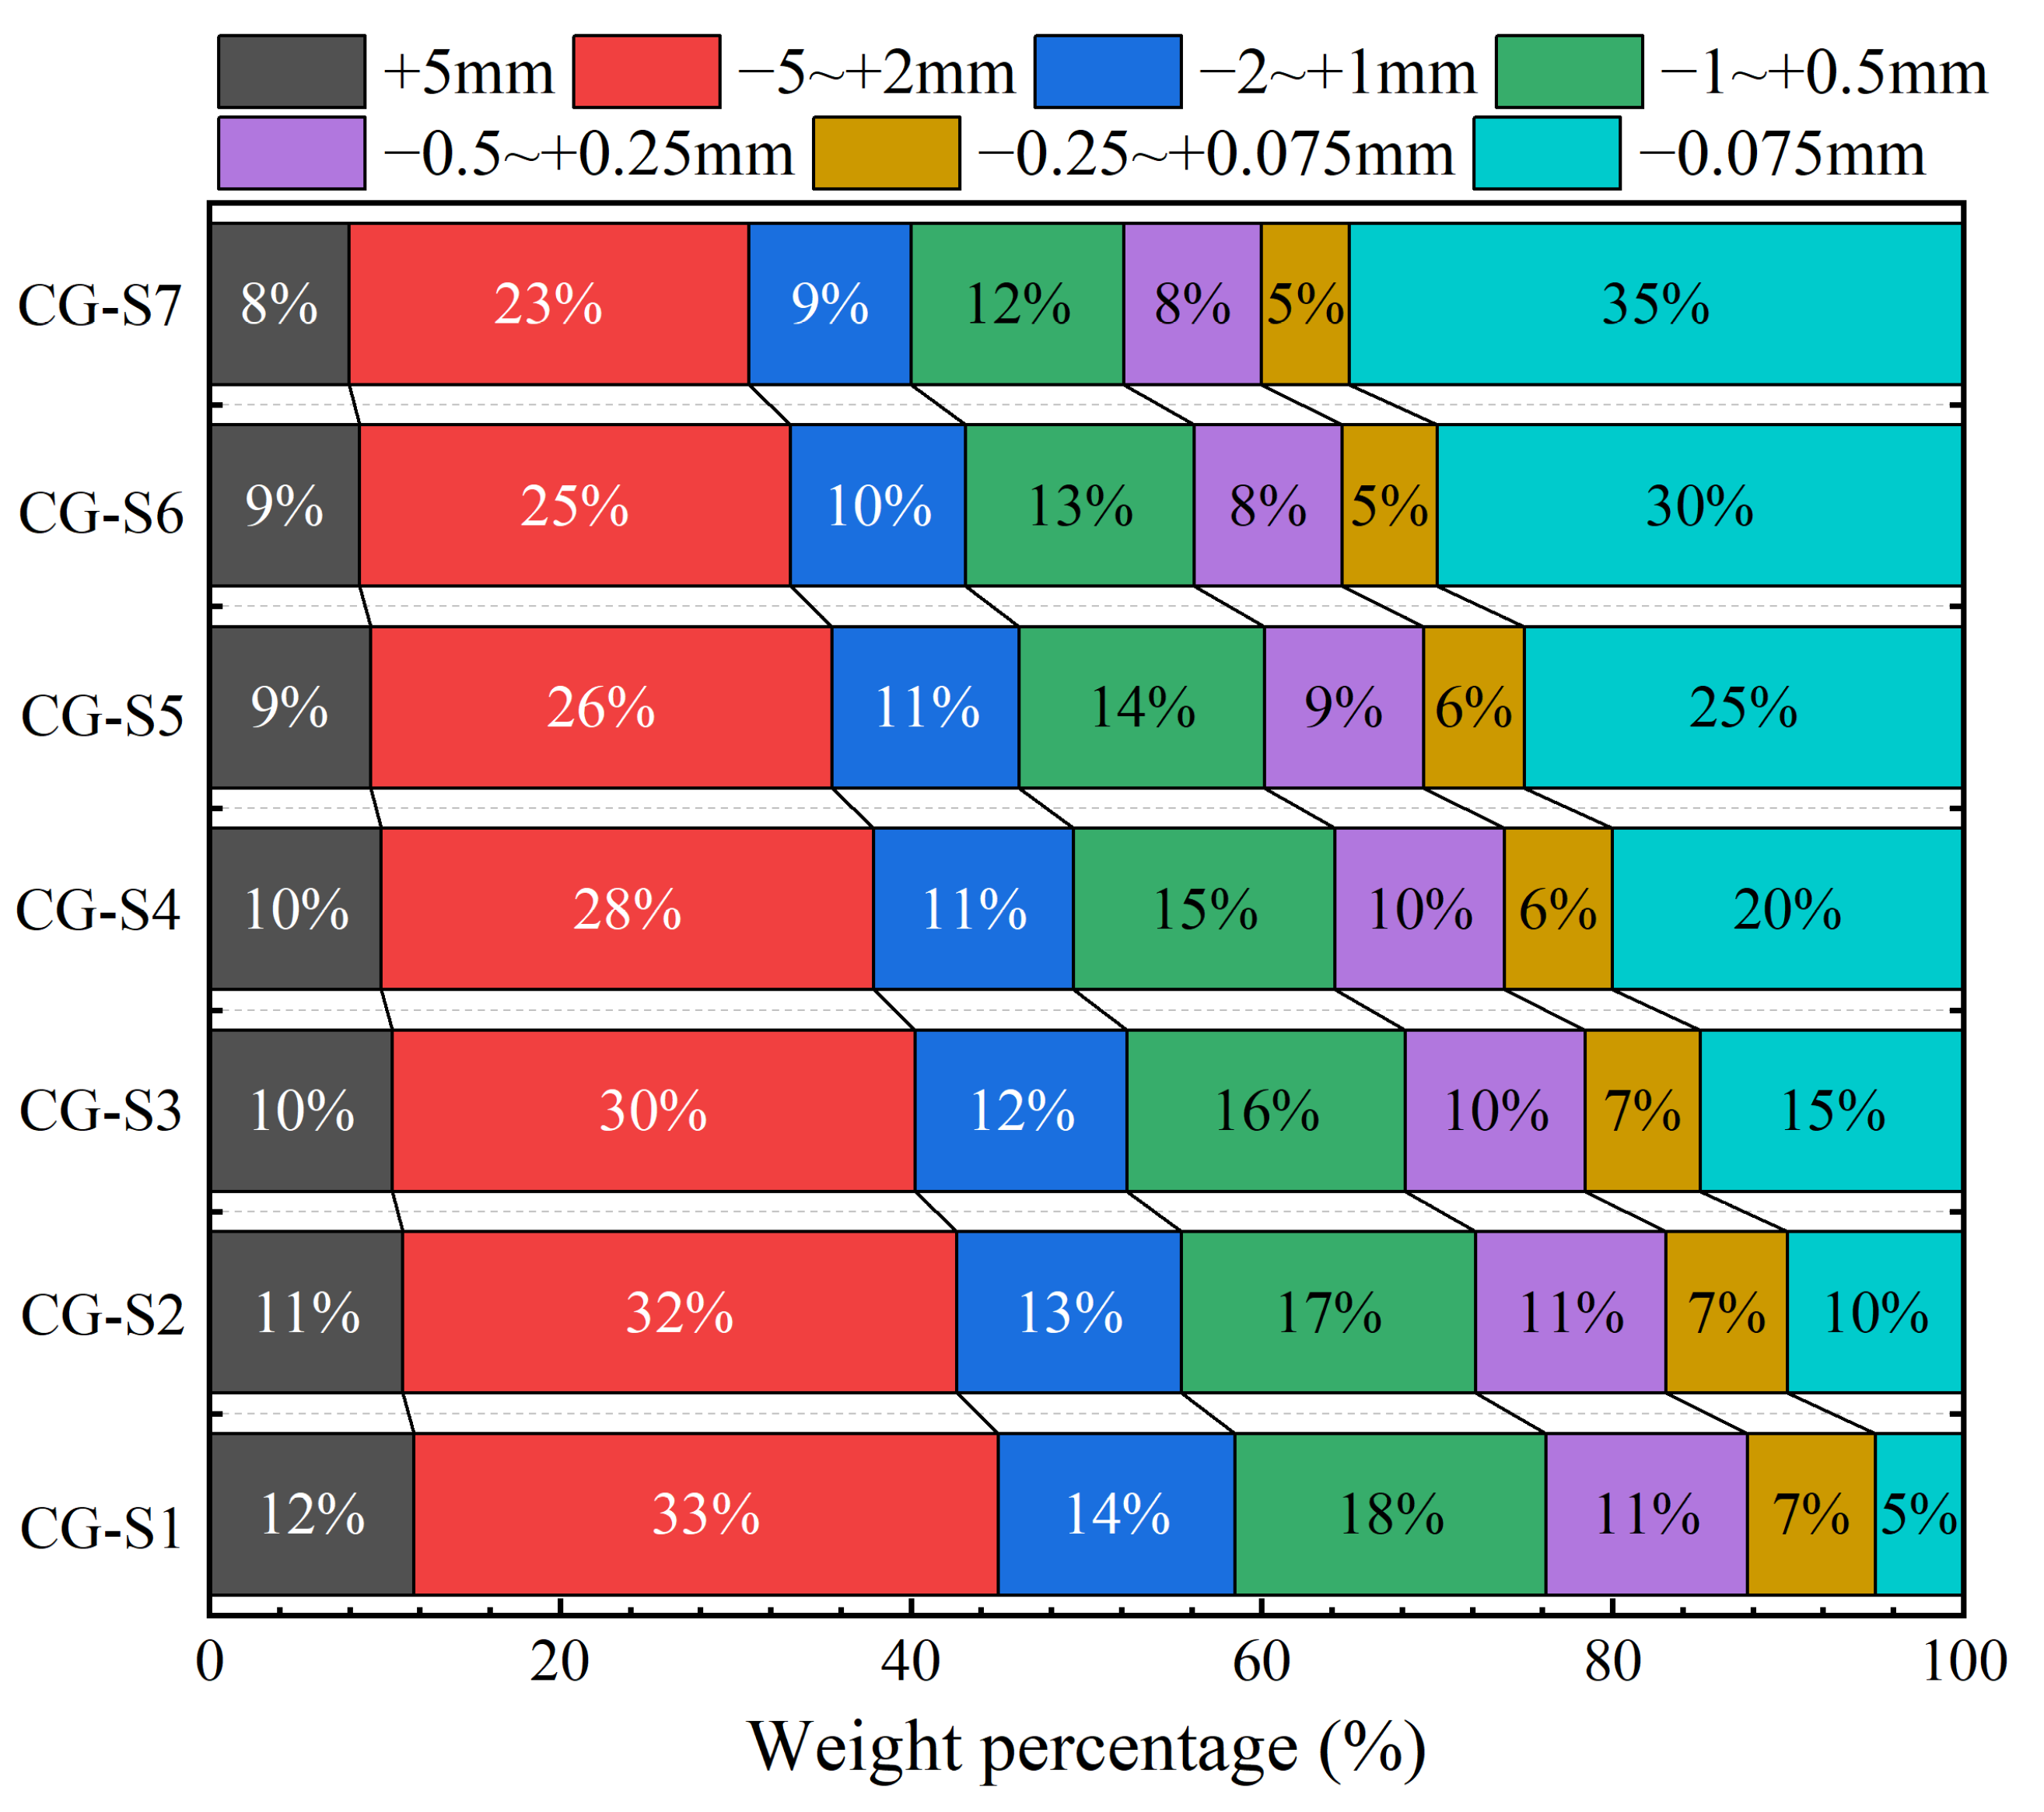
2.1.2. Properties of Recombinant Rare Earth Ore

To explore the effect of different fine particle contents of rare earth ores with continuous grading on the leaching process and permeability of the orebody, seven groups of continuous grading samples with different contents of fine particles were recombined based on the grading characteristics of the raw ore. The fine particle contents of the recombinant ores were 5%, 10%, 15%, 20%, 25%, 30%, and 35%, and the corresponding sample numbers were CG-S1, CG-S2, CG-S3, CG-S4, CG-S5, CG-S6, and CG-S7, respectively. The grading characteristic parameters (including the average particle size, d50; the coefficient of nonuniformity, Cu; and the coefficient of curvature, Cc) and the total content of the ion-exchangeable-phase rare earth of the recombinant ores are shown in Table 3. The particle size distribution curve and the weight percentages of ore with different single particle sizes of the recombined rare earth ores are shown in Figure S1 (in the Supplementary Data) and Figure 1, respectively.

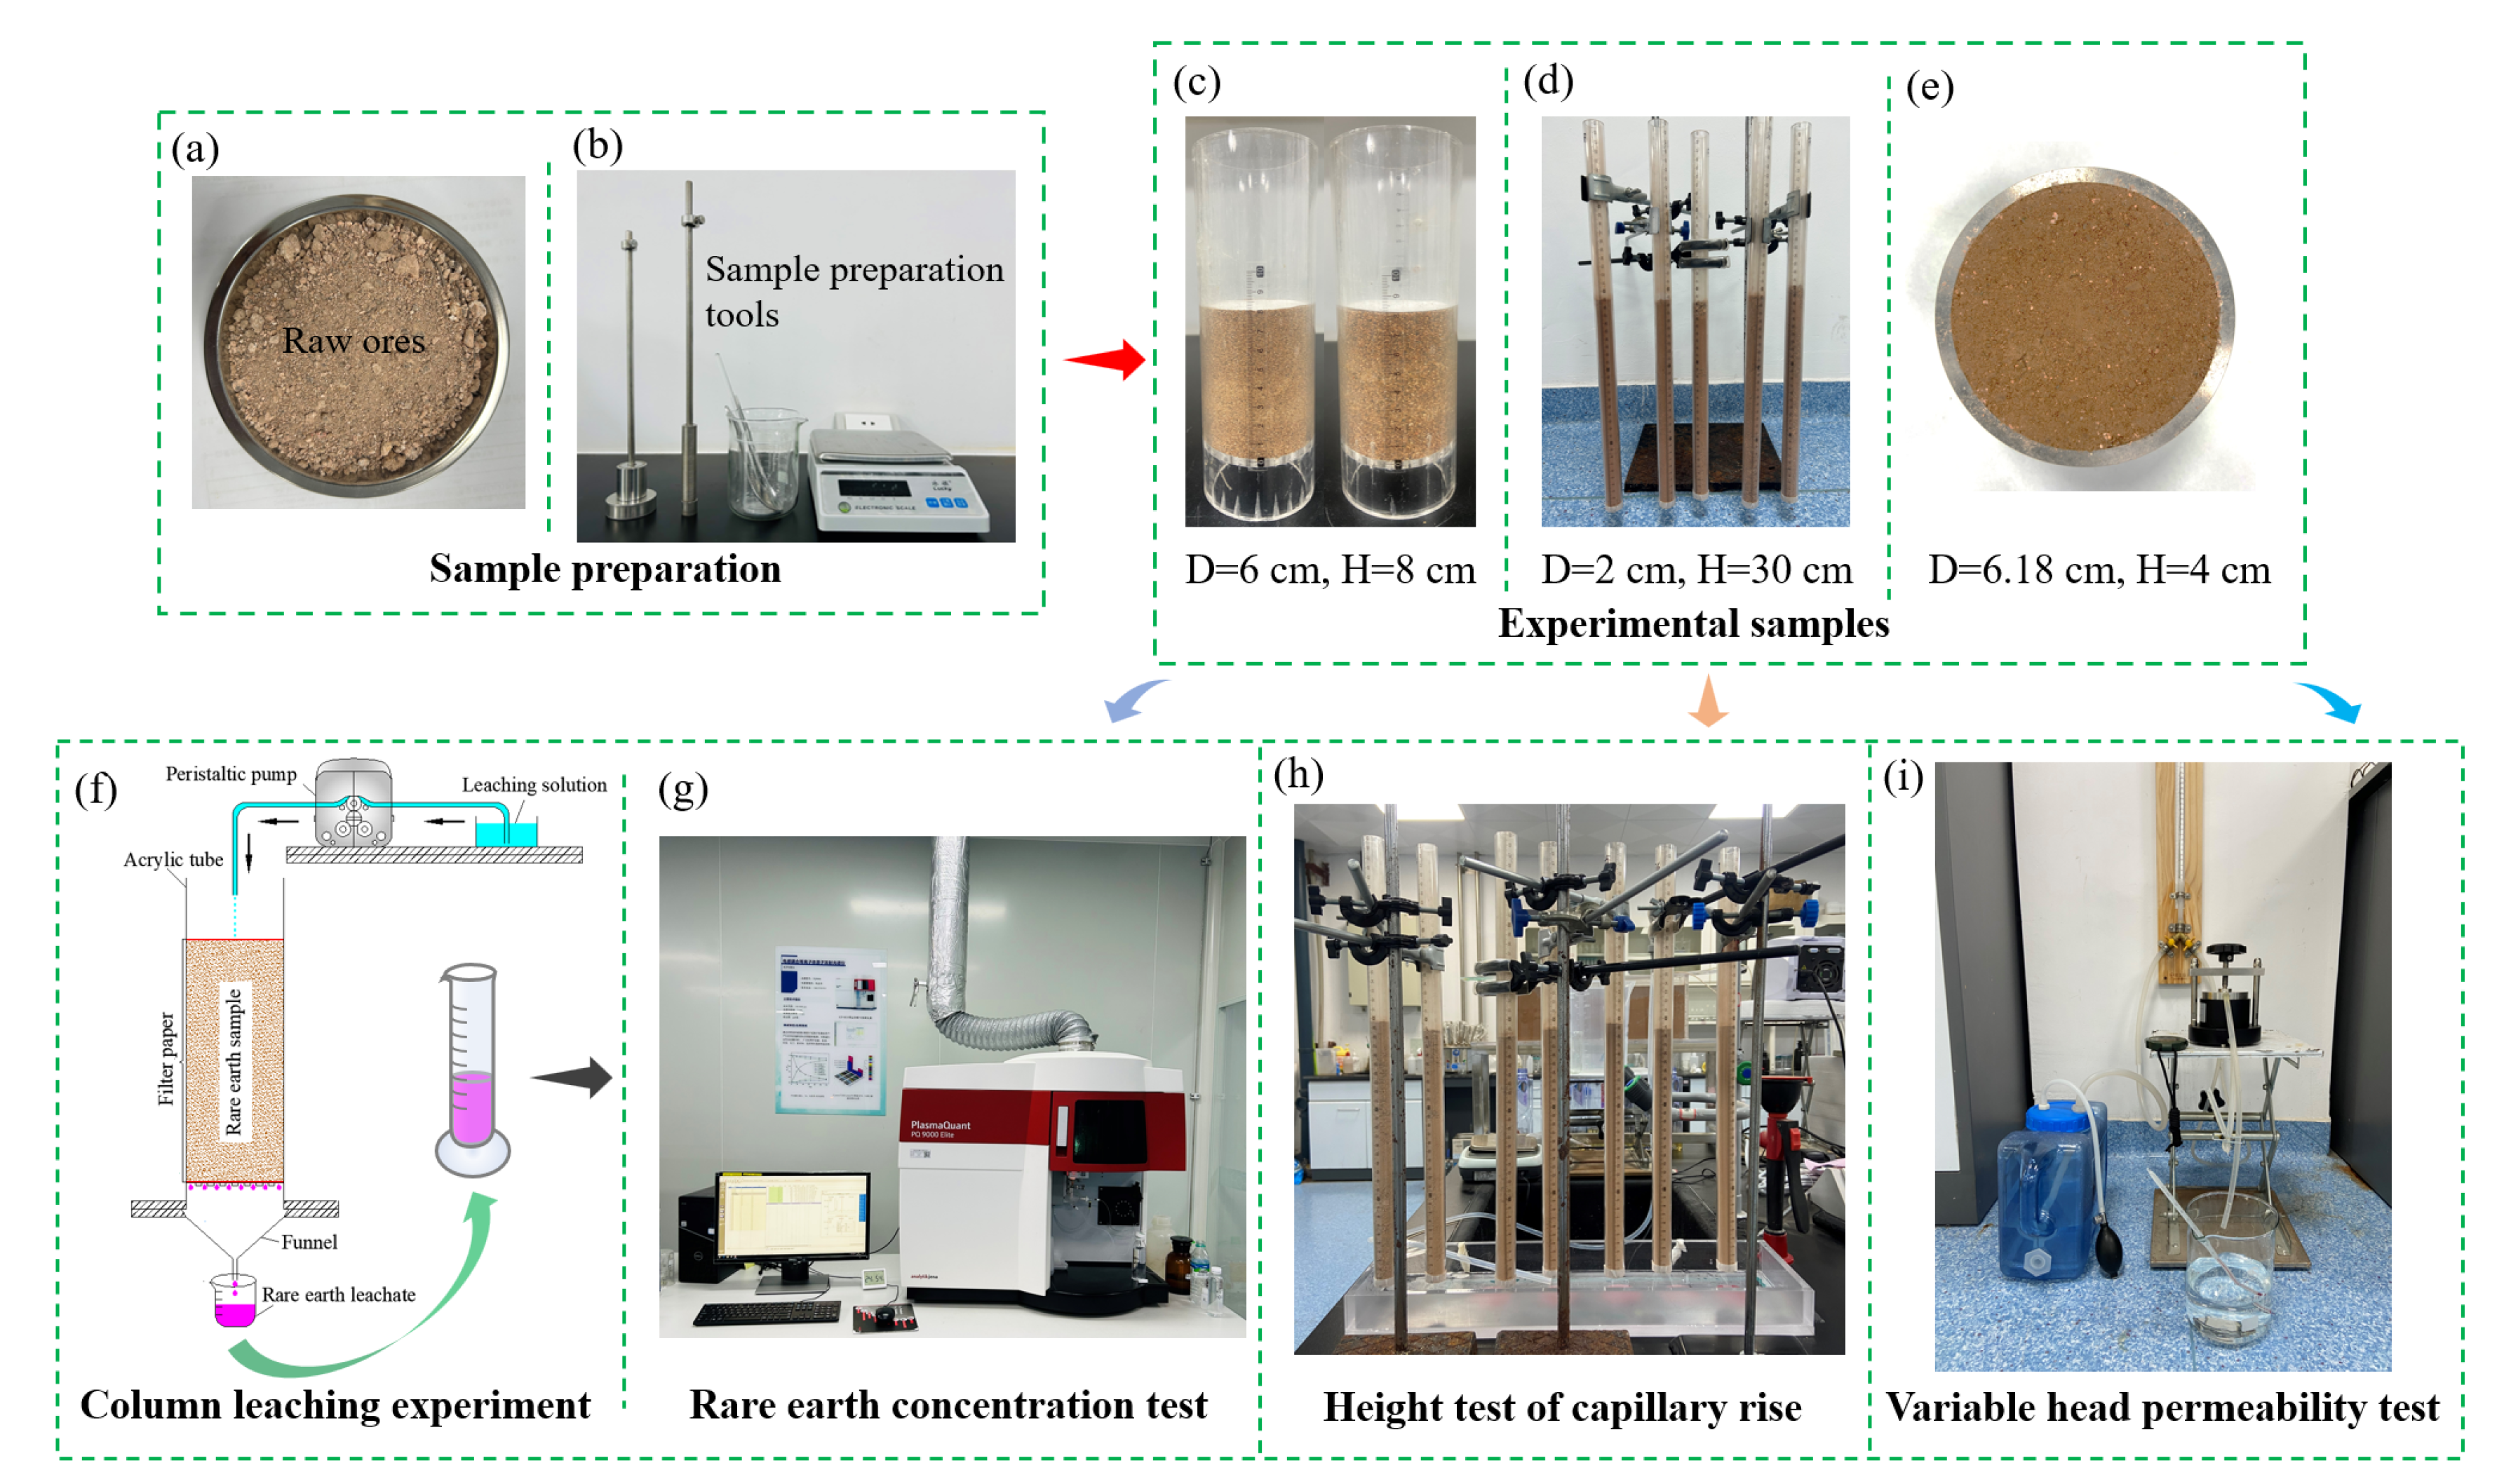
2.2. Experimental Process

To investigate the effect of fine particle content on the mass transfer and permeability of ion-adsorption-type rare earth ore in leaching, different experimental methods were used in this study, including sample preparation, column leaching experiments, height tests of capillary rise, and variable head permeability tests. The schematic diagram of the experimental process is shown in Figure 2.

2.2.1. Sample Preparation

After obtaining the rare earth raw ores, large pieces of ores were broken, and then all the ores were dried and mixed evenly. The ores were screened using a standard soil sieve to obtain ore particles with single grading. According to the pore size of the standard soil sieve, the raw ores were divided into seven groups, and the sample numbers were SG-S1 (>5 mm), SG-S2 (−5 mm to +2 mm), SG-S3 (−2 mm to +1 mm), SG-S4 (−1 mm to +0.5 mm), SG-S5 (−0.5 mm to +0.25 mm), SG-S6 (−0.25 mm to +0.075 mm), and SG-S7 (<0.075 mm), respectively. The screened samples were dried again, and they were recombined according to the preset weight percentage of ore particles with each single grading (the total dry ore mass was unified to 300 g, and the weight of ore particles with each single grading is shown in Table S1). After the recombinant rare earth ores were mixed evenly, deionized water was added to the recombinant ores based on the moisture content of the raw ores. Then, the mixed recombinant ores were divided into three equal parts and added to an acrylic tube. Each additional mineral soil layer was pounded using a gravity hammer to allow each ore layer in the column to reach a specified height. Furthermore, the ore surface at the junction was roughened by poking with a narrow stick without compacting the layer to avoid sample stratification. The diameters and heights of the samples were 6 cm and 8 cm, respectively. The sample preparation tools and the remodeled samples are shown in Figure 2a–c.

2.2.2. Column Leaching Experiment

After the remodeled sample was fixed on the shelf, the 2 wt.% MgSO4 solution (with a pH ranging from 5.5 to 6.0) was added at a constant flow rate of 0.5 mL/min using a peristaltic pump. In the column leaching experiments, the injection volume (solid–liquid ratio) of the MgSO4 solution was set to 5 groups: 1:0.2, 1:0.4, 1:0.6, 1:0.8, and 1:1. After injecting the leaching solution, the sample was cleaned with deionized water, and the solid–liquid ratio (volume ratio) of deionized water was always 1:1. The leachate was collected regularly after the sample was discharged, and its volume was recorded. When the leachate could not be collected at the bottom of the sample, the experiment ended. The rare earth concentration of the leachate was measured by the ICP-OES (see Figure 2g). The experiments were carried out in the same external environment. Figure 2f shows the schematic of the column leaching experimental device.

2.2.3. Height Test of Capillary Rise

The capillary water’s rising height and rising rate of rare earth ores with different fine particle contents were directly observed. The height test of the capillary rise device is shown in Figure 2h, which includes an instrument bracket, organic glass tube, organic glass water tank, scale, peristaltic pump, and connected rubber tube. According to the preset weight percentage of ore particles with each single grading, the rare earth ores were recombined and mixed evenly (the weight of ore particles with each single grading is shown in Table S2). Then, the ores were loaded into the organic glass tube in fractions using a funnel and compacted using a homemade rammer to achieve the required dry density. The diameter, height, and dry density of the samples were 2 cm, 30 cm, and 1.36 g/cm3, respectively. After preparing the samples, they were vertically inserted into a water tank, with the water surface positioned 0.7–0.9 cm above the bottom of the tube. In the initial stage, the heights of the highest point of capillary water were recorded according to the color of the mineral soil in the glass tube at 5, 10, 20, 30, and 60 min, respectively. Subsequently, the heights of the highest point of capillary water were recorded every few hours until the rise was stable. During the experiment, a peristaltic pump was used to keep the water surface unchanged.

2.2.4. Variable Head Permeability Test

The preparation of samples required for the variable-head permeability test was also based on the preset weight percentage of ore particles with each single grading, and the weight of the ore particle with each single grading is shown in Table S3. After the recombinant rare earth ores were mixed evenly, an amount of deionized water was added into the recombinant rare earth ores based on the moisture content of the raw ores, and then the ores were mixed evenly again. The permeability coefficient of the orebody was tested using a TST-55 permeameter. In the experiment testing the permeability coefficients of the samples, the diameter and height of the samples were 61.8 mm and 40 mm, respectively. The sample preparation and experimental steps were followed with the methods specified in the standard for geotechnical testing [33], and the experiments were conducted in the same external environment. The variable head permeability test device is shown in Figure 2i.

3. Results and Discussion

3.1. Experimental Results of Column Leaching

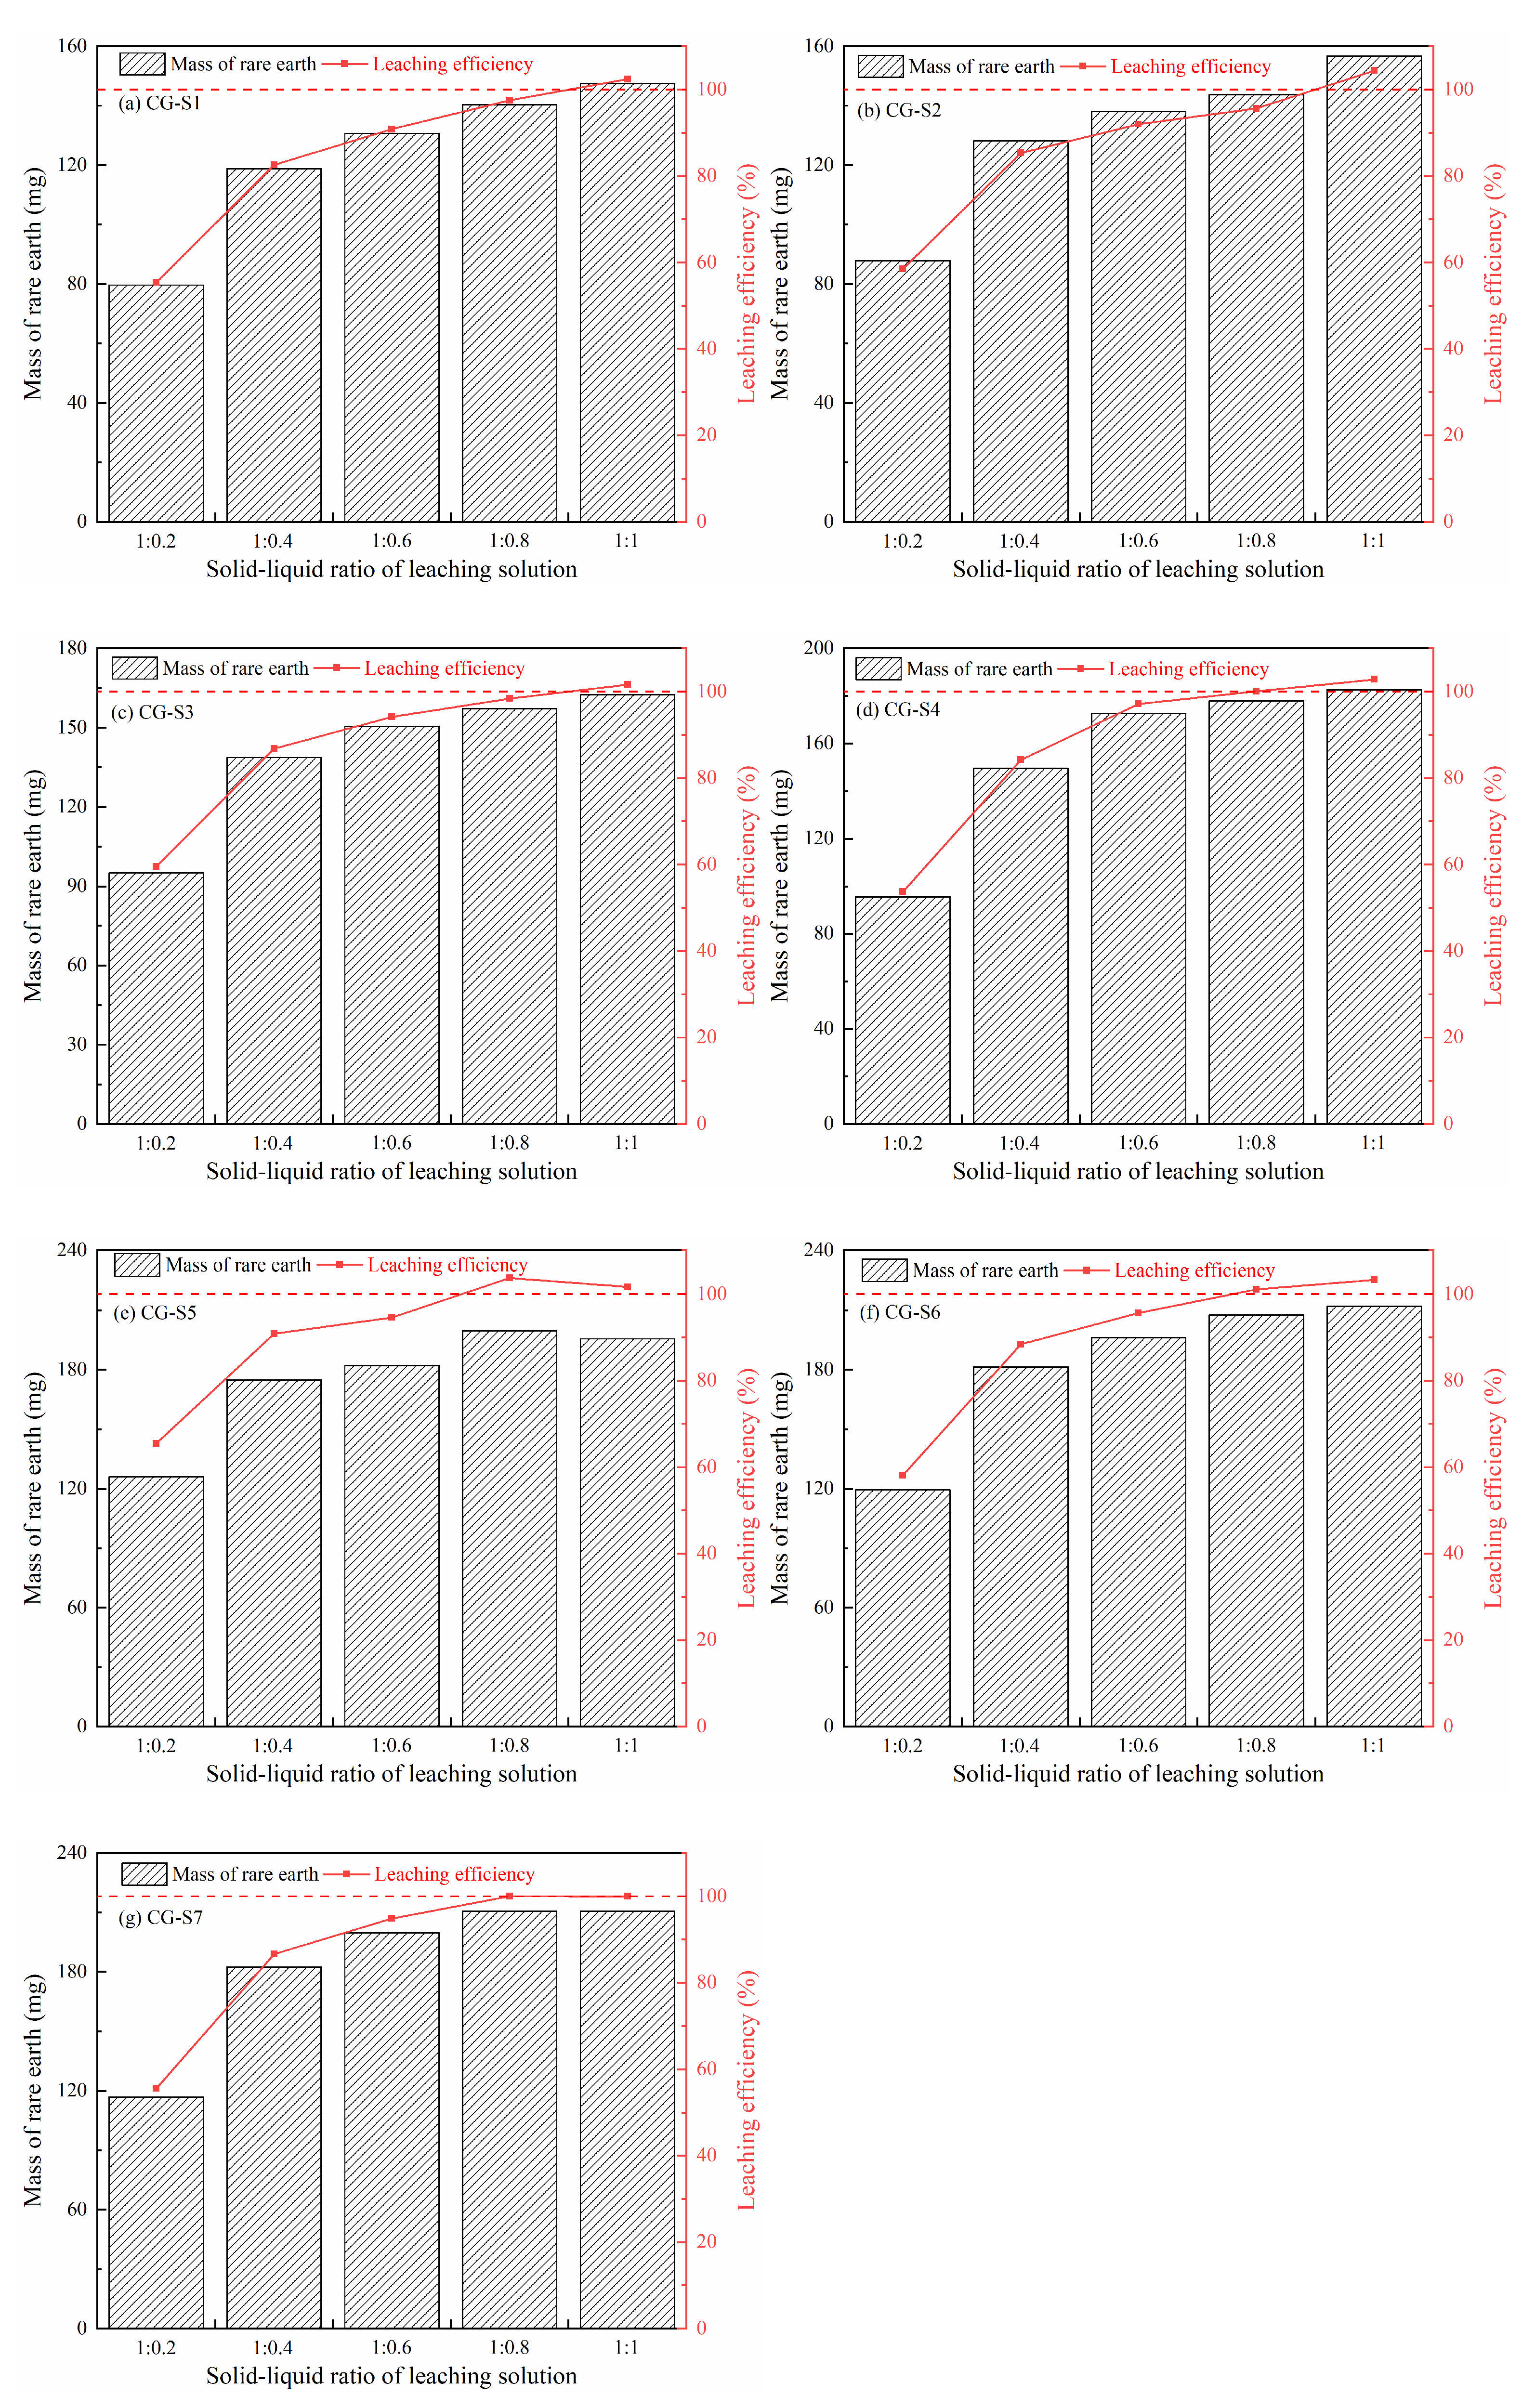
3.1.1. Effect of Different Solid–Liquid Ratios of the Leaching Solution on Rare Earth Leaching

Figure 3 shows the mass of rare earth leached and the leaching efficiency of samples with different fine particle contents at different solid–liquid ratios. As the solid–liquid ratios of the leaching solution rose, the mass of rare earth leached, and the leaching efficiency of the samples increased and eventually tended to stabilize. Additionally, the solid–liquid ratios of the leaching solution at which the leaching efficiency of each sample group reached 100% were not consistent. The fine particle content of the samples (CG-S1, CG-S2, and CG-S3) was less than 20%, and the leaching efficiencies reached 100% when the solid–liquid ratio reached 1:1. However, for the samples (CG-S4, CG-S5, CG-S6, and CG-S7) with fine particle contents exceeding 20%, the leaching efficiency had reached 100% when the solid–liquid ratio of the leaching solution was 1:0.8. According to the REE content of the rare earth ores with a single particle size (Supplementary Table S4), the REE content increased as the particle size of the ore decreased. Therefore, the more the fine particle content, the higher the REE content, and the dosage of the leaching solution required to exchange all the ion-exchangeable-phase rare earth was also higher based on the principle of equivalent exchange. However, the experimental results showed that the higher the fine particle content, the lower the dosage of leaching solution needed, and it was enough to exchange the entire ion-exchangeable phase. This indicated that the leaching efficiency of the ore was closely related to the fine particle content.

3.1.2. Mass Transfer Characteristics of Rare Earth Ore

For the study of the effect of fine particle content on the whole leaching process of rare earth ores with continuous grading, the solid–liquid ratios of the leaching solution and deionized water were set to 1:0.8 and 1:1, respectively. Figure 4 shows the leached rare earth concentration of each sample during the whole leaching process. The leached rare earth concentration of each sample rapidly increased to a maximum, then decreased rapidly, followed by a gradual decrease until finally reaching stability. Moreover, the penetration curve of the sample gradually moved to the right with the increase in the fine particle content of the sample, and the time for the peak rare earth concentration was prolonged, and the peak was gradually increased. This result may be attributed to the ore particles of samples with high fine particle content being continuous with the fine particles embedded between the coarse ones, which resulted in the low porosity and permeability of the sample. Consequently, the flow rate of the leachate decreased for samples with more fine particles, prolonging the leaching time and increasing the time for peak rare earth concentration. In addition, the peak value of the rare earth concentration gradually increased with the increase in the fine particle content. This is due to the higher clay mineral content in samples with more fine particles and the more REEs adsorbed on the surface of the minerals.
As shown in Figure S2 (in the Supplementary Data), the relationship curve between the rare earth concentration and the liquid volume was obtained by using the cumulative volume of the leachate as the abscissa. Then, Figure S2 was analyzed using the chromatographic plate theory, and the results are shown in Table 4. The plate number of theoretical plates (n) and the plate height (H) were used to evaluate the mass transfer efficiency of rare earth with different contents of the fine particles. As shown in Table 4, as the fine particle content of the sample increased, the n of the sample increased, while the H decreased gradually. This indicates that with higher fine particle content, the mass transfer efficiency of rare earth improved, having a promoting effect on the leaching process. Furthermore, the influence of different fine particle content on the n and the H varied significantly. In particular, when the fine particle content increased to 25%, the H and n did not change significantly with a further increase in fine particle content. This means that increasing the fine particle content beyond 25% has little effect on mass transfer. This can be attributed to higher fine particle content increasing the resistance of the leaching solution penetrating downwards, making it difficult for the solution to continue penetrating further. This affects the mass transfer efficiency of the whole leaching process and prolongs the leaching cycle.

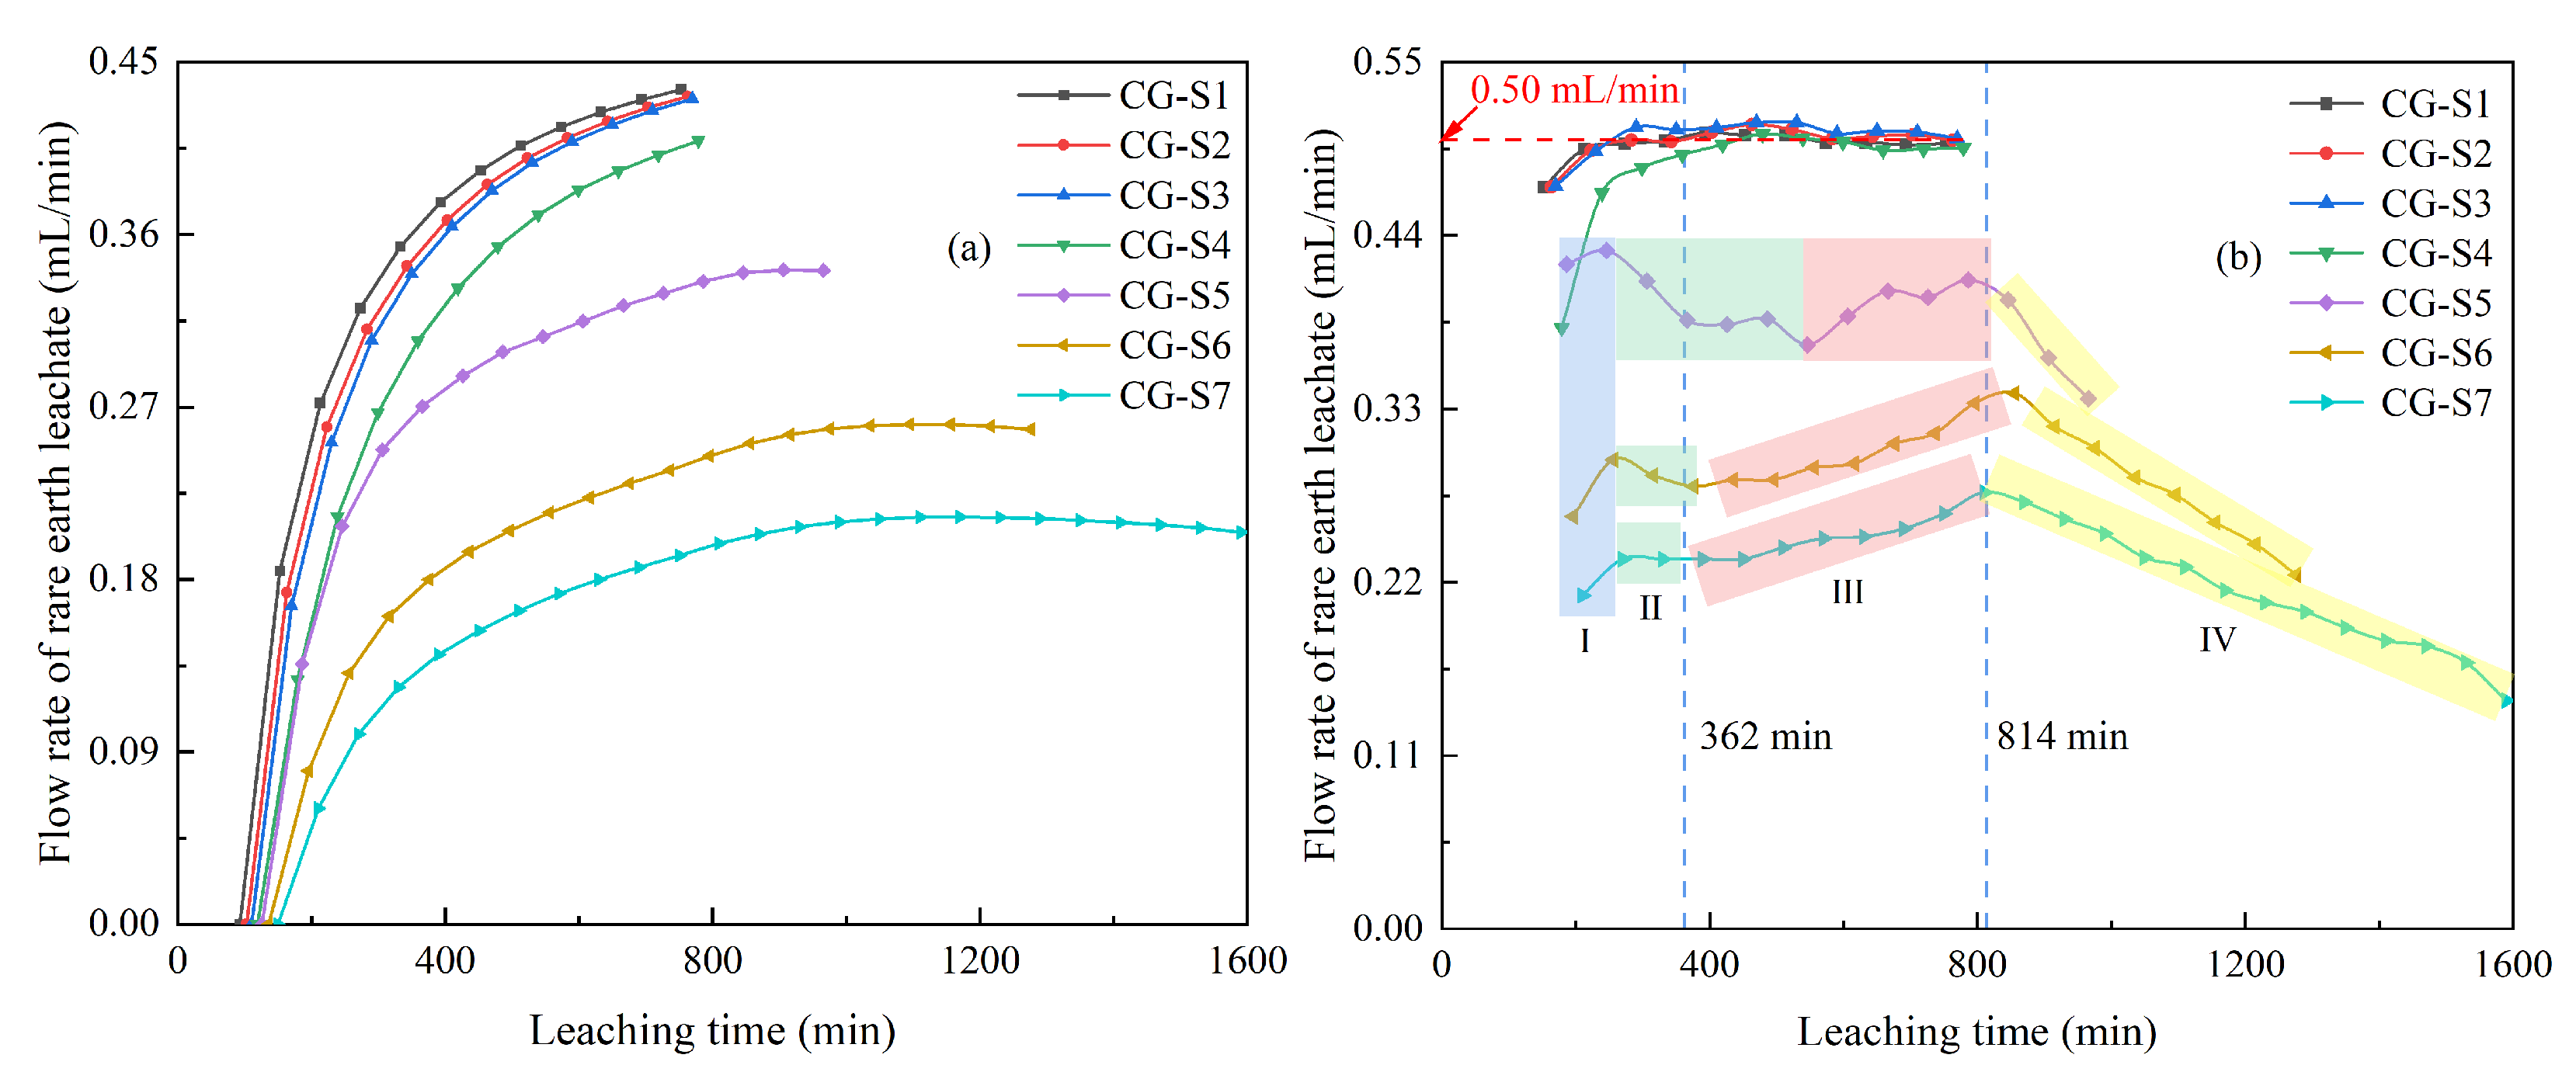
3.1.3. Flow Rate of the Rare Earth Leachate

The flow rate of rare earth leachate of samples with different fine particle contents was determined by analyzing the relationship between leaching time and leachate volume for each sample. The results are shown in Figure 5. Specifically, Figure 5a illustrates the flow rate of rare earth leachate throughout the entire leaching process, calculated by dividing the cumulative leachate volume by the cumulative leaching time. The flow rate gradually increased as leaching progressed and eventually stabilized. In addition, as the fine particle content increased, the flow rate of the leachate of the samples gradually decreased over time throughout the entire leaching process. The decrease in the flow rate of the leachate of the samples (CG-S1, CG-S2, CG-S3, and CG-S4) was relatively small. However, as the fine particle content continued to rise, the decrease in the flow rate of the leachate of the samples (CG-S5, CG-S6, and CG-S7) became more significant. The reason was that the fine particles would be embedded between the coarse particles and would decrease the large pores. When the fine particle content increased beyond a certain extent, the fine particles could potentially obstruct the interstitial pores, causing the ore particles to coalesce into a continuous mass, which in turn caused the porosity and permeability of the sample to become lower. Macroscopically, this manifested as a substantial decrease in the flow rate of the rare earth leachate of the samples.
Figure 5b illustrates the flow rate of rare earth leachate for each leaching cycle, calculated by dividing the volume of leachate collected in each cycle by the corresponding leaching time. After a relatively short leaching time, the flow rate of the leachate of the samples (CG-S1, CG-S2, CG-S3, and CG-S4) stabilized at approximately 0.5 mL/min. According to the experimental design, the leaching solution was introduced using a peristaltic pump at a constant flow rate of 0.5 mL/min. This indicates that once the outflow rates of the samples reached equilibrium, the volume of rare earth leachate recovered was equivalent to the volume of leaching solution introduced. Furthermore, no liquid accumulation was observed at the top of the samples during the entire leaching process. However, the flow rate of the leachate of the samples (CG-S5, CG-S6, and CG-S7) exhibited a multi-stage change. (Ⅰ) The flow rate was affected by both ion exchange and solution penetration in this stage. As the sample was not completely saturated, the penetration of the solution further increased the flow rate of the samples. (II) The flow rate of the samples was also affected by both ion exchange and solution permeation in this stage. However, the samples had reached complete saturation, and ion exchange became the dominant process, negatively impacting solution permeation. Consequently, the flow rate of each sample decreased, with sample CG-S5 exhibiting a prolonged duration in this stage. (III) The liquid at the top of the sample was accumulated in this stage. The flow rate was affected not only by the combined effects of ion exchange and solution permeation but also by the height of the water head. During this stage, the injection of leaching solution ceased, and deionized water began to be introduced. The impact of ion exchange diminished. As deionized water continued to be injected, liquid accumulation at the sample tops increased. Consequently, the flow rate of the samples increased due to the heightened water head. However, liquid accumulation in sample CG-S5 occurred later, resulting in a shorter duration for this stage. (IV) The injection of deionized water was stopped, and the water head above the samples reached the maximum height in this stage. As the leaching process continued, the height of the accumulated liquid gradually decreased. Consequently, the flow rate of the samples continuously declined until the leaching process was completed.
In conclusion, the flow rate variation pattern of samples with different proportions of fine particles under continuous grading did not exhibit a simple increase or decrease throughout the leaching process. This study revealed that when the proportion of fine particles exceeded 20%, the process showed a multi-stage change. The flow rate of the sample was affected by various factors, including solution permeation, ion exchange, and fluctuations in the height of the accumulated liquid. Understanding the permeability characteristics of rare earth minerals based on different proportions of fine particles is crucial for determining optimal injection intensities during in situ leaching. The findings of this research contribute to a more accurate prediction and timely regulation of the leaching process.

3.2. Effect of Fine Particle Content on the Rising Process of Capillary Water

To study the effect of the fine particle content on the capillary water’s rising height and rising rate, height tests of capillary rise were carried out, and the results are shown in Figure 6. The corresponding rising height and rate over different periods are shown in Figures S3 and S4 (in the Supplementary Data), respectively. As shown in Figure 6, based on the law of the rising height and rising rate over different periods, the whole process could be divided into three stages: (Ⅰ) the rapid rise stage (0–60 min), (Ⅱ) the slow rise stage (60–300 min), and (Ⅲ) the steady rise stage (300–900 min). In the rapid rise stage, the water contents of the ores were low, resulting in a large soil matrix potential. Therefore, the capillary water rose quickly under the action of the water potential gradient. Meanwhile, the rising rate decreased quickly in this stage. In the slow rise stage, the water contents of the ores increased as the water gradually entered the ore soil, resulting in a decreasing soil matrix potential. Therefore, the rising rate slowed down in this stage. In the steady rise stage, the rising rate reduced slowly to zero, and the rising height reached the maximum. Furthermore, by comparing the rising height and rising rate over different periods for the samples, it is obvious that the greater the fine particle content of a sample, the greater the final rising height. However, the relationship between the fine particle content and the rising rate was more complex. The rising rate did not simply accelerate throughout the entire rising process as fine particle content increased. Instead, the rising rate likely varied across the different stages for samples with different fine particle contents. In the early stage of the capillary water rising process (the rapid rise stage), the rising rate decreased gradually with the increasing content of fine particles. When the fine particle content exceeded 25%, the rising rate increased gradually. In the slow rise stage, the rising height and rising rate of the sample containing a high fine particle content gradually surpassed those of the sample with a low fine particle content. In the steady rise stage, the higher the fine particle content, the higher the rising height and rising rate.

3.3. Effect of Fine Particle Content on Permeability Characteristics of Rare Earth Ore

To intuitively explore the effect of different contents of fine particles on the permeability of the samples, the permeability coefficients of the samples with different contents of fine particles were obtained by carrying out the variable head permeability test in the laboratory. The results are shown in Figure 7. It can be concluded that the permeability coefficients of the samples increased with the fine particle content. In particular, when the fine particle content of the sample increased from 5% to 20%, the permeability coefficient of the sample decreased significantly, from 0.01623 cm/s to 0.00096 cm/s, with a decrease of 94%. However, when the fine particle content of the sample increased beyond 20%, the decrease in the permeability coefficient of the sample was not obvious. This further indicated that fine particles could be embedded between coarse particles, resulting in a reduction in the large pores between particles and a decrease in the permeability coefficient of the sample. When the fine particle content increased to a certain extent, the orebody essentially became one continuous mass. Macroscopically, it showed a significant decrease in the permeability coefficient. Combined with the results of the column leaching experiments (Section 3.1.1 and Section 3.1.2), it is obvious that the increase in fine particles could improve the leaching efficiency. This effect can be attributed to the increase in fine particle content causing a decrease in porosity and permeability of the sample, which made the infiltration of the leaching solution more uniform and reduce the blind leaching area. However, when the fine particle content was too high, the permeability of the orebody was very poor, which greatly prolonged the leaching time. This would undoubtedly increase the cost of mining. Therefore, when considering the actual mining effect, an infinitely high fine particle content was not optimal.

4. Conclusions

In this study, continuously graded rare earth ores with different contents of fine particles were reconstituted based on the grading of a rare earth raw ore, and column leaching experiments were performed to study the effect of fine particle content on the mass transfer during the leaching process. Subsequently, combined with the height tests of capillary rise and variable head permeability tests, the effect of fine particle content on the permeability of the orebody was investigated. The main conclusions are as follows:
(1)
With the increasing content of fine particles, the time for peak rare earth concentration of the leachate was prolonged, and the peak was increased. When the fine particle content exceeded 20%, all ion-exchangeable-phase rare earth ions could be replaced at a low dosage of the leaching solution. And the flow rate of the leachate showed a multi-stage change, which was affected by the combined effects solution permeation, ion exchange, and fluctuations in the height of accumulated liquid.
(2)
According to the plate theory, a higher fine particle content corresponded to a smaller H and a larger n, indicating that the increase in the fine particle content could improve the mass transfer of rare earth and promote the leaching process. When the fine particle content reached 25%, the H and n changed little with the increasing content of fine particles, which had little improvement in the leaching process.
(3)
In the height tests of capillary rise, the whole rising process could be divided into three stages: the rapid rise stage (0–60 min), the slow rise stage (60–300 min), and the steady rise stage (300–900 min). The capillary water eventually rose to a lower height as the fine particle content increased, and the rising rate varied across different stages for samples with different fine particle content.
(4)
The effect of fine particle content on the flow rate of leachate and the permeability coefficient of the sample was negative. When the proportion of fine particles was elevated from 5% to 20%, the permeability coefficient of the sample decreased from 0.01623 cm/s to 0.00096 cm/s, with a decrease of 94%. But when the fine particle content of the sample increased beyond 20%, the decrease in the permeability coefficient was not obvious.
(5)
The increase in fine particle content could improve leaching efficiency, which could be attributed to the decrease in porosity and permeability of the sample, making the infiltration of the leaching solution more uniform and reducing the blind leaching area. According to the results of this study and the actual conditions of ion-adsorption-type rare earth ores, the optimal fine particle content of the ore is 20%. Under this condition, rare earth leaching has the greatest effectiveness.

Supplementary Materials

The following supporting information can be downloaded at: https://www.mdpi.com/article/10.3390/min14090879/s1, Figure S1: Particle size distribution curve of recombinant rare earth ores; Figure S2: Rare earth concentration of samples with different fine particle contents; Figure S3: Rising height of capillary water over different time periods; Figure S4: Rising rate of capillary water over different time periods; Table S1: Weight of ore particle with each single grading for sample preparation of the column leaching experiments; Table S2: Weight of ore particle with each single grading for sample preparation of the height test of capillary rise; Table S3: Weight of ore particle with each single grading for sample preparation of the variable head permeability test; Table S4: Total content of ion-exchangeable phase rare earth in the rare earth ores with single particle size (expressed as oxides).

Author Contributions

L.Z.: Conceptualization, Methodology, Formal analysis, Data curation, Writing—original draft. S.K., G.S., Y.D., H.Z. and J.X.: Conceptualization, Resources, Project administration, Validation. X.W.: Formal analysis, Writing—Review and editing, Funding acquisition. H.Y.: Conceptualization, Methodology, Formal analysis, Writing—Review and editing, Funding acquisition, Supervision. All authors have read and agreed to the published version of the manuscript.

Funding

This research was funded by the National Natural Science Foundation of China (52174113); the Central Ministry of Ecology and Environment Central Action Plan for Water Pollution Prevention and Control; the Self-deployed Projects of Ganjiang Innovation Academy, Chinese Academy of Sciences (E055A001 and E055A002); the Key Research Programs of the Chinese Academy of Sciences (ZDRW-CN-2021-3).

Data Availability Statement

The data that support the findings of this study are available from the corresponding author upon reasonable request.

Conflicts of Interest

The authors declare that they have no known competing financial interests or personal relationships that could have appeared to influence the work reported in this paper.

References

  1. Ji, L.Q.; Chen, M.X.; Gu, H.; Zhao, J.H.; Yang, X. Actuality of light rare earth resources and application in field of new energy vehicles. J. Chin. Soc. Rare Earths 2020, 38, 129–138. (In Chinese) [Google Scholar]
  2. Liu, T.C.; Chen, J. Extraction and separation of heavy rare earth elements: A review. Sep. Purif. Technol. 2021, 276, 119263. [Google Scholar] [CrossRef]
  3. Zhang, S.; Saji, S.E.; Yin, Z.Y.; Zhang, H.B.; Du, Y.P.; Yan, C.H. Rare-earth incorporated alloy catalysts: Synthesis, properties, and applications. Adv. Mater. 2021, 33, 2005988. [Google Scholar] [CrossRef]
  4. Zhou, B.L.; Li, Z.X.; Chen, C.C. Global potential of rare earth resources and rare earth demand from clean technologies. Minerals 2017, 7, 203. [Google Scholar] [CrossRef]
  5. Zheng, G.D.; Wang, K.; Chen, Q.S.; Zhang, Y.F.; Xing, J.Y.; Long, T.; Dong, Y.T.; Ni, J.P. The change of world rare earth industrial structure and the problems faced by China’s rare earth industry. Acta. Geol. Sin. 2021, 42, 265–272. (In Chinese) [Google Scholar]
  6. Yan, D.R.; Ro, S.; Sunam, O.; Kim, S. On the global rare earth elements utilization and its supply-demand in the future. IOP Conf. Ser. Earth Environ. Sci. 2020, 508, 012084. [Google Scholar] [CrossRef]
  7. Feng, J.; Zhou, F.; Chi, R.A.; Liu, X.; Xu, Y.L.; Liu, Q. Effect of a novel compound on leaching process of weathered crust elution deposited rare earth ore. Miner. Eng. 2018, 129, 63–70. [Google Scholar] [CrossRef]
  8. Li, Y.H.M.; Zhao, W.W.; Zhou, M.F. Nature of parent rocks, mineralization styles and ore genesis of regolith-hosted REE deposits in South China: An integrated genetic model. J. Asian Earth Sci. 2017, 148, 65–95. [Google Scholar] [CrossRef]
  9. Chen, X.; He, Q.; Chen, J.F.; Huang, L.; Tan, C.M.; Yin, Y.Q.; Jiao, Y.F.; Xiao, Y.F. Development of leaching technology and theory of ion-adsorption type rare earth ore. J. Chin. Soc. Rare Earths 2022, 40, 936–947. (In Chinese) [Google Scholar]
  10. Deng, Z.X.; Qin, L.; Wang, G.S.; Luo, S.H.; Peng, C.L.; Li, Q. Metallogenic process of ion adsorption REE ore based on the occurrence regularity of La in kaolin. Ore Geol. Rev. 2019, 112, 103022. [Google Scholar] [CrossRef]
  11. Li, F.J.; Xiao, Z.; Zeng, J.Y.; Chen, J.Q.; Sun, X.Q. Recovery of REEs from leaching liquor of ion-adsorbed-type rare earths ores using ionic liquid based on cooking oil. Hydrometallurgy 2020, 196, 105449. [Google Scholar] [CrossRef]
  12. Zhou, L.B.; Yang, J.; Kang, S.J.; Wang, X.J.; Yu, H.D.; Wan, Y.H. Enhancing leaching efficiency of ion adsorption rare earths by ameliorating mass transfer effect of rare earth ions by applying an electric field. J. Rare Earths 2024, 42, 172–180. [Google Scholar] [CrossRef]
  13. Yang, L.F.; Wang, D.S.; Li, C.C.; Sun, Y.Y.; Zhou, X.Z.; Li, Y.X. Searching for a high efficiency and environmental benign reagent to leach ion-adsorption rare earths based on the zeta potential of clay particles. Green Chem. 2018, 20, 4528–4536. [Google Scholar] [CrossRef]
  14. Li, C. The generalization and application of new technology on lixiviating mineral at the original Place for ionic rare earths nonferrous metals science and engineering. Non-Ferr. Met. Sci. Eng. 2011, 2, 63–67. (In Chinese) [Google Scholar]
  15. Huang, X.W.; Long, Z.Q.; Wang, L.S.; Feng, Z.Y. Technology development for rare earth cleaner hydrometallurgy in China. Rare Mets. 2015, 34, 215–222. [Google Scholar] [CrossRef]
  16. Zhou, F.; Liu, Q.; Feng, J.; Su, J.X.; Liu, X.; Chi, R.A. Role of initial moisture content on the leaching process of weathered crust elution-deposited rare earth ores. Sep. Purif. Technol. 2019, 217, 24–30. [Google Scholar] [CrossRef]
  17. Li, M.Y.H.; Zhou, M.F. The role of clay minerals in formation of the regolith-hosted heavy rare earth element deposits. Am. Miner. 2020, 105, 92–108. [Google Scholar] [CrossRef]
  18. Tian, J.; Yin, J.Q.; Chi, R.A.; Rao, G.H.; Jiang, M.T.; Ouyang, K.X. Kinetics on leaching rare earth from the weathered crust elution-deposited rare earth ores with ammonium sulfate solution. Hydrometallurgy 2010, 101, 166–170. [Google Scholar]
  19. Lee, T.K.; Ro, H.M. Estimating soil water retention function from its particle-size distribution. Geosci. J. 2014, 18, 219–230. [Google Scholar] [CrossRef]
  20. Xie, F.F.; Wang, G.S.; Wen, T. Discussion on reasons for difference of ionic phase rare earth grade distribution in different grain size fractions. Chin. J. Nonferr. Met. 2023, 33, 1672–1681. (In Chinese) [Google Scholar]
  21. Luo, S.H.; Luo, T.; Wang, G.S.; Liu, J.; Hu, S.L.; Zhu, D.M. Effect of heterogeneity of leaching solution on leaching rate in ionic rare earth ore body. Soils 2018, 50, 421–427. (In Chinese) [Google Scholar]
  22. Tian, J.; Yin, J.Q.; Tang, X.K.; Chen, J.; Luo, X.P.; Rao, G.H. Enhanced leaching process of a low-grade weathered crust elution-deposited rare earth ore with carboxymethyl sesbania gum. Hydrometallurgy 2013, 139, 124–131. [Google Scholar] [CrossRef]
  23. Luo, X.P.; Zhang, Y.B.; Zhou, H.P.; He, K.Z.; Zhang, B.Y.; Zhang, D.M.; Xiao, W.J. Pore structure characterization and seepage analysis of ionic rare earth orebodies based on computed tomography images. Int. J. Min. Sci. Technol. 2022, 32, 411–421. [Google Scholar] [CrossRef]
  24. Wang, M.Z.; Long, P.; Hu, S.L.; Wang, G.S.; Luo, S.H.; Hong, B.G. An estimation method for spatial permeability distribution of the ion-adsorption type rare earth ore body. Non-Ferr. Met. Sci. Eng. 2023, 14, 280–287. (In Chinese) [Google Scholar]
  25. Yin, S.H.; Qi, Y.; Xie, F.F.; Chen, X.; Wang, L.M. Permeability characteristic of weathered crust elution-deposited rare earth ores under different pore structures. Chin. J. Nonferrous Met. 2018, 28, 1043–1049. (In Chinese) [Google Scholar]
  26. Guo, Z.Q.; Lai, Y.M.; Jin, J.F.; Zhou, J.R.; Zhao, K.; Sun, Z. Effect of particle size and grain composition on two-dimensional infiltration process of weathered crust elution-deposited rare earth ores. Trans. Nonferrous Met. Soc. China 2020, 30, 1647–1661. [Google Scholar] [CrossRef]
  27. Zou, H.L.; Zhang, Z.Y.; Chen, Z.; Liu, D.F.; Chai, X.W.; Zhang, H.; Chi, R.A. Seepage process on weathered crust elution-deposited rare earth ores with ammonium carboxylate solution. Physicochem. Probl. Miner. Process. 2020, 56, 90–102. [Google Scholar]
  28. Liu, D.F.; Zhang, Z.Y.; Chi, R.A. Seepage mechanism during in-situ leaching process of weathered crust elution-deposited rare earth ores with magnesium salt. Physicochem. Probl. Miner. Process. 2020, 56, 349–361. [Google Scholar] [CrossRef]
  29. Wu, K.X.; Zhang, L.; Zhu, P.; Chen, L.K.; Tian, Z.F.; Xing, X.Y. Research on particle size distribution and its variation of ion-adsorption type rare earth ore. Chin. Rare Earths 2016, 37, 67–74. (In Chinese) [Google Scholar]
  30. Wei, D.D.; Wang, H.N.; Yang, Z.Z. Experimental research on the leaching of ionic rare earth ore with weak permeability. Min. Res. Dev. 2016, 36, 55–58. (In Chinese) [Google Scholar]
  31. Zhang, Q.; Zhang, Z.Y.; Liu, D.F.; Guo, W.D.; Yan, W.X. Analysis of influencing factors and model construction of electrical resistivity of weathered crust elution-deposited rare earth ore. Nonferr. Met. Eng. 2023, 13, 55–65. (In Chinese) [Google Scholar]
  32. Zhou, L.B.; Kang, S.J.; Yang, J.; Wang, X.J.; Yu, H.D.; Wan, Y.H. Effect of particle size on the leaching of a weathered crust elution-deposited rare earth ore. Hydrometallurgy 2023, 222, 106200. [Google Scholar] [CrossRef]
  33. GB/T 50123-2019; Standard for Geotechnical Testing Method. China Planning Press: Beijing, China, 2019. Available online: https://www.mohurd.gov.cn/gongkai/zhengce/zhengcefilelib/201908/20190801_241309.html (accessed on 21 July 2024).
Figure 1. Weight percentage of different single-particle-size ores in the recombinant rare earth ores.
Minerals 14 00879 g001
Figure 2. Schematic diagram of the experimental process. (a,b) sample preparation; (ce) experimental samples; (f) column leaching experiment; (g) rare earth concentration test; (h) height test of capillary rise; (i) variable head permeability test.
Minerals 14 00879 g002
Figure 3. The mass of rare earth and leaching efficiency of samples with different fine particle contents at different solid–liquid ratios: (a) CG-S1; (b) CG-S2; (c) CG-S3; (d) CG-S4; (e) CG-S5; (f) CG-S6; (g) CG-S7.
Minerals 14 00879 g003
Figure 4. Rare earth concentration of samples with different fine particle contents.
Minerals 14 00879 g004
Figure 5. Flow rate of rare earth leachate of samples: (a) accumulated flow velocity; (b) flow velocity of each leaching cycle.
Minerals 14 00879 g005
Figure 6. Rising height and rising rate of capillary water. (a) rising height; (b) rising rate.
Minerals 14 00879 g006
Figure 7. Permeability coefficients of the samples with different fine particle contents.
Minerals 14 00879 g007
Table 1. Physical parameters of the rare earth raw ores.
Parameter
Type
Ore Grade
(%)
Bulk Density
(g/cm3)
Dry Density
(g/cm3)
Moisture Content
(%)
Specific Density
Value0.041.541.3613.002.66
Table 2. Total content and partitioning of ion-exchangeable-phase rare earth in the rare earth raw ores (expressed as oxides).
REO TypeLa2O3CeO2Pr6O11Nd2O3Sm2O3Eu2O3Gd2O3Tb4O7
Value (%)21.5230.855.1419.583.660.503.300.42
REO typeDy2O3Ho2O3Er2O3Tm2O3Yb2O3Lu2O3Y2O3REO
Value (%)2.270.370.98<0.200.75<0.209.950.042
Table 3. Properties of recombinant rare earth ores.
SampleCG-S1CG-S2CG-S3CG-S4CG-S5CG-S6CG-S7
Fine particle content5.0010.0015.0020.0025.0030.0035.00
Ore grade (%)0.0480.0500.0530.0590.0640.0690.070
d50 (mm)1.551.341.140.970.830.690.56
Cu13.4328.4548.8475.5297.11109.75111.91
Cc1.041.832.372.631.970.400.42
Table 4. Theoretical plate number and related parameters of rare earth leaching with different fine particle contents.
SampleFine Particle Content (%)Column
Height (mm)
Retention Volume (mL)Half Peak
Height Width (mL)
Theoretical
Plate Number
Plate Height (mm)
CG-S158063.0894.572.4732.43
CG-S2108062.5092.852.5131.84
CG-S3158063.5380.113.4922.94
CG-S4208077.5685.154.6017.38
CG-S5258075.8671.546.2412.83
CG-S6308072.3867.896.3012.69
CG-S7358069.9863.986.6312.06
Disclaimer/Publisher’s Note: The statements, opinions and data contained in all publications are solely those of the individual author(s) and contributor(s) and not of MDPI and/or the editor(s). MDPI and/or the editor(s) disclaim responsibility for any injury to people or property resulting from any ideas, methods, instructions or products referred to in the content.

