Article

Effect of Gas Dispersion Properties and Bias in Scheelite Column Flotation

Department of Advanced Energy Engineering, Chosun University, Gwangju 61452, Republic of Korea
*
Author to whom correspondence should be addressed.
Minerals 2024, 14(9), 881; https://doi.org/10.3390/min14090881
Submission received: 31 July 2024 / Revised: 26 August 2024 / Accepted: 27 August 2024 / Published: 29 August 2024

Abstract

:
In this study, column flotation was used to recover a high-grade concentrate from low-grade WO3 ore. Gas dispersion properties, such as superficial gas velocity, gas holdup, bubble size, bubble surface area flux, carrying rate, and bias, were investigated in two phases (gas–liquid) and three phases (gas–liquid–solid) in the column, and their effects on the grade and recovery of WO3. It was confirmed that the gas velocity significantly affected these factors, with the gas holdup, bubble size, bubble surface area flux, and carrying rate tending to increase as the gas velocity increased. The bias increased with an increase in the wash water velocity. The results showed that the grade and recovery of WO3 could be controlled within a specific range of operating conditions of bias (0.27–0.48 cm/s) and carrying rate (10.53–18.83 g/min/cm2). Correlation plots of grade/recovery versus bias and carrying rate revealed that the optimal separation achievable for a given WO3 concentrate in a flotation column was a 72.16% grade with a 78.3% recovery, satisfying the metallurgical requirement of more than 50% for WO3.

1. Introduction

Tungsten is used in various aerospace, electronics, materials, and medical fields due to its physicochemical properties, including compressibility, elastic modulus, and high chemical stability [1,2]. Among the various tungsten minerals, scheelite (CaWO4) is considered the most important tungsten resource, along with wolframite (FeWO4) [3]. However, high-grade wolframite resources have been exhausted due to the rapid development of industry and continuous consumption of mineral resources. This has led to increased attention on low-grade scheelite as a potential tungsten resource [4].
Scheelite coexists with calcite (CaCO3) and fluorite (CaF2), which can typically be separated through flotation. However, it is difficult to separate scheelite and calcium-containing minerals because they have similar solubility, hardness, and point of zero charge (PZC) [5,6]. Previous studies on the effective separation of scheelite have examined the effects of collectors such as oleic acid, alkyl sulfonates, fatty acids, depressants such as sodium silicate and fluorosilicate [7], and particle size [8], etc. The ore particle size is an important factor in flotation. Mineral particles with an average diameter of 150 µm can be effectively recovered by flotation, whereas fine (−37 µm) or ultrafine (−10 µm) particles are difficult to separate by flotation because of their small mass, large surface charge, and high surface energy [9,10].
In contrast, column flotation has been effective in recovering fine particles, as it has many advantages over conventional flotation. These advantages include less turbulence in the pulp, a deep froth bed, and the use of wash water to drain back the entrained gangue. Huang et al. (2010) compared the efficiency of scheelite recovery using conventional and column flotation. The WO3 grade improved from 24.52% to 43.41%, with a recovery of 70.81% [11]. Column flotation has been suggested to be more effective than conventional flotation under the same operating conditions with respect to grade and recovery. Sobhy and Tao (2013) confirmed that the recovery of coal below −150 µm increased by 5~50% using column flotation [12]. Peng and Xiong (2015) reported that column flotation is more effective for the flotation performance of fine (−37 µm) or ultra-fine particles (−10 µm) [13]. Therefore, column flotation, which is highly brittle and generates fine particles during crushing, is required to recover scheelite effectively.
The performance of column flotation depends on gas dispersion properties such as gas velocity, gas holdup, bubble size, bubble surface area flux, carrying rate, and bias, a parameter directly related to the selectivity of the flotation. Therefore, it is important to accurately predict the effects of the operating parameters that control the flow behavior in column flotation. The gas holdup is defined as the fraction occupied by gas bubbles in the total volume of the mixture (gas, liquid, and solids) in a column. Finch and Dobby (1990) reported that the gas holdup is affected by the bubble size distribution, wash water and gas velocities, characteristics of the particles, and pulp density [14]. The bubble surface area flux is the total surface area of the bubbles passing through a cross-sectional of the cell per unit of time. Finch et al. (2000) found that the relationship between bubble surface area flux and gas holdup is directly proportional and linear cross-sectional areas of the column and cell, as well as under various experimental conditions [15]. Bhunia et al. (2015) noticed that the bubble surface area flux increased as gas velocity and frother concentration increased but decreased with increasing wash water velocity [16].
The carrying rate refers to the number of bubbles transferred to the concentrate per unit cross-sectional area of the column per unit of time during the column flotation. The carrying rate is related to the solid particles, gas velocity, and bubble surface area flux, which are all factors affecting concentrate recovery. Bias is the factor affecting and is defined as the net water flow difference between the tailing and feed flows [17]. Generally, a positive bias is applied to fine particle flotation to prevent gangue mineral entrainment. However, a negative bias was observed for the column flotation of coarse particles. The bias affects the grade, concentration recovery, and residence time of ascending bubbles [18]. Few studies have applied column flotation and gas dispersion characteristics for the recovery of fine scheelite. Therefore, the gas dispersion properties, such as superficial gas velocity, gas holdup, bubble size, bubble surface area flux, carrying rate, and bias, were investigated in two phases (gas–liquid) and three phases (gas–liquid–solid) in the column, and their effects on the grade and recovery of WO3 were examined.

2. Materials and Methods
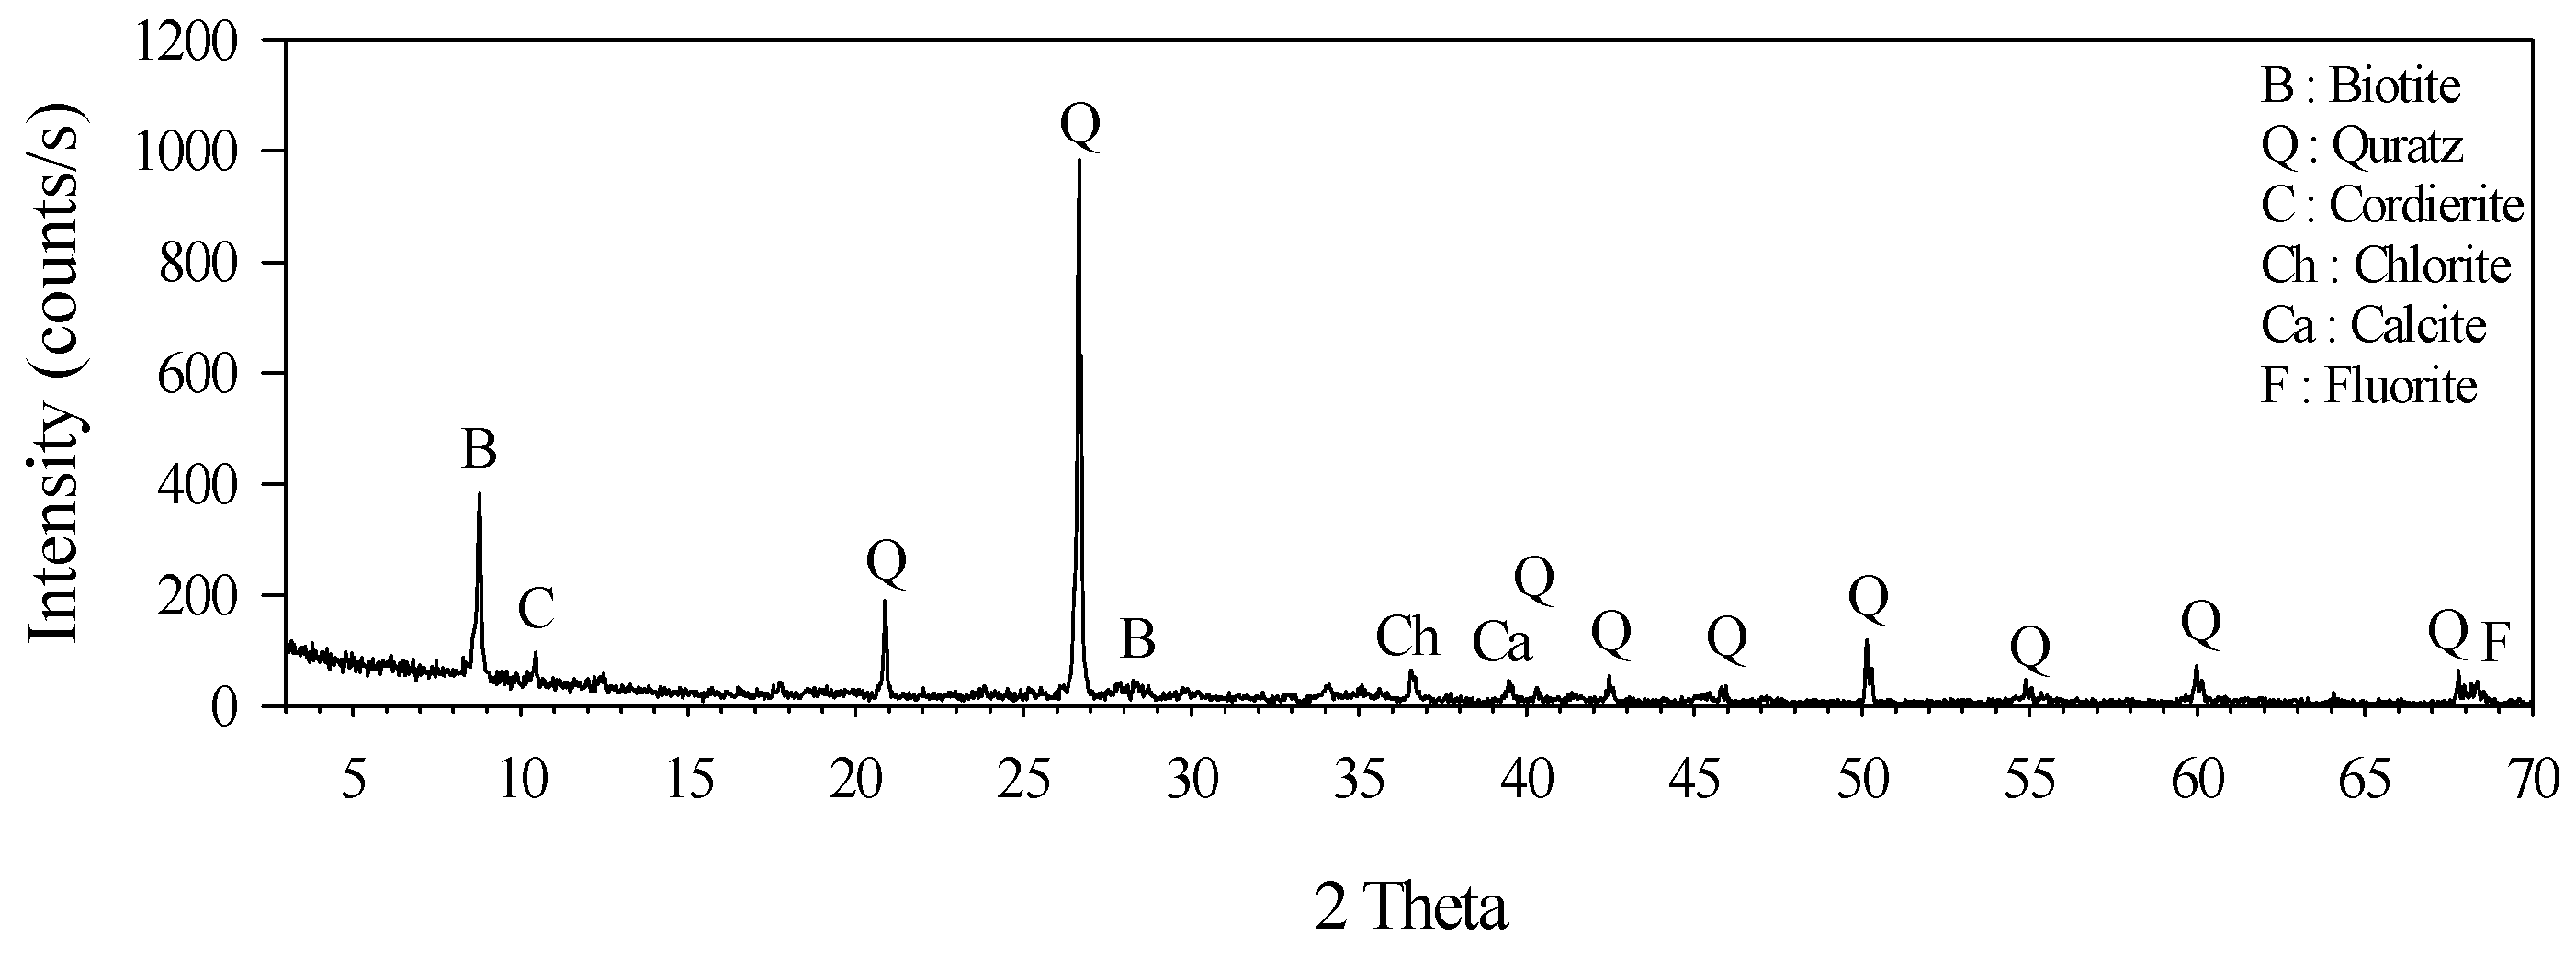
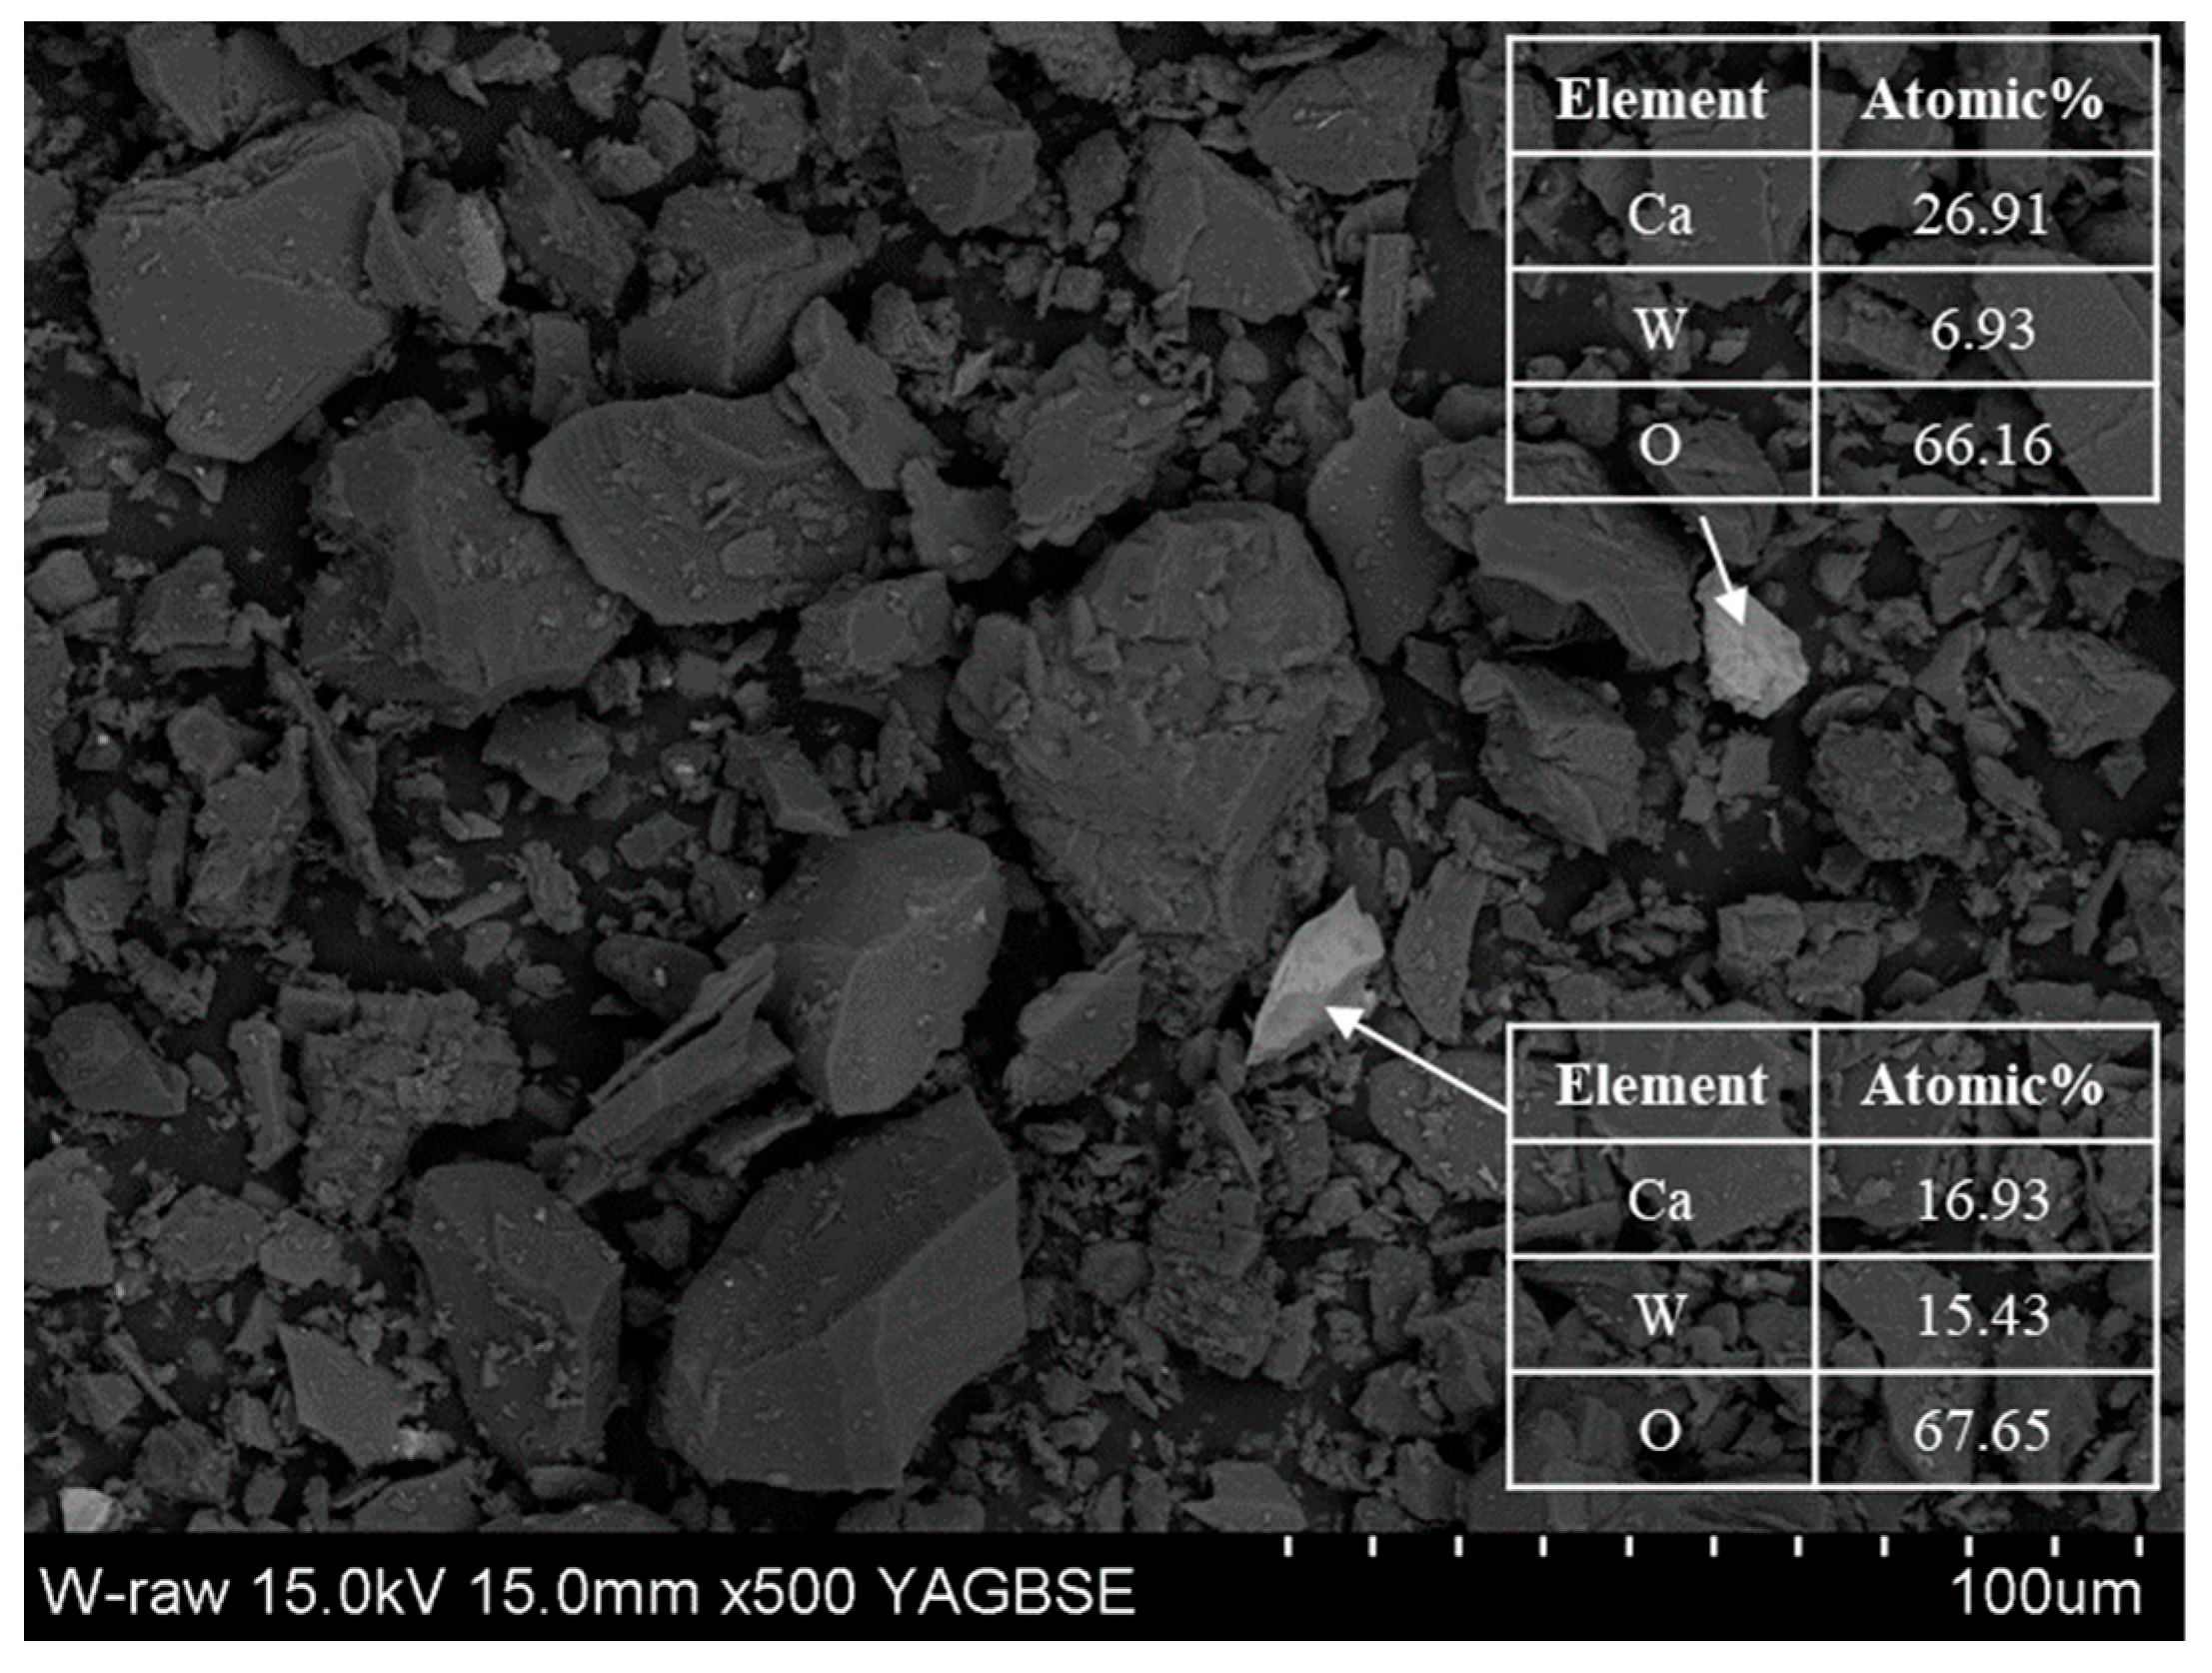
2.1. Materials

Raw ore samples used in this study were obtained from the Sangdong mine located in Korea. Table 1 lists the XRF results for the scheelite ore. The WO3 content of the raw ore was 0.37%; SiO2, Al2O3, and Fe2O3 contents were confirmed to be 53.44%, 2.35%, and 13.97%, respectively; and CaO content was found to be 9.42%. The gangue minerals in the raw ore were mostly composed of silicate and iron oxide minerals. In addition, the SO3 content expected from the presence of sulfide mineral was 0.91%. Figure 1 shows the results of the XRD analysis to confirm the source minerals of each element identified by the chemical composition. The main minerals detected were Ca and Si gangues, such as quartz (SiO2), calcite (CaCO3), and fluorite (CaF2). However, tungsten minerals below the XRD detection limit were not identified. Figure 2 shows the source minerals of the tungsten conducted using SEM-EDS. The source mineral of the tungsten was confirmed to be scheelite, and most of the identified tungsten particles were found to exist as relatively small particles compared to gangue minerals. The equipment used to determine the mineralogical characteristics of the sample was an X-ray fluorescence (XRF; S4 PIONEER, Bruker AXS, Karlsruhe, Germany), X-ray diffraction spectrometer (XRD; X’Pert Pro MRD, PANalytical, Almelo, The Netherlands) and scanning electron microscopy (SEM; FE-SEM, S4800, Hitachi, Tokyo, Japan)–energy dispersive spectroscopy (EDS; ISIS310, Jeol, Yamagata, Japan).

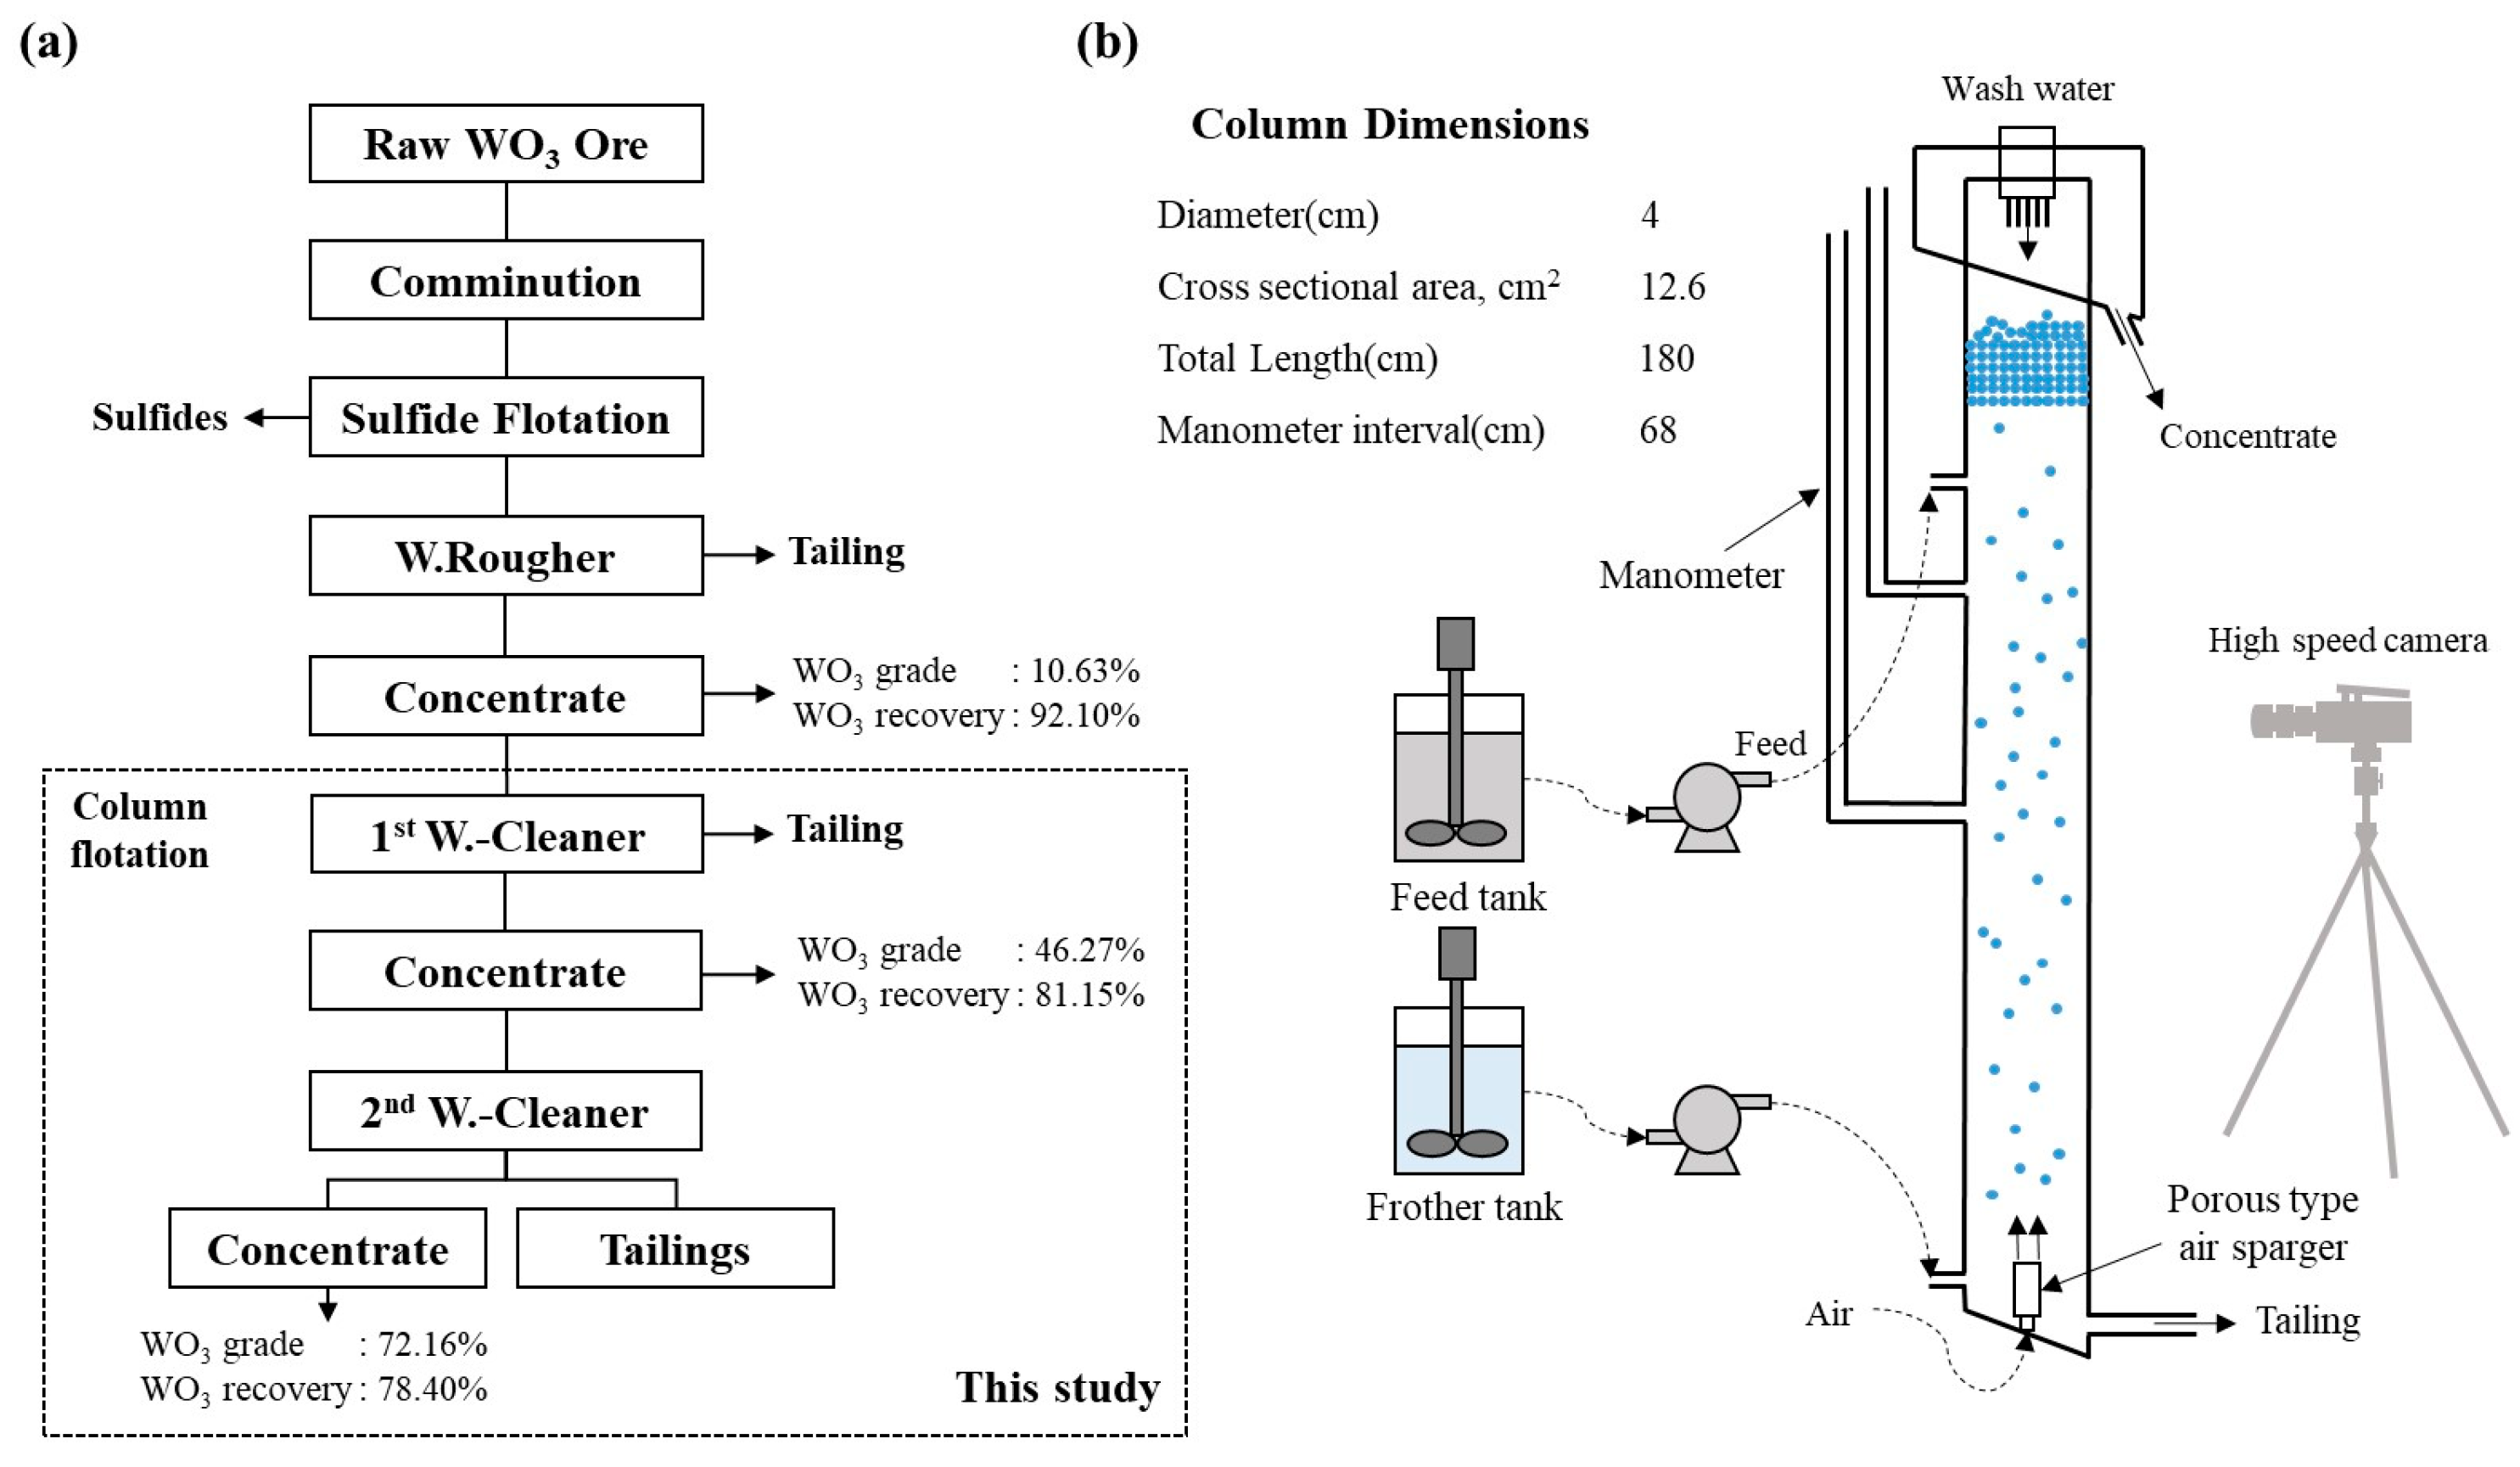
2.2. Equipment and Procedures

Figure 3a illustrates the flotation process used for scheelite recovery in this study. The scheelite ore sample was crushed and pulverized using a jaw crusher, cone crusher, and rod mill to obtain a sample with an average particle size (D50) of 58.9 µm. Sulfide flotation was performed to remove sulfide minerals that could decrease grade and recovery during scheelite recovery. The sink product from sulfide flotation was then subjected to rougher flotation to recover scheelite. Finally, the first cleaner and second cleaner flotation were performed on a rougher flotation concentrate using a flotation column.
First, 20% pulp density was added to the flotation cell of Denver–sub A by sulfide flotation, 150 g/t of potassium amyl xanthate (KAX) as a collector, and 50 g/t of methyl isobutyl carbinol (MIBC) as a frother were added at an impeller speed of 1200 rpm, and the suspension was allowed to react for 3 min. Subsequently, 4 L/min of air was injected to separate the sulfide minerals. Rougher scheelite flotation was achieved using a sink product for sulfide flotation. In this process, the impeller speed was set to 1200 rpm. Sodium carbonate (Na2CO3; 2000 g/t) as a pH modifier and sodium silicate (Na2SiO3; 3000 g/t) as a depressant were sequentially added and allowed to react for 3 min. After sequentially adding 300 g/t of oleic acid as a collector and 70 g/t of Lancropol K-8300 as a frother, respectively, the reaction was performed for 3 min, and then air was injected at 4 L/min to recover the scheelite concentrate. The reagents selected for sulfide and scheelite flotation are currently employed in the flotation plant. Lancropol K-8300, fatty acid sulfonate used as a frother can reduce the amount of oleic acid and has the advantage of bubble elasticity and retention.
Figure 3b shows a schematic of the column flotation equipment used in this study. The flotation column had a height of 180 cm, a diameter of 4 cm, and a cross-sectional area of 12.6 cm2. The feeder was positioned at one-third (1/3) of the column’s height from the top. Air was injected through a porous sparger with a pore size of 0.5 µm at the bottom of the column, and the flow rate was controlled using an airflow meter. Wash water was introduced at the top of the column, with its flow rate was controlled using a peristaltic pump. Two manometers for measuring gas hold-up within the column were installed at intervals of 68 cm. The bubbles in the column were measured using a high-speed camera (Mach-F340, Comart System, Seoul, Republic of Korea), and the bubble size was measured using the ZEISS image analysis program to obtain the average Sauter diameter based on measurements of over 100 bubbles.
The reagent conditions and column operating conditions for the first cleaner flotation were performed as follows: (1) solid concentration 2% (2) collector oleic acid 150 g/t (3) depressant sodium silicate 50 g/ton, (4) frother Lankropol-k8300 75 g/t, (5) gas velocity 0.37–0.61 cm/s, (6) wash water velocity 0.13–0.34 cm/s, (7) feed velocity 0.17 cm/s, (8) frother velocity 0.25 cm/s. The second flotation was performed on the first flotation concentrate by fixing the frother (Lankropol-k8300, 75 g/t) without adding additional reagents. The experiments were performed in duplicate, and the results were expressed as mean values.

2.3. Gas Dispersion Properties and Bias

The main operating conditions for the column flotation were determined based on the gas rate, wash water rate, and bubble size. The effects on scheelite grade and recovery were investigated. The gas holdup was measured using a manometer. Bubble size was measured using a high-speed camera and confirmed using the ZEISS image analysis program. To estimate the gas dispersion properties and bias of the column for scheelite recovery, the following factors were measured and calculated: (1) gas velocity, (2) gas hold-up, (3) bubble surface area flux, (4) carrying rate, and (5) bias.
The gas velocity (Jg) is the velocity at which the gas flows from the bottom of the column to the top. This speed is an important factor that affects several major factors in column flotation, such as bubble-particle collisions, bubble size, and column fluid dynamics. Additionally, gas velocity plays an important role in determining the efficiency and performance of column flotation. The gas velocity in the column was calculated using the following formula [14]:
J g = Q g A c
where Qg is the volumetric flow rate of the gas entering the column, and Ac is the cross-sectional area of the column.
Gas holdup (εg) is defined as the ratio of the column volume occupied by gas during column flotation. Gas hold-up affects particle-bubble attachment, the residence time and bubble stability in column flotation. It also provides an overall indication of the hydrodynamic conditions, as it depends on various factors such as frother type and concentration, sparger type, cell dimensions, operating pressure, and solid phase properties and concentration. The gas holdup was calculated using the following formula [14]:
ε g = Δ h Δ L
where Δh is the distance between two manometers, and ΔL is the difference in water level two manometers. In this study, the gas hold-up was installed by fixing the distance between the two manometers on the right side of the column to 68 cm and then measuring the water difference between the manometers according to the gas velocity.
The bubble surface area flux (Sb) is the total surface area of the bubbles passing through the cross-section of the cell per unit of time. It is commonly used to relate flotation rates with hydrodynamic variables. Under the conditions in which first-order flotation kinetics were applied, the flotation rate constant was claimed to be directly proportional to Sb. The bubble surface area flux was calculated as follows [14]:
S b = 6 J g d b
where Jg is gas velocity, and db is the Sauter mean bubble diameter.
The carrying rate (Cr) refers to the amount of solids (usually expressed as mass or volume) transferred to the concentrate by bubbles per unit cross-sectional area of the column per unit of time during column flotation. It is an important parameter for evaluating the capacity and performance of a column. The carrying rate can be calculated as follows [14]:
C r = π 2 d p ρ p J g d b
where dp is the particle size, ρp is the particle density, Jg is the gas velocity, and db is the Sauter mean bubble diameter.
The bias (JB) refers to the volumetric flow rate difference between the wash water added at the top of the column and the tailings from the bottom. Bias can be positive or negative depending on whether the wash water flow rate is higher or lower than the tailing flow rate, respectively. Positive bias can improve the grade of concentrate by reducing the entrainment of the gangue minerals into froth. Negative bias can increase recovery but often lead to lower concentrate grades due to increased entrainment. Bias was calculated using the following formula [14]:
J B = J CS + J T J F
where Jcs is the volumetric flow rate of solid reporting to the concentrate per unit column cross-sectional area, JT is the superficial flow rate of tailing, and JF is the superficial flow rate of feed. The bias factor is the parameter that is directly related to the selectivity of the flotation performance.

3. Results

3.1. Gas Dispersion Properties and Bias
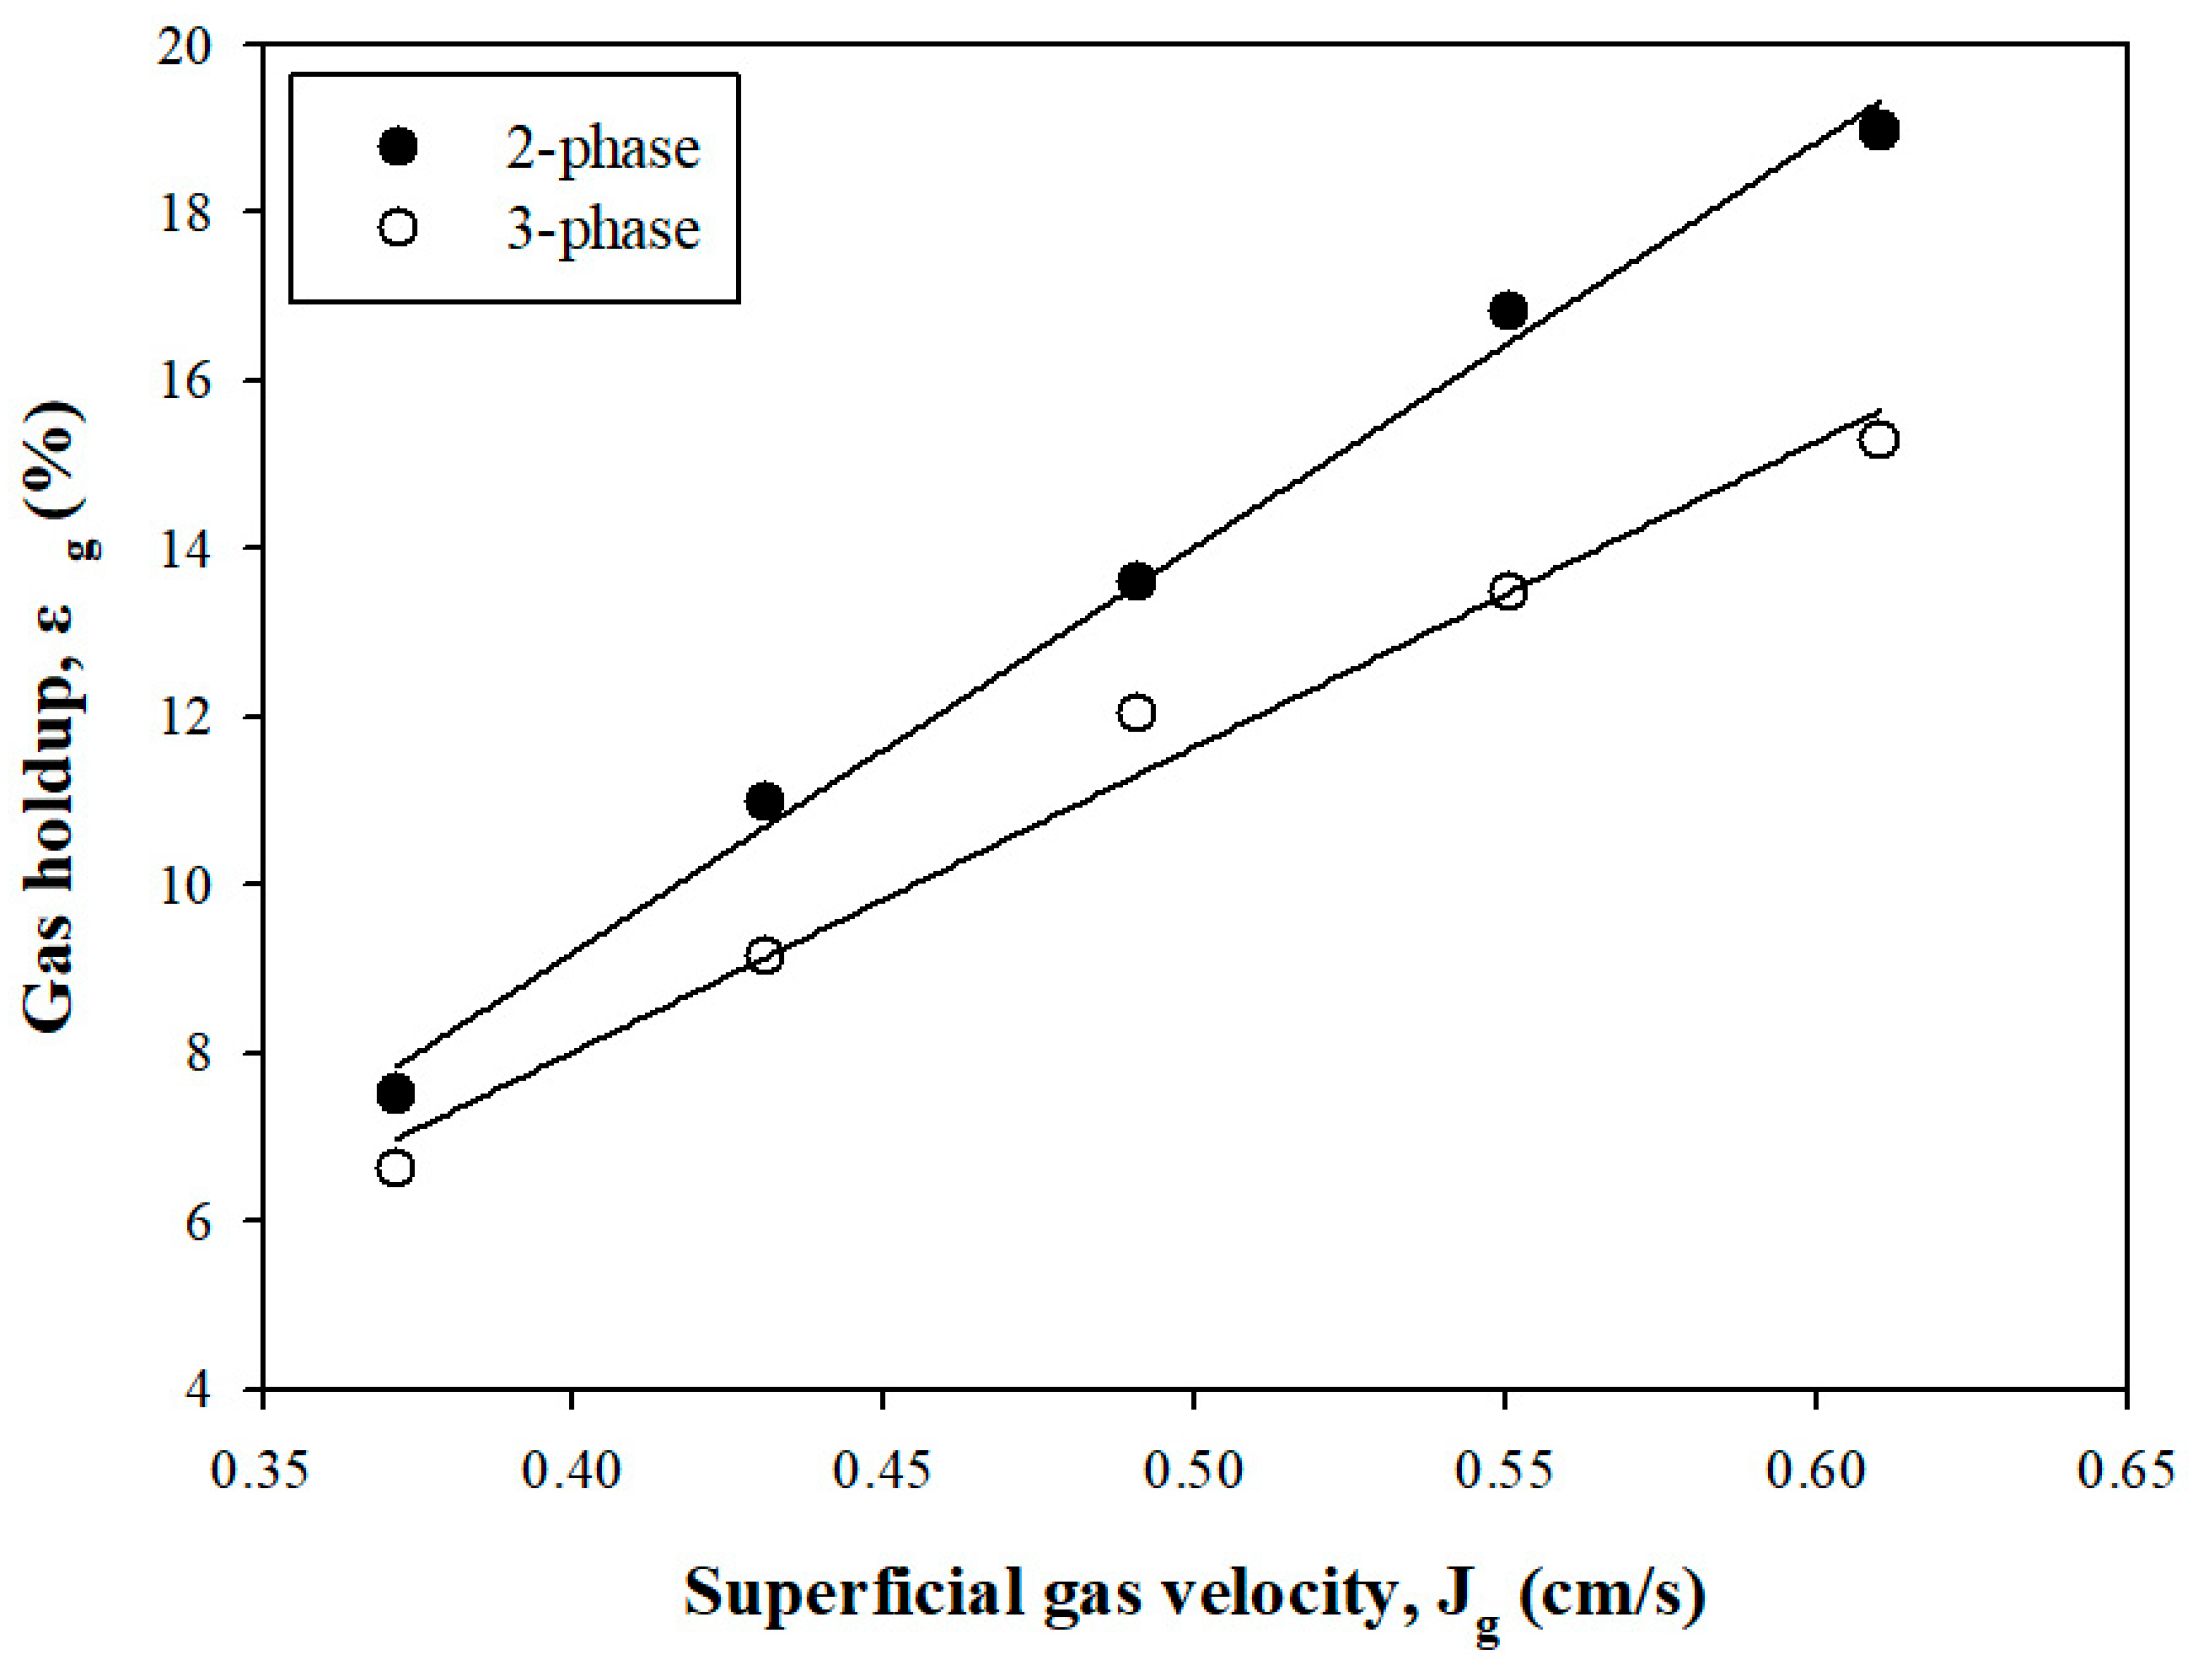
3.1.1. Gas Holdup

Figure 4 shows the variation in gas holdup in two phases and three phases as a function of the gas velocity (0.37–0.61 cm/s). The data show that the gas holdup increased as the gas velocity increased. The gas holdup in two phases and three phases were confirmed to be 7.50%–18.97% and 6.62%–15.29%, respectively, with three phases tending to be lower than two phases. Banisi et al. (1995) reported that solids onto bubbles in three phases decreased the gas holdup in the collection zone of the column [19]. Shukla et al. (2010) and Qiu et al. (1993) noted that hydrophobic particles influenced the gas holdup in the column, namely the presence of coal increased gas holdup with an increase in the frother concentration. However, the opposite effect was observed with an addition in the collector [20,21]. The decreasing gas holdup in three phases significantly may be due to the enhanced coalescence of small bubbles and the formation of larger bubbles by solid particles [22,23]. Thus, the gas holdup was directly proportional to the gas velocity, and the difference between the two phases and three phases is believed to be due to the presence of solid particles.

3.1.2. Bubble Size

Figure 5 shows the Sauter mean diameter (db) as a function of the gas velocity, showing that the diameter increases as gas velocity increases, which is expected. The increase in bubble size with increasing gas velocity may be due to the higher collision frequency, increased kinetic energy, and enhanced bubble coalescence owing to the effects of turbulence and shear forces [24]. Therefore, gas velocity is very important in the flotation process to balance the bubble size and ensure optimal separation efficiency. As the gas velocity increased, the bubble sizes of the two phases and three phases increased from 0.31 mm to 0.36 mm and from 0.32 mm to 0.41 mm, respectively. Additionally, the bubble size was larger in three phases than in two phases. It may be because the viscosity of the pulp increased as solid particles were added, resulting in bubble coalescence between the large and small bubbles [25,26]. Hence, bubble size as a function of gas velocity is considered an important factor in controlling the stability and efficiency of column flotation.

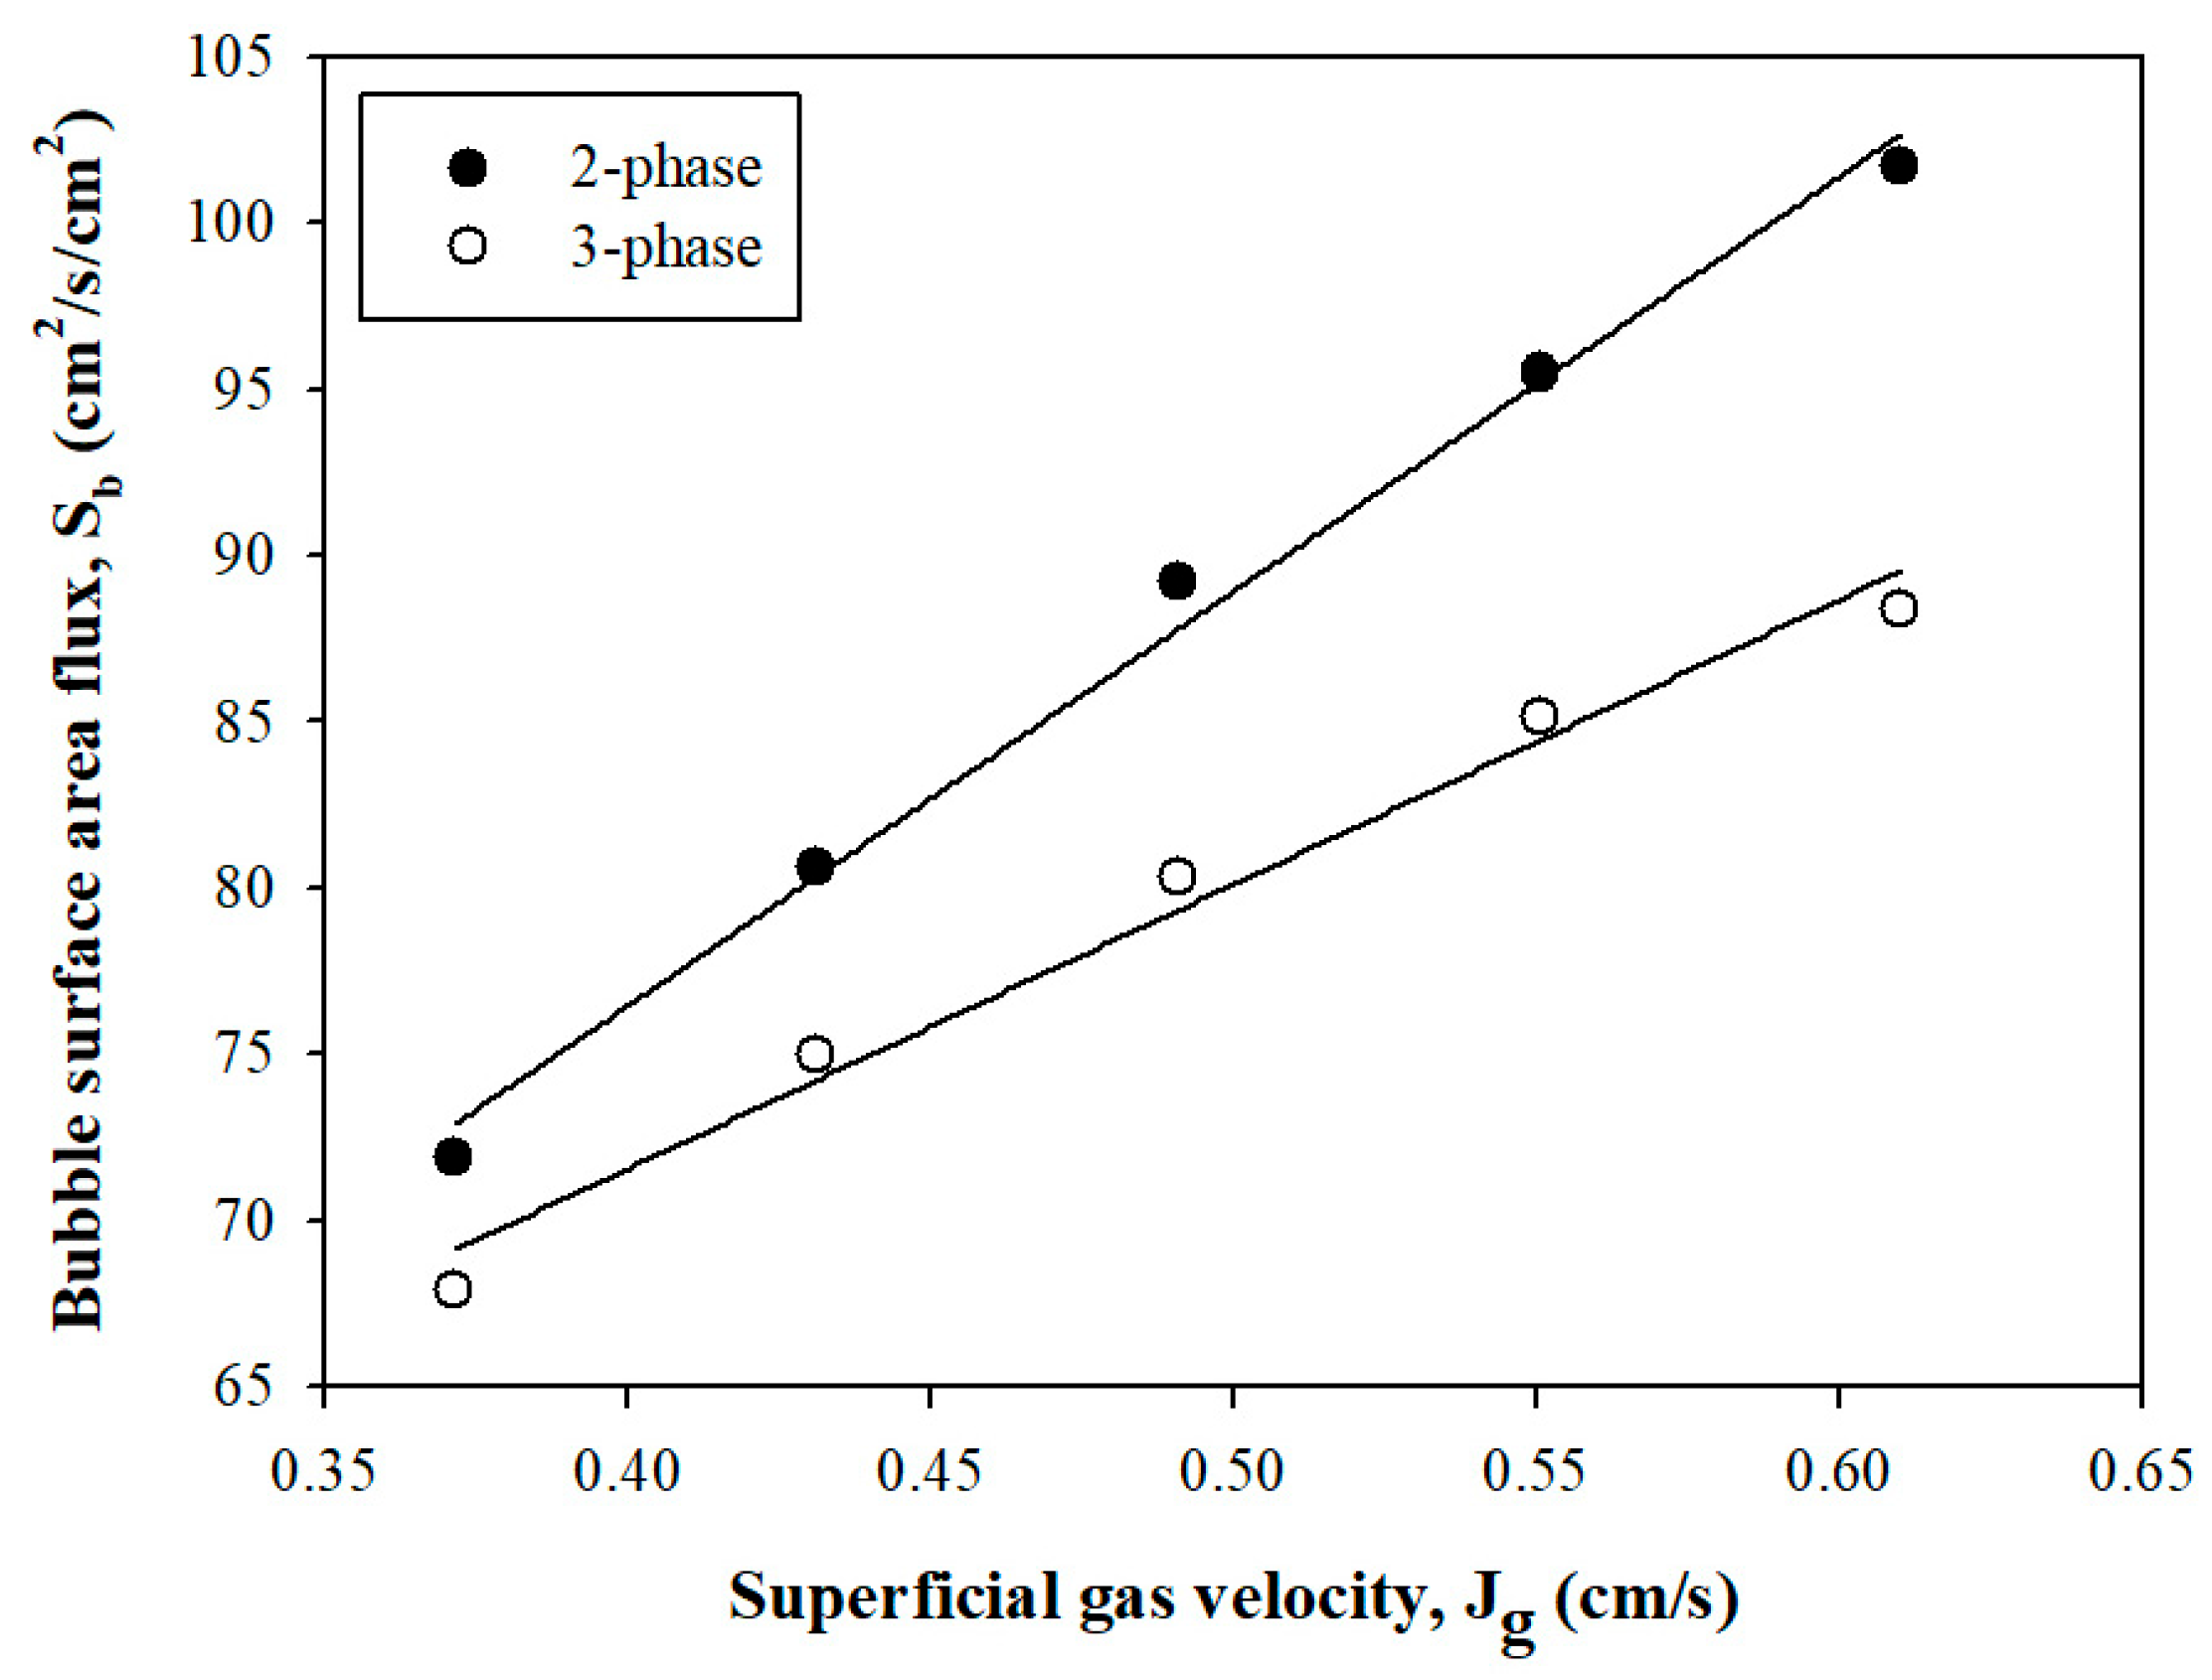
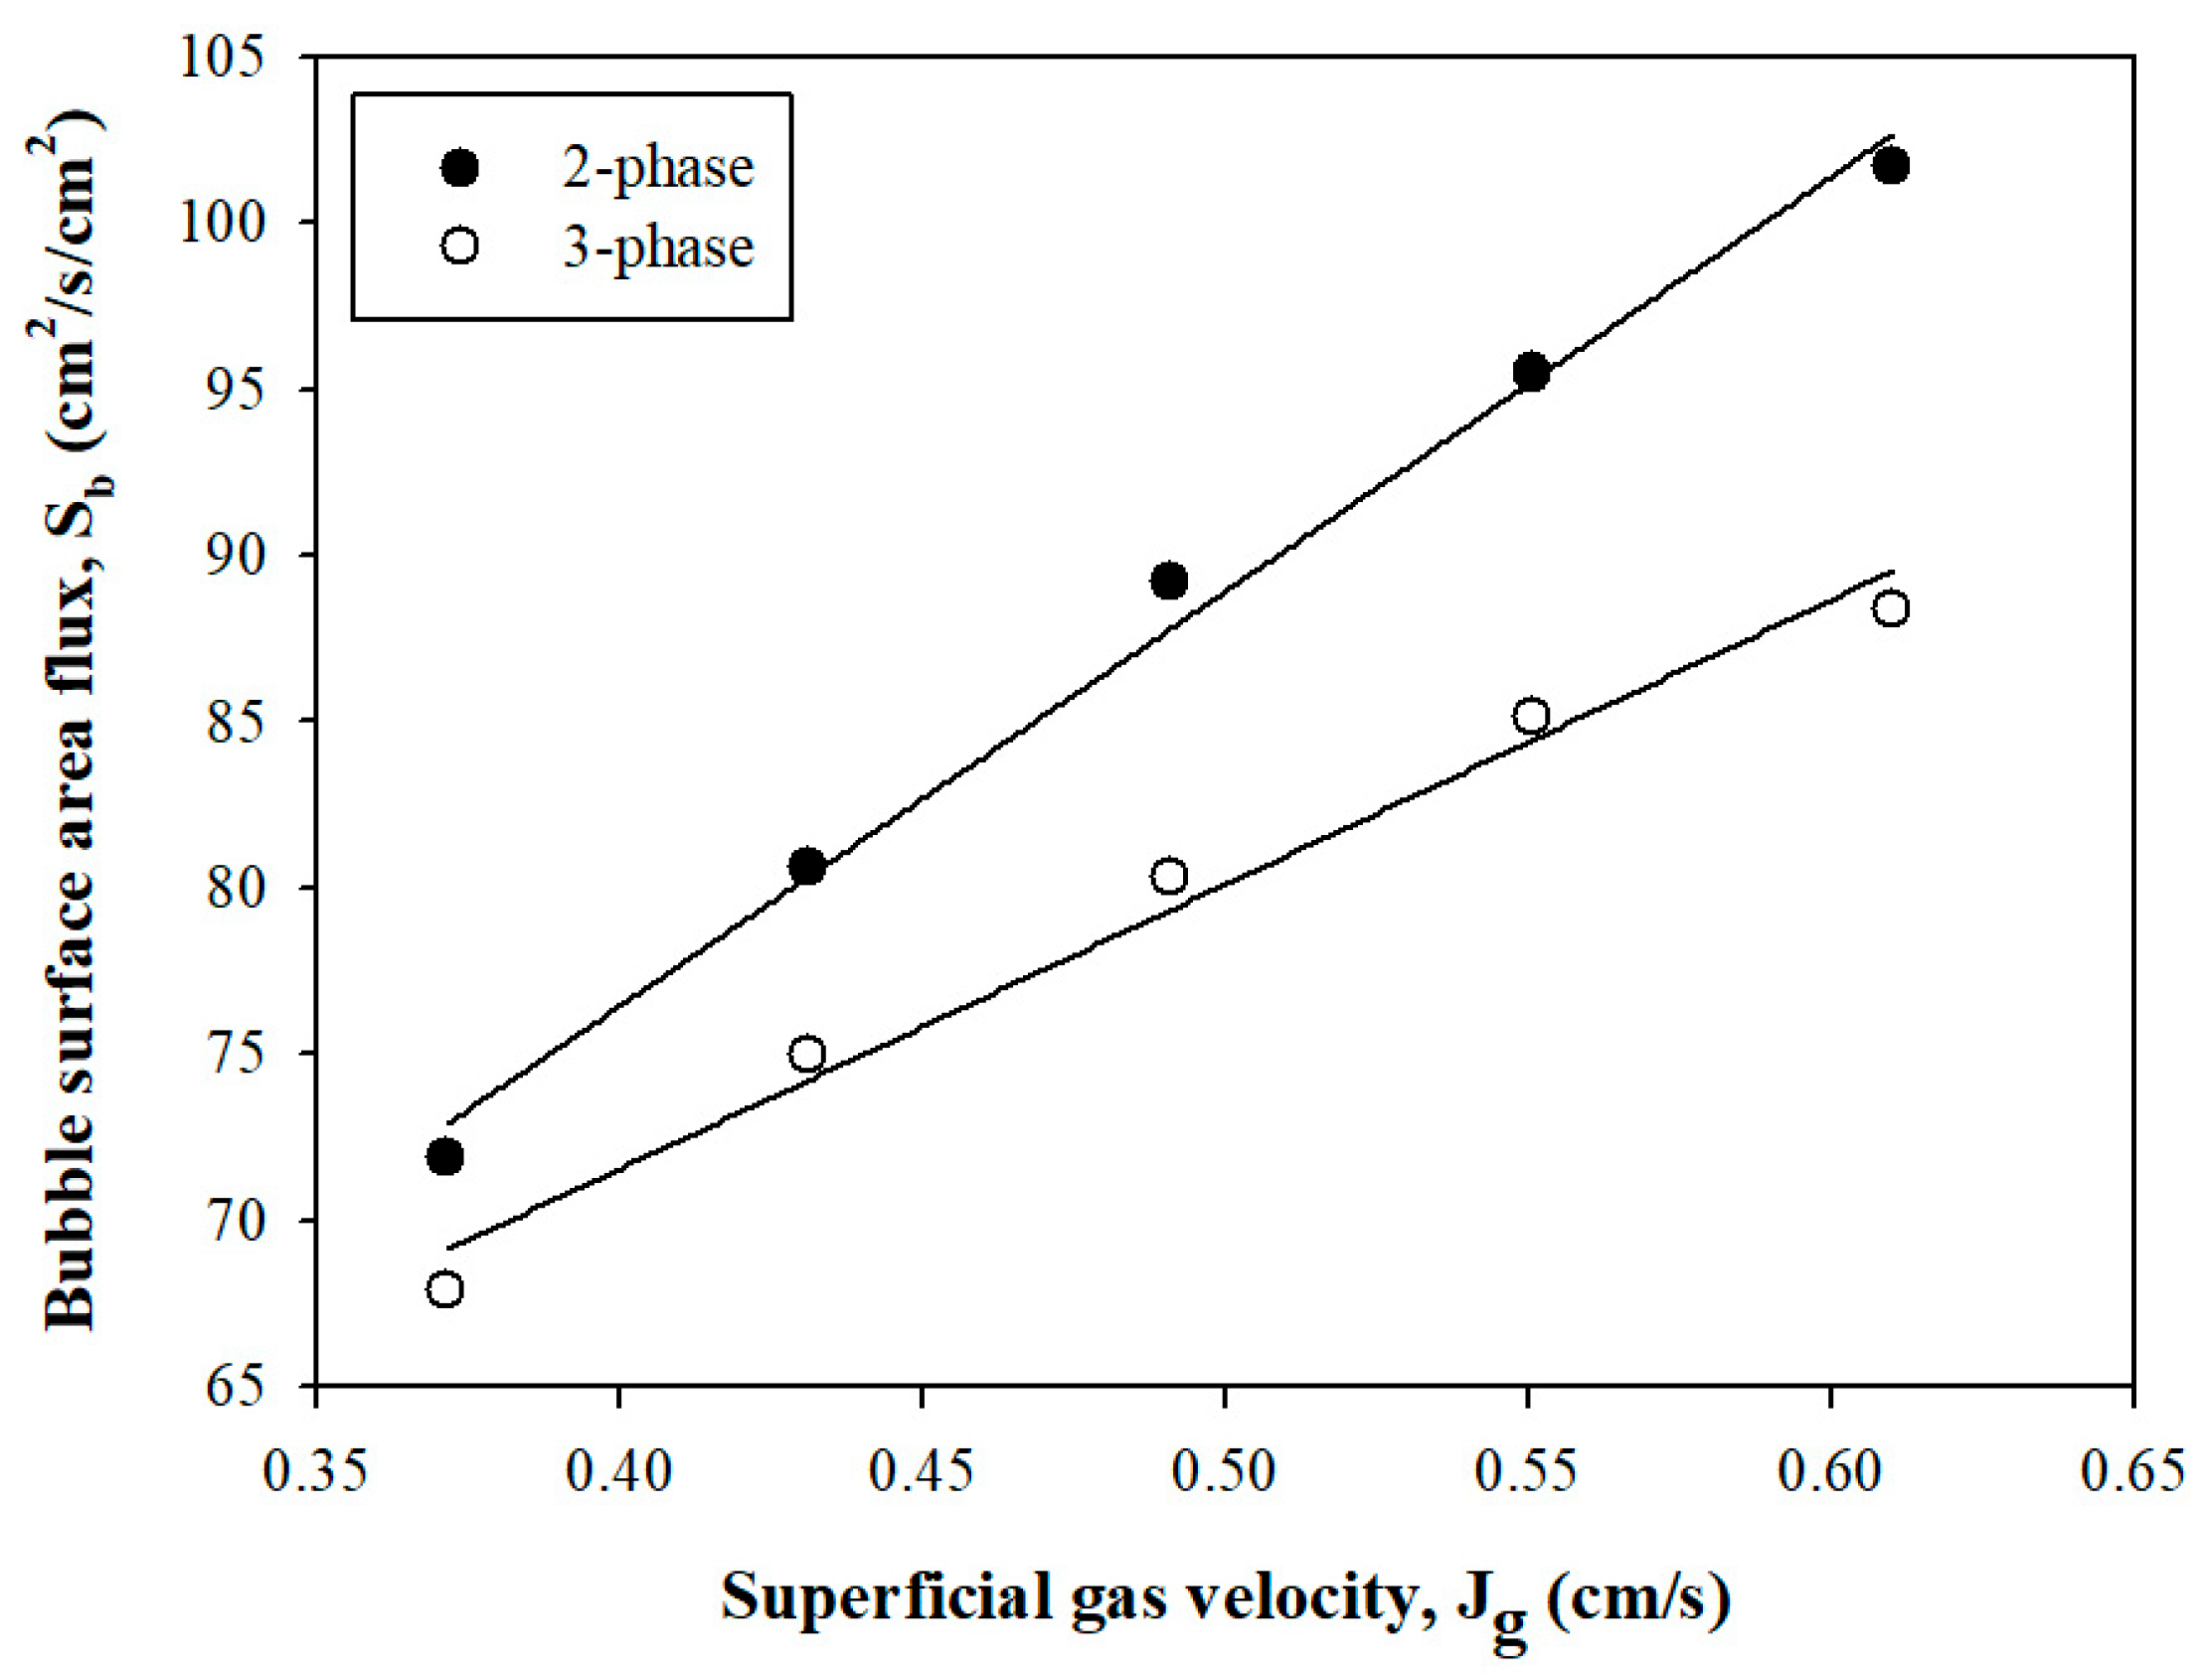
3.1.3. Bubble Surface Area Flux

The bubble surface area flux, which combines the effects of bubble size and gas velocity, is a key variable in flotation. It is related to the collision frequency between bubbles and particles and, consequently, to flotation performance [27]. Figure 6 shows the bubble surface area flux as a function of gas velocity in two phases and three phases. As the gas velocity increases, the bubble surface area flux increases linearly. The maximum bubble surface area flux was found to be 101.68 cm2/s/cm2 and 88.36 cm2/s/cm2 in two phases and three phases, respectively. In addition, when the gas velocity was constant, the bubble surface area flux decreased more in three phases than in two phases. It seems that the larger bubble size with increasing bubble coalescence and the slurry viscosity by solid particles led to an increase in the bubble surface area flux in three phases. Increasing gas velocity can lead to an increase in the number of bubbles and a decrease in bubble size due to a stronger bubble break-up [28,29]. Consequently, the bubble surface area flux tends to increase with increasing gas velocity.

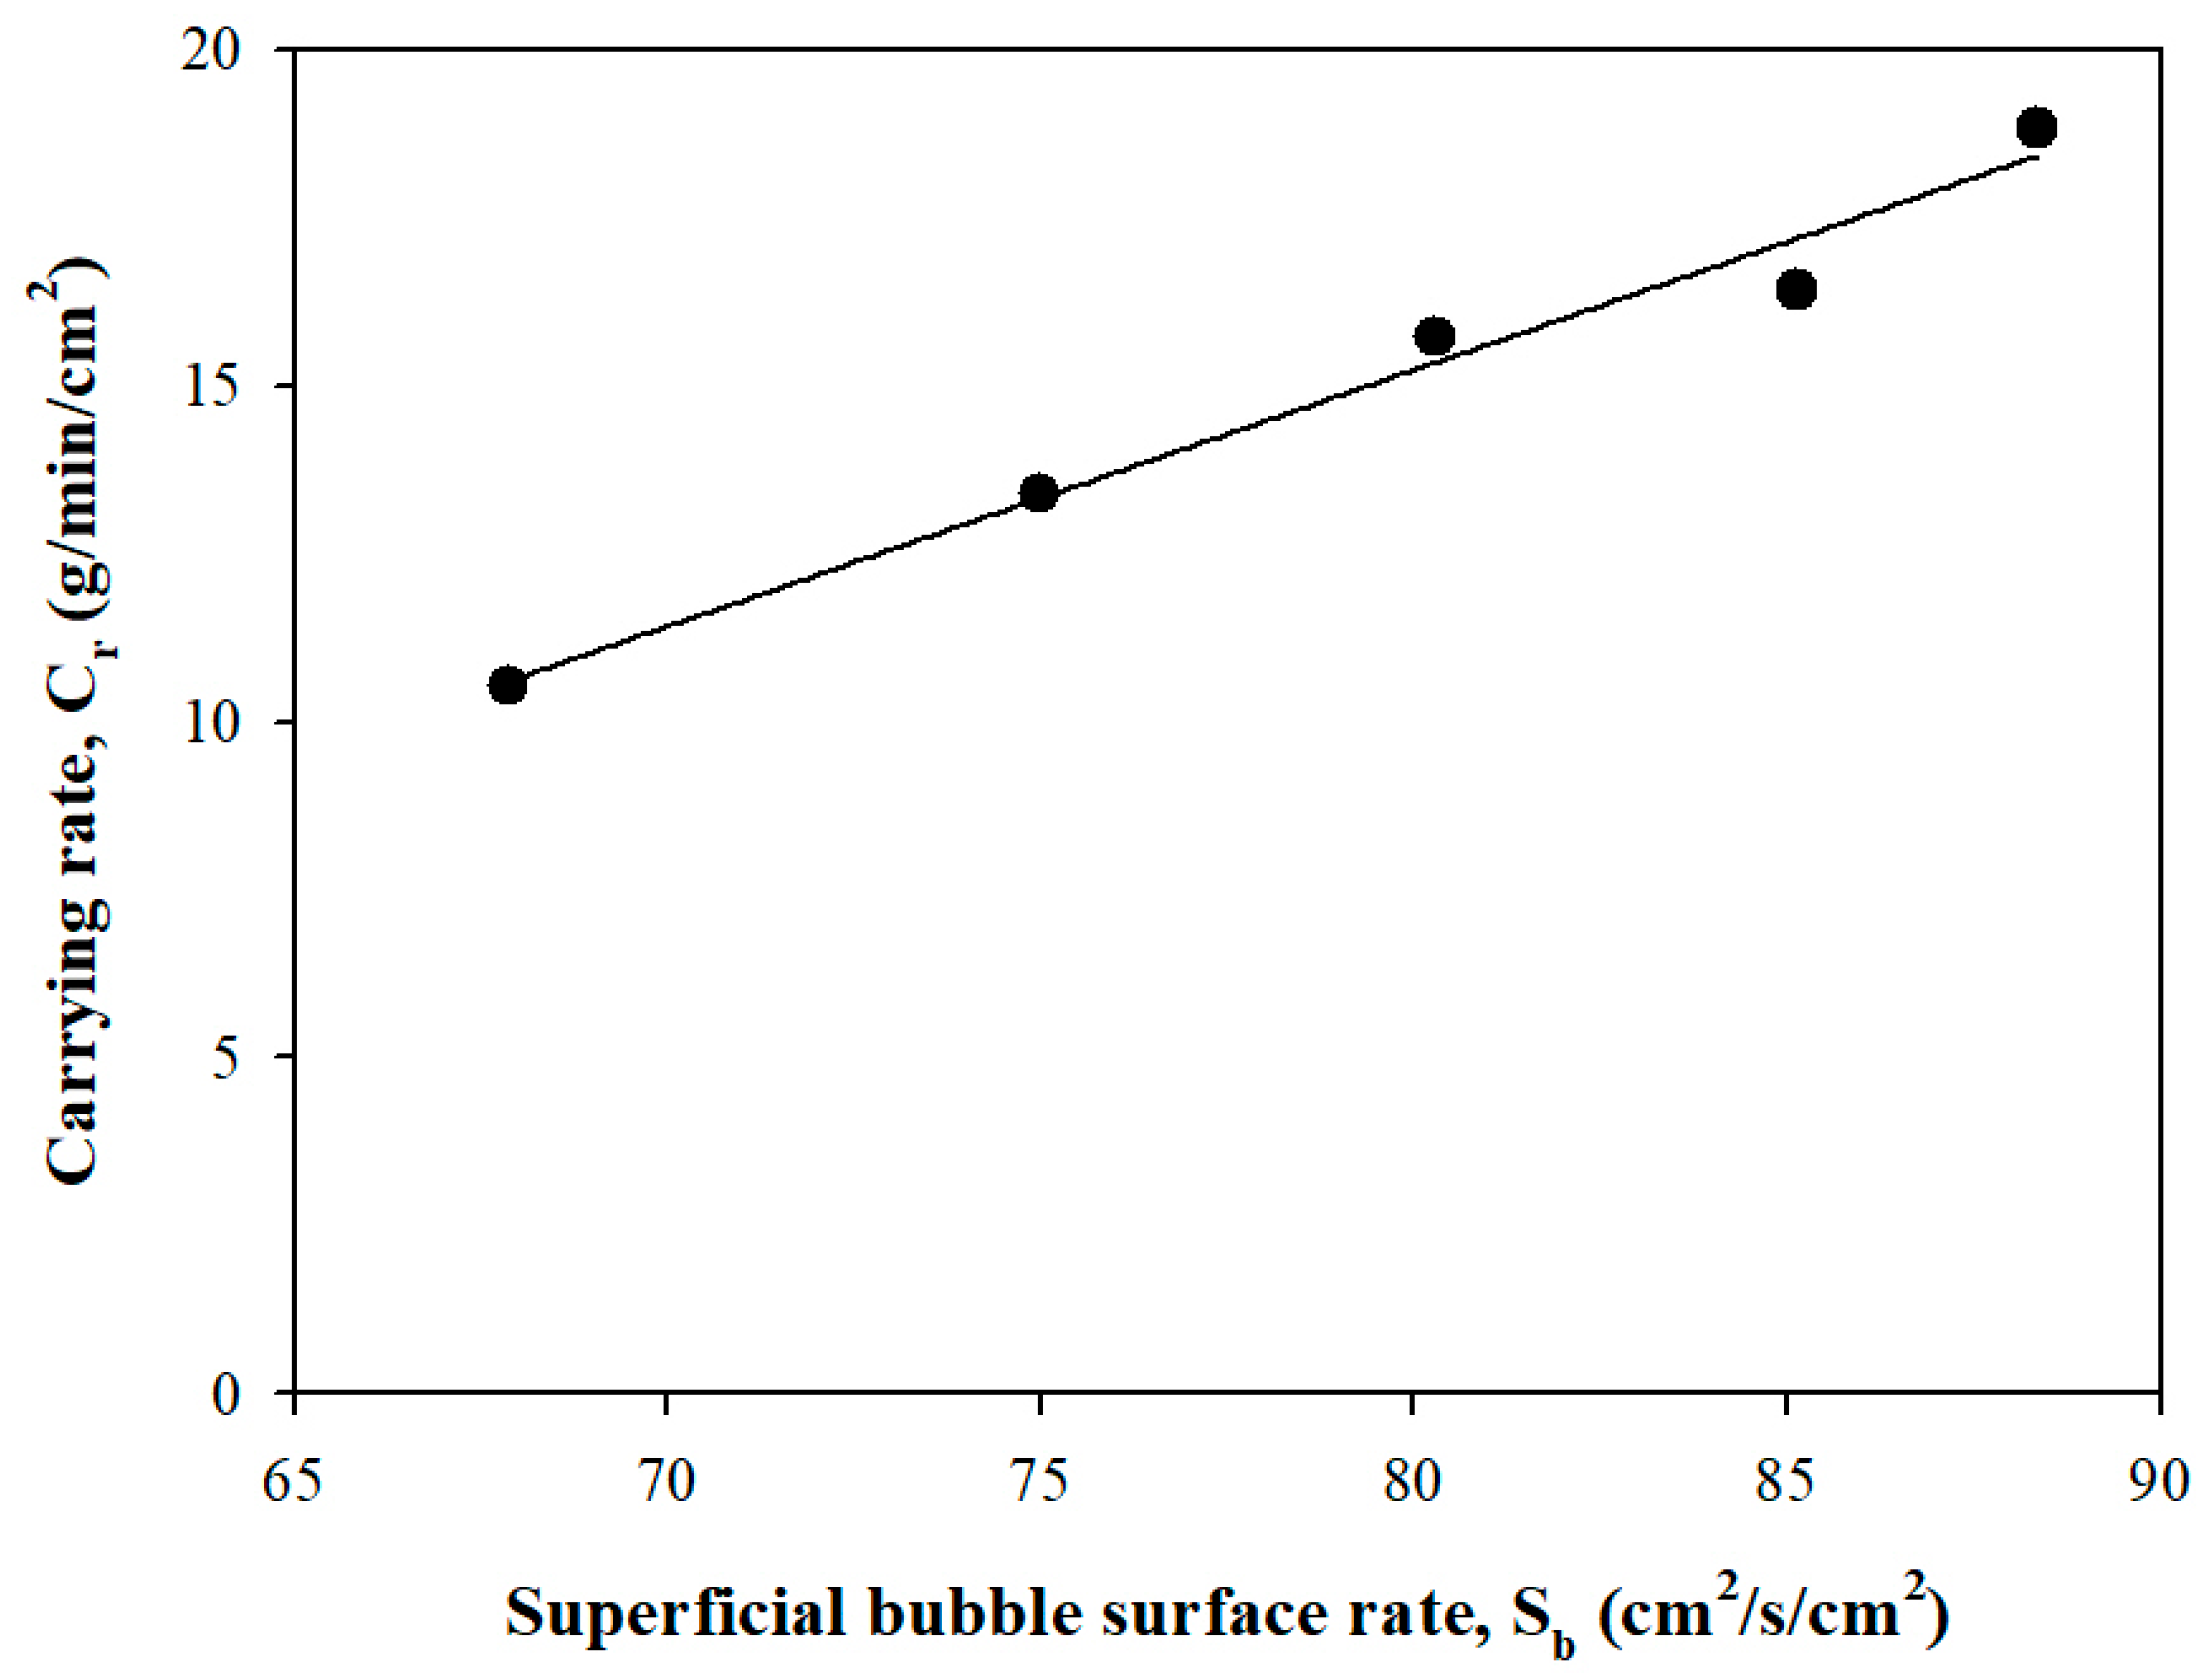
3.1.4. Carrying Rate
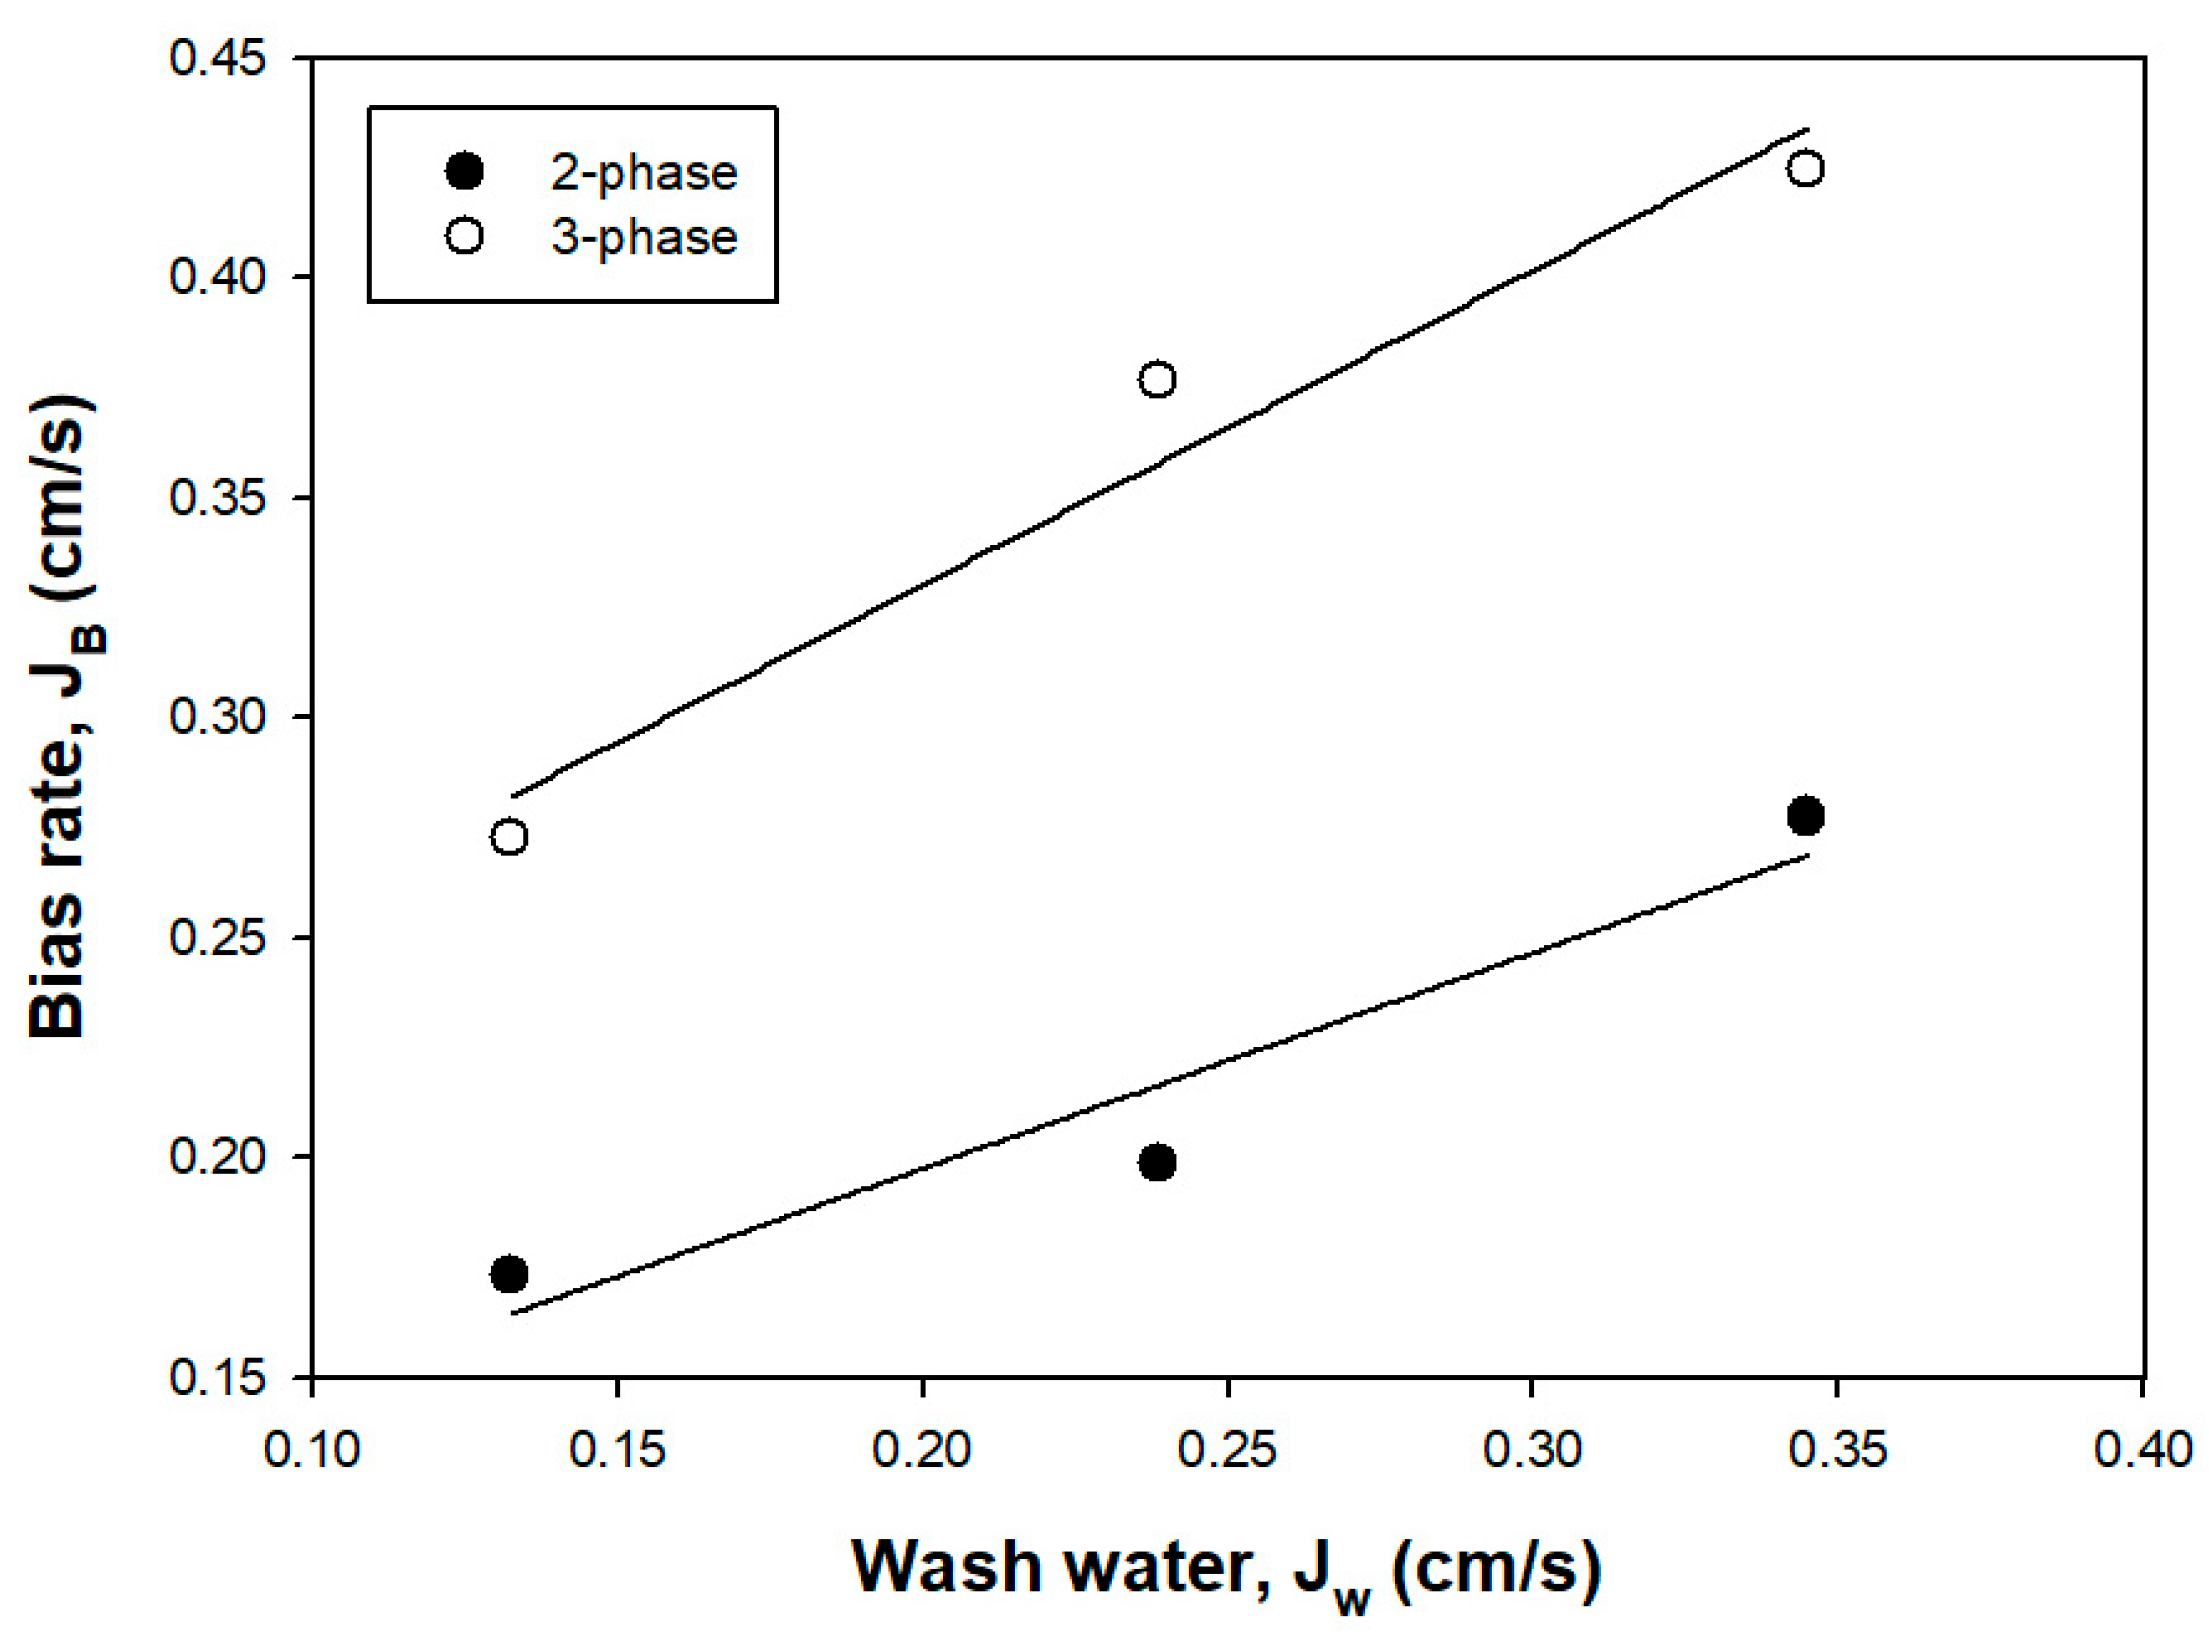
Figure 7 shows the carrying rate as a function of the bubble surface area flux. The carrying rate affects the recovery of particles in the gas dispersion properties of column flotation [30]. As the bubble surface area flux increases, the carrying rate increases linearly from 10.53 g/min/cm2 to 18.83 g/min/cm2. The carrying rate is an important factor in improving the recovery of valuable minerals because a larger bubble surface area adheres to more particles and allows for better flotation dynamics. However, an excessively high carrying rate can reduce the selectivity of valuable minerals, potentially lowering the concentrate grade [31,32]. Davis et al. (1994) reported that the carrying rate has a strong positive correlation with the bubble surface area flux and affects the operating variables of flotation column efficiency [33]. The correlation between the bubble surface area flux and carrying rate can increase the transport capacity of valuable minerals and concentrate production efficiency in column flotation [34]. Therefore, controlling the optimal carrying rate for concentrate recovery efficiency and bubble stability is considered an important factor in column operation.

3.1.5. Bias Rate

Bias is a factor that affects the net water flow difference between the tailings and feed flow [14]. It is directly related to the selectivity of flotation due to froth zone formation [35]. A positive bias factor is generally applied to fine-particle flotation to prevent gangue mineral entrainment. However, a negative bias has been suggested for the column flotation of coarse particles [36]. Figure 8 shows the relationship between bias versus wash water velocity (0.13 cm/s–0.34 cm/s) in two phases and three phases. Overall, the bias was positive and tended to increase with the wash water velocity. As shown in Figure 8, the bias of the two phases increased from 0.17 cm/s to 0.28 cm/s, while in the three-phase systems, it increased from 0.27 cm/s to 0.42 cm/s. There may be complexity in the interactions between solid particles and gas, bubbles, and liquid in the three phases. The reason for the increase in bias with the wash water in three phases is believed to be that the suspended gangue particles were removed owing to the increase in the amount of wash water. However, excessive wash water can cause bubble instability, leading to reduced grade and recovery [37]. Therefore, determining the appropriate level of bias is crucial for optimizing both grade and recovery in column flotation.

3.2. Performance of Column Flotation

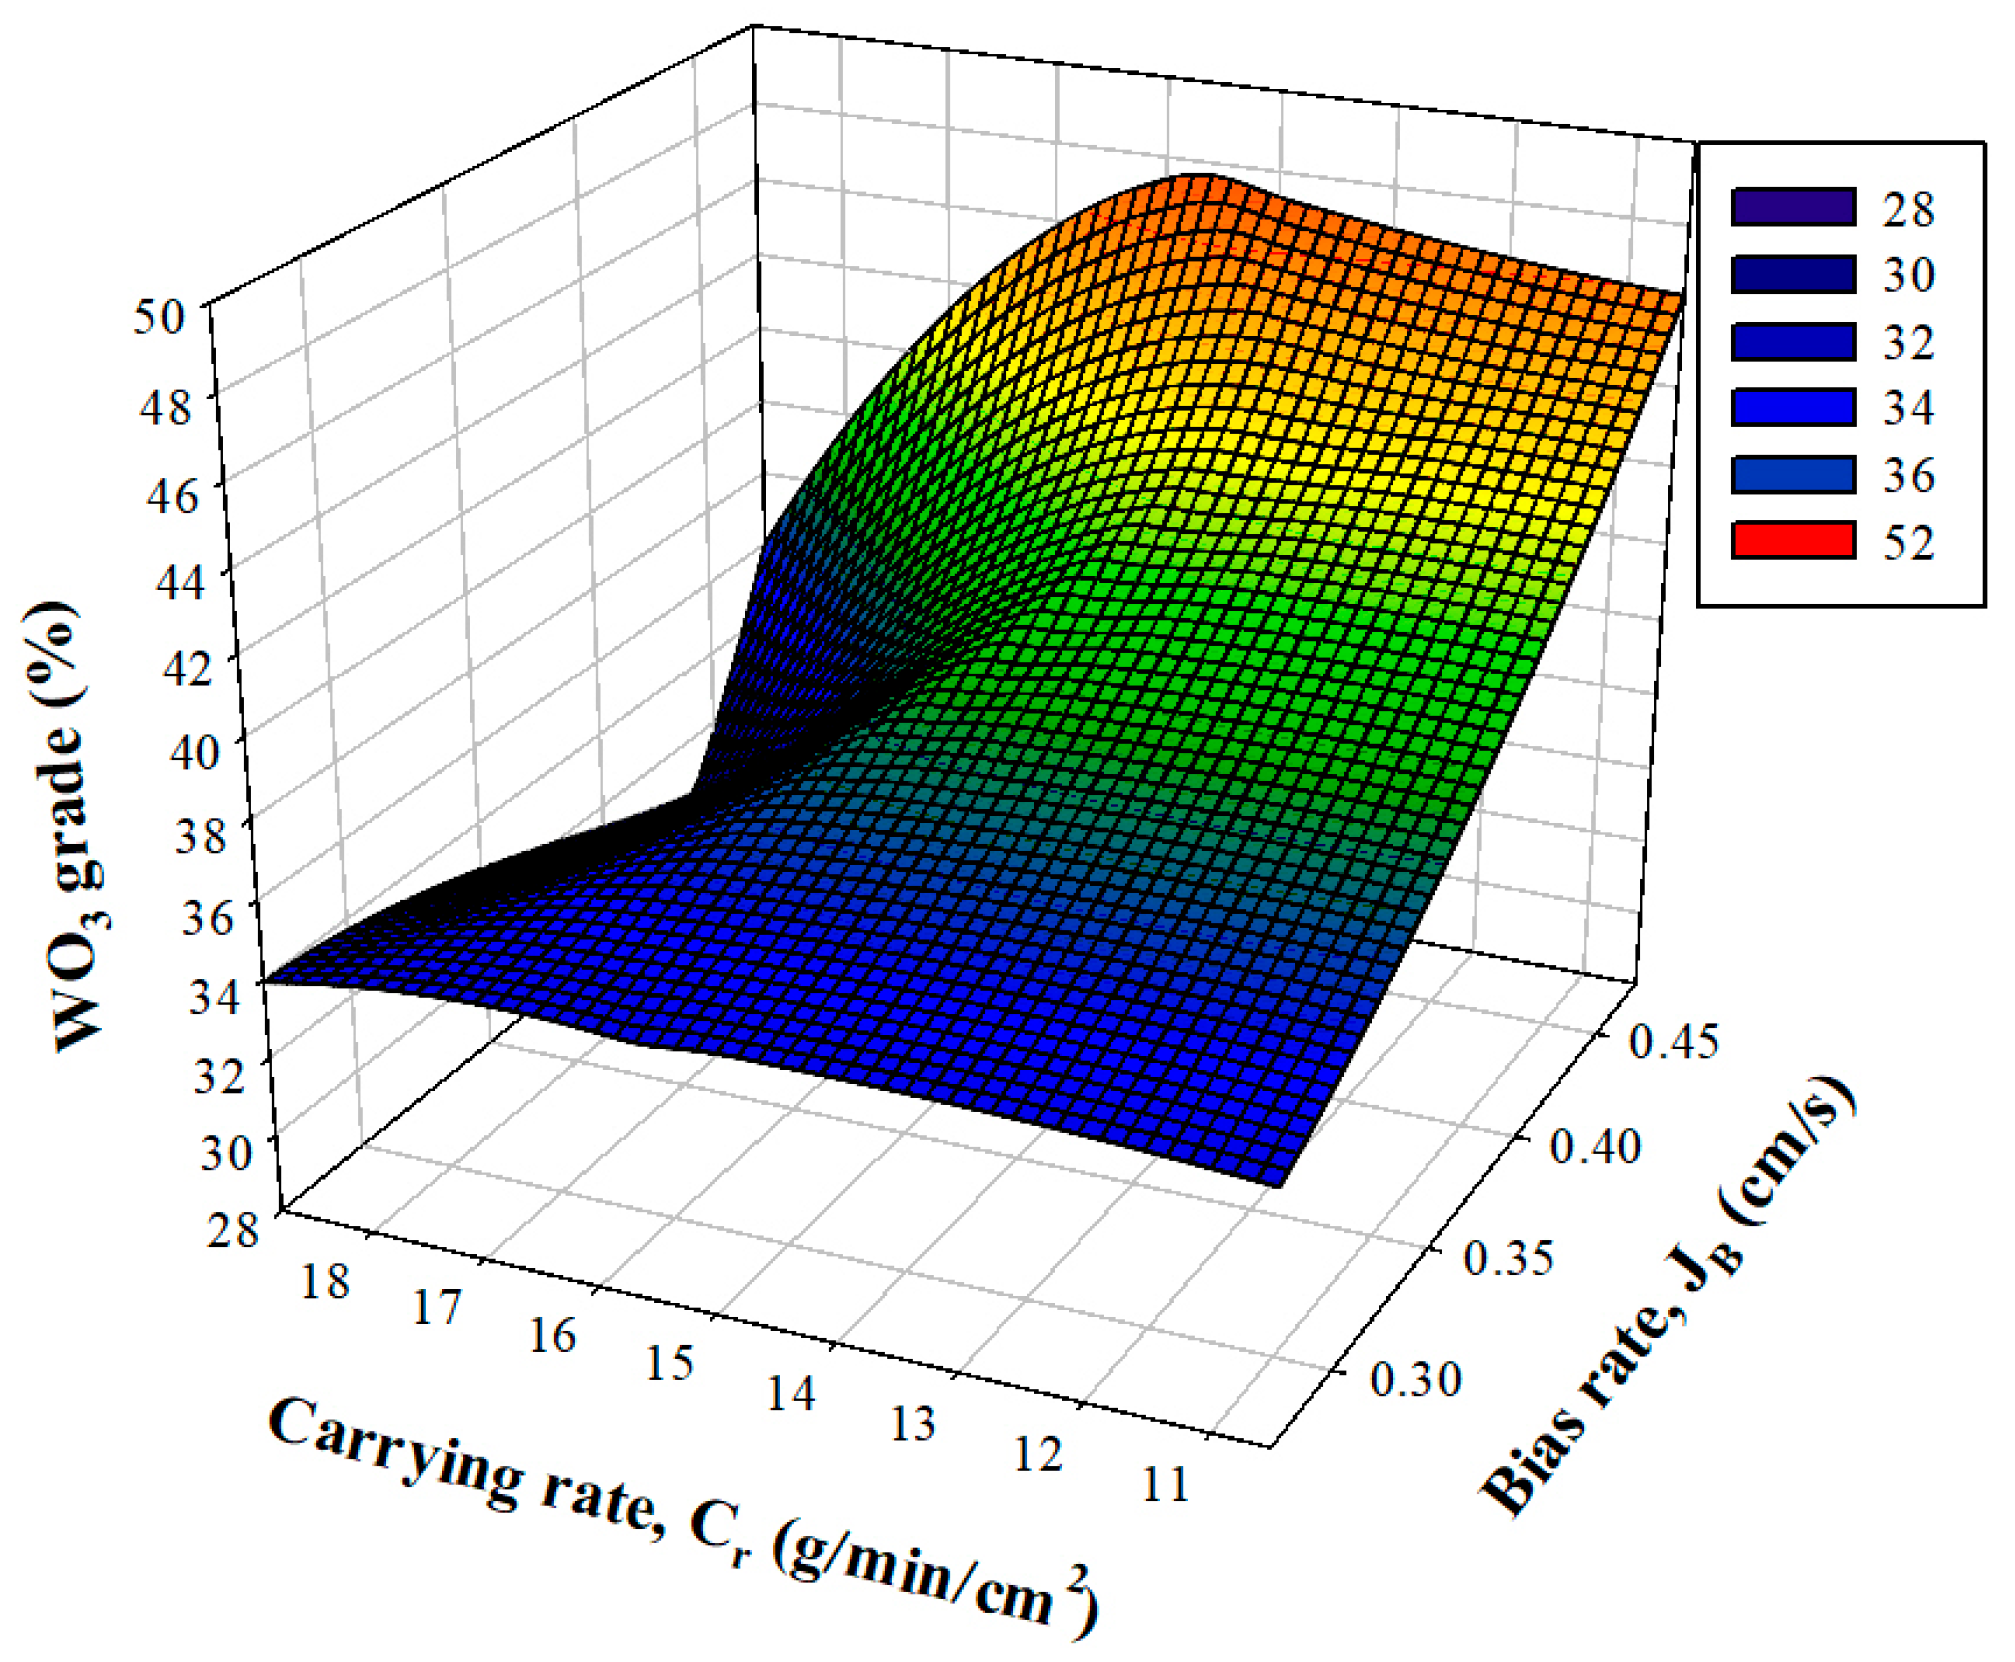
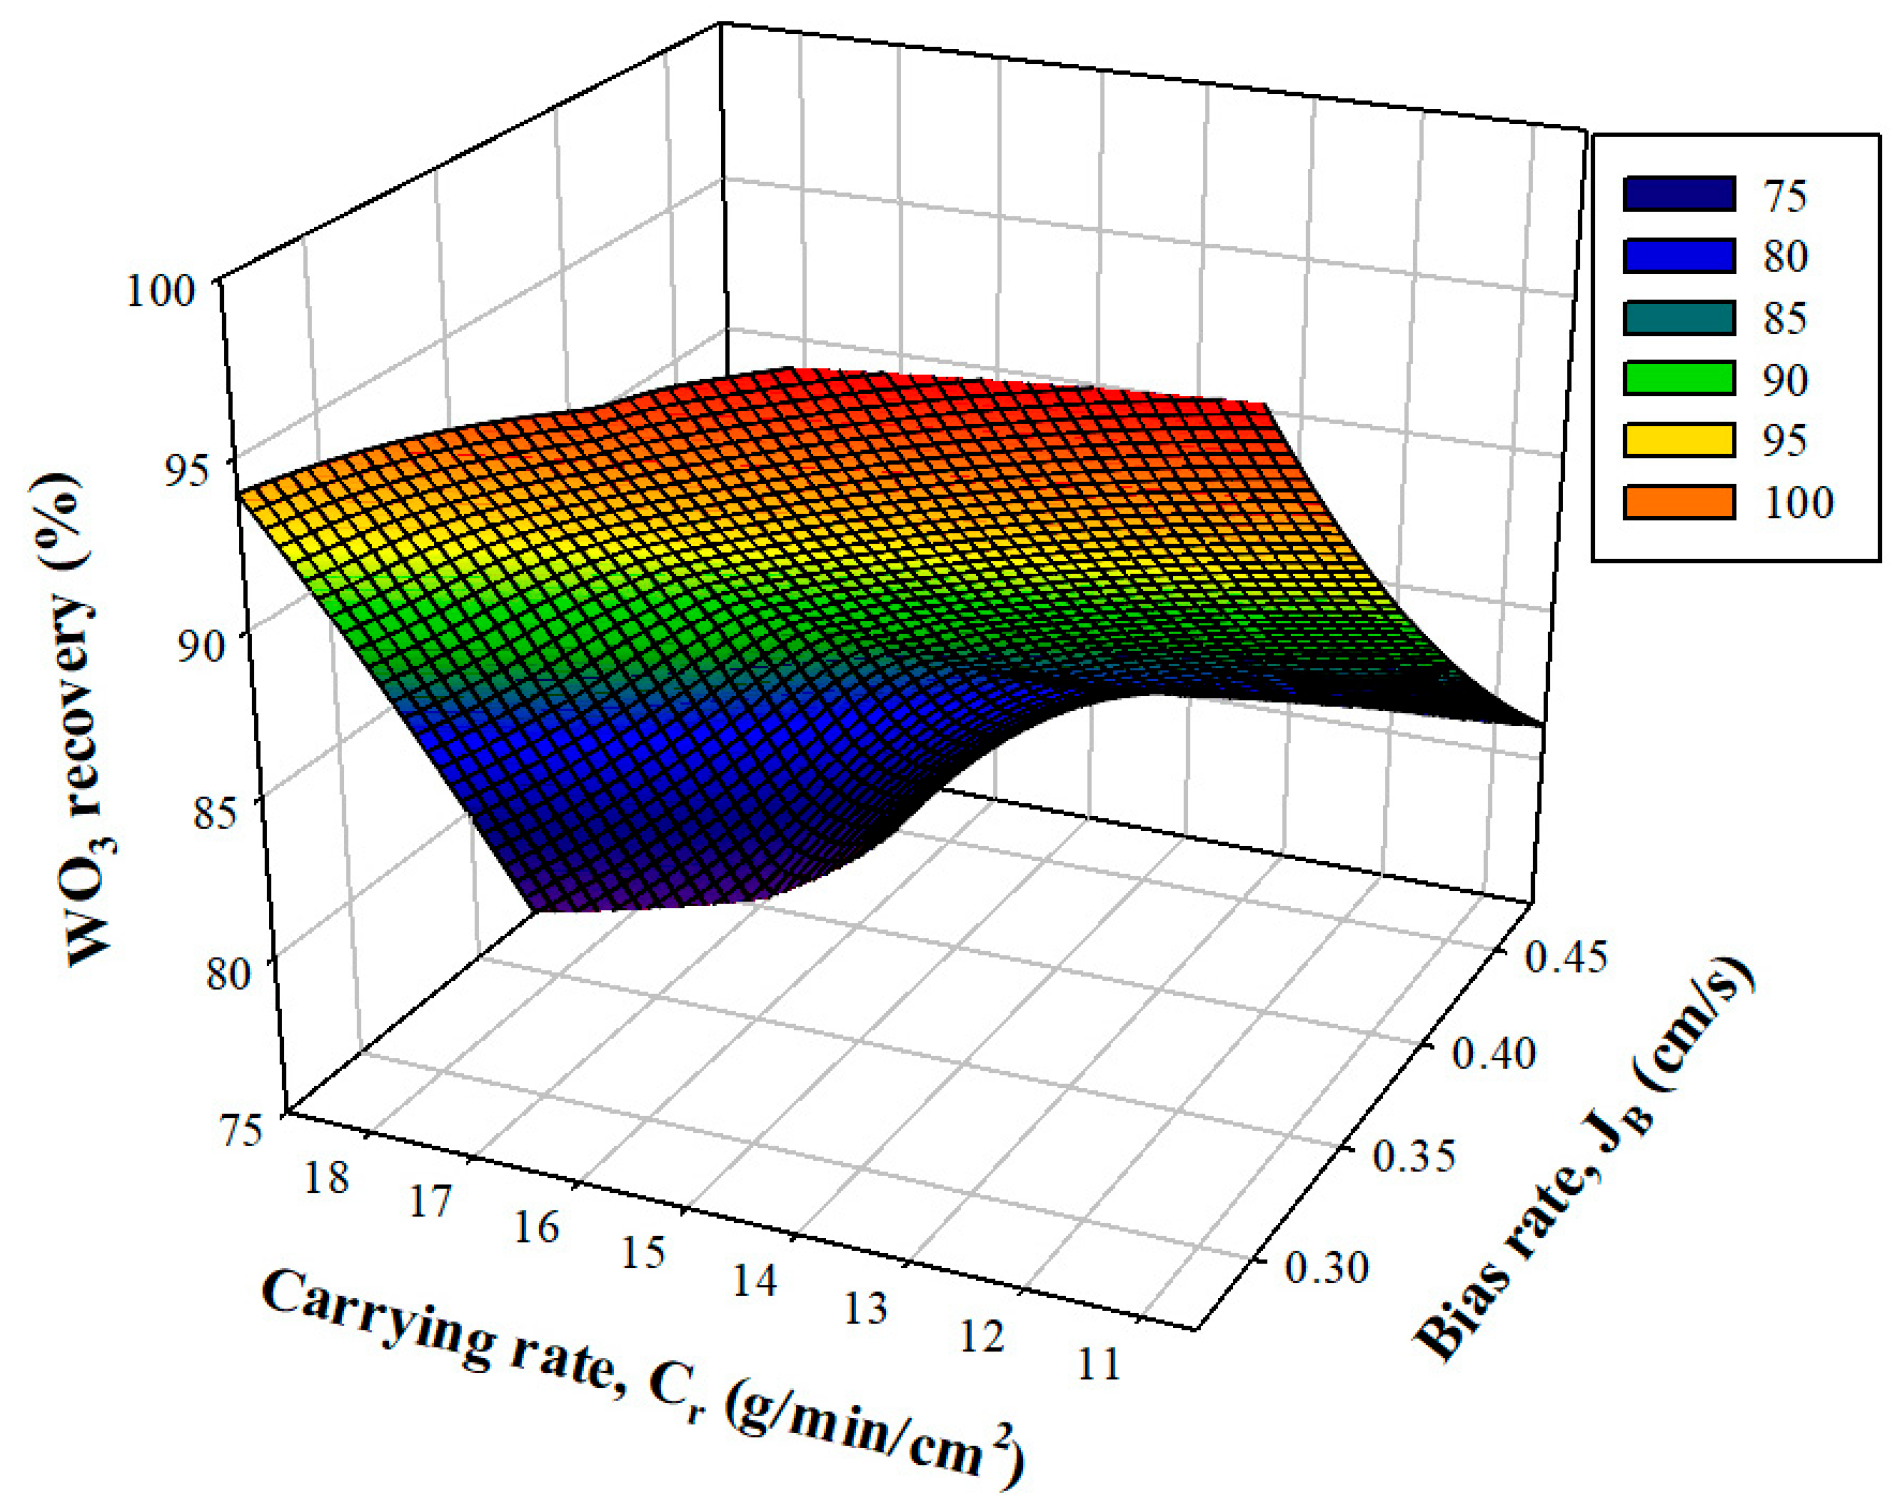
3.2.1. Effect of Bias and Carrying Rate on Grade and Recovery

Figure 9 and Figure 10 show the relationship between grade and recovery as a function of bias and carrying rate. As the bias increased, the WO3 grade increased from 33.94% to 46.27%; conversely, the recovery decreased from 93.99% to 81.15%. The increase in grade with increasing bias is likely due to a reduction in the entrainment of gangue minerals through the washing action. Also, the decrease in recovery with increasing bias may be attributed to the removal of relatively coarse, valuable mineral particles from the froth zone during the washing process [36]. In addition to its effect on washing, bias also affects other aspects of column operation. For example, increasing the bias can extend the residence time of the bubbles in the collection zone, thereby adjusting the recovery [37]. Uçar et al. (2015) reported that although bias is advantageous for obtaining high-grade concentrates, an excessively high bias can actually decrease the concentrate grade owing to the dropback of relatively coarse particles [38]. The carrying rate increased the recovery of WO3 but significantly reduced the grade. As the carrying rate increased, the WO3 recovery increased from 81.15% to 94.04%, but the grade decreased from 46.27% to 33.94%. The optimal WO3 grade and recovery in this stage were 46.27% and 81.15%, respectively. The carrying rate primarily affects the flotation recovery. The optimal carrying rate depends on factors such as particle size and mineral hydrophobicity, which are influenced by gas velocity, gas holdup, bubble size, and bubble surface area flux. Also, it can lead to reduced water consumption. Therefore, it demonstrates that controlling the carrying rate and bias within the column has a substantial impact on the recovery and grade of WO3.

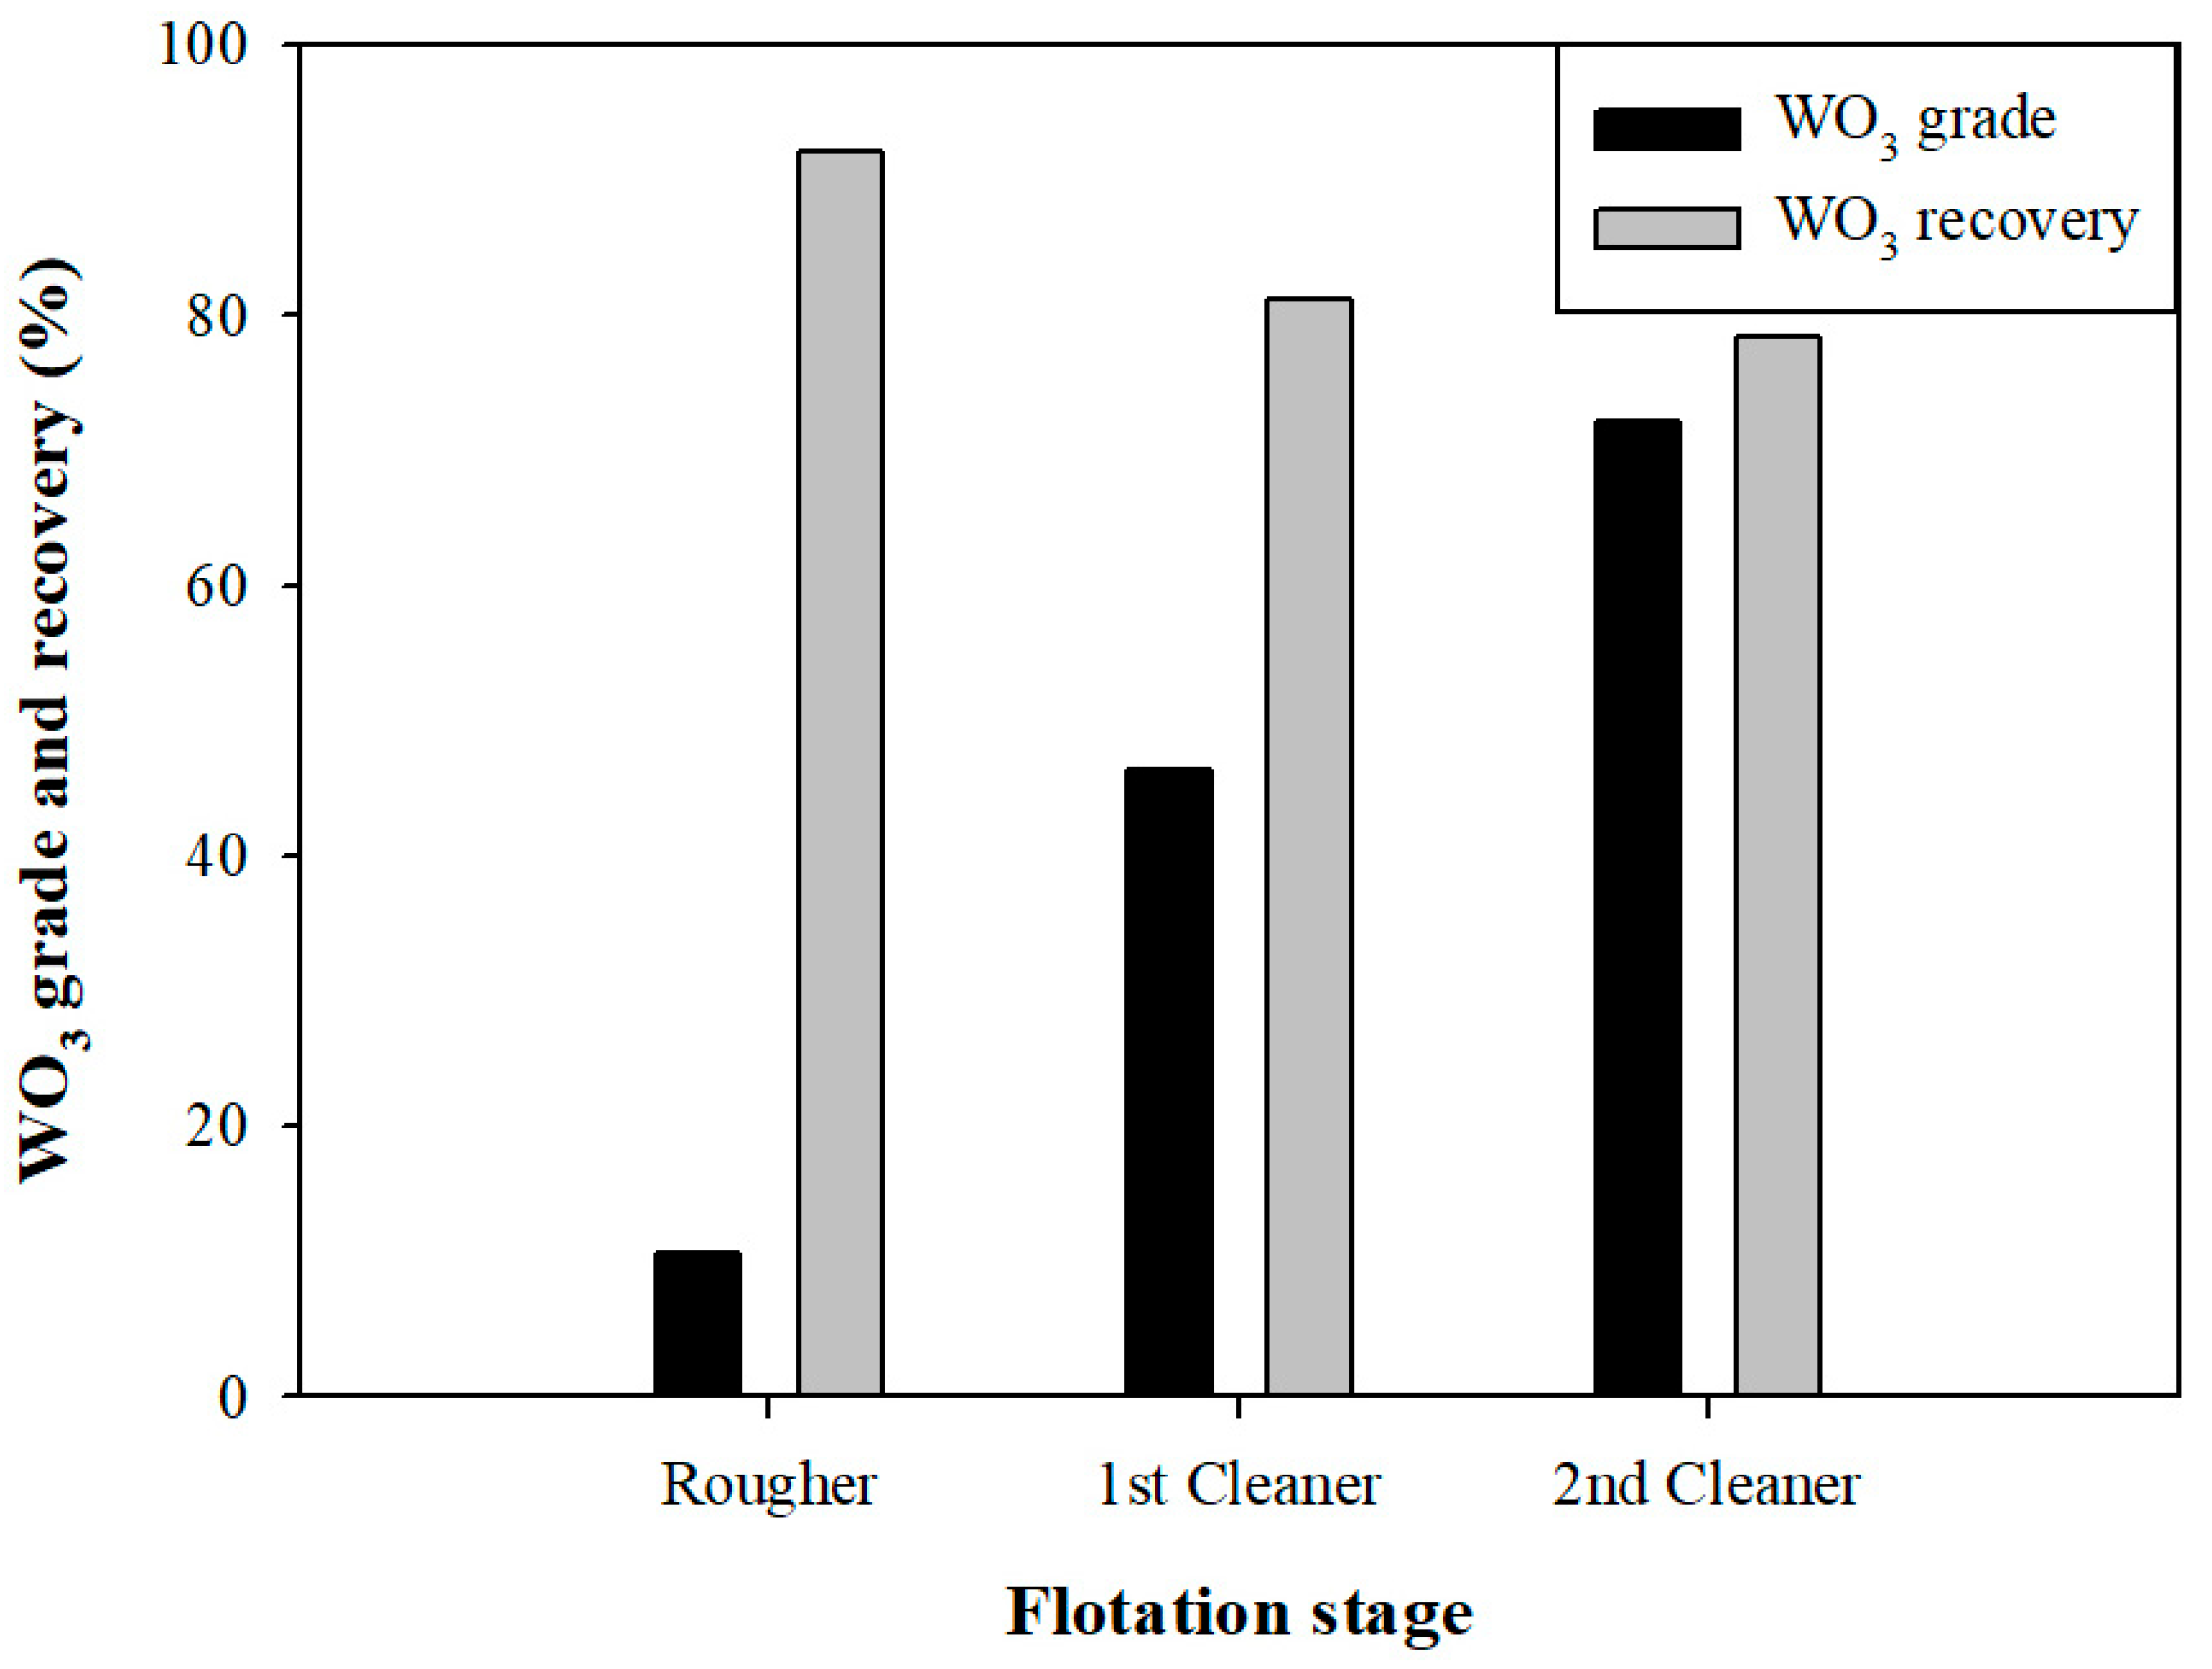
3.2.2. Grade and Recovery of WO3

Figure 11 shows the grade and recovery of the WO3 based on the flotation process. A conventional flotation process was used for the sink product from which sulfide minerals were removed. The rougher flotation stage achieved a WO3 grade of 10.63% and a recovery of 92.1%. The recovered rougher concentrate was then subjected to the first and second cleaner flotations using column flotation. The first cleaner stage achieved a WO3 grade of 46.27% and a recovery of 81.15%. In the second cleaner, the grade and recovery of WO3 were 72.16% and 78.4%, respectively. A high-grade WO3 concentrate could be obtained from low-grade WO3 ore through column flotation, which met the metallurgical requirement of more than 50% for WO3.

4. Conclusions

In this study, gas dispersion properties such as the gas holdup, bubble size, bubble surface area flux, carrying rate, and bias for two phases (gas–liquid) and three phases (gas–liquid–solid) systems in a column were investigated. As the gas velocity increased, the gas dispersion properties also improved. It was confirmed that gas velocity and these factors are interrelated. The bias increased with the wash water velocity. In relation to the recovery and grade of WO3 on the carrying rate and bias, the recovery and grade increased as the carrying rate and bias increased. Therefore, controlling the carrying rate and bias in the column considerably affected the recovery and grade of WO3. Cleaning tests were conducted under the following conditions: pulp density 2%, collector 150 g/t, frother 75 g/t, gas velocity 0.49 cm/s, and wash water 0.34 cm/s. The results of these tests showed that the first cleaner flotation achieved a WO3 grade of 46.27% and a recovery of 81.15%. The second cleaner flotation achieved a WO3 grade of 72.16% and recovery of 78.4%, satisfying the metallurgical requirement of more than 50% for WO3.

Author Contributions

H.K.: writing—original draft, formal analysis, and investigation; C.-H.P.: writing—original draft, writing—review and editing, conceptualization, and methodology. All authors have read and agreed to the published version of the manuscript.

Funding

This study was supported by a research fund from Chosun University in 2018.

Data Availability Statement

All data generated or analyzed during this study are included in this published article.

Conflicts of Interest

The authors declare no conflicts of interest.

References

  1. Shemi, A.; Magumise, A.; Ndlovu, S.; Sacks, N. Recycling of tungsten carbide scrap metal: A review of recycling methods and future prospects. Miner. Eng. 2018, 122, 195–205. [Google Scholar] [CrossRef]
  2. Wu, Y.C.; Hou, Q.Q.; Luo, L.M.; Zan, X.; Zhu, X.Y.; Li, P.; Xu, Q.; Cheng, J.G.; Luo, G.N.; Chen, J.L. Preparation of ultrafine-grained/nanostructured tungsten materials: An overview. J. Alloys Compd. 2019, 779, 926–941. [Google Scholar] [CrossRef]
  3. Zhong, C.; Wang, H.; Feng, B.; Zhang, L.; Chen, Y.; Gao, Z. Flotation separation of scheelite and apatite by polysaccharide depressant xanthan gum. Miner. Eng. 2021, 170, 107045. [Google Scholar] [CrossRef]
  4. Foucaud, Y.; Filippov, L.; Filippova, I.; Badawi, M. The challenge of tungsten skarn processing by froth flotation: A review. Front. Chem. 2020, 8, 230. [Google Scholar] [CrossRef] [PubMed]
  5. Yao, W.; Li, M.; Zhang, M.; Cui, R.; Shi, J.; Ning, J. Decoupling the effects of solid and liquid phases in a Pb-water glass mixture on the selective flotation separation of scheelite from calcite. Miner. Eng. 2020, 154, 106423. [Google Scholar] [CrossRef]
  6. Hu, Y.-h.; Yang, F.; Sun, W. The flotation separation of scheelite from calcite using a quaternary ammonium salt as collector. Miner. Eng. 2011, 24, 82–84. [Google Scholar] [CrossRef]
  7. Feng, B.; Luo, X.; Wang, J.; Wang, P. The flotation separation of scheelite from calcite using acidified sodium silicate as depressant. Miner. Eng. 2015, 80, 45–49. [Google Scholar]
  8. Yin, W.-z.; Wang, J.-z. Effects of particle size and particle interactions on scheelite flotation. Trans. Nonferrous Met. Soc. China 2014, 24, 3682–3687. [Google Scholar] [CrossRef]
  9. Foucaud, Y.; Filippova, I.; Dehaine, Q.; Hubert, P.; Filippov, L. Integrated approach for the processing of a complex tungsten Skarn ore (Tabuaço, Portugal). Miner. Eng. 2019, 143, 105896. [Google Scholar] [CrossRef]
  10. Tao, X.; Liu, Y.; Jiang, H.; Chen, R. Microbubble generation with shear flow on large-area membrane for fine particle flotation. Chem. Eng. Process.-Process Intensif. 2019, 145, 107671. [Google Scholar] [CrossRef]
  11. Huang, G.; Feng, Q.; Ou, L.; Wu, X.; Lu, Y.; Zhang, G. A comparative study of recovering fine scheelite in tailings by flotation cell and flotation column. J. Solid Waste Technol. Manag. 2010, 36, 61–68. [Google Scholar] [CrossRef]
  12. Sobhy, A.; Tao, D. Nanobubble column flotation of fine coal particles and associated fundamentals. Int. J. Miner. Process. 2013, 124, 109–116. [Google Scholar] [CrossRef]
  13. Peng, F.F.; Yu, X. Pico–nano bubble column flotation using static mixer-venturi tube for Pittsburgh No. 8 coal seam. Int. J. Min. Sci. Technol. 2015, 25, 347–354. [Google Scholar] [CrossRef]
  14. Finch, J.A.; Dobby, G. Column flotation. In Flotation Science and Engineering; CRC Press: Boca Raton, FL, USA, 1990; pp. 291–329. [Google Scholar]
  15. Finch, J.; Xiao, J.; Hardie, C.; Gomez, C. Gas dispersion properties: Bubble surface area flux and gas holdup. Miner. Eng. 2000, 13, 365–372. [Google Scholar] [CrossRef]
  16. Bhunia, K.; Kundu, G.; Mukherjee, D. Application of statistical analysis on the bubble surface area flux in a column flotation cell. Sep. Sci. Technol. 2015, 50, 1230–1238. [Google Scholar] [CrossRef]
  17. Li, H.; Villar, R.D.; Gomez, C. Reviewing the experimental procedure to determine the carrying capacity in flotation columns. Can. Metall. Q. 2004, 43, 513–520. [Google Scholar] [CrossRef]
  18. Şahbaz, O.; Uçar, A.; Öteyaka, B.; Taş, O.Ö.; Özdemir, O. Separation of colemanite from tailings using the pilot scale flotation column. Powder Technol. 2017, 309, 31–36. [Google Scholar] [CrossRef]
  19. Banisi, S.; Finch, J.; Laplante, A.; Weber, M. Effect of solid particles on gas holdup in flotation columns—I. Measurement. Chem. Eng. Sci. 1995, 50, 2329–2334. [Google Scholar] [CrossRef]
  20. Shukla, S.C.; Kundu, G.; Mukherjee, D. Study of gas holdup and pressure characteristics in a column flotation cell using coal. Miner. Eng. 2010, 23, 636–642. [Google Scholar] [CrossRef]
  21. Qiu, G.; Hu, Y.; Wang, D. Interaction of Particles and Flotation Techniques of Fine Particles; Central South University of Technology Press: Changsha, China, 1993. (In Chinese) [Google Scholar]
  22. Krishna, R.; De Swart, J.W.; Ellenberger, J.; Martina, G.B.; Maretto, C. Gas holdup in slurry bubble columns: Effect of column diameter and slurry concentrations. AIChE J. 1997, 43, 311–316. [Google Scholar] [CrossRef]
  23. Pandit, A.; Joshi, J. Three phase sparged reactors—Some design aspects. Rev. Chem. Eng. 1984, 2, 1–84. [Google Scholar] [CrossRef]
  24. Vazirizadeh, A.; Bouchard, J.; Chen, Y. Effect of particles on bubble size distribution and gas hold-up in column flotation. Int. J. Miner. Process. 2016, 157, 163–173. [Google Scholar] [CrossRef]
  25. Ostadrahimi, M.; Gharibi, K.; Dehghani, A.; Farrokhpay, S. Estimating bubble loading in industrial flotation cells. Minerals 2019, 9, 222. [Google Scholar] [CrossRef]
  26. Panjipour, R.; Karamoozian, M.; Albijanic, B. Bubble size distributions in gas–liquid–solid systems and their influence on flotation separation in a bubble column. Chem. Eng. Res. Des. 2021, 167, 96–106. [Google Scholar] [CrossRef]
  27. Sarhan, A.; Naser, J.; Brooks, G. CFD model simulation of bubble surface area flux in flotation column reactor in presence of minerals. Int. J. Min. Sci. Technol. 2018, 28, 999–1007. [Google Scholar] [CrossRef]
  28. Panjipour, R.; Karamoozian, M.; Albijanic, B. Investigations of gas holdup, interfacial area of bubbles and bubble size distributions in a pilot plant flotation column. Miner. Eng. 2021, 164, 106819. [Google Scholar] [CrossRef]
  29. Leiva, J.; Vinnett, L.; Contreras, F.; Yianatos, J. Estimation of the actual bubble surface area flux in flotation. Miner. Eng. 2010, 23, 888–894. [Google Scholar] [CrossRef]
  30. Yianatos, J.; Contreras, F. On the carrying capacity limitation in large flotation cells. Can. Metall. Q. 2010, 49, 345–352. [Google Scholar] [CrossRef]
  31. Martínez-Gómez, V.; Pérez-Garibay, R.; Rubio, J. Factors involving the solids-carrying flotation capacity of microbubbles. Miner. Eng. 2013, 53, 160–166. [Google Scholar] [CrossRef]
  32. Garibay, R.P. Effect of collection zone height and operating variables on recovery of overload flotation columns. Miner. Eng. 2002, 15, 325–331. [Google Scholar] [CrossRef]
  33. Davis, V., Jr.; Stanley, F.; Bethell, P.; Luttrell, G.; Mankosa, M. Column flotation at the Middle Fork preparation facility. Coal Perparation 1994, 14, 133–145. [Google Scholar] [CrossRef]
  34. Wang, J.; Wang, L. Improving column flotation of oxidized or ultrafine coal particles by changing the flow pattern of air supply. Miner. Eng. 2018, 124, 98–102. [Google Scholar] [CrossRef]
  35. Mohanty, M.; Honakeri, R. Performance optimization of Jameson flotation technology for fine coal cleaning. Miner. Eng. 1999, 12, 367–381. [Google Scholar] [CrossRef]
  36. Patwardhan, A.; Honaker, R. Development of a carrying-capacity model for column froth flotation. Int. J. Miner. Process. 2000, 59, 275–293. [Google Scholar] [CrossRef]
  37. Perez, R.; Del Villar, R. Estimation of bias and entrainment in flotation columns using conductivity measurements. Can. Metall. Q. 1997, 36, 299–307. [Google Scholar] [CrossRef]
  38. Ucar, A.; Yargan, M. Selective separation of boron values from the tailing of a colemanite processing plant. Sep. Purif. Technol. 2009, 68, 1–8. [Google Scholar] [CrossRef]
Figure 1. XRD pattern of raw WO3 ore.
Minerals 14 00881 g001
Figure 2. SEM-EDS of raw WO3 ore.
Minerals 14 00881 g002
Figure 3. (a) Flowsheet of the batch type scheelite flotation and (b) schematic of flotation column apparatus.
Minerals 14 00881 g003
Figure 4. Gas holdup versus superficial gas velocity (pulp density 2%, collector 150 g/t, frother 75 g/t, gas velocity 0.37–0.61 cm/s, and wash water 0.24 cm/s).
Minerals 14 00881 g004
Figure 5. Bubble size versus superficial gas velocity (pulp density 2%, collector 150 g/t, frother 75 g/t, gas velocity 0.37–0.61 cm/s, and wash water 0.24 cm/s).
Minerals 14 00881 g005
Figure 6. Bubble surface area flux versus superficial gas velocity (pulp density 2%, collector 150 g/t, frother 75 g/t, gas velocity 0.37–0.61 cm/s, and wash water 0.24 cm/s).
Minerals 14 00881 g006
Figure 7. Carrying rate versus superficial bubble surface area flux (pulp density 2%, collector 150 g/t, frother 75 g/t, gas velocity 0.37–0.61 cm/s, and wash water 0.24 cm/s).
Minerals 14 00881 g007
Figure 8. Bias rate versus superficial wash water (pulp density 2%, collector 150 g/t, frother 75 g/t, gas velocity 0.49 cm/s, and wash water 0.13–0.34 cm/s).
Minerals 14 00881 g008
Figure 9. Effect of superficial bias and carrying rate on WO3 grade.
Minerals 14 00881 g009
Figure 10. Effect of superficial bias and carrying rate on WO3 recovery.
Minerals 14 00881 g010
Figure 11. Grade and recovery of WO3 as multi-stage flotation.
Minerals 14 00881 g011
Table 1. Chemical composition of raw ore.
ElementSiO2Fe2O3Al2O3CaOMgOK2OSO3TiO2WO3Etc.
Content (%)53.4413.9712.359.423.422.990.910.880.372.25
Disclaimer/Publisher’s Note: The statements, opinions and data contained in all publications are solely those of the individual author(s) and contributor(s) and not of MDPI and/or the editor(s). MDPI and/or the editor(s) disclaim responsibility for any injury to people or property resulting from any ideas, methods, instructions or products referred to in the content.

