Article

Study on Column Leaching Behavior of Low-Grade High Calcium and Magnesium Copper Ore

1
College of Minerals Processing and Bioengineering, Central South University, Changsha 410083, China
2
Norin Mining Ltd., Beijing 100055, China
3
BGRIMM Technology Group, Beijing 100070, China
4
Department of Mechanical, Automotive and Materials Engineering, University of Windsor, 401 Sunset Avenue, Windsor, ON N9B3P4, Canada
5
Department of Mining and Materials Engineering, McGill University, 3610 University, Montreal, QC H3A 0C5, Canada
*
Author to whom correspondence should be addressed.
These authors contributed equally to this work.
Minerals 2024, 14(8), 822; https://doi.org/10.3390/min14080822
Submission received: 16 July 2024 / Revised: 10 August 2024 / Accepted: 13 August 2024 / Published: 14 August 2024

Abstract

:
This paper studies the process mineralogy, mechanism, and kinetics of column leaching behavior of low-grade high-calcium–magnesium copper ore. The effect of sulfuric acid concentration, leach solution spraying intensity, and material particle size on column leaching kinetics is discussed. The kinetic analysis of column leaching of copper indicates that sulfuric acid concentration has a significant impact. As sulfuric acid concentration increases, the limiting step of reaction shifts from chemical reaction control to a combination of chemical reaction and diffusion mixing control. Spraying intensity also affects copper column leaching; increasing intensity shifts the limiting step from diffusion control to mixing control, thereby mitigating the effects of diffusion control. Regarding other elements, it is found that iron leaching is primarily controlled by chemical reaction, while calcium leaching is mainly controlled by chemical reaction. As sulfuric acid concentration increases from 10 g/L to 20 g/L, the limiting step for calcium leaching shifts from chemical reaction control to chemical reaction and diffusion-mixing control.

1. Introduction

Copper is one of the earliest metals used by humans, and it is widely used in fields such as electricity, electronics, energy, machinery, metallurgy, and transportation due to its excellent conductivity, thermal conductivity, and ductility [1,2,3,4]. Copper ores are a crucial source of copper and an important raw material for achieving sustainable development. Copper ores are mainly categorized into sulfide ores and oxide ores [5]. Sulfide ores, due to their high copper and sulfur contents, generally undergo flotation and pyrometallurgical smelting processes, which are relatively mature in technology [6,7]. Oxide ores, on the other hand, due to their low copper content and difficulty in ore beneficiation, usually require different processing technologies [8,9,10]. Typically, a crushing–agitation leaching process is employed. For low-grade copper ores, heap leaching is commonly used due to its advantages of low investment costs and high cost-effectiveness, although it suffers from long leaching cycles and low leaching rates [11,12].
Heap leaching technology involves percolating a solution containing sulfuric acid or other solvents into the ore heap, where the valuable components can be dissolved in the solution [13]. The solution containing the valuable ions is then recovered. The effectiveness of heap leaching depends primarily on two aspects: the ability of the solution to dissolve valuable components and the penetration efficiency of the solution within the ore heap [14,15,16].
Column leaching can simulate heap leaching on the production site, and it is an important indoor heap leaching method [17]. There have been a number of studies on the heap leaching of oxide and copper ores [18,19,20,21,22]. Wang et al. pointed out that fine powder minerals (−1 mm) degrade the permeability of oxide copper ore heaps [23]. They improved the permeability coefficient of ore heaps 50 times by wet screening to separate materials smaller than −1 mm particle size and building heaps with particles larger than +1 mm, thereby eliminating the ponding phenomenon on the surface of the ore heap. Liu et al. proposed a two-stage crushing–leaching–agglomeration–leaching process flow that solves the problem of poor mineral permeability in fine ore, thereby reducing the production cycle by nearly 300 days [24]. Wang et al. developed a process for treating oxide copper ores using low-concentration ammonia column leaching–extraction–electrowinning technology [25]. Both small-scale tests and 20 kg column leaching simulation tests achieved excellent leaching results, with an ammonia consumption of approximately 0.8 tons per ton of copper. Despite all these studies, there is still a lack of in-depth research on column leaching kinetics.
This research focuses on the process mineralogy, leaching mechanisms, and leaching kinetics of low-grade high-calcium–magnesium oxide copper ore under column leaching. The effects of sulfuric acid concentration, leach solution spraying intensity, material particle size, and other factors on the kinetics of the column leaching process are examined. It identifies the types of minerals and their distribution characteristics in low-grade high-calcium–magnesium oxide copper ores and the influence of column leaching process conditions on column leaching kinetics. The column leaching behavior of iron, calcium, and magnesium is also analyzed.

2. Materials and Methods

2.1. Materials and Analysis

The low-grade high-calcium–magnesium copper–cobalt ore used in this column leaching test was obtained from the Lualaba province in the Democratic Republic of the Congo. The ore consists of a mixture of light red sandstone-like large particles and fine powdery ore, as shown in Figure 1.
The leaching agent used in this column leaching test was a dilute acid solution with a concentration of 5–20 g/L. This solution was prepared by diluting 98% concentrated sulfuric acid with recycled tailings water. The detailed composition of the dilute acid solution is shown in Table 1.
The identification and quantification of minerals were analyzed through advanced mineral identification and characterization system (AMICS) software ver 3. Metal content analysis was performed using an inductively coupled plasma-optical emission spectrometer (ICP-OES, 700-ES, Varian, Palo Alto, CA, USA). Morphologies of the leached residues were examined using an optical microscope (Axioplan 2, Zeiss, Oberkochen, Germany).

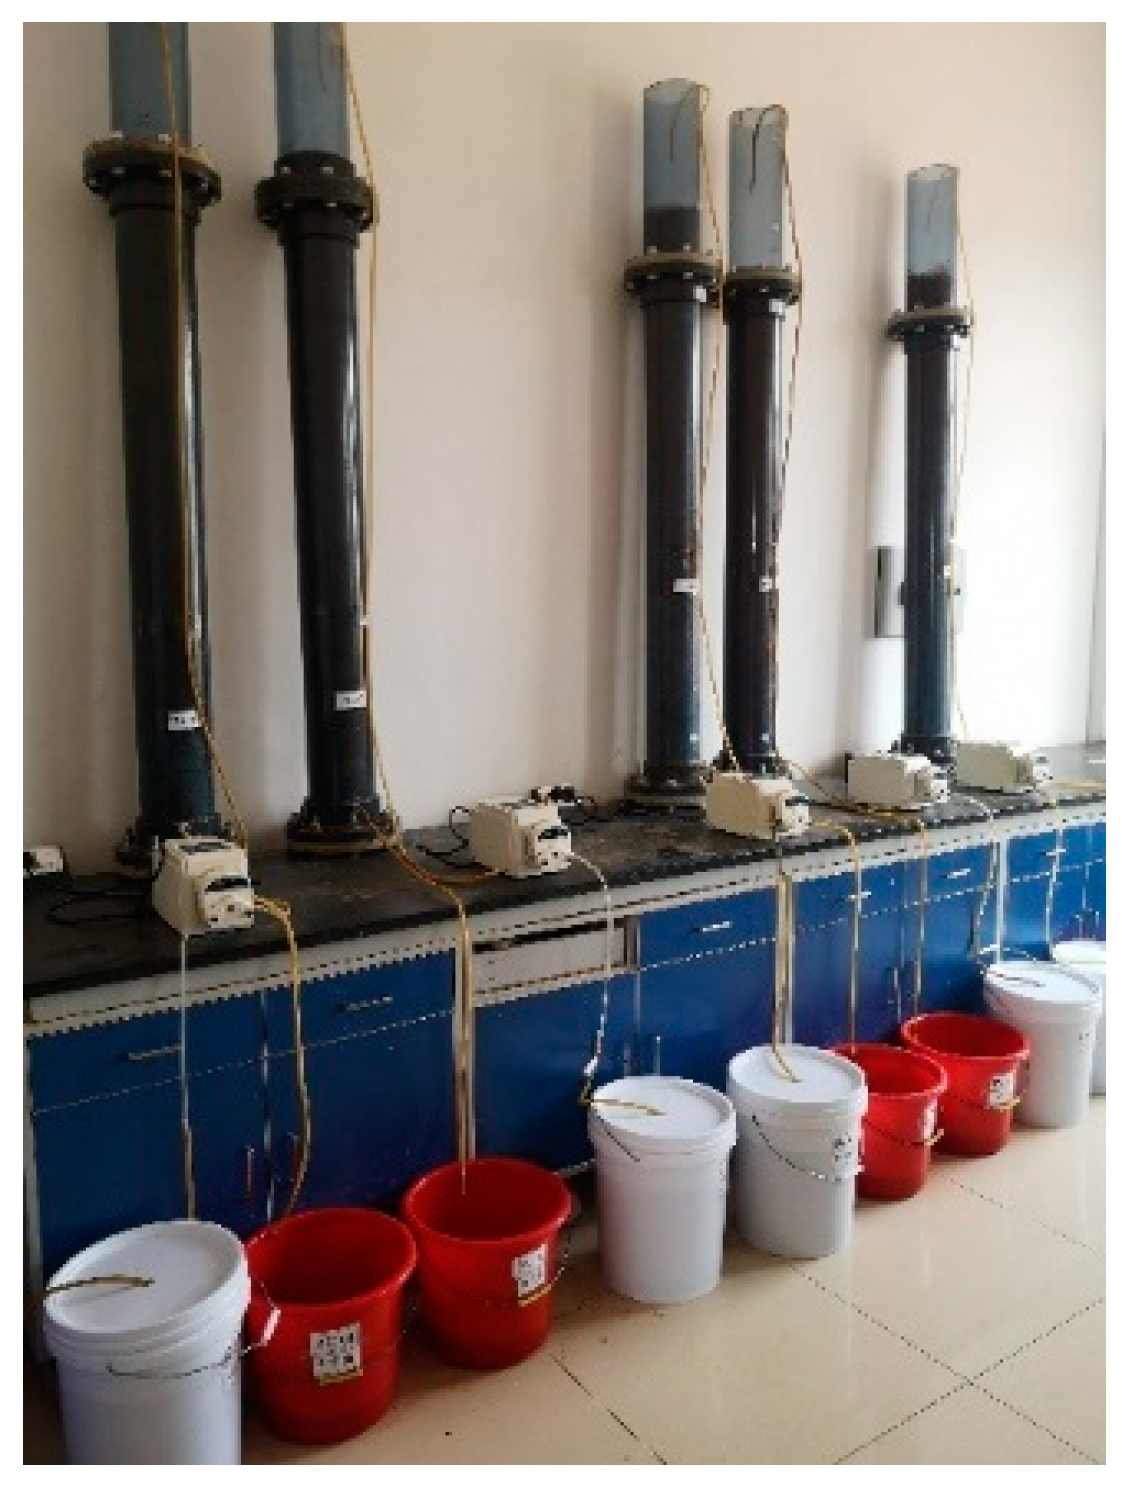
2.2. Leaching Process

Approximately 40 kg of ore samples were placed in an acrylic column with dimensions of 150 mm diameter × 2000 mm. Gravel was placed at the bottom of the column, and cotton was placed at the top of the ore. During the column loading process, the leaching column was laid down first, and the ore was poured into the column. The column mouth was slightly lifted to allow the ore to slowly slide to the bottom of the column, preventing the ore from becoming compacted and affecting permeability. This process was repeated until the required amount of ore was loaded. Each leaching column was equipped with a pre-leaching solution tank, a post-leaching solution tank, and a constant-flow pump. The leaching solution was quantitatively dripped using a peristaltic pump, with the input/output volume recorded daily. The flow rate of the constant-flow pump was calibrated at regular intervals, and samples were taken to analyze the metal content. The leaching rate and acid consumption were calculated to determine the optimal leaching process parameters.
The initial conditions were set as follows: particle size of 10–40 mm, spraying rate of 5–20 L/m2·h, pre-leaching solution acidity of 10–30 g/L, and a leaching regime of 24-h continuous spraying (adjusted according to actual permeability). The test ended when the daily leaching rate was under 0.5% for three consecutive days. The height of the post-leaching ore was measured to calculate the volume ratio before and after leaching. Before dismantling the column, water (or low-acid water) was sprayed to collect the post-leaching solution remaining in the column. The copper in this washing solution was included in the total leaching rate calculation. The column was then unloaded, the ore was emptied, dried, and weighed, and the residue rate was calculated. The leaching equipment is shown in Figure 2.
The leaching rate was determined using Equation (1) based on the elemental content in the leaching residue [26,27], where η—leaching rate (%), ω0—mass of the metal in the original ore (g), and ω—mass of the metal in the leaching residue (g):
η = ω 0 ω ω 0 100 %

3. Process Mineralogy

3.1. Elemental Analysis

The sample was mixed, crushed, and split into approximately 1 kg. The sample was then ground for 5 min to create a powdered sample. The powdered sample was mixed again and split using the quartering method. Three sets of parallel samples were taken for chemical analysis. The averaged results are shown in Table 2.

3.2. Particle Size Analysis

A total of 1 kg of ore sample was wet-sieved to determine the particle size distribution (Table 3).
From Table 3, the ore sample has a higher proportion of coarse particles and relatively fewer fine particles.
Table 4 presents the distribution of elements across different particle size fractions. From Table 4, it can be observed that copper, cobalt, iron, and manganese are primarily distributed in both coarse particles (>4.75 mm) and fine particles (<0.075 mm). Calcium and magnesium are mainly present in coarse particles larger than 4.75 mm.

3.3. Chemical Phase Analysis

The ore sample was finely ground to ensure that 100% passed through a 0.074 mm sieve. The chemical phase analysis for copper, cobalt, and calcium was then performed. The results are shown in Table 5.

3.4. Mineral Composition and Relative Abundance

The main copper minerals in the ore are primarily malachite, with minor amounts of chrysocolla. Trace amounts of covellite, chalcopyrite, and pseudo-malachite are also present. The predominant cobalt mineral is heterogenite, with traces of linnaeite. Other metallic minerals include primarily goethite, with small amounts of siderite and traces of pyrite. Non-metallic minerals consist mainly of quartz, followed by calcite and muscovite. There are also minor quantities of talc, chlorite, and trace amounts of orthoclase, amphibole, apatite, kaolinite, biotite, and celadonite. The mineral composition and relative abundance in the sample are characterized through AMICS and detailed in Table 6.

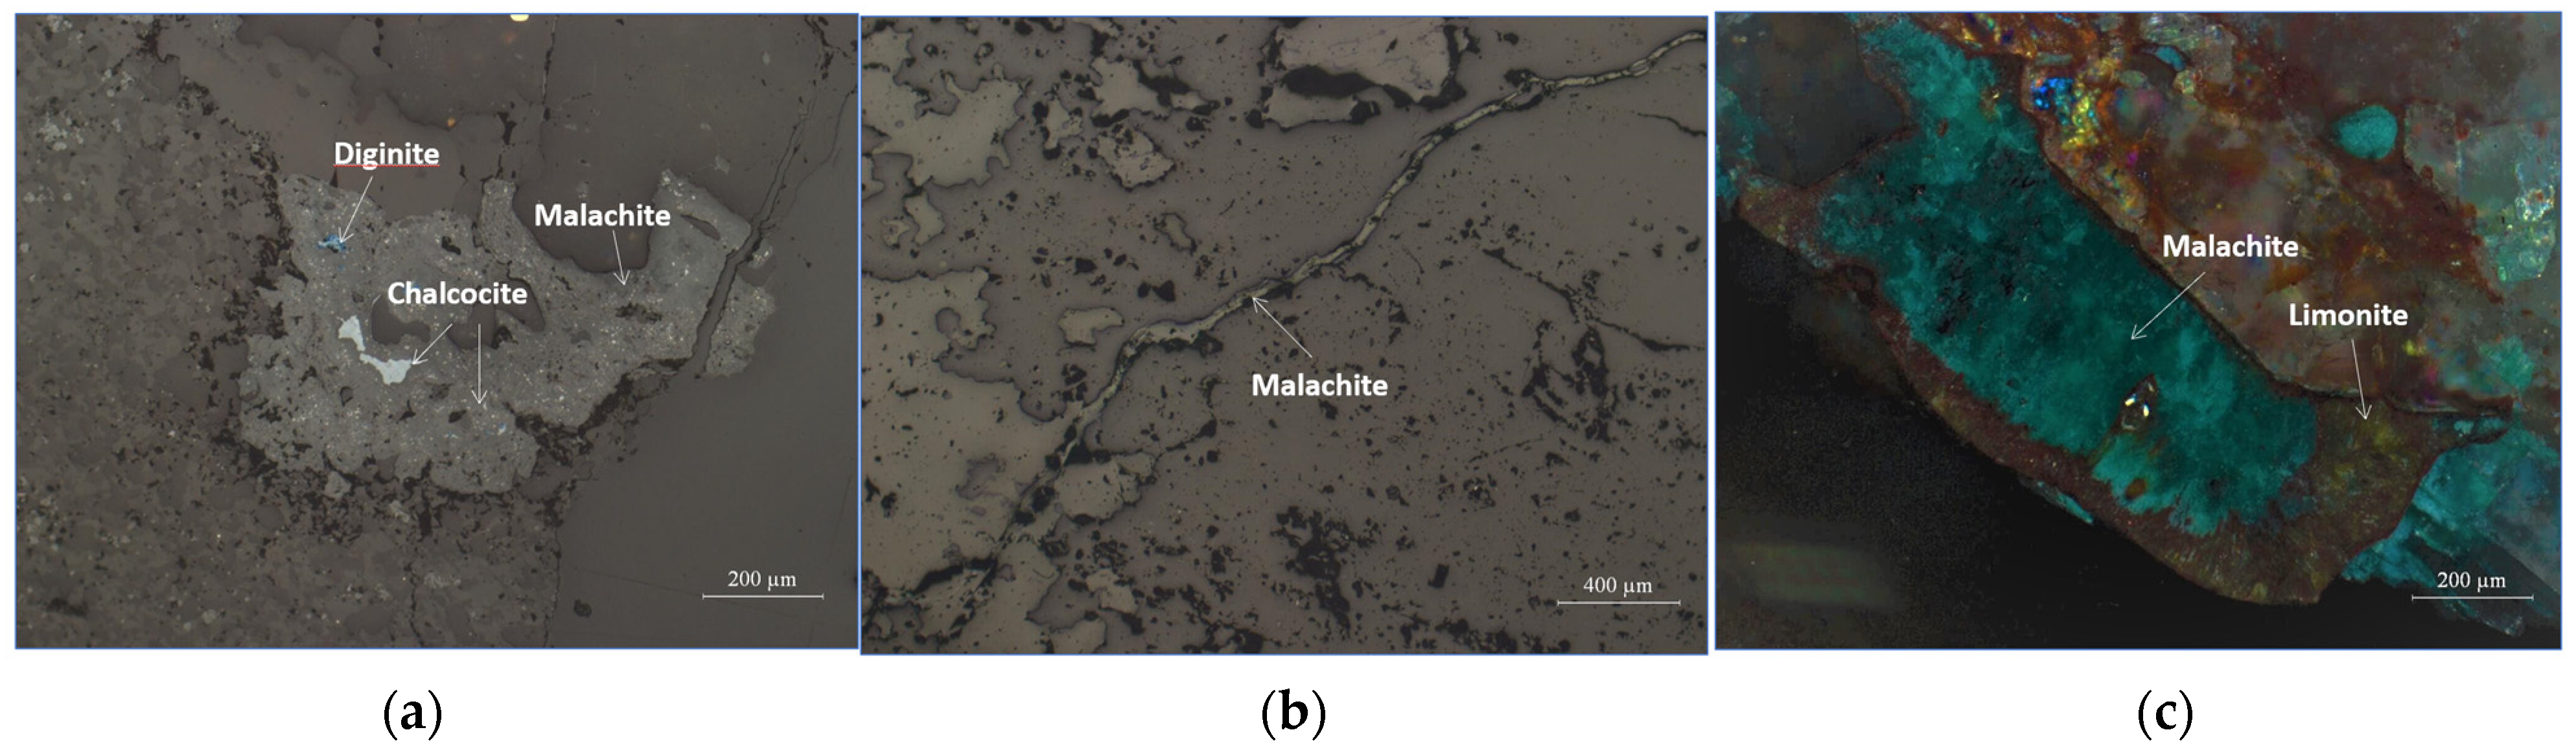
3.5. Mineral Distribution Characteristics

Malachite is primarily distributed within the interstices, fractures, or cavities of quartz and other vein minerals. It is closely associated with chrysocolla in some areas and occasionally embedded with covellite and azurite (Figure 3a). The embedding grain size distribution of malachite is uneven, mostly between 0.1 mm and 0.2 mm (Figure 3b) and occasionally up to 0.4 mm in size (Figure 3c). Heterogenite predominantly appears irregularly or in vein-like patterns embedded within the interstices or fractures of quartz and other minerals. Occasionally, heterogenite can be observed closely embedded with malachite within the fractures of vein minerals. The embedding grain size distribution of heterogenite varies, mostly between 0.05 mm and 0.1 mm.

3.6. Occurrence States of Copper, Cobalt, Calcium, and Magnesium

Copper and cobalt primarily exist in oxide forms. Copper minerals are predominantly malachite (Cu2CO3(OH)2), with minor amounts of chrysocolla ((Cu,Al)2H2Si2O5(OH)4·nH2O) and trace amounts of chalcocite (Cu2S), bornite (Cu5FeS4), and pseudo-malachite (Cu5[PO4]2(OH)4). Cobalt minerals are mainly heterogenite (CoO(OH)), with trace amounts of sphaerocobaltite (CoCO3). Other metal minerals mainly include goethite (Fe2O3·nH2O), with lesser amounts of siderite (FeCO3) and pyrite (FeS2). Non-metallic minerals are primarily quartz, followed by dolomite (CaMg(CO3)2), muscovite (KAl2[AlSi3O10](OH)2), with small amounts of talc (Mg3(Si4O10)(OH)2) and chlorite ((Mg,Fe,Al)3(OH)5{(Mg,Fe,Al)3[(Si,Al)4O10](OH)2}). The distribution of metals is assessed using AMICS as well as optical microscopy.
The distribution of copper across these minerals is detailed in Table 7.
The distribution of cobalt is detailed in Table 8.
The distribution of calcium is detailed in Table 9.
The distribution of magnesium is detailed in Table 10.

4. Analysis of Leaching Mechanisms

4.1. Leaching Mechanism of Copper-Bearing Minerals

(1)
Leaching of copper oxide minerals: Malachite is a copper carbonate mineral (Cu2CO3(OH)2) belonging to the monoclinic crystal system. Its crystals are often prismatic or needle-like. Malachite is readily leached with acids. In a sulfuric acid leaching system, the chemical reaction proceeds as shown in Equation (2) [28]:
Cu2CO3(OH)2 + 2H2SO4 = 2CuSO4 + 3H2O + CO2
(2)
Leaching of copper sulfide minerals: Copper sulfide minerals include chalcocite and bornite, although they are present in very low quantities and are difficult to leach under conventional conditions. Leaching typically requires bacterial action or high-temperature oxidative conditions. In a sulfuric acid leaching system, chalcocite and bornite react directly with sulfuric acid, potentially undergoing the chemical reactions shown in Equations (3) and (4) [28]:
Cu2S + H2SO4 = Cu2SO4 + H2S↑
2Cu5FeS4 + 8H2SO4 = 5Cu2SO4 + Fe2(SO4)3 + 3H2S↑
It should be noted that these reactions typically do not occur to any significant extent in sulfuric acid solutions because the cuprous ion Cu+ is unstable in the absence of a suitable complexing agent, such as ammonia, cyanide, or chloride. These copper sulfide minerals usually require oxidation, such as ferric. In the sulfuric acid medium, cuprous ions will undergo the disproportionation reaction [29,30].

4.2. Leaching Mechanism of Cobalt-Bearing Minerals

Cobalt minerals primarily include heterogenite and minor amounts of cobalt carbonate (CoCO3). In heterogenite, cobalt exists in both lower oxidation states (CoO and CoCO3) and higher oxidation states (Co2O3). Lower-oxidation state cobalt oxides are readily leached with sulfuric acid solutions, while higher oxidation state cobalt oxides are more challenging to leach and require high-temperature, high-acidity, or reductive leaching conditions for effective extraction. In conventional sulfuric acid leaching systems, the cobalt oxides may undergo the reactions given in Equations (5)–(9) [28]:
CoO + H2SO4 = CoSO4 + H2O
CoCO3 + H2SO4 = CoSO4 + H2O + CO2
2Co(OH)3 + 3H2SO4 = Co2(SO4)3 + 6H2O
Co(OH)2 + H2SO4 = CoSO4 + 2H2O
Co3O4 + 4H2SO4 = CoSO4 + Co2(SO4)3 + 4H2O

4.3. Leaching Mechanism of Other Metal Minerals

Other metal minerals mainly include goethite and minor amounts of siderite. Goethite, with a composition of Fe2O3·nH2O, typically contains 30%–40% iron. It is not a standalone mineral but a mixture predominantly composed of iron hydroxides like goethite, hydrated silica, and clays. For thermodynamic calculations, goethite is often used as a representative component. In a sulfuric acid leaching system, the reactions given in Equations (10)–(12) may occur [31]:
2FeO(OH) + 3H2SO4 = Fe2(SO4)3 + 4H2O
FeCO3 + H2SO4 = FeSO4 + H2O + CO2
4FeSO4 + O2 + 2H2SO4 = 2Fe2(SO4)3 + 2H2O
It should be noted that the oxidation of ferrous to ferric in a sulfuric acid system generally requires bacteria; the reaction directly with molecular oxygen is very slow without it.

4.4. Leaching Mechanism of Gangue Minerals

The primary gangue minerals are quartz, followed by dolomite, muscovite, and minor amounts of talc and chlorite.
(1)
Quartz: a gangue mineral with stable physical and chemical properties, belonging to the trigonal crystal system. As an oxide mineral, quartz reacts with hydrofluoric acid but does not react with sulfuric acid, hydrochloric acid, or nitric acid.
(2)
Dolomite: a calcium magnesium carbonate CaMg(CO3)2, belonging to the trigonal crystal system. In a sulfuric acid leaching system, dolomite reacts with sulfuric acid, as given in Equation (13) [26]:
CaMg(CO3)2 + 2H2SO4 = CaSO4·2H2O↓ + MgSO4 + 2CO2
(3)
Muscovite: a silicate mineral KAl2[AlSi3O10](OH)2, belonging to the monoclinic crystal system. The ideal composition involves Al3+ in the octahedral sites, which can be partially substituted by Fe3+, Mg2+, Fe2+, Mn2+, V, and other metal ions. In a sulfuric acid leaching system, muscovite can react with sulfuric acid, as given in Equation (14) [26]:
2KAl2[AlSi3O10](OH)2 + 10H2SO4 = K2SO4 + 3Al2(SO4)3 + 6SiO2↓ + 12H2O
(4)
Talc: a tri-octahedral mineral Mg3(Si4O10)(OH)2. It typically occurs in massive, platy, fibrous, or radial forms, known for its softness and greasy feel. In a sulfuric acid leaching system, talc may react with sulfuric acid, as given in Equation (15) [26]:
Mg3(Si4O10)(OH)2 + 3H2SO4 = 3MgSO4 + 4SiO2↓ + 4H2O
(5)
Chlorite: a special 2:1-type hydrated layered aluminosilicate mineral with a general formula Y3[Z4O10](OH)2·Y3(OH)6, in the formula, Y represents Mg2+, Fe2+, Al3+, and Fe3+, while Z represents Si and Al.

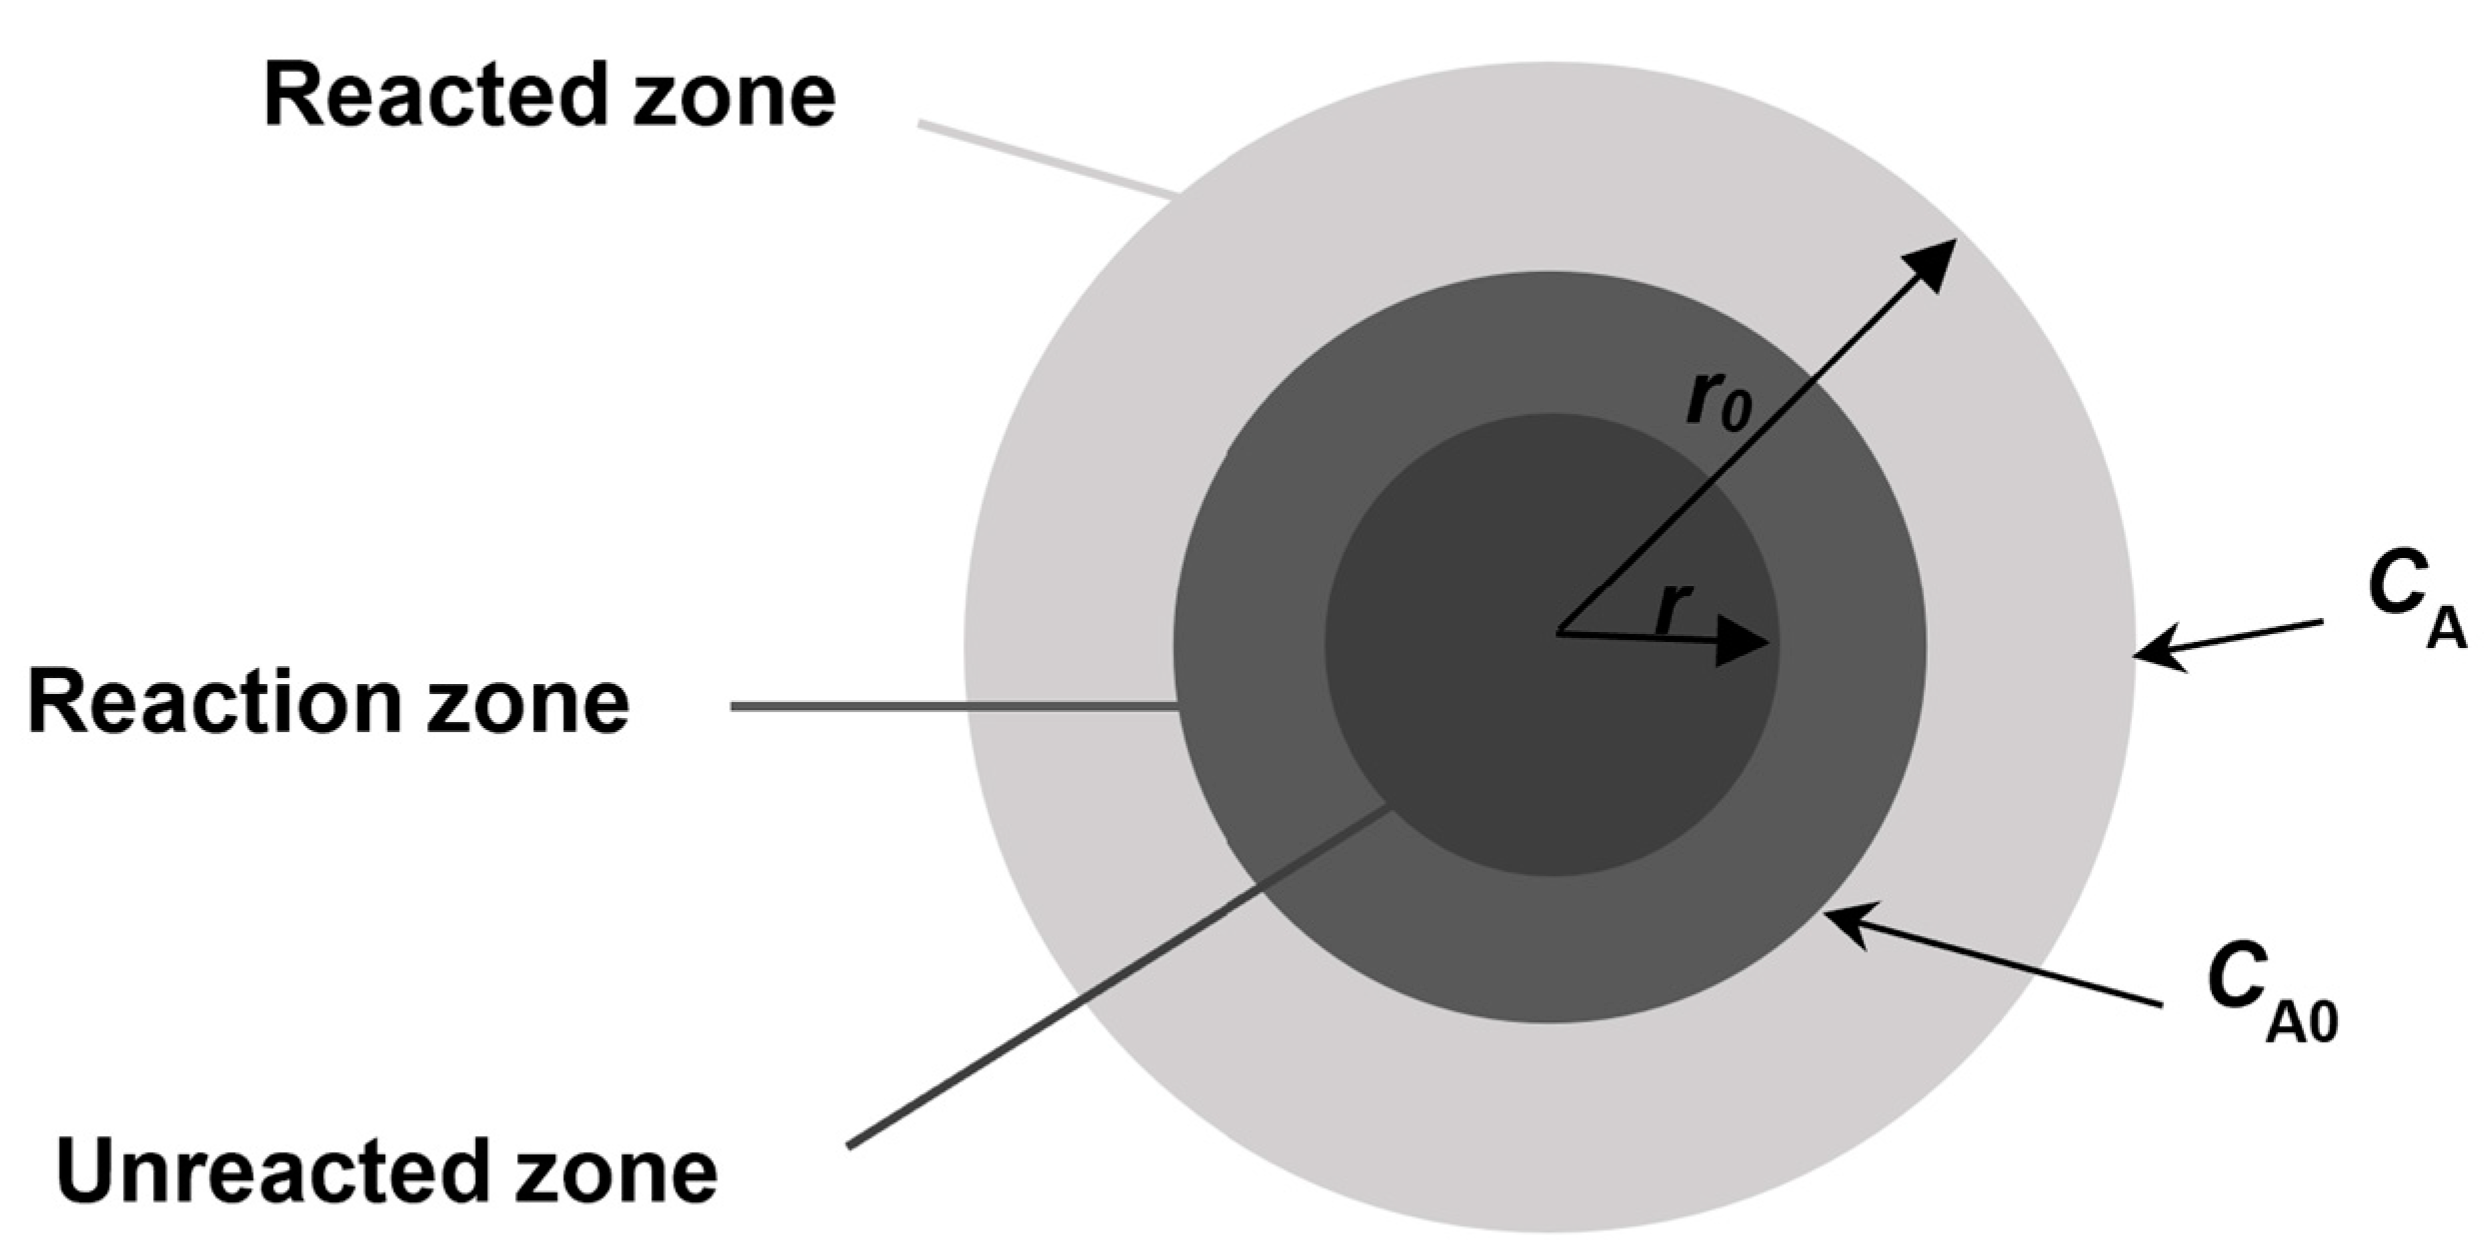
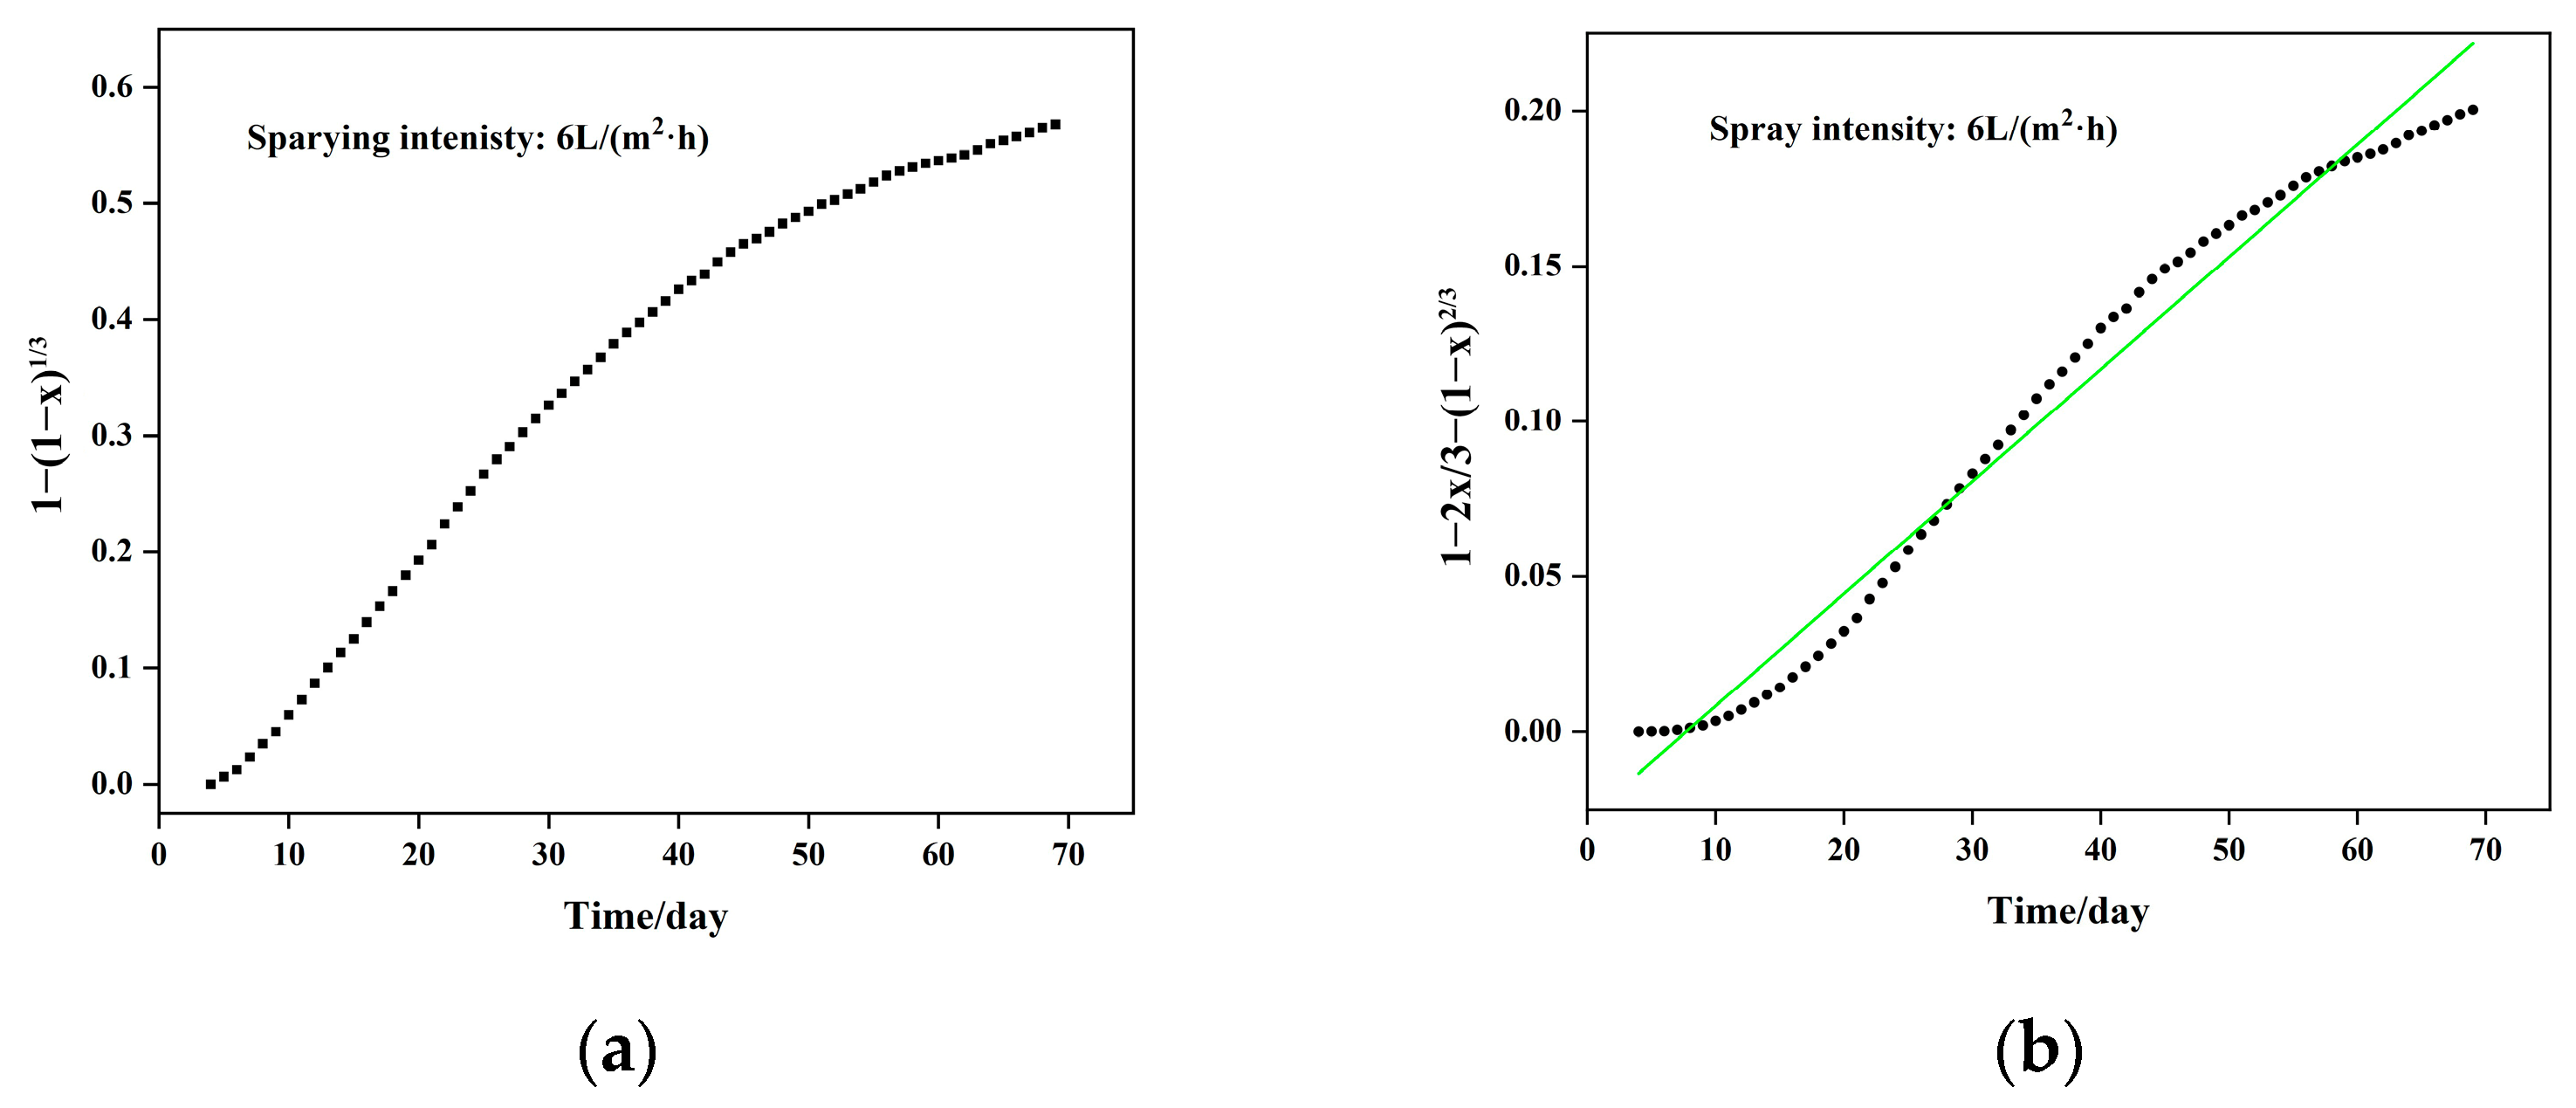
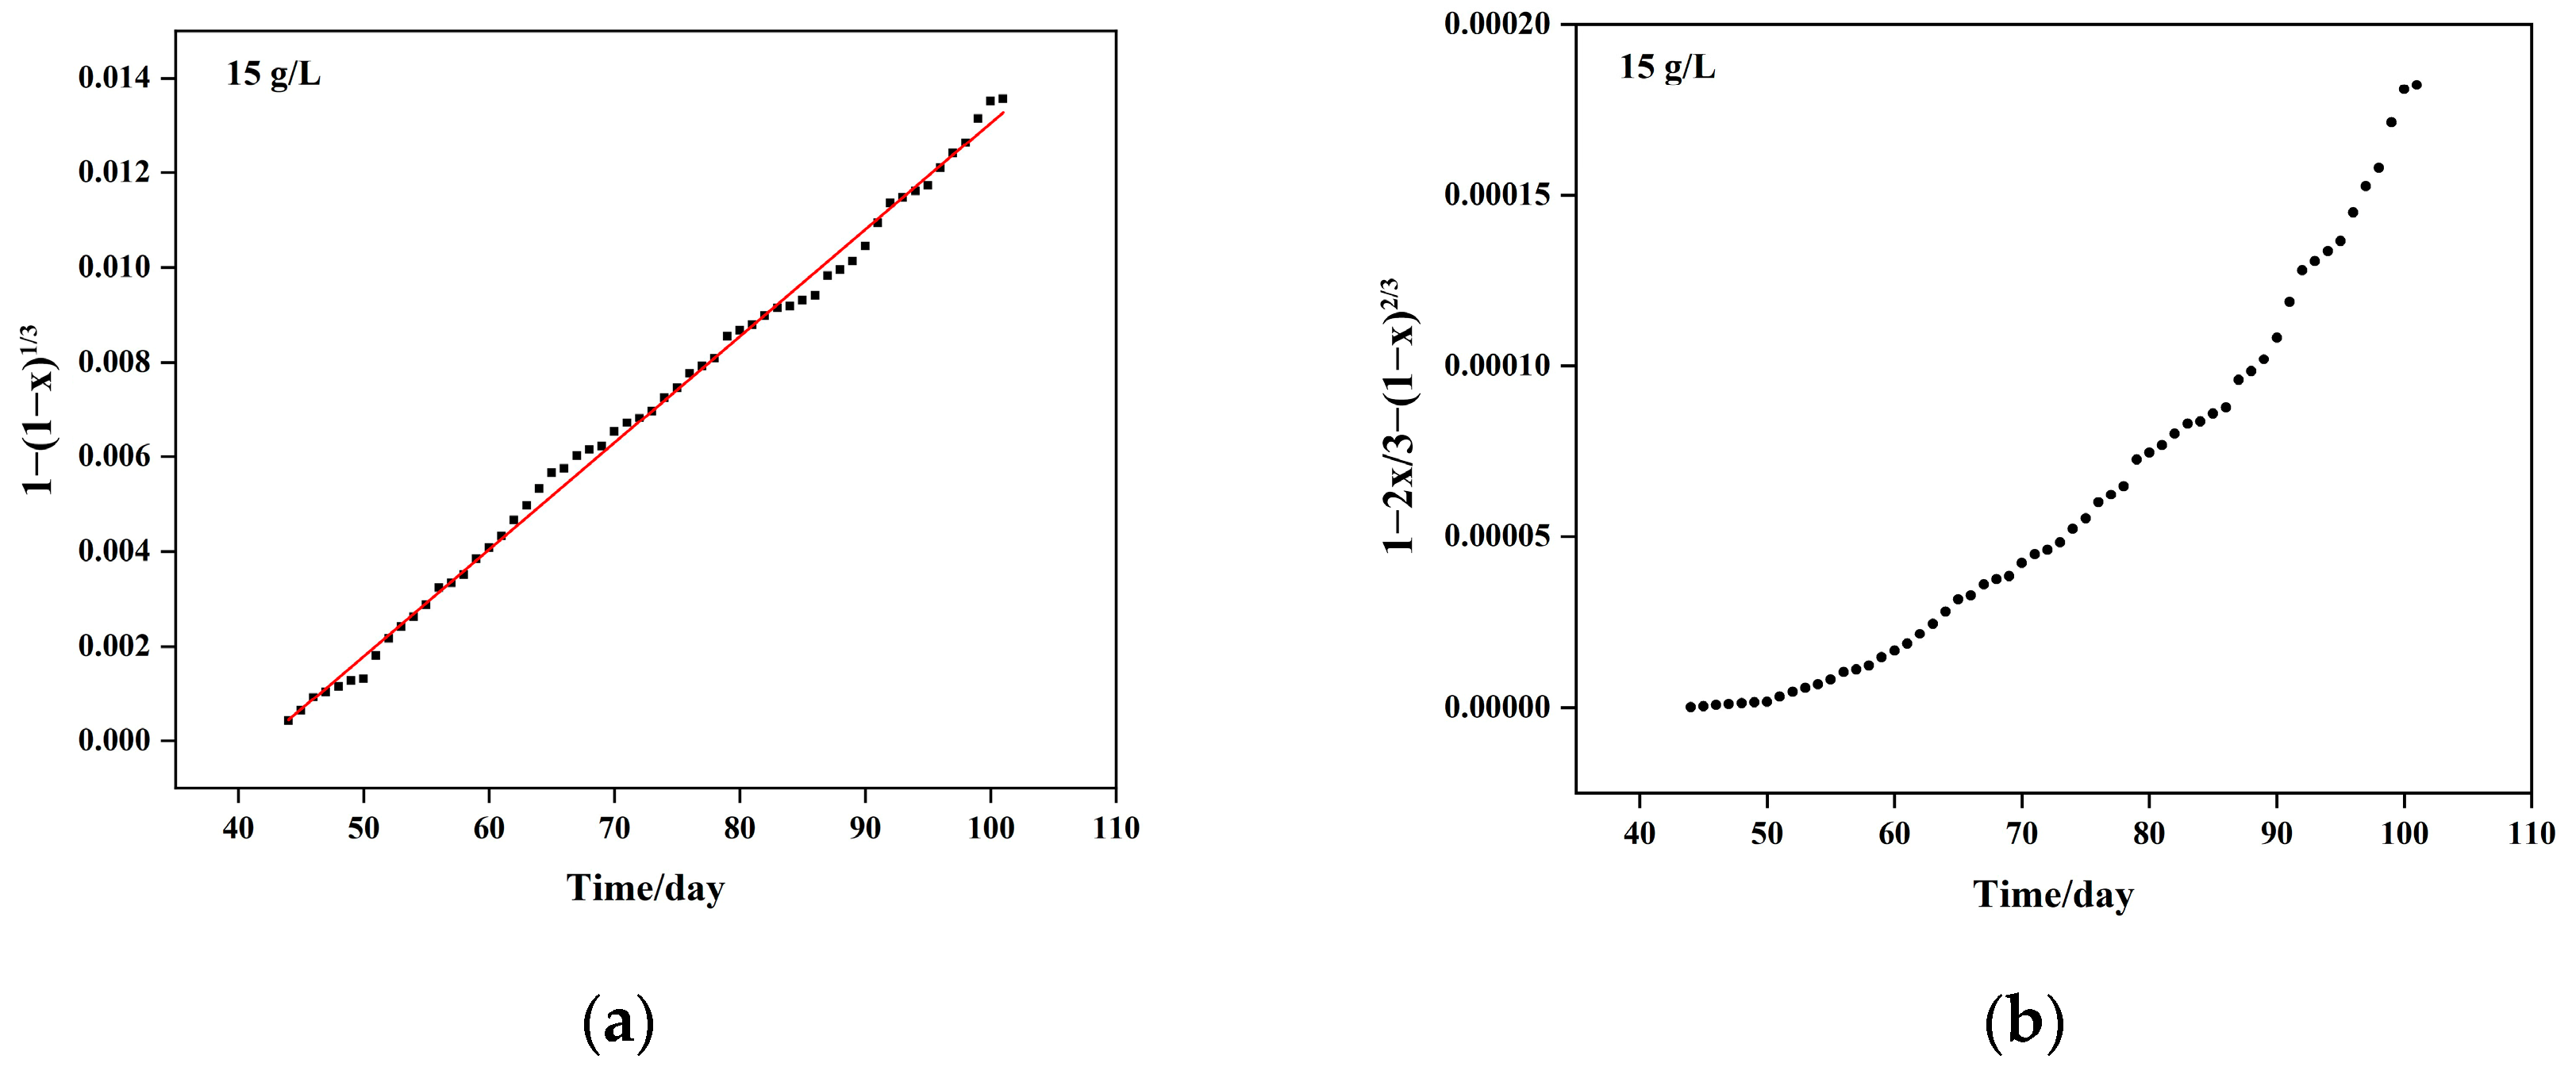
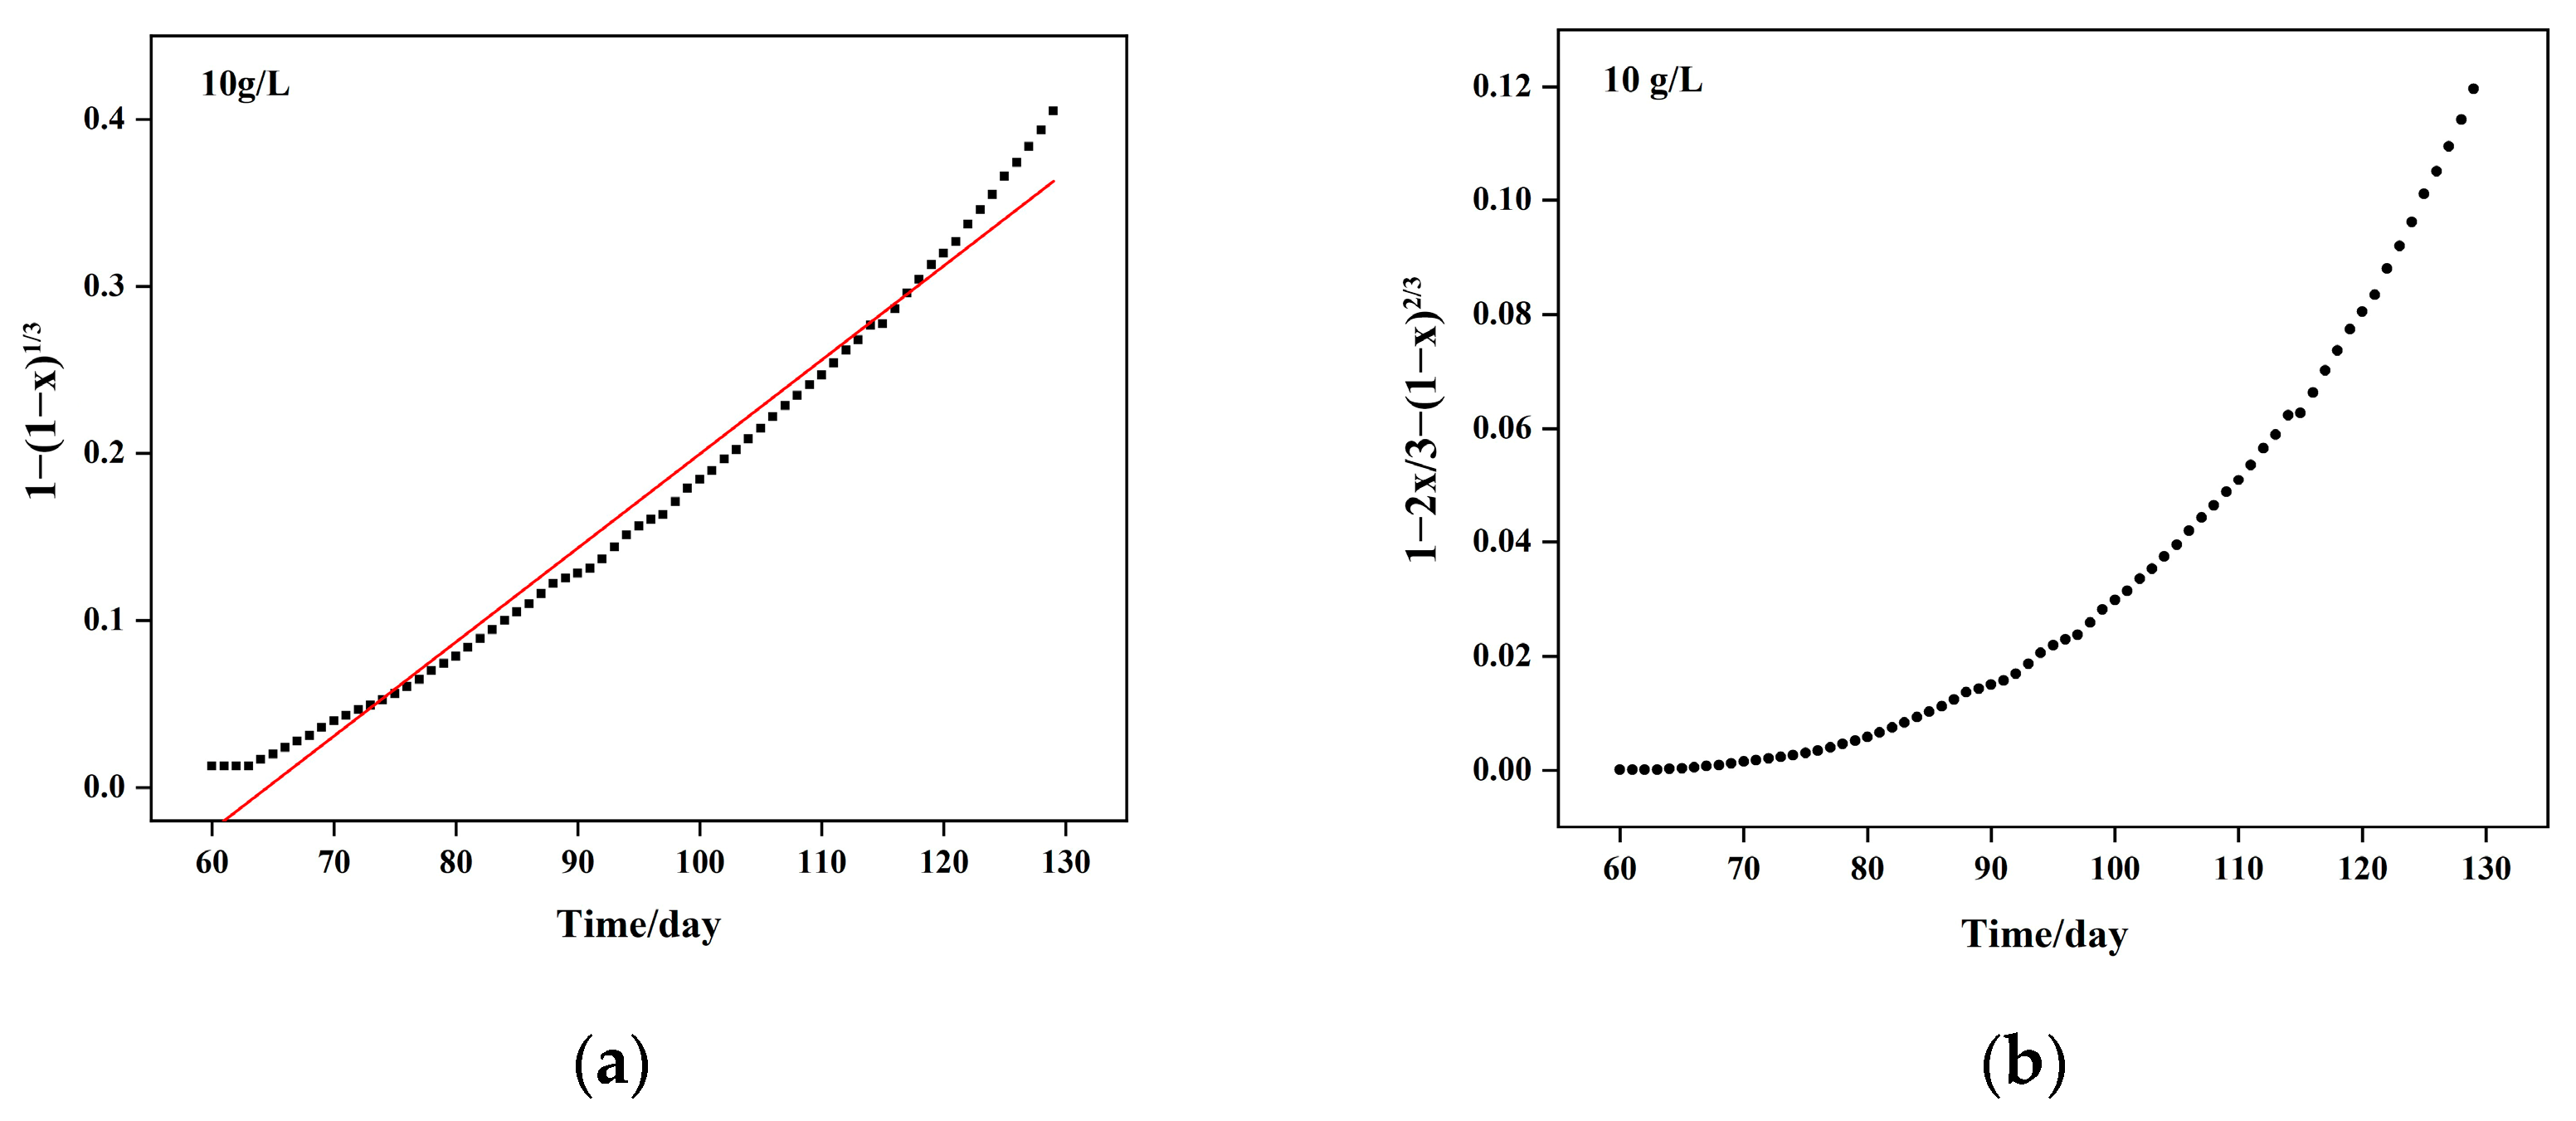
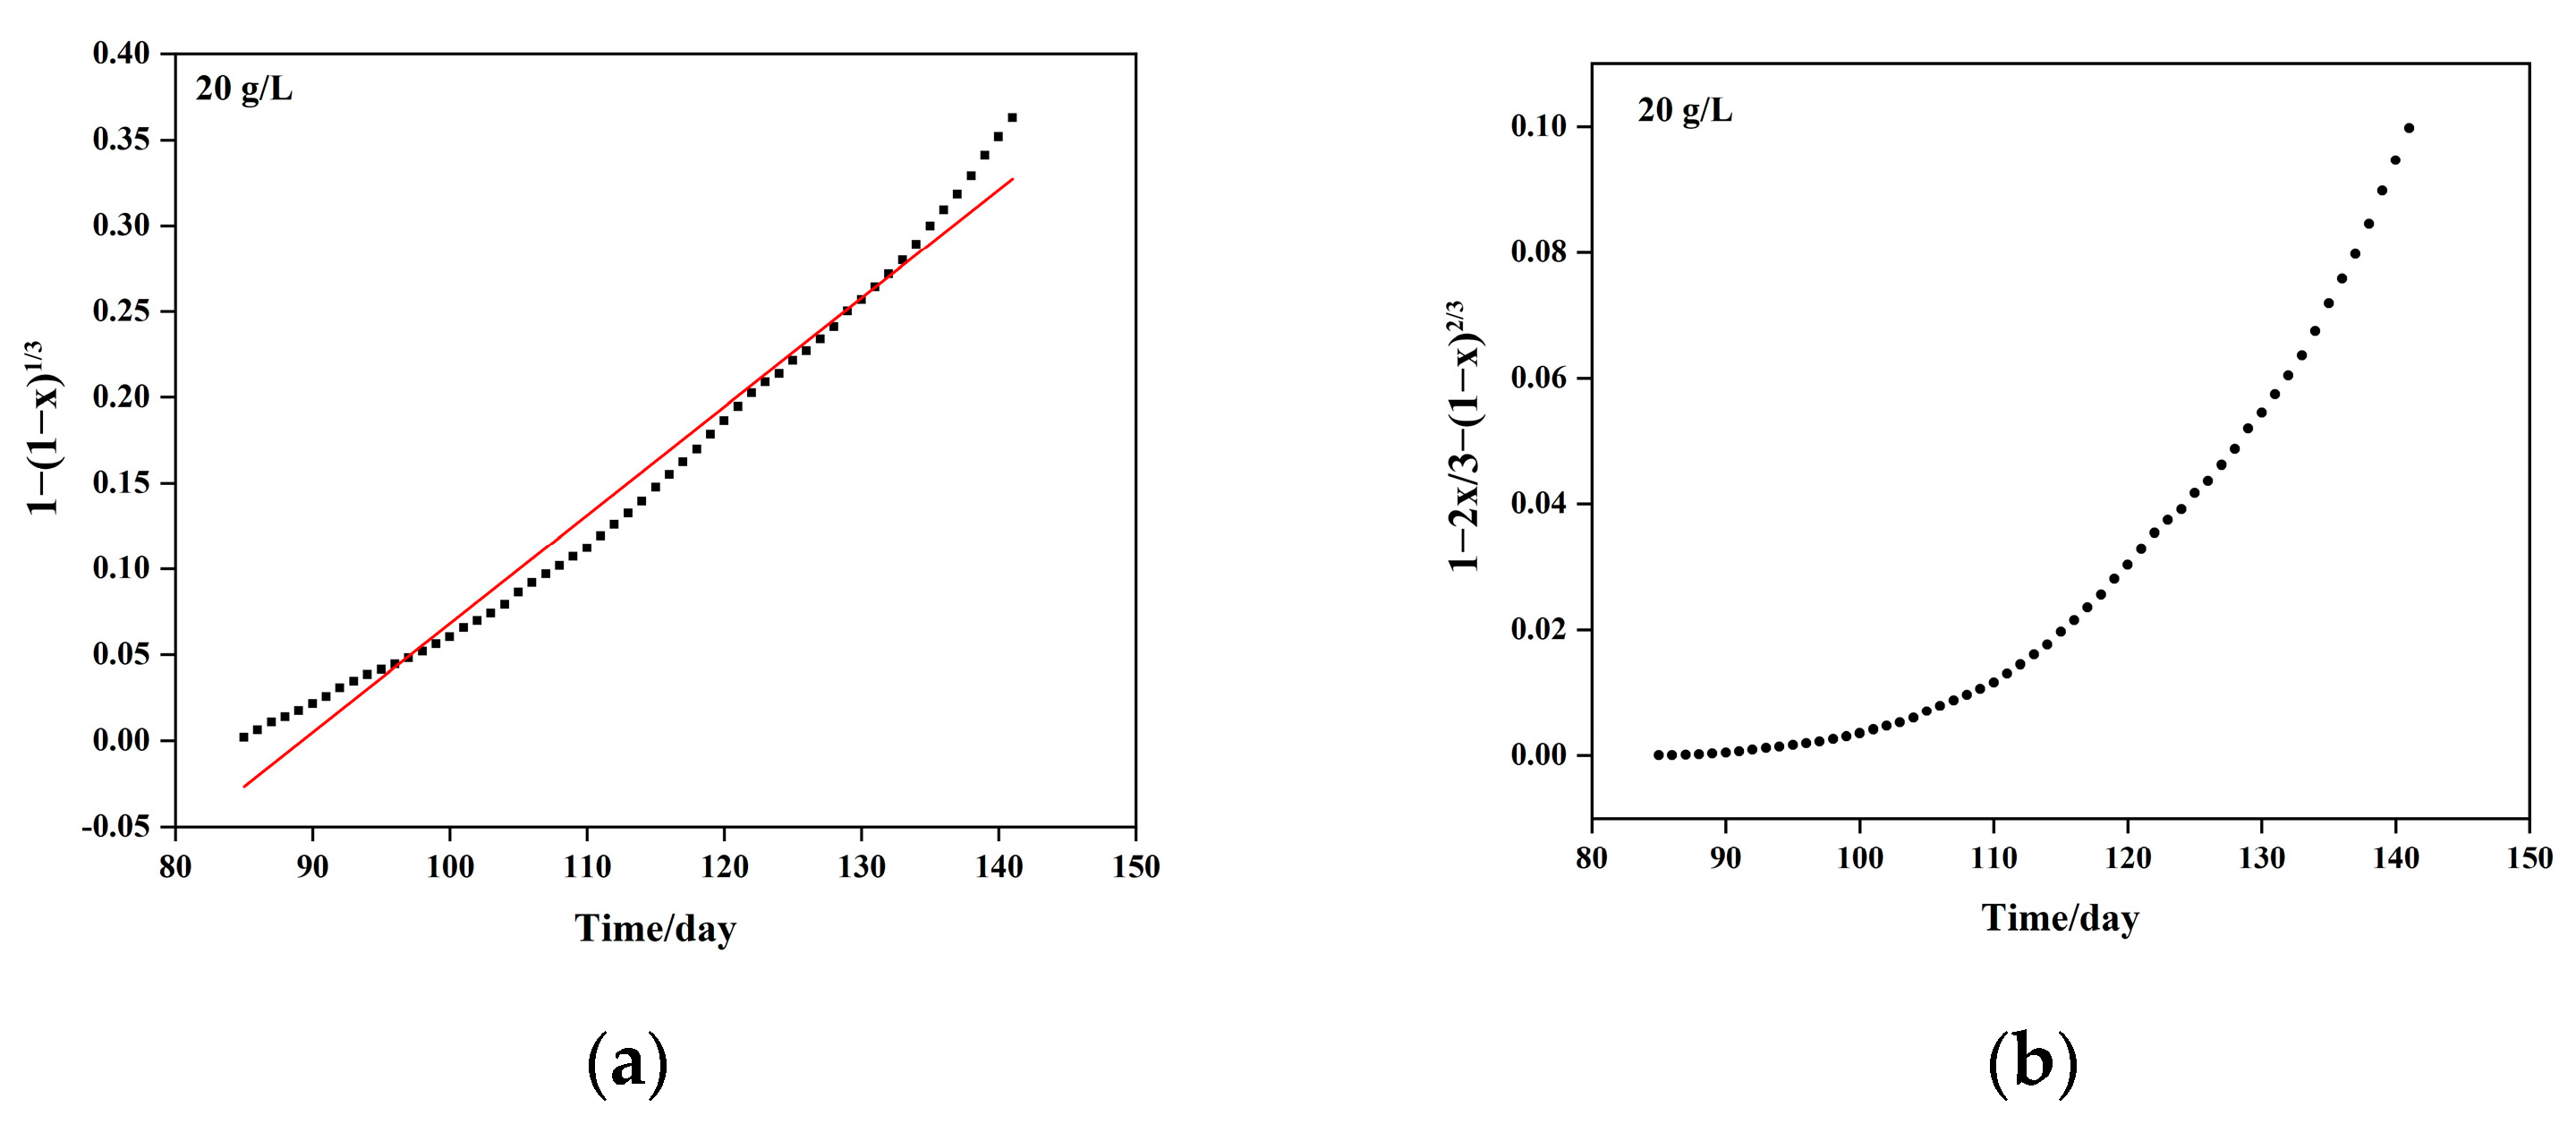
5. Leaching Kinetics Analysis

The column leaching process is a complex mass transfer process involving physical and chemical coupling actions such as convection, dispersion, and chemical reactions within the ore heap, presenting a complex dynamic change process. In oxide copper–cobalt ores, gangue minerals are the primary minerals, with valuable components of oxide copper ores constituting only a very small portion. During the leaching process, the solution gradually infiltrates from the surface of the ore to the interior. When the acid-containing solution comes into contact with the oxide copper minerals, the oxide copper will be leached by sulfuric acid. A schematic diagram of this leaching process is shown in Figure 4.
The specific steps of the reactions occurring in the process are as follows:
① Solution penetration and diffusion into the ore: the solution gradually penetrates and diffuses into the interior through the pores between the ore heap and the cracks in the ore.
② Chemical reaction between sulfuric acid and minerals: the sulfuric acid that has diffused to the surface of the copper oxide reacts with the copper oxide to form copper sulfate.
③ Leachate diffusion to the outside of the ore: the leaching solution containing copper sulfate diffuses from the surface of the copper oxide through the gangue layer to the outer solution.
Generally, the chemical reaction between copper oxide and sulfuric acid is relatively fast. The primary factor determining the speed of column leaching is the diffusion rate of sulfuric acid and copper sulfate through the gangue mineral layer.
The rate of column leaching is controlled by the dispersion of the solution and solute. The diffusion in the gangue layer follows steady-state diffusion, with the diffusion rate defined in Equation (16):
V = DA   δ C δ D
where V is the diffusion rate; D is the diffusion coefficient; A is the diffusion area; δ C is the concentration difference of the diffusing substance as it passes through the gangue mineral layer in the ore; and δ D is the gangue layer’s thickness during diffusion.
In the actual leaching process, different gangue layers have varying diffusion coefficients. Even within the same gangue layer, differences in physical structure can lead to different diffusion coefficients. Additionally, the diffusion area varies significantly across different copper oxide particles. During the actual diffusion process, as the solution passes over the ore surface, a diffusion layer exists between the solution bulk and the mineral surface. Both the reacting sulfuric acid and the produced copper sulfate also have diffusion layers between the gangue layer surface and the reaction interface. When copper oxide is located on the surface of the ore particles, there is no diffusion process within the gangue layer of the ore.
Based on extensive research, Braun et al. proposed the “Zone Leaching Model” [26,32], as illustrated in Figure 5.
This model points out that the ore is divided into three zones: the reacted zone, the reaction zone, and the unreacted zone. There are distinct boundaries between these zones. The leaching agent in the solution diffuses through the gangue layer into the reaction zone. The thickness of the reaction zone is relatively small, and as the reaction progresses, the reaction zone continuously moves toward the center of the ore block.
The chemical reaction equations can be described in Equation (17):
a A ( aq ) + b B ( s ) = c C ( aq ) + d D ( s )
The chemical reaction rate can be expressed in Equation (18):
d n B d t = 4 π r 2 δ ϕ n p A p k r C As
In Equations (17) and (18):
n B represents the moles of the leachable mineral B.
δ represents the thickness of the reaction zone.
ϕ represents the geometric factor for correcting deviations for a sphere.
n p represents the average area of mineral particles per unit volume of gangue.
A p represents the average area of each mineral particle in the reaction zone.
k r represents the rate constant of the reaction between the mineral particles and the leaching agent.
C AS represents the average concentration of the leaching agent in the reaction zone.
Due to the fact that the leaching reaction of mineral particles only occurs within the reaction zone, as the reaction zone moves towards the center, new particles of each size fraction begin to undergo leaching reactions at the leading edge of the reaction zone (i.e., at position r ), while the old particles at the rear of the reaction zone (i.e., at position r + δ ) have already been completely leached. Therefore, it can be assumed that the effective area of the mineral within the unit volume of the reaction zone ( n p A p ) remains constant. The diffusion rate of the leaching agent through the reacted pores can be expressed in Equation (19):
d n B d t = 2 π r 2 ϕ × b a × D A × d C A d r
In Equation (19), a , b represents the stoichiometric coefficient of the leaching reaction.   D A   represents the effective diffusion coefficient of the leaching agent through the reaction zone.
D A = ε τ D A
In Equation (20), ε is the porosity of the ore, and τ is the tortuosity of the porosity.
Under steady-state conditions, d n B / d t in the reacted zone is constant for any r . Therefore, integrating Equation (19) yields:
d n B d t = 4 π r r 0 ϕ ( r 0 r ) × b a D A × ( C A C AS )
After eliminating C AS , the relationship with C A is as in Equation (22):
C AS = C A 1 + a r ( r 0 r ) b D A r 0 δ n p A p k r
Equation (22) can be substituted into Equation (21) to eliminate C AS , resulting in Equation (23):
d n B d t = 4 π r 2 C A ϕ × 1 δ n P A P k r + a r b D A r 0 ( r 0 r ) 1
Assuming the average radius r p of mineral particles, density ρ p , and block density ρ r , the grade G of the ore can be calculated using Equation (24):
G = n p A p r p ρ p 3 ρ r
Let
β = 3 ρ r δ k r r p ρ p
Substituting Equations (24) and (25) into Equation (23) yields Equation (26):
d n B d t = 4 π r 2 C A ϕ × 1 G β + a r b D A ( r 0 r ) 1
Since the ore contains both gangue and leachable minerals, the molar coefficient of mineral B in the block ore is related to the ore grade:
n B = 4 π r 3 ρ r G 3 M B
where M B represents the molar mass of mineral B. Differentiating Equation (27) with respect to time yields Equation (28):
d n B d t = 4 π r 2 M B ρ r G d r d t
Substituting Equation (28) into Equation (26), Equation (29) is obtained:
d r d t = M B C A ϕ ρ r G 1 G β + a r b D A r 0 ( r 0 r ) 1
Integrating Equation (29) under the condition that C A is constant, Equation (30) is obtained:
1 G β ( r 0 r ) + a b D A r 0 r 0 2 ( r 0 2 r 2 ) + 1 3 ( r 3 r 0 3 ) = M B C A ϕ ρ r G t
Substituting r = r 0 ( 1 x ) 1 / 3 into Equation (30), Equation (31) is obtained:
r 0 G β 1 ( 1 x ) 1 / 3 + a r 0 2 b D A 1 2 3 x ( 1 x ) 2 / 3 = M B C A ϕ ρ r G t
Equation (32) is obtained as follows:
β G r 0 1 ( 1 x ) 1 / 3 + 1 2 3 x ( 1 x ) 2 / 3 = γ G r 0 2 t
where β = 2 b D A a β and γ = 2 b M B C A D A a ϕ ρ r . f 1 = 1 ( 1 x ) 1 / 3 represents the equation governing solid-material layer diffusion control, while f 2 = 1 2 3 x ( 1 x ) 2 / 3 represents the equation governing chemical reaction control.
(1)
When the chemical reaction rate is very fast, Equation (32) can be simplified to 1 2 3 x ( 1 x ) 2 / 3 = k t , indicating that the leaching process is controlled by solid material layer diffusion.
(2)
When the solid material layer diffusion rate is very high, the leaching process is controlled by chemical reactions.
(3)
When the rates are comparable, the leaching process is controlled by a combination of chemical reaction and solid material layer diffusion, and the dynamic equation is Equation (32).

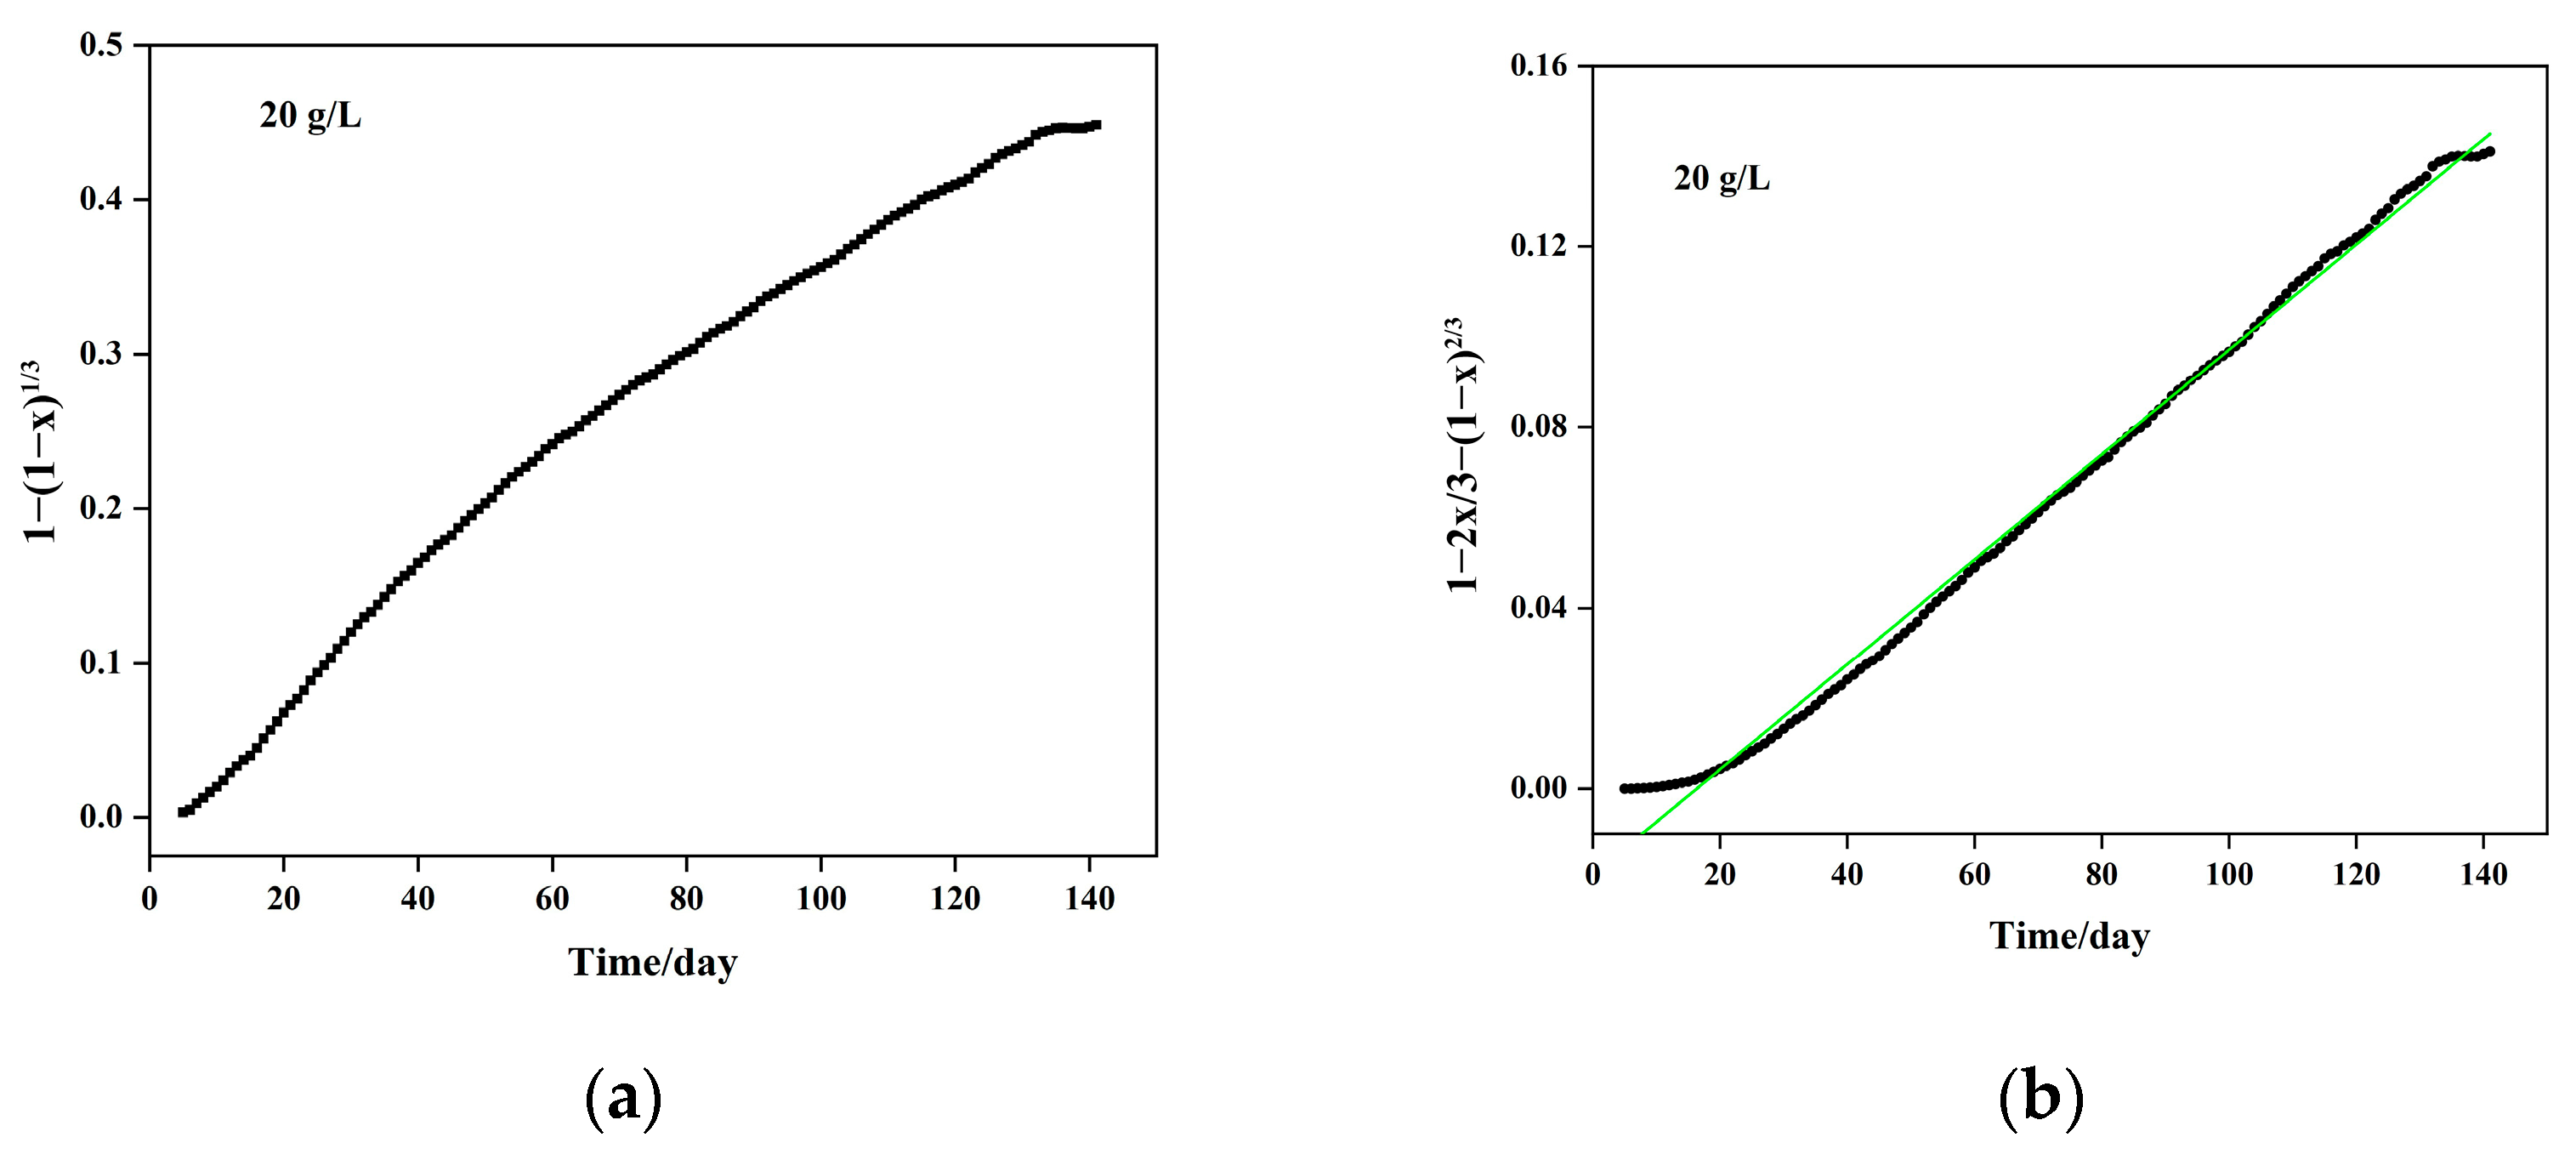
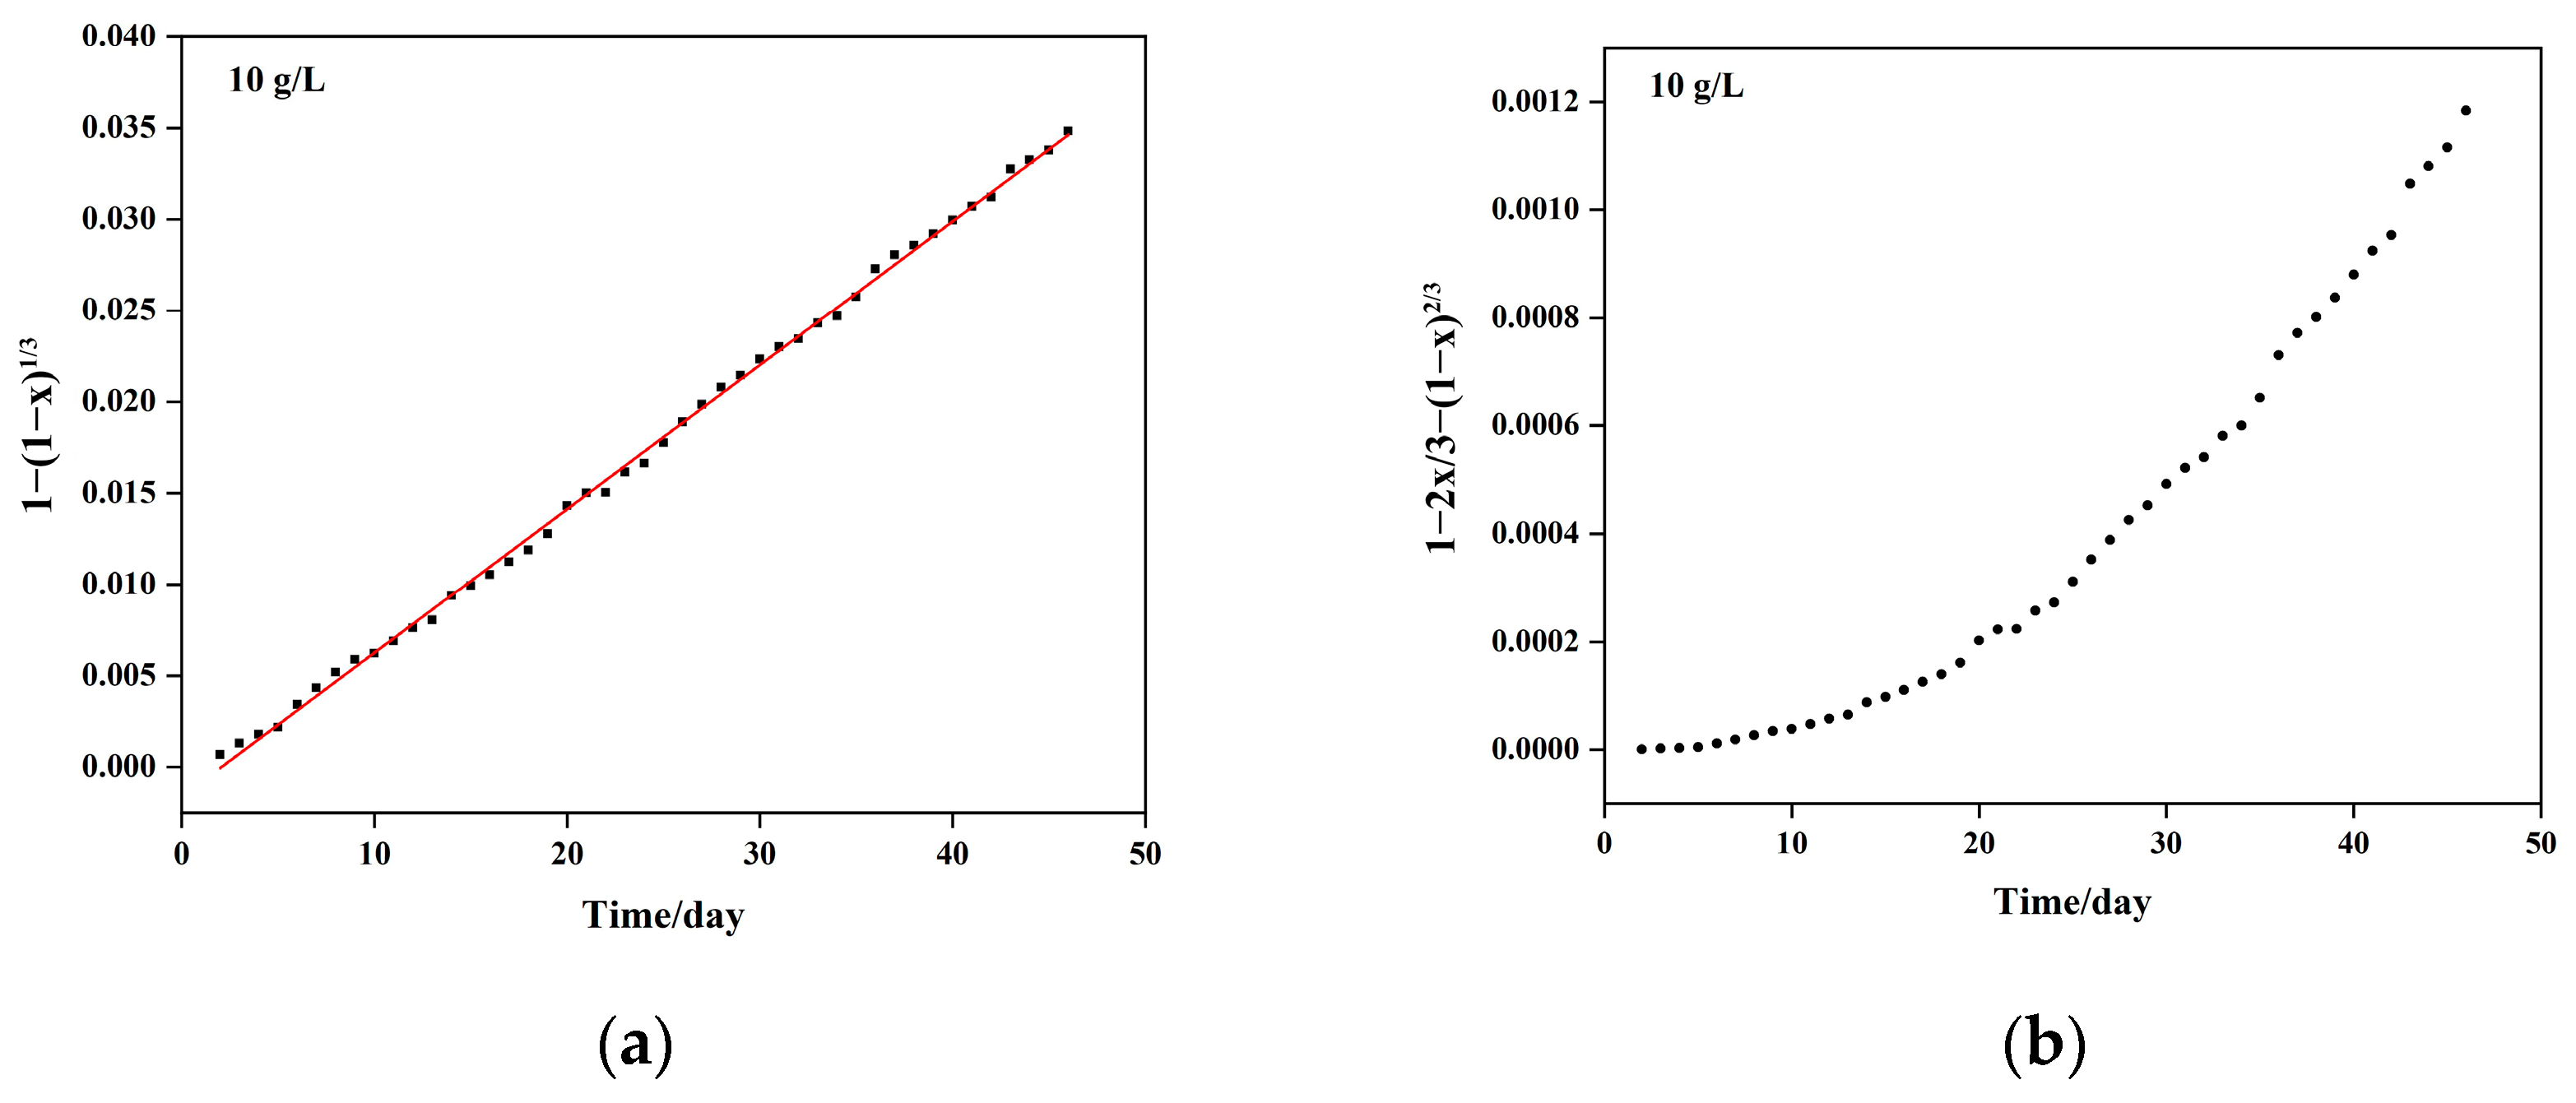
5.1. Column Leaching Kinetics of Copper

(1) Column leaching kinetics at different sulfuric acid concentrations.
Column leaching experiments were conducted under the conditions of spraying intensity 10 L/(m2·h) and material particle size <40 mm, with sulfuric acid concentrations of 10 g/L, 15 g/L, and 20 g/L. The experimental results are shown in Figure 6, Figure 7 and Figure 8.
From Figure 6a, it can be observed that at a sulfuric acid concentration of 10 g/L, 1 ( 1 x ) 1 / 3 t exhibits a linear relationship, indicating that copper leaching under this condition follows chemical reaction control. The kinetic equation for chemical control is equation 1 ( 1 x ) 1 / 3 = 2.23 × 10 3 t , with a coefficient of determination (R2) of 0.9951. The apparent reaction rate constant is 2.23 × 10⁻³ day−1.
From Figure 7, at a sulfuric acid concentration of 15 g/L, both 1 ( 1 x ) 1 / 3 t and 1 2 x / 3 ( 1 x ) 2 / 3 t show linear relationships, indicating that under these conditions, copper leaching is controlled by a combination of chemical reaction and solid material diffusion. Through linear fitting, the following results were obtained:
(1)
Chemical reaction control kinetics equation: 1 ( 1 x ) 1 / 3 = 3.313 × 10 3 t , with a correlation coefficient of R2 = 0.9918;
(2)
Solid material diffusion control kinetics equation: 1 2 x / 3 ( 1 x ) 2 / 3 = 7.774 × 10 4 t , with a correlation coefficient of R2 = 0.9828. Combining the chemical reaction and diffusion control kinetics equations, the resulting mixed control kinetics equation is represented as: 1 ( 1 x ) 1 / 3 + 1 2 x / 3 ( 1 x ) 2 / 3 = 4.090 × 10 3 t , with an apparent reaction rate constant of 4.090 × 10⁻³ day−1.
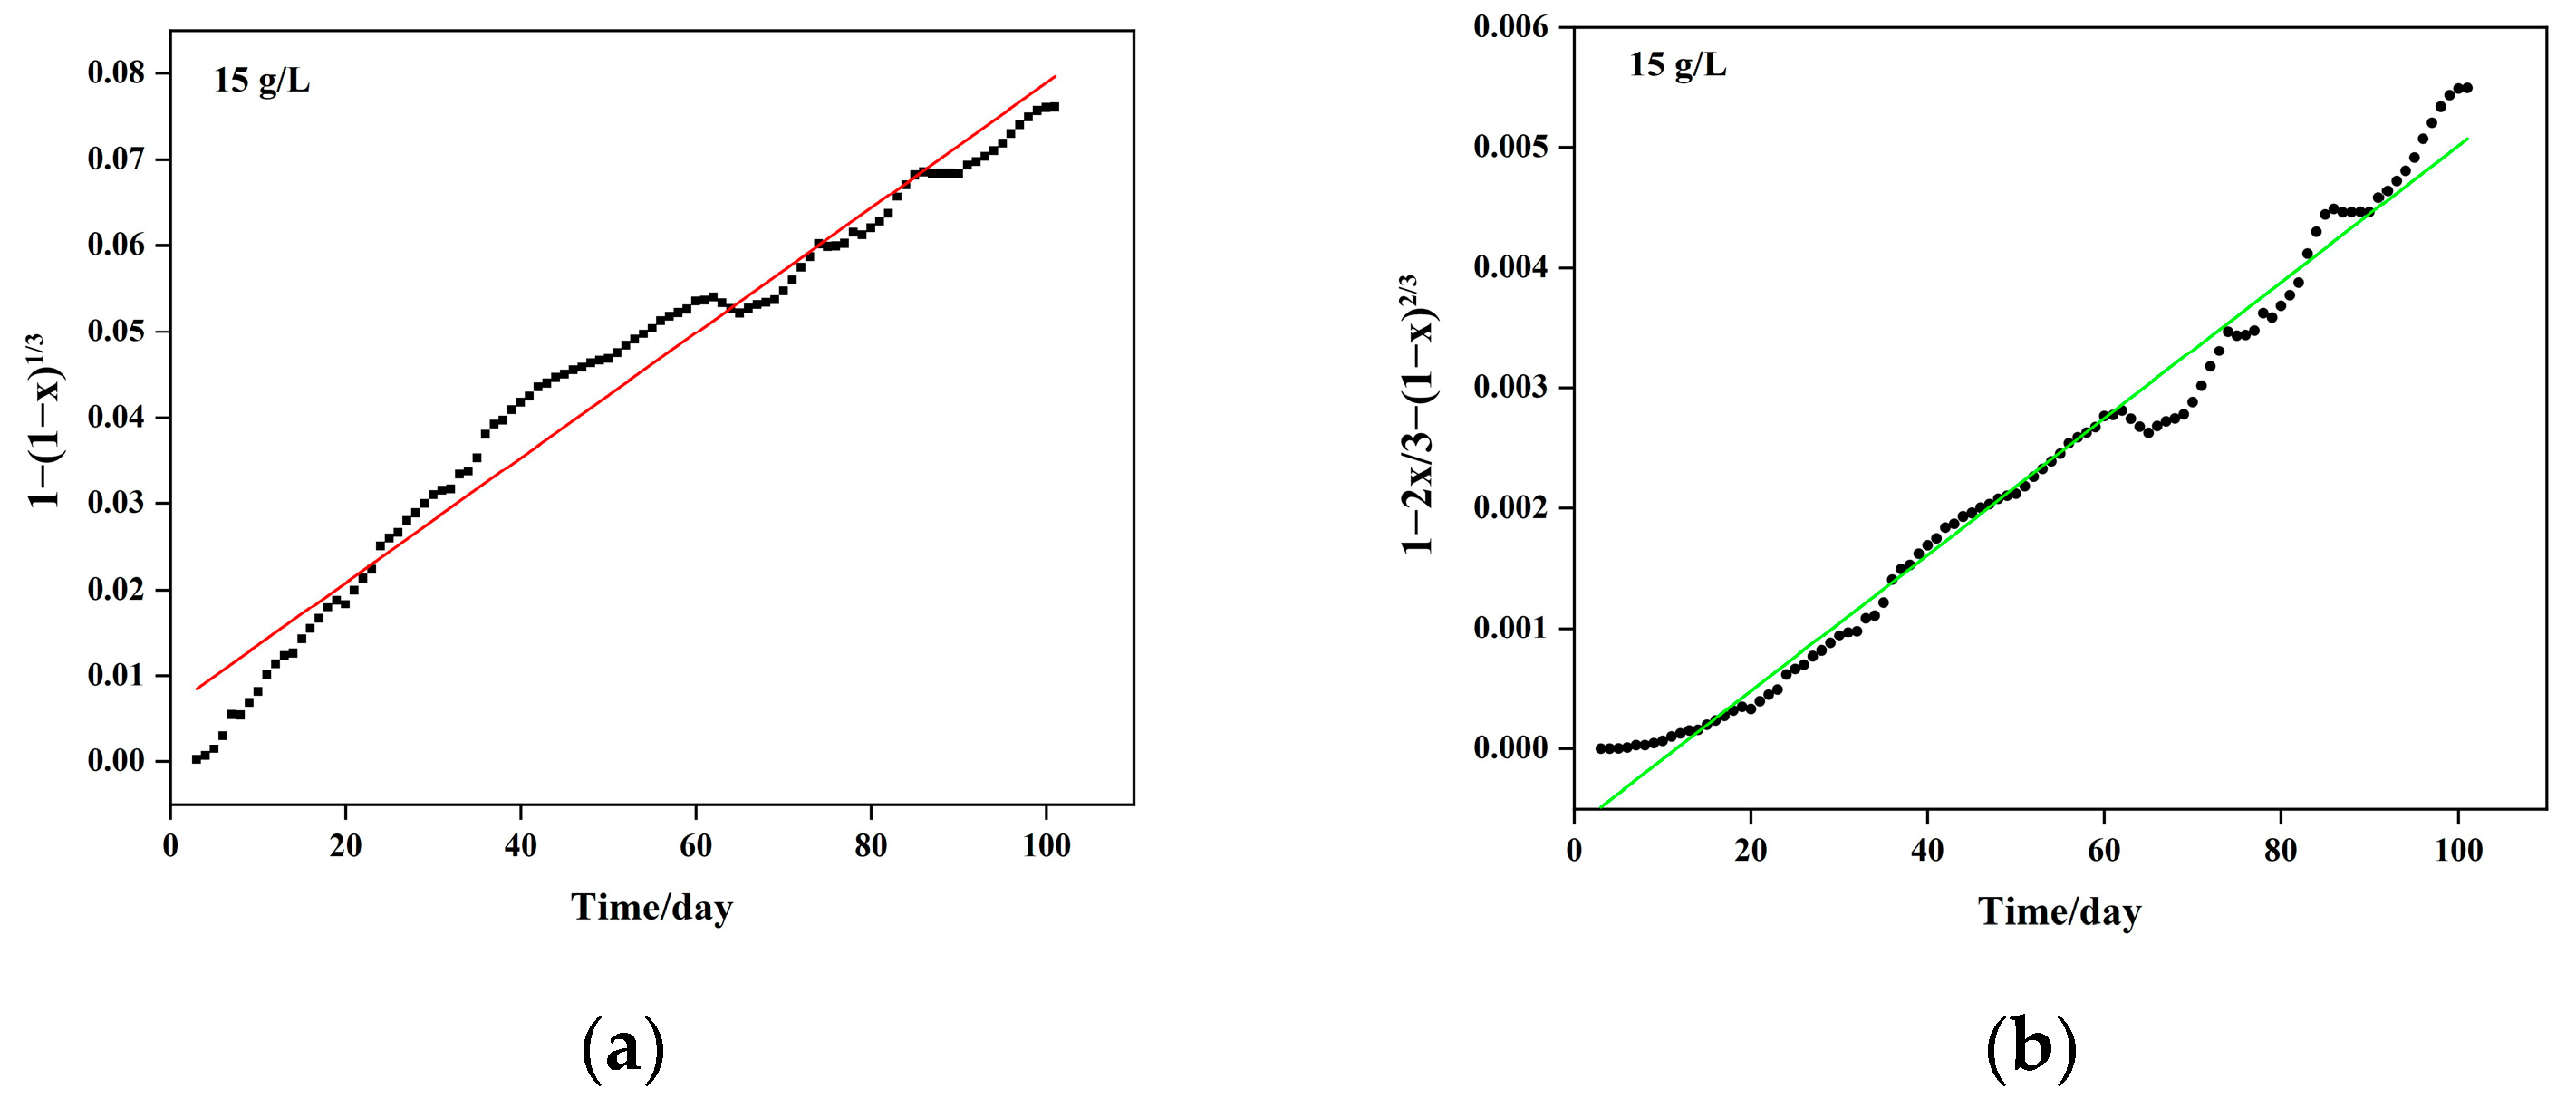
From Figure 8, at a sulfuric acid concentration of 20 g/L, 1 2 x / 3 ( 1 x ) 2 / 3 t exhibits a better linear relationship, indicating that under these conditions, copper leaching in copper–cobalt ores is controlled by solid material diffusion.
Through linear fitting, the following results were obtained: solid material diffusion control kinetics equation: 1 2 x / 3 ( 1 x ) 2 / 3 = 1.16 × 10 3 t , with a correlation coefficient of R2 = 0.9952 and an apparent reaction rate constant of 1.16 × 10⁻³ days−1.
Table 11 summarizes the leaching kinetics of copper in copper–cobalt ore under different acidity conditions.
Analysis of Table 11 indicates that under the conditions of spraying intensity of 10 L/(m2·h) and particle size <40 mm, the leaching kinetics of copper are significantly influenced by sulfuric acid concentration. As the sulfuric acid concentration increases, the controlling step in the kinetic process shifts from chemical reaction control to a mixed control of chemical reaction and solid material layer diffusion, and finally to diffusion control by the solid material layer.
(2) Column leaching kinetics at different spraying intensities.
Under conditions of sulfuric acid concentration of 20 g/L and particle size <40 mm, column leaching experiments were conducted at spraying intensities of 6 L/(m2·h), 10 L/(m2·h), and 15 L/(m2·h). The results are shown in Figure 9, Figure 10 and Figure 11.
From Figure 9, at a sulfuric acid concentration of 20 g/L and a spraying intensity of 6 L/(m2·h), 1 2 x / 3 ( 1 x ) 2 / 3 t shows a better linear relationship than 1 ( 1 x ) 1 / 3 t , indicating that under these conditions, copper leaching is predominantly controlled by solid material diffusion. The kinetics equation obtained from fitting is: 1 2 x / 3 ( 1 x ) 2 / 3 = 3.62 × 10 3 t , with a correlation coefficient of R2 = 0.9791 and an apparent reaction rate constant of 3.62 × 10⁻³ per day.
From Figure 10, it can be observed that at a sulfuric acid concentration of 20 g/L and a spraying intensity of 10 L/(m2·h), 1 2 x / 3 ( 1 x ) 2 / 3 t exhibits a better linear relationship than 1 ( 1 x ) 1 / 3 t . This indicates that under these conditions, copper leaching is primarily controlled by solid material diffusion. The kinetics equation obtained from the fitting is: 1 2 x / 3 ( 1 x ) 2 / 3 = 1.16 × 10 3 t , with a correlation coefficient of R2 = 0.9952 and an apparent reaction rate constant of 1.16 × 10⁻³ per day.
From Figure 11, the kinetic equations obtained from the fitting are as follows: For the chemical reaction control process, equation 1 ( 1 x ) 1 / 3 = 1.836 × 10 - 2 t with a correlation coefficient of R2 = 0.9830; for the solid material diffusion control process, equation 1 2 x / 3 ( 1 x ) 2 / 3 = 6.76 × 10 - 3 t with a correlation coefficient of R2 = 0.9832. The combined control kinetics equation is 1 ( 1 x ) 1 / 3 + 1 2 x / 3 ( 1 x ) 2 / 3 = 2.512 × 10 2 t , with an apparent reaction rate constant of 2.512 × 10⁻² per day.
Table 12 presents the copper leaching kinetics for different spraying intensities in column leaching processes.
(3) Column leaching kinetics at different ore particle sizes.
Under the conditions of a sulfuric acid concentration of 15 g/L and a spraying intensity of 10 L/(m2·h), column leaching experiments were conducted with ore particle sizes <10 mm and <40 mm. The results are shown in Figure 12.
From Figure 12, both 1 ( 1 x ) 1 / 3 t and 1 2 x / 3 ( 1 x ) 2 / 3 t show a linear relationship, indicating that under these conditions, copper leaching is controlled by a combination of chemical reactions and solid material layer diffusion. The following kinetic equations were obtained:
(1)
Chemical reaction control kinetic equation: 1 ( 1 x ) 1 / 3 = 1.989 × 10 2 t , with a correlation coefficient of R2 = 0.9746;
(2)
Solid material layer diffusion control kinetic equation: 1 2 x / 3 ( 1 x ) 2 / 3 = 7.40 × 10 3 t , with a correlation coefficient of R2 = 0.9912. Combining the kinetic equations for chemical reaction control and diffusion control, the mixed control kinetic equation is derived as 1 ( 1 x ) 1 / 3 + 1 2 x / 3 ( 1 x ) 2 / 3 = 2.729 × 10 2 t , with an apparent reaction rate constant of 2.729 × 10⁻² per day.
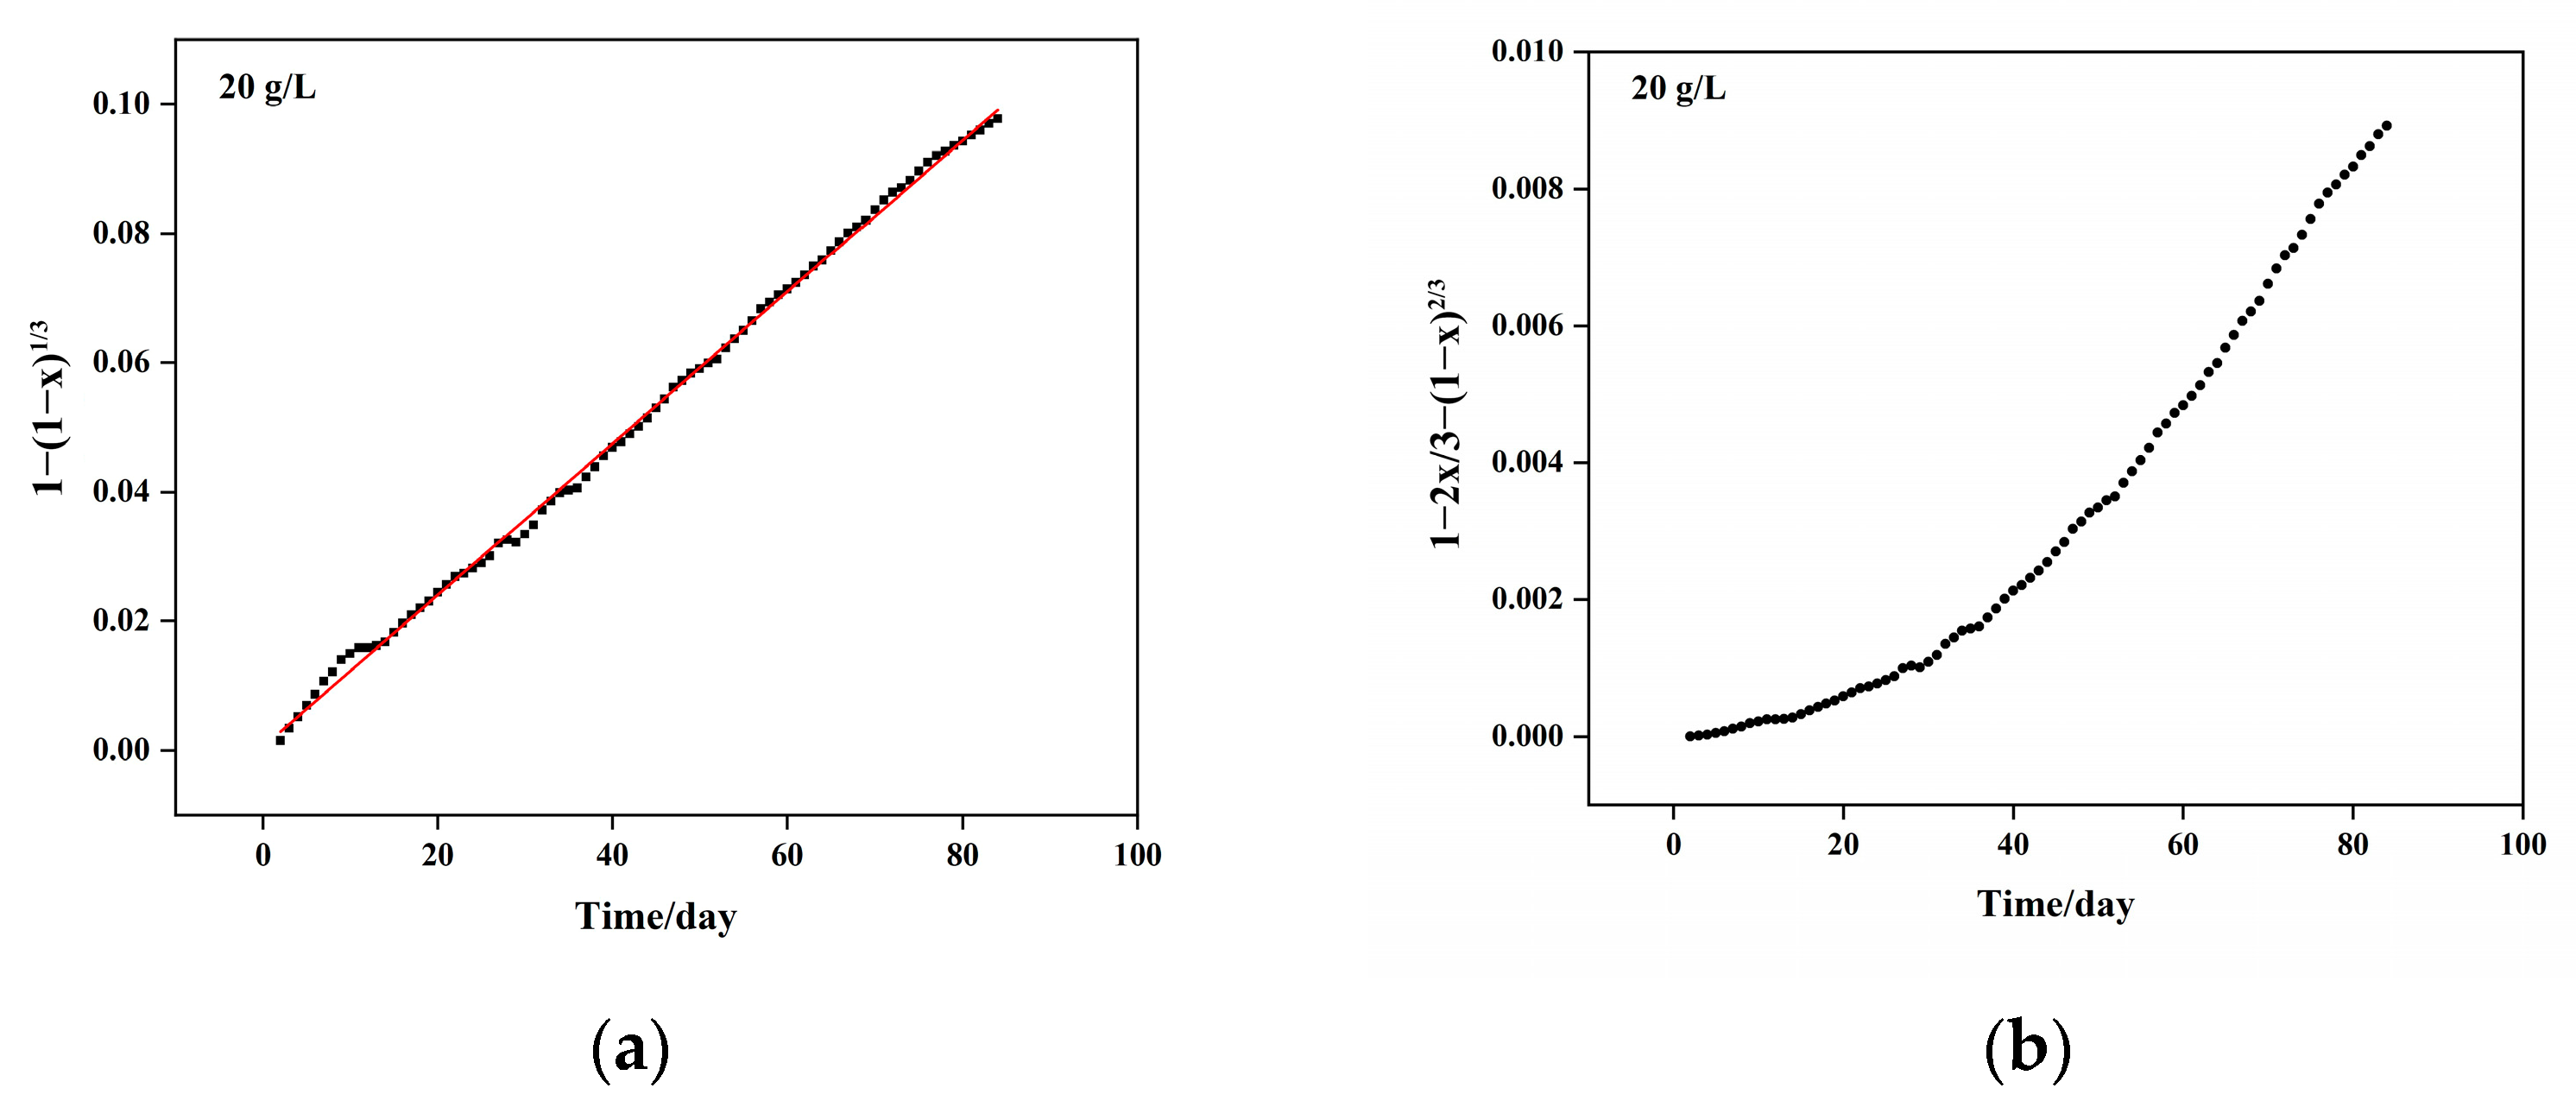
Figure 13 shows the copper column leaching kinetics analysis for particles <40 mm in size.
For a particle size <40 mm (Figure 13), it can be observed that both 1 ( 1 x ) 1 / 3 t and 1 2 x / 3 ( 1 x ) 2 / 3 t exhibit linear relationships, indicating that copper leaching under these conditions is influenced by a combination of chemical reactions and solid material diffusion control. Through linear fitting, the following equations were derived:
(1)
Chemical reaction control kinetic equation: 1 ( 1 x ) 1 / 3 = 3.13 × 10 3 t , with a correlation coefficient of R2 = 0.9918;
(2)
Solid material diffusion control kinetic equation: 1 2 x / 3 ( 1 x ) 2 / 3 = 7.92 × 10 4 t , with a correlation coefficient R2 = 0.9828. By merging the chemical reaction control and diffusion control kinetic equations, the combined control kinetic equation is obtained as follows: 1 ( 1 x ) 1 / 3 + 1 2 x / 3 ( 1 x ) 2 / 3 = 4.092 × 10 3 t , with an apparent reaction rate constant of 4.092 × 10⁻³ per day.
Table 13 presents the copper leaching kinetics for different particle sizes in column leaching processes.
From Table 13, under the conditions of a sulfuric acid concentration of 15 g/L and a leaching intensity of 10 L/(m2·h), as the particle size increases from <10 mm to <40 mm, the leaching limitation for copper is a mixture of chemical reaction and solid material layer diffusion control. Comparing the apparent reaction rate constants, it is observed that finer particle sizes result in faster reaction rates.
It should be noted that those kinetics analyses may be used for relating diffusion rate constants to some physical parameters of the ore. For instance, given a specific diffusion rate constant under predetermined column leaching parameters, since the diffusion coefficient can reflect the size of mineral particles to some extent, we can obtain ore sphere diameter information. However, it should be noted that some mineral particles may weather during column leaching under the influence of water flow and acidity. In this case, the particle size changes, and the diffusion coefficient becomes that of the powdered particles.

5.2. Leaching Kinetics of Iron

Under the conditions of spraying intensity of 10 L/(m2·h) and material particle size < 40 mm, column leaching experiments were conducted at sulfuric acid concentrations of 15 g/L and 20 g/L. The results for 15 g/L are shown in Figure 14.
From Figure 14a, at a sulfuric acid concentration of 15 g/L, 1 ( 1 x ) 1 / 3 t follows a linear relationship, indicating that iron leaching under these conditions is governed by chemical reaction control. After linear fitting, the kinetic equation under chemical reaction control is obtained as equation 1 - ( 1 - x ) 1 / 3 = 2.25 × 10 4 t , with a correlation coefficient R2 = 0.9964 and an apparent reaction rate constant of 2.25 × 10 4 per day.
Figure 15 shows the iron column leaching kinetics at H2SO4 of 20 g/L.
From Figure 15a, at a sulfuric acid concentration of 20 g/L, 1 ( 1 x ) 1 / 3 t exhibits a linear relationship, indicating that leaching under these conditions is governed by chemical reaction control. After linear fitting, the kinetic equation under chemical reaction control is derived as equation 1 - ( 1 - x ) 1 / 3 = 2.92 × 10 4 t , with a correlation coefficient R2 = 0.9871 and an apparent reaction rate 2.92 × 10 4 per day. The leaching kinetics of iron at different sulfuric acid concentrations are shown in Table 14.

5.3. Column Leaching Kinetics of Calcium

Under the conditions of spraying intensity of 10 L/(m2·h) and material particle size <40 mm, column leaching experiments were conducted with sulfuric acid concentrations of 10 g/L, 15 g/L, and 20 g/L.
Figure 16 shows the calcium column leaching kinetics at H2SO4 of 10 g/L.
From Figure 16a, it can be observed that at a sulfuric acid concentration of 10 g/L, 1 ( 1 x ) 1 / 3 t follows a linear relationship, indicating that the leaching of calcium under this condition is governed by chemical reaction control. The linear fit yields the following chemical reaction control kinetic equation: 1 - ( 1 - x ) 1 / 3 = 5.63 × 10 3 , with a coefficient of determination of R2 = 0.9806 and an apparent reaction rate constant of 5.63 × 10 3 per day.
Figure 17 shows the calcium column leaching kinetics at H2SO4 of 15 g/L.
For 15 g/L, from Figure 17b, it can be seen that 1 2 x / 3 ( 1 x ) 2 / 3 t follows a linear relationship, indicating that the leaching of calcium under this condition conforms to diffusion control. The linear fit yields the following solid material layer diffusion control kinetic equation: 1 - 2 x / 3 ( 1 x ) 2 / 3 = 1.30 × 10 6 , with a coefficient of determination of R2 = 0.9889, and an apparent reaction rate constant of 1.30 × 10 6 per day.
Figure 18 shows the calcium column leaching kinetics at H2SO4 of 20 g/L.
For 20 g/L, from Figure 18a, it can be seen that 1 ( 1 x ) 1 / 3 t follows a linear relationship, indicating that the leaching of calcium under this condition is governed by chemical reaction control. The linear fit yields the following chemical reaction control kinetic equation: 1 - ( 1 - x ) 1 / 3 = 6.32 × 10 3 , with a coefficient of determination of R2 = 0.9798 and an apparent reaction rate constant of 6.32 × 10 3 per day.
Table 15 outlines calcium leaching kinetics under different sulfuric acid concentrations.
From Table 15, as the sulfuric acid concentration increases from 10 g/L to 20 g/L, the limiting step for calcium leaching changes from chemical reaction control to diffusion control and then remains chemical reaction control.

5.4. Column Leaching Kinetics of Magnesium

Under conditions of spray intensity of 10 L/(m2·h) and material particle size <40 mm, column leaching experiments were conducted with sulfuric acid concentrations of 10 g/L, 15 g/L, and 20 g/L. The results are shown in Figure 19, Figure 20 and Figure 21.
From Figure 19a, at a sulfuric acid concentration of 10 g/L, 1 ( 1 x ) 1 / 3 t follows a linear relationship, indicating that the leaching of magnesium under this condition is governed by chemical reaction control. The linear fit yields the following chemical reaction control kinetic equation: 1 - ( 1 - x ) 1 / 3 = 7.88 × 10 4 t , with a coefficient of determination of R2 = 0.9987 and an apparent reaction rate constant of 7.88 × 10 4 per day.
From Figure 20, at a sulfuric acid concentration of 15 g/L, both 1 ( 1 x ) 1 / 3 t and 1 2 x / 3 ( 1 x ) 2 / 3 t exhibit linear relationships, indicating that the leaching of magnesium under this condition follows a mixed control. After linear fitting, we can obtain:
(1)
Chemical reaction control kinetic equation: 1 - ( 1 - x ) 1 / 3 = 7.26 × 10 4 t , with a coefficient of determination of R2 = 0.9663;
(2)
Solid material layer diffusion control kinetic equation: 1 - 2 x / 3 ( 1 x ) 2 / 3 = 5.67 × 10 5 t , with a coefficient of determination of R2 = 0.9834. By combining the chemical reaction control and diffusion control kinetic equations, the mixed control kinetic equation is derived as follows: 1 ( 1 x ) 1 / 3 + 1 2 x / 3 ( 1 x ) 2 / 3 = 7.83 × 10 4 t , with an apparent reaction rate constant of 7.73 × 10 4 per day.
From Figure 20, at a sulfuric acid concentration of 15 g/L, both 1 ( 1 x ) 1 / 3 t and 1 2 x / 3 ( 1 x ) 2 / 3 t exhibit linear relationships, indicating that the leaching of magnesium under this condition follows a mixed control. After linear fitting:
(1)
Chemical reaction control kinetic equation: 1 - ( 1 - x ) 1 / 3 = 7.26 × 10 4 t , with a coefficient of determination of R2 = 0.9663;
(2)
Solid material layer diffusion control kinetic equation: 1 - 2 x / 3 ( 1 x ) 2 / 3 = 5.67 × 10 5 t , with a coefficient of determination of R2 = 0.9834. By combining the chemical reaction control and diffusion control kinetic equations, the mixed control kinetic equation is derived as follows: 1 ( 1 x ) 1 / 3 + 1 2 x / 3 ( 1 x ) 2 / 3 = 7.83 × 10 4 t , with an apparent reaction rate constant of 7.73 × 10 4 per day.
From Figure 21, at a sulfuric acid concentration of 20 g/L, 1 ( 1 x ) 1 / 3 t follows a linear relationship, indicating that the leaching of magnesium under this condition is governed by chemical reaction control. The linear fit yields the following chemical reaction control kinetic equation: 1 - ( 1 - x ) 1 / 3 = 1.17 × 10 3 t , with a coefficient of determination of R2 = 0.9986 and an apparent reaction rate constant of 1.17 × 10 3 per day. Table 16 summarizes the magnesium leaching kinetics.

6. Conclusions

This study explores the leaching behavior of low-grade oxidized copper ore containing calcium and magnesium. It focuses on process mineralogy, leaching mechanism, and kinetics, analyzing the impact of sulfuric acid concentration, leaching solution spray intensity, and material particle size on column leaching. The key findings are summarized as follows:
1. Process Mineralogy:
The ore consists of 0.75% Cu, 0.13% Co, 4.11% Ca, and 4.60% Mg. Copper and cobalt are mainly in oxide form, while calcium is predominantly present as calcium silicate and carbonate. Malachite is the primary copper mineral, accompanied by chrysocolla, cuprite, bornite, and pseudo-malachite. Heterogenite is the main cobalt mineral, with traces of spherocobaltite. Other metal minerals include goethite, with minor amounts of siderite and pyrite. Non-metallic minerals are primarily quartz, dolomite, muscovite, talc, and chlorite. Malachite is mainly associated with gangue minerals like quartz, with varied grain sizes. Heterogenite occurs sporadically among gangue minerals like quartz.
2. Leaching Kinetics Analysis:
Copper Leaching Kinetics: Sulfuric acid concentration significantly influences copper leaching, shifting the control mechanism from chemical reactions to a combination of reactions and diffusion. Leaching solution spray intensity affects the process, while material particle size has minimal impact.
Iron Leaching Kinetics: Initial iron leaching is low at a higher pH but increases as acidity rises due to reactions with acid-consuming substances, primarily controlled by chemical reactions.
Calcium Leaching Kinetics: Chemical reactions primarily govern calcium leaching, transitioning from rapid reactions to diffusion control with increased sulfuric acid concentration, forming a gypsum layer that requires diffusion for continued reactions.
Magnesium Leaching Kinetics: Magnesium leaching is mainly controlled by chemical reactions, with limited influence from diffusion.

Author Contributions

Conceptualization, S.Q.; methodology, S.Q. and H.S.; software, C.Z.; validation, J.X. and K.E.W.; formal analysis, S.Q. and C.Z.; investigation, B.Y., G.Q. and D.O.N.; resources, S.L., G.Q. and K.E.W.; data curation, J.X.; writing—original draft preparation, J.X., S.Q. and H.M.; writing—review and editing, D.O.N., K.E.W. and H.M.; visualization, S.L., G.Q. and D.O.N.; supervision, B.Y.; project administration, H.S.; funding acquisition, H.M. and B.Y. All authors have read and agreed to the published version of the manuscript.

Funding

This research received no external funding.

Data Availability Statement

The original contributions presented in the study are included in the article, further inquiries can be directed to the corresponding author.

Acknowledgments

The support from the Senior Foreign Expert Program (G2023074002L) from the Ministry of Science and Technology of China is acknowledged.

Conflicts of Interest

Shuchen Qin, Chaozhen Zheng, Honghong Sun, Sanping Liu and Hao Ma are working in company BGRIMM Technology Group. On behalf of all authors, the corresponding author states that there is no conflict of interest.

References

  1. Borodianskiy, K. Effect of carbon nanotubes’ addition on mechanical properties and thermal conductivity of copper. J. Mater. Sci. 2019, 54, 13767–13774. [Google Scholar] [CrossRef]
  2. Jona, F.; Marcus, P.M. Structural properties of copper. Phys. Rev. B 2001, 63, 094113. [Google Scholar] [CrossRef]
  3. Jiang, Q.; Zhang, P.; Yu, Z.; Shi, H.; Wu, D.; Yan, H.; Ye, X.; Lu, Q.; Tian, Y. A review on additive manufacturing of pure copper. Coatings 2021, 11, 740. [Google Scholar] [CrossRef]
  4. Murphy, M.C. The engineering fatigue properties of wrought copper. Fatigue Fract. Eng. Mater. Struct. 1981, 4, 199–234. [Google Scholar] [CrossRef]
  5. Miya, N.; Machogo-Phao, L.F.E.; Ntsendwana, B. Exploring copper oxide and copper sulfide for non-enzymatic glucose sensors: Current progress and future directions. Micromachines 2023, 14, 1849. [Google Scholar] [CrossRef] [PubMed]
  6. Habashi, F. The future of copper metallurgy. Miner. Process. Extr. Metall. Rev. 1995, 15, 5–12. [Google Scholar] [CrossRef]
  7. Schlesinger, M.E.; Sole, K.C.; Davenport, W.G.; Flores, G.R.A. Extractive Metallurgy of Copper; Elsevier: Amsterdam, The Netherlands, 2021. [Google Scholar]
  8. Biswas, A.K.; Davenport, W.G. Extractive Metallurgy of Copper: International Series on Materials Science and Technology; Elsevier: Amsterdam, The Netherlands, 2013; Volume 20. [Google Scholar]
  9. Bai, X.; Wen, S.M.; Feng, Q.C.; Liu, J.; Lin, Y.L.; Yao, Z.H. A new technique for recovering copper from complex copper oxide ore by flotation and metallurgical processing. JOM 2019, 71, 784–790. [Google Scholar] [CrossRef]
  10. Cao, Z.F.; Zhong, H.; Liu, G.Y.; Zhao, S.J. Techniques of copper recovery from Mexican copper oxide ore. Min. Sci. Technol. 2009, 19, 45–48. [Google Scholar] [CrossRef]
  11. Petersen, J. Heap leaching as a key technology for recovery of values from low-grade ores–A brief overview. Hydrometallurgy 2016, 165, 206–212. [Google Scholar] [CrossRef]
  12. Dixon, D.G. Heap leach modeling–the current state of the art. Hydrometallurgy 2003, 1, 289–314. [Google Scholar]
  13. Trujillo, J.Y.; Cisternas, L.A.; Gálvez, E.D.; Mellado, M.E. Optimal design and planning of heap leaching process. Application to copper oxide leaching. Chem. Eng. Res. Des. 2014, 92, 308–317. [Google Scholar] [CrossRef]
  14. Mellado, M.E.; Gálvez, E.D.; Cisternas, L.A. On the optimization of flow rates on copper heap leaching operations. Int. J. Miner. Process. 2011, 101, 75–80. [Google Scholar] [CrossRef]
  15. Ghorbani, Y.; Franzidis, J.P.; Petersen, J. Heap leaching technology—Current state, innovations, and future directions: A review. Miner. Process. Extr. Metall. Rev. 2016, 37, 73–119. [Google Scholar] [CrossRef]
  16. Shayestehfar, M.R.; Nasab, S.K.; Mohammadalizadeh, H. Mineralogy, petrology, and chemistry studies to evaluate oxide copper ores for heap leaching in Sarcheshmeh copper mine, Kerman, Iran. J. Hazard. Mater. 2008, 154, 602–612. [Google Scholar] [CrossRef] [PubMed]
  17. Norris, P.R.; Calvo-Bado, L.A.; Brown, C.F.; Davis-Belmar, C.S. Ore column leaching with thermophiles: I, copper sulfide ore. Hydrometallurgy 2012, 127, 62–69. [Google Scholar] [CrossRef]
  18. Hoseinian, F.S.; Abdollahzade, A.; Mohamadi, S.S.; Hashemzadeh, M. Recovery prediction of copper oxide ore column leaching by hybrid neural genetic algorithm. Trans. Nonferrous Met. Soc. China 2017, 27, 686–693. [Google Scholar] [CrossRef]
  19. de Andrade Lima, L.R.P. A mathematical model for isothermal heap and column leaching. Braz. J. Chem. Eng. 2004, 21, 435–447. [Google Scholar] [CrossRef]
  20. Liu, M.; Wen, J.; Tan, G.; Liu, G.; Wu, B. Experimental studies and pilot plant tests for acid leaching of low-grade copper oxide ores at the Tuwu Copper Mine. Hydrometallurgy 2016, 165, 227–232. [Google Scholar] [CrossRef]
  21. Panda, S.; Mishra, G.; Sarangi, C.K.; Sanjay, K.; Subbaiah, T.; Das, S.K.; Sarangi, K.; Ghosh, M.K.; Pradhan, N.; Mishra, B.K. Reactor and column leaching studies for extraction of copper from two low grade resources: A comparative study. Hydrometallurgy 2016, 165, 111–117. [Google Scholar] [CrossRef]
  22. Renman, R.; Jiankang, W.; Jinghe, C. Bacterial heap-leaching: Practice in Zijinshan copper mine. Hydrometallurgy 2006, 83, 77–82. [Google Scholar] [CrossRef]
  23. Yang, W.; Liu, Y.; Li, X.; Ma, B.; Wang, H.; Wang, C. Selective extraction of cobalt and copper From cobalt-rich copper sulfide ores. Metall. Mater. Trans. B 2023, 54, 2332–2346. [Google Scholar] [CrossRef]
  24. Liu, W.; Granata, G. Temperature control in copper heap bioleaching. Hydrometallurgy 2018, 176, 26–32. [Google Scholar] [CrossRef]
  25. Yin, S.; Wang, L.; Kabwe, E.; Chen, X.; Yan, R.; An, K.; Zhang, L.; Wu, A. Copper bioleaching in China: Review and prospect. Minerals 2018, 8, 32. [Google Scholar] [CrossRef]
  26. Zheng, C.; Jiang, K.; Cao, Z.; Northwood, D.O.; Waters, K.E.; Wang, H.; Liu, S.; Zhu, K.E.; Ma, H. Agitation leaching behavior of copper–cobalt oxide ores from the Democratic Republic of the Congo. Minerals 2023, 13, 743. [Google Scholar] [CrossRef]
  27. Xu, J.; Qin, S.; Zheng, C.; Wang, J.; Yang, B.; Qiu, G.; Cui, S.; Ma, H. Characterization and optimization of copper-cobalt oxide ores during acid leaching. JOM 2023, 75, 5785–5795. [Google Scholar] [CrossRef]
  28. Zheng, C.; Jiang, K.; Cao, Z.; Wang, H.; Liu, S.; Waters, K.E.; Ma, H. Pressure leaching behaviors of copper-cobalt sulfide concentrate from Congo. Sep. Purif. Technol. 2023, 309, 123010. [Google Scholar] [CrossRef]
  29. Park, I.; Yoo, K.; Alorro, R.D.; Kim, M.S.; Kim, S.K. Leaching of copper from cuprous oxide in aerated sulfuric acid. Mater. Trans. 2017, 58, 1500–1504. [Google Scholar] [CrossRef]
  30. Yang, J.; Chen, L.; Wu, D.; Cao, J.; Guo, J. Leaching of cuprite with ozone as an oxidant in sulfuric acid solution and its oxidation leaching mechanism. Arab. J. Chem. 2023, 16, 105159. [Google Scholar] [CrossRef]
  31. Wang, Y.; Jiang, K.; Ma, H.; Qin, S.; Zheng, C. The behavior of zinc and iron in neutralized residue during pressure leaching. Min. Metall. Explor. 2022, 39, 847–854. [Google Scholar] [CrossRef]
  32. Braun, R.L.; Lewis, A.E.; Wadsworth, M.E. In-place leaching of primary sulfide ores: Laboratory leaching data and kinetics model. Metall. Trans. 1974, 5, 1717–1726. [Google Scholar] [CrossRef]
Figure 1. Sample morphology.
Minerals 14 00822 g001
Figure 2. Leaching equipment.
Minerals 14 00822 g002
Figure 3. Mineral distribution of the ore sample: (a) malachite distributed within other minerals; (b) malachite with an uneven grain size; and (c) malachite with grain sizes up to 0.4 mm.
Minerals 14 00822 g003
Figure 4. A schematic diagram of the column leaching process.
Minerals 14 00822 g004
Figure 5. A schematic diagram of the zone leaching model.
Minerals 14 00822 g005
Figure 6. Copper column leaching kinetics under H2SO4 of 10 g/L: (a) 1 − (1 − x)1/3; (b) 1 − 2x/3 − (1 − x)2/3.
Minerals 14 00822 g006
Figure 7. Copper column leaching kinetics under H2SO4 of 15 g/L: (a) 1 − (1 − x)1/3; (b) 1 − 2x/3 − (1 − x)2/3.
Minerals 14 00822 g007
Figure 8. Copper column leaching kinetics under H2SO4 of 20 g/L: (a) 1 − (1 − x)1/3; (b) 1 − 2x/3 − (1 − x)2/3.
Minerals 14 00822 g008
Figure 9. Column leaching kinetics analysis at a spraying intensity of 6 L/(m2·h): (a) 1 − (1 − x)1/3; (b) 1 − 2x/3 − (1 − x)2/3.
Minerals 14 00822 g009
Figure 10. Column leaching kinetics analysis at a spraying intensity of 10 L/(m2·h): (a) 1 − (1 − x)1/3; (b) 1 − 2x/3 − (1 − x)2/3.
Minerals 14 00822 g010
Figure 11. Column leaching kinetics analysis at a spraying intensity of 15 L/(m2·h): (a) 1 − (1 − x)1/3; (b) 1 − 2x/3 − (1 − x)2/3.
Minerals 14 00822 g011
Figure 12. Copper column leaching kinetics analysis <10 mm particle size: (a) 1 − (1 − x)1/3; (b) 1 − 2x/3 − (1 − x)2/3.
Minerals 14 00822 g012
Figure 13. Copper column leaching kinetics analysis for particle size < 40 mm: (a) 1 − (1 − x)1/3; (b) 1 − 2x/3 − (1 − x)2/3.
Minerals 14 00822 g013
Figure 14. Leaching kinetics of iron during column leaching at H2SO4 of 15 g/L: (a) 1 − (1 − x)1/3; (b) 1 − 2x/3 − (1 − x)2/3.
Minerals 14 00822 g014
Figure 15. Leaching kinetics of iron column leaching at H2SO4 of 20 g/L: (a) 1 − (1 − x)1/3; (b) 1 − 2x/3 − (1 − x)2/3.
Minerals 14 00822 g015
Figure 16. Calcium column leaching kinetics under H2SO4 of 10 g/L: (a) 1 − (1 − x)1/3; (b) 1 − 2x/3 − (1 − x)2/3.
Minerals 14 00822 g016
Figure 17. Calcium column leaching kinetics under H2SO4 of 15 g/L: (a) 1 − (1 − x)1/3; (b) 1 − 2x/3 − (1 − x)2/3.
Minerals 14 00822 g017
Figure 18. Calcium column leaching kinetics under a sulfuric acid concentration of 20 g/L: (a) 1 − (1 − x)1/3; (b) 1 − 2x/3 − (1 − x)2/3.
Minerals 14 00822 g018
Figure 19. Magnesium column leaching kinetics under H2SO4 of 10 g/L: (a) 1 − (1 − x)1/3; (b) 1 − 2x/3 − (1 − x)2/3.
Minerals 14 00822 g019
Figure 20. Magnesium column leaching kinetics under H2SO4 of 15 g/L: (a) 1 − (1 − x)1/3; (b) 1 − 2x/3 − (1 − x)2/3.
Minerals 14 00822 g020
Figure 21. Magnesium column leaching kinetics under H2SO4 of 20 g/L: (a) 1 − (1 − x)1/3; (b) 1 − 2x/3 − (1 − x)2/3.
Minerals 14 00822 g021
Table 1. The composition of the dilute acid solution (wt%).
No.CuCoFeMnCaMg
Sample-10.700.670.0780.360.594.45
Sample-20.670.680.0780.360.584.33
Sample-30.700.680.0780.370.584.23
Average0.690.680.0800.360.584.34
Table 2. Chemical composition of the ore sample (wt%).
ElementCuCoFeSZnPbNiAsTiO2
Content (%)0.750.131.180.010.030.050.010.010.03
ElementCaMgAl2O3SiO2K2ONa2OP2O5MnOC
Content (%)4.114.604.3161.070.930.040.070.053.55
Table 3. Particle size distribution.
Particle Size (mm)Weight (g)Percentage (%)Cumulative Percentage (%)
13.2–26.5346.5031.2931.29
4.75–13.2259.1023.4054.69
1–4.75149.4013.4968.18
0.45–169.606.2974.47
0.154–0.4571.106.4280.89
0.075–0.15453.804.8685.75
<0.075157.8014.25100.00
Total1107.30
Table 4. Elemental distribution in different particle sizes.
Particle Size (mm)CuCoFeMnCaMg
13.2–26.529.21 30.99 21.72 30.34 41.03 39.80
4.75–13.220.60 9.89 16.24 14.73 25.13 22.97
1–4.7516.20 15.14 12.37 10.33 12.68 12.07
0.45–17.54 10.79 7.82 7.80 5.44 6.30
0.154–0.455.65 10.17 7.49 9.50 4.75 5.15
0.075–0.1543.50 6.09 5.79 7.19 2.98 3.56
<0.07517.30 16.93 28.56 20.12 7.99 10.15
Total100.00 100.00 100.00 100.00 100.00 100.00
Table 5. Chemical phase analysis for copper, cobalt, and calcium.
CopperPhaseOxidized CopperSecondary
Sulfide Copper
GoethiteOtherTotal
Copper content (wt%)0.610.0110.0090.0040.634
Distribution (%)96.211.741.420.63100.00
CobaltPhaseOxidized cobaltCarbonateGoethiteOtherTotal
Cobalt content (wt%)0.1050.0030.0040.0030.115
Distribution (%)91.302.613.482.61100.00
CalciumPhaseCalcium carbonateCalcium
fluoride
Calcium
silicate
Calcium
sulfate
Total
Calcium content (wt%)1.800.106.120.058.07
Distribution (%)22.301.2475.840.62100.00
Table 6. Mineral composition and relative abundance in the sample.
MineralContent (%)Mineral NameContent (%)
Malachite0.89Chlorite2.75
Chrysocolla0.29Talc2.59
Covellite0.01Biotite0.32
Heterogenite0.17Amphibole0.71
Goethite0.62Apatite0.12
Siderite0.13Kaolinite0.24
Quartz52.14Celadonite0.11
Dolomite27.68Potassium Feldspar0.40
Muscovite10.52Other0.31
Table 7. Copper distribution in ores.
MineralMineral
Weight (wt%)
Copper Content
in Mineral (%)
Copper
Metal Weight
(wt%)
Copper
Distribution (%)
Malachite0.8954.950.48977.97
Chrysocolla0.2934.990.10116.18
Heterogenite0.179.210.0162.50
Covellite0.0179.860.0081.27
Goethite0.621.520.0091.50
Talc2.590.100.0030.41
Biotite0.320.340.0010.17
Total 0.627100.00
Table 8. Cobalt distribution in ores.
MineralMineral
Weight (wt%)
Cobalt Content in Mineral (%)Cobalt
Metal Weight (wt%)
Cobalt Distribution (%)
Heterogenite0.1757.350.097585.13
Malachite0.891.050.00938.16
Chrysocolla0.290.130.00040.32
Goethite0.620.650.00403.52
Calcite27.680.010.00282.42
Talc2.590.020.00050.45
Total 0.1145100.00
Table 9. Calcium distribution in ores.
MineralMineral
Weight (wt%)
Calcium Content in Mineral (%)Calcium
Metal Weight (wt%)
Calcium Distribution (%)
Dolomite27.6820.705.7396.21
Amphibole0.7117.710.132.11
Apatite0.1239.650.050.80
Wollastonite0.2414.460.030.57
Celadonite0.1117.360.020.31
Total 5.96100.00
Table 10. Magnesium distribution in ores.
MineralMineral
Weight (wt%)
Magnesium Content
in Mineral (%)
Magnesium
Metal Weight (wt%)
Magnesium
Distribution (%)
Dolomite27.6813.603.764574.62
Celadonite2.7518.500.508810.08
Talc2.5917.590.45569.03
Biotite10.521.820.19153.79
Wollastonite0.7110.210.07251.44
Chrysocolla0.2411.770.02820.56
Biotite0.325.580.01790.35
Malachite0.890.350.00310.06
Chrysocolla0.290.990.00290.06
Goethite0.620.090.00060.01
Total 5.0454100.00
Table 11. Leaching kinetics at different H2SO4 concentrations.
Sulfuric Acid Concentration (g/L)Kinetic EquationApparent Reaction Rate Constant (Days−1)Controlling Step
10 1 ( 1 x ) 1 / 3 = 2.23 × 10 3 t 2.23 × 10⁻³Chemical reaction
15 1 ( 1 x ) 1 / 3 + 1 2 x / 3 ( 1 x ) 2 / 3 = 4.09 × 10 2 t 4.09 × 10⁻²Mixed control: Chemical and diffusion control
20 1 2 x / 3 ( 1 x ) 2 / 3 = 1.16 × 10 3 t 1.16 × 10⁻³Diffusion control
Table 12. Leaching kinetics at different spraying intensities.
Spraying Intensity (L/(m2·h))Kinetic EquationApparent Reaction Rate Constant (Day−1)Controlling Step
6 1 2 x / 3 ( 1 x ) 2 / 3 = 3.62 × 10 3 t 3.62 × 10⁻³Diffusion control
10 1 2 x / 3 ( 1 x ) 2 / 3 = 1.16 × 10 3 t 1.16 × 10⁻³Diffusion control
15 1 ( 1 x ) 1 / 3 + 1 2 x / 3 ( 1 x ) 2 / 3 = 2.512 × 10 2 t 2.512 × 10⁻²Diffusion control
Table 13. Leaching kinetics under different particle sizes.
Particle SizeKinetic EquationApparent Reaction Rate Constant (per Day)Controlling Step
<10 mm 1 ( 1 x ) 1 / 3 + 1 2 x / 3 ( 1 x ) 2 / 3 = 2.729 × 10 2 t 2.729 × 10⁻²Mixed control
<40 mm 1 ( 1 x ) 1 / 3 + 1 2 x / 3 ( 1 x ) 2 / 3 = 4.092 × 10 3 t 4.092 × 10⁻³Mixed control
Table 14. Leaching kinetics of iron at different sulfuric acid concentrations.
Sulfuric Acid Concentration (g/L)Kinetic EquationApparent Reaction Rate Constant (Day−1)Controlling Step
15 1 - ( 1 - x ) 1 / 3 = 2.25 × 10 4 t 1.05 × 10⁻³Mixed control
20 1 - ( 1 - x ) 1 / 3 = 2.92 × 10 4 t 1.38 × 10⁻³Chemical reaction control
Table 15. Calcium leaching kinetics under different sulfuric acid concentrations.
Sulfuric Acid Concentration (g/L)Kinetic EquationApparent Reaction Rate Constant (Day−1)Controlling Step
10 1 - ( 1 x ) 1 / 3 = 5.63 × 10 3 t 5.63 × 10⁻³Chemical reaction control
15 1 - 2 x / 3 ( 1 x ) 2 / 3 = 1.30 × 10 6 1.30 × 10⁻⁶Diffusion control
20 1 - ( 1 - x ) 1 / 3 = 6.32 × 10 3 6.32 × 10⁻³Chemical reaction control
Table 16. Magnesium leaching kinetics under different sulfuric acid concentrations.
Sulfuric Acid Concentration (g/L)Kinetic EquationApparent Reaction Rate Constant (Day−1)Controlling Step
10 1 - ( 1 - x ) 1 / 3 = 7.88 × 10 4 t 7.88 × 10⁻³Chemical reaction control
15 1 ( 1 x ) 1 / 3 + 1 2 x / 3 ( 1 x ) 2 / 3 = 7.83 × 10 4 t 7.83 × 10⁻⁴Mixed control
20 1 - ( 1 - x ) 1 / 3 = 1.17 × 10 3 t 1.17 × 10⁻³Chemical reaction control
Disclaimer/Publisher’s Note: The statements, opinions and data contained in all publications are solely those of the individual author(s) and contributor(s) and not of MDPI and/or the editor(s). MDPI and/or the editor(s) disclaim responsibility for any injury to people or property resulting from any ideas, methods, instructions or products referred to in the content.

