Article

Geological Controlling Factors on Mississippi Valley-Type Pb-Zn Mineralization in Western Semnan, Iran

1
Department of Mining Engineering, Amirkabir University of Technology, Tehran 1591634311, Iran
2
Institute of Oceanography and Environment (INOS), Higher Institution Center of Excellence (HICoE) in Marine Science, University Malaysia Terengganu (UMT), Kuala Nerus 21030, Malaysia
3
Faculty of Engineering, Malayer University, Malayer 65719-95863, Iran
*
Author to whom correspondence should be addressed.
Minerals 2024, 14(9), 957; https://doi.org/10.3390/min14090957
Submission received: 12 June 2024 / Revised: 3 September 2024 / Accepted: 18 September 2024 / Published: 21 September 2024
(This article belongs to the Special Issue Mineralogy and Geochemistry of Polymetallic Ore Deposits)

Abstract

:
Mississippi Valley-type (MVT) Pb-Zn deposits are a subtype of sedimentary-hosted mineralization. These deposits are hosted by carbonate sequences in passive-margin tectonic settings. This paper uses the Fry technique and distance distribution analysis to model the spatial distribution pattern of MVT Pb-Zn deposits in the west of Semnan province (Iran) and their association with some geological features, aiming at mapping mineral prospectivity in the area. The modeling results reveal that NE–SW trending faults and Permian-Cretaceous dolomites and limestone are, respectively, major structural and lithological controlling factors of mineralization that operate as conduits and physicochemical subsystems of ore formation. The integration of the corresponding evidence maps of the controlling factors with a model of the geochemical signature of MVT Pb-Zn deposits through a supervised random forest approach, a machine learning technique, gains an exceptional prospectivity map predicting 100% of the known MVT Pb-Zn deposits in only 15% of the study area, which is an achievement. The recognized targets can be planned for further exploration.

1. Introduction

Mississippi Valley-type Pb-Zn (MVT Pb-Zn) deposits are a subtype of sedimentary-hosted Pb-Zn deposits that occur in platform carbonate sequences, typically in passive-margin tectonic settings [1,2,3,4,5,6,7]. As [8] states, the dominant mineralogy of these deposits includes sphalerite, galena, pyrite, marcasite, dolomite, and calcite. MVT deposits primarily occur in platform carbonate sequences within the foreland of orogenic belts. While most MVT deposits fit this pattern, some anomalous examples are found along the margins of active extensional basins (such as the Lennard Shelf in Australia) [9,10,11]. [12] discussed the geological context in which MVT Pb-Zn deposits are typically found, particularly in orogenic foreland areas. They highlighted the significant role of tectonic settings in the formation and localization of these mineral deposits and explained the process of mineralization, including how lead and zinc become concentrated in these specific settings. Unlike SEDEX and Irish-type deposits, MVT deposits do not require a direct link between the tectonic environment where the host rock formed and the subsequent mineralization. These deposits are associated with broad paleotopographic highs and domal structures at the basin scale, likely influenced by the overall compressional conditions and basement highs that facilitate fluid flow [7,8]. MVT deposits are lenticular and irregular in shape and occur in clusters. Their ore-forming fluid consists of intra-basin brines (not related to magmatic and metamorphic water) with an approximate salinity of 10 to 30%, equivalent to the weight of table salt. The Earth’s crust is the source of metals and sulfur in MVT deposits. The final temperature of sulfides in these deposits ranges from 75 to 200 degrees Celsius. The controlling factors for their formation are faults and fractures, dissolution seams, and transitional boundaries (often between carbonate units and shale layers). Sulfide minerals exhibit a range from coarse to fine-grained and disseminated to massive [10,13]. Temporal association with tectonic activity influences fluid flow and hydrothermal processes [8,13,14].
At a district scale of MVT Pb-Zn mineral systems, the critical processes include sediment basin development, fluid flow, source of metals, active pathways, and chemical/physical traps. The main factor that starts the desired mineralization process is the tectonic forces and also lithological pressure of the sedimentary layers caused by the foreland basin formation [4,6,7,8,15]. The pressure induces the water flow within the sedimentary basin (basinal brines). This water is heated at the bottom of the sedimentary basin due to the geothermal gradient. The heated water then moves within the surrounding rocks. Some of these adjacent rocks serve as good sources of metals, including shales, siltstones, and sandstones [8]. Some studies show that black shale, which contains extractable metals, is one of the potential sources of Pb and Zn in Pb-Zn MVT deposits [4,7,16,17,18,19]; thus, the heated fluid leaches the metals from the surrounding rocks and carries them away.
Faults and fractures serve as pathways for fluids within the Earth’s crust, allowing the percolation of the saline fluids with the host rocks and also increasing the area of interaction. Movement along these structures allows the creation of spaces where mineralization occurs. These faults play a key role in transferring ore-bearing fluids from deeper layers to the surface. Within carbonate host rocks, fluid circulation occurs through permeable corridors, enhancing the conduit for ore-forming processes [20,21,22]. MVT Pb-Zn deposits are particularly prevalent in the Phanerozoic, constituting the second-largest category of lead-zinc deposits, accounting for approximately 24% of all Pb-Zn occurrences. The peak occurrence of MVT deposits coincides with the amalgamation of the Pangaea supercontinent (Carboniferous to Permian) and the Alpine-Laramide orogeny (Cretaceous to Tertiary) [8]. Recent decades have seen significant advances in understanding the genesis of the MVT Pb-Zn mineralization. Extensive research has investigated the features of these deposits [17,18,23,24,25]. Currently, it is widely accepted that most MVT deposits are related to enormous fluid systems that migrated through carbonate units in foreland basins, driven by gravity from an adjacent orogenic belt [3,26,27,28]. These epigenetic Pb-Zn deposits are hosted by stratigraphic layers within carbonate rock formations, resulting from the filling of specific horizons [1,3,4,6,8].
There are over 285 carbonate-hosted Pb-Zn (CH Pb-Zn) deposits in Iran, which fall into two main categories: (1) Permian–Triassic-hosted deposits (mainly MVT) concentrated in the Central Alborz metallogenic belt, the NE margin of the Sanandaj-Sirjan Zone (SSZ), and the Tabas-Posht e Badam metallogenic belt and (2) Cretaceous-hosted deposits distributed in the SSZ, the Yazd Block, and the Central Iranian Geological and Structural (CIGS) transitional zone [14,15]. There is a notable association between the distribution of CH Pb-Zn deposits and the main suture zones surrounding the Iran Plate. Most of the orogenic MVT deposits from the Permian–Triassic period occur along these suture zones. These zones formed due to the collision between the Iran Plate and the Eurasia Plate during the Upper Triassic when the Paleo Tethys Ocean closed. The close spatial and temporal relationships between these MVT deposits and the Main-Cimmerian orogenic events indicate the development of a foreland basin during the Upper Triassic. This basin played a role in Pb-Zn and fluorine mineralization. The modern distribution of these deposits in Iran is attributed to the formation of this foreland basin and subsequent fragmentation of the Central Iranian Microcontinent into blocks that rotated along right-lateral strike-slip faults. This late process divided the Permian–Triassic MVT province into the Tabas Posht e Badam and Central Alborz metallogenic belts [14,15]. Some studies have been conducted about CH Pb-Zn deposits in Iran [8,13,14,15,29,30]. Parsa and Maghsoudi [20] considering the necessity of recognizing the processes that have controlled the establishment of MVT Pb-Zn mineralization in the Behabad district (Iran), clarified the structural and lithological factors influencing their distribution.
Considering the necessity of distinguishing the processes that controlled the organization of MVT Pb-Zn mineralization, this study aims to clarify the structural and lithological factors influencing the distribution of MVT Pb-Zn deposits in western Semnan in Iran, which are not yet fully understood and can provide valuable insights for future exploration efforts [18]. In this study, the Fry analysis technique [31] was applied to clarify spatial distribution patterns in the MVT Pb-Zn deposit [20,32]. Additionally, we used distance distribution analysis [33] to study the spatial relationship between geological features and known occurrences and subsequently recognize the geological features that are significantly associated with MVT Pb-Zn deposits [20,34]. Furthermore, we integrated sediment basin geochemical signatures and inferred controlling factors using a data-driven random forest (RF) algorithm to identify high-potential MVT Pb-Zn mineralization in the study area.

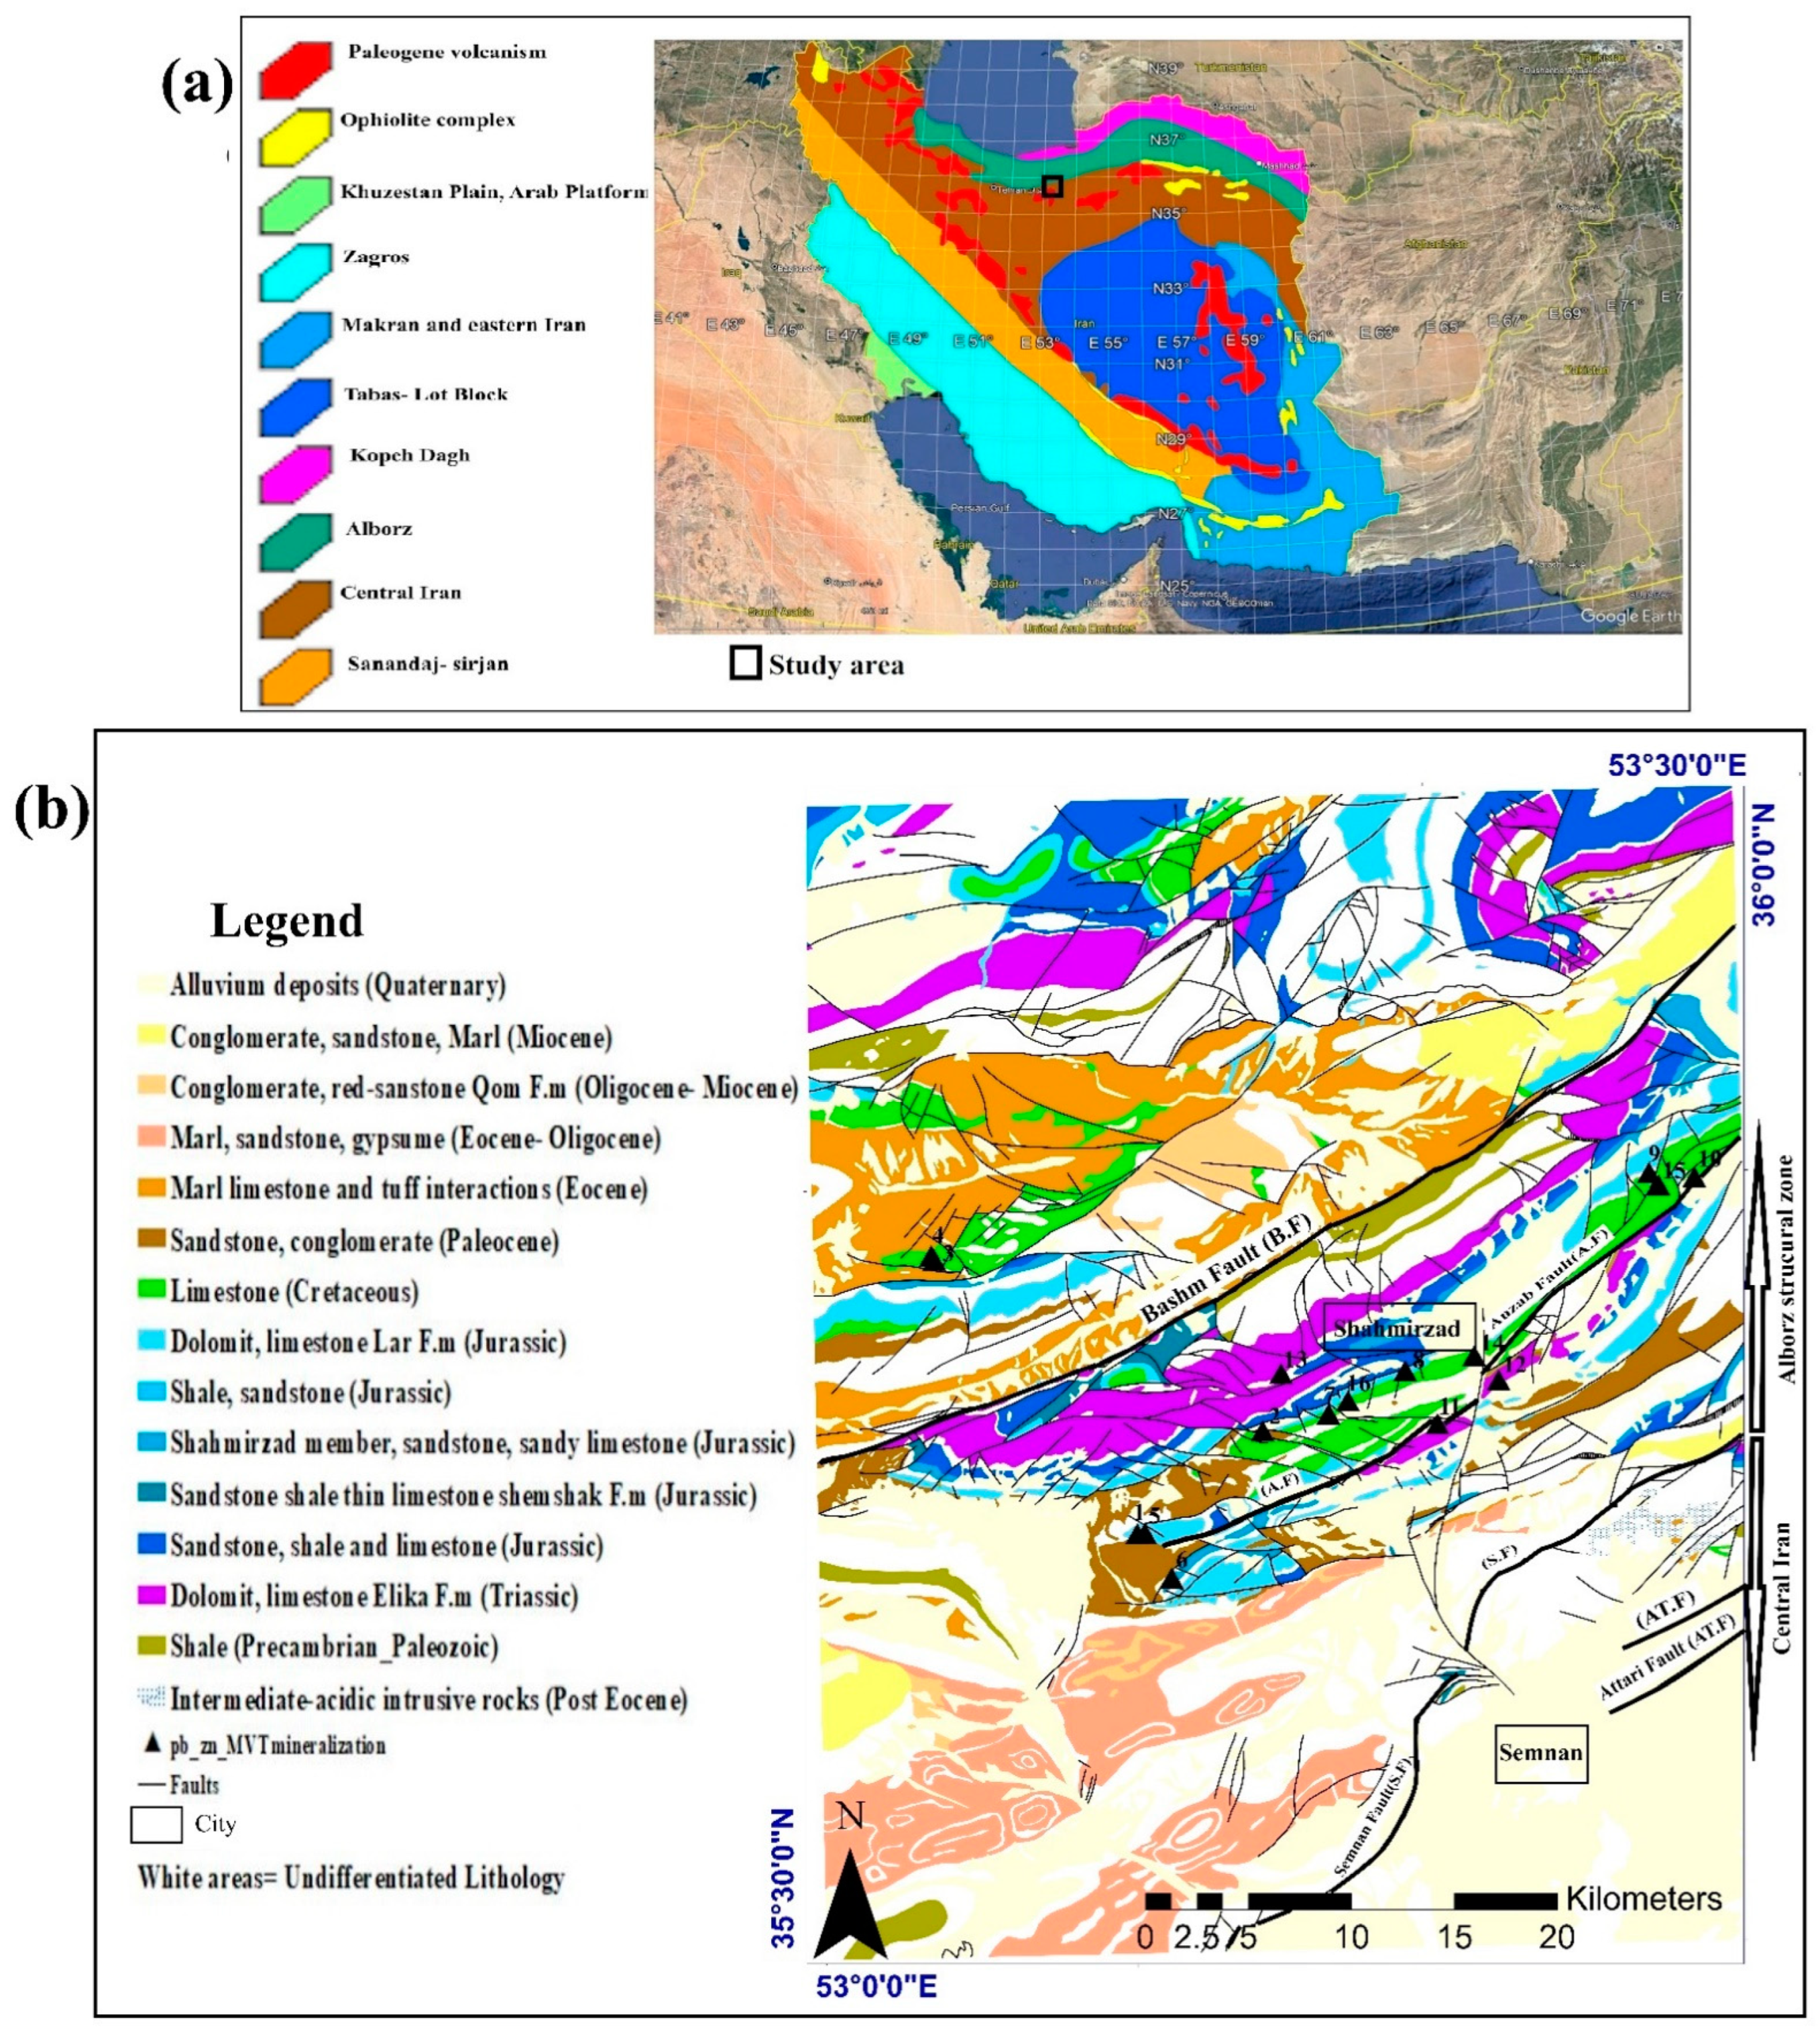
2. Geological Framework of the Study Area

The study area is located in the western part of Semnan province, Iran (Figure 1a). Semnan province straddles the southern slopes of the Alborz Mountain range (central-eastern) and borders the Great Desert to the north. It falls within two distinct structural zones: the Alborz Zone and the Central Iran Zone (CIZ) (Figure 1a). The ‘Semnan fault’ in the north demarcates the boundary between Alborz and CIZ, while the Attari fault, located about 30 km east of Semnan, separates the two tectono-sedimentary zones within the CIZ (Figure 1b). These tectonic features play a crucial role in shaping the geological landscape of Semnan Province [35,36,37]. Separated by important faults from north to south, the study area exhibits two major tectono-sedimentary units, including within the Alborz Zone with shale, green sandstone, and tuff, as well as the CIZ characterized by continental or shallow marine sediments, limestones, conglomerates, and sandstones (Neogene units [35,36,37]). Furthermore, fluorite and galena mineralization were reported in limestone layers of the Elika formation and in the Cretaceous limestone, southern part of Shahmirzad zone. Figure 1a and b depict the geographical location and simplified geological map of the selected study area, respectively.

MVT Pb-Zn Mineralization in Western Semnan

The study area, situated southeast of the central Alborz metallurgical belt in northern Iran, exhibits significant mineralization potential for MVT zinc-lead and fluorite. The Alborz orogen system is a part of the Alpine-Himalayan orogenic belt [13,15,38,39,40,41,42]. Thrust faults play a pivotal role, displacing structural elements and leading to duplex systems. Two distinct thrusting generations shaped the area: (1) the pre-Jurassic phase associated with the Early Cimmerian orogeny (ductile nature) and (2) the Cenozoic phase, which is related to the Alpine orogeny (brittle behavior) [40].
In the study area, MVT lead and zinc mineralization primarily occurs in Cretaceous carbonate rocks (dolomite and dolomitic limestone), Lar formation limestones (Late Jurassic), and Elika formation dolomites (Triassic) [8,13,14,30]. Sulfide mineralization in this area is accompanied by hydrothermal alteration, dolomitization, and less significant silicification [29]. Hydrothermal dolomites, coarser-grained than regional diagenetic ones, surround sulfide mineralization loads. MVT deposits tend to be more commonly hosted in dolomite rather than limestone. These dolomite-hosting deposits are typically larger and exhibit higher grades of Pb and Zn compared to other host rocks [43]. Galena, sphalerite, and minor pyrite occur in various forms (streaks, veins, substitution, etc.) and are associated with carbonate mineral phases. The Anzab and Bashm faults, trending NE–SW, are key structures in the Cretaceous succession and seem to play a crucial role in sulfide mineralization. These compressional faults intersect secondary mineralization-related tensional faults and fractures with NW–SE trends. Fault activity was initiated during Upper Cretaceous limestone and dolomite deposition in western Semnan [13].
Hydrothermal fluids exhibit a homogeneous temperature range (70–110 °C) and salinity (15%–25% NaCl by weight) [13]. Oxygen isotope studies on quartz and carbon isotopes of dolomite reveal sedimentary fluids as ore-forming agents. Galena Pb isotopes trace the metals back to continental crust sources [8,13].
Based on a 1:100,000 scale geological map of Semnan and related previous studies, characteristics of 16 MVT Pb-Zn deposits of the study area were summarized (Table 1). Since the Semnan fault is the boundary of the Alborz structural zone and CIZ, all of these deposits are located in the Alborz zone.
Table 1. Summary of major characteristics of some MVT deposits in western Semnan.
No.NameX in UTMY in UTMMetal AssociationsHost Rock
1Chenaran53°10′15″35°40′54″LeadLimestone. Lar. Fm (Jurassic)
2Darreh Ahu53°14′21″35°43′31″LeadDolomite, limestone (Cretaceous)
3Sarlash53°03′48″35°48′15″Lead/ZincLimestone (Cretaceous)
4Anabu53°03′55″35°48′09″Lead/ZincLimestone (Cretaceous)
5Kuh-e-Rudbar53°10′29″35°40′55″Lead/ZincLimestone. Lar. Fm (Jurassic)
6Abgarm53°11′20″35°39′45″Lead/ZincSandy limestone. Shahmirzad member (Jurassic)
7Shahmirzad53°16′29″35°43′54″Lead/ZincLimestone (Cretaceous)
8Mehdi Shahr53°19′00″35°45′00″Lead/ZincLimestone. Lar Fm (Jurassic)
9Kuh-e-Bashm53°27′00″35°49′59″Lead/ZincLimestone (Cretaceous)
10Rezabarag53°28′18″35°49′40″Lead/ZincLimestone (Cretaceous)
11Sangsar53°19′59″35°43′36″Lead and ZincLimestone. Elika Fm (Triassic)
12Laveh dar53°22′00″35°44′41″Lead and ZincDolomite. Elika Fm (Triassic)
13Darband Shahmirzad53°15′00″35°45′00″Lead and ZincLimestone, dolomite. Elika Fm (Triassic)
14Darband53°21′10″35°44′54″Lead and ZincLimestone (Cretaceous)
15Rezabark53°27′17″35°49′40″Lead and ZincLimestone (Cretaceous)
16Shahmirzad153°17′08″35°44′14″Lead and ZincLimestone (Cretaceous)

3. Material and Methods

3.1. Data Source

In this study, we used a 1:100,000 scale geological map of Semnan. The geological map was digitized, from which the recorded lithological units and faults/lineaments were derived in the vector format (Figure 1b) and the locations of 16 known MVT Pb-Zn occurrences in western Semnan (Figure 1b and Table 1).
The Geological Survey of Iran conducted a systematic geochemical exploration program in the Semnan geological map area at a 1:100,000 scale. They established a regular sampling network with 1400 m × 1400 m cell size. Stream sediment samples were collected from first- or second-order streams within each cell. These samples were combined into composite samples representing 2 km² and associated with each cell’s center. A total of 1111 composite stream sediment samples were collected. Major and trace element concentrations in these samples were analyzed using inductively coupled plasma optical emission spectrometry (ICP-OES), except for gold (Au), which was analyzed separately using the fire assay method (note that universities and researchers are permitted to use the GSI data). Geochemical data investigation is crucial for identifying promising areas for mineralization modeling [44]. Previous studies by [45,46,47,48] have successfully used geochemical data to detect anomalies and potential mineral resource zones.

3.2. Fry Analysis

The spatial distribution of mineralization can be assessed by creating a plot where the distances and directions between each data point are represented as points relative to the origin [32]. The Fry analysis, introduced by Fry in 1979, is a geometric autocorrelation technique used to examine the spatial distribution of point objects. This method was applied to investigate the structural controls of mineral deposits across various terrains, as demonstrated by studies conducted by [20,32,34,49]. In the Fry method, a transparent sheet of paper with vertical and horizontal axes is employed to create a set of translated points based on the location of each object. By moving the paper both horizontally and vertically across a map depicting the spatial distribution of points, researchers position each point at the central intersection point once, recording the locations of the remaining points on the transparent paper. In DotProc software (version 1.0f), for a total of n points, the Fry analysis generates n2n translated points, commonly known as ‘Fry points’. These points provide valuable insights into the spatial distribution of point objects and mineral deposits during regional-scale assessments, helping us investigate the influence of geological features in the genesis of one typology of deposits. Therefore, in this study, the point vector layer containing coordinates of the 16 MVT Pb-Zn occurrences in ArcGIS (version 10.8.1) was exported into a format supported by DotProc. Using the Fry points output from DotProc 1.0f, we inputted the data back into ArcGIS to visualize and analyze the spatial pattern of both the Fry points and the original data points.

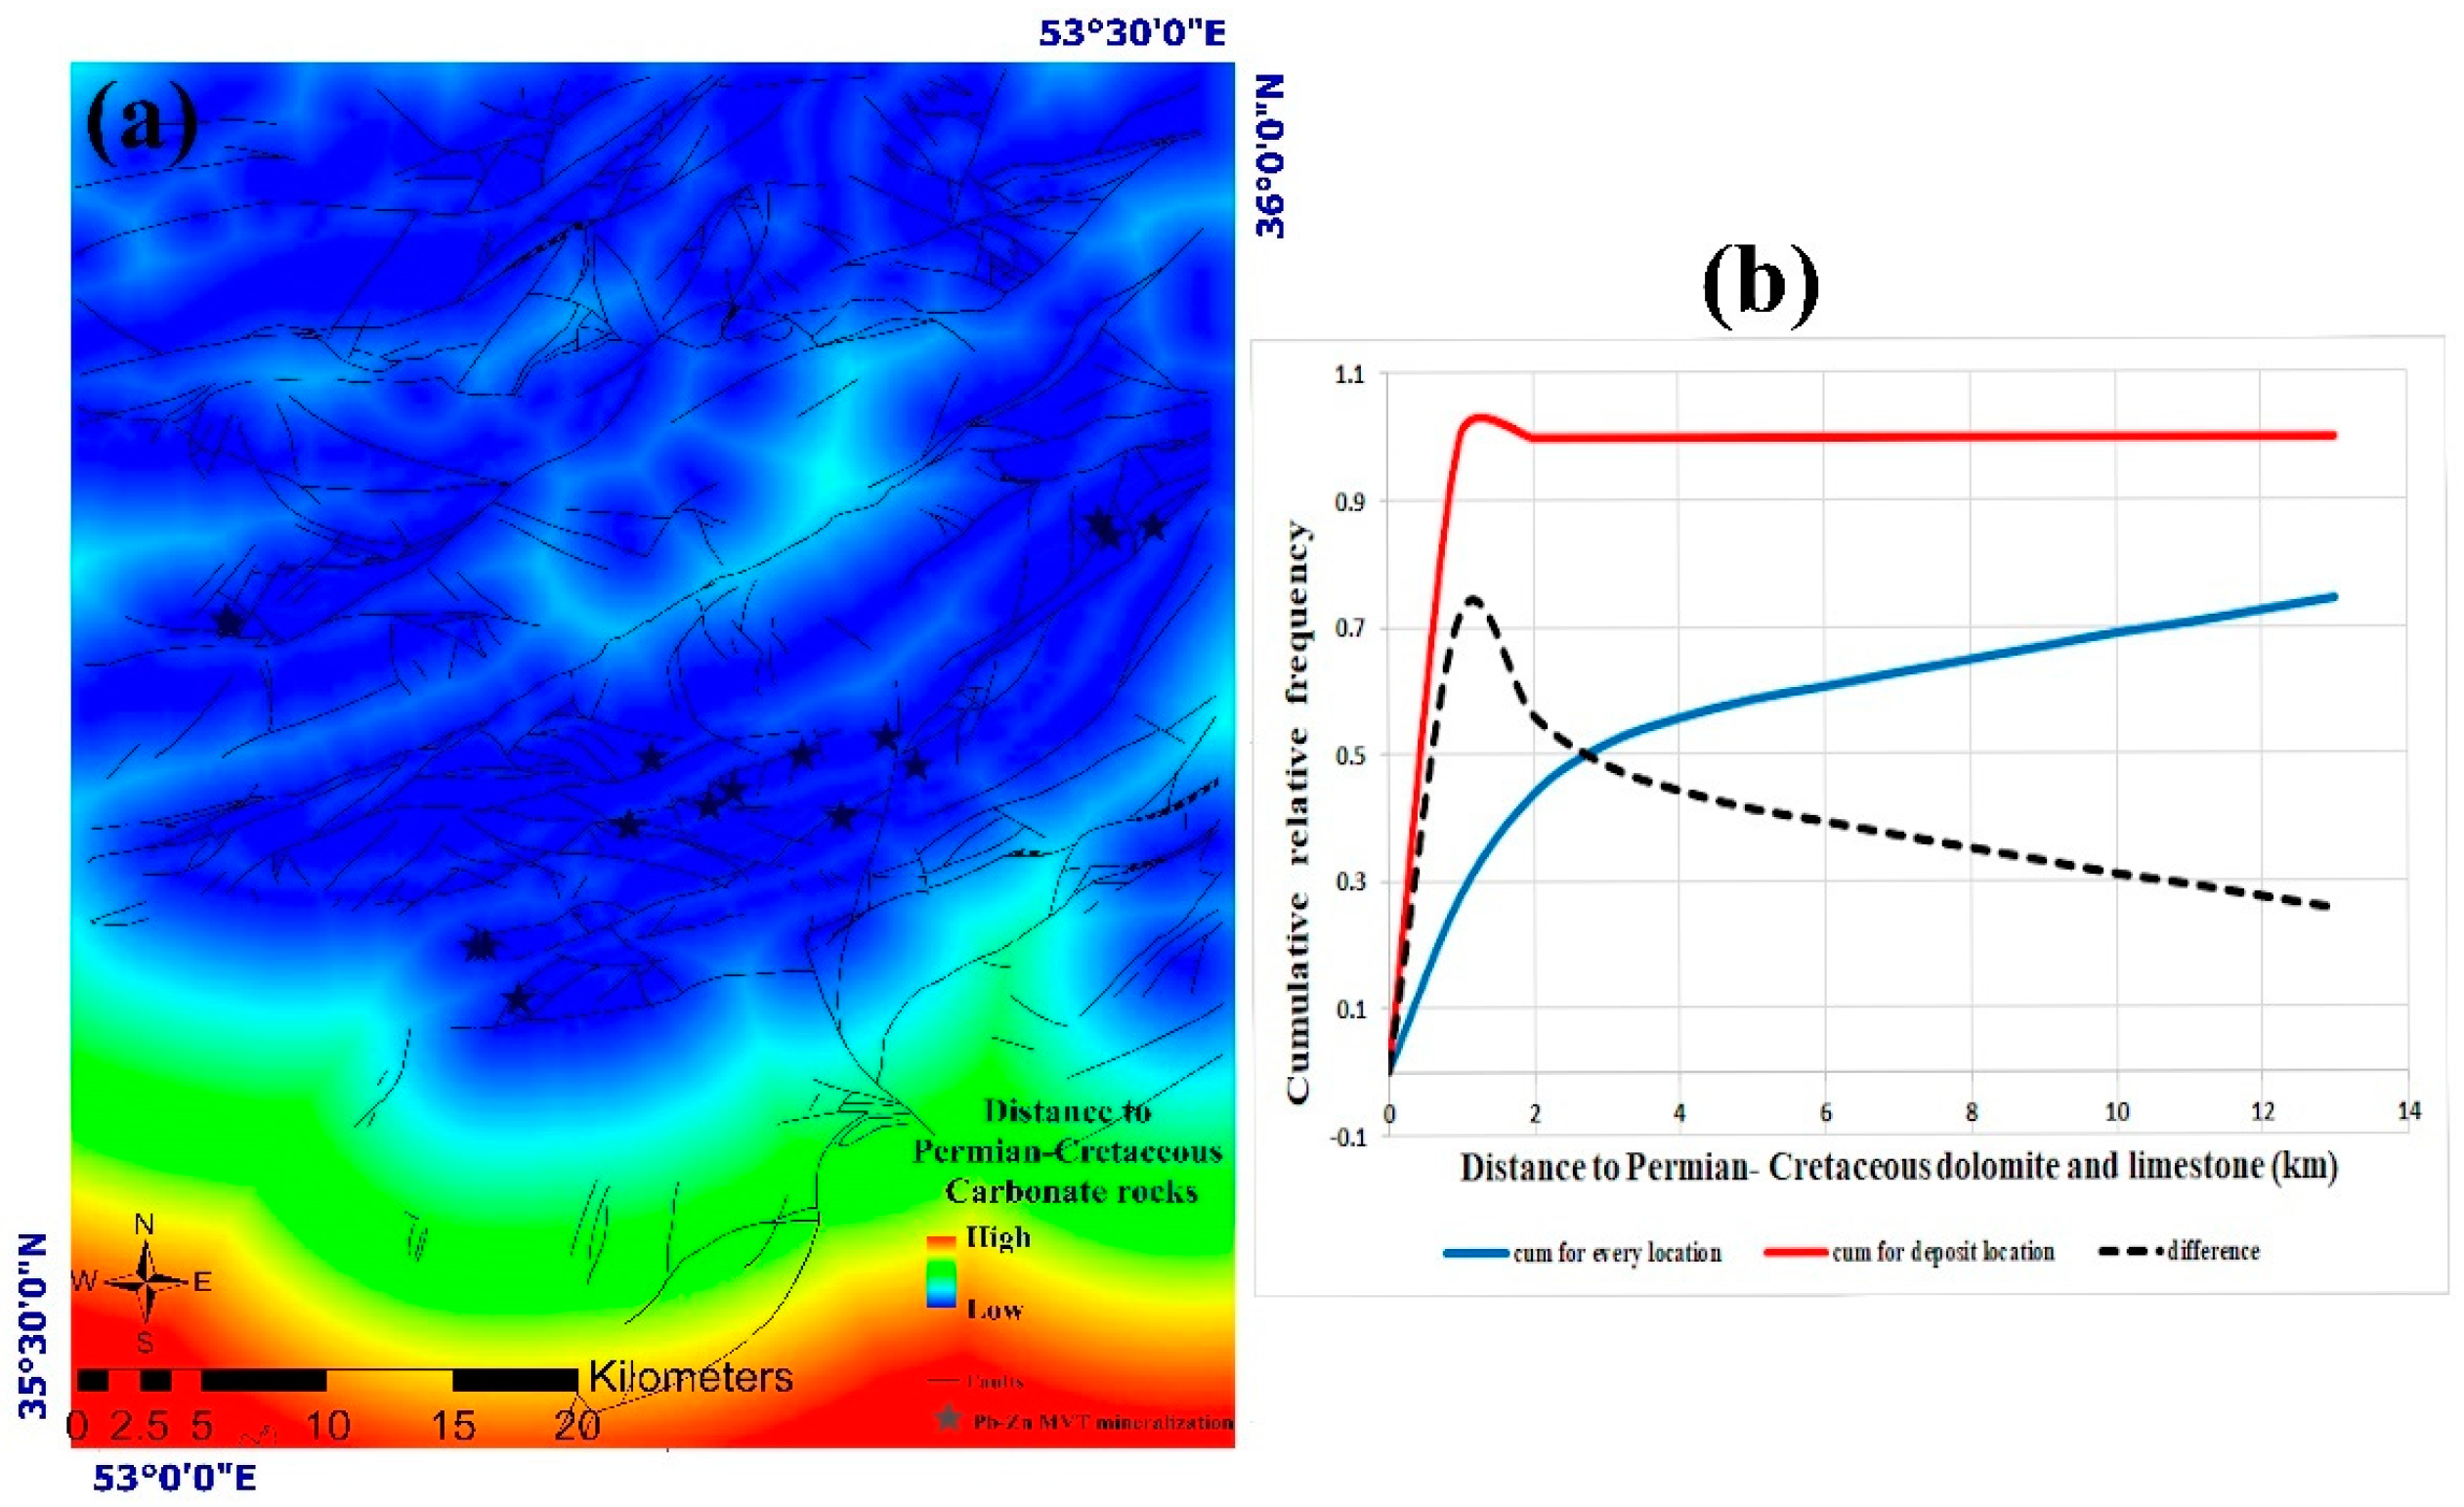
3.3. Distance Distribution Analysis

The concept of distance distribution pertains to the probability distribution of the distance from a fixed point to the k-th nearest figure within a Poisson process of identically-shaped figures in n-dimensional space [33]. The method outlined in Berman’s paper enables the determination of this distribution, and notably, it remains independent of the figures’ orientation distribution. This approach has been applied in various fields, including the study of spatial associations between point objects and geological features, such as mineral occurrences [20,50,51]. In this approach, we compare the cumulative relative frequency distribution of distances from a set of geological features to mineral deposit locations (Dm) with the distribution of distances to all locations (De). The former represents the geological conditions influencing mineral deposit emplacement, while the latter represents a random pattern. The contrast C, which represents the difference between the two plots at varying distances, serves as a measure of spatial association between mineral deposits and geological features. If C≅0, then the mineral deposit locations and the set of geological features are spatially independent [34]. Positive and negative C values indicate corresponding positive and negative spatial associations. The maximum value of C (Cmax) identifies the optimal distance range where the most significant spatial association occurs between mineral deposits and the geological features under examination. A higher Cmax signifies a stronger spatial relationship between these features (faults, lithologies, etc.) and mineralization.

3.4. Random Forest (RF) Algorithm-Based Modeling

To produce a prospective map of MVT Pb-Zn mineralization in western Semnan, we used RF algorithm [52]. RF is a machine learning (ML) algorithm that creates an ensemble of multiple decision trees to reach a singular, more accurate prediction or result. This method is very popular for not only classification tasks but also for regression analysis [44,53,54,55,56]. The trees are applied sequentially, starting from a root node and progressing to terminal nodes (leaves). The goal is to make repeated predictions based on training data. RF can be used for both classification and regression tasks. Each decision tree in the ensemble is trained on a randomly selected subset of the data, using bootstrap aggregation (bagging). Out-of-bag samples are used for validation. Additionally, at each node split, a random subset of predictor variables is considered. The final prediction from the RF (in regression) is the average of predictions from all the individual regression trees. The algorithm recursively splits the data based on conditions until a predefined stopping criterion is met. Each leaf node contains a simple regression model. The Gini impurity index is used to assess the purity of child nodes relative to their parent node. Decision trees in RF can grow to maximum purity, unlike regression trees, which can be pruned or grown to specific conditions [52,57].
In data-driven predictive modeling of mineral prospectivity, RF utilizes multiple regression trees. These trees are trained on labeled data, where the target variable takes values of 1 for deposit locations and 0 for non-deposit locations. As a result, RF predictions yield floating values between 0 and 1, representing the likelihood of mineral deposit occurrence. By applying a specific threshold value, these predictions can be classified into a binary map of prospective and non-prospective areas. In this study, we used a binary labeling approach (0 and 1). Specifically, we considered a buffer of 2000 m around the 16 known MVT Pb-Zn deposits, labeling these areas as 1 (indicating mineralization). Additionally, we identified 16 locations that are not only distant from the known deposit sites but also far from their suitable host rocks, labeling them as 0 (indicating non-mineralization).

3.4.1. Hyperparameters for RF Analysis

When working with RF for regression tasks, it is essential to understand hyperparameters and evaluate the model’s performance. The key aspects to consider involve:
Number of Estimators (n_estimators): The n_estimators parameter determines the number of decision trees in the ensemble. Increasing the number of estimators can improve model performance up to a point. However, adding too many trees may lead to overfitting. We should consider experimenting with different values (e.g., 100, 500, 1000) and selecting the optimal value based on cross-validation results.
Randomness Parameters (random_state): The random_state parameter ensures reproducibility by fixing the random seed used during bootstrapping and feature selection. We should set it to a specific value (e.g., 0) for consistent results across runs.

3.4.2. Performance Metrics for Regressor RF

Mean Absolute Error (MAE): The MAE measures the average absolute difference between predicted and actual values. Lower MAE indicates better performance.
Root Mean Squared Error (RMSE): The RMSE penalizes larger errors more heavily than the MAE. It is the square root of the mean squared error. Smaller RMSE values are desirable.
R-squared (R2) Score: The R2 score represents the proportion of variance explained by the model. It ranges from 0 to 1, where 1 indicates a perfect fit. Higher R2 values indicate better explanatory power.

4. Analysis, Results, and Interpretation

To assess the spatial distribution pattern of Pb-Zn MVT deposits in the study area, fry analysis was applied to the locations of the 16 known deposits (Figure 2a). Furthermore, an orientation diagram was created for all pairs of Fry points, revealing a significant northeast-to-southwest direction (see Figure 2b). This orientation corresponds to the prevailing northeast-to-southwest fault and carbonate unit trend observed in the study area.
In the study area, various faults were categorized into four main orientations: N–S, E–W, NW–SE, and NE–SW (Figure 3). The minor direction showed N30°W, N50°W–N60°W, and N80°E. Distance maps for all four orientations were created (Figure 4). Then, the spatial relationships between MVT Pb-Zn deposits and these structural features were assessed using the distance distribution analysis method introduced by [33] (see Figure 5a–d). According to the producing plots and related C values for each orientation, all of the faults’ orientations are in a positive correlation with MVT Pb-Zn occurrences except for N–S trending faults. The C_max values for the E–W and NW–SE directions are 0.43 and 0.44, respectively. However, NE–SW striking faults show significant positive spatial associations with the mineralization type sought in western Semnan. The C_max value of NE–SW striking faults is 0.49 (Table 2).
MVT Pb-Zn mineralization occurs within cretaceous dolomite and limestone. For a better understanding of the relationship between these rock units and MVT mineralization, a distance distribution analysis was conducted. The results indicate a strong positive spatial association (C_max value of 0.72) between cretaceous dolomite and limestone with MVT Pb-Zn occurrences (Table 2 and Figure 6). Therefore, it can be inferred that these rock units play a significant role as the lithological control for MVT Pb-Zn mineralization in western Semnan.

4.1. Conceptual Modeling of Geologic Controls on MVT Pb-Zn Mineralization

According to the spatial association analysis, the individual sets of geological features in terms of their relative importance as controls on mineral deposit occurrence can be ranked. Based on the foregoing explanation about MVT Pb-Zn mineralization in western Semnan and spatial analysis results in the relationship between the MVT Pb-Zn occurrences and geological features, we can imagine a conceptual model and identify spatial criteria in MVT mineralization in the study area. Therefore, the prospectivity for MVT Pb-Zn deposits in the district is defined by the following geological and spatial recognition criteria:
  • The presence of Permian–Cretaceous dolomite and limestone geological units as chemical and also physical traps.
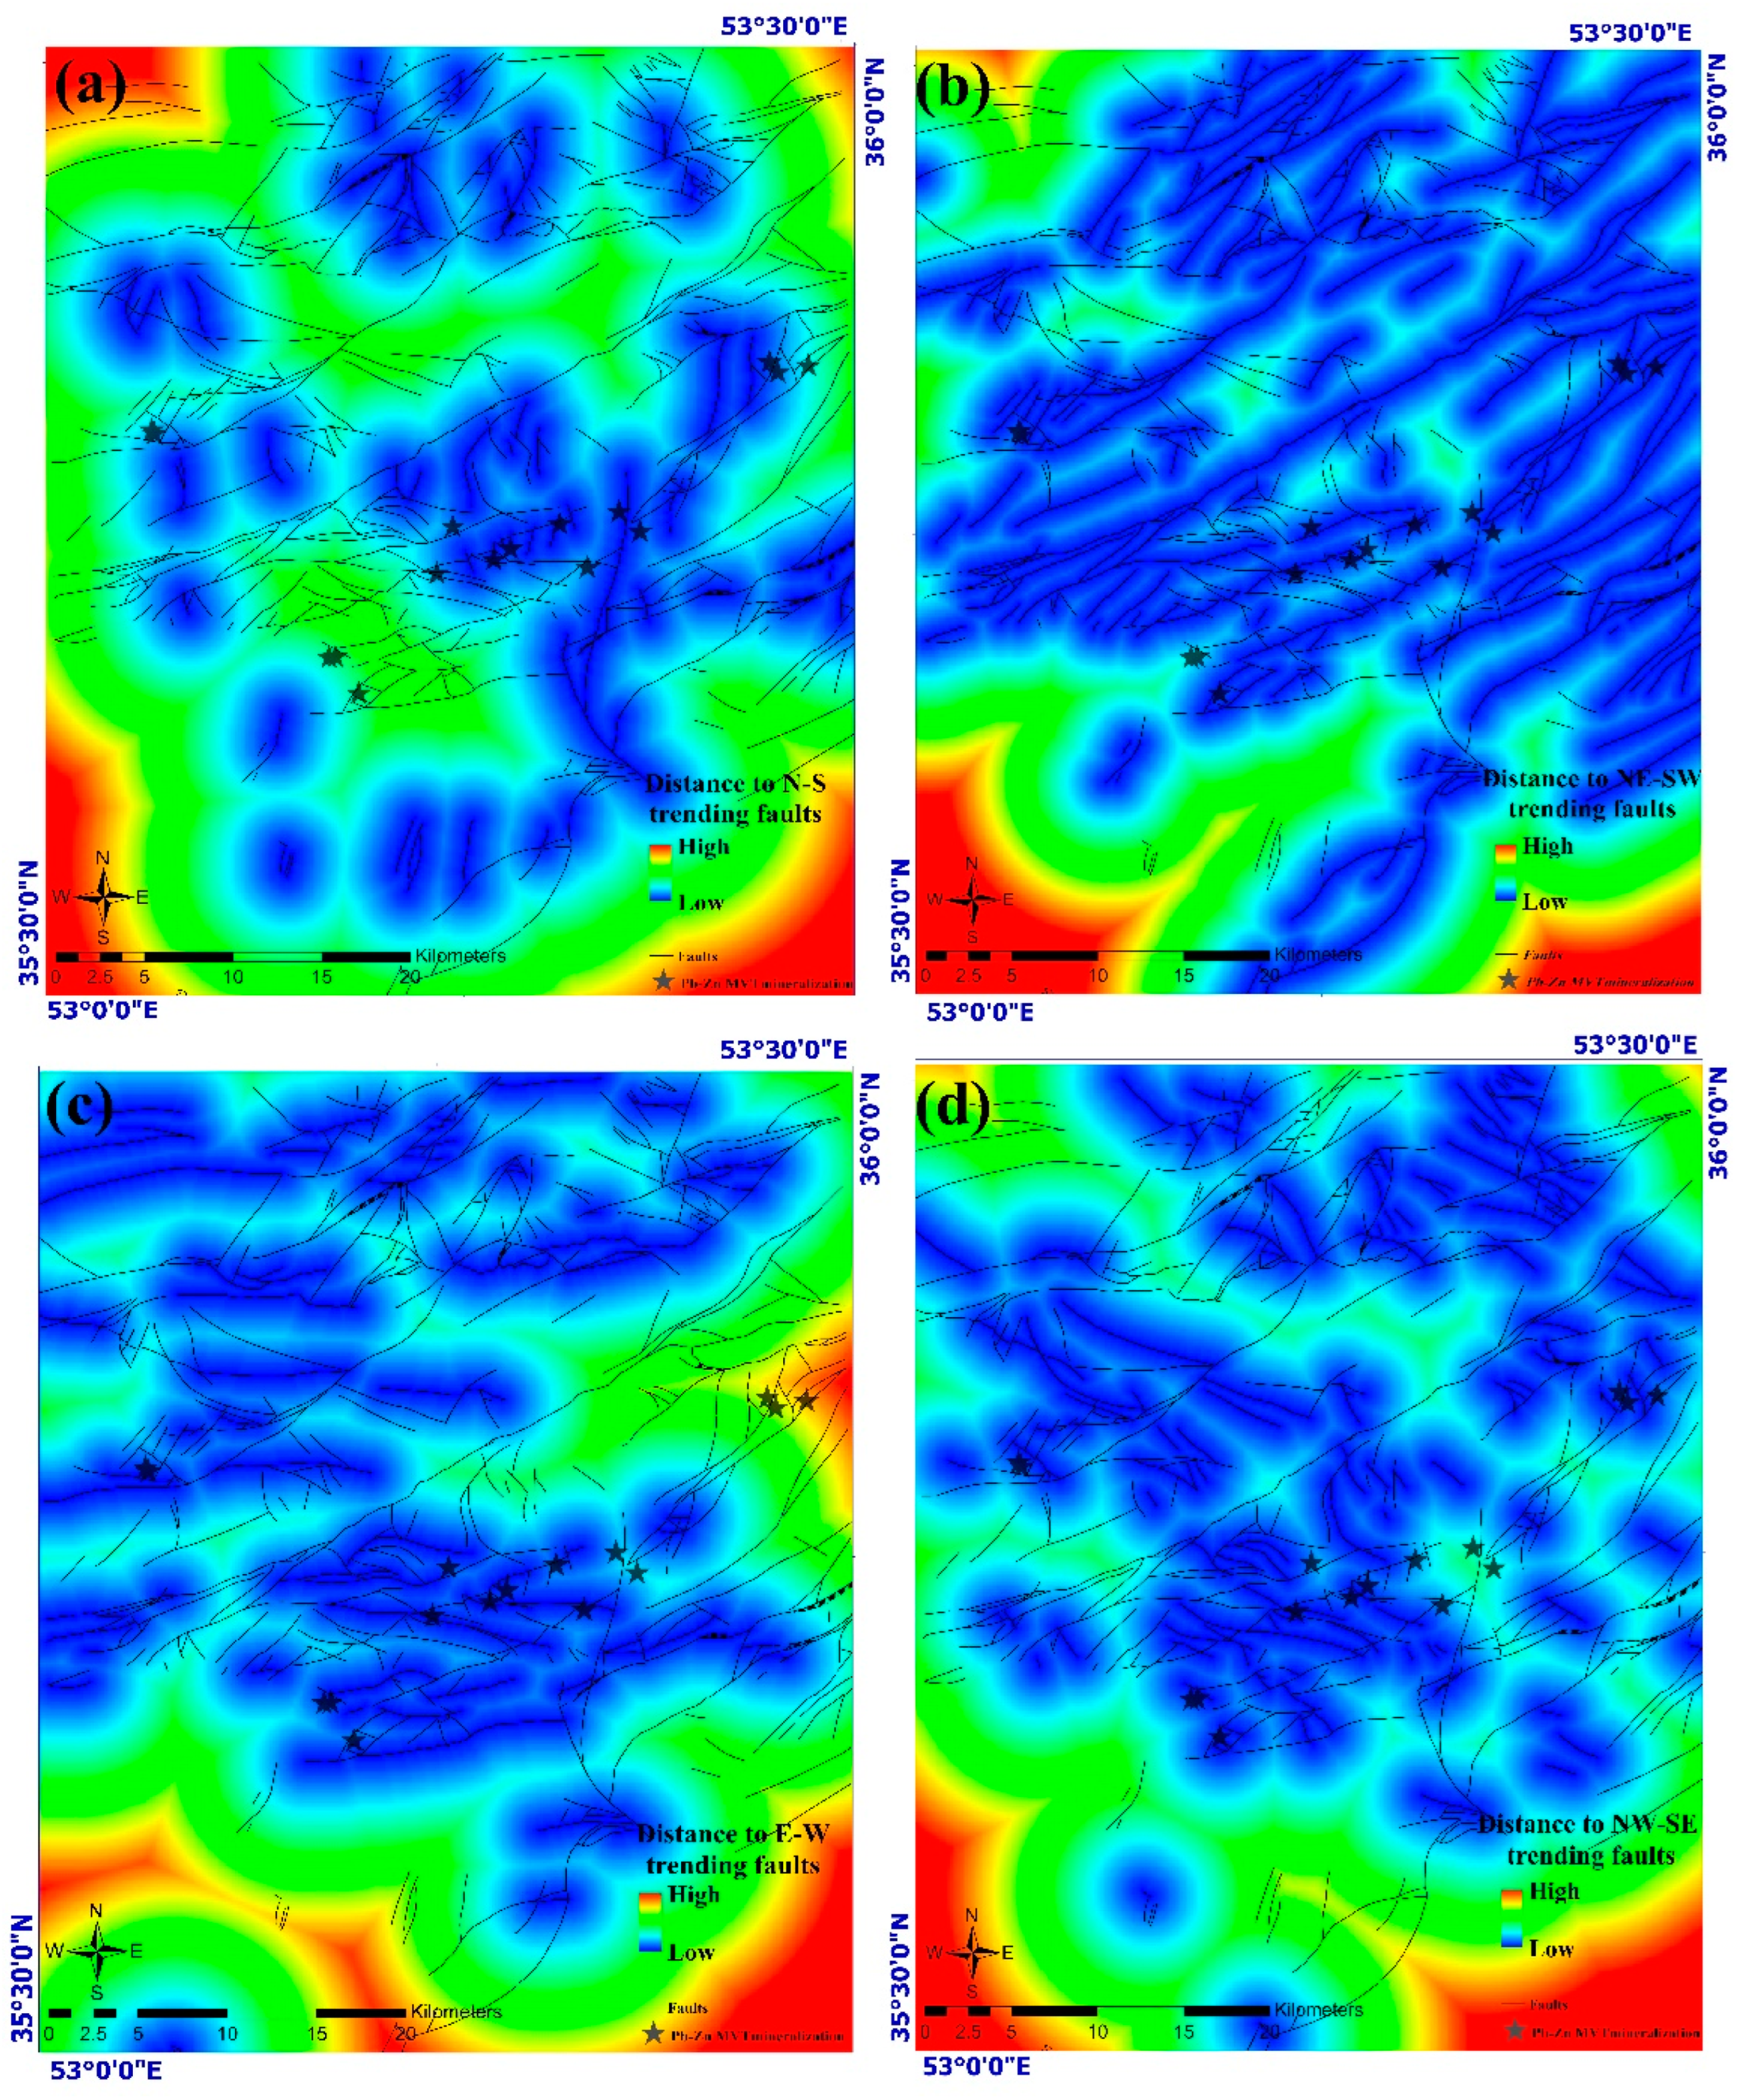
  • The presence of relative regular structure (NE–SW) faults/fractures and the confluence of the fault families for fluid migration from source to traps.
  • The presence of fractures to provide a suitable path for the flow of fluids from the sedimentary basin.
Additionally, in the formation of MVT deposits, the presence of a sedimentary basin as the primary condition for starting the desired mineralization and also the presence of rocks rich in metals (such as shales) that are leached by saline fluids is required. This conceptual model of the district-scale mechanism of geological control on MVT Pb-Zn mineralization in the study area can be tested further and mapped through predictive modeling of mineral prospectivity.

4.2. MVT Pb-Zn Mineral Prospectivity Mapping (MPM)

4.2.1. Geochemical Signatures

For mapping MVT Pb-Zn mineralization in western Semnan, we used the identified spatial controlling factors combined with the study area’s geochemical signatures.
In this research after required preprocessing, we conducted a multivariate factor analysis on 28 elements to identify the key influencing and controlling components related to the desired mineralization. Subsequently, Pb, Zn, and Ba were identified as the controlling components in this study. Then fuzzified geochemical maps of Pb, Zn, and Ba were prepared for suitable representation of geochemical signatures [58,59,60,61,62,63,64,65,66,67]. Thus, we prepared the following evidence layers for MPM in the study area for desired mineralization; we used logistic functions to fuzzify raster layers (Table 3).
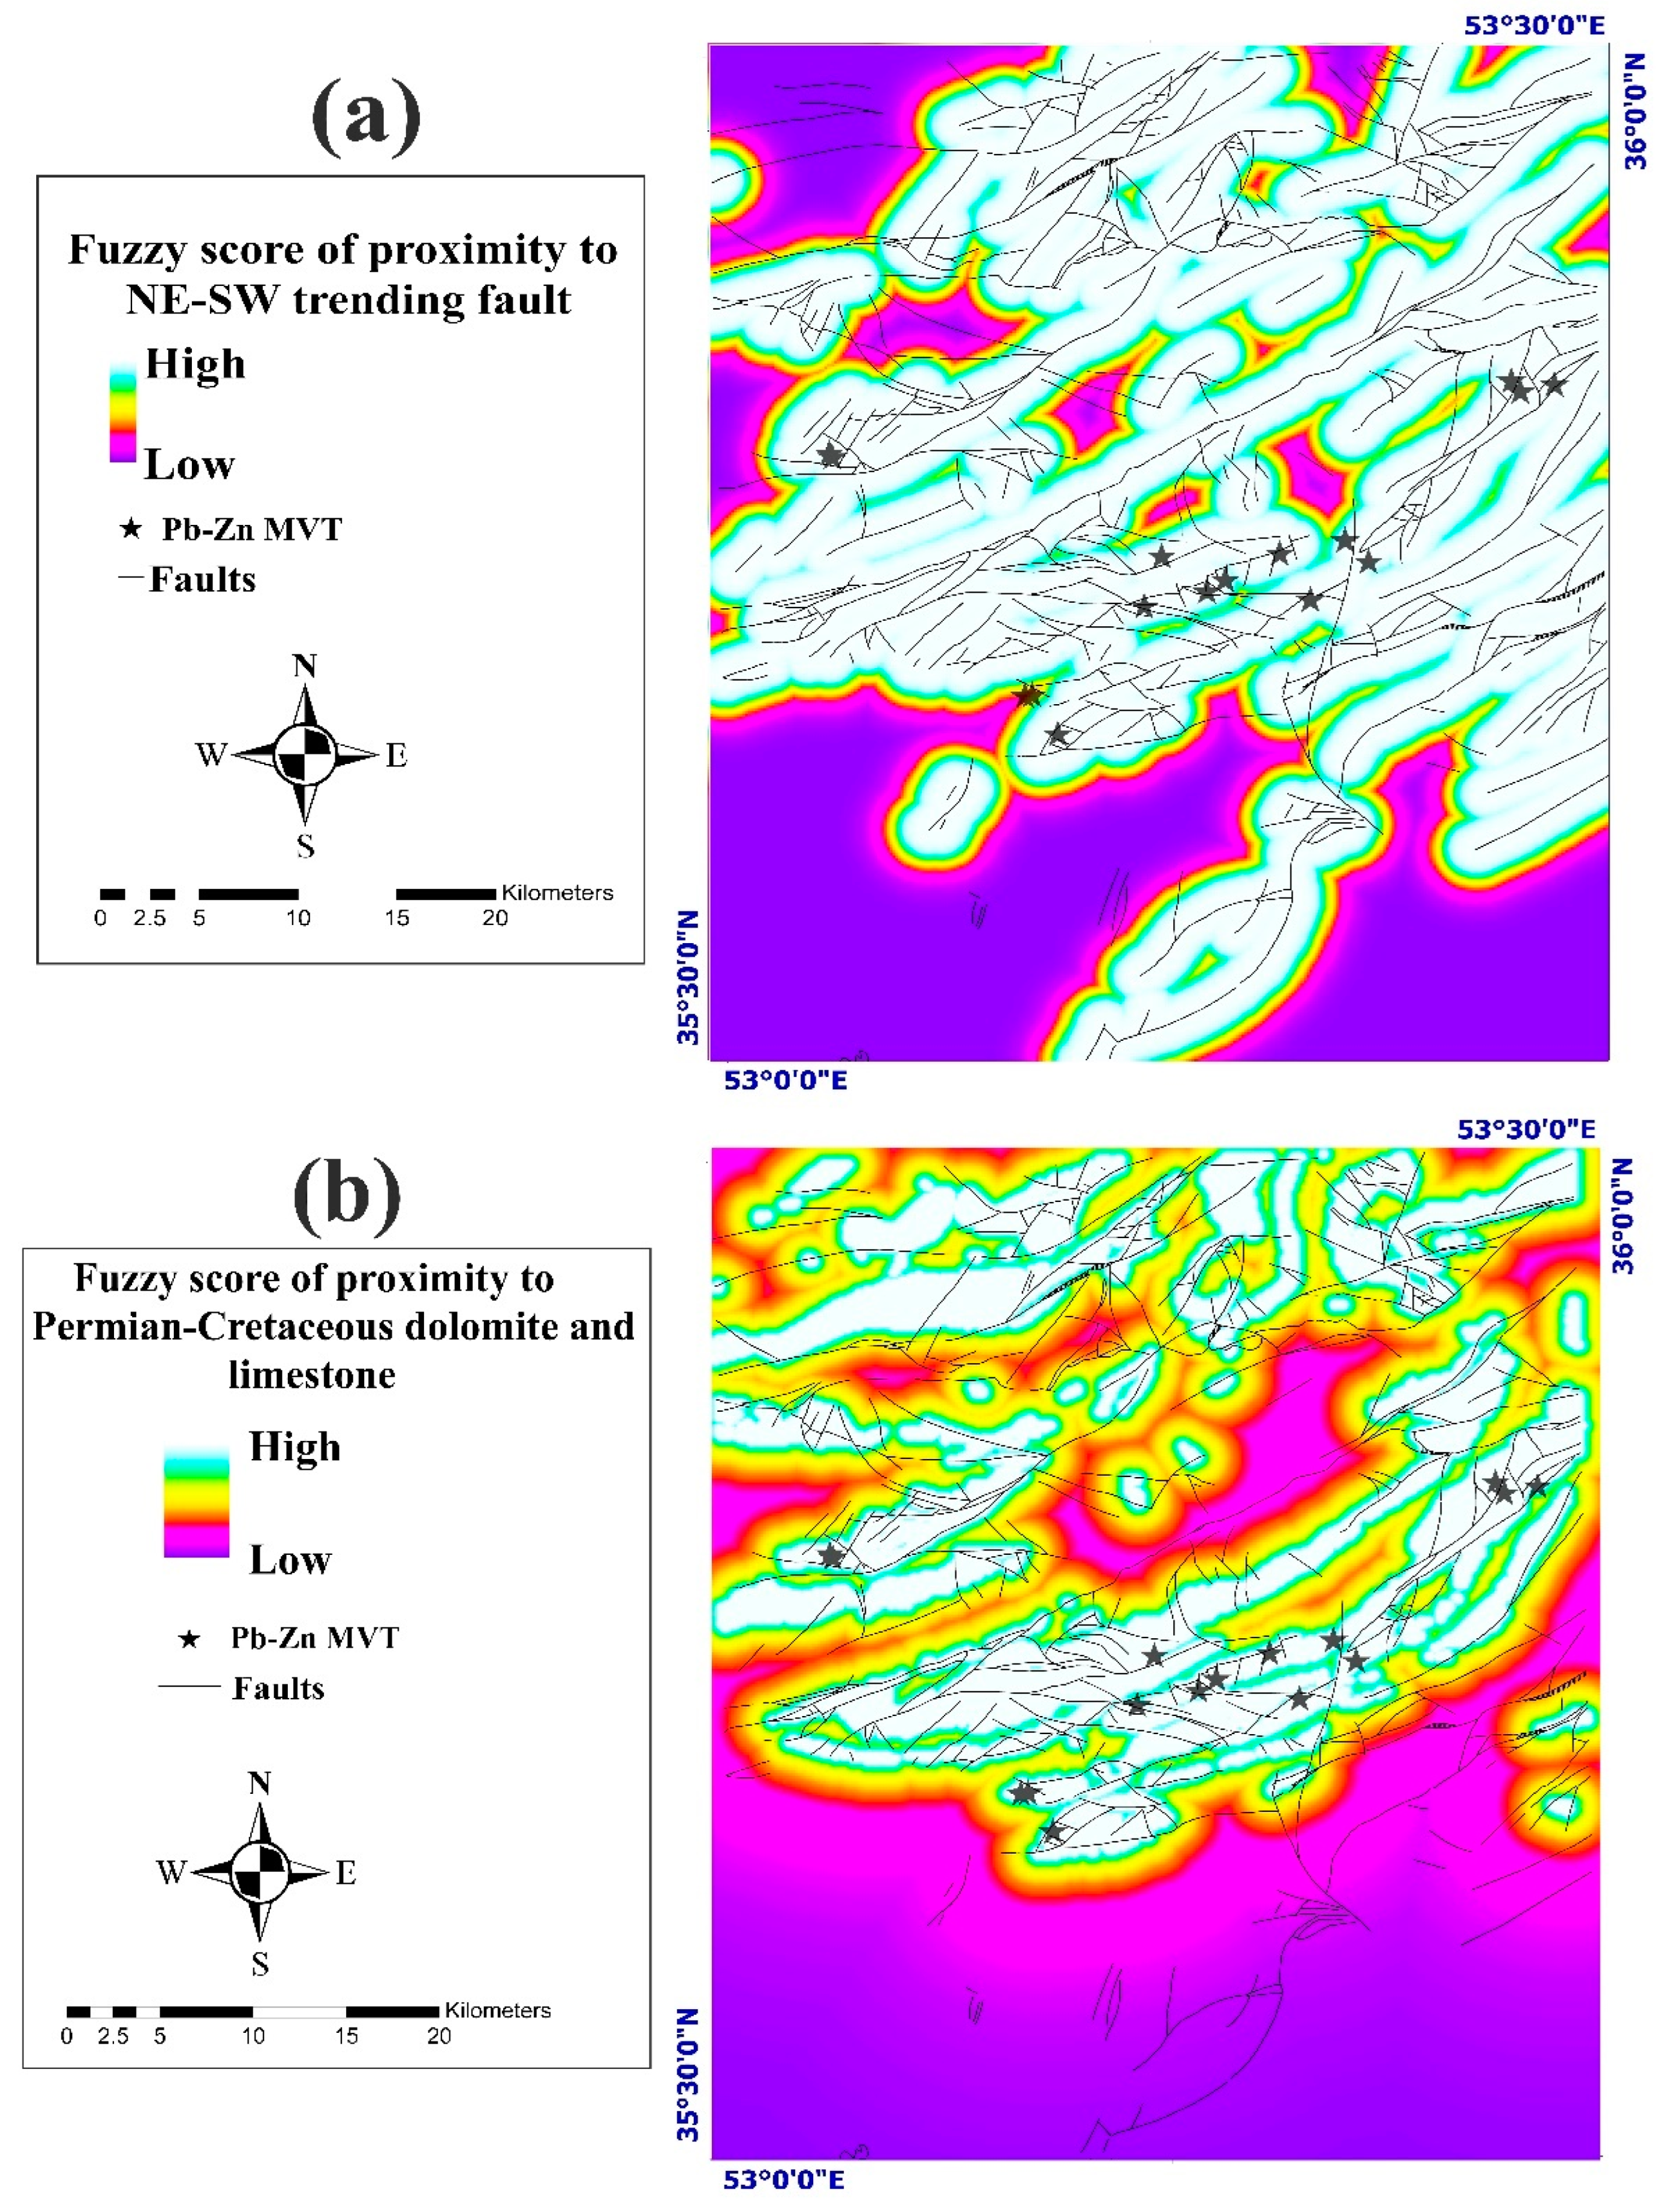
  • Fuzzified map of the proximity to the NE–SW trending fault (Figure 7a)
  • Fuzzified map of the proximity to Permian–Cretaceous dolomite and limestone geological unit (Figure 7b)
  • Fuzzified map of the geochemical information layer of Ba (Figure 8a)
  • Fuzzified map of the geochemical information layer of Pb (Figure 8b)
  • Fuzzified map of the geochemical information layer of Zn (Figure 8c)

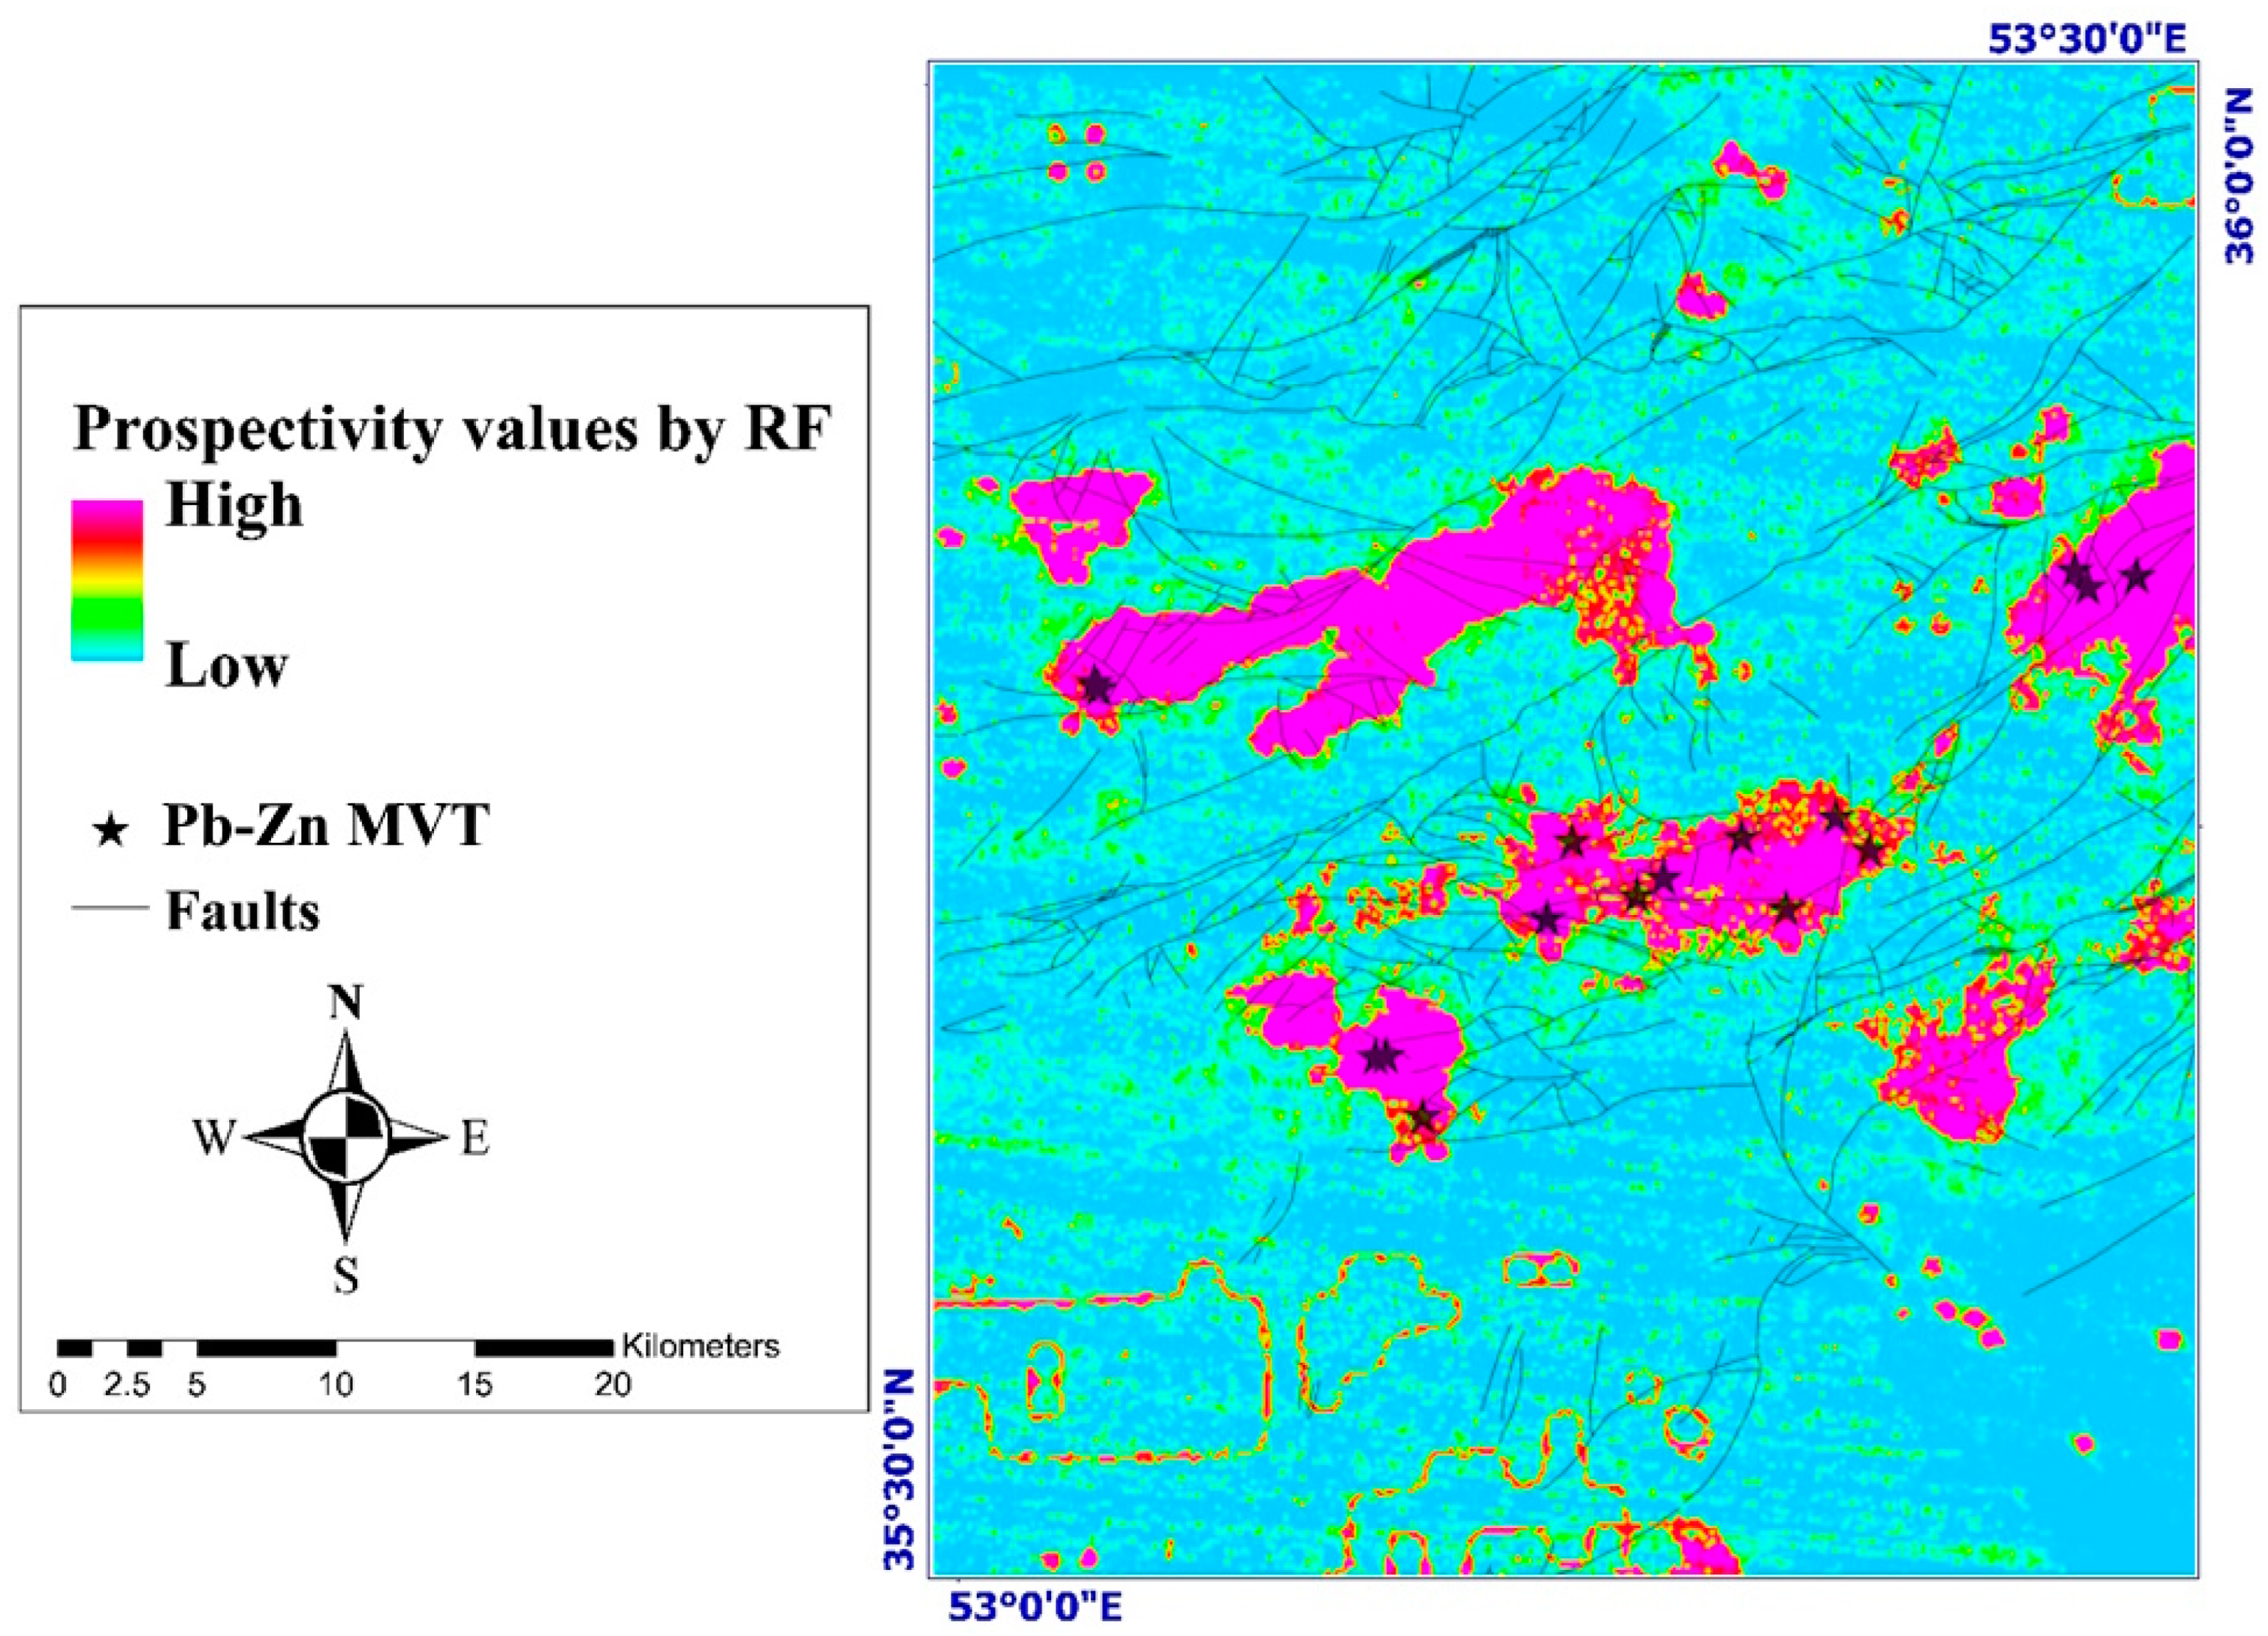
4.2.2. Model Training

The suitable RF tuning hyperparameter and the model performance metrics in this study are shown in Table 4 and Table 5, respectively. Model training was based on the labeling procedure demonstrated in Figure 9.Through subsequent training and predicting via the designed model, we created a prediction map of MVT Pb-Zn mineralization in western Semnan, as shown in Figure 10. This prediction map introduced all of the known deposits in only 15% of the study area.

5. Discussion

For over four decades, geoscientists have worked to comprehend the underlying controlling factors in the varied distribution of different types of mineral deposits to model mineral prospectivity and exploration targeting [6,12,20,68,69,70,71,72,73,74,75,76,77,78,79,80]. The spatial distribution of mineral deposits is not random and is influenced by specific geological processes and features. Analyzing the spatial patterns of known occurrences can unveil which geological factors probably controlled their formation. Furthermore, studying the associations between these deposits and specific geological features helps us discern the relative importance of each feature as a control on mineral occurrence. Ultimately, this knowledge informs the creation of predictive maps for assessing the prospectivity of similar mineral deposits at specific geographical scales.
Depending on various geological conditions and, consequently, mineralization processes, mineral deposits may be distributed in different patterns. Using mineral occurrence distribution recognition and then identifying spatial relationships between geological features and mineral occurrences could highlight controlling features on deposit formation. Controls on ore deposition could assist exploration geologists with reliable exploration targeting criteria. In this study, the point-based spatial distribution method (e.g., Fry analysis) and the lineament-based spatial distribution method (e.g., distance distribution analysis) were implemented to assess the spatial distribution pattern and controlling factors in MVT Pb-Zn mineralization in western Semnan, Iran. Each approach for analyzing the spatial distribution of mineral deposits focuses on specific aspects. However, relying solely on individual methods may not provide adequate insights into the controlling factors of mineralization. To better understand these controls, integration of multiple methods is necessary.
In this study, the spatial analysis revealed that the MVT Pb-Zn mineral deposition pattern follows the NE–SW trend. As depicted in Figure 3, the distribution of Fry points aligns parallel to fault traces, and the main trend of units exhibits a dominant northeast-southwest trend. The spatial analysis of Pb-Zn MVT deposits in relation to fault orientations reveals significant insights into the geological controls on mineralization. The distance distribution analysis demonstrated a significant positive correlation between NE–SW trending faults and the occurrence trend of MVT Pb-Zn deposits in the study area. While NW–SE and E–W trending faults also exhibit significant C_max values, the NE–SW trending faults stand out with the highest contrast value of 0.49. This suggests that NE–SW faults play a prominent role in shaping the geological framework in western Semnan. In addition, the Fry plot analysis further supports the NE–SW trend as the principal direction of mineralization, reinforcing the significance of these trending faults. Therefore, objective data (C_max values) and visual evidence (Fry plot) converge to highlight NE–SW trending faults as the dominant structural control through which ore fluids are probably channeled. This finding aligns with previous investigations and field observations [8,13]. Furthermore, the cumulative percentage graphs (Figure 5) indicate that approximately 70% of the known deposits are located within one kilometer of E–W trending faults. This suggests a strong structural control exerted by these faults on the localization of mineralization. Furthermore, the distance-distribution analysis for NW–SE trending faults shows that around 90% of the known deposits occur within 2.5 km of these faults. This pattern highlights the regional influence of NW–SE trending faults on the distribution of Pb-Zn deposits. In contrast, the NE–SW trending faults exhibit a more localized control, while 90% of the known deposits are situated within one kilometer of these faults. These findings suggest that NE–SW trending faults likely act as ore-controlling structures at the deposit scale, while NW–SE and E–W trending faults play a significant role in controlling mineralization at the regional scale. The interplay between these fault orientations and their respective distances to mineral deposits underscores the complexity of structural controls in the study area. Overall, the analysis provides a comprehensive understanding of the spatial relationship between fault orientations and Pb-Zn mineralization, which is crucial for guiding future exploration efforts in the region.
Moreover, distance distribution analysis revealed that Permian–Cretaceous dolomites and limestones, which are hosted for MVT mineralization, are lithological controls in MVT Pb-Zn mineralization in western Semnan. The results in Figure 6 demonstrated that about 95% of the known deposits occurred within 1.5 km of Permian–Cretaceous dolomite and limestone units, highlighting these units’ significant role in trapping the enriched fluids. MVT deposits are indeed associated with carbonate rocks. Changes in vertical and lateral permeability within carbonate platform sequences play a crucial role in mineralization [81]. The mineralization process is influenced by factors controlling deposit fluid formation, which encompasses transitional facies such as shale to carbonate, lime to dolomite, and sandstone to carbonate [11,82].

6. Conclusions

The Fry analysis technique was used to investigate the spatial distribution pattern of MVT Pb-Zn deposits in western Semnan, Iran. Based on the Fry analysis, we concluded that the distribution of mineral deposits in western Semnan is not random but follows an NE–SW trend, parallel to the main unit trend and parallel to the main fracture pattern trend. The results of distance distribution analysis showed that the NE–SW, NW–SE, and E–W striking faults are important structural controls for the MVT Pb-Zn mineralization in western Semnan. The NE–SW striking faults with the highest C_max value are the most important structural controls in the prospect scale. While the NW–SE and E–W trending faults act as critical controls on the regional scale. The Anzab and Bashm faults play a pivotal role in the mineralization of some MVT deposits in the study area. These NE–SW trending compressional faults intersect NW–SE trending tensional faults that influence the deposition of sulfides. In addition, Permian–Cretaceous dolomites and limestone in the study area were introduced as important lithological factors influencing the type of mineralization sought. Based on the C_max values, lithological controls were found to play a more crucial role in the development of MVT mineralization compared to structural factors. Faults/fractures have provided active pathways as well as physical traps for Pb-Zn-bearing fluids responsible for MVT mineralization in the district and Permian–Cretaceous carbonate host rocks are suitable chemical and physical traps for ore-bearing fluid focusing. It appears that ore-bearing fluids were likely directed through fault corridors and subsequently trapped within lithological controls, circulating further through permeable pathways in brittle dolostone formations. These processes facilitated the movement of ore-forming fluids and subsequent supergene and oxidation processes. Therefore, future exploration efforts should concentrate on the Permian–Cretaceous dolostone formations.
The spatial analysis techniques used in this study accurately depicted the spatial pattern of mineralization and the structural-lithological controls on mineralization. Subsequently, a data-driven procedure that combined the structural-lithological controls with the geochemical signatures of the sedimentary basins in the study area provided an excellent predictive map. This map highlighted areas of high potential, covering all 16 known deposits (100%) in only 15% of the study area. This excellent prediction rate of the proposed approach emphasizes the correct identification of (1) the spatial pattern of mineralization, (2) the correlation between occurrences and geological features, (3) the mineral system of the type sought, (4) the conceptual modeling of the mineralization, (5) the decision of labeling procedure, (6) the choice of data-driven MPM method, and (7) the hyperparameter tuning of the predictive model. Accordingly, an intelligent combination of spatial controlling factors with geochemical signatures can map the mineralization potential of the desired type of ore deposits. The random forest algorithm can robustly highlight high-potential zones of MVT Pb-Zn mineralization in analogous metallogenic provinces.

Author Contributions

Conceptualization, S.Q.; methodology, S.Q.; software, S.Q.; validation, S.Q., A.M., A.B.P.; formal analysis, S.Q.; investigation, S.Q.; resources, A.M.; data curation, S.Q., A.M.; writing—original draft preparation, S.Q.; writing—review and editing, S.Q., A.M., A.B.P., M.Y.; visualization, S.Q.; supervision, A.M.; project administration, A.M. All authors have read and agreed to the published version of the manuscript.

Funding

This research received no external funding.

Data Availability Statement

The data used in this study are confidential.

Conflicts of Interest

The authors declare no conflict of interest.

References

  1. Sangster, D.F. Mississippi Valley-type and sedex lead-zinc deposits: A comparative examination. Inst. Min. Metall. Trans. 1990, 99, B21–B42. [Google Scholar]
  2. Goodfellow, W.D.; Lydon, J.W.; Turner, R.J.W. Geology and genesis of stratiform sediment-hosted (SEDEX) zinc-lead-silver sulphide deposits. Geol. Assoc. Can. Spec. Paper. 1993, 40, 201–251. [Google Scholar]
  3. Leach, D.L.; Bradley, D.; Lewchuk, M.T.; Symons, D.T.A.; de Marsily, G.; Brannon, J. Mississippi Valley-type lead-zinc deposits through geological time: Implications from recent age-dating research. Miner. Depos. 2001, 36, 711–740. [Google Scholar] [CrossRef]
  4. Leach, D.L.; Sangster, D.F.; Kelley, K.D.; Large, R.R.; Garven, G.; Allen, C.R.; Gutzmer, J.; Walters, S. Sediment-hosted lead-zinc deposits: A global perspective. Econ. Geol. 2005, 100, 561–608. [Google Scholar] [CrossRef]
  5. Goodfellow, W.D.; Lydon, J.W. Sedimentary-exhalative (SEDEX) deposits. In Mineral Deposits of Canada: A Synthesis of Major Deposit Types, District Metallogeny, the Evolution of Geological Provinces and Exploration Methods ; Goodfellow, W.D., Ed.; Geological Association of Canada, Mineral Deposits Division: New Québec, QC, Canada, Special Publication 5; 2007; pp. 163–183. Available online: https://www.mddgac.org/ (accessed on 1 September 2024).
  6. Leach, D.; Bradley, D.; Huston, D.; Pisarevsky, S.; Taylor, R.; Gardoll, S. Sediment-Hosted Lead-Zinc Deposits in Earth History. Econ. Geol. 2010, 105, 593–625. [Google Scholar] [CrossRef]
  7. Wilkinson, J.J. Sediment-Hosted Zinc-Lead Mineralization: Processes and Perspectives. In Treatise on Geochemistry: Second Edition; Elsevier: Amsterdam, The Netherlands, 2014; Chapter 13; pp. 219–249. [Google Scholar] [CrossRef]
  8. Rajabi, A. Metallogeny and Geology of Zinc-Lead Deposits with Sedimentary Host Rocks in Iran; University of Tehran: Tehran, Iran, 2021. [Google Scholar]
  9. Symons, D.T.; Arne, D. Paleomagnetic constraints on Zn–Pb ore genesis of the Pillara Mine, Lennard Shelf, Western Australia. Miner. Depos. 2005, 39, 944–959. [Google Scholar] [CrossRef]
  10. Paradis, S.; Hannigan, P.; Dewing, K. Mississippi Valley-type lead-zinc deposits. Geol. Assoc. Can. Miner. Depos. Div. Spec. Publ. 2007, 5, 185–203. [Google Scholar]
  11. Leach, D.L.; Taylor, R.D. Mississippi Valley-Type Lead-Zinc Deposit Model. In U.S. Geological Survey Open-File Report 2009-1213; USGS: Reston, VA, USA, 2009. [Google Scholar]
  12. Bradley, D.; Leach, D. Tectonic controls of Mississippi Valley-type lead–zinc mineralization in orogenic forelands. Miner. Deposita 2003, 38, 652–667. [Google Scholar] [CrossRef]
  13. Bazargani-Guilani, K.; Nekouvaght Tak, M.A.; Faramarzi, M. Pb-Zn deposits in Cretaceous carbonate host rocks, northeast Shahmirzad, central Alborz, Iran. Aust. J. Earth Sci. 2011, 58, 197–307. [Google Scholar] [CrossRef]
  14. Rajabi, A.; Rastad, E.; Canet, C. Metallogeny of Cretaceous carbonate-hosted Zn–Pb deposits of Iran: Geotectonic setting and data integration for future mineral exploration. Int. Geol. Rev. 2012, 54, 1649–1672. [Google Scholar] [CrossRef]
  15. Rajabi, A.; Rastad, E.; Canet, C. Metallogeny of Permian–Triassic carbonate-hosted Zn–Pb and F deposits of Iran: A review for future mineral exploration. Aust. J. Earth Sci. 2013, 60, 197–216. [Google Scholar] [CrossRef]
  16. He, Z.; Gao, J.; Li, S.; He, S. Mineralization of MVT Pb-Zn Deposits in the Process of Hydrocarbon Accumulation and Destruction in the Strong Structural Deformation Area of Eastern Sichuan, South China. Minerals 2022, 12, 1281. [Google Scholar] [CrossRef]
  17. Wang, G.; Lei, Q.; Huang, Z.; Liu, G.; Fu, Y.; Li, N.; Liu, J. Genetic Relationship between Mississippi Valley-Type Pb–Zn Mineralization and Hydrocarbon Accumulation in the Wusihe Deposits, Southwestern Margin of the Sichuan Basin, China. Minerals 2022, 12, 1447. [Google Scholar] [CrossRef]
  18. Guan, G.; Li, S.; Li, R. Mineralization Process of MVT Zn-Pb Deposit Promoted by the Adsorbed Hydrocarbon: A Case Study from Mayuan Deposit on the North Margin of Sichuan Basin. Minerals 2023, 13, 72. [Google Scholar] [CrossRef]
  19. Laranjeira, V.; Ribeiro, J.; Moreira, N.; Nogueira, P.; Flores, D. Geochemistry of Precambrian black shales from Ossa-Morena Zone (Portugal): Depositional environment and possible source of metals. J. Iber. Geol. 2023, 49, 1–19. [Google Scholar] [CrossRef]
  20. Parsa, M.; Maghsoudi, A. Controls on Mississippi Valley-Type Zn-Pb mineralization in Behabad district, Central Iran: Constraints from spatial and numerical analyses. J. Afr. Earth Sci. 2018, 140, 189–198. [Google Scholar] [CrossRef]
  21. Gibson, G.M.; Edwards, S. Basin inversion and structural architecture as constraints on fluid flow and Pb–Zn mineralization in the Paleo–Mesoproterozoic sedimentary sequences of northern Australia. Solid Earth 2020, 11, 1205–1226. [Google Scholar] [CrossRef]
  22. Bowness, N.P.; Cawood, A.J.; Ferrill, D.A.; Smart, K.J.; Bellow, H.B. Mineralogy controls fracture containment in mechanically layered carbonates. Geol. Mag. 2022, 159, 1855–1873. [Google Scholar] [CrossRef]
  23. Chi, G.; Xue, C. Similarities and Differences between the Sandstone-Hosted Jinding Zn-Pb Deposit and MVT Deposits. AGU Spring Meet. Abstr. 2009, MA73C-07. [Google Scholar]
  24. Ma, R. Study on geological features and exploration methods of MVT Pb-Zn deposits. IOP Conf. Ser. Earth Environ. Sci. 2018, 108, 032010. [Google Scholar] [CrossRef]
  25. Liu, Y.; Yang, Z.; Yue, L.; Yu, Y.; Ma, W.; Tang, B. Geological Characteristics and Genesis of the Jiamoshan MVT Pb–Zn Deposit, Sanjiang belt, Tibetan Plateau. Acta Geol. Sin. Engl. Ed. 2020, 94. [Google Scholar] [CrossRef]
  26. Garven, G. The role of regional fluid flow in the genesis of the Pine Point deposit, Western Canada Sedimentary Basin. Econ. Geol. 1985, 80, 307–324. [Google Scholar] [CrossRef]
  27. Ge, S.; Garven, G. Hydromechanical modeling of tectonically-driven groundwater flow with application to the Arkoma foreland basin. J. Geophys. Res. 1992, 97, 9119–9144. [Google Scholar] [CrossRef]
  28. Appold, M.S.; Garven, G. The hydrology of ore formation in the Southeast Missouri District: Numerical models of topography-driven fluid flow during the Ouachita Orogeny. Econ. Geol. 1999, 94, 913–936. [Google Scholar] [CrossRef]
  29. Bazargani-Guilani, K.; Faramarzi, M.; Tak, M. Multistage dolomitization in the Cretaceous carbonates of the east Shahmirzad area, north Semnan, central Alborz, Iran. Carbonates Evaporites 2010, 25, 177–191. [Google Scholar] [CrossRef]
  30. Bazargani-Guilani, K.; Rabiei, M.; Mehrabi, B. Effects of host rock mineralogical composition and sedimentary facies on development of geochemical halos in Shahmirzad Pb-Zn deposits, central Alborz, Iran. J. Geochem. Explor. 2013, 124, 155–165. [Google Scholar] [CrossRef]
  31. Fry, N. Random point distributions and strain measurement in rocks. Tectonophysics 1979, 60, 89–105. [Google Scholar] [CrossRef]
  32. Vearncombe, J.; Vearncombe, S. The spatial distribution of mineralization; applications of Fry analysis. Econ. Geol. 1999, 94, 475–486. [Google Scholar] [CrossRef]
  33. Berman, M. Distance distributions associated with Poisson processes of geometric figures. J. Appl. Probab. 1977, 14, 195–199. [Google Scholar] [CrossRef]
  34. Carranza, E.J.M. Controls on mineral deposit occurrence inferred from analysis of their spatial pattern and spatial association with geological features. Ore Geol. Rev. 2009, 35, 383–400. [Google Scholar] [CrossRef]
  35. Assereto, R. The Paleozoic formations in central Elburz (Iran) (preliminary note). Riv. Ital. Paleontol. Stratigr. 1963, 69, 503–543. [Google Scholar]
  36. Stöcklin, J.; Ruttner, A.; Nabavi, M. New Data on the Lower Paleozoic and Pre-Cambrian of North Iran; Geological Survey of Iran: Tehran, Iran, 1964; Volume 1. [Google Scholar]
  37. Geyer, G.; Bayet-Goll, A.; Wilmsen, M.; Mahboubi, A.; Moussavi-Harami, R. Lithostratigraphic revision of the middle Cambrian (Series 3) and upper Cambrian (Furongian) in northern and central Iran. Newsl. Stratigr. 2014, 47, 21–59. [Google Scholar] [CrossRef]
  38. Berberian, M. The southern Caspian: A compressional depression floored by a trapped modified oceanic crust. Can. J. Earth Sci. 1983, 20, 163–183. [Google Scholar] [CrossRef]
  39. Alavi, M. Sedimentary and structural characteristics of the Paleo-Tethys remnants in northeastern Iran. Geol. Soc. Am. Bull. 1991, 103, 983–992. [Google Scholar] [CrossRef]
  40. Alavi, M. Tectono-stratigraphic synthesis and structural style of the Alborz Mountain system in northern Iran. J. Geodyn. 1996, 21, 1–33. [Google Scholar] [CrossRef]
  41. Axen, G.J.; Lam, P.S.; Grove, M.; Stockli, D.F.; Hassanzadeh, J. Exhumation of the west-central Alborz Mountains, Iran, Caspian subsidence, and collision-related tectonics. Geology 2001, 29, 559–562. [Google Scholar] [CrossRef]
  42. Guest, B.; Stockli, D.F.; Grove, M.; Axen, G.J.; Lam, P.S.; Hassanzadeh, J. Thermal histories from the central Alborz Mountains, northern Iran: Implications for the spatial and temporal distribution of deformation in north Iran. Geol. Soc. Am. Bull. 2006, 118, 1507–1521. [Google Scholar] [CrossRef]
  43. David, L.; Taylor, R.D.; Fey, D.L.; Diehl, S.F.; Saltus, R.W. A Deposit Model for Mississippi Valley-Type Lead-Zinc Ores. Mineral Deposit Models for Resource Assessment; Scientific Investigations Report 2010–5070–K; USGS: Reston, VA, USA, 2010.
  44. Bigdeli, A.; Maghsoudi, A.; Ghezelbash, R. Recognizing geochemical anomalies associated with mineral resources using singularity analysis and random forest models in the Torud-Chahshirin Belt, Northeast Iran. Minerals 2023, 13, 1399. [Google Scholar] [CrossRef]
  45. Tabatabaei, S.H.; Rodsari, P.R.; Mokhtari, A.R. Predicting Potential Mineralization Using Surface Geochemical Data and Multiple Linear Regression Model in the Kuh Panj Porphyry Cu Mineralization (Iran). Arab. J. Sci. Eng. 2015, 40, 163–170. [Google Scholar] [CrossRef]
  46. Chen, Y.; Wu, W. Application of one-class support vector machine to quickly identify multivariate anomalies from geochemical exploration data. Geochem. Explor. Environ. Anal. 2017, 17, 231–238. [Google Scholar] [CrossRef]
  47. Grunsky, E.; Caritat, P.D. State-of-the-Art Analysis of Geochemical Data for Mineral Exploration. Geochem. Explor. Environ. Anal. 2019, 20, geochem2019-031. [Google Scholar] [CrossRef]
  48. Li, C.; Liu, B.; Guo, K.; Li, B.; Kong, Y. Regional Geochemical Anomaly Identification Based on Multiple-Point Geostatistical Simulation and Local Singularity Analysis—A Case Study in Mila Mountain Region, Southern Tibet. Minerals 2021, 11, 1037. [Google Scholar] [CrossRef]
  49. Ghasemi, R.; Tokhmechi, B.; Borg, G. Evaluation of effective factors in window optimization of fry analysis to identify mineralization pattern: Case study of Bavanat region, Iran. J. Min. Environ. 2017, 9, 195–208. [Google Scholar] [CrossRef]
  50. Nguemhe Fils, S.C.; Mimba, M.; Nyeck, B.; Nforba, M.; Boniface, K.; Nouck, P.; Hell, J. GIS-Based Spatial Analysis of Regional-Scale Structural Controls on Gold Mineralization Along the Bétaré-Oya Shear Zone, Eastern Cameroon. Nat. Resour. Res. 2020, 29, 3457–3477. [Google Scholar] [CrossRef]
  51. Ghasemzadeh, S.; Maghsoudi, A.; Yousefi, M.; Mihalasky, M.J. Recognition and incorporation of mineralization-efficient fault systems to produce a strengthened anisotropic geochemical singularity. J. Geochem. Explor. 2022, 235, 106967. [Google Scholar] [CrossRef]
  52. Breiman, L. Random Forests. Mach. Learn. 2001, 45, 5–32. [Google Scholar] [CrossRef]
  53. Carranza, E.J.M.; Laborte, A. Data-driven predictive mapping of gold prospectivity, Baguio district, Philippines: Application of Random Forests algorithm. Ore Geol. Rev. 2014, 71, 777–787. [Google Scholar] [CrossRef]
  54. Xiang, J.; Xiao, K.; Carranza, E.J.M.; Jianping, C.; Li, S. 3D Mineral Prospectivity Mapping with Random Forests: A Case Study of Tongling, Anhui, China. Nat. Resour. Res. 2019, 29, 395–414. [Google Scholar] [CrossRef]
  55. Kuhn, S.D. Machine learning for mineral exploration: Prediction and quantified uncertainty at multiple exploration stages. Ph.D. Thesis, University of Tasmania, Hobart, Australia, 2021. [Google Scholar] [CrossRef]
  56. Zuo, R.; Carranza, E.J.M. Machine Learning-Based Mapping for Mineral Exploration. Math. Geosci. 2023, 55, 891–895. [Google Scholar] [CrossRef]
  57. Breiman, L. Classification and Regression Trees; CRC Press: Boca Raton, FL, USA, 1984. [Google Scholar]
  58. Carranza, E.J.M.; Hale, M. Where are porphyry copper deposits spatially localized? A case study in Benguet province, Philippines. Nat. Resour. Res. 2002, 11, 45–59. [Google Scholar] [CrossRef]
  59. Bishop, C.M. Pattern Recognition and Machine Learning; Springer Science Business Media: New York, NY, USA, 2006. [Google Scholar]
  60. Theodoridis, S.; Koutroumbas, K. Clustering: Basic concepts. Pattern Recogn. 2006, 483–516. [Google Scholar]
  61. Carranza, E.J.M. Geochemical Anomaly and Mineral Prospectivity Mapping in GIS. In Handbook of Exploration and Environmental Geochemistry; Elsevier: Amsterdam, The Netherlands, 2008; Volume 11. [Google Scholar]
  62. Yousefi, M.; Kamkar-Rouhani, A.; Carranza, E.J.M. Application of staged factor analysis and logistic function to create a fuzzy stream sediment geochemical evidence layer for mineral prospectivity mapping. Geochem. Explor. Environ. Anal. 2014, 14, 45–58. [Google Scholar] [CrossRef]
  63. Yousefi, M.; Carranza, E.J.M. Prediction-area (P-A) plot and C-A fractal analysis to classify and evaluate evidential maps for mineral prospectivity modeling. Comput. Geosci. 2015, 79, 69–81. [Google Scholar] [CrossRef]
  64. Mutele, L.; Billay, A.; Hunt, J.P. Knowledge-driven prospectivity mapping for granite-related polymetallic Sn–F–(REE) mineralization. Bushveld Igneous Complex, South Africa. Nat. Resour. Res. 2017. [Google Scholar] [CrossRef]
  65. Nykänen, V.; Niiranen, T.; Molnár, F.; Lahti, I.; Korhonen, K.; Cook, N.; Skyttä, P. Optimizing a Knowledge-driven Prospectivity Model for Gold Deposits Within Peräpohja Belt, Northern Finland. Nat. Resour. Res. 2017, 26, 571–584. [Google Scholar] [CrossRef]
  66. Bigdeli, A.; Maghsoudi, A.; Ghezelbash, R. Application of self-organizing map (SOM) and K-means clustering algorithms for portraying geochemical anomaly patterns in Moalleman district, NE Iran. J. Geochem. Explor. 2022, 233, 106923. [Google Scholar] [CrossRef]
  67. Ghasemzadeh, S.; Maghsoudi, A.; Yousefi, M.; Mihalasky, M.J. Information value-based geochemical anomaly modeling: A statistical index to generate enhanced geochemical signatures for mineral exploration targeting. Appl. Geochem. 2022, 136, 105177. [Google Scholar] [CrossRef]
  68. Meyer, C. Ore-forming processes in geologic history. Econ. Geol. 1981, 75, 6–41. [Google Scholar] [CrossRef]
  69. Meyer, C. Ore deposits as guides to geologic history of the earth. Annu. Rev. Earth Planet. Sci. 1988, 16, 147–171. [Google Scholar] [CrossRef]
  70. Sawkins, F.J. Metal Deposits in Relation to Plate Tectonics; Springer: Berlin, Germany, 1984; Volume 17. [Google Scholar]
  71. Veizer, J.; Laznicka, P.; Jansen, S.L. Mineralization through geologic time: Recycling perspective. Am. J. Sci. 1989, 289, 484–524. [Google Scholar] [CrossRef]
  72. Barley, M.E.; Groves, D.I. Supercontinent cycles and the distribution of metal deposits through time. Geology 1992, 20, 291–294. [Google Scholar] [CrossRef]
  73. Hutchinson, R.W. Mineral deposits and metallogeny: Indicators of Earth’s evolution. In Early Organic Evolution: Implications for Mineral and Energy Resources; Schidlowski, M., Ed.; Springer: Berlin, Heidelberg, Germany, 1992; pp. 521–544. [Google Scholar]
  74. Titley, S.R. Relationship of strata bound ores with tectonic cycles of the Phanerozoic and Proterozoic. Precambrian Res. 1993, 61, 295–322. [Google Scholar] [CrossRef]
  75. Goldfarb, R.J.; Groves, D.I.; Gardoll, S. Rotund versus skinny orogens: Well-nourished or malnourished gold? Geology 2001, 29, 539–542. [Google Scholar] [CrossRef]
  76. Groves, D.I.; Vielreicher, R.M.; Goldfarb, R.J.; Condie, K.C. Controls on the heterogeneous distribution of mineral deposits through time. Geol. Soc. Lond. Spec. Publ. 2005, 248, 71–101. [Google Scholar] [CrossRef]
  77. Holland, H.D. Sedimentary mineral deposits and the evolution of Earth’s near-surface environments. Econ. Geol. 2005, 100, 1489–1509. [Google Scholar] [CrossRef]
  78. Bigdeli, A.; Maghsoudi, A.; Ghezelbash, R. A comparative study of the XGBoost ensemble learning and multilayer perceptron in mineral prospectivity modeling: A case study of the Torud-Chahshirin belt, NE Iran. Earth Sci. Inform. 2024, 17, 483–499. [Google Scholar] [CrossRef]
  79. Yousefi, M.; Kreuzer, O. Towards an effective exploration information system–new concepts and ideas aimed at improving mineral exploration targeting. Appl. Geochem. 2024, 106053. [Google Scholar] [CrossRef]
  80. Yousefi, M.; Lindsay, M.D.; Kreuzer, O.P. Mitigating uncertainties in mineral exploration targeting: Majority voting and confidence index approaches in the context of an Exploration Information System (EIS). Ore Geol. Rev. 2024, 165, 105930. [Google Scholar] [CrossRef]
  81. Al-Khdheeawi, E.A.; Allawi, R.H.; Al-Rubaye, W.I.; Iglauer, S. A New Approach to Predicting Vertical Permeability for Carbonate Rocks in the Southern Mesopotamian Basin. Minerals 2023, 13, 1519. [Google Scholar] [CrossRef]
  82. Paradis, S.; Hannigan, P.; Dewing, K. Mineral Deposits of Canada: Mississippi Valley-type Lead-Zinc Deposits (MVT); Geological Survey of Canada: Ottawa, ON, Canada, 2008. [Google Scholar]
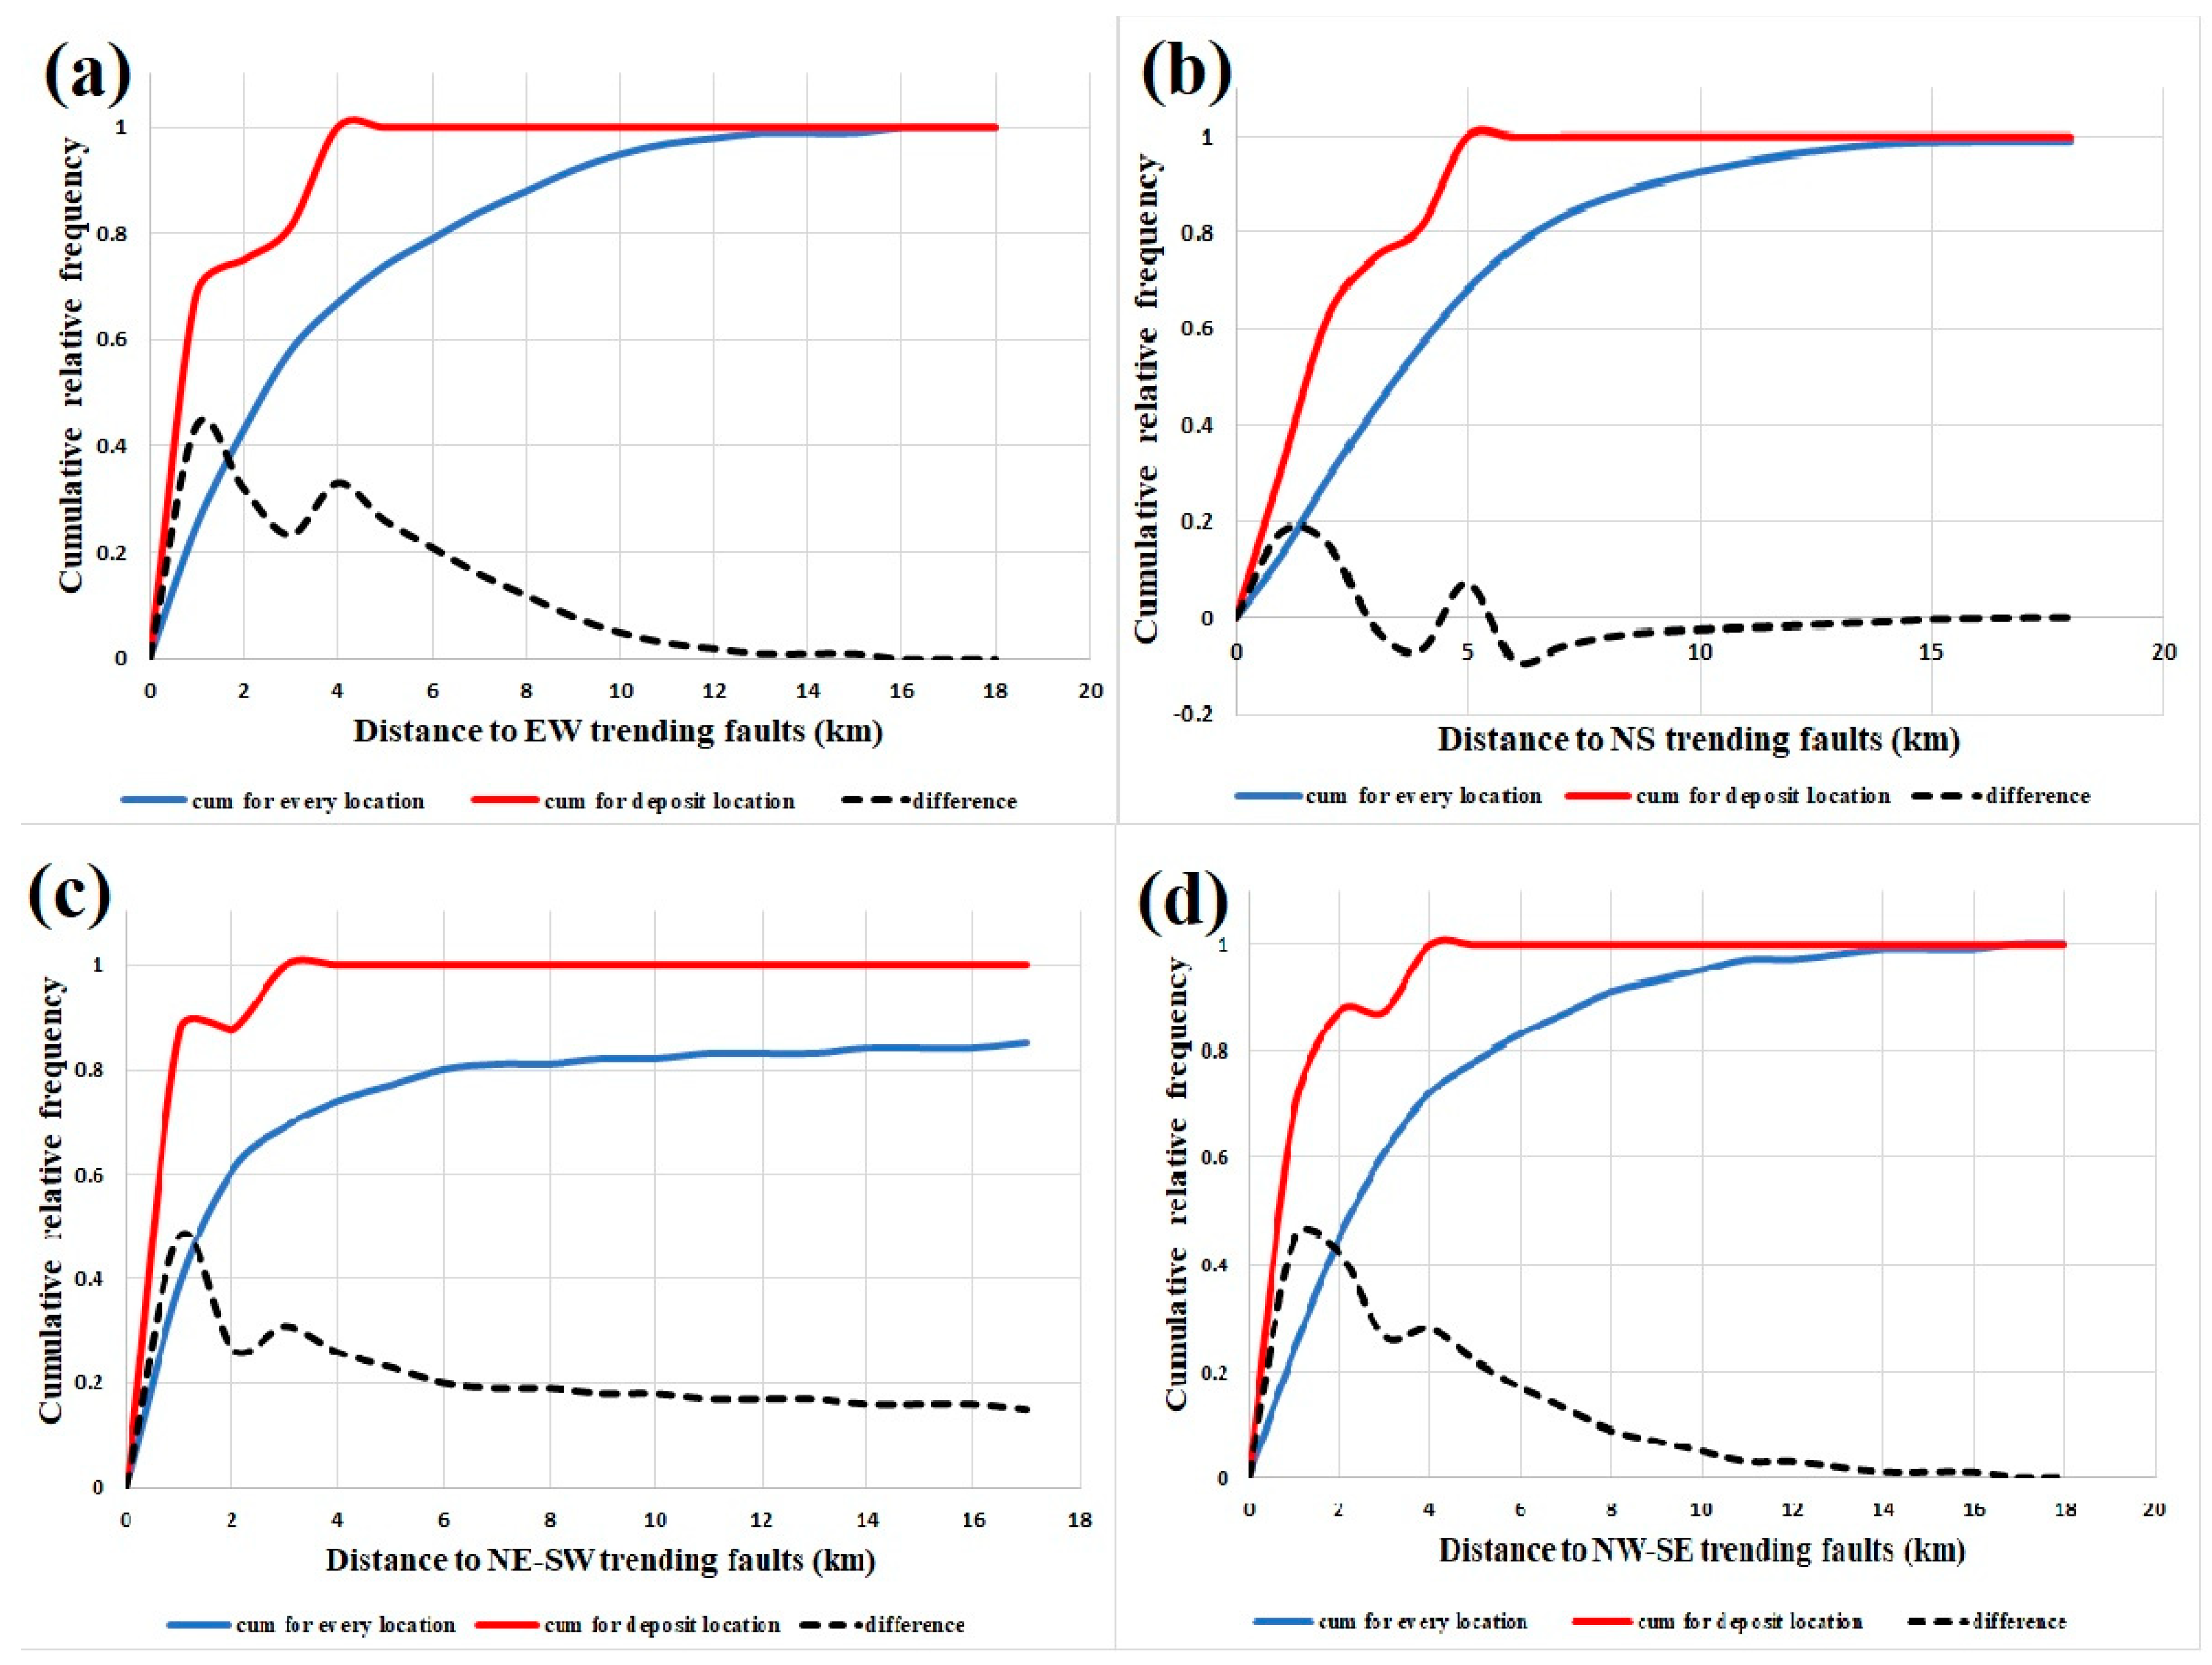
Figure 1. (a) Structural map of Iran and the location of the study area. (b) Simplified geological map of the study area. The numbers are the same as those in Table 1.
Minerals 14 00957 g001
Figure 2. (a) Fry plot showing known mineralization trend in the study area. (b) Orientation diagram to investigate the orientation distribution of the connecting lines between known deposits in the Fry plot.
Minerals 14 00957 g002
Figure 3. (a) Fry points of MVT Pb-Zn deposits and various orientations of faults in western Semnan. (b) Rose diagram of faults in the study area.
Minerals 14 00957 g003
Figure 4. Distance maps of (a) N-S, (b) NE-SW, (c) E-W and (d) NW-SE main trending faults in the study area.
Minerals 14 00957 g004
Figure 5. Plots showing distances from every location and from deposit locations to (a) EW, (b) NS, (c) NE–SW, and (d) NW–SE striking faults.
Minerals 14 00957 g005
Figure 6. (a) Distance map of Permian–Cretaceous carbonate rocks. (b) Graphs illustrating the distances between each location and the deposit sites to Cretaceous dolomites and limestone.
Minerals 14 00957 g006
Figure 7. Geological controlling factors evidence layers: fuzzified maps of proximity to (a) NE–SW trending faults and (b) cretaceous dolomite and limestone geological units.
Minerals 14 00957 g007
Figure 8. Fuzzified geochemical maps of (a) Ba, (b) Pb, and (c) Zn.
Minerals 14 00957 g008
Figure 9. 0,1 Labeling approach in this study for data-driven MPM.
Minerals 14 00957 g009
Figure 10. Obtained prediction map by RF.
Minerals 14 00957 g010
Table 2. Maximum contrast values for different geological features in western Semnan.
Geological FeaturesMaximum Contrast Value, Cmax
NS striking faults0.18
EW striking faults0.43
NW–SE striking faults0.44
NE–SW striking faults0.49
Permian–Cretaceous dolomites and limestone units0.72
Table 3. Fuzzification functions are applied to generate the continuously-weighted predictor layers.
PredictorMembership Function
Proximity to NE–SW trending faults Small
proximity to Permian–Cretaceous dolomite and limestone geological unitSmall
Pb distribution layerMS Large
Zn distribution layerMS Large
Ba distribution layerMS Large
Table 4. Hyperparameters for regressor RF.
HyperparameterValue
Number of Estimators200
Random State0
Table 5. Performance metrics for regressor RF implementation.
Performance MetricValue
Mean Absolute Error 0.06
Root Mean Squared Error0.14
R-squared (R2) Score0.82
Disclaimer/Publisher’s Note: The statements, opinions and data contained in all publications are solely those of the individual author(s) and contributor(s) and not of MDPI and/or the editor(s). MDPI and/or the editor(s) disclaim responsibility for any injury to people or property resulting from any ideas, methods, instructions or products referred to in the content.

