Article

In-Depth Analysis of Complex Multiphase Oxidative Transformations in Iron Sulfides (Pyrrhotite and Pyrite) Within Migmatitic Gneiss

1
Institute of Materials Engineering, University of Silesia, 75 Pułku Piechoty 1A, 41-500 Chorzow, Poland
2
Institute of Earth Sciences, University of Silesia, Będzińska 60, 41-200 Sosnowiec, Poland
*
Author to whom correspondence should be addressed.
Minerals 2025, 15(1), 49; https://doi.org/10.3390/min15010049
Submission received: 3 December 2024 / Revised: 30 December 2024 / Accepted: 31 December 2024 / Published: 3 January 2025

Abstract

:
Raman imaging and K-means cluster analysis of individual mineral grains supplemented by scanning electron microscopy, electron probe microanalysis, and X-ray powder diffraction were applied to study fine-grained, multi-component products of the pyrrhotite three-stage oxidative alteration in migmatitic gneiss. During the first stage, related to the kaolinization of feldspars in gneisses, pyrrhotite was replaced by marcasite via intermediate amorphous iron sulfide. Increased oxygen fugacity caused the localized crystallization of either maghemite or ferric (oxyhydr)oxides. Even higher oxygen fugacity and an increase in solution pH during the second stage of alteration resulted in the partial replacement of marcasite by pyrite, followed by the replacement of both sulfides by Fe oxides (hematite, maghemite, magnetite) and ferric (oxyhydr)oxides (goethite, feroxyhyte). The final stage of sulfide oxidative alteration resulted in the predominance of sulfates of the alunite–jarosite series over ferric oxyhydroxides and relicts of Fe sulfides. Quartz–calcite–pyrite hydrothermal veins were affected by the most recent weathering, which resulted in the crystallization of the dominant alunite–jarosite-series minerals (alunite, jarosite, Al-jarosite) and ferric (oxyhydr)oxides (goethite, lepidocrocite).

1. Introduction

The weathering of iron sulfides is a typical process with significant adverse environmental consequences, mainly through acid rock drainage (ARD) and acid mine drainage (AMD) [1]. The oxidative alteration of pyrite (FeS2) and pyrrhotite (Fe1−xS) is the primary driver of AMD [2,3]. Pyrrhotite oxidizes more rapidly than pyrite due to its defect structure, making it more susceptible to degradation [4,5,6,7]. This increased susceptibility has practical implications. For example, the European standard EN-12620:2008 [8,9] limits the sulfur content in aggregates containing pyrrhotite to a maximum of 0.1%, which is 10 times lower than the typical threshold for aggregates containing other iron sulfides [10].
The weathering of iron sulfides has been examined in numerous studies based on field observations, instrumental analyses, and experiments [11,12,13,14]. While the understanding of iron sulfide oxidative alteration is satisfactory, some challenges remain, including the identification of minerals in fine-grained aggregates of multi-component assemblages. Both abiotic oxidation and bio-oxidation of pyrrhotite and pyrite may generate a multitude of intermediate end products that are sometimes difficult to identify [3]. Raman spectroscopy is well suited for this kind of research due to its high lateral resolution of ~1 μm and sensitivity to short-range order [15]. The latter is essential since some of the sulfide oxidation products are poorly crystalline or X-ray amorphous.
In this paper, we report on the application of Raman imaging and K-means cluster analysis to study fine-grained and multi-component products of multistage oxidative alteration and dissolution of iron sulfides (pyrrhotite, marcasite, pyrite) in migmatitic gneiss and hydrothermal veins exposed in the foreland of the Góry Sowie (Owl Mts), SW Poland.

2. Geological Setting and Sampling

Samples for this study were collected in the Piława Górna (PG) amphibolite–migmatite quarry (50°42′13.680″ N, 16°44′06.360″ E) located in the eastern part of the tectonostratigraphic unit called the Góry Sowie Block (GSB) (Figure 1). The GSB is a slab of the Neoproterozoic continental crust in the NE margin of the Bohemian Massif, subducted to the mantle depths between the Late Silurian and Early Devonian, and then uplifted to shallow crustal depths during the Middle to Late Devonian [16]. The GSB is built up of high-grade paragneisses and migmatites with subordinate orthogneisses, amphibolites, small bodies of granulites [17], eclogites [18], metabasites, peridotites, and calc-silicate rocks. Locally, pegmatite veins and lenses are abundant. The post-Variscan baryte–quartz–calcite–fluorite–sulfide hydrothermal veins cross-cut the metamorphic rocks [19,20,21,22]. Gneisses were metamorphosed and migmatized between 380 and 365 Ma [23,24]. The migmatization occurred in the pressure range of 5 to 8 kbar at 660–680 °C [25].
Migmatitic gneisses dominate over amphibolites in the PG quarry [17]. Both amphibolites and migmatitic gneisses contain several-meter-sized bodies of retrogressed eclogites [26]. Amphibolites were intruded by a swarm of anatectic pegmatites of the rare-metal class. Their emplacement ages of 380.7 and 377.6 Ma coincide with the migmatization of gneisses [23,24]. Gneisses and amphibolites are fractured, with major fractures trending SW–NE and NW–SE. Those fractures are superimposed on regional NW–SE-oriented faults [27].
Migmatitic gneisses are composed of quartz, plagioclases (An15–30), alkali feldspars, biotite, subordinate muscovite, garnet, and accessory pyrrhotite, ilmenite, chalcopyrite, sphalerite, titanite, zircon, and sillimanite. Graphite crystals are uniformly dispersed within the gneiss matrix and are intricately intergrown with biotite in the biotite layers [20,23].
Pyrrhotite is a dominant opaque mineral in migmatitic gneisses (<4.2 vol.%), as revealed by reflected light modal analysis during this study. Ilmenite (<3.9 vol.%) dominates over pyrrhotite (3.3 vol.%) in amphibolites and eclogites (1.3 vol.%). Pyrrhotite in migmatitic gneisses is chiefly confined to the biotite–graphite layers. The subordinate opaque minerals in migmatitic gneisses include magnetite, chalcopyrite (principally as inclusions in pyrrhotite), sphalerite, and galena. Pyrrhotite, together with numerous other sulfides and native bismuth, occurs in pegmatites [20].
The hydrothermal quartz–calcite–pyrite veins, <4–5 cm thick, cross-cut migmatitic gneisses and amphibolites. The amount of pyrite is <20 vol.%. The suite of subordinate minerals includes actinolite, epidote, chlorite, prehnite, albite, adularia, laumontite, stibnite, titanite, and anatase. This fracture-filling assemblage was affected by propylitic and argillic alterations of migmatitic gneisses along a network of tension-shear cracks in the fault zone.
Samples were collected in the PG quarry from (a) freshly exposed migmatitic gneisses, (b) heavily fractured migmatitic gneisses, and (c) hydrothermal veins. Those samples represent two types of the fluid/rock system: a closed one (undisturbed and unaltered gneisses), in which interstitial solutions may have been episodically saturated with respect to minerals, and an open system infiltrated by solutions relatively freely circulating within fractures.

3. Methods

Optical microscopic observations and measurements were conducted using an Olympus BX51 polarized light microscope equipped with an Olympus SC30 camera and a halogen light source. Data were collected with a UMPlanFI 50× objective lens (numerical aperture ~0.30) and processed using Olympus Soft Imaging Solutions GmbH 5.1 software (CelîA analysis).
X-ray powder diffraction (XRD) patterns of primary pyrrhotite were obtained using a fully automated PANalytical X’PERT PRO-PW 3040/60 diffractometer equipped with CoKα source radiation operated at 45 kV and 30 mA. The samples were placed on the surface of a silicon plate (zero background holder).
Morphological features, spatial relationships between minerals, and their elemental composition were determined using a scanning electron microscope (SEM) Phenom XL coupled with an energy-dispersive X-ray spectrometer (EDX). The SEM conditions included an electron-accelerating voltage of 15 kV, a working distance of approximately 10 mm, and a counting time of 40 s. The same conditions were applied for backscattered electron (BSE) imaging.
Chemical composition was analyzed using a CAMECA SX-100 electron microprobe analyzer (EMPA) in wavelength-dispersive X-ray (WDS) mode, with an accelerating voltage of 15 kV and a sample current of 10 nA. The beam diameter was approximately 3 μm. The following standards were used for calibration: diopside for Mg, Si, and Ca; albite for Na; orthoclase for Al and K; Fe2O3 for Fe; rhodonite for Mn; rutile for Ti; Cr2O3 for Cr; V2O5 for V; NiO for Ni; sphalerite for Zn; cuprite for Cu; apatite for P; and barite for Ba.
Raman spectra were recorded using a WITec CRM alpha 300R confocal Raman microscope equipped with an air-cooled solid-state laser (λ = 532 nm) and a CCD detector. The excitation laser was coupled into the microscope via a polarization-maintaining single-mode optical fiber (50 μm diameter) with an air Olympus MPLAN (50×/0.76 NA) objective lens. Raman scattered light was collected using a multi-mode fiber (50 μm diameter) and a monochromator with a 600 line/mm grating.
Single Raman spectra were collected in the range of 120–4000 cm−1 with a resolution of 3 cm−1. The measurement parameters (integration time, accumulation, power) were thoroughly optimized to achieve the best signal-to-noise ratio while preserving the structural integrity of the phases under investigation. The laser power on the sample was carefully chosen based on EMPA analysis of multiple crystals prior to measurements to ensure minimal thermal effects. Among various tested parameters, a laser power of 2 mW was selected as the least invasive power for the study samples, as it does not induce local overheating. Based on our observations of prepared petrological thin sections, 2 mW does not also alter the crystal structure of individual minerals, and no shifts in Raman bands, changes in full width at half maximum (FWHM), or sample degradation were observed. Our results in this experiment are consistent with the previous literature studies on similar iron sulfide and oxide phases in which the 2 mW laser power does not induce phase transformations [28].
Furthermore, in our studies, single spectra were gathered at an integration time of 10 s and 10 accumulations, which, at the proposed laser power, resulted in a nice signal-to-noise ratio with clearly visible bands, preventing thermal degradation of the studied crystals [28]. Furthermore, in line with recommendations from earlier works regarding the impact of external conditions [29], all measurements were performed under controlled environmental conditions throughout the experiments, including stable oxygen levels, a temperature of 20 °C, a humidity of 60%, and low light availability. Raman spectra were recorded from specific spots identified through EMPA analysis, and instrument calibration was verified using the Si spectral line at 520.7 cm−1.
Similar laboratory conditions were maintained for Raman imaging. Raman maps were generated for different mineral assemblages, including Fe sulfide–oxide (ISO), Fe sulfide–oxide–sulfate (ISOS), and vein assemblages, with the same laser power of 2 mW as applied for single spectra measurements. ISO imaging covered a 130 μm × 50 μm area with 260 × 100 pixels; ISOS imaging spanned an 80 μm × 80 μm area with 240 × 240 pixels, and vein imaging was performed on a 140 μm × 140 μm area with 280 × 280 pixels. The precision of sample movement during measurements was ± 0.2 μm, and the lateral resolution (LR) was estimated at 427 nm, according to the Rayleigh criterion: LR = 0.61λ/NA. The optimal signal-to-noise ratio, while ensuring reasonable measurement times, was achieved through the illumination of each pixel for approximately 0.5 s. Notably, increasing the spatial resolution to capture a higher number of spectra during measurements while maintaining the same laser power lowered the signal-to-noise ratio. While still acceptable, this decrease in signal quality could lead to under- or overestimation in the final spectra during band fitting analysis, which should be taken into consideration.
The processing of single spectra and imaging output data involved baseline correction using a third-degree polynomial auto-correction function alongside the automatic removal of cosmic rays by comparing each pixel to adjacent pixels. Chemical images were generated by applying K-means clustering, which belongs to a machine learning algorithm that helps to organize the unlabeled dataset into meaningful clusters. Clustering was performed using the Manhattan distance metric, with the number of K clusters determined iteratively based on their distance from the cluster centers. Given the highly phase-complicated nature of the system, the number of clusters was not predefined. Still, it was adjusted iteratively by scientists experienced with the studied samples to effectively group and analyze individual Fe oxides, sulfates, and sulfides.
Chemical analysis of spectra obtained after the K-means clustering was performed using WITec Project Five Plus Software (v5.1.1). At the same time, band fitting analysis was conducted using a Lorentz–Gauss function for single spectra extracted from imaging areas and individual measurements. This step was executed with the GRAMS (v9.2) software package, ensuring precise spectral deconvolution and quantitative evaluation.

4. Results

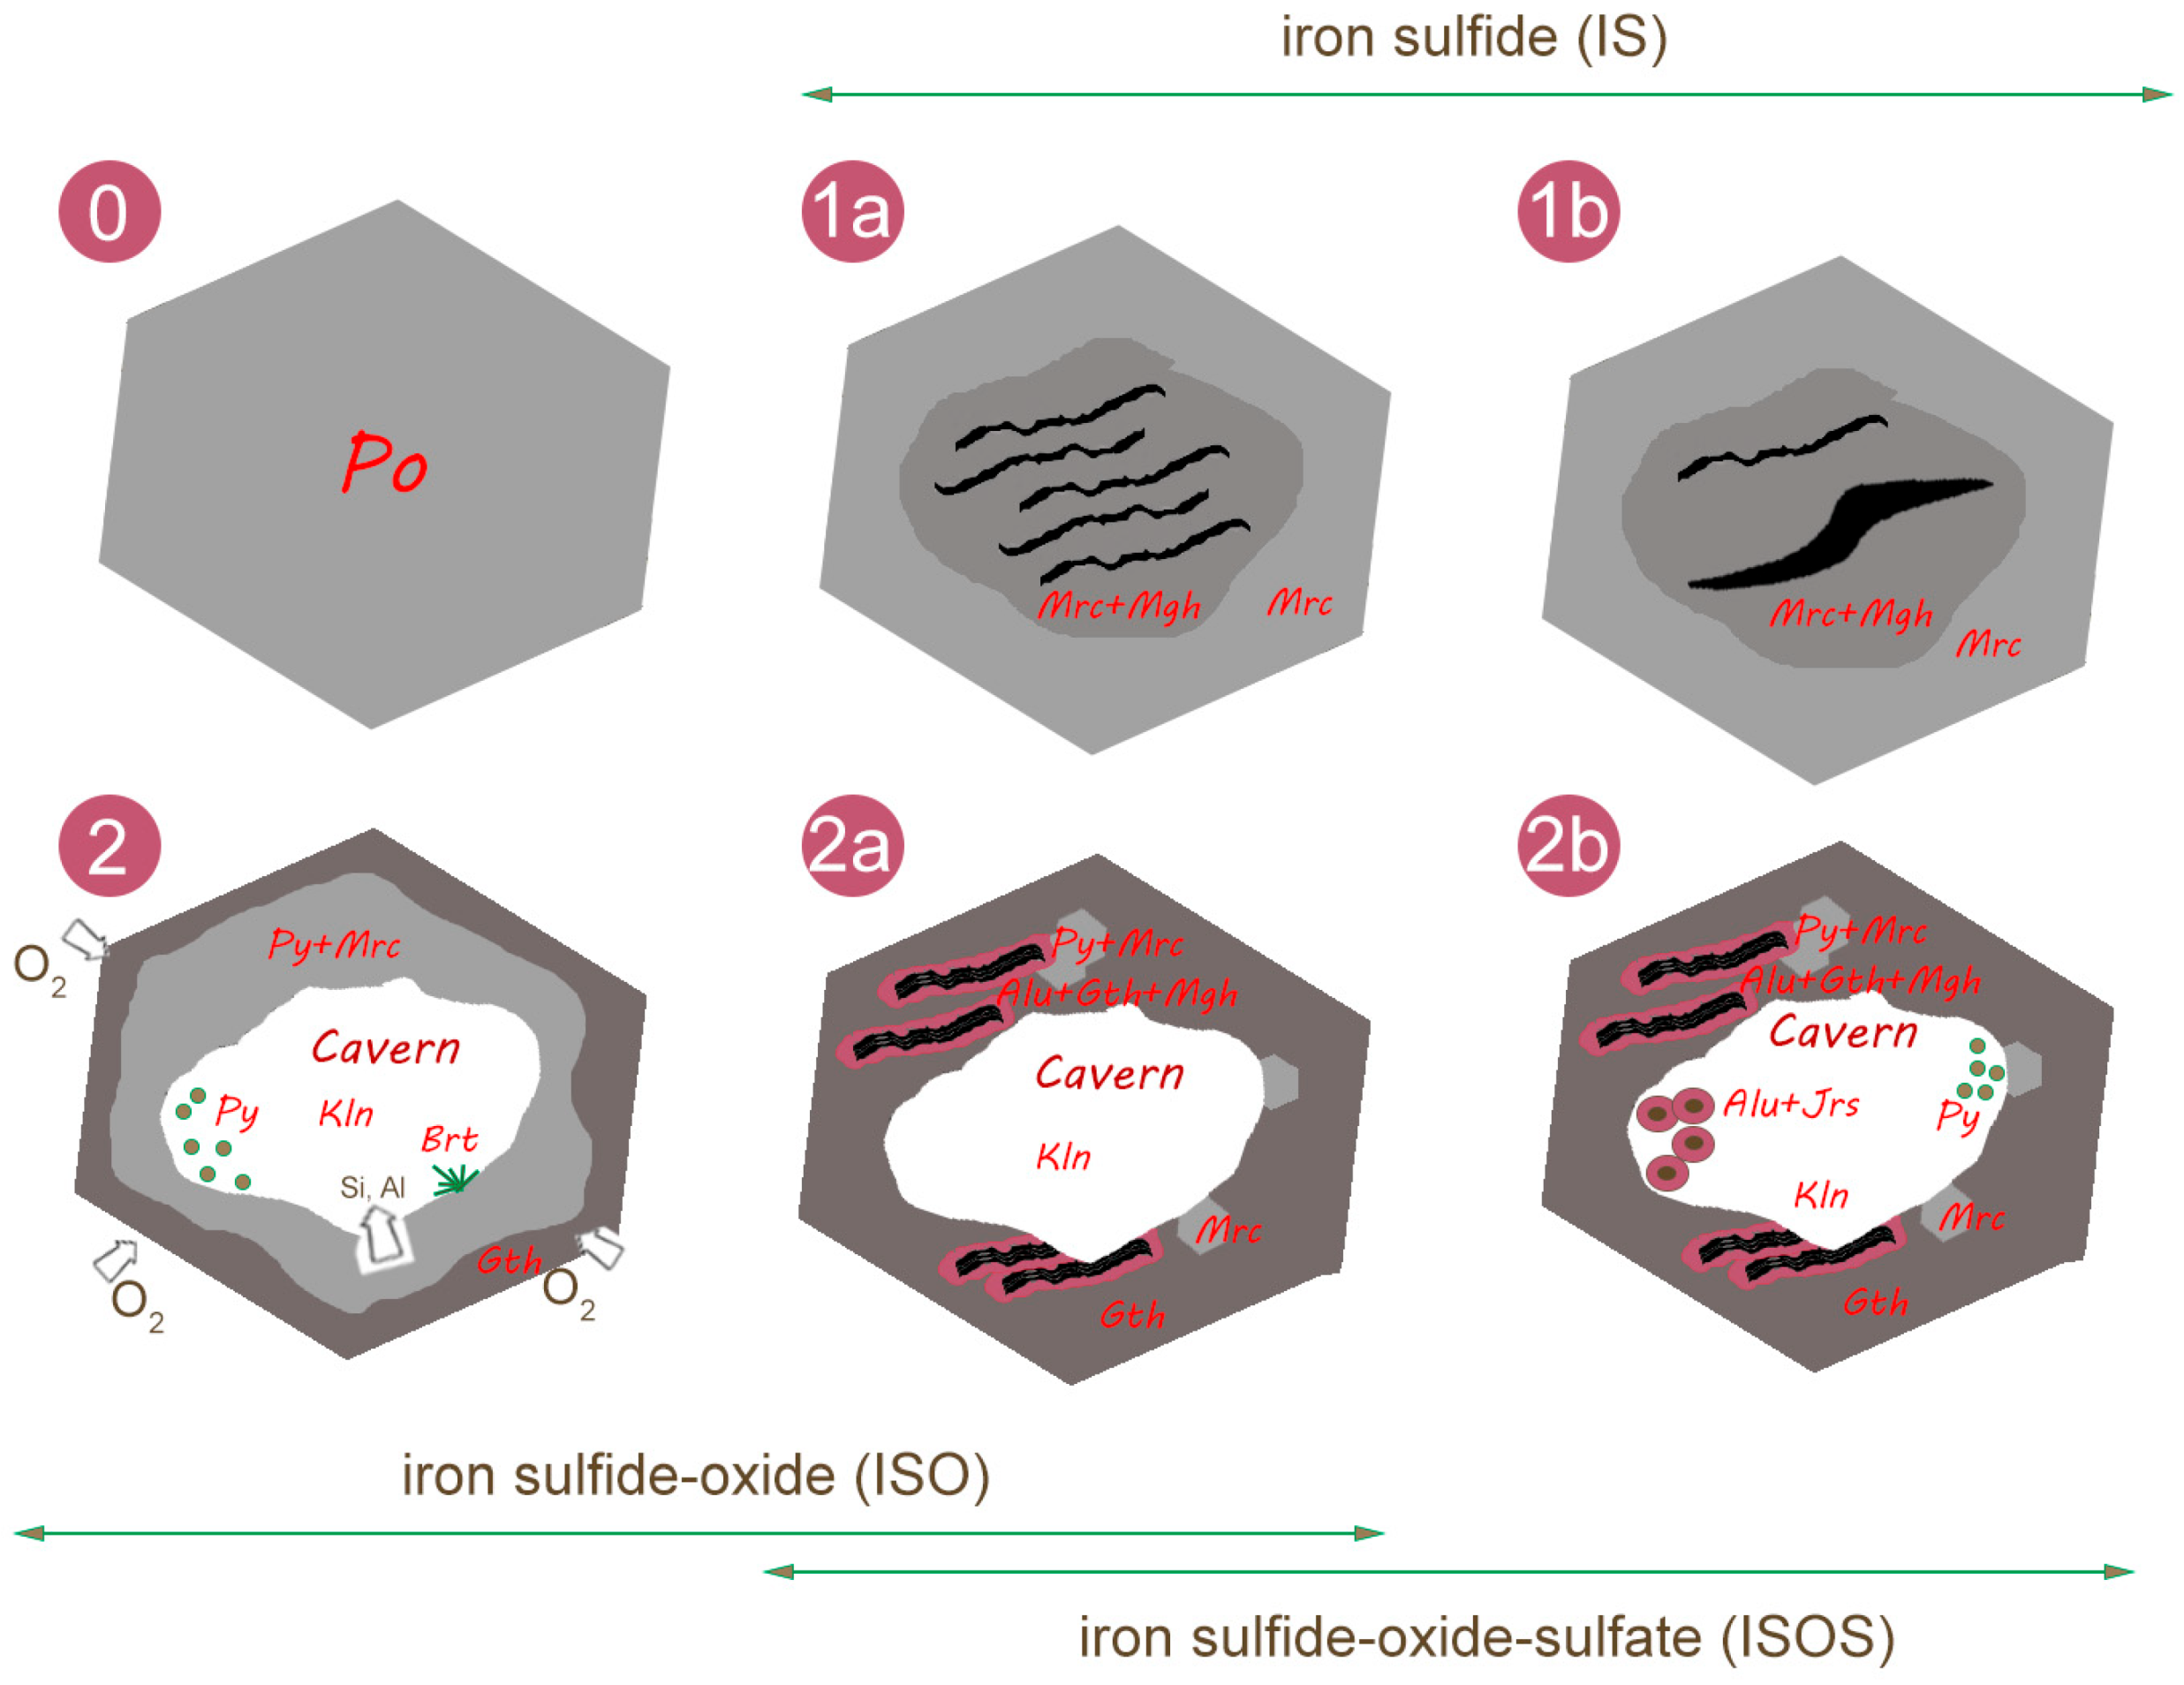
4.1. Unaltered Pyrrhotite

Pyrrhotite occurs as both idiomorphic and angular grains ranging from 0.08 to 0.49 mm in diameter, with most grains within the 0.15–0.35 mm range (Figure 1). Pyrrhotite is creamy white with a pale pinkish hue in reflected light under the optical microscope. The values of reflectance are Rω = 34.0% and Rε = 39.2% for λ546nm. Raman spectrum of pyrrhotite (Figure 2) is typical for structurally disordered pyrrhotite [30]. Pyrrhotite grains are composed of two intergrown structural types distinguished by X-ray powder diffraction, namely, the Fe-deficient (Fe7S8) ferrimagnetic monoclinic 4C-type and the Fe-rich (Fe9S10) antiferromagnetic hexagonal 5C-type. Both polytypes occur in similar amounts, i.e., 4C 51.8% and 5C 48.2%, as revealed by the Rietveld refinement of the pyrrhotite XRD patterns [31,32].
The intergrowths of the 5C and 4C pyrrhotite polymorphs suggest that the latter formed at 230 °C by analogy to the 4C pyrrhotite in gneisses of the western margin of the Bohemian Massif in eastern Bavaria, which occurs to a depth of 8080 m, i.e., at temperature 230 °C [33,34].
Figure 1. Raman spectrum (a) collected from a spot marked with an asterisk in the BSE image of unaltered pyrrhotite (Po) shown in the inset; (b) Bt—biotite, Chl—chlorite, Gr—graphite; (c) XRD pattern of pyrrhotite extracted from the migmatitic gneiss.
Minerals 15 00049 g001

4.2. Altered Pyrrhotite

Three types of altered pyrrhotite grains associated with mineral assemblages indicative of three stages of progressive low-temperature oxidative alteration were examined, namely iron sulfide (IS), iron sulfide–oxide (ISO), and iron–sulfide–oxide–sulfate (ISOS).

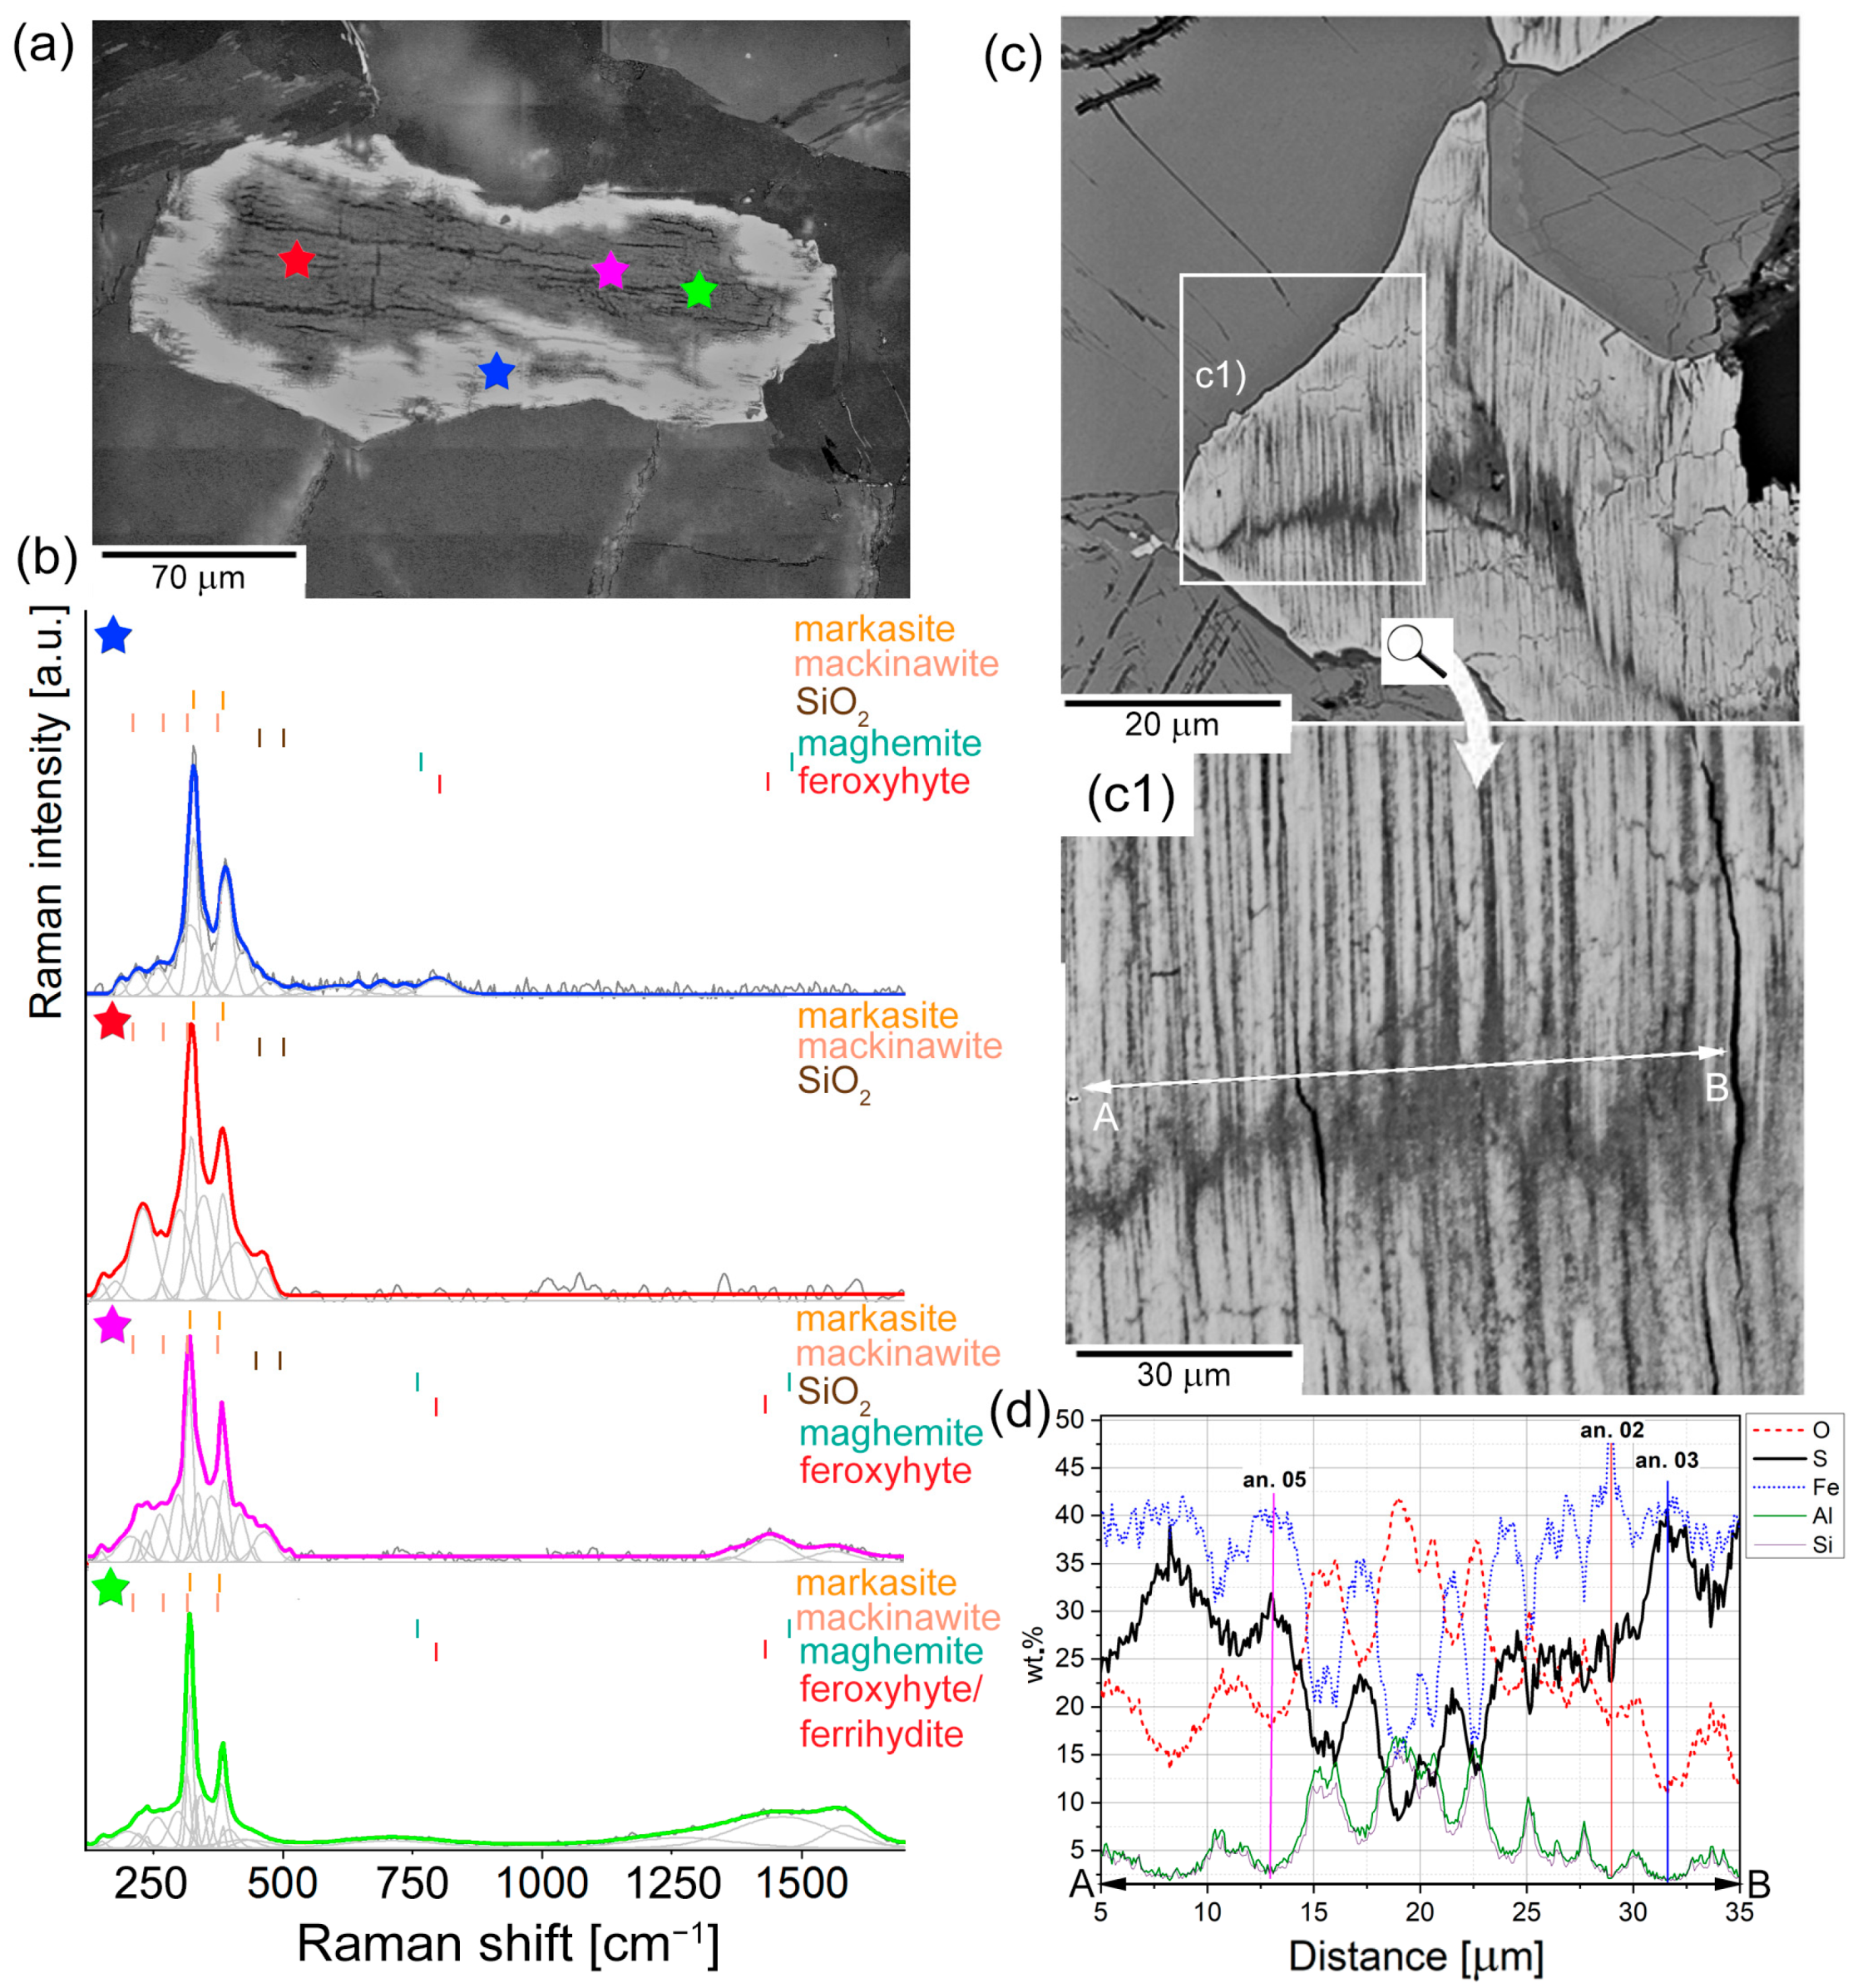
4.2.1. First Stage of Alteration: IS Grains

BSE images of the post-pyrrhotite IS grains show two contrasting regions: bright rim and dark, fractured core (Figure 2a). Raman spectra of the rim show high-intensity bands centered at 332 and 392 cm−1 (Figure 2b) corresponding to marcasite, FeS2 [35,36]. Low-intensity bands at 218 and 275 cm−1 can be assigned to the amorphous iron sulfide [37,38], while bands at 316 and 350 cm−1 arise from partially oxidized, non-stoichiometric Fe2+1−3xFe3+2xS [37,39,40,41] (Figure 2b).
Raman spectra of the core are more complex. Bands at 230, 295, and 411 cm−1 can be either from mackinawite, FeS, or hexagonal FeS. Those bands are slightly blue-shifted due to the heterogeneous distribution of nanocrystalline iron sulfides [42,43,44]. A low-intensity band around 468 cm−1 originated from amorphous silica. Magnon bands between 1300 and 1600 cm−1 are either from iron-deficient sites in the inverse spinel structure of non-stoichiometric feroxyhyte, δ-FeO(OH), ferrihydrite, Fe3+2O3·0.5H2O [45,46], or poorly crystalline maghemite, γ-Fe2O3 [47,48,49].
Figure 2. (a) Optical image of the zoned post-pyrrhotite IS grain. Asterisks correspond to Raman spectra in (b); (c) BSE image of a grain with features indicative of the onset of the second stage of oxidative alteration along (0001) cleavage planes in pyrrhotite. (c1) Magnified view of an area within a rectangle in (c). AB marks the line of the EPMA traverse shown in (d). Oxygen, Al, and Si are from kaolinite, seen as a dark-contrast area in the BSE image (c1).
Minerals 15 00049 g002
Pseudomorphic replacement of pyrrhotite by fine-grained porous marcasite occurred along the (0001) cleavage planes (Table 1: analyses 1–5). Evidence of oxidative dissolution was also visible in the sulfur (S) and iron (Fe) distribution patterns (Figure 2(c,c1)). Further alterations progressed inward from fractures and cleavage planes, leading to marcasite dissolution through the release of sulfur and the growth of oxygen-rich Fe (oxyhydr)oxides. These layers were subsequently replaced by kaolinite. The altered grain showed low concentrations of Fe and S, which inversely correlated with elevated levels of oxygen (O), aluminum (Al), and silicon (Si), particularly in the grain’s central region (Figure 2d, Table 1: analyses 6, 7, and 10). The presence of kaolinite is likely linked to the weathering of feldspars within the migmatitic gneiss.
Detailed EPMA data for post-pyrrhotite IS grains analyzed in specific areas revealed iron sulfides characterized by a narrow Fe range (45.93–46.76 wt.%) and S content (37.11–53.27 wt.%), with low oxygen levels of up to 4.40 wt.% (Table 1: analyses 1–4). The oxygen content increased significantly, reaching up to 24.13 wt.% in various Fe (oxyhydr)oxide layers, correlating with shifts in sulfur (10.54–38.74 wt.%) and iron (46.16–62.73 wt.%) content (Table 1: analyses 5, 8, 9). Notably, the sum of Fe + S in all EPMA analyses was much lower than expected for pure iron sulfides, likely due to intergrowths with (oxyhydr)oxides and silicates. Further reductions in sulfur and iron concentrations, down to 5.11 and 4.45 wt.%, respectively, were accompanied by increases in silica (19.64 wt.%), aluminum (18.64 wt.%), and oxygen (49.80 wt.%), confirming the coexistence of kaolinite with minor amounts of iron sulfides and oxides (Table 1: analyses 6, 7, 10).
Raman spectroscopy and EPMA data reveal a microscale multiphase assemblage formed during the localized weathering of gneisses (Figure 2).
Table 1. Electron microprobe analyses (wt.%) of the post-pyrrhotite grains and percentage of corresponding minerals identified by Raman spectroscopy.
12345678910
Zn0.000.070.000.000.080.000.040.000.00
Co0.040.200.140.100.210.030.130.210.07
Ni0.160.420.120.220.240.120.190.310.11
Fe46.2445.9346.7646.2446.1641.7747.1162.7349.514.45
S53.2752.7449.1746.8137.1110.7623.3310.5438.745.11
Si0.060.300.050.830.863.673.600.410.8819.46
Al0.020.280.030.790.803.503.430.360.9018.64
Mg0.010.000.000.000.010.000.000.000.00
Ca 0.05 0.040.290.330.140.080.19
Na 0.50 0.24
K 0.39 0.33
P 0.68 0.51
O 0.751.804.4013.0637.2620.7024.139.2049.80
Total99.79100.7498.0799.5398.8299.0198.6798.77100.6897.45
Percentage of minerals *
Mrc 98.6691.9987.5769.6420.1243.6519.7272.479.55
Gth 24.48 *
Fex 62.10 *
Mgh 5.647.83 38.3076.5622.55 *
Kln 1.330.203.783.8516.7316.421.724.3289.18
Total 100.7497.8399.1897.9798.9598.4098.0099.3498.73
* calculated by combining the EPMA data with the identification of minerals by Raman spectroscopy. Mrc—marcasite; Gth—goethite, probably mixed with marcasite, feroxyhyte, and Fe(OH)3; Fex—feroxyhyte, probably mixed with marcasite, goethite, Fe(OH)3, and jarosite; Mgh—pure maghemite and (*) maghemite, probably mixed with marcasite and jarosite; Kln—kaolinite.

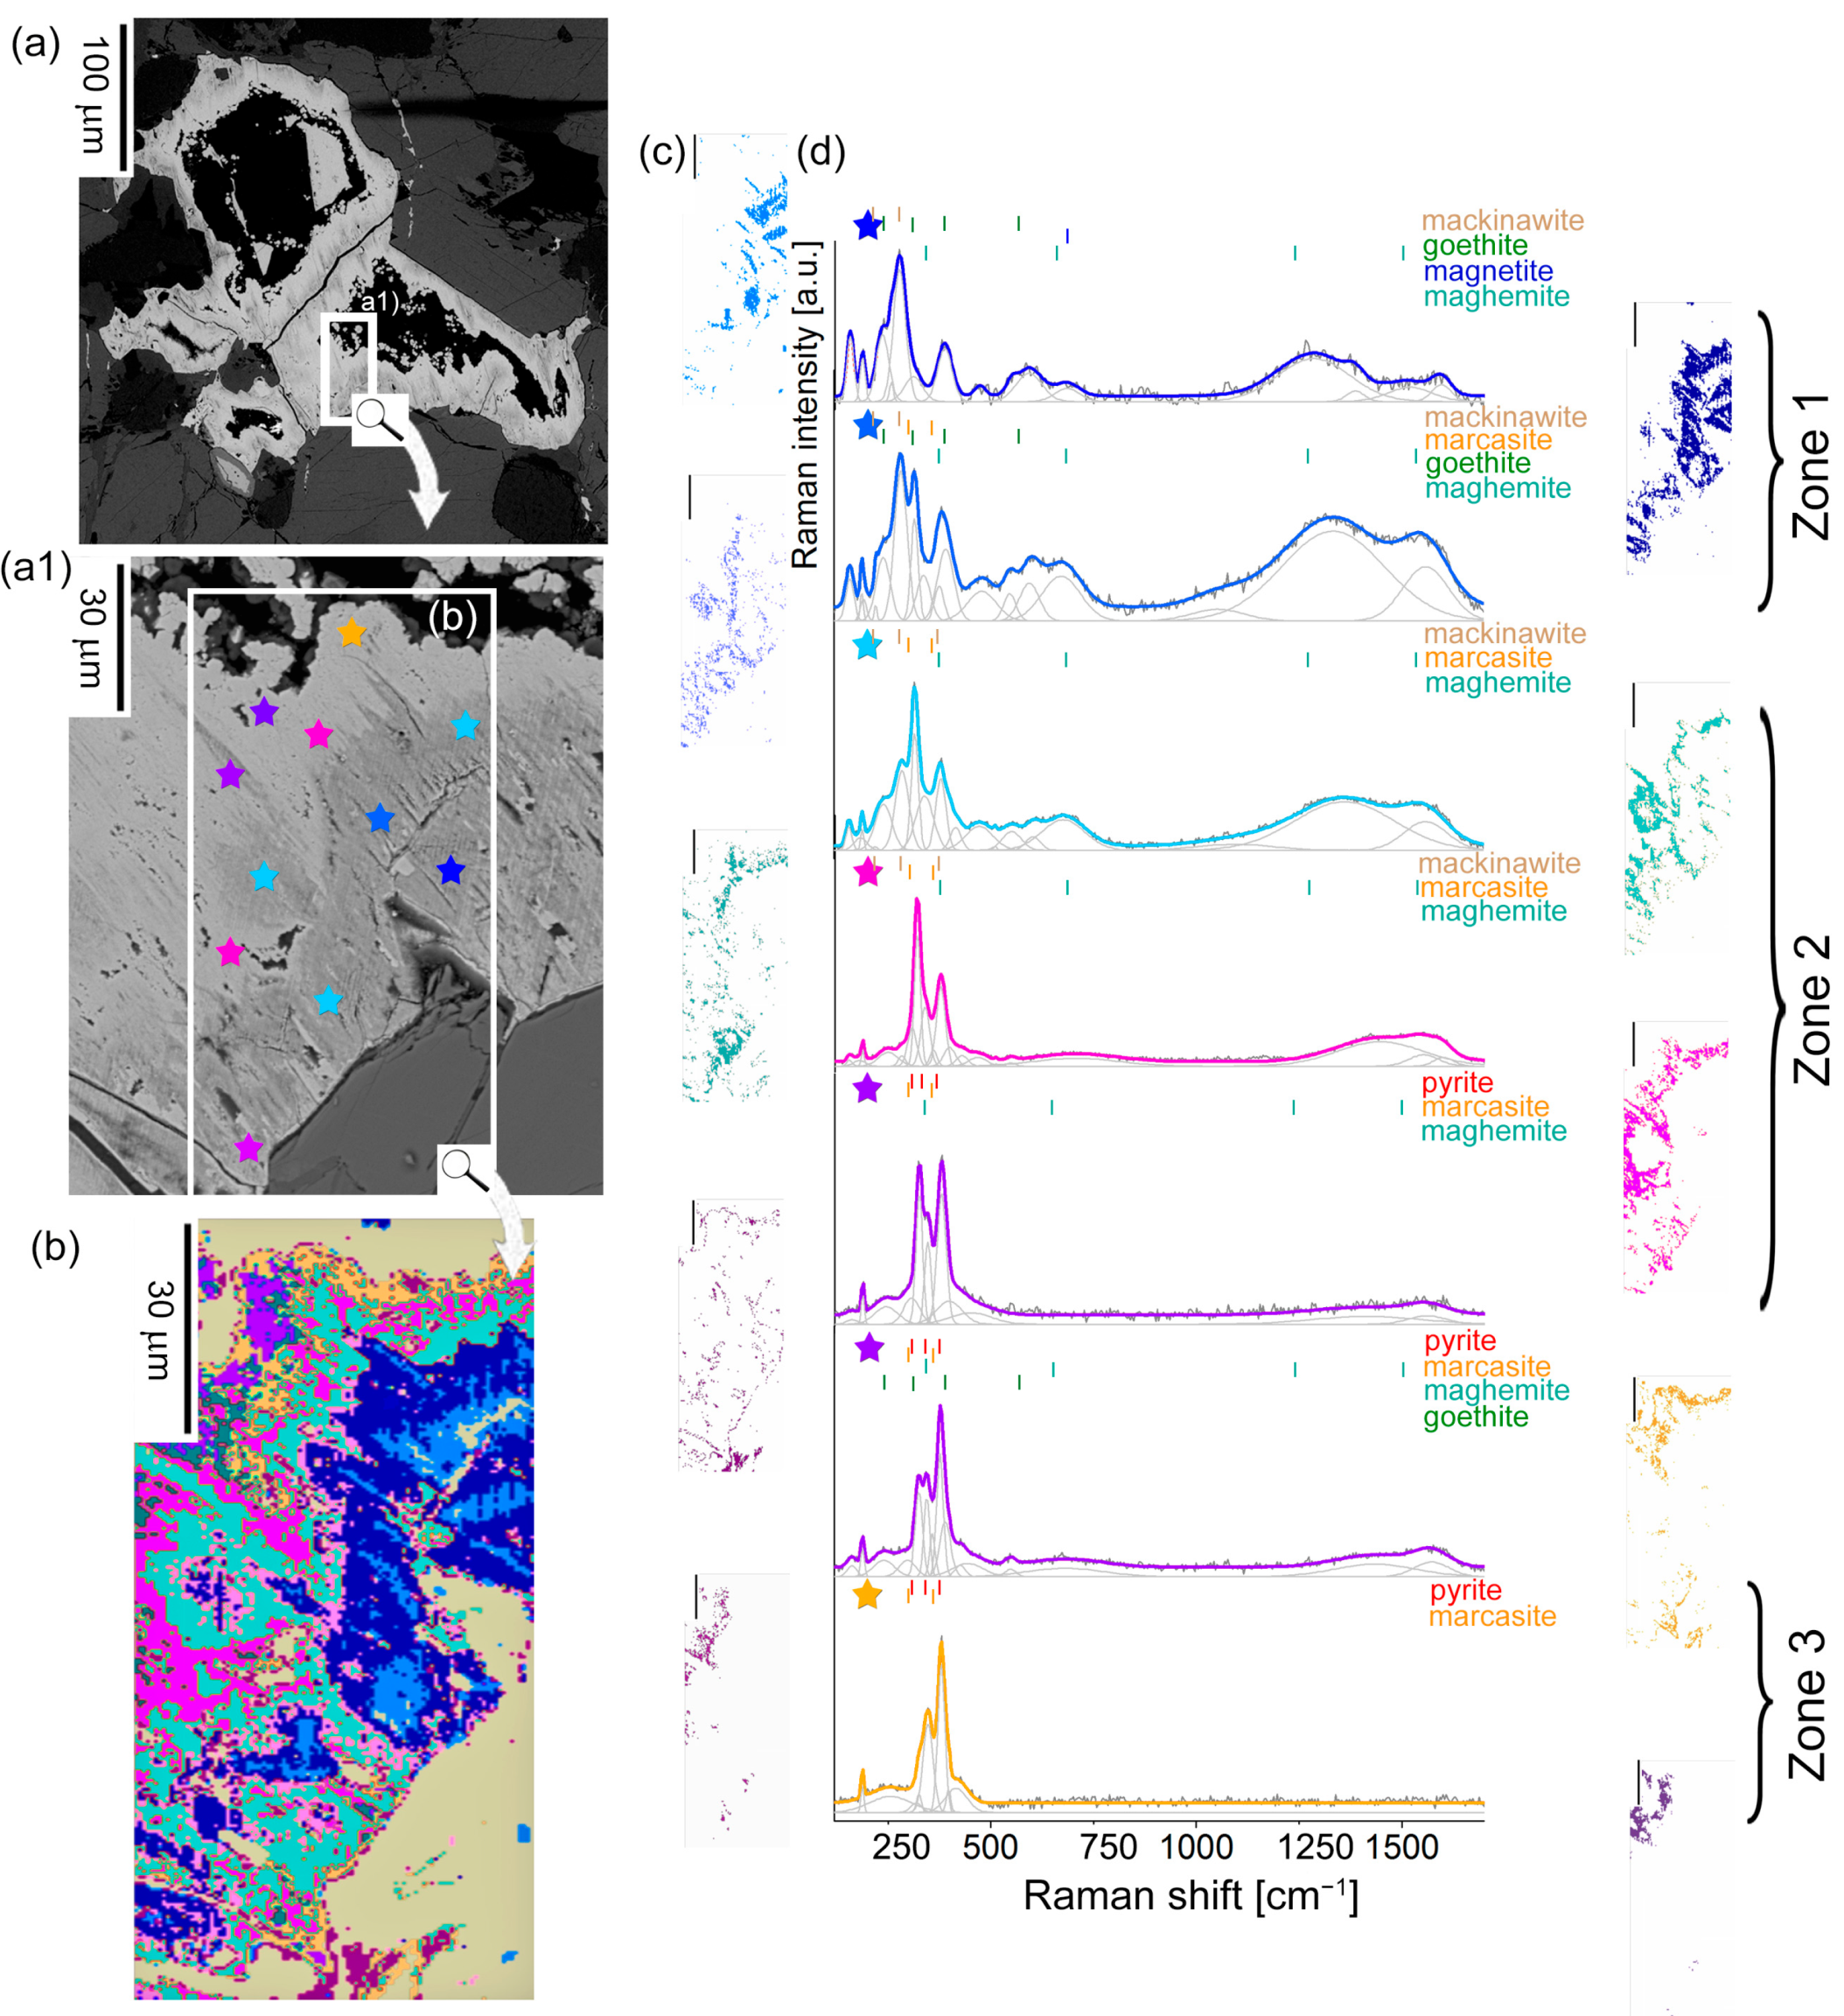
4.2.2. The Second Stage of Alteration: ISO Grains

Xenomorphic and <700 μm long grains of mixed Fe sulfide/oxide display irregular boundaries indicative of dissolution (Figure 3). They represent the advanced stage of sulfide oxidation proceeding from grain boundaries and a network of cracks along the cleavage planes. Elemental distribution maps show two distinct areas (Figure 3a): (1) enriched in Fe and O, and (2) enriched in Fe and S. SEM determined the spatial distribution of major elements in the ISO grain. The increased content of O and Al negatively correlates with Fe and S on the EDX traverse across fractures (Figure 3b,b1,c).
Figure 3. (a) BSE image and chemical maps of Fe, O, S, and Al in the ISO grain. Raman imaging was performed within the contoured rectangular area. The dark green, blue, and brown false colors correspond to the strongest X-ray signal of the analyzed elements; (b) BSE image of a grain representative of the third stage of the oxidative alteration; (b1) enlargement of the area outlined in (b). AB—EPMA traverse line; (c) The elemental composition along the AB line.
Minerals 15 00049 g003
K-means cluster analysis of areas distinguished by Raman imaging revealed three major zones composed of (1) dominant iron oxides, (2) mixed iron sulfides and oxides, and (3) dominant marcasite/pyrite and subordinate iron oxides (Figure 4).
Figure 4. (a) BSE image of the ISO grain that underwent the second stage of oxidative alteration. (a1) Enlarged view of the region within the rectangle in Figure 4a. Colored asterisks show the locations of EPM and Raman analyses. (b) K-means cluster analysis of Fe sulfide oxidation zones of the area of Figure 3a and Figure 4a1. (c) The cluster tree, including clusters of three distinct oxidation zones: (1) the blue-root cluster is associated with Fe oxide zones, (2) the green-, pink-, and yellow-root clusters pertain to intermediate zones composed of both Fe oxides and sulfides, (3) the violet-root clusters represent the Fe sulfide zone. (d) Deconvoluted Raman spectra of spots marked in (a1).
Minerals 15 00049 g004
The Voigt-function fitting of Raman spectra obtained from the zone (1) reveals multiple overlapping bands in the regions of 200–700 cm−1 and 1300–1600 cm−1, primarily pointing to minerals of the maghemite-type structure [48,49]. Poorly crystalline cubic ferrites coexist with both magnetite, Fe2+Fe3+2O4, and well-crystalline goethite, α-FeOOH, as suggested by the Raman bands in the 300–600 cm−1 range (Figure 4d). Low-frequency Raman broad bands at ~221 and 275 cm−1 are assigned to the lattice and symmetric stretching modes of an amorphous FeS or poorly crystalline mackinawite considered a precursor of the iron sulfide transformations [39,41].
Similarly to zone (1), Raman spectra from zone (2) consist of well-distinguishable bands within 200–700 cm−1 and 1300–1600 cm−1 regions, pointing to poorly crystalline goethite, feroxyhyte, and maghemite. A notable increase in the intensity of bands in the 1300–1600 cm−1 region suggests a high degree of iron-deficient sites in the inverse spinel structure [47]. The low-intensity, broad bands around 220 and 285 cm−1 are from relics of amorphous or nanocrystalline FeS (220, 285 cm−1) and Fe3+-containing mackinawite (Fe2+1−3xFe3+2xS) [37,44]. Those bands occur in Raman spectra collected from the border between light- and dark-gray areas seen in the BSE images (Figure 3).
The number of amorphous and crystalline phases varies outside zones (1) and (2). Raman spectra collected in zone 3 (Figure 4) show a band at 348 cm−1, which is indicative of either partially oxidized pyrite or greigite (Fe3S4) [50,51,52]. The latter is considered to be a precursor of FeS2 (marcasite or pyrite). Other bands at 322 and 384 cm−1 originated from the S-S dimer vibration in marcasite, and bands at 336 and 377 cm−1 are from pyrite [35,36]. Maghemite or feroxyhyte occur as oxidative products of iron sulfides outside zone (1) (Figure 4).

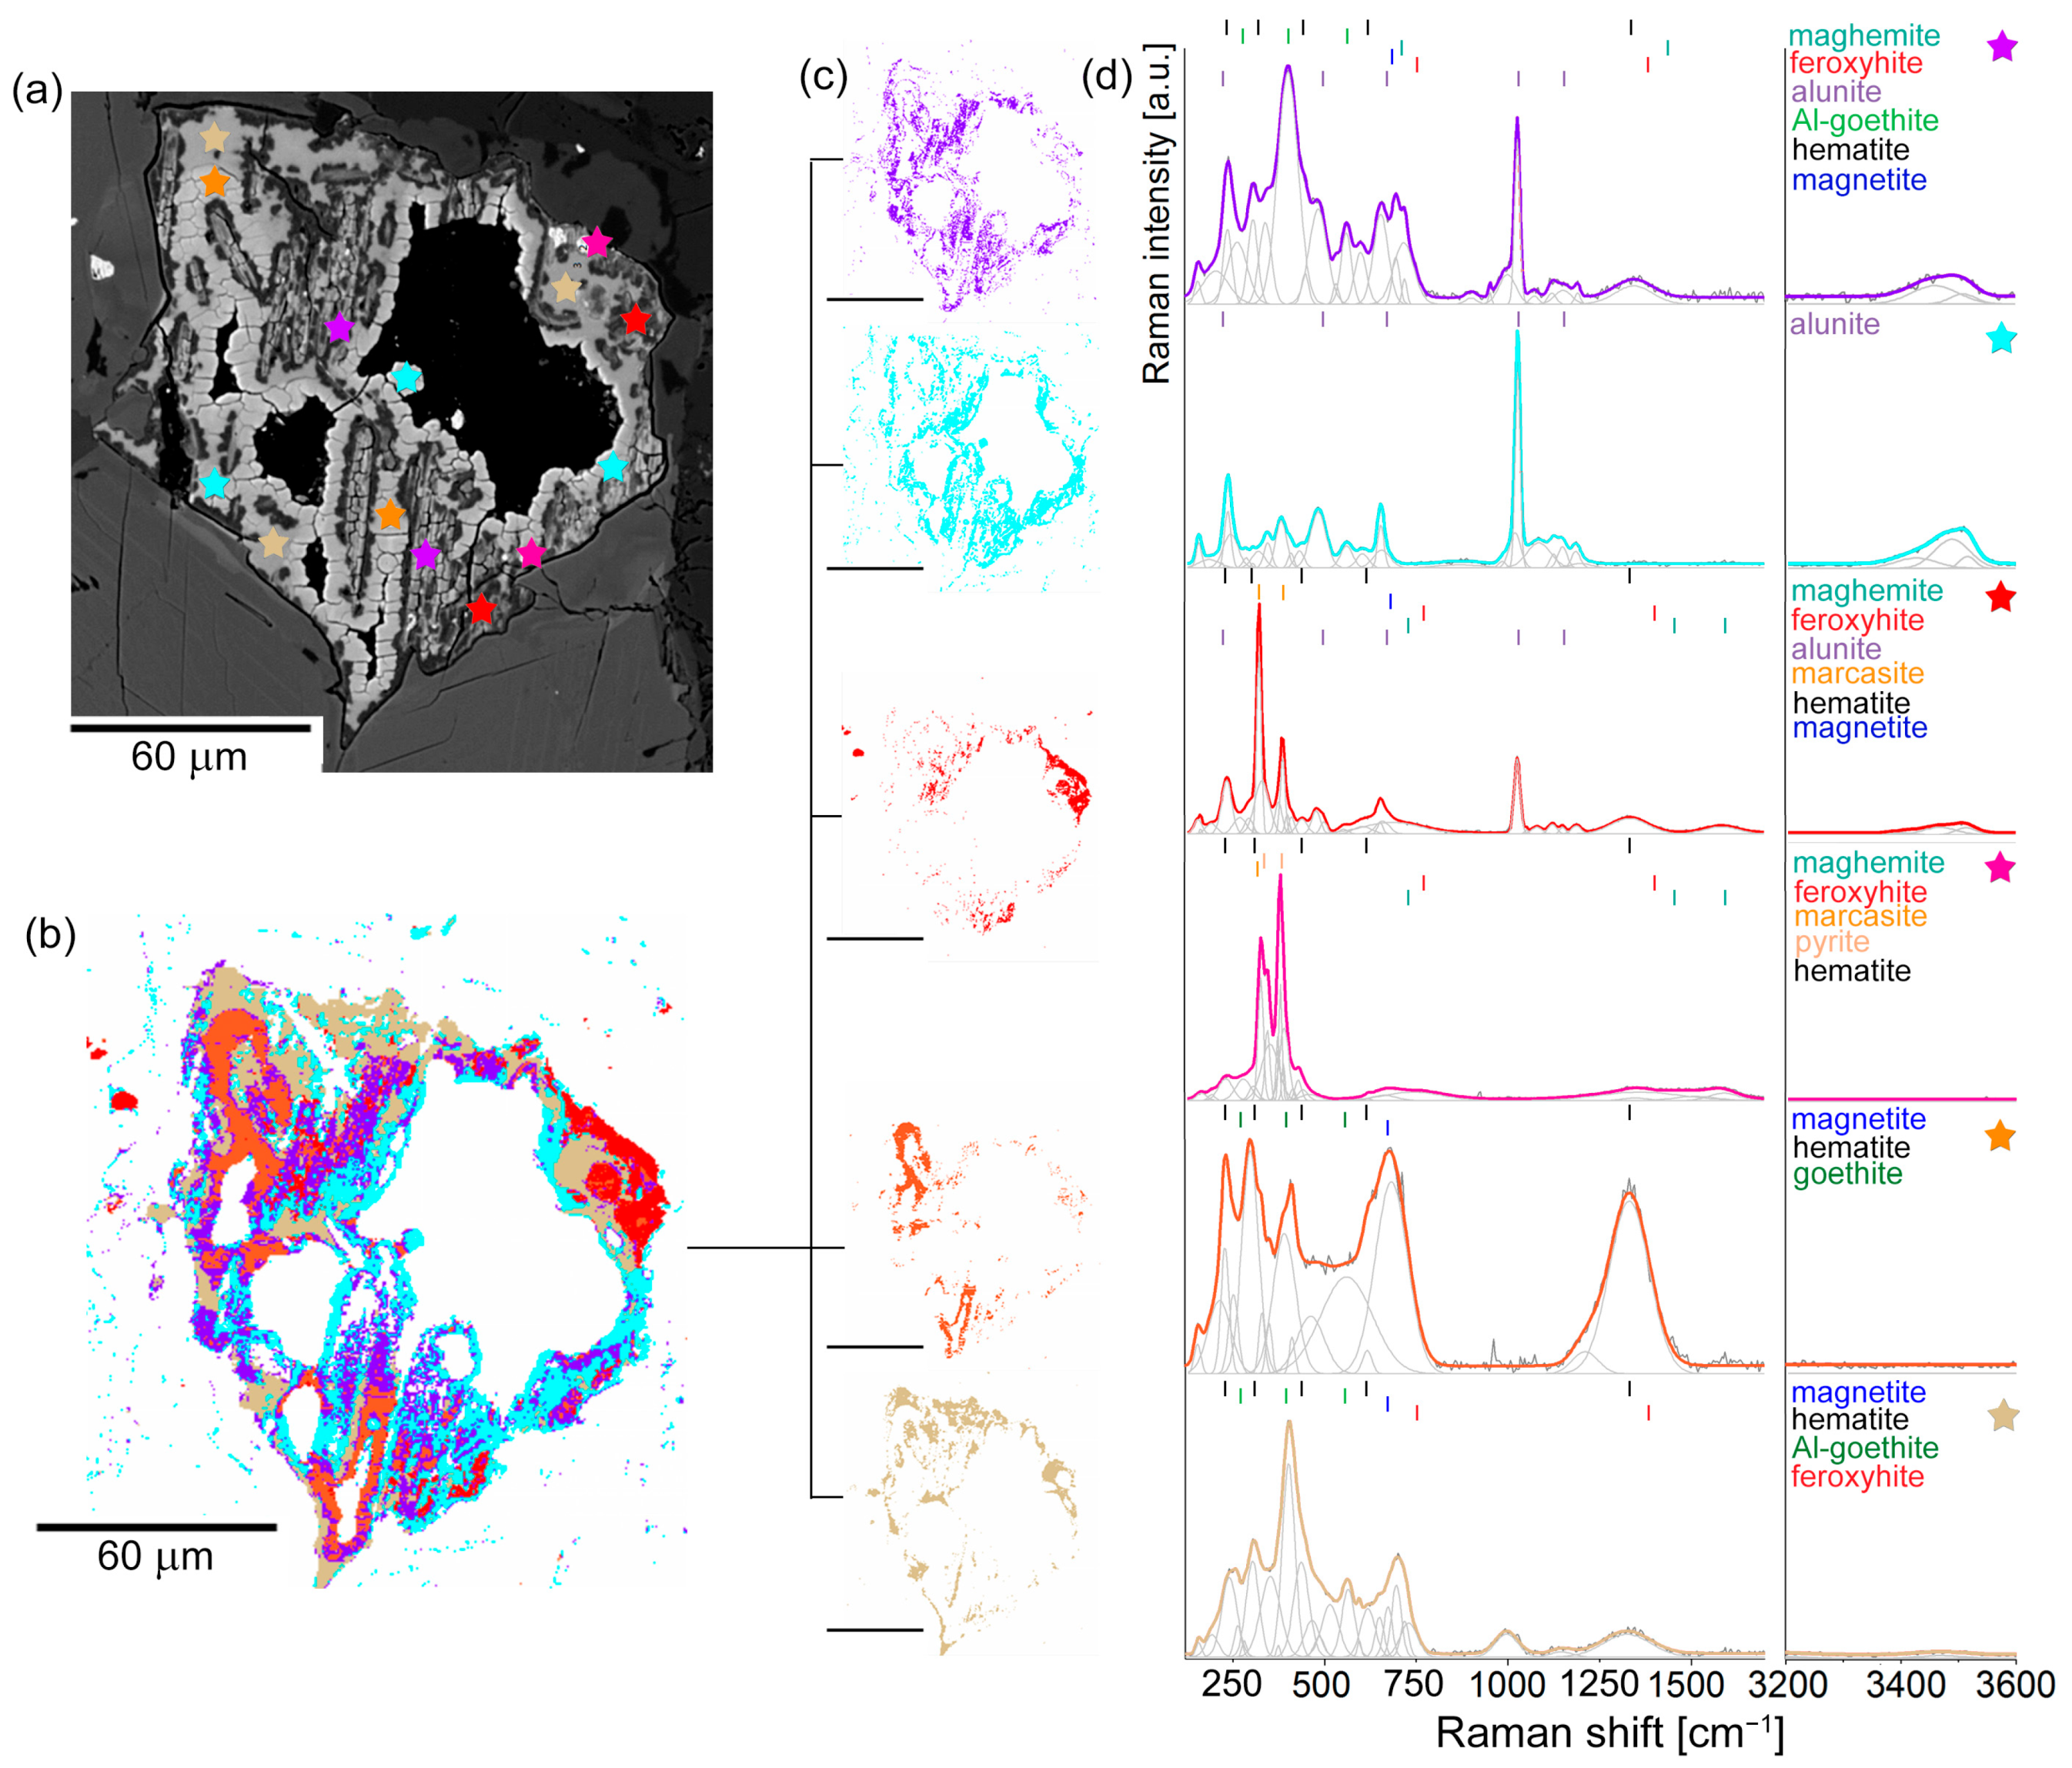
4.2.3. Stage Three: ISOS Grains

Grains of this type occur adjacent to open fractures and represent the most oxidized post-pyrrhotite pseudomorphs. They consist of fine-grained aggregates of iron sulfide relicts and products of the oxidation of the post-pyrrhotite marcasite: dominant iron sulfates and subordinate Fe (oxyhydr)oxides. EPMA revealed two subsets of the ISOS assemblage, coded hereafter ISOS1 and ISOS2. ISOS1 is enriched in Fe and depleted in Al and Si compared to ISOS2 (Table 2).
Table 2. Electron microprobe analyses (wt.%) of ISOS1 and ISOS2 grains and percentage of corresponding minerals identified by Raman spectroscopy.
OxideISOS1ISOS2
SiO217.6844.3242.1740.48
Al2O34.0337.0637.9937.37
Fe2O367.212.662.564.66
MnO0.020.020.080.02
MgO0.000.030.030.00
CaO0.240.230.170.35
K2O0.470.270.821.27
Na2O0.000.000.090.10
SO31.280.732.503.65
P2O50.760.480.520.48
Total91.7085.8086.9287.23
Percentage of minerals *
Gth72.012.962.855.18
Kln10.2192.0690.1485.80
Silica12.921.460.210.55
Jrs5.69
Alu 1.896.479.44
Total100.8398.3799.67100.97
* calculated by combining the EPMA data and identification of minerals by Raman spectroscopy. Kln—kaolinite, Gth—goethite, Jrs—jarosite, Alu—alunite.
K-means cluster analysis based on Raman imaging revealed five compositionally different mineral clusters within the ISOS1 grain (Figure 5). The blue and violet clusters occupy the entire grain. In comparison, the other three clusters are more localized. The Raman spectra corresponding to the blue and violet clusters show bands centered at 481, 657, 1027, and 1188 cm−1 related to the ν2, ν4, ν1, and ν3 (SO3) bending and stretching vibrational modes, while bands at 235, 381, 3491, and 3519 cm−1 are assigned to the framework deformation and stretching modes of Al-OH and OH [53,54] in alunite, KAl3(SO4)2(OH)6, [54,55,56]. Alunite coexists with hematite, as suggested by bands at 228, 295, 390, 616, and 1332 cm−1 [57,58,59,60], and with goethite, as indicated by bands at 251, 306, 404, 481, 541 cm−1 [61,62,63,64,65,66]. Notably, the goethite bands are upshifted by ~5 cm−1 compared to what is typically observed for this mineral, probably due to the substitution of Fe3+ by Al3+. Based on the observed bands shift and applying the equation given by Liu et al. [67], the Al content in the examined goethite is approximately 6 wt.%. Other minerals identified by the Raman spectroscopy include the low-ordered or poorly crystalline maghemite [48,49], feroxyhyte [45,46], ferrihydrite, and magnetite with broadened bands at ~700 cm−1 and bands in the 1300–1600 cm−1 region, suggesting a high degree of iron-deficient sites in the inverse spinel structure [47,65,68,69].
Raman spectra of the red cluster suggest the coexistence of relicts of amorphous FeS with marcasite (320, 384 cm−1) and pyrite (336, 377 cm−1) [35,36]. The orange cluster is dominated by hematite, as revealed by bands at 235, 299, 396, 612, and 1326 cm−1. A band indicates the occurrence of subordinate magnetite at 681 cm−1 [61] (Figure 5).
Figure 5. (a) BSE image of the ISOS1 pseudomorph. Asterisks mark spots of EPMA and Raman analyses. The black areas within the pseudomorph are voids; (b) K-means cluster analysis map of the pseudomorph; (c) Cluster tree with the color-coded root clusters from (1) the mixture of goethite and alunite (violet), (2) alunite (blue), (3) marcasite and pyrite (red), (4) hematite, maghemite, magnetite (pink), and (5) goethite (brown); (d) Respective Raman spectra used for K-means cluster analysis.
Minerals 15 00049 g005
Raman spectra of the ISOS2 grains show bands assigned to alunite and jarosite (Figure 6). Bands at 485, 657, 1025, and 1188 cm−1 are from ν2, ν4, ν1, and ν3 (SO3) bending and stretching vibrational modes, while bands at 238, 380, 3479, and 3515 cm−1 originated from the stretching mode of Al-OH and OH in potassium alunite [53,54,55,56]. On the other hand, bands centered at 434, 629, 651, 1012, 1112, and 1162 cm−1 are from bending and stretching vibrational modes of (SO3), while bands at 230, 325, 385, 572, and 3420 cm−1 are assigned to the framework deformation and stretching mode of Fe-OH and OH in Al-jarosite or jarosite [53,55,70,71] (Figure 6).
Figure 6. (a) BSE image of the ISOS2 grain and magnified views of areas contoured by (a1,a2) rectangles. Asterisks mark spots in which EPMA and Raman spectra shown in (b) were collected.
Minerals 15 00049 g006
Raman spectra of the ISOS2 assemblage suggest the co-occurrence of alunite and either jarosite, KFe3(SO4)2(OH)6, or Al-rich jarosite, K(Fe,Al)3(SO4)2(OH)6. A decrease in the Al content implies the Fe3+→Al3+ isomorphic substitution in the alunite–jarosite series. This substitution locally alters the crystal field by increasing Fe-O bond distances, which is reflected in the downshift of the major Raman bands. The increased intensity of those bands results from a reduction in structural order compared to fully crystalline alunite [70]. The low-frequency, broad bands around 220 and 285 cm−1 are attributed to amorphous iron sulfide [37]; bands at 255, 326, 414, 486, and 552 cm−1 originated from Al-goethite [67], while bands at 430, 472, and 1003 cm−1 are from amorphous silica (Figure 6).

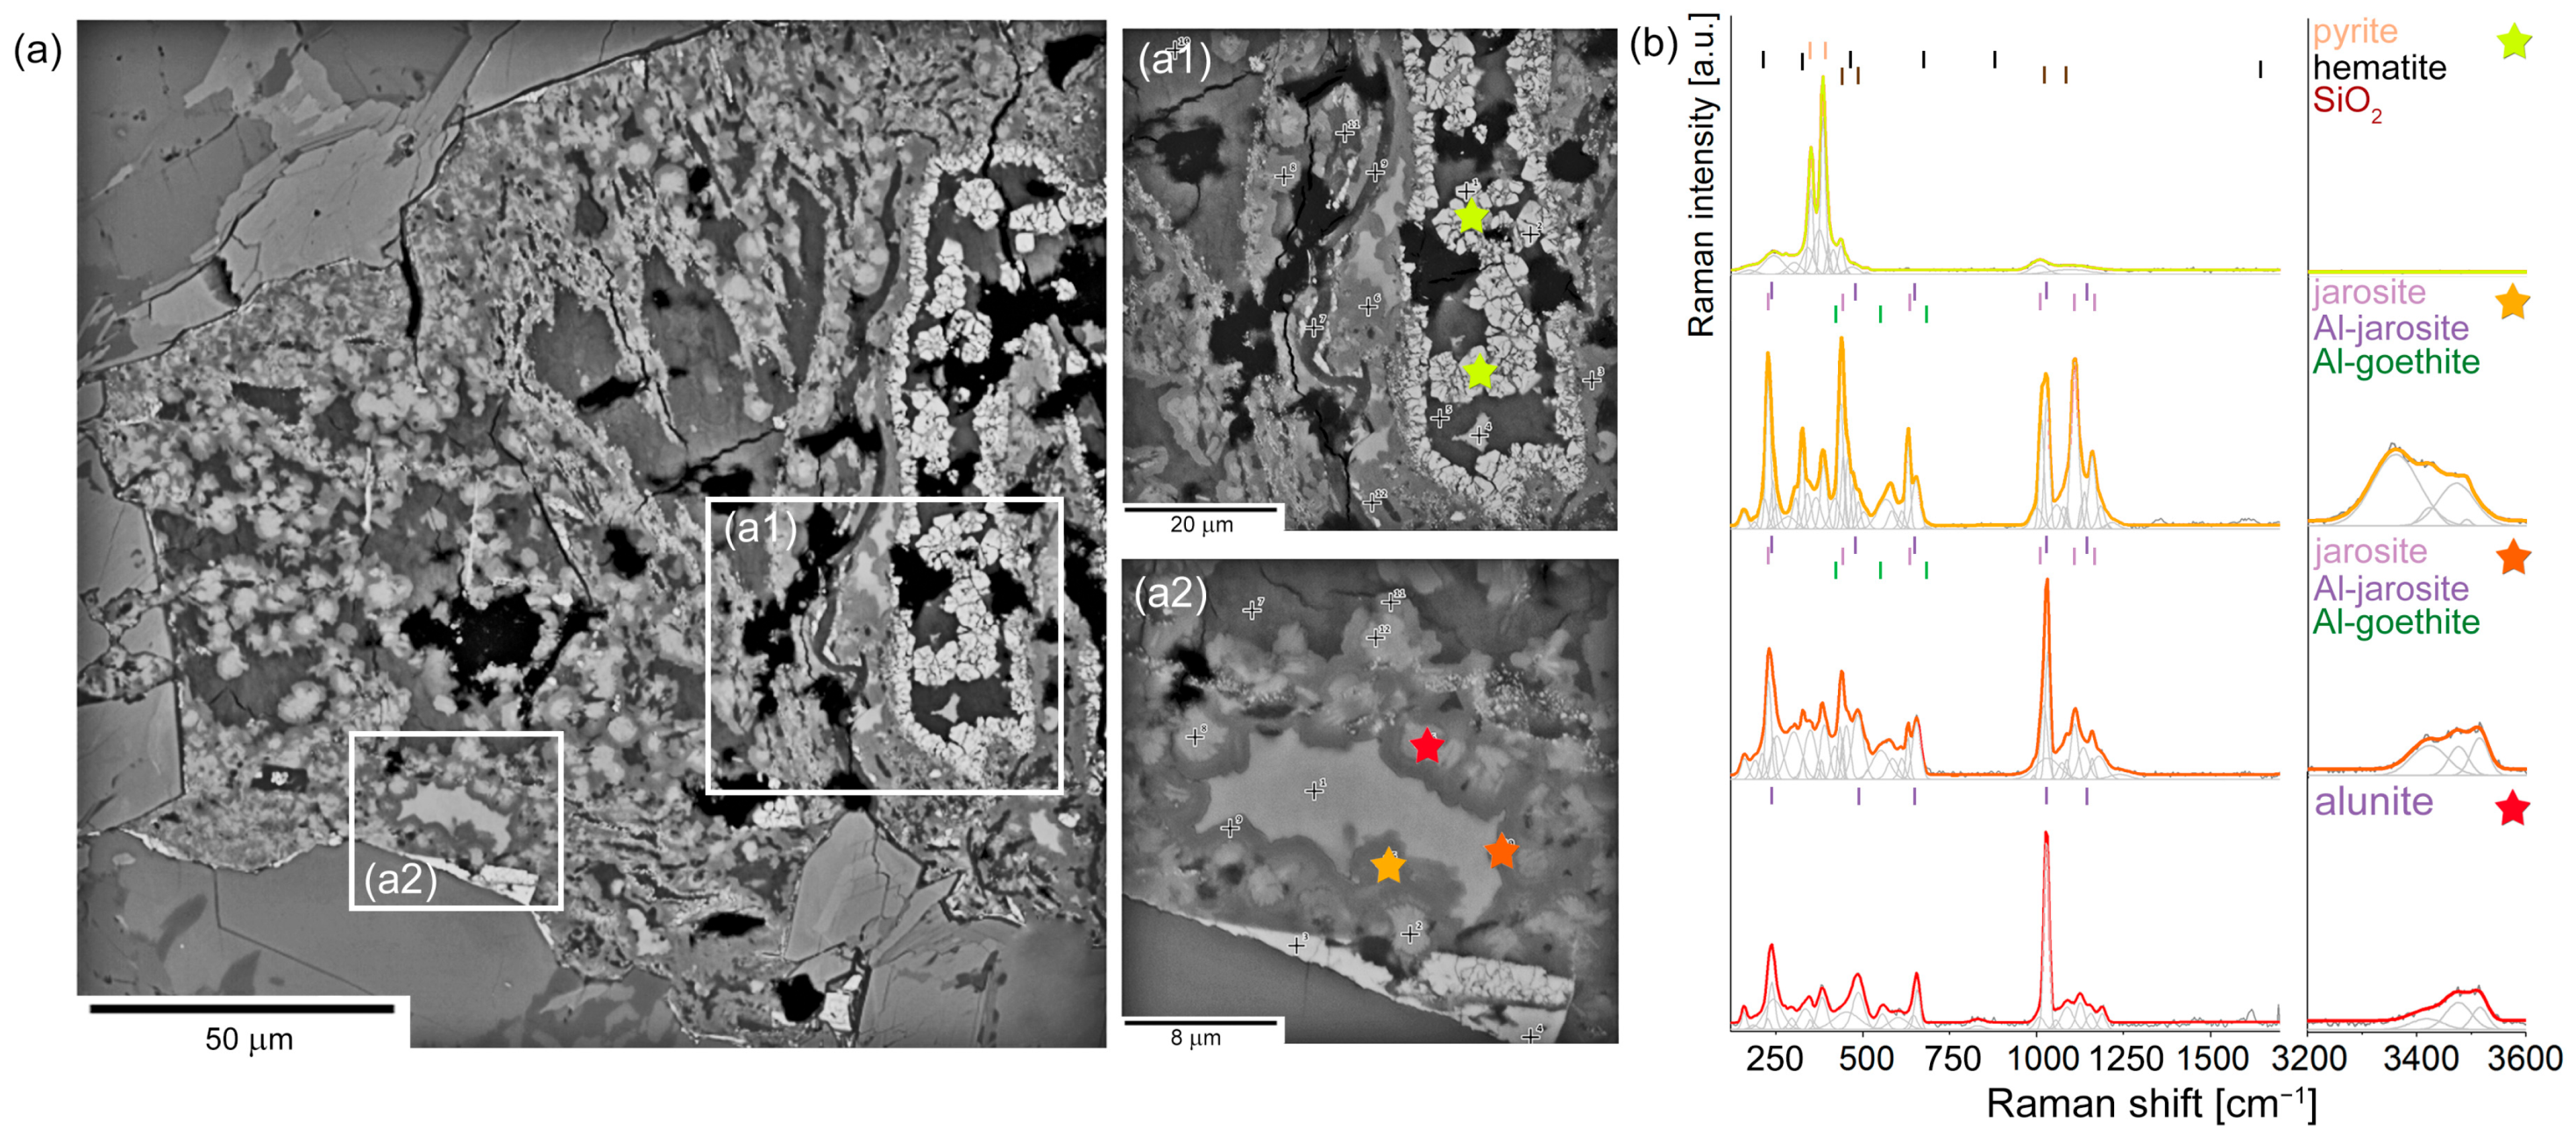
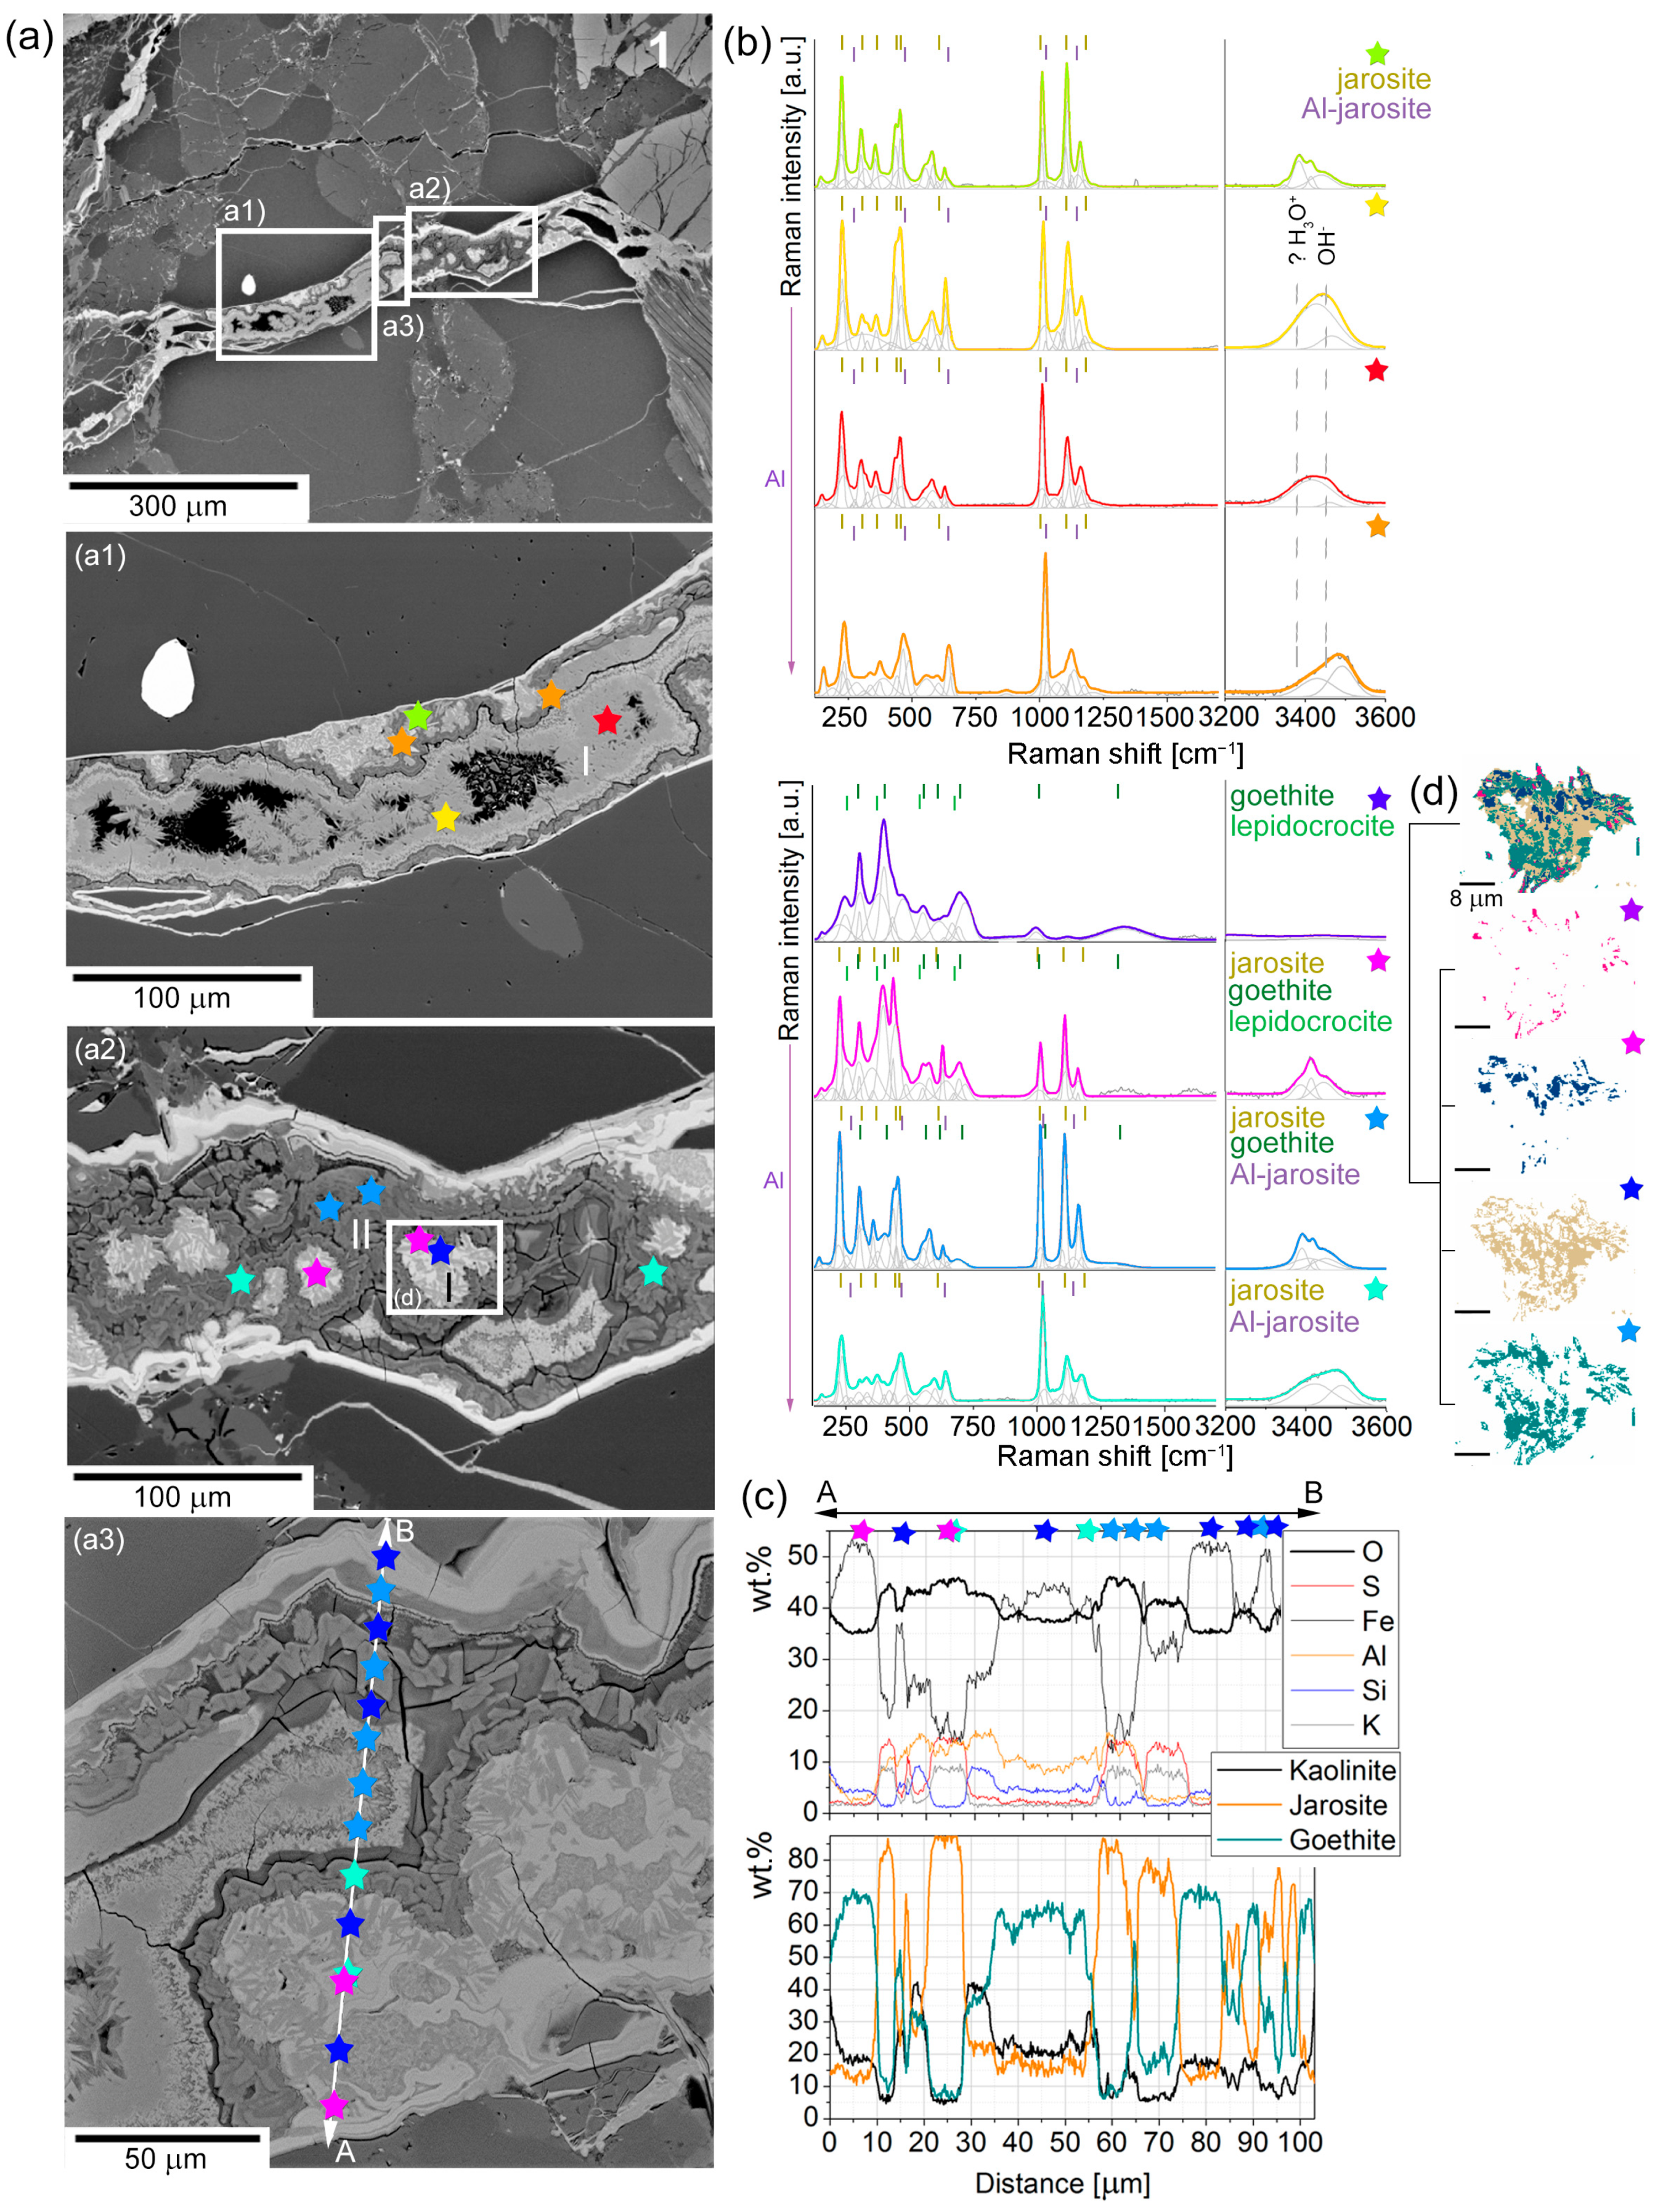
5. Pyrite Oxidation Products in Hydrothermal Veins

Microscopic observations combined with EPMA identified vein-filling assemblages related to the most advanced oxidation stage of pyrite with dominant alunite–jarosite series and subordinate FeOOH (Figure 7). The alunite–jarosite series crystals are fine-grained (2–10 μm), tabular/bladed, anhedral, and locally pseudo-cubic (Figure 7). There are also fine-grained (<2 μm) jarosite/alunite aggregates intricately intergrown with kaolinite, goethite, and amorphous silica.
Figure 7. (a) BSE images of hydrothermal veinlet in migmatitic gneiss. Rectangles (a1a3) contour areas enlarged in (a1a3) BSE images. Roman numerals I and II refer to bright and dark regions seen in the BSE images, respectively. Asterisks refer to spots from which both Raman spectra and EPMA data were obtained, including the cross-section line (AB); (b) Deconvoluted Raman spectra of spots marked with asterisks in BSE images and related to bright and dark regions in (a1,a2); (c) Chemical and mineralogical compositions along the AB line in (a3). (d) K-means cluster analysis of an area I contoured by the rectangle (d) in (a2).
Minerals 15 00049 g007
The general formula of the jarosite-group minerals is AB3(SO4)2(OH)6, where A = K, Na, NH4, H3O, Ag, Pb, Tl; B = Fe3+, Al, Mg, Mn, Ca [72]. EMPA data for the jarosite-group minerals investigated during this study are given in Table 3. Chemical compositions combined with morphological observations revealed three generations of jarosite (Figure 8). Analyses 1–4 in Table 3 reveal lower occupancy of the B site, probably due to vacancies typically observed in supergene iron sulfates. However, there are analyses (5–9 in Table 3) with an excess of B cations, possibly resulting from the sub-micron scale contamination by FeOOH. All the analyses are K and SO3-deficient. H3O+ may compensate for low potassium content at the alkali (A) site. However, both the K and SO3 deficiencies may equally be an artifact of EPMA conditions, which may have induced the migration of K and S from the sulfates. The EPMA profile across the investigated vein (Figure 7(a3)) revealed a positive correlation between O, S, and K and irregularity for Fe and Al (Figure 7c) resulting from various proportions of goethite and jarosite-group minerals.
Table 3. Electron microprobe analyses (wt.%) of the jarosite-group minerals analyzed by Raman spectroscopy.
Oxide123456789
SiO20.050.260.030.200.040.590.431.092.77
Al2O30.522.526.1026.430.463.057.3824.9830.65
Fe2O346.0243.2637.4313.5246.9645.1539.6420.4020.27
MgO0.040.000.030.010.050.000.020.000.01
MnO0.070.000.000.000.120.000.030.010.05
CaO0.050.010.040.160.080.240.080.110.41
Na2O0.260.100.400.110.210.120.060.100.08
K2O6.503.723.616.586.187.914.683.504.39
SO332.2031.6230.3536.8229.7730.2529.6135.4335.96
P2O50.000.161.070.400.001.59 0.290.85
Total85.7181.6579.0684.2283.8788.9181.9385.9195.42
Number of ions calculated based on 2(XO4), where X = S and P
Si0.0040.0220.0030.0140.0040.0510.0390.0820.202
Al0.0510.2500.6192.2420.0490.3080.7832.2052.643
Fe3+2.8662.7362.4250.7323.1632.9072.6851.1491.116
Mg0.0050.0000.0040.0010.0070.0000.0030.0000.001
Mn0.0050.0000.0000.0000.0090.0000.0020.0010.003
Ca0.0040.0010.0040.0120.0080.0220.0080.0090.032
Na0.0420.0160.0670.0160.0360.0200.0100.0150.011
K0.6860.3990.3960.6040.7060.8640.5370.3340.409
S2.0001.9941.9611.9882.0001.9422.0001.9911.974
P0.0000.0060.0390.0120.0000.0580.0000.0180.026
H3O+ *0.2720.5850.5370.3800.2580.1170.4520.6510.579
Total5.9356.0086.0546.0026.2396.2886.5196.4556.997
ΣB2.9312.9863.0522.9883.2353.2373.4813.3643.794
* calculated by the difference at the alkali site.
Raman spectra of area a1 in Figure 7b show numerous overlapping bands of Al–jarosite and jarosite. Bands assigned to jarosite occur at 458, 635, 1014, 1105, and 1163 cm−1. They resulted from the ν2, ν4, ν1, and ν3 (SO3) bending and stretching modes. At the same time, bands at 227, 329, 365, 572, and 3430 cm−1 are assigned to the framework deformation and stretching mode of Fe-OH and OH in jarosite [71,73] (Figure 7b). A close inspection of the OH stretching region reveals both the shape and position of OH bands different from what is typical for jarosite, possibly due to lower K content, as suggested by EPMA (Table 3). Hydronium ions may have been incorporated into jarosite to maintain the charge balance of the crystal structure. That would require additional protonation of OH groups [74,75]. Substitution of K by hydronium ions causes blue-shift and broadening of Raman bands in the OH region [53,73,76]. Alternatively, the K position may be vacant, distorting the crystal structure, as suggested by the Raman bands broadening.
The substitution of Fe by Al in jarosite implies the shortening of metal-O bonds and the upshift of the prominent Raman bands. The number and intensity of Raman bands gradually decrease with the increasing Al content. Raman spectrum of Al-rich jarosite shows bands at 470, 643, 1022, and 1136 cm−1 [53,54,55,56] corresponding to the internal vibrations of (SO3) groups and bands at 235, 372, 3426, and 3493 cm−1 originated from the lattice modes and stretching vibrations of Al-OH and OH [53,54].
Raman spectra of the vein’s margins (green and orange stars in Figure 7(a1)) show bands centered at 226, 299, 359, 455, 575, 630, 1011, 1107, 1160, 3382, 3412, and 3443 cm−1, which are typical for potassium jarosite [71,73].
Raman spectra of area a2 in the vein’s central part (Figure 7(a2)) are from Al-rich jarosite. They are similar to the spectra obtained from the marginal part of the vein. There are areas in the vein occupied by goethite (243, 303, 395, 472, 549 cm−1), lepidocrocite (253, 378, 528 cm−1), magnetite (~690 cm−1), Al–jarosite (466, 645, 1022, 1136 cm−1: ν2, ν4, ν1, ν3 (SO3) and 234, 374, 3424, 3486 cm−1: Al-OH and OH), and K–jarosite (442, 628, 1011, 1105, 1160 cm−1: ν2, ν4, ν1, ν3 (SO3) and 224, 350, 555, 3388, 3412, 3450 cm−1: Fe-OH and OH), as revealed by Raman imaging and cluster analysis (Figure 7(a2,b,c)) [77].
Goethite occurs in the marginal portion of the vein, whereas the central part is compositionally more complex. BSE images of the central part show dark and light areas. The dark areas have a constant O content and alternating Fe-rich and Al-rich bands from the intercalated Al-poor and Al-rich goethites. The light areas are depleted in Fe and have elevated concentrations of K, O, S, and Al from both Al-rich K–jarosite and K–alunite. Tabular/bladed Al–jarosite crystals occur within the interiors of the alunite crystals. Oscillatory zoning of alternating alunite and Al–jarosite is common in pseudo-cubic grains. There are also alternating light and dark areas with relatively low Fe and high K, S, Al, and O content due to the co-occurrence of Al–goethite and Al–jarosite (Figure 7c).
Figure 8. The ternary diagram for iron sulfates in the hydrothermal veins. I, II, and III refer to three generations of jarosite.
Minerals 15 00049 g008

6. Discussion

The principal stages of iron sulfide oxidation in the investigated migmatitic gneiss have been inferred from Raman spectroscopy supplemented by SEM/EDX and EPMA (Figure 9). In the low-porosity zone, i.e., at the low fluid/gneiss ratio, pyrrhotite (Figure 9, stage 0) was replaced by marcasite at the onset of the oxidative alteration (Figure 2a, Figure 9 and Figure S1), in accord with the reaction [78]:
            2Fe1−xS + (1/2 − x)O2 + (2 − 4x)H+ = FeS2 + (1 − 2x)Fe2+ + (1 − 2x)H2O
pyrrhotite          marcasite
According to Murowchick [78], the epitaxial replacement of pyrrhotite by marcasite occurs by a phase transformation. The absence of crystallographic relations between those minerals suggests coupled dissolution–reprecipitation replacement reactions [78] under both oxic- and anaerobic conditions [32,79]. Whether marcasite or pyrite forms during the Fe1−xS—FeS2 transformation depends on the competition between nucleation and crystal growth during crystallization, which, in turn, is controlled by both the degree of the solution saturation with respect to minerals and the solution pH. The transformation of pyrrhotite to marcasite is preferred in the absence of external S2− (H2S) under both acidic and basic conditions. Pyrrhotite is transformed into fine-grained porous marcasite in strongly acidic (pH < 2.5) and oxidized solutions [80].
Figure 9. Schematic representation of the progressive oxidative alteration of pyrrhotite and post-pyrrhotite marcasite in migmatitic gneiss. Kln—kaolinite, Gth—goethite, Jrs—jarosite, Alu—alunite, Mrc—marcasite, Mgh—maghemite, Py—pyrite, Po—pyrrhotite, Brt—baryte. Refer to the text for an explanation. Numbers refer to individual stages of the pyrrhotite transformation (0: Unaltered Pyrrhotite, 1a and 1b: post-pyrrhotite grains with iron sulfides, 2: incomplete pseudomorphs with iron sulfides and oxides, 2a and 2b: the most oxidized post-pyrrhotite pseudomorphs with relicts of fine-grained iron sulfides and oxides as well as kaolinite and sulfates of the alunite supergroup).
Minerals 15 00049 g009
Studies of pyrite and marcasite crystallization from hydrothermal solutions at <300 °C emphasized the role of a fine-grained FeS precursor (amorphous FeS, mackinawite, and/or greigite) in the FeS2 formation in the presence of H2Saq [81]. The latter originates through dissolution–reprecipitation reactions from the FeS precursor and not directly by nucleation from acidic solutions [81]. The conversion of FeS to FeS2 is a multi-step process involving changes in aqueous sulfur species, leading to the following solid-state transformation sequence: mackinawite or amorphous FeS → greigite → marcasite or pyrite [82].
Raman spectra of the rim of the post-pyrrhotite grain (Figure 2a) confirm the involvement of the intermediate FeS precursor in the pyrrhotite replacement by marcasite. There are four pathways possible for this transformation: (1) the polysulfide pathway by the reaction of FeS with (S2−n); (2) Fe loss without an external source of sulfur; (3) the H2S-pathway by a sulfidation reaction mechanism in the presence of H2Saq; and (4) the O2-pathway, which requires an external oxidant (oxygen or other oxidizer such as Fe3+) [32,78,79].
The inner portion of the post-pyrrhotite grains consists of either poorly crystalline maghemite [γ-Fe3+2O3] or feroxyhyte [Fe3+O(OH)] and ferrihydrite [Fe3+2O3·0,5(H2O)] (Figure 9, stages 1a and 1b, Figure S1a). They originated from the oxidation of marcasite by solutions containing dissolved oxygen (the O2 pathway). Subsequent oxidative dissolution of marcasite resulted in the formation of ferric iron (oxyhydr)oxide via dissolution–crystallization, depending on the acidity of the solution [83,84,85]. Crystallization of sulfates may have resulted from the increased solution pH [86]. Aqueous solutions had easy access to iron sulfides in the highly porous and fractured migmatitic gneiss and caused advanced oxidative alteration of the post-pyrrhotite marcasite.
Incomplete pseudomorphs (ISO) after post-pyrrhotite marcasite consists of broad alteration rims composed of ferric iron oxides and (oxyhydr)oxides surrounding cavities filled with kaolinite, pyrite microcrystals (<10 μm), and baryte (Figure 9, stage 2, Figure S1b,c). Minerals of the ISO assemblage may have crystallized from the late-stage hydrothermal fluids mixed with meteoric water [87]. Cavities in the ISO grains originated from the oxidative dissolution of marcasite along en-echelon fractures (Figure 9 and Figure S1d,e). Intense oxidation of marcasite proceeded from cracks developed along the (0001) cleavage planes and from grain boundaries. The replacement of marcasite by pyrite around cavities, most likely due to an increase in the solution pH, occurred through an intermediate pyrite/marcasite zone, as revealed by Raman imaging of an area between the quartz–pyrrhotite boundary and the poly-crystalline lining of cavities (Figure 4). This type of pseudomorph may have also developed during the dissolution of marcasite and its replacement by kaolinite along cleavage planes (Figure 3b,c and Figure S1d,e).
The complete and the most oxidized post-pyrrhotite pseudomorphs (ISOS), with a few relicts of fine-grained marcasite, occur adjacent to open fractures (Figure 5, Figure 6 and Figure S1(f,f1)). They represent the third stage of oxidation of pyrrhotite and post-pyrrhotite marcasite. The oxidation products comprise iron oxides (magnetite, maghemite, and hematite) and (oxyhydr)oxides (goethite, feroxyhyte, and Al-rich goethite) (Table 3, analysis 3). Al-rich goethite co-occurs with hydrated iron sulfates and most probably originated by the recrystallization of goethite/feroxyhyte caused by a solution that supplied Si, Al, and K.
Cavities in the ISOS1 grains are filled with kaolinite and sulfates of the alunite supergroup (Figure 9, stages 2a and 2b). The oscillatory-zoned alunite pseudo-cubic rhombohedral crystals crystallized within remnants of marcasite (Figure S1g,h). The rhombohedral alunite crystallizes at <200 °C [88] in a wide range of solution pH, Eh, and concentrations of Al3+, Fe3+, and SO42−. The complete ISOS2 pseudomorphs originated in an oxidizing environment with a low solid-to-solution ratio. They consisted of two assemblages: silica–pyrite–kaolinite–goethite and Al–goethite–jarosite–alunite (Figure 9 and Figure S1g–j). The tabular and bladed jarosite crystals with Al2O3 content of up to 9 wt.% occur in small cavities in post-pyrrhotite pseudomorphs, together with kaolinite, pyrite, and quartz (Figure 9 and Figure S1m). The ISOS2 usually appears in the immediate vicinity of the open fractures, constituting pathways for fluid circulations (Figure S1f: single Fe stage; Figure S1g–j: two Fe, Al stages).
In summary, the complex progressive oxidative alteration of iron sulfides in migmatitic gneiss can be simplified to a sequence of pseudomorphic replacements: pyrrhotite → mackinawite or amorphous FeS → marcasite → ferric oxides and (oxyhydr)oxides → hydrated ferric sulfates and ferric (oxyhydr)oxides.
Three major post-pyrite oxidative alteration stages, each characterized by a distinct chemical composition of jarosite and alunite, have been identified in the hydrothermal veins (Figure 8). Platy crystals of jarosite represent the earliest stage with Al2O3 content <3%wt. That jarosite co-occurs with subordinate Al–goethite (Figure 9 stages 2b, Figure S1j,k). The crystallization of jarosite required high Fe3+ activity and low pH. Assuming that the K deficiency observed in some of the analyzed jarosites (analyses 1–4 in Table 3) resulted from K substitution by hydronium ions, there must have been local conditions for rapid pyrite oxidation at low availability of alkalis [89,90]. The crystallization of hydronium jarosite occurred recently because this mineral is unstable in terrestrial environments over geological timescales [91].
The intermediate alunite–jarosite solid solution partially replaced jarosite (15–26%wt. Al2O3) during the second oxidative stage. Alunite, Al–jarosite, kaolinite, goethite, lepidocrocite, and silica co-precipitated at that stage. Pseudo-cubic crystals of alunite are commonly intergrown with kaolinite, Al–jarosite, goethite, lepidocrocite, and silica in veinlets that cross-cut migmatitic gneiss. Such a mineral assemblage is indicative of supergene origin [92]. The third-generation jarosite enriched in Al (5–9%wt. Al2O3) locally replaced the second-stage assemblage.

7. Conclusions

Raman imaging and K-means analysis proved helpful in deciphering complex, fine-grained mineral assemblages that originated during a multistage oxidative alteration of pyrrhotite and post-pyrrhotite marcasite in gneisses and of pyrite in hydrothermal veins. Raman high-precision imaging enabled both identification and spatial distribution of intimately intergrown micron-scale minerals due to high spectral resolution. Furthermore, it was possible to distinguish between crystalline and amorphous phases with the same chemical compositions.
A combination of Raman spectroscopy with SEM/EDX and EPMA revealed three primary and consecutive stages of oxidation of sulfides in migmatitic gneisses. During the first stage, related to the kaolinization of feldspars in gneisses, pyrrhotite was replaced by marcasite via intermediate amorphous iron sulfides. Increased oxygen fugacity caused the localized crystallization of either maghemite or ferric (oxyhydr)oxides. Even higher oxygen fugacity and an increase in solution pH during the second stage of alteration resulted in the partial replacement of marcasite by pyrite, followed by the replacement of sulfides by both Fe oxides (hematite, maghemite, magnetite) and ferric (oxyhydr)oxides (goethite, feroxyhyte). The final stage of sulfide oxidative alteration resulted in the predominance of sulfates of the alunite–jarosite series over ferric (oxyhydr)oxides and relicts of Fe sulfides.
Quartz–calcite–pyrite hydrothermal veins were affected by the most recent weathering caused by meteoric water and seasonal changes in temperature and pH. As a result of that weathering, pyrite was oxidized into jarosite-group sulfates and ferric (oxyhydr)oxides (goethite and lepidocrocite).

Supplementary Materials

The following supporting information can be downloaded at: https://www.mdpi.com/article/10.3390/min15010049/s1, Figure S1: BSE images of various grains of different zones: (a) IS, (b–e) ISO with BSE images present: (b) cavity filled by kaolinite and pyrite microcrystals, (c) and (c1) cavity coated over with polycrystalline pyrite rim, (d) pseudomorphic grains with kaolinite replaced marcasite along cleavage planes and (e) cavity filling by automorphic microcrystals of baryte. (f–i) pyrrhotite paedomorphosis (ISOS) located immediate vicinity of more open areas with pathways for hydrothermal fluids with BSE images presenting internal cavities filled with (f) and (f1) kaolinite, alunite microcrystals and pseudocubic habit on the disulfide relicts, (g–j) polycrystalline pyrite and a mixture of kaolinite, jarosite, Al-jarosite, alunite with fine-grained silica as well as (k) post-pyrrhotite pseudomorphs, kaolinite, and pyrite. (l–m) three main vein-filling stages, including crystallization of jarosite-alunite minerals coexisting with goethite and Al-goethite. * Kln: kaolinite, Gth: goethite, Jrs: jarosite, Alu: alunite, Mrc: marcasite, Py: pyrite, Chl: chlorite, Brt: baryte.

Author Contributions

Conceptualization, R.W. and J.J.; methodology, M.D. and R.W.; software, M.D.; validation, M.D., J.J. and R.W.; formal analysis, R.W. and M.D.; investigation, R.W. and M.D.; data curation, R.W. and M.D.; writing—original draft preparation, M.D., R.W. and J.J.; writing—review and editing, M.D., R.W. and J.J.; visualization, M.D.; supervision, M.D., R.W. and J.J.; funding acquisition, J.J. All authors have read and agreed to the published version of the manuscript.

Funding

This research was financially supported by the Statutory Fund of the Institute of Earth Sciences and the Institute of Physics of the University of Silesia.

Data Availability Statement

Data are stored in the cloud and stuck as a backup.

Acknowledgments

We are grateful to Tomasz Krzykawski for performing the XRD analyses.

Conflicts of Interest

The authors declare no conflict of interest.

References

  1. Dold, B. Acid rock drainage prediction: A critical review. J. Geochem. Explor. 2017, 172, 120–132. [Google Scholar] [CrossRef]
  2. Blowes, D.W.; Ptacek, C.J.; Jambor, J.L.; Weisener, C.G. 9.05—The Geochemistry of Acid Mine Drainage. In Treatise on Geochemistry; Holland, H.D., Turekian, K.K., Eds.; Pergamon: Oxford, UK, 2003; pp. 149–204. ISBN 978-0-08-043751-4. [Google Scholar]
  3. Moncur, M.C.; Jambor, J.L.; Ptacek, C.J.; Blowes, D.W. Mine drainage from the weathering of sulfide minerals and magnetite. Appl. Geochem. 2009, 24, 2362–2373. [Google Scholar] [CrossRef]
  4. Cabri, L.J.; Vaughan, D. Modern Approaches to Ore and Environmental Mineralogy; Short Course Series (Mineralogical Association of Canada); Mineralogical Association of Canada: Ottawa, ON, Canada, 1998; Volume 27, ISBN 978-0-921294-00-9. [Google Scholar]
  5. Jambor, J.L.; Blowes, D.W.; Ritchie, A.I.M. (Eds.) Environmental Aspects of Mine Wastes; Short Course Series; Mineralogical Association of Canada: Ottawa, ON, Canada, 2003; ISBN 978-0-921294-31-3. [Google Scholar]
  6. Belzile, N.; Chen, Y.-W.; Cai, M.-F.; Li, Y. A review on pyrrhotite oxidation. J. Geochem. Explor. 2004, 84, 65–76. [Google Scholar] [CrossRef]
  7. Jamieson, H.E. Geochemistry and Mineralogy of Solid Mine Waste: Essential Knowledge for Predicting Environmental Impact. Elements 2011, 7, 381–386. [Google Scholar] [CrossRef]
  8. Ss En 12620 2008 Specification For Aggregates For Concrete PDF Free | PDF. Available online: https://www.scribd.com/document/587261300/pdfcoffee-com-ss-en-12620-2008-specification-for-aggregates-for-concrete-pdf-free (accessed on 30 December 2024).
  9. EN 12620:2002+A1:2008; Aggregates for Concrete. European Committee for Standardization: Brussels, Belgium, 2008. Available online: https://standards.iteh.ai/catalog/standards/cen/27c8e34e-993f-4b1a-989f-8a3263dbe9fb/en-12620-2002a1-2008 (accessed on 30 December 2024).
  10. Marcelino, A.; Calixto, J.; Gumieri, A.; Ferreira, M.; Caldeira, C.; Silva, M.; Costa, A. Evaluation of pyrite and pyrrhotite in concretes. Rev. Ibracon Estrut. E Mater. 2016, 9, 484–493. [Google Scholar] [CrossRef]
  11. Courtin-Nomade, A.; Grosbois, C.; Marcus, M.A.; Fakra, S.C.; Beny, J.-M.; Foster, A.L. The weathering of a sulfide orebody: Speciation and fate of some potential contaminants. Can. Mineral. 2009, 47, 493–508. [Google Scholar] [CrossRef]
  12. Hayes, S.M.; Root, R.A.; Perdrial, N.; Maier, R.; Chorover, J. Surficial weathering of iron sulfide mine tailings under semi-arid climate. Geochim. Et Cosmochim. Acta 2014, 141, 240–257. [Google Scholar] [CrossRef]
  13. Lara, R.H.; Monroy, M.G.; Mallet, M.; Dossot, M.; González, M.A.; Cruz, R. An experimental study of iron sulfides weathering under simulated calcareous soil conditions. Environ. Earth Sci. 2015, 73, 1849–1869. [Google Scholar] [CrossRef]
  14. Gu, X.; Heaney, P.J.; Reis, F.D.A.A.; Brantley, S.L. Deep abiotic weathering of pyrite. Science 2020, 370, eabb8092. [Google Scholar] [CrossRef]
  15. Nasdala, L.; Smith, D.; Kaindl, R.; Ziemann, M. Raman spectroscopy: Analytical perspectives in mineralogical research. In EMU Notes in Mineralogy; Eötvös University Press: Budapest, Hungary, 2004; Volume 12, pp. 281–343. ISBN 978-963-463-662-5. [Google Scholar]
  16. Mazur, S.; Aleksandrowski, P.; Kryza, R.; Oberc-Dziedzic, T. The Variscan Orogen in Poland. Geol. Q. 2006, 50, 89–118. [Google Scholar]
  17. Kryza, R. Migmatization in gneisses of the northern part of the Sowie Góry, Sudetes. Geol. Sudet. 1981, 16, 7–100. [Google Scholar]
  18. Ilnicki, S.; Nejbert, K.; Pieczka, A.; Szełęg, E.; Turniak, K.; Szuszkiewicz, A.; Łodziński, M.; Banach, M.; Michałowski, P.; Rożniak, R. Metamorphic record of retrogressed eclogites from the Piława Górna (Sowie Góry block, SW Poland). Mineral. Pol.—Spec. Pap. 2011, 38, 103–104. [Google Scholar]
  19. Muszer, A.; Szuszkiewicz, A.; Łobos, K. New Occurrence of Clausthalite (PbSe) in the Sudetes (SW Poland). Mineralogia 2006, 37, 123–132. [Google Scholar] [CrossRef]
  20. Pieczka, A.; Łodziński, M.; Szełęg, E.; Ilnicki, S.; Nejbert, K.; Szuszkiewicz, A.; Turniak, K.; Banach, M.; Michałowski, P.; Różniak, R. The Sowie Mts. pegmatites (Lower Silesia, SW Poland): A current knowledge. Acta Mineral.–Petrogr. 2012, 7, 105–106. [Google Scholar]
  21. Piestrzyński, A.; Kowalik, K. Argentopentlandite from barite vein in Zagórze Śląskie, Lower Silesia; a first occurrence in Poland. Mineral. Pol. 2015, 45, 13–25. [Google Scholar] [CrossRef]
  22. Wala, A.; Wolska, A.; Jeleń, P. Stary Julianów Fault in Sowie Góry gneiss complex and geological situation in the place of its occurrence. (Wałbrzych Foothills, Central Sudetes, Southern Poland. Biul. Panstw. Inst. Geol. 2015, 463, 77–116. [Google Scholar] [CrossRef]
  23. Pieczka, A.; Szuszkiewicz, A.; Szełęg, E.; Janeczek, J.; Nejbert, K. Granitic pegmatites of the Polish part of the Sudetes (NE Bohemian massif, SW Poland). In Fieldtrip Guidebook, Proceedings of the 7th International Symposium on Granitic Pegmatites, Książ, Poland, 17–19 June 2015; PEG: Książ, Poland, 2015; pp. 73–103. [Google Scholar]
  24. Turniak, K.; Pieczka, A.; Kennedy, A.K.; Szełęg, E.; Ilnicki, S.; Nejbert, K.; Szuszkiewicz, A. Crystallisation age of the Julianna pegmatite system (Góry Sowie Block, NE margin of the Bohemian massif): Evidence from U-Th-Pb SHRIMP monazite and CHIME uraninite studies. In Fieldtrip Guidebook, Proceedings of the 7th International Symposium on Granitic Pegmatites, Książ, Poland, 17–19 June 2015; PEG: Książ, Poland, 2015; pp. 111–112. [Google Scholar]
  25. Muller, A.; Szuszkiewicz, A.; Ilnicki, S.; Nejbert, K. Quartz chemistry of the Julianna pegmatites and their wall rocks, Piława Górna, Poland: Implications for the origin of pegmatite melts. In Abstracts, Proceedings of the 8th International Symposium on Granitic Pegmatites, PEG2017, Kristiansand, Norway, 13–15 June 2017; Norsk Geologisk Forening: Trondheim, Norway, 2017; pp. 84–88. [Google Scholar]
  26. Nejbert, K.; Ilnicki, S.; Anczkiewicz, R.; Pieczka, A.; Szełęg, E.; Szuszkiewicz, A.; Turniak, K. Geochronological constraints on metamorphism of eclogites from Piława Górna (Góry Sowie block, Sudetes). Mineral. Spec. Pap. 2013, 41, 66. [Google Scholar]
  27. Szuszkiewicz, A.; Szełęg, E.; Pieczka, A.; Ilnicki, S.; Nejbert, K.; Turniak, K.; Banach, M.; Łodziński, M.; Różniak, R.; Michałowski, P. The Julianna pegmatite vein system at the Piława Górna Mine, Góry Sowie Block, SW Poland—Preliminary data on geology and descriptive mineralogy. Geol. Q. 2013, 57, 467–484. [Google Scholar] [CrossRef]
  28. Xi, S.; Zhang, X.; Luan, Z.; Du, Z.; Li, L.; Liang, Z.; Lian, C.; Yan, J. Micro-Raman Study of Thermal Transformations of Sulfide and Oxysalt Minerals Based on the Heat Induced by Laser. Minerals 2019, 9, 751. [Google Scholar] [CrossRef]
  29. Weber, I.; Böttger, U.; Pavlov, S.G.; Hübers, H.-W.; Hiesinger, H.; Jessberger, E.K. Laser alteration on iron sulfides under various environmental conditions. J. Raman Spectrosc. 2017, 48, 1509–1517. [Google Scholar] [CrossRef]
  30. Mendili, Y.E.; Abdelouas, A.; Hajj, H.E.; Bardeau, J.-F. Phase transitions of iron sulphides formed by steel microbial corrosion. RSC Adv. 2013, 3, 26343–26351. [Google Scholar] [CrossRef]
  31. Arnold, R.G. Range in composition and structure of 82 natural terrestrial pyrrhotite. Can. Mineral. 1967, 31–50. [Google Scholar]
  32. Qian, G.; Xia, F.; Brugger, J.; Skinner, W.M.; Bei, J.; Chen, G.; Pring, A. Replacement of pyrrhotite by pyrite and marcasite under hydrothermal conditions up to 220 °C: An experimental study of reaction textures and mechanisms. Am. Mineral. 2011, 96, 1878–1893. [Google Scholar] [CrossRef]
  33. Kontny, A.; Friedrich, G.; Behr, H.J.; Wall, H.; Horn, E.E.; Möller, P.; Zulauf, G. Formation of ore minerals in metamorphic rocks of the German continental deep drilling site (KTB). J. Geophys. Res. Solid Earth 1997, 102, 18323–18336. [Google Scholar] [CrossRef]
  34. Kontny, A.; de Wall, H.; Sharp, T.G.; Pósfai, M. Mineralogy and magnetic behavior of pyrrhotite from a 260 °C section at the KTB drilling site, Germany. Am. Mineral. 2000, 85, 1416–1427. [Google Scholar] [CrossRef]
  35. Yuan, B.; Luan, W.; Tu, S. One-step synthesis of cubic FeS2 and flower-like FeSe2 particles by a solvothermal reduction process. Dalton Trans. 2011, 41, 772–776. [Google Scholar] [CrossRef]
  36. Teo, M.Y.C.; Kulinich, S.A.; Plaksin, O.A.; Zhu, A.L. Photoinduced Structural Conversions of Transition Metal Chalcogenide Materials. J. Phys. Chem. A 2010, 114, 4174–4180. [Google Scholar] [CrossRef]
  37. Bourdoiseau, J.-A.; Jeannin, M.; Sabot, R.; Rémazeilles, C.; Refait, P. Characterisation of mackinawite by Raman spectroscopy: Effects of crystallisation, drying and oxidation. Corros. Sci. 2008, 50, 3247–3255. [Google Scholar] [CrossRef]
  38. Zhang, W.; Young, D.; Brown, B.; Shafer, C.; Lu, F.; Anyanwu, E.; Singer, M. An in-situ Raman study on the oxidation of mackinawite as a corrosion product layer formed on mild steel in marginally sour environments. Corros. Sci. 2021, 188, 109516. [Google Scholar] [CrossRef]
  39. Hansson, E.B.; Odziemkowski, M.S.; Gillham, R.W. Formation of poorly crystalline iron monosulfides: Surface redox reactions on high purity iron, spectroelectrochemical studies. Corros. Sci. 2006, 48, 3767–3783. [Google Scholar] [CrossRef]
  40. Pineau, S.; Sabot, R.; Quillet, L.; Jeannin, M.; Caplat, C.; Dupont-Morral, I.; Refait, P. Formation of the Fe(II-III) hydroxysulphate green rust during marine corrosion of steel associated to molecular detection of dissimilatory sulphite-reductase. Corros. Sci. 2008, 50, 1099–1111. [Google Scholar] [CrossRef]
  41. Mendili, Y.E.; Minisini, B.; Abdelouas, A.; Bardeau, J.-F. Assignment of Raman-active vibrational modes of tetragonal mackinawite: Raman investigations and ab initio calculations. RSC Adv. 2014, 4, 25827–25834. [Google Scholar] [CrossRef]
  42. Sweeney, R.E.; Kaplan, I.R. Pyrite Framboid Formation; Laboratory Synthesis and Marine Sediments. Econ. Geol. 1973, 68, 618–634. [Google Scholar] [CrossRef]
  43. Rickard, D.T. The chemistry of iron sulphide formation at low temperatures. Stockh. Contrib. Geol. 1969, 20, 67–95. [Google Scholar]
  44. Mendili, Y.E.; Abdelouas, A.; Bardeau, J.-F. Insight into the mechanism of carbon steel corrosion under aerobic and anaerobic conditions. Phys. Chem. Chem. Phys. 2013, 15, 9197–9204. [Google Scholar] [CrossRef]
  45. Kergourlay, F.; Rémazeilles, C.; Neff, D.; Foy, E.; Conforto, E.; Guilminot, E.; Reguer, S.; Dillmann, P.; Nicot, F.; Mielcarek, F.; et al. Mechanisms of the dechlorination of iron archaeological artefacts extracted from seawater. Corros. Sci. 2011, 53, 2474–2483. [Google Scholar] [CrossRef]
  46. Müller, K.; Ciminelli, V.S.T.; Dantas, M.S.S.; Willscher, S. A comparative study of As(III) and As(V) in aqueous solutions and adsorbed on iron oxy-hydroxides by Raman spectroscopy. Water Res. 2010, 44, 5660–5672. [Google Scholar] [CrossRef]
  47. Ferguson, G.A.; Hass, M. Magnetic structure and vacancy distribution in g-Fe2O3 by neutron diffraction. Phys. Rev. 1958, 112, 1130–1131. [Google Scholar] [CrossRef]
  48. White, W.B.; DeAngelis, B.A. Interpretation of the vibrational spectra of spinels. Spectrochim. Acta Part A Mol. Spectrosc. 1967, 23, 985–995. [Google Scholar] [CrossRef]
  49. Verble, J.L. Temperature-dependent light-scattering studies of the Verwey transition and electronic disorder in magnetite. Phys. Rev. B 1974, 9, 5236–5248. [Google Scholar] [CrossRef]
  50. Berner, R.A. Iron Sulfides Formed from Aqueous Solution at Low Temperatures and Atmospheric Pressure. J. Geol. 1964, 72, 293–306. [Google Scholar] [CrossRef]
  51. Benning, L.G.; Wilkin, R.T.; Barnes, H.L. Reaction pathways in the Fe–S system below 100 °C. Chem. Geol. 2000, 167, 25–51. [Google Scholar] [CrossRef]
  52. Bourdoiseau, J.-A.; Jeannin, M.; Rémazeilles, C.; Sabot, R.; Refait, P. The transformation of mackinawite into greigite studied by Raman spectroscopy. J. Raman Spectrosc. 2011, 42, 496–504. [Google Scholar] [CrossRef]
  53. Maubec, N.; Lahfid, A.; Lerouge, C.; Wille, G.; Michel, K. Characterization of alunite supergroup minerals by Raman spectroscopy. Spectrochim. Acta Part A: Mol. Biomol. Spectrosc. 2012, 96, 925–939. [Google Scholar] [CrossRef] [PubMed]
  54. Rudolph, W.W.; Mason, R. Study of Aqueous Al2(SO4)3 Solution under Hydrothermal Conditions: Sulfate Ion Pairing, Hydrolysis, and Formation of Hydronium Alunite. J. Solut. Chem. 2001, 30, 527–548. [Google Scholar] [CrossRef]
  55. Frost, R.L.; Wills, R.-A.; Weier, M.L.; Martens, W.; Theo Kloprogge, J. A Raman spectroscopic study of alunites. J. Mol. Struct. 2006, 785, 123–132. [Google Scholar] [CrossRef]
  56. Toumi, M.; Tlili, A. Rietveld refinement and vibrational spectroscopic study of alunite from el Gnater, central Tunisia. Russ. J. Inorg. Chem. 2008, 53, 1845–1853. [Google Scholar] [CrossRef]
  57. Chamritski, I.; Burns, G. Infrared- and Raman-Active Phonons of Magnetite, Maghemite, and Hematite:  A Computer Simulation and Spectroscopic Study. J. Phys. Chem. B 2005, 109, 4965–4968. [Google Scholar] [CrossRef]
  58. Bersani, D.; Lottici, P.P.; Montenero, A. Micro-Raman investigation of iron oxide films and powders produced by sol–gel syntheses. J. Raman Spectrosc. 1999, 30, 355–360. [Google Scholar] [CrossRef]
  59. Gasparov, L.V.; Tanner, D.B.; Romero, D.B.; Berger, H.; Margaritondo, G.; Forró, L. Infrared and Raman studies of the Verwey transition in magnetite. Phys. Rev. B 2000, 62, 7939–7944. [Google Scholar] [CrossRef]
  60. Jubb, A.M.; Allen, H.C. Vibrational Spectroscopic Characterization of Hematite, Maghemite, and Magnetite Thin Films Produced by Vapor Deposition. ACS Appl. Mater. Interfaces 2010, 10, 2804–2812. [Google Scholar] [CrossRef]
  61. de Faria, D.L.A.; Venâncio Silva, S.; de Oliveira, M.T. Raman microspectroscopy of some iron oxides and oxyhydroxides. J. Raman Spectrosc. 1998, 28, 873–878. [Google Scholar] [CrossRef]
  62. Das, S.; Hendry, M.J. Application of Raman spectroscopy to identify iron minerals commonly found in mine wastes. Chem. Geol. 2011, 3–4, 101–108. [Google Scholar] [CrossRef]
  63. Oh, S.J.; Cook, D.C.; Townsend, H.E. Characterization of Iron Oxides Commonly Formed as Corrosion Products on Steel. Hyperfine Interact. 1998, 112, 59–66. [Google Scholar] [CrossRef]
  64. Dünnwald, J.; Otto, A. An investigation of phase transitions in rust layers using Raman spectroscopy. Corros. Sci. 1989, 29, 1167–1176. [Google Scholar] [CrossRef]
  65. Hanesch, M. Raman spectroscopy of iron oxides and (oxy)hydroxides at low laser power and possible applications in environmental magnetic studies. Geophys. J. Int. 2009, 177, 941–948. [Google Scholar] [CrossRef]
  66. Ohtsuka, T.; Kubo, K.; Sato, N. Raman Spectroscopy of Thin Corrosion Films on Iron at 100 to 150 C in Air. Corrosion 1986, 42, 476–481. [Google Scholar] [CrossRef]
  67. Liu, H.; Chen, T.; Zou, X.; Qing, C.; Frost Ray, L. Effect of Al content on the structure of Al-substituted goethite: A micro-Raman spectroscopic study. J. Raman Spectrosc. 2013, 44, 1609–1614. [Google Scholar] [CrossRef]
  68. van der Weerd, J.; Rehren, T.; Firth, S.; Clark, R.J.H. Identification of iron oxide impurities in earliest industrial-scale processed platinum. Mater. Charact. 2004, 53, 63–70. [Google Scholar] [CrossRef]
  69. Nie, X.; Li, X.; Du, C.; Huang, Y.; He, D. Characterization of corrosion products formed on the surface of carbon steel by Raman spectroscopy. J. Raman Spectrosc. 2009, 40, 76–79. [Google Scholar] [CrossRef]
  70. Frost Ray, L.; Rachael-Anne, W.; Weier Matt, L. Martens Wayde Comparison of the Raman spectra of natural and synthetic K- and Na-jarosites at 298 and 77 K. J. Raman Spectrosc. 2005, 36, 435–444. [Google Scholar] [CrossRef]
  71. Sasaki, K.; Tanaike, O.; Konno, H. Distinction of jarosite-group compounds by Raman spectroscopy. Can. Mineral. 1998, 36, 1225–1235. [Google Scholar]
  72. Stoffregen, R.E.; Alpers, C.N.; Jambor, J.L. Alunite-Jarosite Crystallography, Thermodynamics, and Geochronology. Rev. Mineral. Geochem. 2000, 40, 453–479. [Google Scholar] [CrossRef]
  73. Frost, R.L.; Wills, R.-A.; Weier, M.L.; Martens, W.; Mills, S. A Raman spectroscopic study of selected natural jarosites. Spectrochim. Acta Part A Mol. Biomol. Spectrosc. 2006, 63, 1–8. [Google Scholar] [CrossRef] [PubMed]
  74. Härtig, C.; Brand, P.; Bohmhammel, K. Fe-Al-Isomorphie and Strukturwasser in Kristallen vom Jarosit-Alunit-Typ. Z. Anorg. Allg. Chem. 1984, 508, 159–164. [Google Scholar] [CrossRef]
  75. Kubisz, J. Studies on synthetic alkali–hydronium jarosites. I. Synthesis of jarosite and natrojarosite. Mineral. Pol. 1970, 1, 47–57. [Google Scholar]
  76. Murphy, P.J.; Smith, A.M.L.; Hudson-Edwards, K.A.; Dubbin, W.E.; Wright, K. Raman and IR spectroscopic studies of alunite-supergroup compounds containing Al, Cr3+, Fe3+ and V3+ at the B site. Can. Mineral. 2009, 47, 663–681. [Google Scholar] [CrossRef]
  77. Li, S.; Hihara, L.H. A Micro-Raman Spectroscopic Study of Marine Atmospheric Corrosion of Carbon Steel: The Effect of Akaganeite. J. Electrochem. Soc. 2015, 162, C495. [Google Scholar] [CrossRef]
  78. Murowchick, J.B. Marcasite inversion and the petrographic determination of pyrite ancestry. Econ. Geol. 1992, 87, 1141–1152. [Google Scholar] [CrossRef]
  79. Qian, G.; Brugger, J.; Skinner, W.; Chen, G.; Pring, A. An experimental study of the mechanism of the replacement of magnetite by pyrite up to 300 degrees C. Geochim. Cosmochim. Acta 2010, 74, 5610–5630. [Google Scholar] [CrossRef]
  80. Rottier, B.; Kouzmanov, K.; Wälle, M.; Bendezú, R.; Fontboté, L. Sulfide Replacement Processes Revealed by Textural and LA-ICP-MS Trace Element Analyses: Example from the Early Mineralization Stages at Cerro de Pasco, Peru. Econ. Geol. 2016, 111, 1347–1367. [Google Scholar] [CrossRef]
  81. Drobner, E.; Huber, H.; Wächtershäuser, G.; Rose, D.; Stetter, K.O. Pyrite formation linked with hydrogen evolution under anaerobic conditions. Nature 1990, 346, 742–744. [Google Scholar] [CrossRef]
  82. Lennie, A.; Vaughan, D.J. Spectroscopic studies of iron sulfide formation and phase relations at low temperatures. Geochem. Soc. Spec. Publ. 1996, 5, 117–131. [Google Scholar]
  83. Jolivet, J.-P.; Tronc, E.; Chanéac, C. Iron oxides: From molecular clusters to solid. A nice example of chemical versatility. Comptes Rendus Geosci. 2006, 338, 488–497. [Google Scholar] [CrossRef]
  84. Jolivet, J.-P.; Chanéac, C.; Tronc, E. Iron oxide chemistry. From molecular clusters to extended solid networks. Chem. Commun. 2004, 481–483. [Google Scholar] [CrossRef]
  85. Sobanska, S.; Deneele, D.; Barbillat, J.; Ledésert, B. Natural weathering of slags from primary Pb–Zn smelting as evidenced by Raman microspectroscopy. Appl. Geochem. 2016, 64, 107–117. [Google Scholar] [CrossRef]
  86. Andrés, M.P.A.; López, R.P.; Ross, G.R.; Illera, V.; Cama, J.; Cotte, M.; Tucoulou, R. Analysis of the iron coatings formed during marcasite and arsenopyrite oxidation at neutral-alkaline conditions. Geol. Acta 2013, 11, 465–481. [Google Scholar]
  87. Rye, R.O. A review of the stable-isotope geochemistry of sulfate minerals in selected igneous environments and related hydrothermal systems. Chem. Geol. 2005, 215, 5–36. [Google Scholar] [CrossRef]
  88. Georgieva, S.; Velinova, N. Alunite from the advanced argillic alterations in the Chelopech high-sulphidation epithermal Cu-Au deposit, Bulgaria: Chemistry, morphology and genetic significance. Geochem. Mineral. Petrol. 2012, 49, 17–31. [Google Scholar]
  89. Kubisz, J. Natural hydronium jarosites. Bull. L’académie Pol. Sci. 1961, 195–200. [Google Scholar]
  90. Dutrizac, J.E.; Jambor, J.L. Jarosites and their application in hydrometallurgy. In Sulfate Minerals, Crystallography, Geochemistry, and Environmental Significance; Reviews in Mineralogy and Geochemistry; GeoScienceWorld: McLean, VA, USA, 2000; Volume 40, pp. 405–443. [Google Scholar]
  91. Desborough, G.A.; Smith, K.S.; Lowers, H.A.; Swayze, G.A.; Hammarstrom, J.M.; Diehl, S.F.; Leinz, R.W.; Driscoll, R.L. Mineralogical and chemical characteristics of some natural jarosites. Geochim. Cosmochim. Acta 2010, 74, 1041–1056. [Google Scholar] [CrossRef]
  92. Rye, R.O.; Bethke, P.M.; Wasserman, M.D. The stable isotope geochemistry of acid sulfate alteration. Econ. Geol. 1992, 87, 225–262. [Google Scholar] [CrossRef]
Disclaimer/Publisher’s Note: The statements, opinions and data contained in all publications are solely those of the individual author(s) and contributor(s) and not of MDPI and/or the editor(s). MDPI and/or the editor(s) disclaim responsibility for any injury to people or property resulting from any ideas, methods, instructions or products referred to in the content.

