Article

Estimating Content of Rare Earth Elements in Marine Sediments Using Hyperspectral Technology: Experiment and Method Series

1
Laboratory of Marine Geology and Geophysics, First Institute of Oceanography, Ministry of Natural Resources, Qingdao 266061, China
2
Key Laboratory of Marine Geology and Metallogeny, First Institute of Oceanography, Ministry of Natural Resources, Qingdao 266061, China
3
Laboratory for Marine Mineral Resources, Qingdao Marine Science and Technology Center, Qingdao 266237, China
4
Laboratory for Marine Geology, Qingdao Marine Science and Technology Center, Qingdao 266237, China
5
Suzhou Institute of Biomedical Engineering and Technology, Chinese Academy of Sciences, Suzhou 215163, China
6
Key Laboratory of Deep Sea Mineral Resource Development, Shandong (Preparatory), First Institute of Oceanography, Ministry of Natural Resources, Qingdao 266061, China
7
The First Company of China Eighth Engineering Bureau Ltd., Jinan 250000, China
*
Authors to whom correspondence should be addressed.
Minerals 2025, 15(11), 1102; https://doi.org/10.3390/min15111102
Submission received: 16 September 2025 / Revised: 20 October 2025 / Accepted: 21 October 2025 / Published: 23 October 2025

Abstract

Marine sediments enriched with rare earth elements (REEs) serve as a significant reservoir, particularly for heavy REEs. Conventional lab-based REE exploration restricts rapid and large-scale assessment, whereas hyperspectral imaging provides a promising approach for quantitative evaluation. This study evaluates the capacity of hyperspectral data for the quantitative determination of REEs in marine sediments. A total of 53 samples from various locations were analyzed to determine their chemical composition and spectral characteristics within the 380–1000 nm range under natural light. The influence of surface conditions on spectral integrity was evaluated, and multiple preprocessing and spectral feature extraction methods were applied to enhance data reliability. This study proposes a novel approach, termed Feature Importance within Pearson Correlation Coefficient-Based High-Correlation Spectral Range (PCCR-FI), designed for the identification of characteristic spectral bands associated with REEs. Machine learning models were subsequently constructed to estimate REE concentrations, and the following key findings were observed: (a) technical adjustments effectively addressed variations in sediment surface conditions, ensuring data reliability. (b) The PCCR-FI technique identified characteristic REEs spectral bands, enhancing processing efficiency and prediction accuracy. (c) The integration of the reciprocal logarithmic first derivative (TLOG-FD) technique with a multilayer perceptron (MLP) model, termed TLOG-FD-MLP, efficiently captured critical spectral features, resulting in improved prediction accuracy. For light REEs, the model achieved coefficient of determination (R2) values exceeding 0.60 and relative performance deviation (RPD) values exceeding 1.60, with some elements demonstrating R2 values as high as 0.81 with RPD values surpassing 2.00. Furthermore, several heavy REEs exhibited moderate prediction performance, with R2 values consistently exceeding 0.60. When considering the total REE content, an R2 of 0.73 and an RPD of 1.97 were achieved. These findings demonstrate the use of hyperspectral imaging as a viable tool for quantitative evaluation of REE concentrations in marine sediments, providing valuable guidance for resource mapping and the exploration of seafloor polymetallic deposits.

1. Introduction

Rare earth elements (REEs) play a vital role in economic development, technological advancement, and military applications. The identification of REE deposits in the Pacific Ocean in 2011 [1] significantly increased global attention toward the investigation of deep-sea REE resources. Sedimentary deposits within the central Indian Ocean, Southeast Pacific, and Western Pacific regions are particularly enriched with REEs, especially heavy variants, occurring at concentrations substantially higher than those commonly found in terrestrial deposits [2]. Geochemists further subdivide REEs into light rare earth elements (LREE: La-Eu) and heavy rare earth elements (HREE: Gd-Lu, and Y), each demonstrating distinct geochemical behaviors [3]. Current exploration of deep-sea REE resources typically employs an integrated approach combining sediment core sampling with geophysical methods, such as shallow stratigraphic profiling. Quantitative evaluation of REE content is conventionally conducted through laboratory analysis of core samples, complemented by stratigraphic data to estimate broader resource distribution [4]. Technological platforms, including deep-sea towed vehicles, remotely operated vehicles (ROVs), autonomous underwater vehicles (AUVs), and human-occupied vehicles (HOVs), have been successfully employed to facilitate in situ sediment parameter measurements [5,6]. Laboratory determination of rare earth element concentrations primarily relies on Inductively Coupled Plasma Mass Spectrometry (ICP-MS) and X-ray Fluorescence (XRF) spectroscopy [7,8,9]. These methods are often combined with stratigraphic data to extrapolate the large-scale distribution of REE resources. Although they enable precise measurement of REE in sediments, the analytical procedures are complex and restricted to laboratory environments, limiting their applicability for rapid on-site analysis. It should be indicated that both laboratory-based and platform-assisted in situ assessments rely on point-based sampling, which ensures accurate geolocation and reliable measurement precision. However, such station-based approaches inherently constrain spatial resolution across horizontal scales, requiring significant time for each sampling event, while involving high operational costs. Generally, these methods are well-suited for detailed research and verification purposes but remain impractical for comprehensive scanning or rapid, large-scale assessments.
Hyperspectral detection technology, distinguished by its high data density, fine spatial resolution, and rapid scanning capability, has been widely applied across various fields such as agriculture, environmental assessment, and mineral prospecting. The integration of this technique with unmanned aerial vehicles (UAVs) significantly extended its functional applications [10,11]. In the agricultural field, it facilitates the monitoring of crop biochemical parameters, including concentrations of active compounds, chlorophyll levels, and nutrient conditions throughout growth stages [12,13,14]. Environmental applications primarily involve the estimation of heavy metal ion concentrations in soils and salinized land areas using hyperspectral data [15,16,17,18,19], along with quantitative estimations of soil organic matter content [20]. In the context of mineral resource exploration, hyperspectral imaging has proven effective for the identification and evaluation of terrestrial rare earth element deposits and other economically significant minerals [21,22,23,24,25]. It provides a rapid, cost-effective, and efficient means of acquiring and analyzing resource-related data, overcoming the limitation of laboratory-exclusive quantification of REE. Furthermore, it holds significant potential for rapid assessment of marine sediments.
A range of modeling techniques has been employed for the effective quantitative elemental determination using hyperspectral datasets, including partial least squares regression (PLSR), support vector regression (SVR), random forest (RF), and extreme learning machine (ELM). These approaches have demonstrated strong applicability in the assessment of terrestrial mineral resources and monitoring of ecological conditions [26,27]. Machine learning algorithms offer significant advantages for hyperspectral-based mineral evaluation by facilitating rapid, large-scale, and precise quantitative assessments [25,28,29]. In addition to direct estimation based on spectral data, indirect predictions can also be achieved by using inter-element relationships, yielding reliable estimation performance [30]. Furthermore, emerging modeling strategies such as self-attention-based neural networks (SCSANet), deep learning frameworks, and geographically weighted gradient boosting algorithms (GW-XGBoost) enhanced the ability to simultaneously predict the concentrations of various metals [12,26,31,32]. It is worth noting that the success of such estimation models largely depends on efficient spectral feature extraction and the accurate identification of key wavelength bands. Common hyperspectral preprocessing and feature extraction techniques primarily include first-order derivative (FD), second-order derivative (SD), multiplicative scatter correction (MSC), and continuum removal (CR) [33,34]. Studies have demonstrated that derivative-based techniques are particularly effective in revealing subtle variations within spectral signatures, improving the accuracy of metal content estimation in specific regions [35]. Furthermore, the choice of band selection technique, including correlation analysis or absorption depth evaluation, can significantly influence both the spectral range and the number of extracted features, impacting the accuracy and performance of the estimation. Hence, the appropriate selection of spectral bands remains a critical factor in determining final prediction results.
Currently, marine hyperspectral techniques are primarily employed for monitoring sea surface oil spills, analyzing chlorophyll content, and assessing phytoplankton distributions [36,37,38]. Recent progress regarding underwater hyperspectral imaging has significantly enhanced the ability to capture detailed and high-resolution spectral information from subaqueous environments, marking a significant technological advancement in marine observation systems [39]. Simultaneously, advancements in underwater robotic technologies, including ROVs and AUVs, have provided essential support for high-resolution, rapid seabed observation. Upon integration with hyperspectral sensors, these robotic platforms enable dynamic and fine-scale spectral surveys of the ocean floor [40,41], providing an effective technical means for optical exploration of benthic mineral resources, including polymetallic nodules, crusts, rare earth-enriched sediments, and hydrothermal sulfide deposits.
An experimental framework was developed to assess the feasibility of applying hyperspectral techniques for estimating REE concentrations in marine sediments, taking advantage of their capacity for precise measurement, large-volume data acquisition, and rapid information processing. The current study effectively analyzed the sediment samples from various marine regions, including Antarctica, the Chukchi Sea, and the Bering Sea, for model validation. Each sample was investigated for its chemical composition using inductively coupled plasma mass spectrometry (ICP-MS), while hyperspectral radiance data were collected through the utilization of an imaging spectrometer operating across 380–1000 nm with a spectral resolution of 2.5 nm, under standardized conditions appropriate for subsea applications. The dataset was further processed to investigate the effects of factors such as sample surface flatness, collection angles, sediment texture, and localized shading on the spectral responses. Hyperspectral features associated with REEs were extracted using six distinct effective spectral feature extraction methods. A novel band extraction method, Feature Importance within Pearson Correlation Coefficient-Based High-Correlation Spectral Range (PCCR-FI), was developed, which successfully identified the characteristic spectral bands of REEs. Furthermore, five regression models, PLSR, Extreme Gradient Boosting (XGBoost), MLP, SVR, and RF, were compared to evaluate their accuracy in estimating various REEs, with the optimal model selected based on predictive performance. The TLOG-FD-MLP model demonstrated superior predictive capability for REEs, providing valuable insights into the practical application of hyperspectral techniques for the detection and quantitative assessment of marine rare earth elements.

2. Data and Methods

2.1. Date

(1) Marine sediment samples: This study utilized 53 surface sediment samples collected from marine environments as the experimental dataset. The samples were primarily obtained from regions near Antarctica (70–78° E, 64–69° S), and from the Bering Sea and Chukchi Sea (167–180° W, 56–72° N), using box corers to ensure minimal disturbance and representative sediment collections. The surface sediment samples near Antarctica were collected from water depths ranging between 311 and 3240 m, whereas those from the Bering and Chukchi Seas were obtained from relatively shallower depths of approximately 35 to 1684 m. The sediments primarily comprised gray clayey silt, sandy silt, and their mixtures, along with the presence of some muddy gravel. The sampling locations covered diverse geological settings characterized by variations in sediment sources and water depth conditions. To investigate the application of hyperspectral data for estimating REE content and to develop an effective prediction model, the sediment samples were ground into fine powder (200-mesh) to ensure uniformity, enabling accurate measurement of both REE concentrations and spectral data. The overall procedures for sample testing, analysis, and hyperspectral data acquisition are illustrated in Figure 1.
(2) Laboratory REE Content Analysis: The REEs concentrations in the sediment samples were determined using ICP-MS. In this method, the plasma efficiently ionizes the sample, and the mass spectrometer accurately separates and measures the ions based on their mass-to-charge ratios. Table 1 presents the statistical summary of REE concentrations.
The results show a higher presence of LREEs in the samples, with cerium (Ce) demonstrating the highest mean concentration at 58.37 mg/kg, with relatively lower levels of HREEs. The mean total REE (∑REE) content was determined to be 160.67 mg/kg. All REEs display coefficients of variation (C.V., calculated as the standard deviation divided by the mean) below 1.0, indicating a relatively uniform spatial distribution and minimal impact from anthropogenic activities.
(3) Sample Preparation and Experimental Setup: To evaluate the performance and reliability of hyperspectral technology for estimating elemental content in marine sediments under near-natural conditions, the experimental setup and sample preparation (illustrated in Figure 1b) were designed to ensure a quasi-natural environment. For sample preparation, D-type tubes were utilized to maintain sediment stability and preserve their inherent spatial arrangement, ensuring a uniform surface level across samples. Each container was labeled sequentially, and an aliquot of the chemically analyzed sediment was deposited into its designated contaminant-free container, spreading evenly to form a consistent layer at the bottom (Figure 1b). Hyperspectral data acquisition was performed against a black background to minimize the reflectance interference. A line-scan hyperspectral camera, mounted on a sliding rail system, was used to capture the data (Figure 1c). However, minor instabilities were observed in the setup, attributed to slight vibrations of the rail. Furthermore, the experimental environment posed challenges, including ambient noise interference, shadows cast by containers or neighboring samples, uneven lighting, vibrations from the sliding rail, and variations in the sample-to-sensor distance during data acquisition. Target-specific factors further complicated the setup, including heterogeneity in sediment surface compaction and looseness, variations in surface flatness, minor differences in moisture content, and heterogeneous composition. These effects were exerted by the heterogeneous particle sizes in the background sediments, including micro-nodules, sand grains, and fragments of calcareous fossils, contributing to a non-uniform target background.
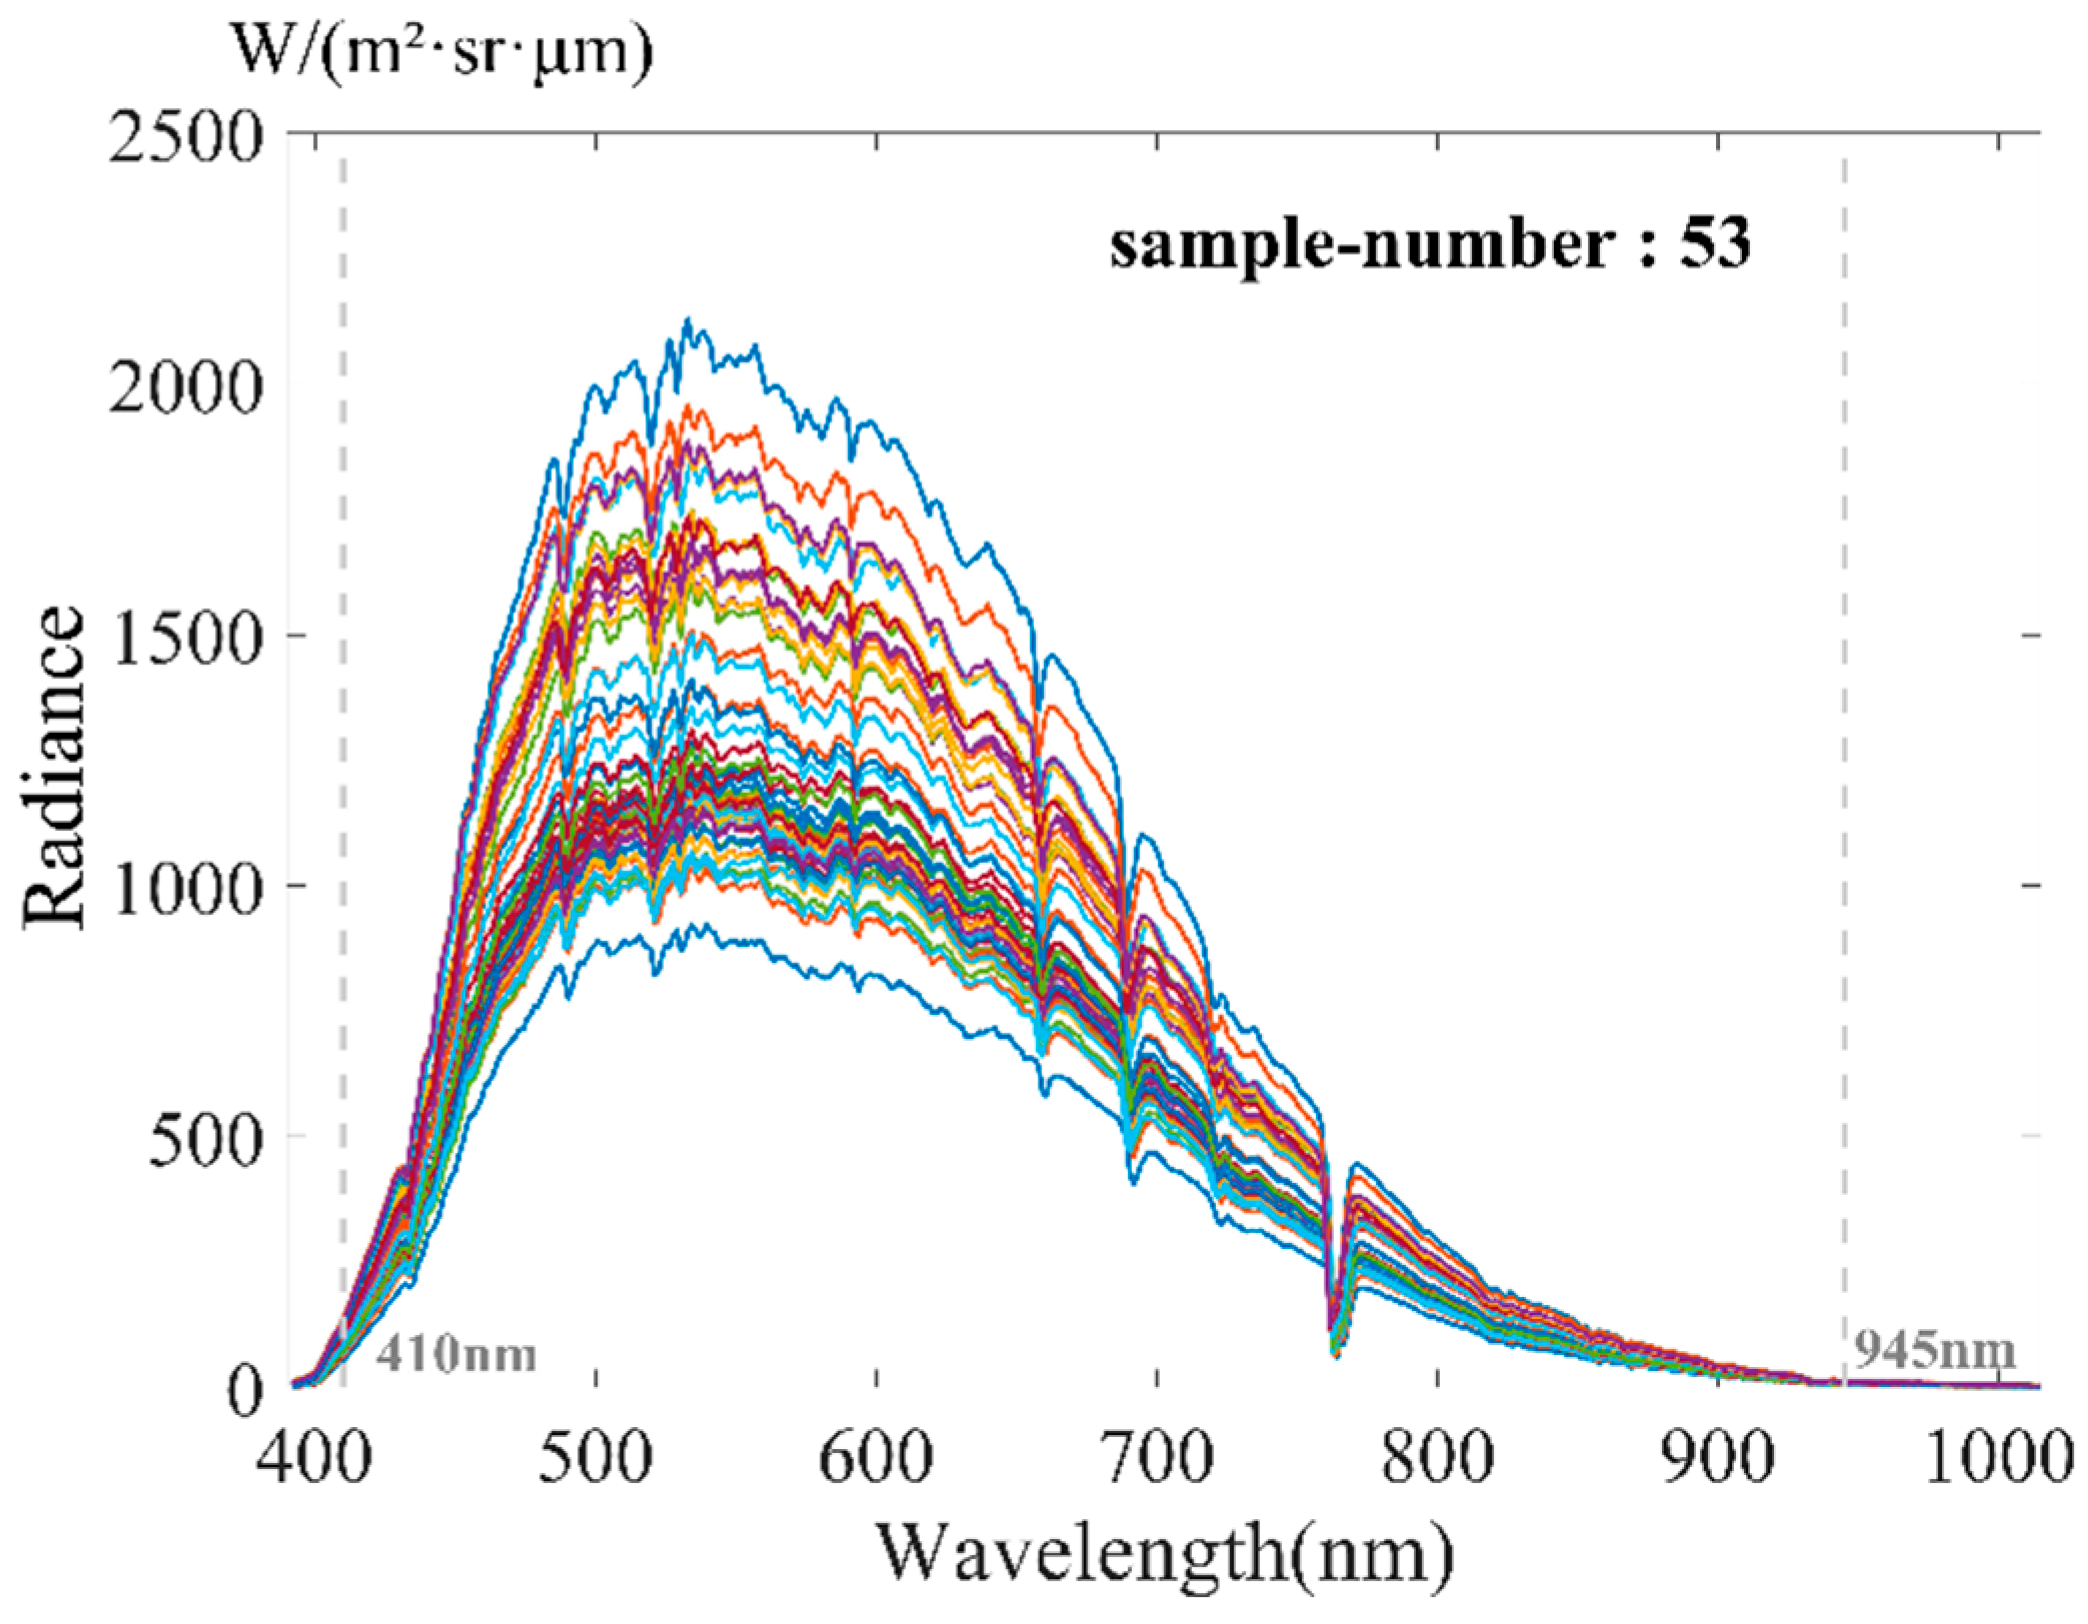
(4) Hyperspectral Data Acquisition: Hyperspectral data were collected using a line-scan hyperspectral camera operating in the spectral range of 380–1000 nm, with a spectral resolution of 2.5 nm across 480 spectral bands. The camera featured a 70° field of view and 1200 vertical pixels. Before data collection, the sediment samples, prepared as described in Section 2.1 (3), were positioned on a black background under ambient natural lighting (Figure 1c). During acquisition, the camera was mounted vertically on a sliding rail system above the samples, which moved at a constant speed of 20 mm/s. The camera operated at 28 frames per second (fps) with an exposure time of 5110 μ s , ensuring that the captured radiance remained within the dynamic range of the camera’s sensor. For assessing the acquisition distance effect on the data quality, the camera-to-sample distance was varied among three settings: 0.15, 0.68, and 1.00 m, corresponding to approximately 57, 13, and 8 hyperspectral data points per cm, respectively. Higher sampling densities improved spatial resolution but generated larger data volumes, whereas lower densities reduced accuracy and increased susceptibility to edge-mixing effects. Considering these trade-offs, the dataset acquired at 0.68 m was selected as the primary dataset, providing an optimal balance between spatial resolution and processing efficiency. At the described distance, each sample included over 20 × 20 spatial data points (with 25 mm inner diameter of the sample containers), with each point comprising 480 spectral bands. Radiance values across the dataset varied from less than 20 W / ( m 2 · s r · μ m ) to over 3000 W / ( m 2 · s r · μ m ) , with the lowest values predominantly observed at the spectral range boundaries.
Hyperspectral data were collected at close range (<1 m) from the samples. At this distance, the effects of atmospheric scattering, absorption, and aerosols are negligible, ensuring that the sensor-recorded radiance primarily originates from the target and is solely influenced by the controlled lighting conditions. Furthermore, in deep-sea environments, hyperspectral measurements are strongly affected by light absorption in water, resulting in low radiance values. Converting these low signals to reflectance using standard white or gray reference panels could introduce substantial relative errors. Therefore, this study employed radiance data directly to estimate REE concentrations in sediments, demonstrating the potential of hyperspectral techniques for REE assessment in marine sediments.

2.2. Workflow

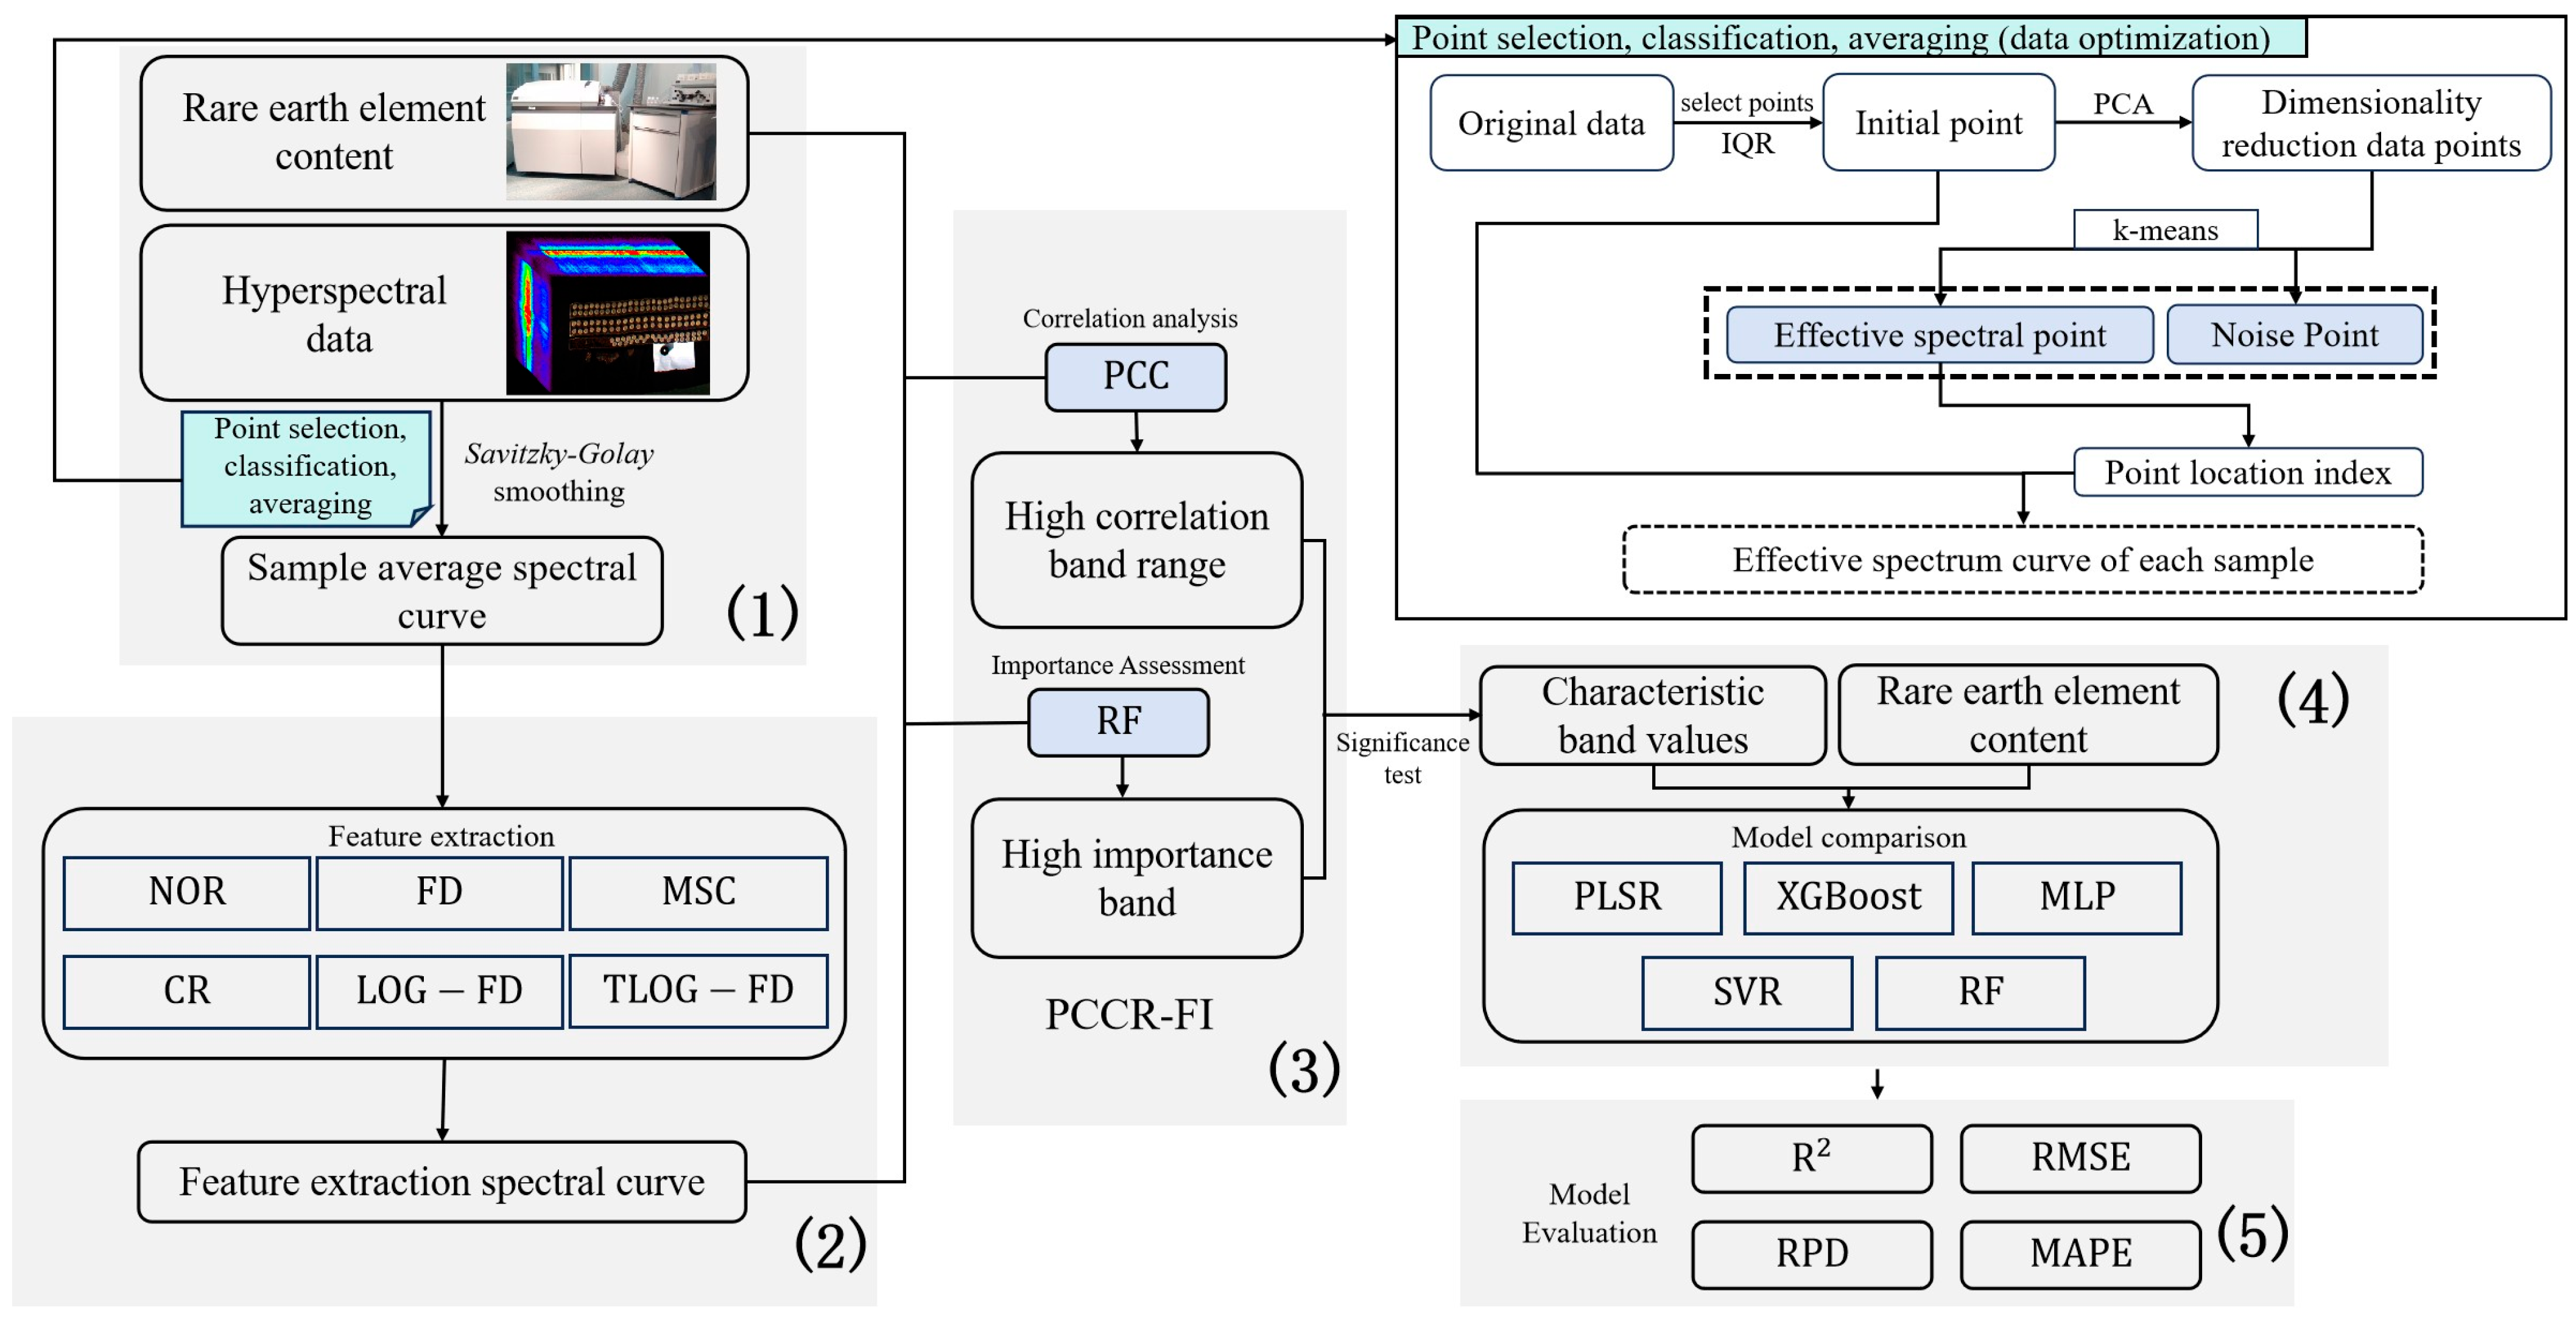
To estimate REE concentrations in marine sediments using hyperspectral data, a modeling framework was developed within the MATLAB 2023b platform. The analysis and implementation were conducted through a five-stage workflow: (1) Preprocessing of hyperspectral data: For each sediment sample, spectral data were first screened for outliers using the interquartile range (IQR) method. Dimensionality reduction was then performed using principal component analysis (PCA), followed by K-means clustering to isolate reliable spectral subsets, those unaffected by anomalous factors such as instrumental noise or environmental interference. Subsequently, dark current correction and Savitzky–Golay filtering were applied to minimize noise, and mean spectral curves were generated by averaging the spectra from valid pixels. (2) Spectral features were enhanced by using six preprocessing techniques: normalization (NOR), first derivative (FD), multiplicative scatter correction (MSC), continuum removal (CR), logarithmic transformation followed by first derivative (LOG-FD), and reciprocal logarithmic first derivative (TLOG-FD). (3) To select informative spectral bands, Pearson correlation coefficients (PCC) were calculated between individual wavelengths and measured element concentrations. Continuous spectral regions exhibiting strong correlations were then retained for further analysis. The significance of the correlated spectral bands was assessed using RF analysis, and subsequent statistical testing was applied to identify the key wavelengths most predictive for each REE. (4) The selected spectral characteristics and corresponding chemical measurements were then compiled into datasets, which were subsequently categorized into training and testing subsets in a ratio of 2:1. Five regression algorithms, including PLSR, XGBoost, MLP, SVR, and RF, were successfully employed in the model for predicting REE concentrations. A Taylor diagram was used to illustrate and compare the effectiveness of various preprocessing methods and modeling approaches. (5) Model accuracy was determined using statistical metrics including the coefficient of determination (R2), relative performance deviation (RPD), root mean square error (RMSE), and mean absolute percentage error (MAPE). The detailed analytical procedure carried out in this study is illustrated in Figure 2.

2.3. Hyperspectral Data Anomaly Detection and Removal

The acquisition of hyperspectral imagery in natural environments is frequently influenced by environmental and technical factors, such as diffuse ambient light, mechanical vibrations of the imaging system, and shadows resulting from changing angles of natural illumination. Moreover, attempts to preserve the natural surface features during sample preparation, such as non-uniform surface elevation and heterogeneous dispersion of sediment powders, can further impact the spectral scattering behavior. These influences (stemming from ambient light, mechanical vibration, occlusions, and physical heterogeneity) closely mimic the challenges faced in in situ mobile hyperspectral surveys. Therefore, the initial processing steps must prioritize the removal of data demonstrating significant anomalies to ensure data reliability. It is also essential to assess the spectral data collected under these operational conditions to verify their accuracy and consistency.
To overcome these challenges and provide an empirical basis, hyperspectral datasets from 53 sediment samples were analyzed. All samples were ground into fine powder to minimize the heterogeneity effects, and scans were conducted according to the procedures outlined in Section 2.1 (3). This protocol generated approximately 400 spatial data points per sample, each comprising 480 radiance measurements. Consequently, each elemental measurement corresponds to a high-dimensional dataset of around 192,000 spectral values (400 × 480), which inherently contains the variations and potential anomalies discussed above.
In this analysis, major spectral outliers within each sample were initially eliminated using the IQR technique. Subsequently, a combination of PCA and K-means clustering was then applied to extract and retain spectra that accurately represented the surface characteristics of the samples.
(1) PCA for Dimensionality Reduction
PCA is a statistical method that transforms high-dimensional data into a lower-dimensional space by determining orthogonal directions (principal components) along which the variance is maximized. These new axes serve as transformed coordinates, reducing redundancy among features while retaining the most critical information. The general procedure involves the following steps:
a. The collected hyperspectral data are arranged into a matrix format, where p represents the total number of spectral bands. Each band is considered a random variable, denoted by W 1 , W 2 , . , W P . The corresponding sample means are represented as W 1 ¯ , W 2 ¯ , , W p ¯ , and the associated sample standard deviations are σ 1 , σ 2 , . , σ P . To ensure comparability across bands, a standardization transformation is applied to normalize the data.
w i = W i W i ¯ σ i
b. The covariance matrix of the standardized sample matrix is calculated by using the standardized data matrix W , where n represents the number of spectral samples.
R = 1 n 1 W T W
c. Eigen Decomposition and Principal Component Selection: The eigenvalues and eigenvectors of the covariance matrix R are calculated to determine the primary directions of variance in the standardized dataset. Each eigenvector represents a principal axis in the transformed feature space, and its corresponding eigenvalue indicates the variance captured along that direction. The top m eigenvectors with the largest eigenvalues were retained for dimensionality reduction, ensuring that the cumulative explained variance exceeded 90%.
(2) K-means Clustering
K-means is an unsupervised learning algorithm that divides a dataset into k distinct groups by minimizing intra-cluster variation and maximizing inter-cluster separation. The goal is to group data points closely around a central centroid while keeping different clusters well-separated. The general process includes the following steps:
a. Randomly select k data points from the dataset to serve as the initial cluster centers.
b. Assign each data point to the nearest centroid based on a distance metric, typically Euclidean distance.
c. For each cluster, the center is recalculated as the arithmetic mean of all points currently assigned to it.
d. Repeat the assignment and centroid update steps until the cluster memberships stabilize or a stopping criterion is met.
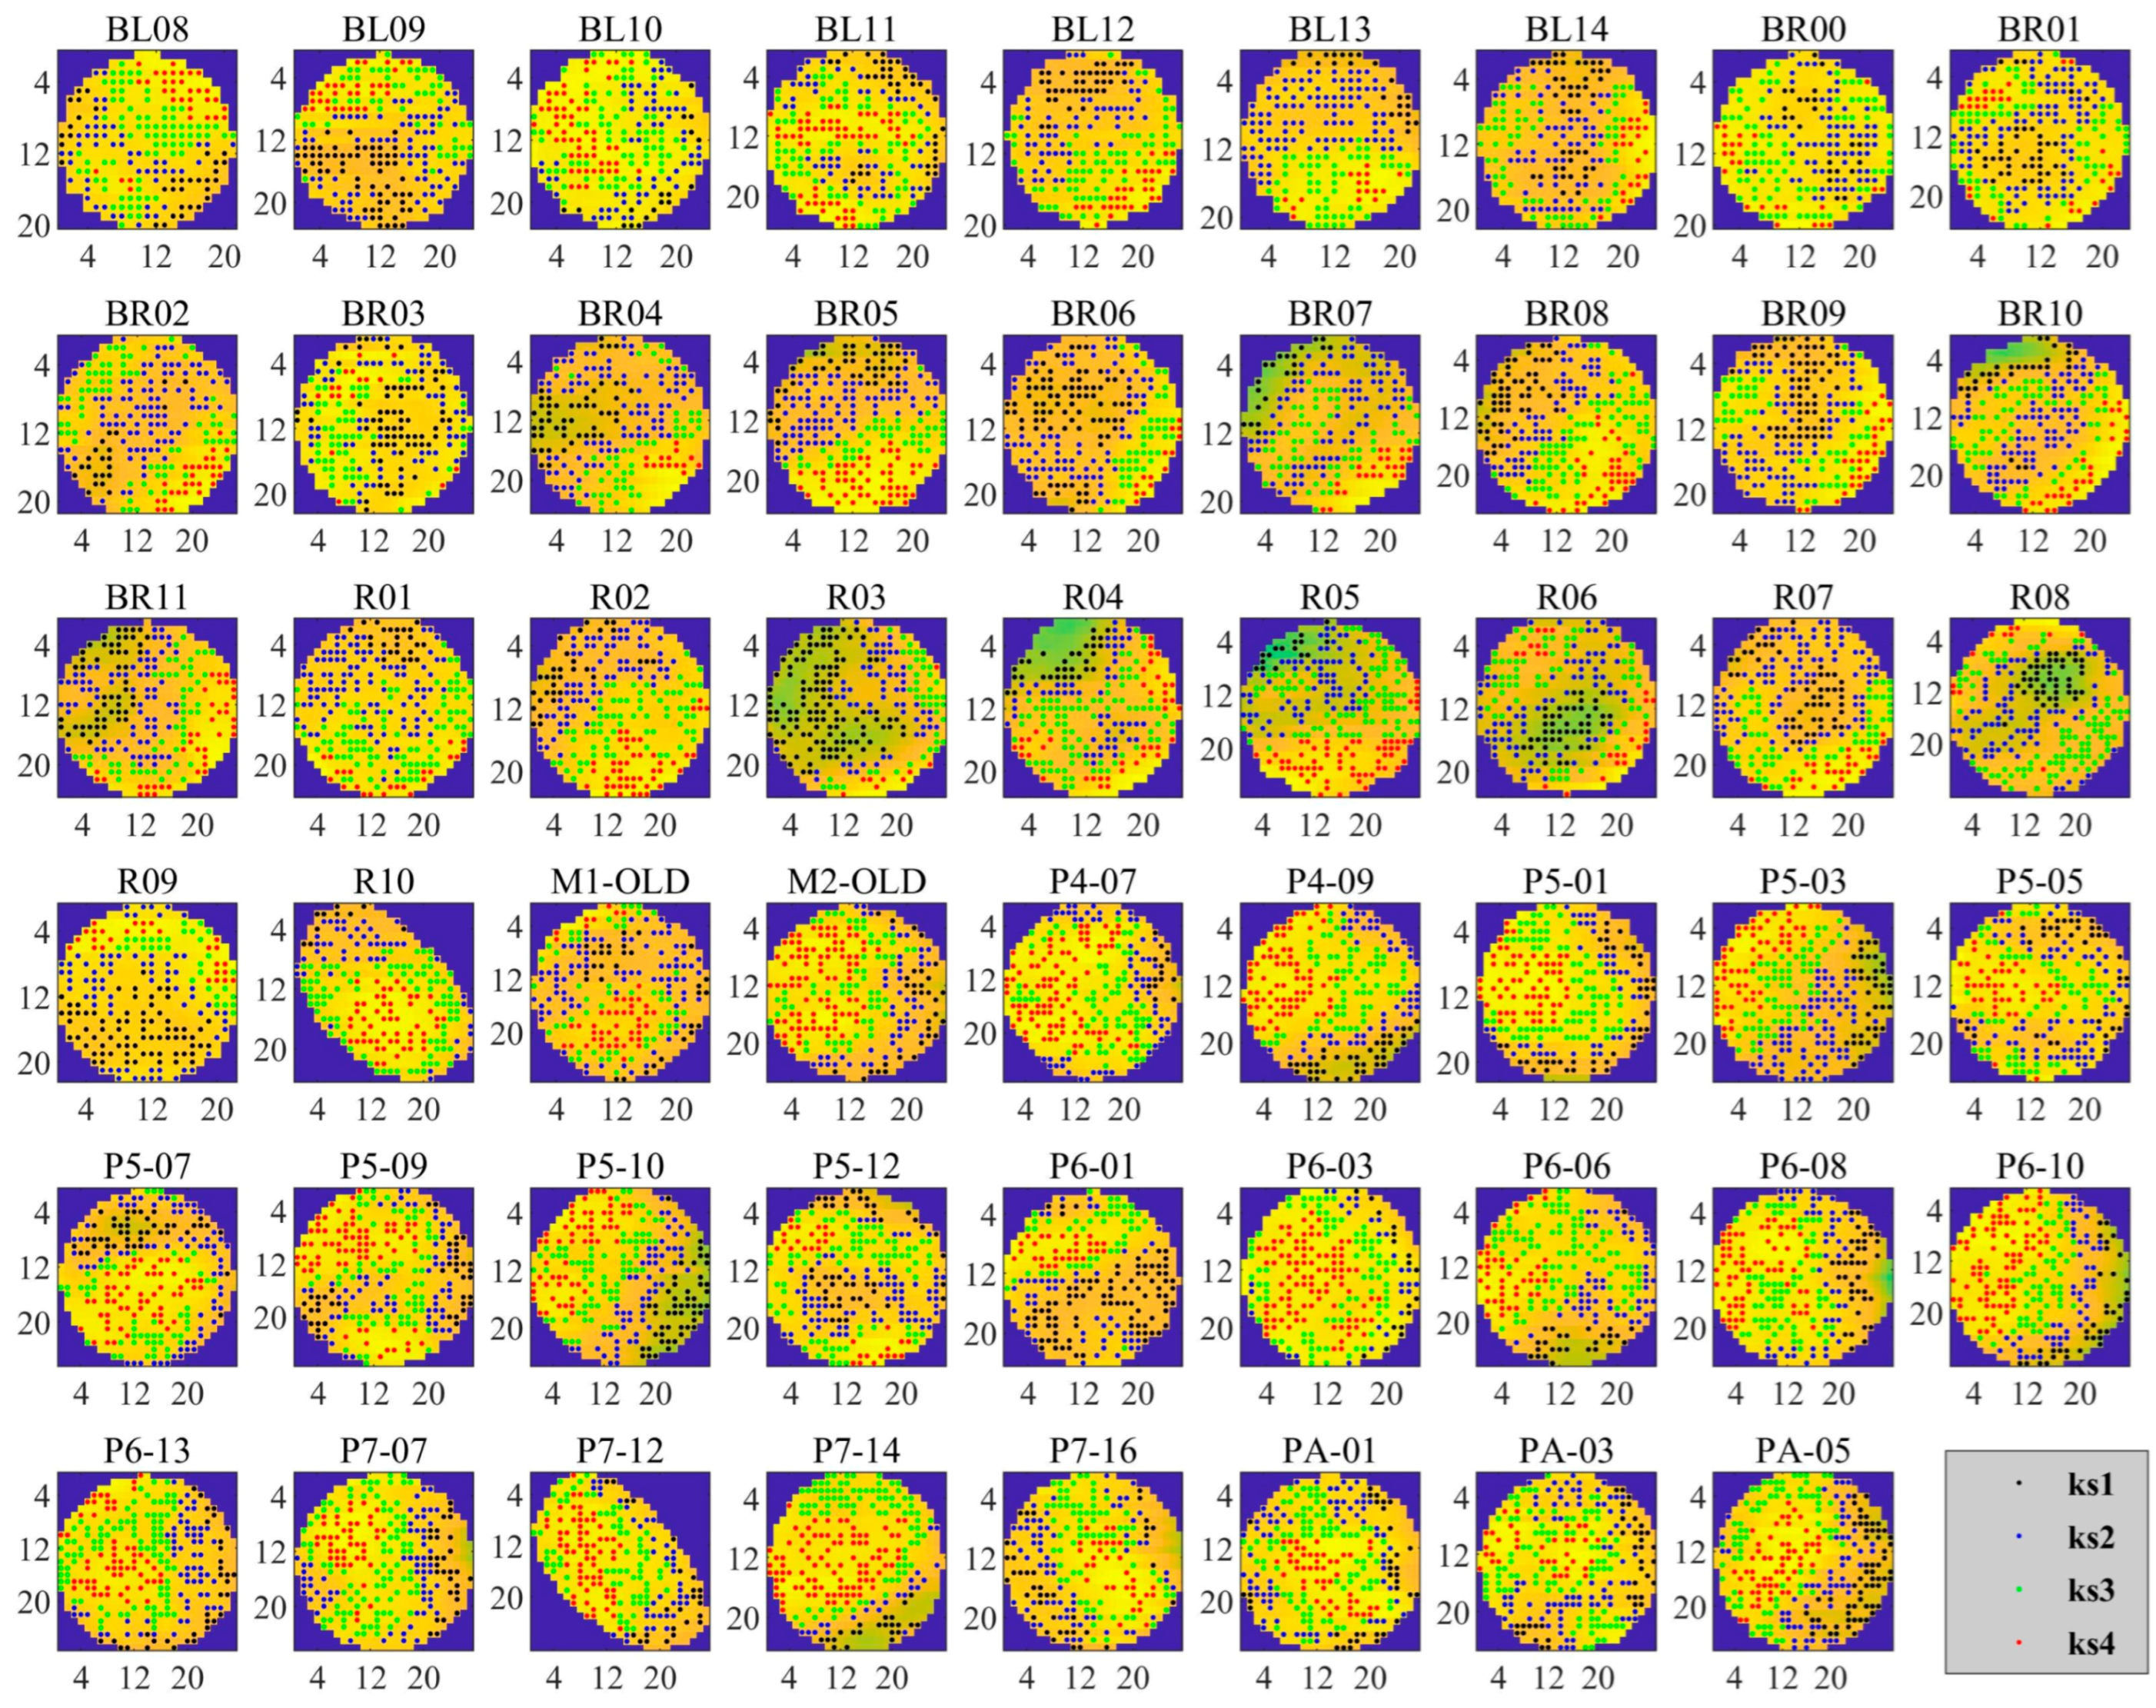
Initial quality control of the data included outlier removal using a quartile-based approach to maintain spectral consistency. Dimensionality reduction via PCA was then performed, retaining three principal components that together accounted for >90% of total variance. This step efficiently compresses the dataset while preserving key spectral information, optimizing the computational workload. After that, unsupervised clustering analysis was conducted using K-means clustering, with Euclidean distance employed to quantify the closeness between data points and cluster centroids. The clustering analysis was performed on the three principal components derived from PCA. Considering the surface features of the sediment samples (Figure 1b) and repeated validation results, the hyperspectral data were successfully classified into four distinct groups, representing different surface conditions, including shadowed areas, accumulated regions, loose textures, and smooth surfaces (Figure 3).
The spectral profile of ks4 (Category 4) demonstrated the highest intensity, consistent with the sample’s smooth and densely packed surface texture, as shown in the sample photograph in the lower-right corner of Figure 1b. The spectral profile of ks4 (Category 4) demonstrated the highest intensity along with significant consistency, aligning with the densely packed and smooth regions, as illustrated in Figure 1b. However, ks3 (Category 3) displayed slightly reduced intensity levels, corresponding to more loosely packed surface textures. ks2 (Category 2) revealed higher variability in spectral intensity, reflecting areas with loosely aggregated material. ks1 (Category 1) displayed the most irregular and unstable spectral signals, typically associated with pronounced shadows or mixed contributions from the container structure. The spectral stability decreased progressively from ks4 through ks1.
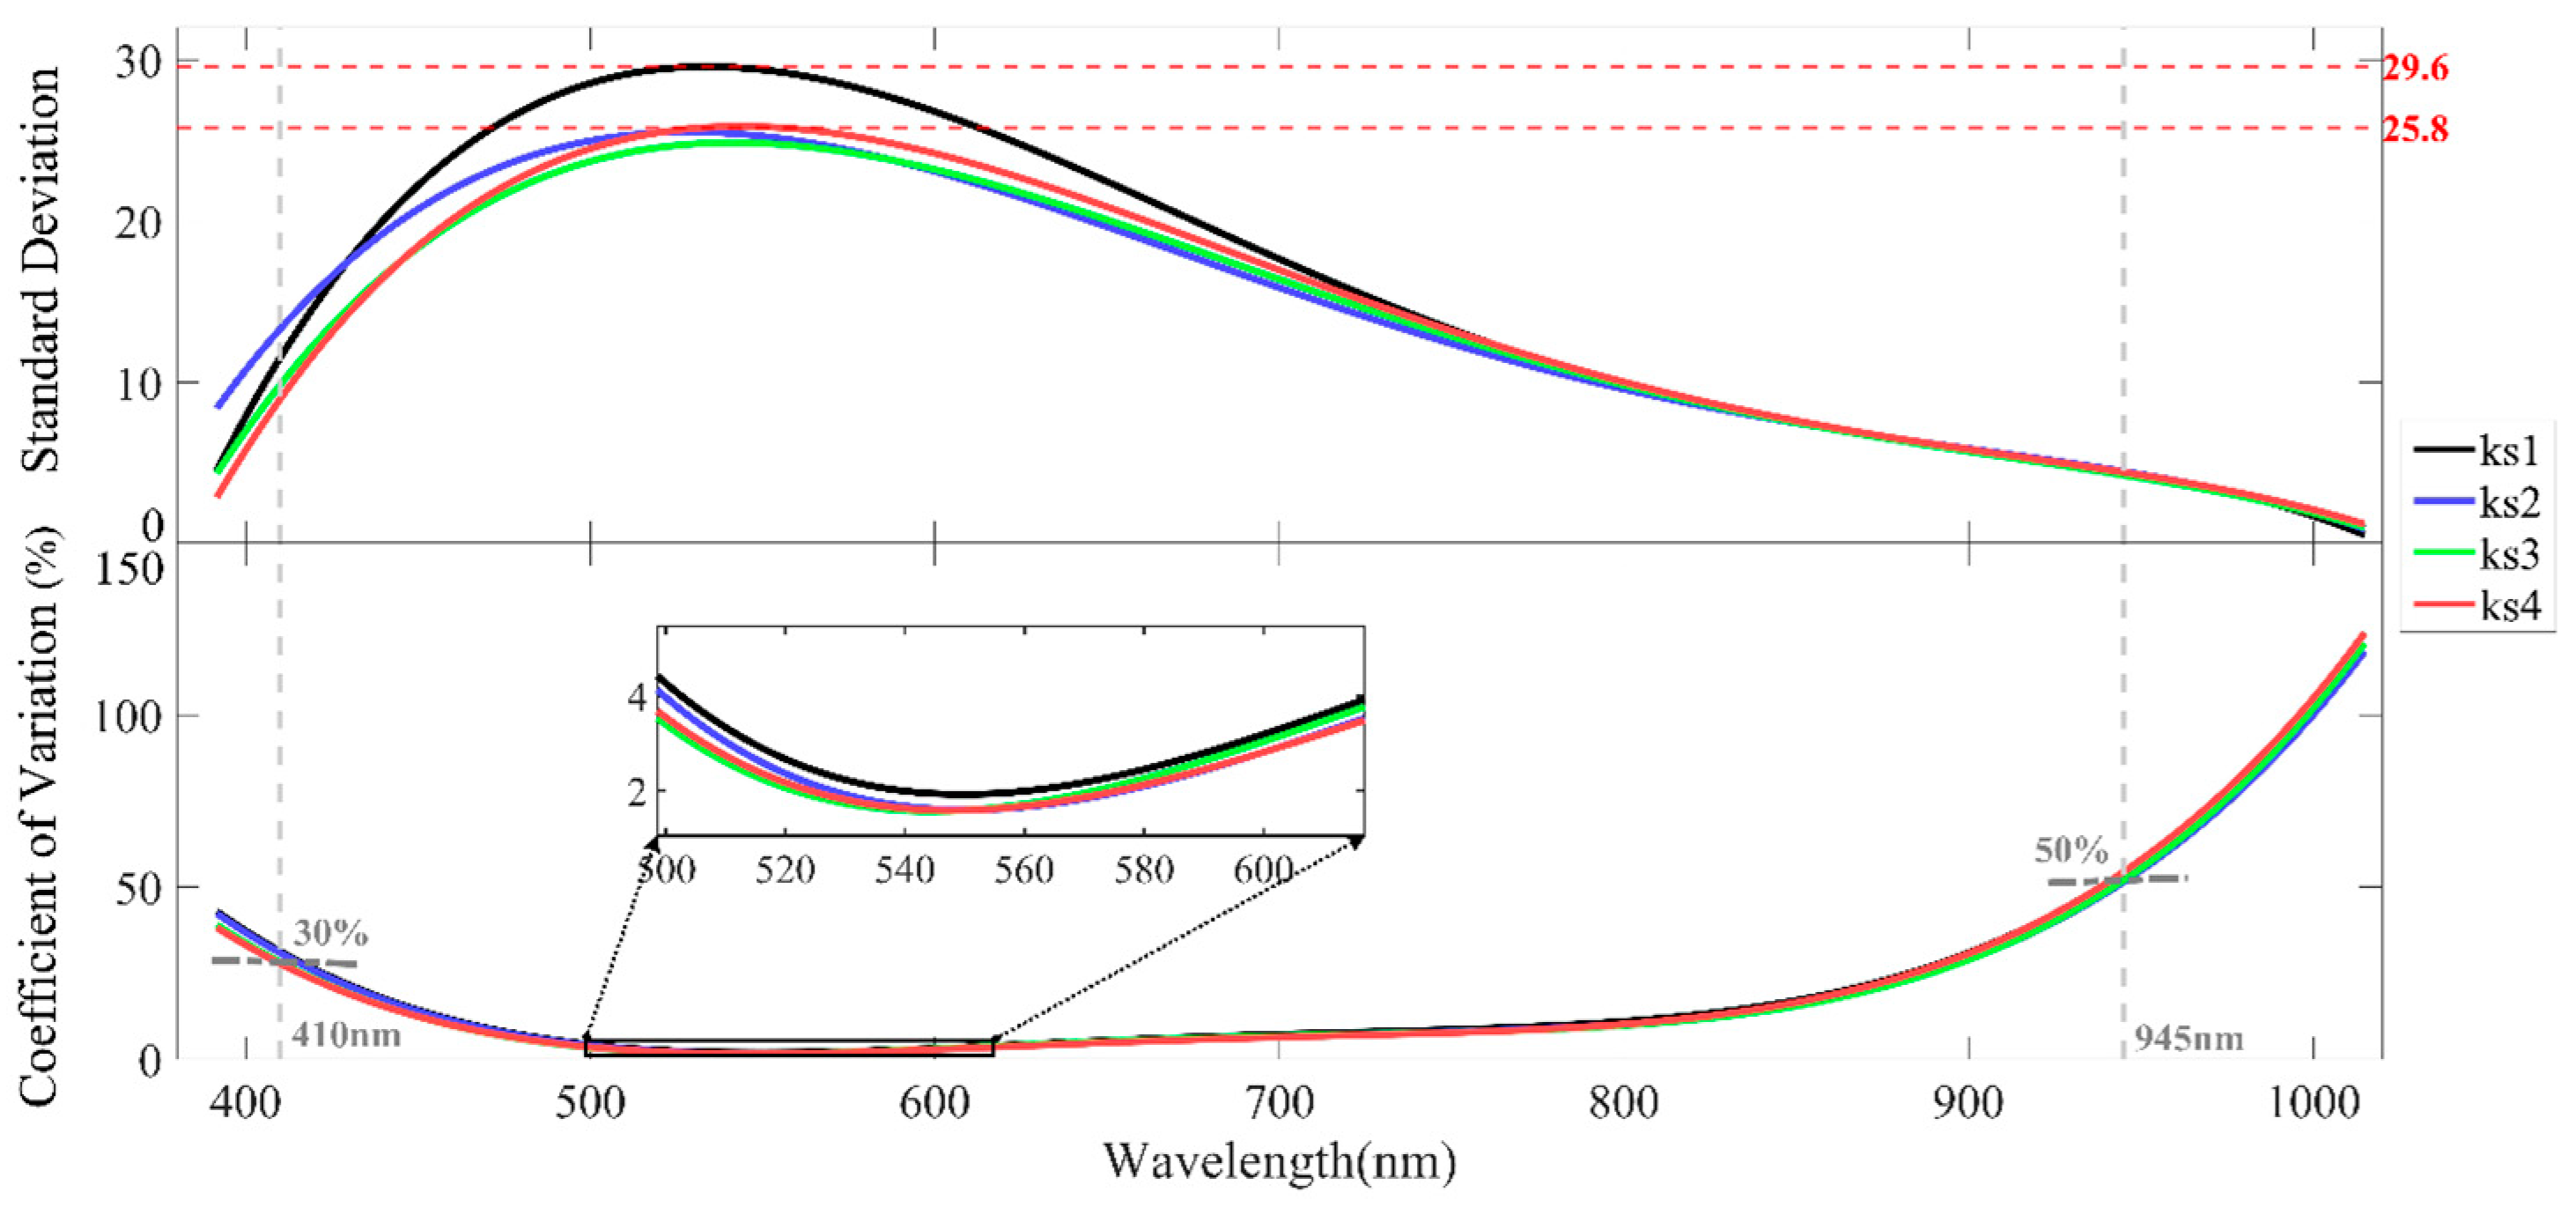
Polynomial regression of the standard deviation and coefficient of variation across spectral bands revealed that both metrics vary according to wavelength, reflecting differing degrees of spectral fluctuation across the spectrum (Figure 4).
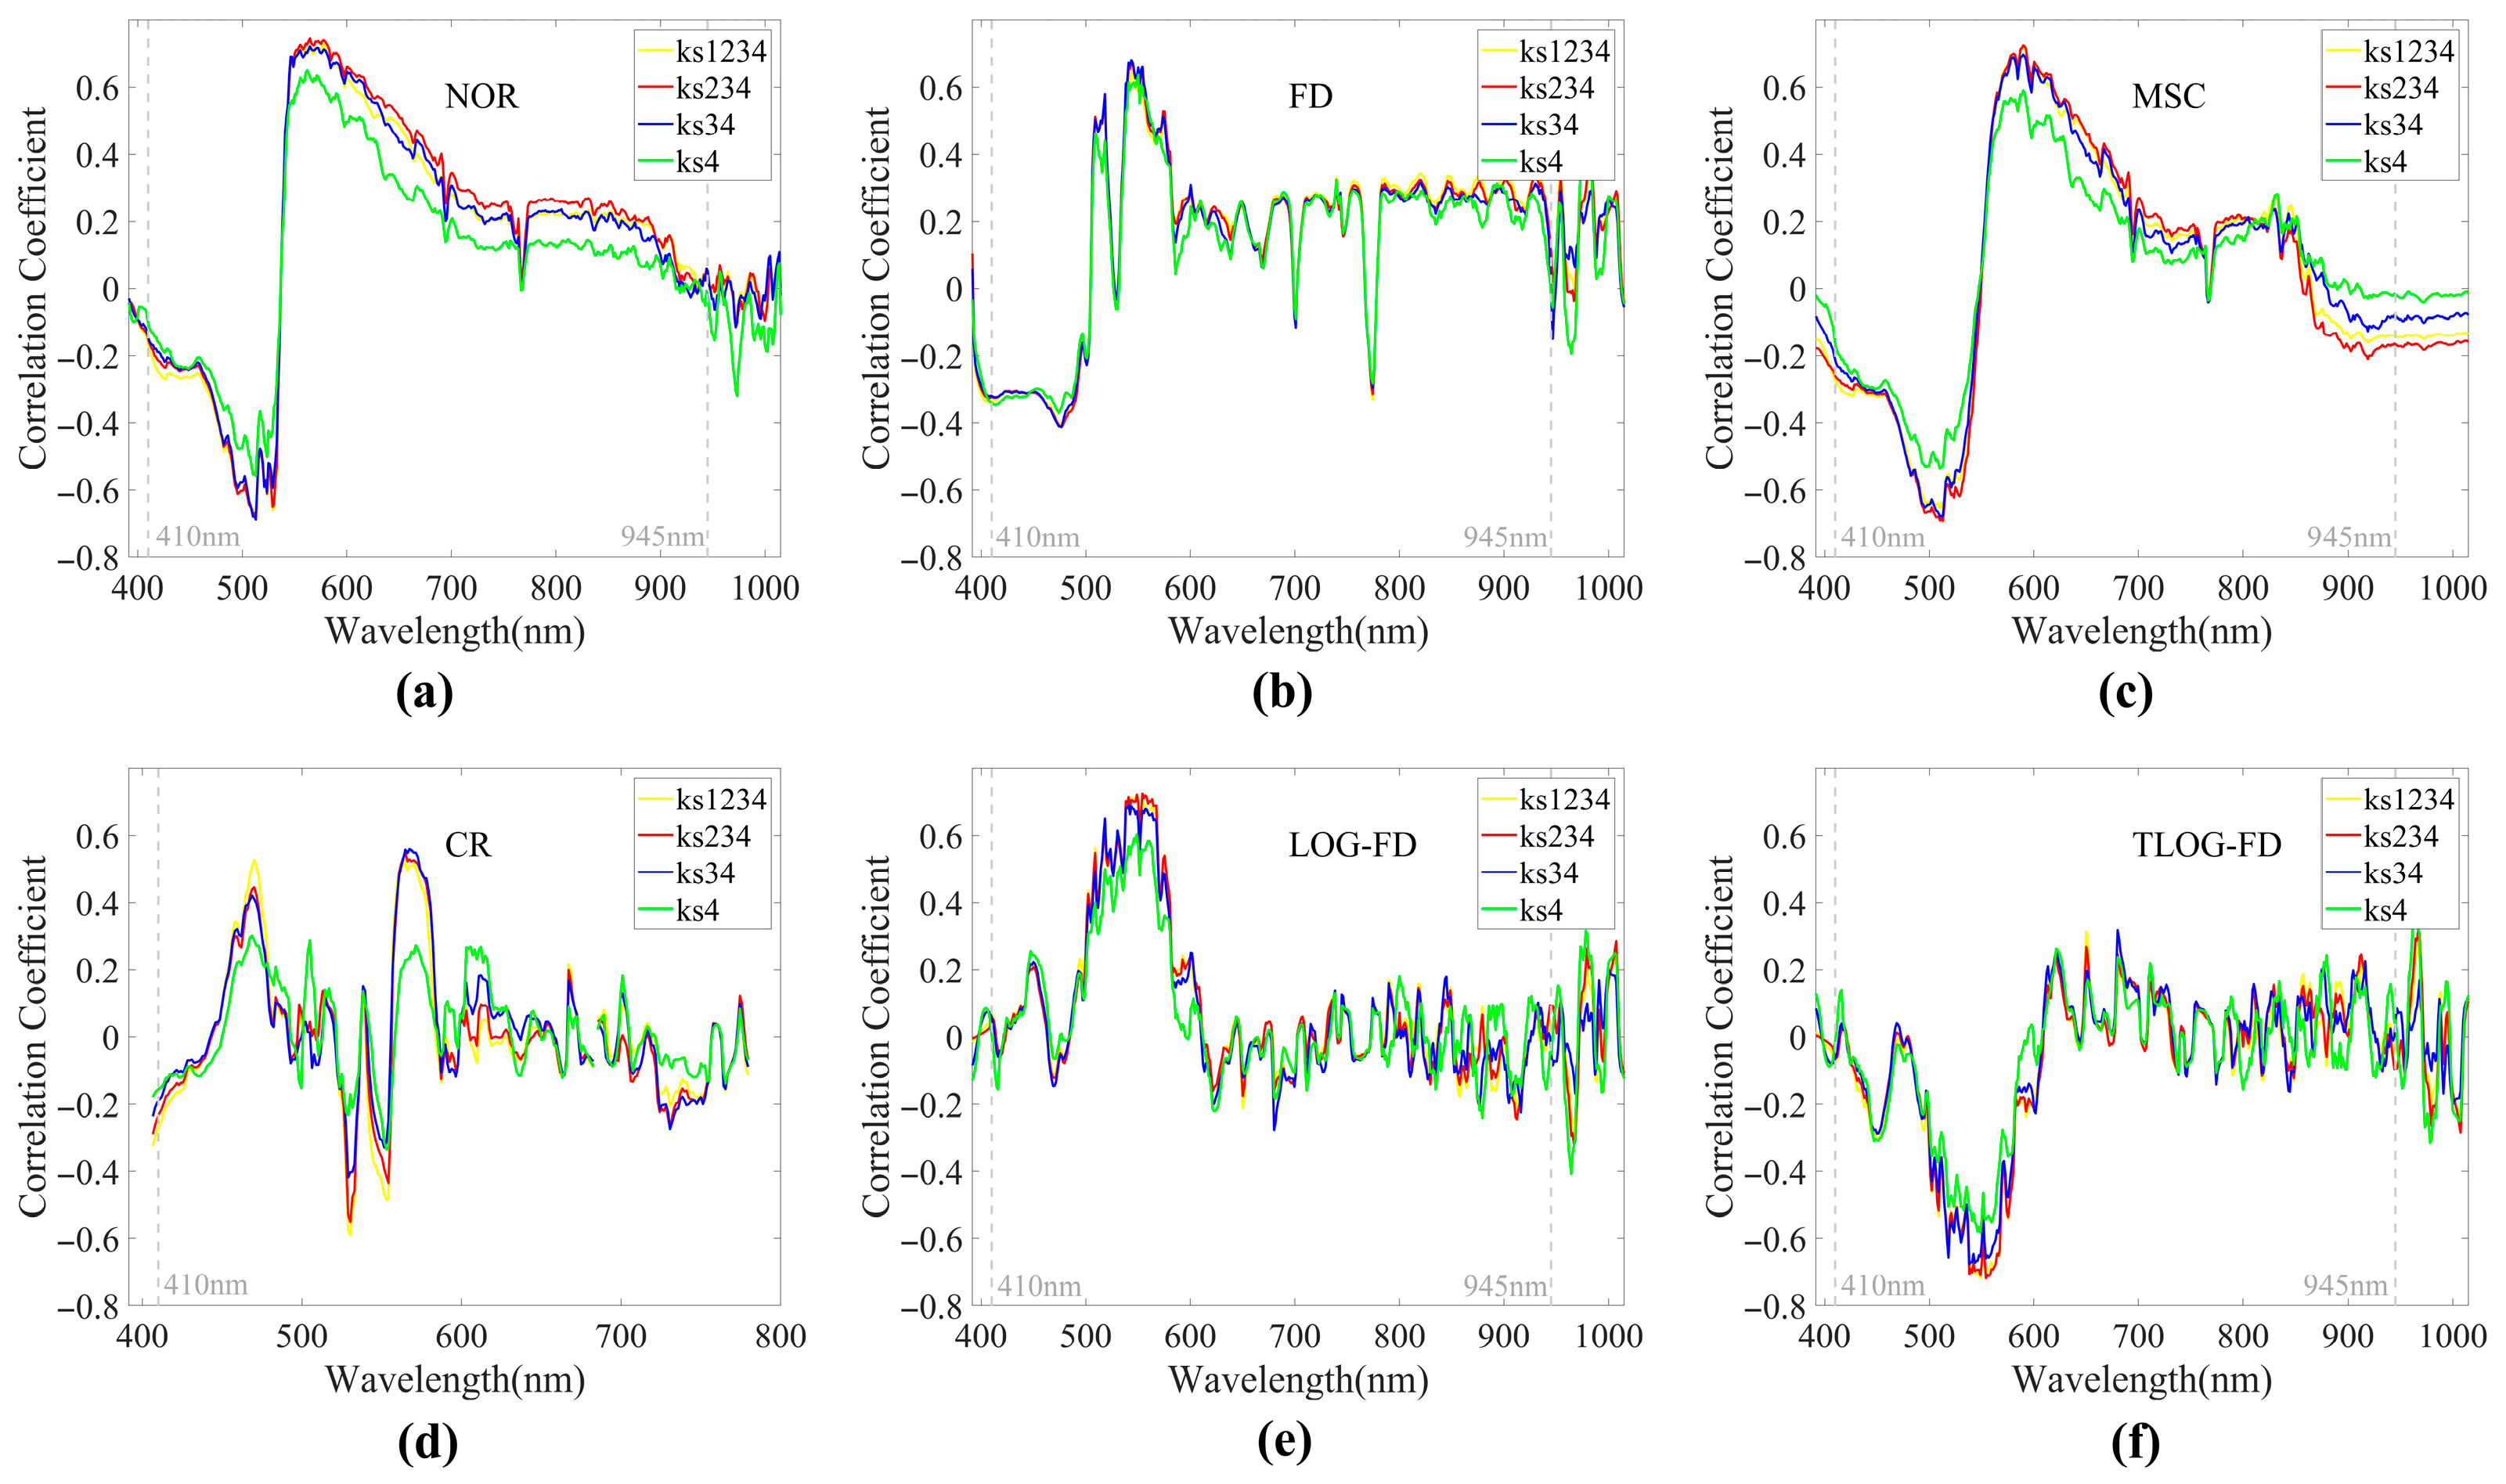
The standard deviation values associated with ks1 points surpassed those of the other three categories by roughly 0–5 units, whereas the coefficient of variation showed only slight variations among the categories. ks1 points demonstrated slightly elevated coefficients, primarily due to spectral instability caused by shadow effects and edge-related spectral mixing, both of which significantly compromised the accuracy of content estimation. To evaluate spectral reliability under different conditions, subsets were created by combining categories based on data consistency: Categories 1–4, 2–4, 3–4, and only Category 4. These subsets were then used to calculate the mean spectral response per sample. After that, spectral feature extraction was performed, followed by correlation analysis with the measured elemental concentration, with the results demonstrating that all category combinations provided representative and analytically valid data.
Further insights from Figure 4 indicated increased coefficients of variation at the extreme ends of the spectral range, indicating greater randomness in these bands. Wavelengths below 410 nm and above 900 nm demonstrated variations exceeding 30%, reflecting pronounced instability. Therefore, spectral bands below 410 nm were discarded. However, given the large number of bands beyond 900 nm and the potential for elemental characteristic signals in this region, bands above 945 nm demonstrating coefficients of variation greater than 50%, indicating excessive randomness, were excluded from further analysis. To enhance the credibility of subsequent estimation analyses, spectral data from ks1, significantly affected by shadowing and edge interference, were excluded while retaining the spectral data from ks2, ks3, and ks4 due to their higher reliability. The valid spectral curves for each sample were then averaged to generate the original mean spectral curve.
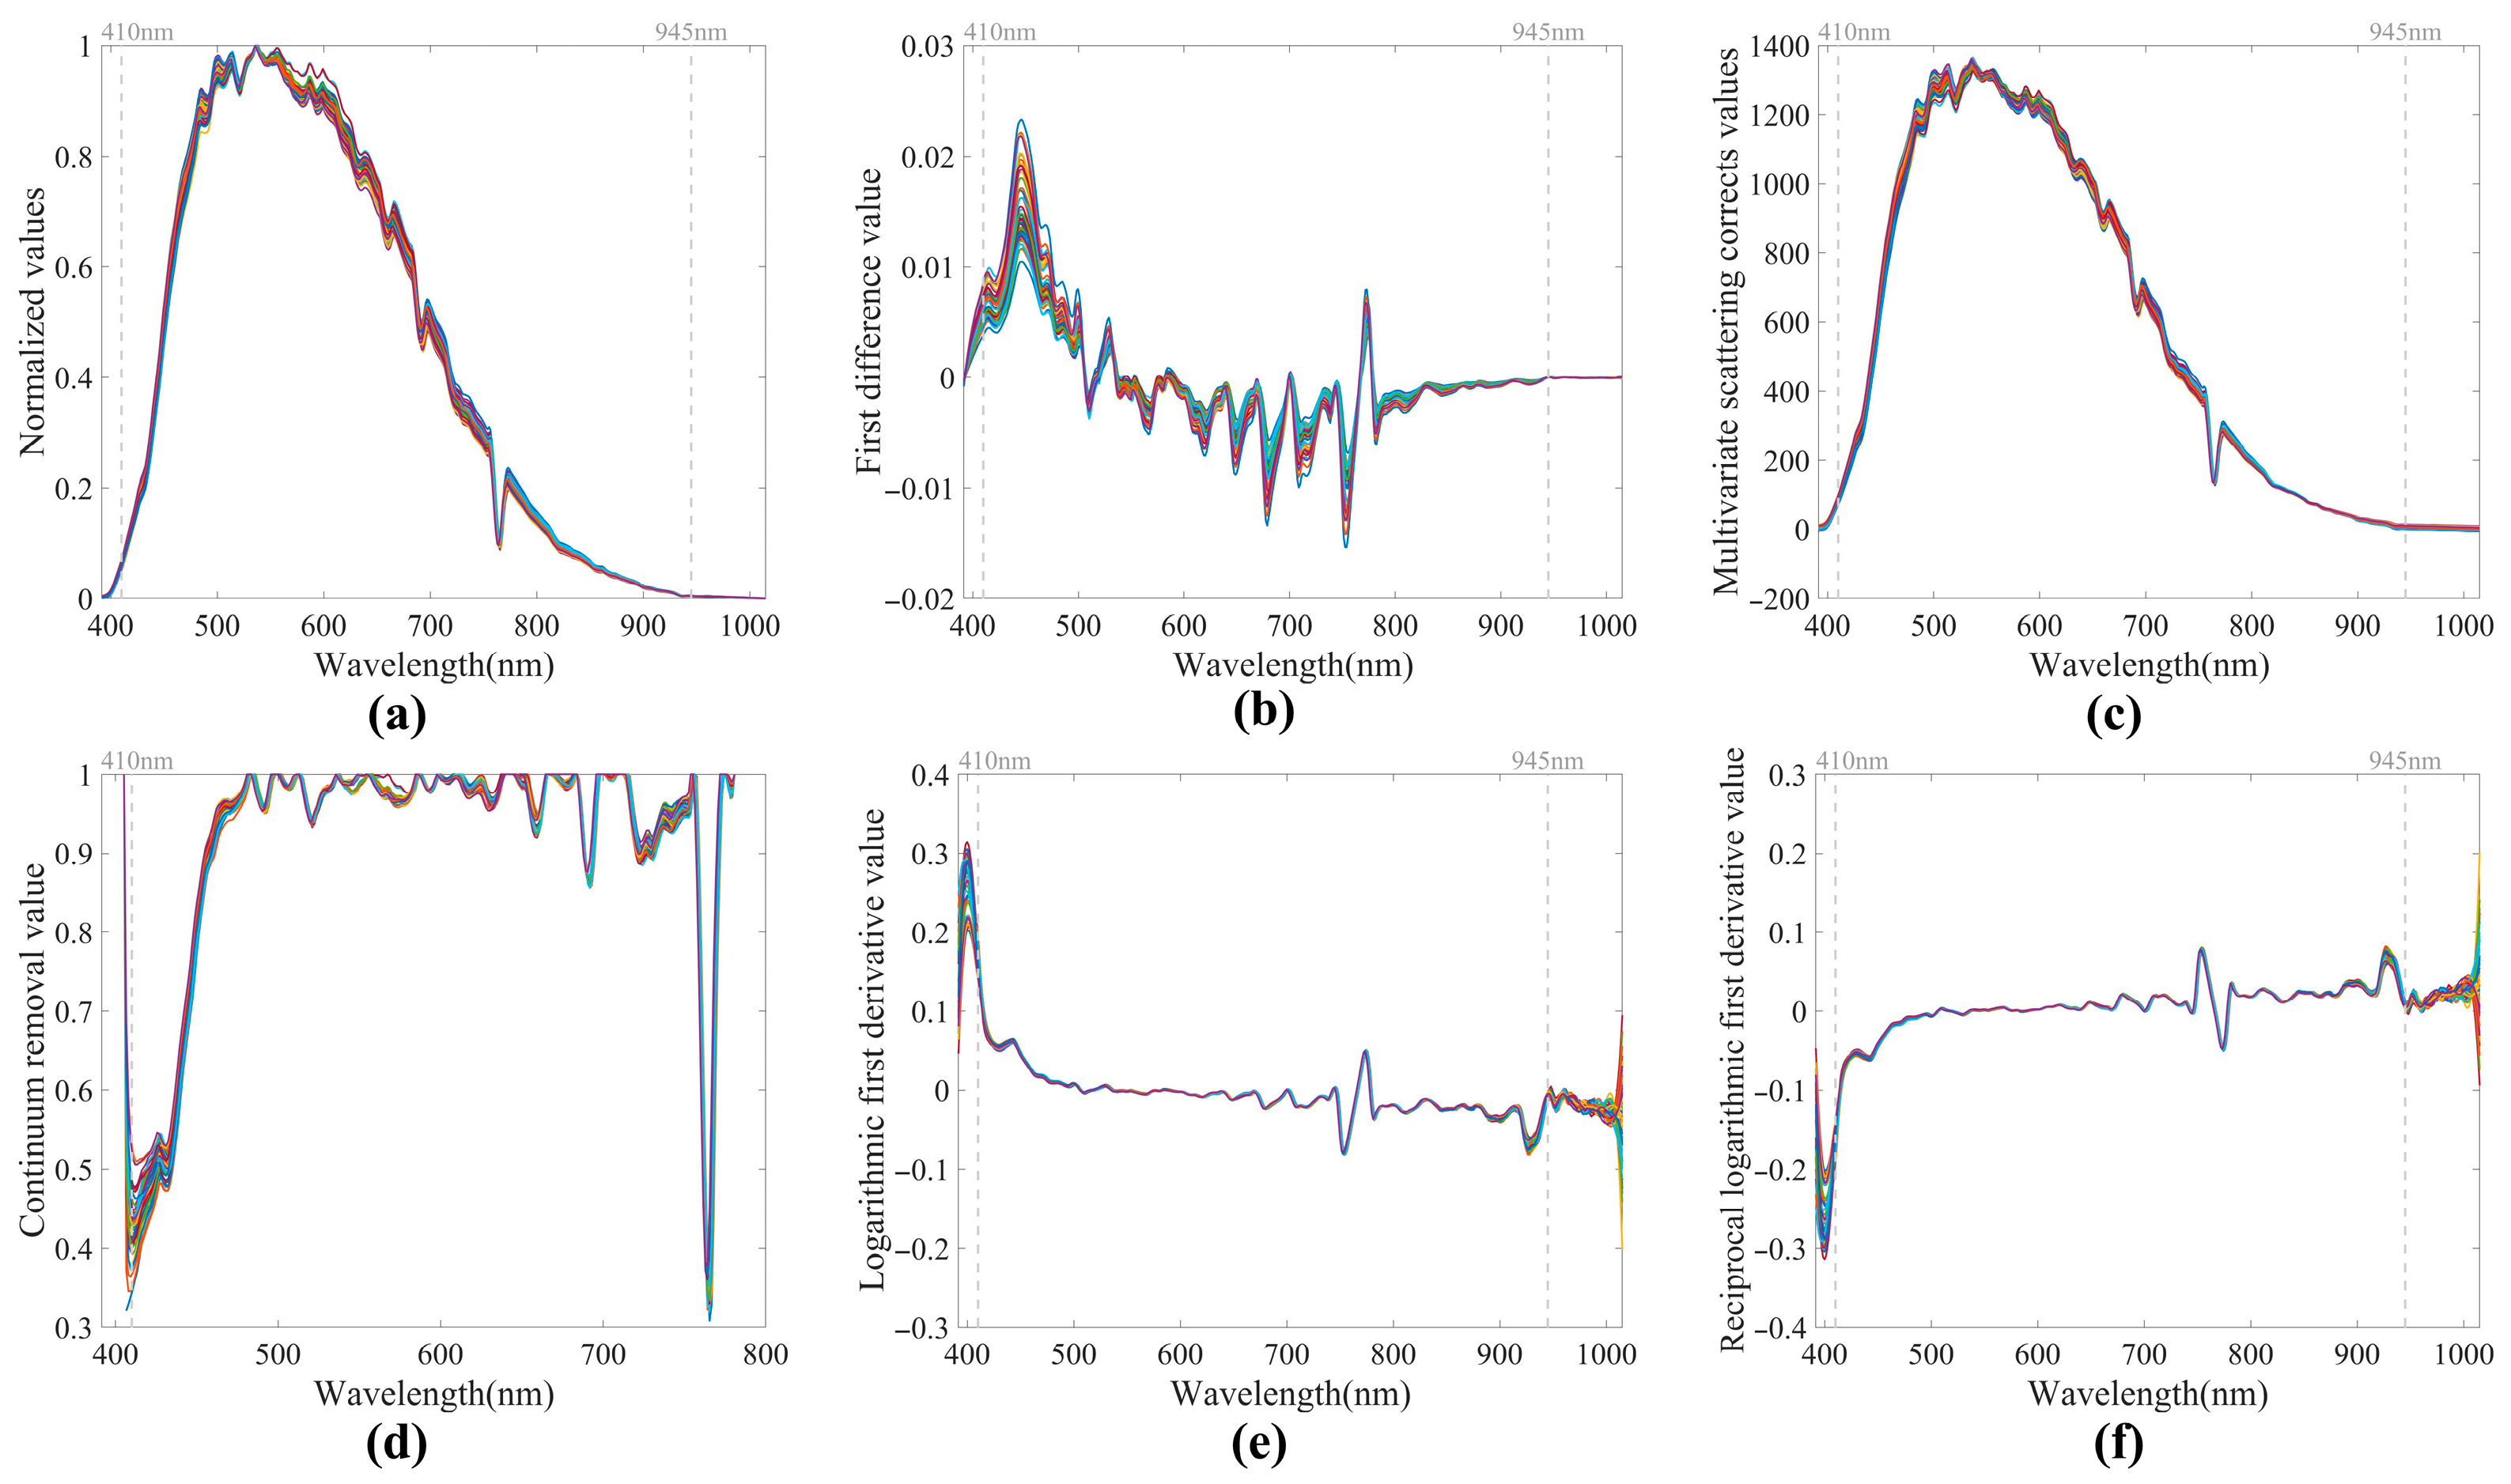
After generating the original mean spectral profiles for each sample, residual effects such as dark current interference and high-frequency noise remained, which were subsequently eliminated using additional correction for dark current, followed by the implementation of the Savitzky–Golay (SG) smoothing algorithm to suppress spectral noise. The SG filter effectively minimized rapid fluctuations while preserving essential spectral features, including the overall shape and bandwidth of the signal [42,43]. Finally, the corresponding mean spectral curves of each sample are presented in Figure 5.

2.4. Spectral Feature Extraction

Minerals exhibit distinct spectral characteristics, and the approach used for feature extraction plays a critical role in capturing relevant information while minimizing spectral redundancy. Selecting an effective extraction technique is essential for enhancing the precision of subsequent predictive modeling. This study employed six conventional spectral feature extraction techniques, including NOR, FD, MSC, CR, LOG-FD, and TLOG-FD. The NOR technique normalized the radiance values to 0 and 1, enabling straightforward comparison across samples. FD enhanced the weak spectral variations, improving the distinction between materials and highlighting absorption features. MSC addressed the spectral distortions arising from physical variations in the samples by referencing the mean spectrum and applying linear corrections to reduce non-informative fluctuations. CR isolated absorption features by removing the spectral continuum and then normalizing the results to a 0–1 scale, facilitating the identification of key bands associated with elemental content. Spectral data beyond 780 nm demonstrated significant fluctuations and distortion after CR processing; hence, these wavelengths were excluded to ensure the reliability of the analysis. LOG-FD and TLOG-FD first apply a logarithmic transformation to mitigate heteroscedasticity and compress the range of spectral variations, followed by first derivative application to emphasize fine spectral details.
Following initial spectral preprocessing, each feature extraction method was applied to assess its effect on spectral patterns and estimation performance. The optimal technique for detecting REE signals in sediment samples was established through systematic evaluation and performance-based comparison of all tested approaches.

2.5. Characteristic Band Selection

Selecting the most informative spectral bands is essential for achieving accurate and scientifically robust estimation of REE in sediment samples. Following the extraction of spectral features (Section 2.4), specific hyperspectral bands were found to correlate strongly with REE concentrations, highlighting their potential for targeted selection in model construction. However, care must be taken because spectral similarities can arise from overlapping signals of coexisting minerals or elements in different oxidation states. Therefore, directly selecting bands solely based on their correlation with elemental concentrations can reduce model accuracy and predictive reliability. To overcome this limitation, Ma et al. (2024) proposed a two-step band selection approach; first, the 50 most relevant bands were identified for each feature extraction method, followed by further refinement using a RF importance ranking to pinpoint the bands closely associated with specific elements [33]. However, this approach does not account for the absorption peaks with relatively low correlation, potentially resulting in the incomplete selection of essential bands. In another study, Ye et al. (2023) used the XGBoost algorithm to evaluate the importance of bands within the pre-identified relevant ranges. Their method retained only bands with a feature importance (FI) score above 0.001 for model input [31]. However, this strategy can still introduce redundancy among selected bands or potentially exclude important features.
Based on these earlier approaches, the current study introduced a refined approach termed PCCR-FI. This technique effectively integrated Pearson correlation analysis to narrow the band range and applied feature importance ranking to select the key wavelengths that contribute most significantly to elemental prediction. Initially, spectral regions with strong correlation were identified and evaluated using importance metrics, isolating bands associated with absorption peaks and demonstrating both high correlation coefficients and FI scores. To mitigate the influence of small sample variability, the selected bands underwent a statistical significance test, and only those with p < 0.01 were retained as reliable feature bands for predicting REE concentrations in sediments.
The correlation analysis within the PCCR-FI method is defined mathematically as follows:
r j = i = 1 s x i X ¯ y i Y ¯ i = 1 s x i X ¯ 2 i = 1 s y i Y ¯ 2
where r j indicates the correlation coefficient associated with the j-th spectral band, x i corresponds to the target REE concentration, and y i reflects the spectral response at the same band. The variables X ¯ and Y ¯ denote the mean values of the elemental concentrations and spectral radiance, respectively. The value of j ranged from 1 to 480, with a total of 53 samples.
After correlation and significance assessments, the RF algorithm was used to prioritize the spectral bands associated with strong correlations by evaluating their relative importance. Feature importance is determined by calculating the reduction in impurity contributed by each feature across all trees in the ensemble, which can be represented mathematically as:
I f = 1 T t = 1 T m t I m p u r i t y m f
In this context, I m p u r i t y m f indicates the decrease in impurity resulting from the use of feature f at node m, and T denotes the total number of constructed trees. I(f) represents the mean reduction in impurity attributed to feature f (i.e., a spectral band) across all trees. For regression analysis, impurity was quantified using mean squared error (MSE). The importance of each spectral band was assessed by its ability to reduce the MSE at each node split, and these contributions are averaged across all trees in the ensemble to establish the final ranking of the spectral features.
The PCCR-FI technique was applied to identify optimal feature bands. The process was initiated by identifying spectral bands showing strong correlations with elemental concentrations, based on correlation coefficients and significance test results. An adjacent extension was introduced to prevent the exclusion of potentially relevant bands near significant absorption features. For bands with an absolute correlation exceeding 0.1 and deemed highly significant, the wavelength range was extended by adding 10 nm to the upper limit and subtracting 10 nm from the lower limit to capture adjacent relevant features. The resulting high-correlation range, accompanied by its adjacent extensions, constitutes the initial candidate band set. These candidate bands for each REE were then analyzed using the RF algorithm to calculate the FI score. Bands with high FI scores were subjected to further validation through statistical significance testing. The process was initiated by evaluating the top 30 bands ranked by importance. If all these bands demonstrated extremely significant correlations, the evaluation range was expanded to include the top 40. In practice, no more than 30 bands were ultimately selected. This iterative selection and validation process yielded a refined set of feature bands for each REE.

2.6. Estimation Model

Five distinct modeling approaches were employed to estimate the concentration of REEs in sediment samples. These included one linear technique, including PLSR, along with four nonlinear algorithms, including XGBoost, MLP, SVR, and RF. These models have proven effective in accurately predicting outcomes in areas such as mineral resource evaluation and heavy metal detection. In this analysis, the extracted spectral features from the selected characteristic bands were integrated with measured elemental concentrations to systematically evaluate the predictive performance of each modeling approach.
(1) PLSR: This approach reduced both the predictor and response variables into a common lower-dimensional space using latent variables (principal components), effectively capturing the essential linear associations among multiple variables [44]. PLSR combines the concepts of principal component analysis and multivariate regression [45], enabling dimension reduction while preserving most of the information. This approach is particularly advantageous for addressing collinearity in datasets containing various predictor variables.
(2) XGBoost: XGBoost, an enhanced gradient boosting algorithm [46], is renowned for its efficiency and high predictive accuracy when handling high-dimensional and large-scale datasets [47]. It constructs an ensemble of decision trees sequentially, with each tree aiming to correct the prediction errors of the previous one. This model iteratively optimizes its loss function while incorporating L1 and L2 regularization to minimize overfitting. Furthermore, XGBoost can handle missing values and is optimized for parallel calculations. In this study, the model’s hyperparameters were tuned using Bayesian optimization within a 10-fold cross-validation framework to ensure the best predictive performance.
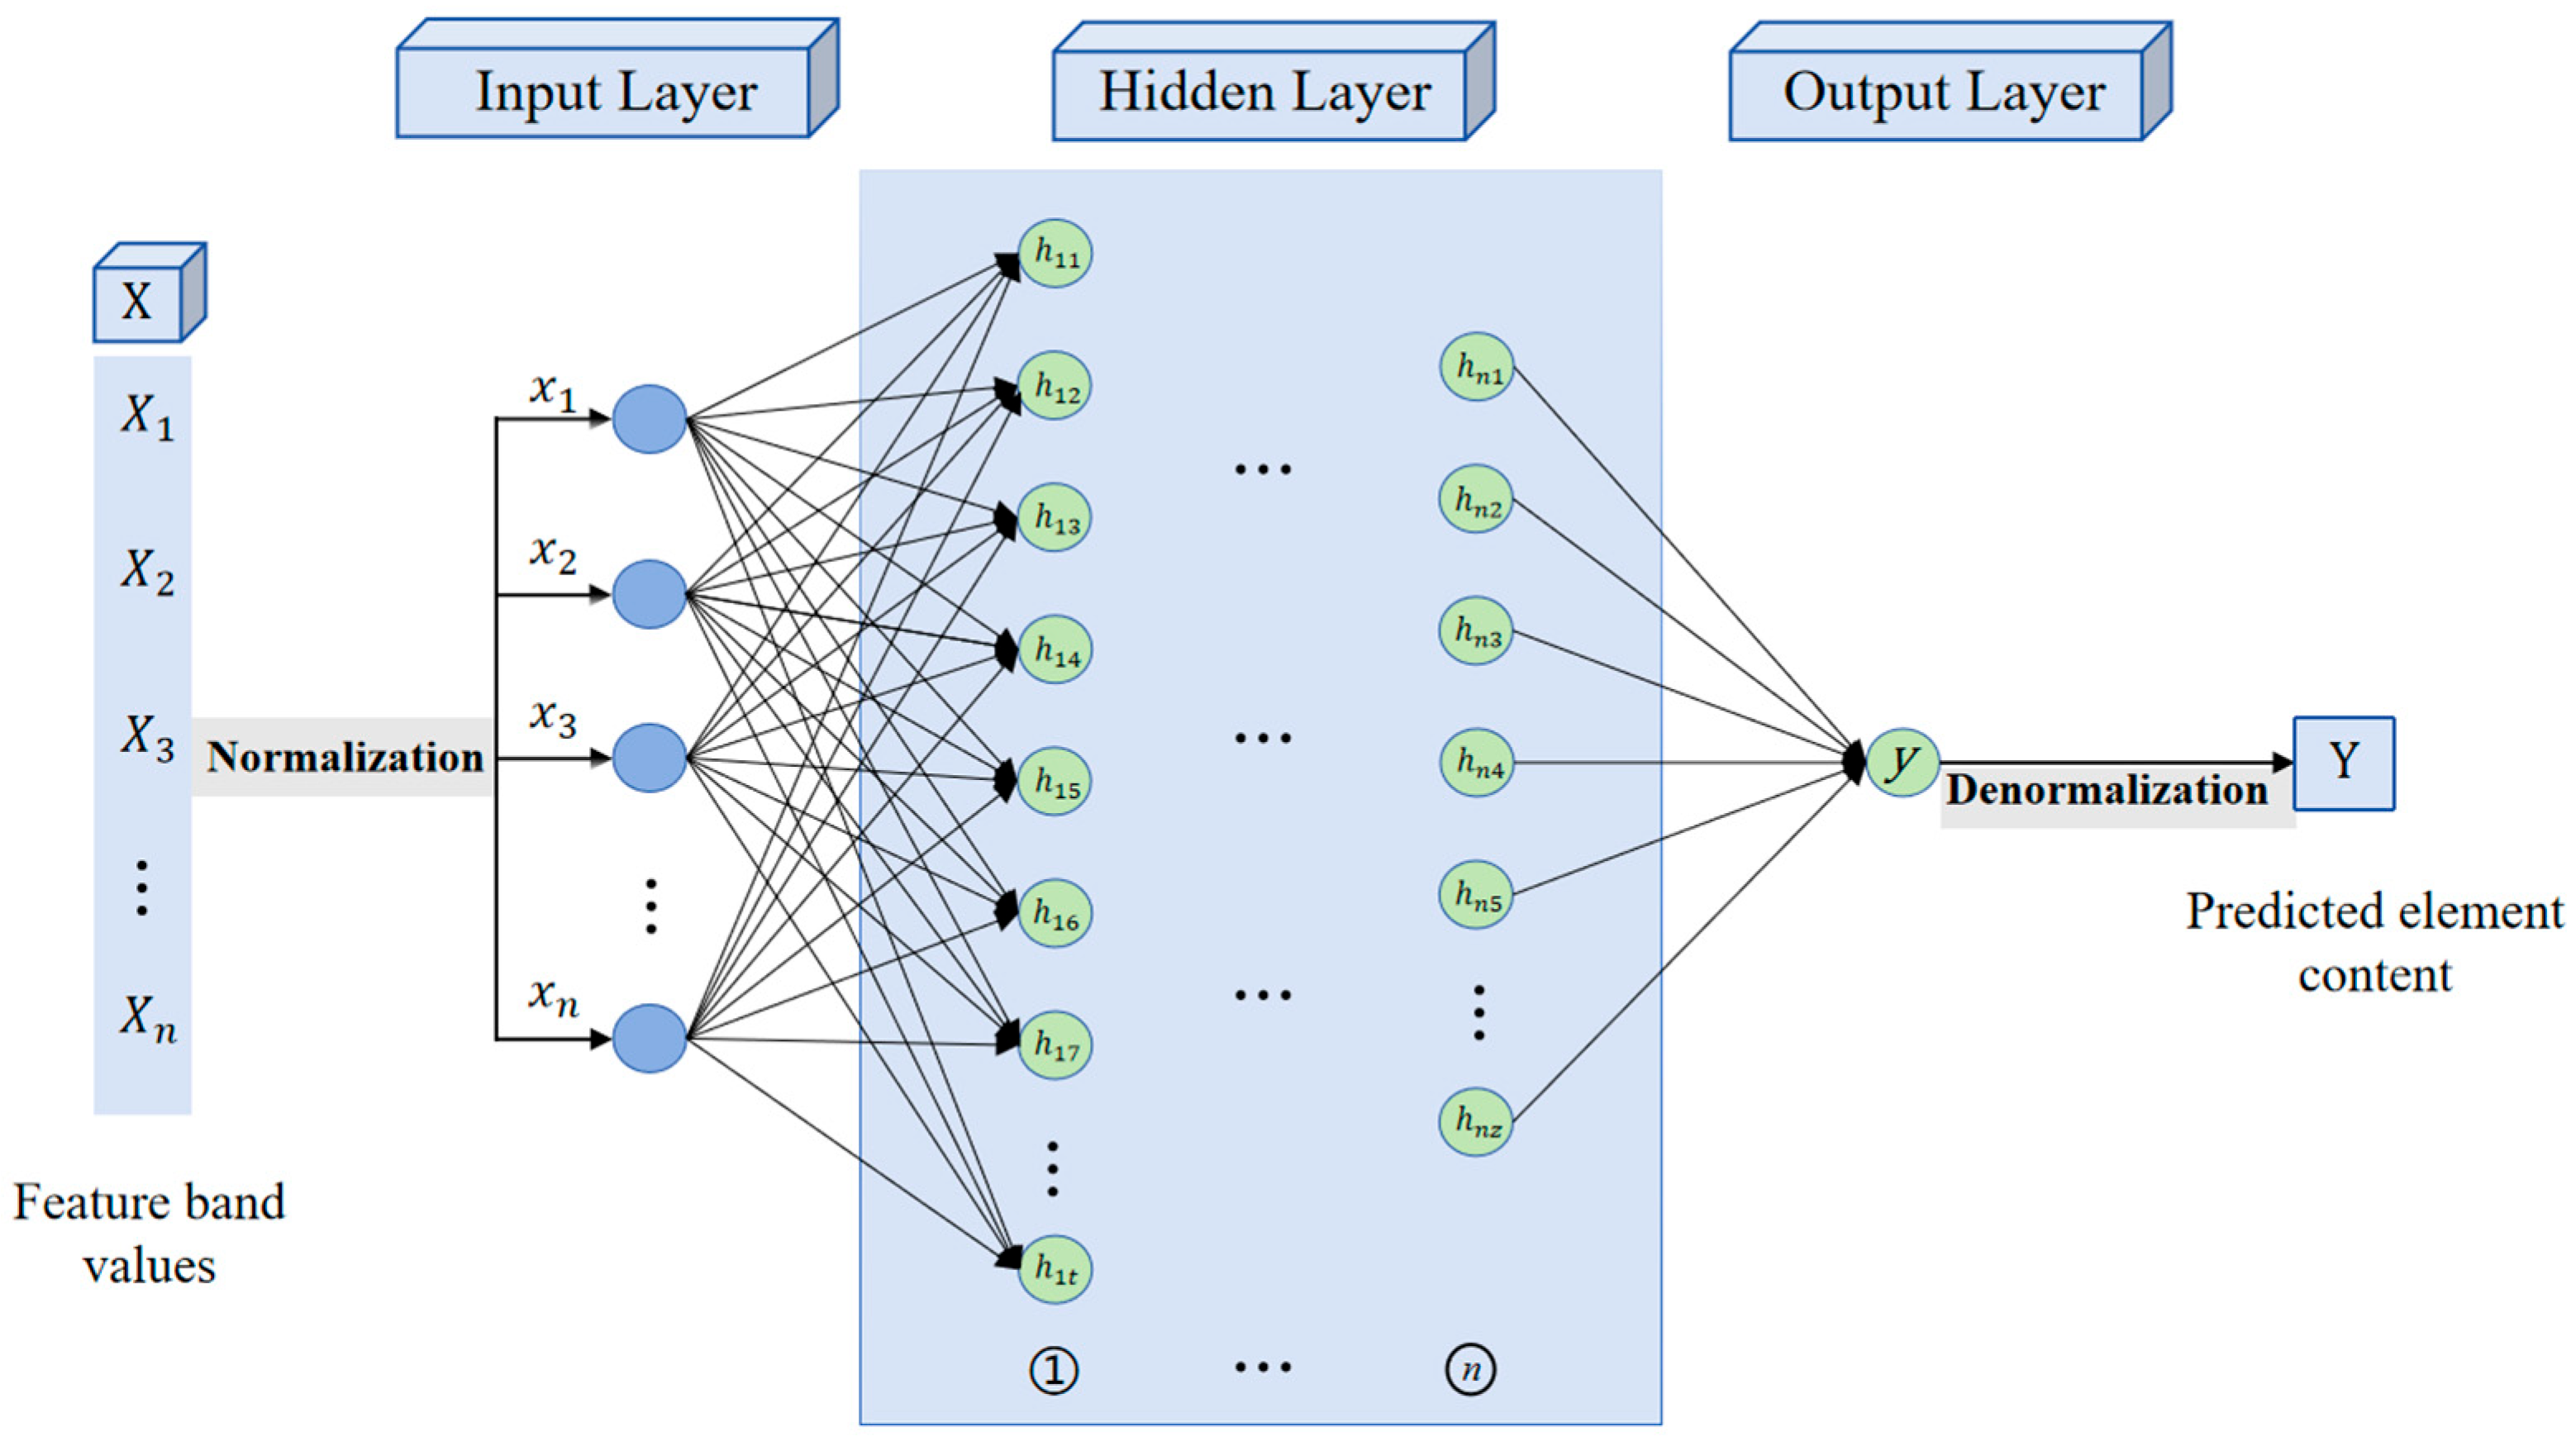
(3) MLP: The Multi-Layer Perceptron is a deep learning model designed for nonlinear regression and classification tasks. Its architecture consisted of an input layer, one or more hidden layers, and an output layer (Figure 6). Each neuron in the hidden and output layers utilizes nonlinear activation functions, allowing the MLP to model complex relationships within the data. This capability makes MLP particularly effective for predicting REE concentrations from spectral inputs, where intricate patterns must be distinguished.
The MLP model integrated the Rectified Linear Unit (ReLU) as the activation function in its hidden layers, while the Adam optimizer was used to update network weights during backpropagation. The input data, including spectral features and REE concentrations, were normalized range between 0 and 1. The configuration of hidden layers and neuron counts varied across various elements, with optimal architecture determined through iterative experimentation. The model was trained for up to 300 epochs. After generating predictions, a reverse normalization is applied to transform the outputs back into actual REE concentrations.
(4) SVR: The SVR serves as the regression extension of the Support Vector Machine (SVM) framework [48]. The primary objective of this method is to construct a hyperplane in a high-dimensional feature space that fits most data points within a predefined margin of tolerance. SVR employed kernel functions, similar to SVM classification, to transform input data into a higher-dimensional space, enhancing the model’s ability to achieve linear separation. Typical kernels include linear, polynomial, radial basis function (RBF), and sigmoid. In this work, the RBF kernel was adopted to model the nonlinear relationship between spectral characteristics and elemental concentrations in sediment samples. Key hyperparameters of the SVR model were optimized using Bayesian optimization, improving its prediction accuracy.
(5) RF: The RF regression model, a decision tree-based ensemble method, aggregates the outputs of multiple trees to improve prediction stability and accuracy [49]. During model development, hyperparameters, including the number of decision trees and the minimum split size, were adjusted through empirical testing for each REE. These refinements reduced the overfitting and improved the model’s robustness in estimating elemental content.
To maintain consistent data distribution and enable accurate assessment of model performance, the dataset was carefully split into training and prediction subsets. The combined spectral and chemical datasets are first arranged in ascending order of concentration and then organized into groups of three. From each group, one sample was randomly selected to form the prediction dataset, while the remaining two were assigned to the training dataset, resulting in 35 training samples and 18 prediction samples. These standardized datasets were then used to train and evaluate the five selected models, enabling a comparative assessment of their predictive performance.

2.7. Model Evaluation

To assess and validate the precision of the model predictions, several statistical performance indicators were employed, including the R2, RMSE, RPD, and MAPE. These evaluation metrics were calculated using the following mathematical expressions:
R 2 = 1 i = 1 N o b s i p r e d i 2 i = 1 N o b s i o b s ¯ 2
R M S E = i = 1 N o b s i p r e d i 2 N
R P D = S D R M S E P
M A P E = 100 % N i = 1 N o b s i p r e d i o b s i
where obs represents the experimentally measured elemental concentration, while pred represents the corresponding predicted value. The subscript p indicates the prediction dataset, N refers to the total number of prediction samples, and SD signifies the standard deviation.
The evaluation metrics are interpreted as follows: For the R2, values approaching 1 demonstrated better predictive accuracy, while values below 0.30 indicated poor predictive capability. Regarding the RPD, model effectiveness was classified into three categories: RPD > 2.00 indicated strong predictive ability, 1.40 ≤ RPD ≤ 2.00 demonstrated moderate performance, and RPD < 1.40 reflected weak predictive capability [50]. A lower RMSE value signified improved prediction accuracy, as RMSE quantifies the deviation between predicted and observed values. The MAPE, which measures the relative percentage deviation between predicted and actual values, has been widely adopted in laboratory settings due to its effectiveness in quantifying predictive accuracy.
R2 and RPD served as the core evaluation metrics in this study, with the higher R2 reflecting the model’s strong ability to capture dominant patterns within the data, whereas an elevated RPD value confirmed its suitability for practical application. Furthermore, RMSE provided a specific range of prediction errors, while MAPE offered an additional accuracy assessment from a percentage standpoint. These indicators established a comprehensive and reliable evaluation framework.

3. Results and Discussion

3.1. Estimation Results of Rare Earth Elements

Through spectral stability assessments performed under diverse external conditions and analysis of their effects on subsequent stages, such as feature extraction, band selection, and estimation modeling, this study identified optimal strategies for accurately estimating REE concentrations from hyperspectral data. The experimental findings confirmed that hyperspectral methods can accurately estimate REE content in marine sediment samples, even without predefined boundary conditions representative of natural environments (Section 2.1 (3)). A comparative assessment of various feature extraction techniques and modeling approaches facilitated the identification of the most effective combinations for individual elements, with the selected methods presented in Table 2.
Table 2 presents the most effective combinations of feature extraction techniques and estimation models tailored for each rare earth element, along with their respective performance evaluation metrics. The accuracy of predicted and observed REE concentrations was quantified using R2, RMSE, RPD, and MAPE as evaluation metrics. The “Method” and “Model” fields specified the most effective spectral feature extraction approaches and regression algorithms determined for each element.
Key findings include the following:
(1) The TLOG-FD-MLP configuration demonstrates excellent predictive capability for light REEs such as La, Ce, Pr, Nd, Sm, and Eu. Most predictions demonstrated R2 values exceeding 0.60, RPD values greater than 1.60, and MAPE within the 13%–21% range. Particularly, La and Ce showed superior estimation performance, with R2 exceeding 0.76 and RPD surpassing 2.00.
(2) In the case of heavy-weight REEs for Gd, Tb, and Sc, combinations involving TLOG-FD or MSC feature extraction coupled with MLP or XGBoost models deliver strong predictive outcomes, achieving R2 values greater than 0.60, RPD above 1.70, and MAPE values ranging from 14 to 19%.
(3) For total REE content, TLOG-FD demonstrated the highest predictive effectiveness. The optimal predictions (R2 = 0.73, RPD = 1.97, and MAPE close to 18%) were achieved using SVR and MLP models.
(4) For Dy, Ho, Er, Tm, Yb, Lu, and Y, the estimation accuracy was comparatively lower, with R2 values ≤ 0.60, RPD below 1.5, and MAPE ranging from 17 to 24%. However, preprocessing approaches such as TLOG-FD or MSC, when integrated with RF, SVR, MLP, or XGBoost models, yield comparatively superior predictive performance within this group.

3.2. Discussion on the Quantitative Estimation of Rare Earth Element Content Using Hyperspectral Data

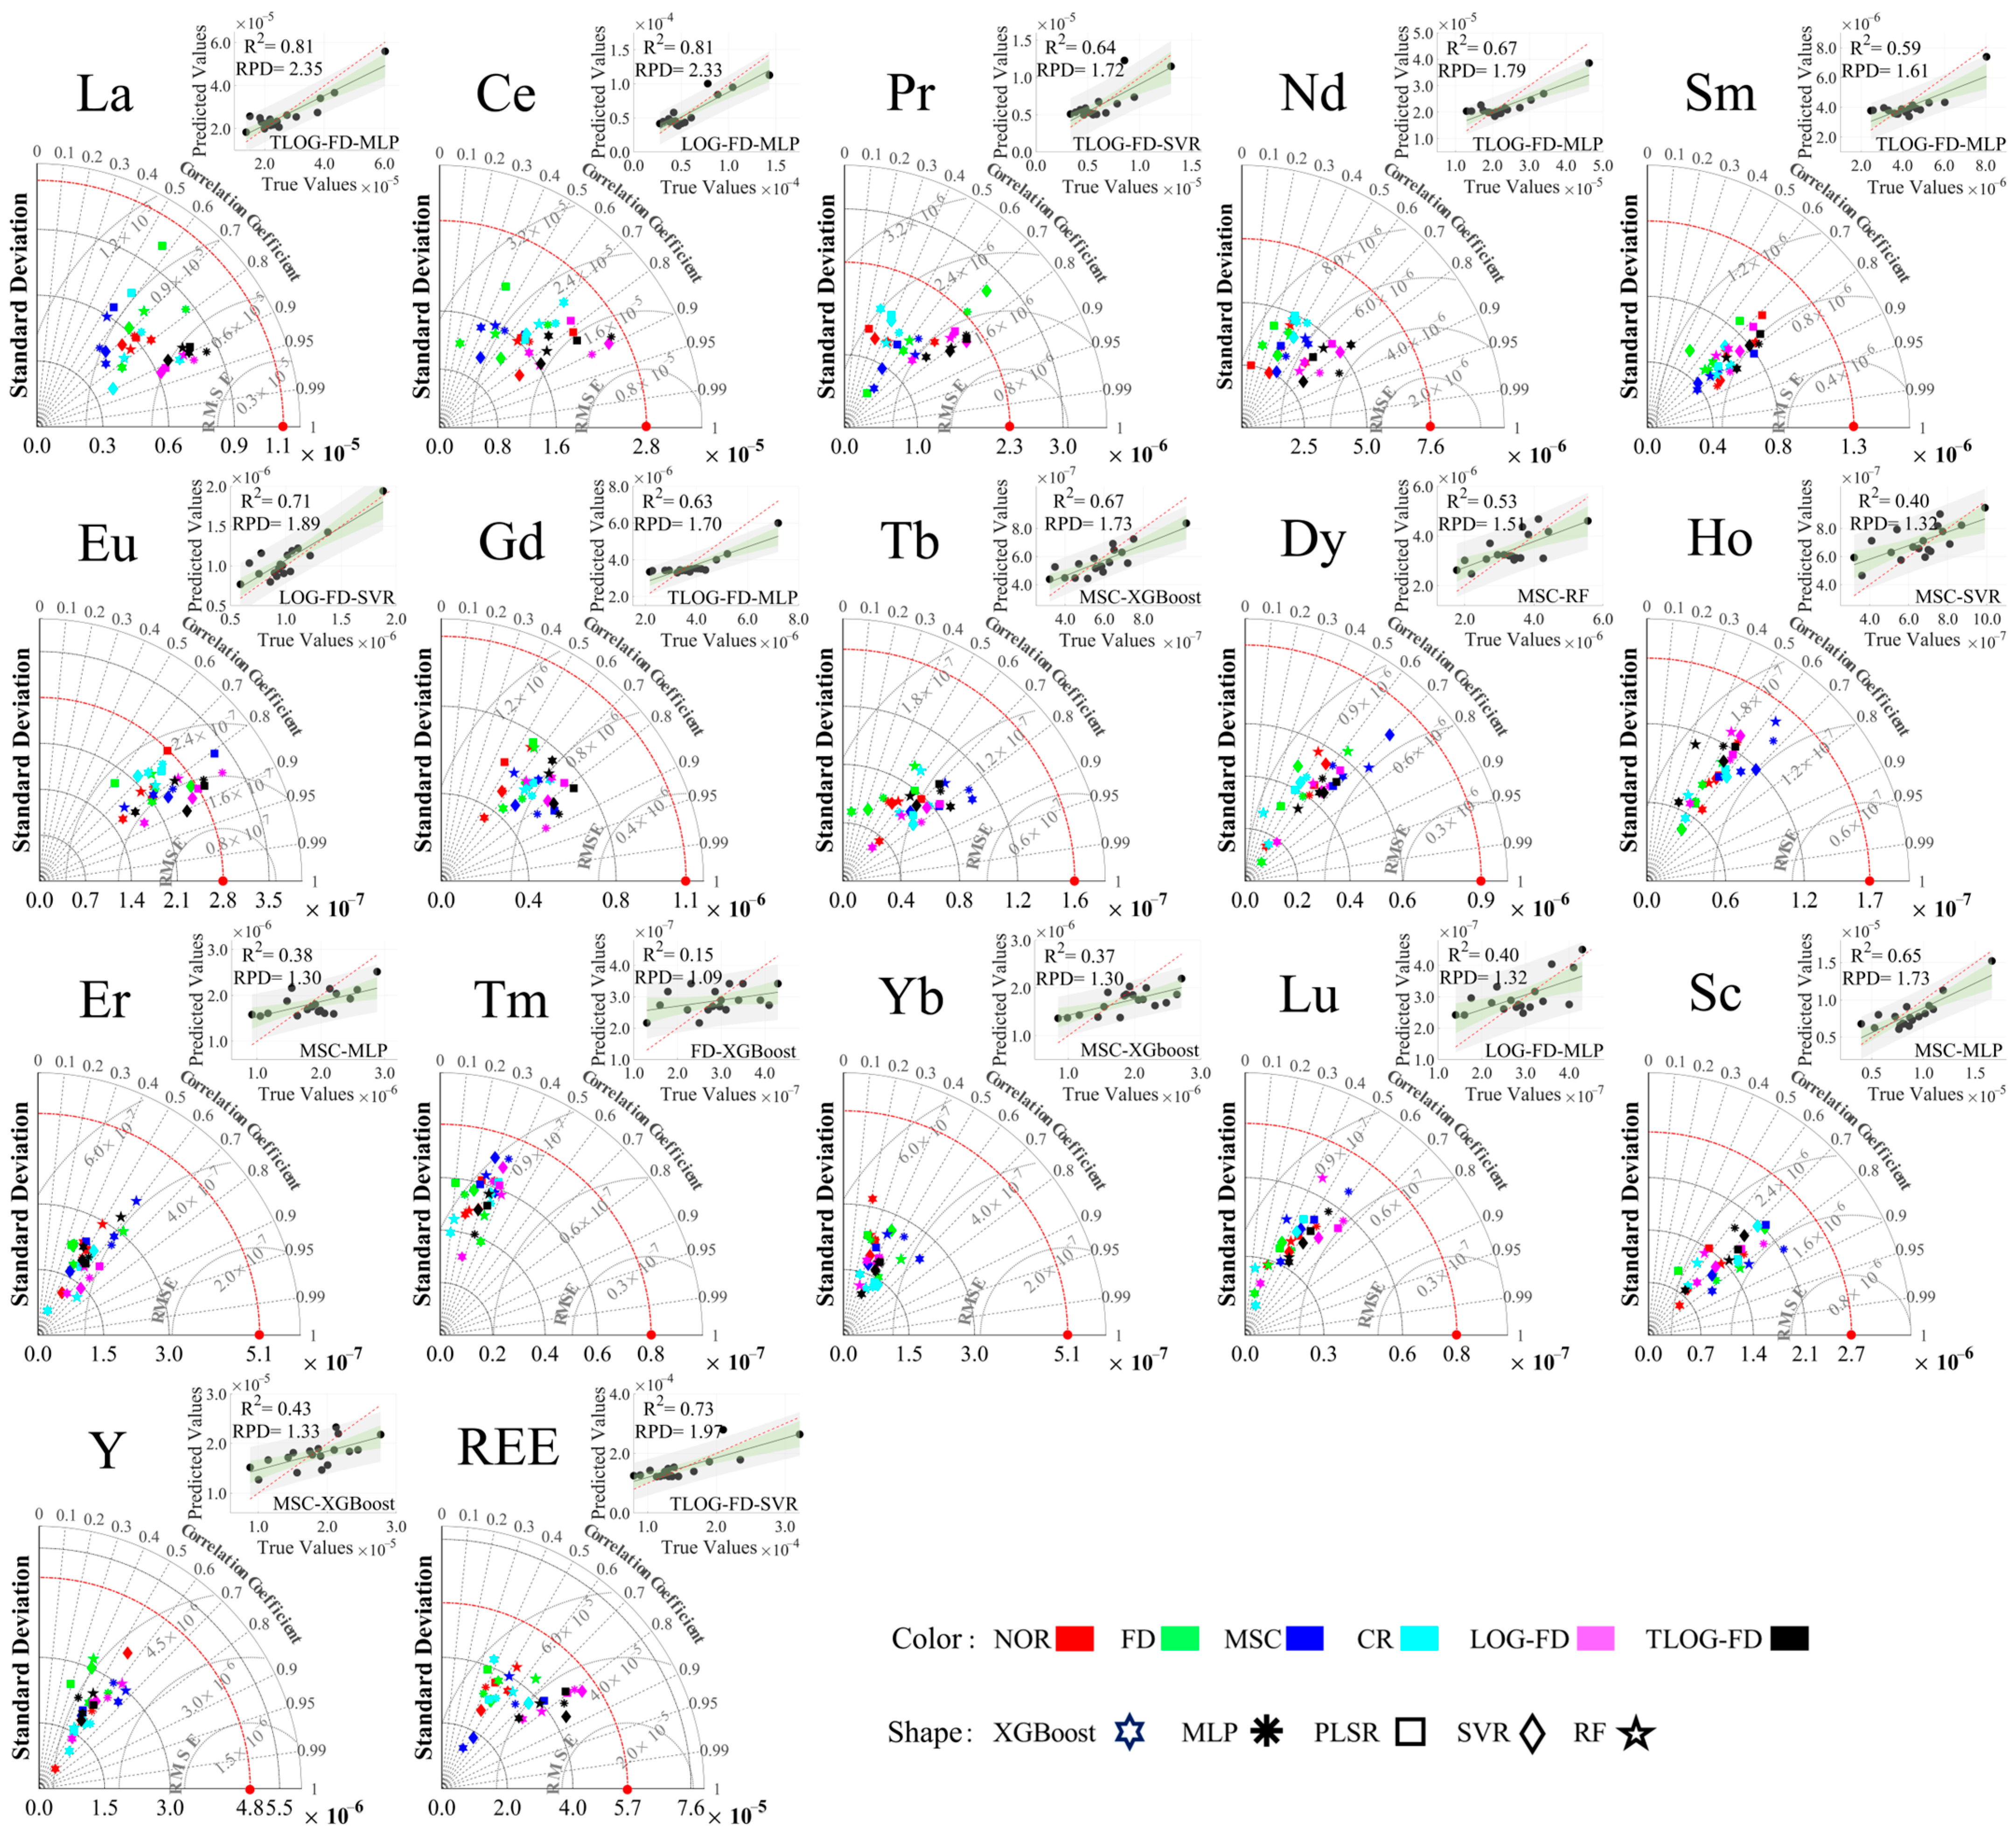
An integrated modeling framework was constructed by combining six spectral feature extraction methods with five regression algorithms to evaluate the performance of various approaches for estimating REE concentrations. These combinations were applied to predict REE content across 18 samples from the prediction dataset (Section 2.6). Model performance was evaluated using four key metrics, including R2, RMSE, RPD, and MAPE. Furthermore, confidence intervals were calculated for the top-performing models to ensure statistical reliability and robustness of the predictions. A Taylor diagram was employed to visually assess and compare the accuracy and effectiveness of different feature extraction–model combinations in estimating REE concentrations for individual elements, as illustrated in Figure 7.
Figure 7 presents a Taylor diagram summarizing the evaluation outcomes of 16 individual REEs and total REE concentrations under various spectral feature extraction techniques and predictive modeling combinations. Color coding represented different feature extraction techniques, and distinct geometric symbols indicate the corresponding estimation models, encompassing a total of 510 evaluations. The visual analysis revealed that predictions for heavy REEs demonstrated higher deviation from the ideal reference point than those for light and total REEs, as evidenced by elevated RMSE values, reduced correlation coefficients, and decreased fitting accuracy, even in the most optimized models.
The analysis revealed that LREEs, particularly La and Ce, along with total REE content, demonstrated superior predictive accuracy, characterized by lower RMSE values and a strong concordance between predicted and actual values. Among the various approaches, the integration of TLOG-FD feature extraction with the MLP model provides the most reliable results, consistently achieving R2 values exceeding 0.60. The estimation models for La and Ce achieved R2 values as high as 0.81. The observed variation in feature extraction performance across certain elements can be attributed to the coexistence of multiple valence states, leading to inconsistent findings across comparable extraction strategies. For instance, the LOG-FD method performed well in capturing the spectral characteristics of Ce. However, predictions for most heavy REEs, including Y, demonstrated significant inconsistencies, with R2 values below 0.60 and RPD values of 1.50. These results reflected fluctuations in model stability, although the MSC feature extraction technique demonstrated comparatively greater consistency and reliability across different elements. Gd emerged with comparatively accurate predictions, possibly due to its strong spectral or elemental associations with LREEs, enabling an effective indirect estimation approach [30]. Elements including Tb, Dy, and Sc demonstrated favorable results when estimated using combination strategies such as MSC-XGBoost, MSC-RF, and MSC-MLP. However, the underlying reasons for the enhanced predictive accuracy observed for certain elements under specific model–method pairings require further detailed analysis.
The experimental procedures and analysis of results indicate that integrating PCA with K-means clustering efficiently reduces data dimensionality while retaining essential information, thus enhancing the overall quality of the dataset. The TLOG-FD method demonstrated a strong capability for extracting spectral features associated with REEs in marine sediments. Meanwhile, MLP was found to be highly effective for REE estimation. Therefore, the “PCA-Kmeans—TLOG-FD—MLP” sequence established a core framework for hyperspectral inversion-based prediction of REE content, providing enhanced prediction accuracy, particularly for LREEs. However, when applied to HREEs, which are generally present at lower concentrations, the predictive performance demonstrated reduced stability. The observed inconsistency, summarized in Table 2, Section 3.1 (4), and Figure 7, was primarily attributed to the low abundance and occurrence forms of these elements, along with the limited spectral range (380–1000 nm) of the hyperspectral data, which constrains the system’s sensitivity to their spectral signals. Moreover, REEs with multiple valence states, such as Ce, Eu, and Sc, presented additional challenges. These elements show significant variability and methodological sensitivity during feature extraction and spectral band selection, leading to shifts in the wavelength regions with the most pronounced spectral responses. Such behavior may originate from the differences in mineral composition and structural characteristics associated with different oxidation states.
Considering the overall findings and the accuracy achieved in estimating REE content using visible-range hyperspectral data appropriate to aquatic environments, hyperspectral imaging demonstrated strong potential for industrial-scale assessment of REE concentrations. Hence, this approach offers a foundation for rapid, efficient, and large-scale evaluation of REE resources.

3.3. Effectiveness and Generalization Ability of Experimental and Method Models

(1) Hyperspectral Data Validation and Optimization in an Experimental Environment Without Specific Condition Constraints: By carefully designing the experimental setup and preparing the samples accordingly, the study maintained the natural conditions of the test environment under undefined boundary constraints. Apart from employing a full-spectrum light source essential for the optimal operation of the hyperspectral system, no artificial boundary conditions were applied to the test subjects. This approach allowed the samples to retain their natural state without external constraints, as illustrated in Figure 1.
Based on the spectral data analysis (Section 2.3), an unsupervised classification approach successfully categorized the samples into four distinct groups, which were then subjected to spectral feature extraction and correlation analysis with their corresponding elemental content. The outcomes, illustrated in Figure 8, alongside insights from Figure 4 and Section 2.3, confirmed that each category effectively represented distinct and meaningful surface characteristics. Among the evaluated combinations, the integrated use of categories 2, 3, and 4 (ks2, ks3, and ks4) yielded the most favorable validation results, indicating that differences in surface texture exert only a minor influence on feature extraction and its subsequent application. The main challenges were arising from spectral mixing and shadow interference. Thus, emphasis should be placed on addressing spectral blending among various target types and developing specialized post-processing strategies. Furthermore, minimizing obstructions during hyperspectral data collection is considered crucial to maintain data integrity. The ks2-ks3-ks4 combination demonstrated enhanced performance, indicating that expanding the number of homogeneous spectral data points enhanced representation of the complete spectral profile of a single sample across different surface forms, contributing to enhanced reliability and extended applicability of the modeling approach. Each sample dataset within this three-class grouping contained roughly 260 points, providing a comprehensive basis for internal validation and repeatability checks. This substantial volume of data increased the statistical reliability and experimental robustness of the developed methodology.
Experimental findings further indicated the strong tolerance of this approach against variability in data acquisition quality and environmental conditions. Post-processing techniques effectively correct for surface heterogeneity and sample instability, preserving the consistency of the spectral data. After refinement in Section 2.3, representative spectra for each sample were constructed by averaging the selected data points (Figure 5). This process enhanced the correspondence between spectral and chemical measurements across all feature extraction methods, validating the effectiveness of the data optimization strategy. Under high-resolution sampling conditions, variations in target surface characteristics demonstrated negligible influence on spectral data quality. Appropriate feature extraction techniques enabled significant reduction of environmental interference, refinement of the data, improvement of model performance, and enhancement of estimation reliability.
(2) Spectral Feature Extraction Methods for Rare Earth Elements in Sediments: REEs are typically found in low concentrations within natural environments and are frequently associated with other minerals. Their enrichment levels vary considerably, governed by geological and environmental factors, with concentrations ranging from a few parts per million to several thousand. Previous research indicated that the characteristic absorption features of REEs were predominantly observed in the visible to near-infrared spectral range [51,52,53,54]. In marine sediments, HREEs are often associated with stable metal elements, biogenic apatite, or micro-nodules, forming complex mixtures owing to their high chemical affinity and similarity [1,55,56]. These characteristics make it challenging to identify and isolate their spectral signals, rendering the choice of an appropriate spectral feature extraction method a crucial step in accurately analyzing REE content.
Figure 9 presents the results of six distinct techniques used to extract the spectral features from the mean spectral curves of 53 sediment samples. Although each method identified multiple absorption features, the complex mixture of minerals demonstrated a spectral overlap, complicating the identification of distinct characteristic bands. In addition to the primary absorption signals, hyperspectral datasets with high resolution revealed numerous minor absorption characteristics, which more accurately reflected the information associated with REE. Based on both considerations and empirical evaluation, the TLOG-FD approach was selected as the preferred feature extraction approach due to its superior performance. TLOG-FD, along with FD and LOG-FD, extracted spectral features by deriving the first-order differences in the spectral data, which accentuates subtle variations between consecutive wavelengths. This technique enhanced weak mineral signatures, improving the resolution of overlapping features and facilitating more precise detection of characteristic absorption peaks. Applying a logarithmic transformation before derivation normalizes data variance, enhancing the consistency and reliability of feature extraction. However, the NOR, CR, and MSC approaches depend primarily on global statistical measures, which may diminish weak yet significant spectral features. While the NOR technique effectively normalized strong signals in high-concentration materials, it failed to adequately resolve the subtle spectral traits associated with REEs, as evidenced in Figure 7. Similarly, MSC, despite its widespread application in airborne spectral studies, lacks the sensitivity required for extracting weak spectral features in sediment samples.
The spectral dataset analyzed in this research demonstrated a skewed (asymmetrical) distribution, inducing significant prediction errors in the modeling process. Applying reciprocal and logarithmic transformations to the original data can reduce this skewness and enhance contrast, particularly in the lower-value ranges. Furthermore, the FD technique efficiently emphasized subtle spectral features, revealing more detailed variation. Therefore, the TLOG-FD approach can compress higher values, enhance distinctions among lower values, while mitigating the heteroscedasticity in skewed datasets. The effectiveness of this method is reflected in Table 2 and Figure 7, demonstrating the strong performance of TLOG-FD in estimating both total REE concentrations and most individual REE contents.
(3) PCCR-FI Rare Earth Element Feature Band Selection Method: The study employed the PCCR-FI feature band selection method to effectively identify and select characteristic spectral bands for each REE (Section 2.5). This method effectively reduced the errors associated with omitting relevant bands or incorrectly including non-informative ones.
As illustrated in Figure 10, the characteristic wavelength bands identified varied considerably across different spectral feature extraction techniques. Using La as a representative case, NOR, FD, and MSC methods predominantly highlighted bands within the 500–600 nm range, whereas CR, LOG-FD, and TLOG-FD methods identified several critical regions in the range of 410–700 nm. The identification of characteristic wavelengths for various REEs is strongly dependent on the selected feature, a trend consistent with previous studies [57,58]. Systematic evaluations of band selection across all REEs demonstrated that the extraction technique directly affected which spectral bands were selected for each element, emphasizing that the effectiveness of spectral analysis relies heavily on the extraction approach.
Furthermore, according to the selected bands and the spectral profiles presented in Figure 5 and Figure 9, the main absorption features within the 410–780 nm range were primarily associated with electronic transitions of metal ions, including F e 2 + , F e 3 + , and M n 3 + . However, the 800 to 1000 nm spectral region was largely influenced by the presence of organic compounds [59,60]. The strong correlations between REEs and these metals or organic compounds form the basis for indirect estimation techniques. In addition to the primary absorption peaks, the high-resolution hyperspectral data revealed numerous subtle absorption features. These weak signals provided deeper insight into the influence of REEs on spectral behavior in the visible range. A complete summary of the band selection results for all REEs is presented in Table 3.
Different spectral feature extraction techniques demonstrated a varying number of characteristic bands. By processing the raw hyperspectral data, these techniques highlighted subtle absorption variations, allowing precise discrimination of spectral features associated with individual REEs. The proposed PCCR-FI method effectively reduced the number of feature bands, reducing the impact of redundant or non-informative data and accurately pinpointing the key spectral positions associated with each element. As detailed in Table 3, depending on the specific element, the PCCR-FI method successfully limited the selected characteristic bands to a small fraction, ranging from 0.8%–4.6% of the total spectral range. By excluding extraneous information, this method reduced noise effects and ensured accurate identification of key spectral bands, particularly at spectral boundaries. This phenomenon decreased the computational complexity and minimized the interference from overlapping or insignificant bands, improving the reliability and efficiency of the estimation model. Empirical evaluation confirmed that PCCR-FI narrowed the visible-spectrum bands for REEs to approximately 20 key wavelengths, significantly improving both prediction speed and precision. Along with the results presented in Table 2, these results confirmed that PCCR-FI effectively selected meaningful spectral bands associated with individual REEs, enabling accurate content estimation. Compared with the previous terrestrial hyperspectral studies [24,25], the hyperspectral data employed in the current study allowed finer discrimination of subtle spectral variations within the range of 380–1000 nm. The refined granularity enabled more precise characterization of absorption features influenced by REE signatures, supporting high-accuracy quantification in marine sediment samples.

3.4. The Limitations and Feasibility of Hyperspectral Estimation of Rare Earth Elements in Sediments

This study investigated the potential of hyperspectral technology for estimating REE concentrations in deep-sea surface sediments, highlighting its strong potential for assessing deep-sea mineral resources. However, it is important to recognize that hyperspectral technology has limitations when applied to the economic evaluation of deposits in such environments, particularly for accurately assessing key indicators like grade, generally requiring rigorous sampling procedures and high-precision chemical analyses [61,62]. Currently, hyperspectral technology remains primarily at the laboratory or research stage, lacking standardized field protocols, and is primarily used to estimate the element content of surface or submarine mineral resources. The construction of this estimation method depends on high-precision metal element data, limiting its practical applicability in economic geology under current conditions.
Despite the aforementioned limitations in economic geology applications, evaluations based on the current use of hyperspectral remote sensing for terrestrial mineral resource assessment indicated that hyperspectral technology already demonstrated considerable resource assessment capabilities [23,25,28,63]. Its primary strengths include a rapid, large-area, and low-cost detection approach, making it a valuable tool for mineral resource exploration and preliminary mineral assessment. With advancements in underwater vehicle technology, hyperspectral technology has increasingly been applied to the exploration of deep-sea mineral resources, demonstrating promising initial results in mapping seabed surface mineral resources [40,41]. Therefore, this paper focuses on evaluating the potential of hyperspectral remote sensing for assessing seabed rare earth resources. Preliminary results indicated that, compared with traditional regional resource assessment methods based on sampling and laboratory analysis, integrating hyperspectral technology with machine learning offers a rapid, large-area, and low-cost detection method for the assessment of deep-sea mineral resources, demonstrating strong application potential.
Beyond the previously mentioned limitations in economic geology applications, the strong absorption of infrared wavelengths by seawater and the complex underwater lighting conditions hinder optimal spectral data acquisition in the infrared region, posing ongoing challenges for the application of underwater hyperspectral technology. This investigation employed high-resolution hyperspectral data within the 380–1000 nm visible spectrum, suitable for aquatic environments, to assess the feasibility of estimating REE concentrations in marine sediment samples. A total of 53 sediment samples, collected from various marine regions along with various sediment types, were analyzed using a comprehensive methodological approach. The workflow, conducted without imposing boundary constraints, encompassed hyperspectral scanning, spectral validation, data refinement, feature extraction, spectral band selection, and REE content prediction. The analysis demonstrated that the light REEs in marine sediments could be reliably estimated using visible-range hyperspectral data, with overall performance metrics of R2 > 0.60 and RPD > 1.60. The elements La and Ce demonstrated particularly high predictive accuracy, achieving R2 > 0.80 and RPD > 2.00. For selected HREEs, estimation accuracy also exceeded R2 > 0.60. The model predicted total REE content with R2 = 0.73 and RPD = 1.97, suggesting that hyperspectral techniques were highly effective for assessing the abundance of most REEs in sedimentary environments. Comparison with previous land-based REE studies using hyperspectral imagery [25] indicated that the 380–1000 nm spectral range maintained strong predictive capability for REE estimation, highlighting the potential applicability of hyperspectral methods for deep-sea REE exploration. Moreover, the experimental findings validated the effectiveness of the TLOG-FD approach in enhancing spectral features, especially for detecting weak REE signals. The proposed PCCR-FI method further enhanced precision by accurately identifying relevant feature bands. With further development, this model framework could substantially reduce computational requirements and improve operational efficiency, offering a valuable tool for future marine geochemical studies.
While this study demonstrated promising results, real-world seafloor conditions are considerably more complex. Elements such as biological interference, the underwater environment, light attenuation, instrument resolution, and the challenges of long-distance data acquisition can all degrade the quality of hyperspectral measurements. Despite accounting for some environmental factors, the full complexity of natural seafloor conditions could not be replicated in this study. Furthermore, the study relied on a small dataset of 53 samples from a limited number of locations; therefore, the model’s results for estimating REE content in other sedimentary environments need to be further investigated. The model’s accuracy and reliability may be uncertain when applied to samples from significantly different environments, including deep-sea clay regions or calcareous/siliceous ooze areas. The model may have primarily captured the characteristic relationships specific to the limited sampled sedimentary environments, potentially reducing its transferability when applied to unknown environments. This research served as an initial step to explore hyperspectral methods for evaluating deep-sea mineral resources. The findings aim to contribute to the wider application of hyperspectral technology in estimating REE content, assessing sedimentary resource potential, and extending its use to other relevant contexts.
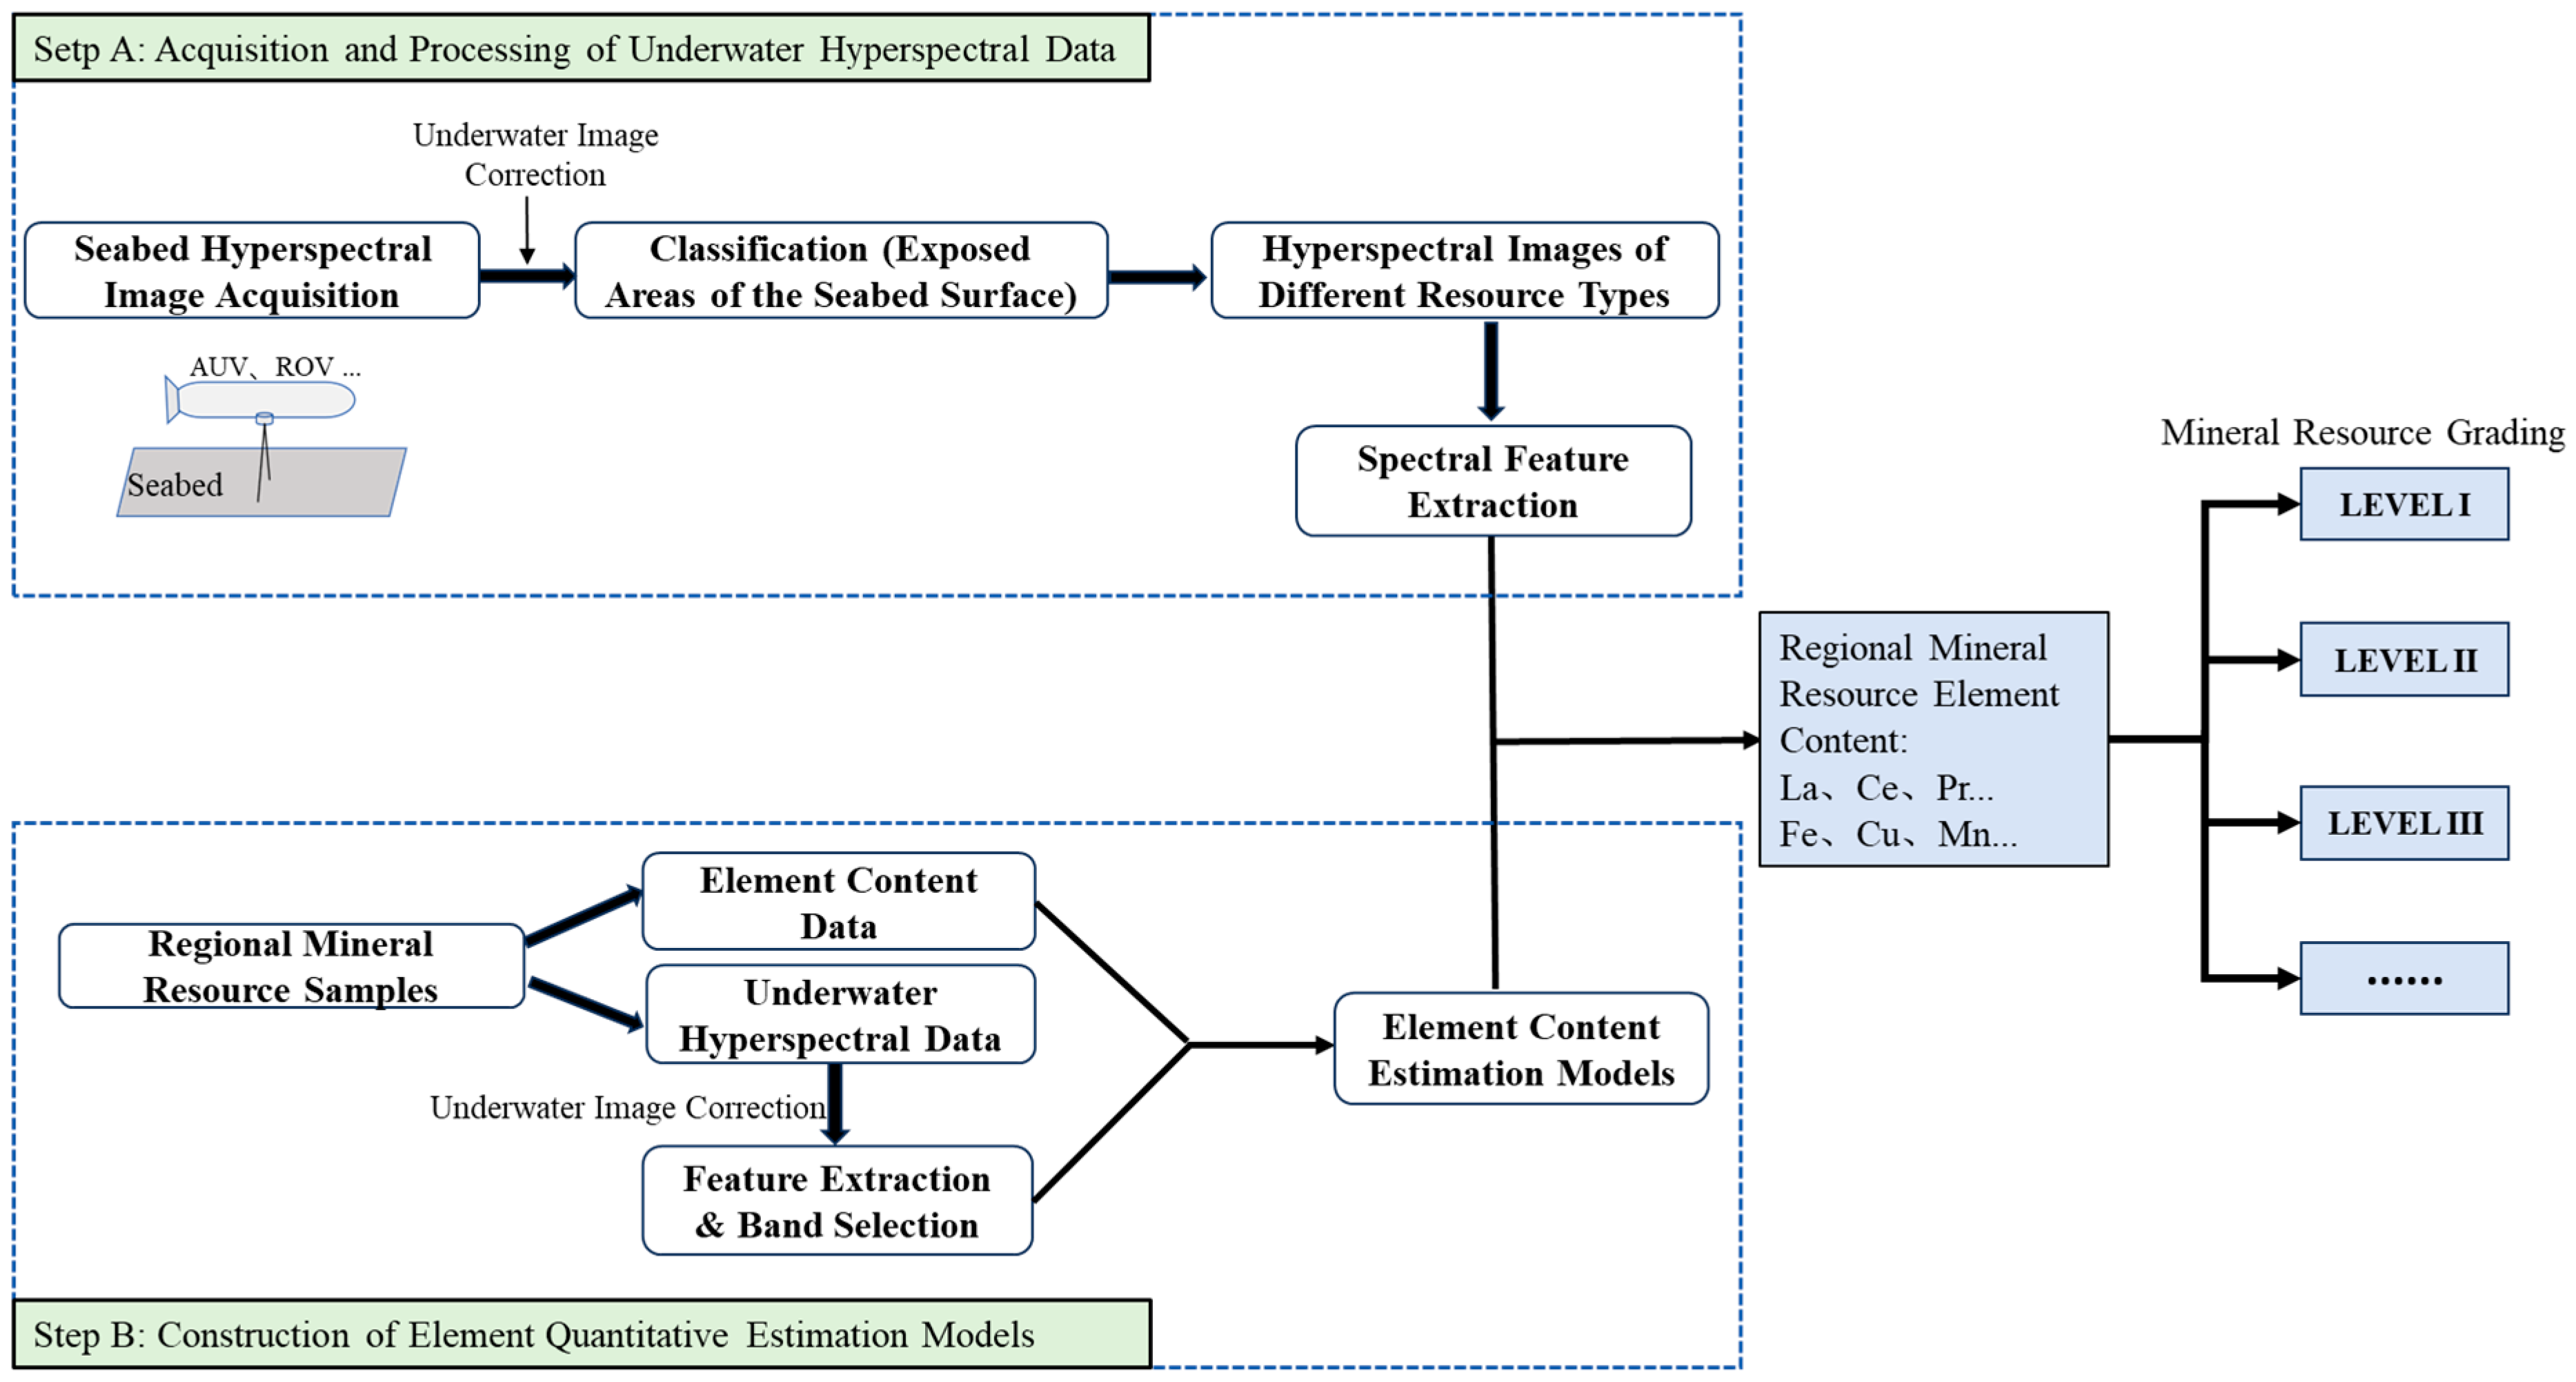
The current study considered the potential application of integrating hyperspectral technology with underwater vehicles, as illustrated in Figure 11. Step A demonstrates that ROVs or AUVs fitted with hyperspectral sensors can quickly capture large-scale data from seabed surface mineral deposits. Classifying these data to distinguish different mineral resource types, including REEs, can significantly improve the quantitative estimation accuracy while simplifying data processing. Step B involves constructing a quantitative estimation model by integrating underwater hyperspectral data with laboratory-derived elemental composition data. Integrating Steps A and B enabled quantitative estimation of valuable metal contents and hierarchical assessment of diverse mineral resources, offering substantial potential for advancing resource evaluation and future deep-sea mining.
Both Step A and Step B in Figure 11 require underwater image correction. Although this study has verified the feasibility of using hyperspectral data in the 380–1000 nm range for quantitative estimation of REEs in sediments, the variability of underwater environments indicated that radiometric correction techniques must be tailored to diverse water quality and optical conditions. Therefore, further in-depth investigation is required, and collaboration with other researchers is anticipated to advance the application of hyperspectral technology in deep-sea mineral resource exploration.

4. Conclusions

Hyperspectral data were collected from sediment samples representing diverse marine regions and sediment types without imposing boundary constraints. The experimental framework encompassed assessments of spectral stability, validity analysis, data optimization, feature extraction, characteristic band identification, and quantitative estimation of REE concentrations. The experimental results and corresponding analyses verified the potential of hyperspectral technology to accurately detect and quantify REEs in sediment samples.
(1) Under high-resolution sampling conditions, variations in target geometry demonstrated a negligible impact on hyperspectral data quality or applicability. Using appropriate feature extraction methods effectively minimized environmental interferences, enhancing model robustness and improving the precision of estimation results.
(2) The TLOG-FD demonstrated high efficiency in isolating spectral signatures associated with rare earth elements, while the PCCR-FI method accurately identified key feature bands for each REE. This approach reduced the number of characteristic bands to a range of 7–17 bands within the 380–1000 nm visible spectrum (2.5 nm resolution), improving both the precision and computational efficiency of the process. The MLP nonlinear model emerged as the most effective approach in estimating REE concentrations in the conducted experiments.
(3) The “PCA-Kmeans—TLOG-FD—MLP” method exhibited superior performance in spectral data processing and in the quantitative estimation of LREEs, certain HREEs, and total REEs in seabed samples. The estimation of LREEs generally achieved R2 values of above 0.60 and RPD values of over 1.60, with La and Ce demonstrating particularly stronger performance (R2 = 0.81 and RPD > 2.00). For some HREEs, the estimation accuracy yielded R2 ≤ 0.6 and RPD < 1.5, suggesting potential limitations in both the applied feature extraction technique and the estimation model.
The current study quantitatively estimated the REEs using visible hyperspectral data in the 380–1000 nm wavelength range, demonstrating the feasibility of efficiently acquiring spectral data for REEs and rapidly estimating elemental contents through hyperspectral technology. The findings provide valuable insights for advancing future research and practical applications in related marine and geochemical studies.

Author Contributions

Conceptualization, D.L. and S.Y.; methodology, D.L.; validation, G.Y., J.Y. and C.Y.; investigation, X.L., X.R. and M.H.; resources, G.Y. and X.L.; data curation, Y.L., Y.H. and Y.Z.; writing—original draft preparation, D.L.; writing—review and editing, D.L., S.Y. and G.Y.; visualization, D.L.; supervision, Z.C. and D.D.; funding acquisition, G.Y. All authors have read and agreed to the published version of the manuscript.

Funding

This work was supported by National Key R&D Program of China (2022YFC2803602, 2022YFC2806002), Laoshan Laboratory (LSKJ202203602), National Natural Science Foundation of China (42276080).

Data Availability Statement

The datasets presented in this study are not readily available because they are part of an ongoing marine sediment analysis study and require permission from the research institution.

Conflicts of Interest

Xiaofeng Liu is employee of The First Company of China Eighth Engineering Bureau Ltd. The paper reflects the views of the scientists and not the company.

References

  1. Kato, Y.; Fujinaga, K.; Nakamura, K.; Takaya, Y.; Kitamura, K.; Ohta, J.; Toda, R.; Nakashima, T.; Iwamori, H. Deep-sea mud in the Pacific Ocean as a potential resource for rare-earth elements. Nat. Geosci. 2011, 4, 535–539. [Google Scholar] [CrossRef]
  2. Shi, X.; Bi, D.; Huang, M.; Yu, M.; Luo, Y.; Zhou, T.; Zhang, Z.; Liu, J. Distribution and metallogenesis of deep-sea rare earth elements. Geol. Bull. China 2021, 40, 195–208. [Google Scholar]
  3. Lu, D.; Mao, J.; Ye, H.; Wang, P.; Chao, W.; Yu, M. Geochemistry of scheelite from Jiangligou skarn W-(Cu-Mo) deposit in the West Qinling orogenic belt, Northwest China: Implication on the multistage ore-forming processes. Ore Geol. Rev. 2023, 159, 105525. [Google Scholar] [CrossRef]
  4. Huang, M.; Shi, X.; Bi, D.; Yu, M.; Li, L.; Li, J.; Zhang, P.; Zhang, X.; Liu, J.; Yang, G.; et al. Advances on the study of exploration and development of deep-sea rare earth resources. Chin. J. Nonferrous Met. 2021, 31, 2665–2681. [Google Scholar]
  5. Ding, Z.; Liu, B.; Liu, Z.; Xin, H. Research on multi-function in-situ detect miniature probe of sea sediment. J. Electron. Meas. Instrum. 2009, 23, 44–48. [Google Scholar]
  6. Kan, G.; Liu, B.; Han, G.; Li, G.; Zhao, Y. Application of in-situ measurement technology to the survey of seafloor sediment acoustic properties in the Huanghai Sea. Acta Oceanol. Sin. 2010, 32, 88–94. [Google Scholar]
  7. Zhu, Y.; Bao, R.; Zhu, L.; Jiang, S.; Chen, H.; Zhang, L.; Zhou, Y. Investigating the provenances and transport mechanisms of surface sediments in the offshore muddy area of Shandong Peninsula: Insights from REE analyses. J. Mar. Syst. 2022, 226, 103671. [Google Scholar] [CrossRef]
  8. Graul, S.; Kallaste, T.; Pajusaar, S.; Urston, K.; Gregor, A.; Moilanen, M.; Ndiaye, M.; Hints, R. REE + Y distribution in Tremadocian shelly phosphorites (Toolse, Estonia): Multi-stages enrichment in shallow marine sediments during early diagenesis. J. Geochem. Explor. 2023, 254, 107311. [Google Scholar] [CrossRef]
  9. Ouyang, A.; Xiong, W.; Li, X.; Chen, D.; Zhang, L.; Jiang, P. Occurrence and screening- flotation separation for the beneficiation of rare earth elements and yttrium (REY) in core sediments from the Pacific Ocean. Mar. Geol. 2023, 462, 107097. [Google Scholar] [CrossRef]
  10. Jia, Y.; Zhang, L.; Wu, D.; Song, C.; Yuan, W.; Li, L. Comparative analysis of grassland biomass inversion models based on unmanned aerial vehicle multispectral data. Acta Ecol. Sin. 2024, 44, 6854–6864. [Google Scholar]
  11. Liang, W.; Wu, Y.; Shi, Y.; Wang, D.; Wang, Y. Inversion of Taipu River water quality parameters by UAV hyperspectral imaging technology. Bull. Surv. Mapp. 2024, 4, 29–34. [Google Scholar] [CrossRef]
  12. Patel, A.K.; Ghosh, J.K.; Pande, S.; Sayyad, S.U. Deep-Learning-Based Approach for Estimation of Fractional Abundance of Nitrogen in Soil From Hyperspectral Data. IEEE J. Sel. Top. Appl. Earth Obs. Remote Sens. 2020, 13, 6495–6511. [Google Scholar] [CrossRef]
  13. Xu, L.; Shi, S.; Gong, W.; Shi, Z.; Qu, F.; Tang, X.; Chen, B.; Sun, J. Improving leaf chlorophyll content estimation through constrained PROSAIL model from airborne hyperspectral and LiDAR data. Int. J. Appl. Earth Obs. Geoinf. 2022, 115, 103128. [Google Scholar] [CrossRef]
  14. Zhang, M.; Chen, T.; Gu, X.; Kuai, Y.; Wang, C.; Chen, D.; Zhao, C. UAV-borne hyperspectral estimation of nitrogen content in tobacco leaves based on ensemble learning methods. Comput. Electron. Agric. 2023, 211, 108008. [Google Scholar] [CrossRef]
  15. Bian, Z.; Sun, L.; Tian, K.; Liu, B.; Huang, B.; Wu, L. Estimation of multi-media metal(loid)s around abandoned mineral processing plants using hyperspectral technology and extreme learning machine. Environ. Sci. Pollut. Res. 2022, 30, 19495–19512. [Google Scholar] [CrossRef]
  16. Zhang, Z.-H.; Guo, F.; Xu, Z.; Yang, X.-Y.; Wu, K.-Z. On retrieving the chromium and zinc concentrations in the arable soil by the hyperspectral reflectance based on the deep forest. Ecol. Indic. 2022, 144, 109440. [Google Scholar] [CrossRef]
  17. Zhu, C.; Ding, J.; Zhang, Z.; Wang, Z. Exploring the potential of UAV hyperspectral image for estimating soil salinity: Effects of optimal band combination algorithm and random forest. Spectrochim. Acta A 2022, 279, 121416. [Google Scholar] [CrossRef]
  18. Tan, J.; Ding, J.; Wang, Z.; Han, L.; Wang, X.; Li, Y.; Zhang, Z.; Meng, S.; Cai, W.; Hong, Y. Estimating soil salinity in mulched cotton fields using UAV-based hyperspectral remote sensing and a Seagull Optimization Algorithm-Enhanced Random Forest Model. Comput. Electron. Agric. 2024, 221, 109017. [Google Scholar] [CrossRef]
  19. Zhong, L.; Yang, S.; Chu, X.; Sun, Z.; Li, J. Inversion of heavy metal copper content in soil-wheat systems using hyperspectral techniques and enrichment characteristics. Sci. Total Environ. 2024, 907, 168104. [Google Scholar] [CrossRef]
  20. Tan, K.; Zhu, L.; Wang, X. A Hyperspectral Feature Selection Method for Soil Organic Matter Estimation Based on an Improved Weighted Marine Predators Algorithm. IEEE Trans. Geosci. Remote Sens. 2025, 63, 1–11. [Google Scholar] [CrossRef]
  21. Chen, Y.; Wang, M.; Li, P. Study on the Geochemical Anomalies Identification of REE Based on HJ-1A-HSI. Spectrosc. Spectr. Anal. 2015, 35, 3172–3175. [Google Scholar]
  22. Zimmermann, R.; Brandmeier, M.; Andreani, L.; Mhopjeni, K.; Gloaguen, R. Remote Sensing Exploration of Nb-Ta-LREE-Enriched Carbonatite (Epembe/Namibia). Remote Sens. 2016, 8, 620. [Google Scholar] [CrossRef]
  23. Lorenz, S.; Beyer, J.; Fuchs, M.; Seidel, P.; Turner, D.; Heitmann, J.; Gloaguen, R. The Potential of Reflectance and Laser Induced Luminescence Spectroscopy for Near-Field Rare Earth Element Detection in Mineral Exploration. Remote Sens. 2019, 11, 21. [Google Scholar] [CrossRef]
  24. Cheng, G.; Li, J.; Wang, C.; Hu, Z.; Ning, Q. Study on Hyperspectral Quantitative Inversion of Ionic Rare Earth Ores. Spectrosc. Spectr. Anal. 2019, 39, 1571–1578. [Google Scholar]
  25. Cheng, G.; Zhang, H.; Li, H.; Deng, X.; Elatikpo, S.M.; Li, J.; Hu, Z.; Li, G. Quantitative Inversion of REEs in Ion-Adsorbed Rare Earth Ores from the Liutang Area (South China), Based on Measured Hyperspectral Data. J. Earth Sci. 2023, 34, 1068–1082. [Google Scholar] [CrossRef]
  26. Jia, X.; Hu, B.; Marchant, B.P.; Zhou, L.; Shi, Z.; Zhu, Y. A methodological framework for identifying potential sources of soil heavy metal pollution based on machine learning: A case study in the Yangtze Delta, China. Environ. Pollut. 2019, 250, 601–609. [Google Scholar] [CrossRef]
  27. Acosta, I.C.C.; Khodadadzadeh, M.; Tolosana-Delgado, R.; Gloaguen, R. Drill-Core Hyperspectral and Geochemical Data Integration in a Superpixel-Based Machine Learning Framework. IEEE J. Sel. Top. Appl. Earth Obs. Remote Sens. 2020, 13, 4214–4228. [Google Scholar] [CrossRef]
  28. Boesche, N.K.; Rogass, C.; Lubitz, C.; Brell, M.; Herrmann, S.; Mielke, C.; Tonn, S.; Appelt, O.; Altenberger, U.; Kaufmann, H. Hyperspectral REE (Rare Earth Element) Mapping of Outcrops—Applications for Neodymium Detection. Remote Sens. 2015, 7, 5160–5186. [Google Scholar] [CrossRef]
  29. Huang, Z.; Huang, W.; Li, S.; Ni, B.; Zhang, Y.; Wang, M.; Chen, M.; Zhu, F. Inversion Evaluation of Rare Earth Elements in Soil by Visible-Shortwave Infrared Spectroscopy. Remote Sens. 2021, 13, 4886. [Google Scholar] [CrossRef]
  30. Shen, Q.; Xia, K.; Zhang, S.; Kong, C.; Hu, Q.; Yang, S. Hyperspectral indirect inversion of heavy-metal copper in reclaimed soil of iron ore area. Spectrochim. Acta A 2019, 222, 117191. [Google Scholar] [CrossRef]
  31. Ye, M.; Zhu, L.; Li, X.; Ke, Y.; Huang, Y.; Chen, B.; Yu, H.; Li, H.; Feng, H. Estimation of the soil arsenic concentration using a geographically weighted XGBoost model based on hyperspectral data. Sci. Total Environ. 2023, 858, 159798. [Google Scholar] [CrossRef]
  32. Zhang, T.; Fu, Q.; Tian, R.; Zhang, Y.; Sun, Z. A spectrum contextual self-attention deep learning network for hyperspectral inversion of soil metals. Ecol. Indic. 2023, 152, 110351. [Google Scholar] [CrossRef]
  33. Ma, X.; Wang, J.; Zhou, K.; Zhang, W.; Zhang, Z.; De Maeyer, P.; Van de Voorde, T. New data-driven estimation of metal element in rocks using a hyperspectral data and geochemical data. Ore Geol. Rev. 2024, 165, 105877. [Google Scholar] [CrossRef]
  34. Subi, X.; Eziz, M.; Zhong, Q.; Li, X. Estimating the chromium concentration of farmland soils in an arid zone from hyperspectral reflectance by using partial least squares regression methods. Ecol. Indic. 2024, 161, 111987. [Google Scholar] [CrossRef]
  35. Chen, L.; Lai, J.; Tan, K.; Wang, X.; Chen, Y.; Ding, J. Development of a soil heavy metal estimation method based on a spectral index: Combining fractional-order derivative pretreatment and the absorption mechanism. Sci. Total Environ. 2022, 813, 151882. [Google Scholar] [CrossRef]
  36. Wang, G.; Lee, Z.; Mishra, D.R.; Ma, R. Retrieving absorption coefficients of multiple phytoplankton pigments from hyperspectral remote sensing reflectance measured over cyanobacteria bloom waters. Limnol. Oceanogr. Methods 2016, 14, 432–447. [Google Scholar] [CrossRef]
  37. Wang, M.; Yang, J.; Liu, S.; Gu, Y.; Xu, M.; Ma, Y.; Zhang, J.; Wan, J. Quantitative Inversion of Oil Film Thickness Based on Airborne Hyperspectral Data Using the 1DCNN_GRU Model. IEEE Trans. Geosci. Remote Sens. 2023, 61, 1–16. [Google Scholar] [CrossRef]
  38. Niu, C.; Tan, K.; Wang, X.; Du, P.; Pan, C. A semi-analytical approach for estimating inland water inherent optical properties and chlorophyll a using airborne hyperspectral imagery. Int. J. Appl. Earth Obs. Geoinf. 2024, 128, 103774. [Google Scholar] [CrossRef]
  39. Xue, Q.; Bai, H.; Li, H.; Wang, Y.; Zhang, D. Development of Underwater Hyperspectral Imaging Detecting Technology (Invited). Acta Photonica Sin. 2021, 50, 9–34. [Google Scholar]
  40. Dumke, I.; Nornes, S.M.; Purser, A.; Marcon, Y.; Ludvigsen, M.; Ellefmo, S.L.; Johnsen, G.; Søreide, F. First hyperspectral imaging survey of the deep seafloor: High-resolution mapping of manganese nodules. Remote Sens. Environ. 2018, 209, 19–30. [Google Scholar] [CrossRef]
  41. Dumke, I.; Ludvigsen, M.; Ellefmo, S.L.; Søreide, F.; Johnsen, G.; Murton, B.J. Underwater Hyperspectral Imaging Using a Stationary Platform in the Trans-Atlantic Geotraverse Hydrothermal Field. IEEE Trans. Geosci. Remote Sens. 2019, 57, 2947–2962. [Google Scholar] [CrossRef]
  42. Savitzky, A.; Golay, M. Smoothing and Differentiation of Data by Simplified Least Squares Procedures. Anal. Chem. 1964, 36, 1627–1639. [Google Scholar] [CrossRef]
  43. Zhang, X.; Sun, W.; Cen, Y.; Zhang, L.; Wang, N. Predicting cadmium concentration in soils using laboratory and field reflectance spectroscopy. Sci. Total Environ. 2019, 650, 321–334. [Google Scholar] [CrossRef]
  44. Hanafi, M.; Ouertani, S.S.; Boccard, J.; Mazerolles, G.; Rudaz, S. Multi-way PLS regression: Monotony convergence of tri-linear PLS2 and optimality of parameters. Comput. Stat. Data Anal. 2015, 83, 129–139. [Google Scholar] [CrossRef]
  45. Wold, S.; Sjöström, M.; Eriksson, L. PLS-regression: A basic tool of chemometrics. Chemom. Intell. Lab. Syst. 2001, 58, 109–130. [Google Scholar] [CrossRef]
  46. Chen, T.; Guestrin, C. XGBoost: A Scalable Tree Boosting System. In Proceedings of the 22nd ACM SIGKDD International Conference on Knowledge Discovery, San Francisco, CA, USA, 13–17 August 2016. [Google Scholar]
  47. Ma, M.; Zhao, G.; He, B.; Li, Q.; Dong, H.; Wang, S.; Wang, Z. XGBoost-based method for flash flood risk assessment. J. Hydrol. 2021, 598, 126382. [Google Scholar] [CrossRef]
  48. Cortes, C.; Vapnik, V. Support-Vector Networks. Mach. Learn. 1995, 20, 273–297. [Google Scholar] [CrossRef]
  49. Breiman, L. Random Forests. Mach. Learn. 2001, 45, 5–32. [Google Scholar] [CrossRef]
  50. Zhang, J.; Jing, X.; Song, X.; Zhang, T.; Duan, W.; Su, J. Hyperspectral estimation of wheat stripe rust using fractional order differential equations and Gaussian process methods. Comput. Electron. Agric. 2023, 206, 107671. [Google Scholar] [CrossRef]
  51. Batsanov, S.S.; Derbeneva, S.S.; Batsanova, L.R. Electronic spectra of fluorides, oxyfluorides, and oxides of rare-earth metals. Appl. Spectrosc. 1969, 10, 240–242. [Google Scholar] [CrossRef]
  52. Möller, V.; Williams-Jones, A.E. A hyperspectral study (V-NIR-SWIR) of the Nechalacho REE-Nb-Zr deposit, Canada. Geochem. Explor. 2018, 188, 194–215. [Google Scholar] [CrossRef]
  53. Dai, J.; Wu, Y.; Ling, T. Reflectance Spectroscopy and Hyperspectral Detection of Rare Earth Element. Spectrosc. Spectr. Anal. 2018, 38, 3801–3808. [Google Scholar]
  54. Koerting, F.; Koellner, N.; Kuras, A.; Boesche, N.K.; Rogass, C.; Mielke, C.; Elger, K.; Altenberger, U. A solar optical hyperspectral library of rare-earth-bearing minerals, rare-earth oxide powders, copper-bearing minerals and Apliki mine surface samples. Earth Syst. Sci. Data 2021, 13, 923–942. [Google Scholar] [CrossRef]
  55. Bi, D.; Shi, X.; Huang, M.; Yu, M.; Zhou, T.; Zhang, Y.; Zhu, A.; Shi, M.; Fang, X. Geochemical and mineralogical characteristics of deep-sea sediments from the western North Pacific Ocean: Constraints on the enrichment processes of rare earth elements. Ore Geol. Rev. 2021, 138, 104318. [Google Scholar] [CrossRef]
  56. Li, J.; Sun, C.; Jiang, F.; Gao, F.; Zheng, Y. Distribution pattern and geochemical analysis of rare earth elements in deep-ocean sediments. J. Oceanol. Limnol. 2021, 39, 79–88. [Google Scholar] [CrossRef]
  57. Feng, X.; Chen, H.; Chen, Y.; Zhang, C.; Liu, X.; Weng, H.; Xiao, S.; Nie, P.; He, Y. Rapid detection of cadmium and its distribution in Miscanthus sacchariflorus based on visible and near-infrared hyperspectral imaging. Sci. Total Environ. 2019, 659, 1021–1031. [Google Scholar] [CrossRef] [PubMed]
  58. Dai, X.; Wang, Z.; Liu, S.; Yao, Y.; Zhao, R.; Xiang, T.; Fu, T.; Feng, H.; Xiao, L.; Yang, X.; et al. Hyperspectral imagery reveals large spatial variations of heavy metal content in agricultural soil—A case study of remote-sensing inversion based on Orbita Hyperspectral Satellites (OHS) imagery. J. Clean. Prod. 2022, 380, 134878. [Google Scholar] [CrossRef]
  59. Xu, M.; Wu, S.; Zhou, S.; Liao, F.; Ma, C.; Zhu, C. Hyperspectral reflectance models for retrieving heavy metal content: Application in the archaeological soil. J. Infrared Millim. Waves 2012, 30, 109–114. [Google Scholar] [CrossRef]
  60. Jeong, Y.S.; Yu, J.; Wang, L.; Lee, K.-J. Bulk scanning method of a heavy metal concentration in tailings of a gold mine using SWIR hyperspectral imaging system. Int. J. Appl. Earth Obs. Geoinf. 2021, 102, 102382. [Google Scholar] [CrossRef]
  61. Priester, M.; Ericsson, M.; Dolega, P.; Löf, O. Mineral grades: An important indicator for environmental impact of mineral exploitation. Miner. Econ. 2019, 32, 49–73. [Google Scholar] [CrossRef]
  62. Rosera, J.M.; Lederer, G.W.; Schuenemeyer, J.H. Statistical approaches for modeling correlated grade and tonnage distributions and applications for mineral resource assessments. Appl. Comput. Geosci. 2025, 26, 100240. [Google Scholar] [CrossRef]
  63. Neave, D.A.; Black, M.; Riley, T.R.; Gibson, S.A.; Ferrier, G.; Wall, F.; Broom-Fendley, S. On the Feasibility of Imaging Carbonatite-Hosted Rare Earth Element Deposits Using Remote Sensing. Econ. Geol. 2016, 111, 641–665. [Google Scholar] [CrossRef]
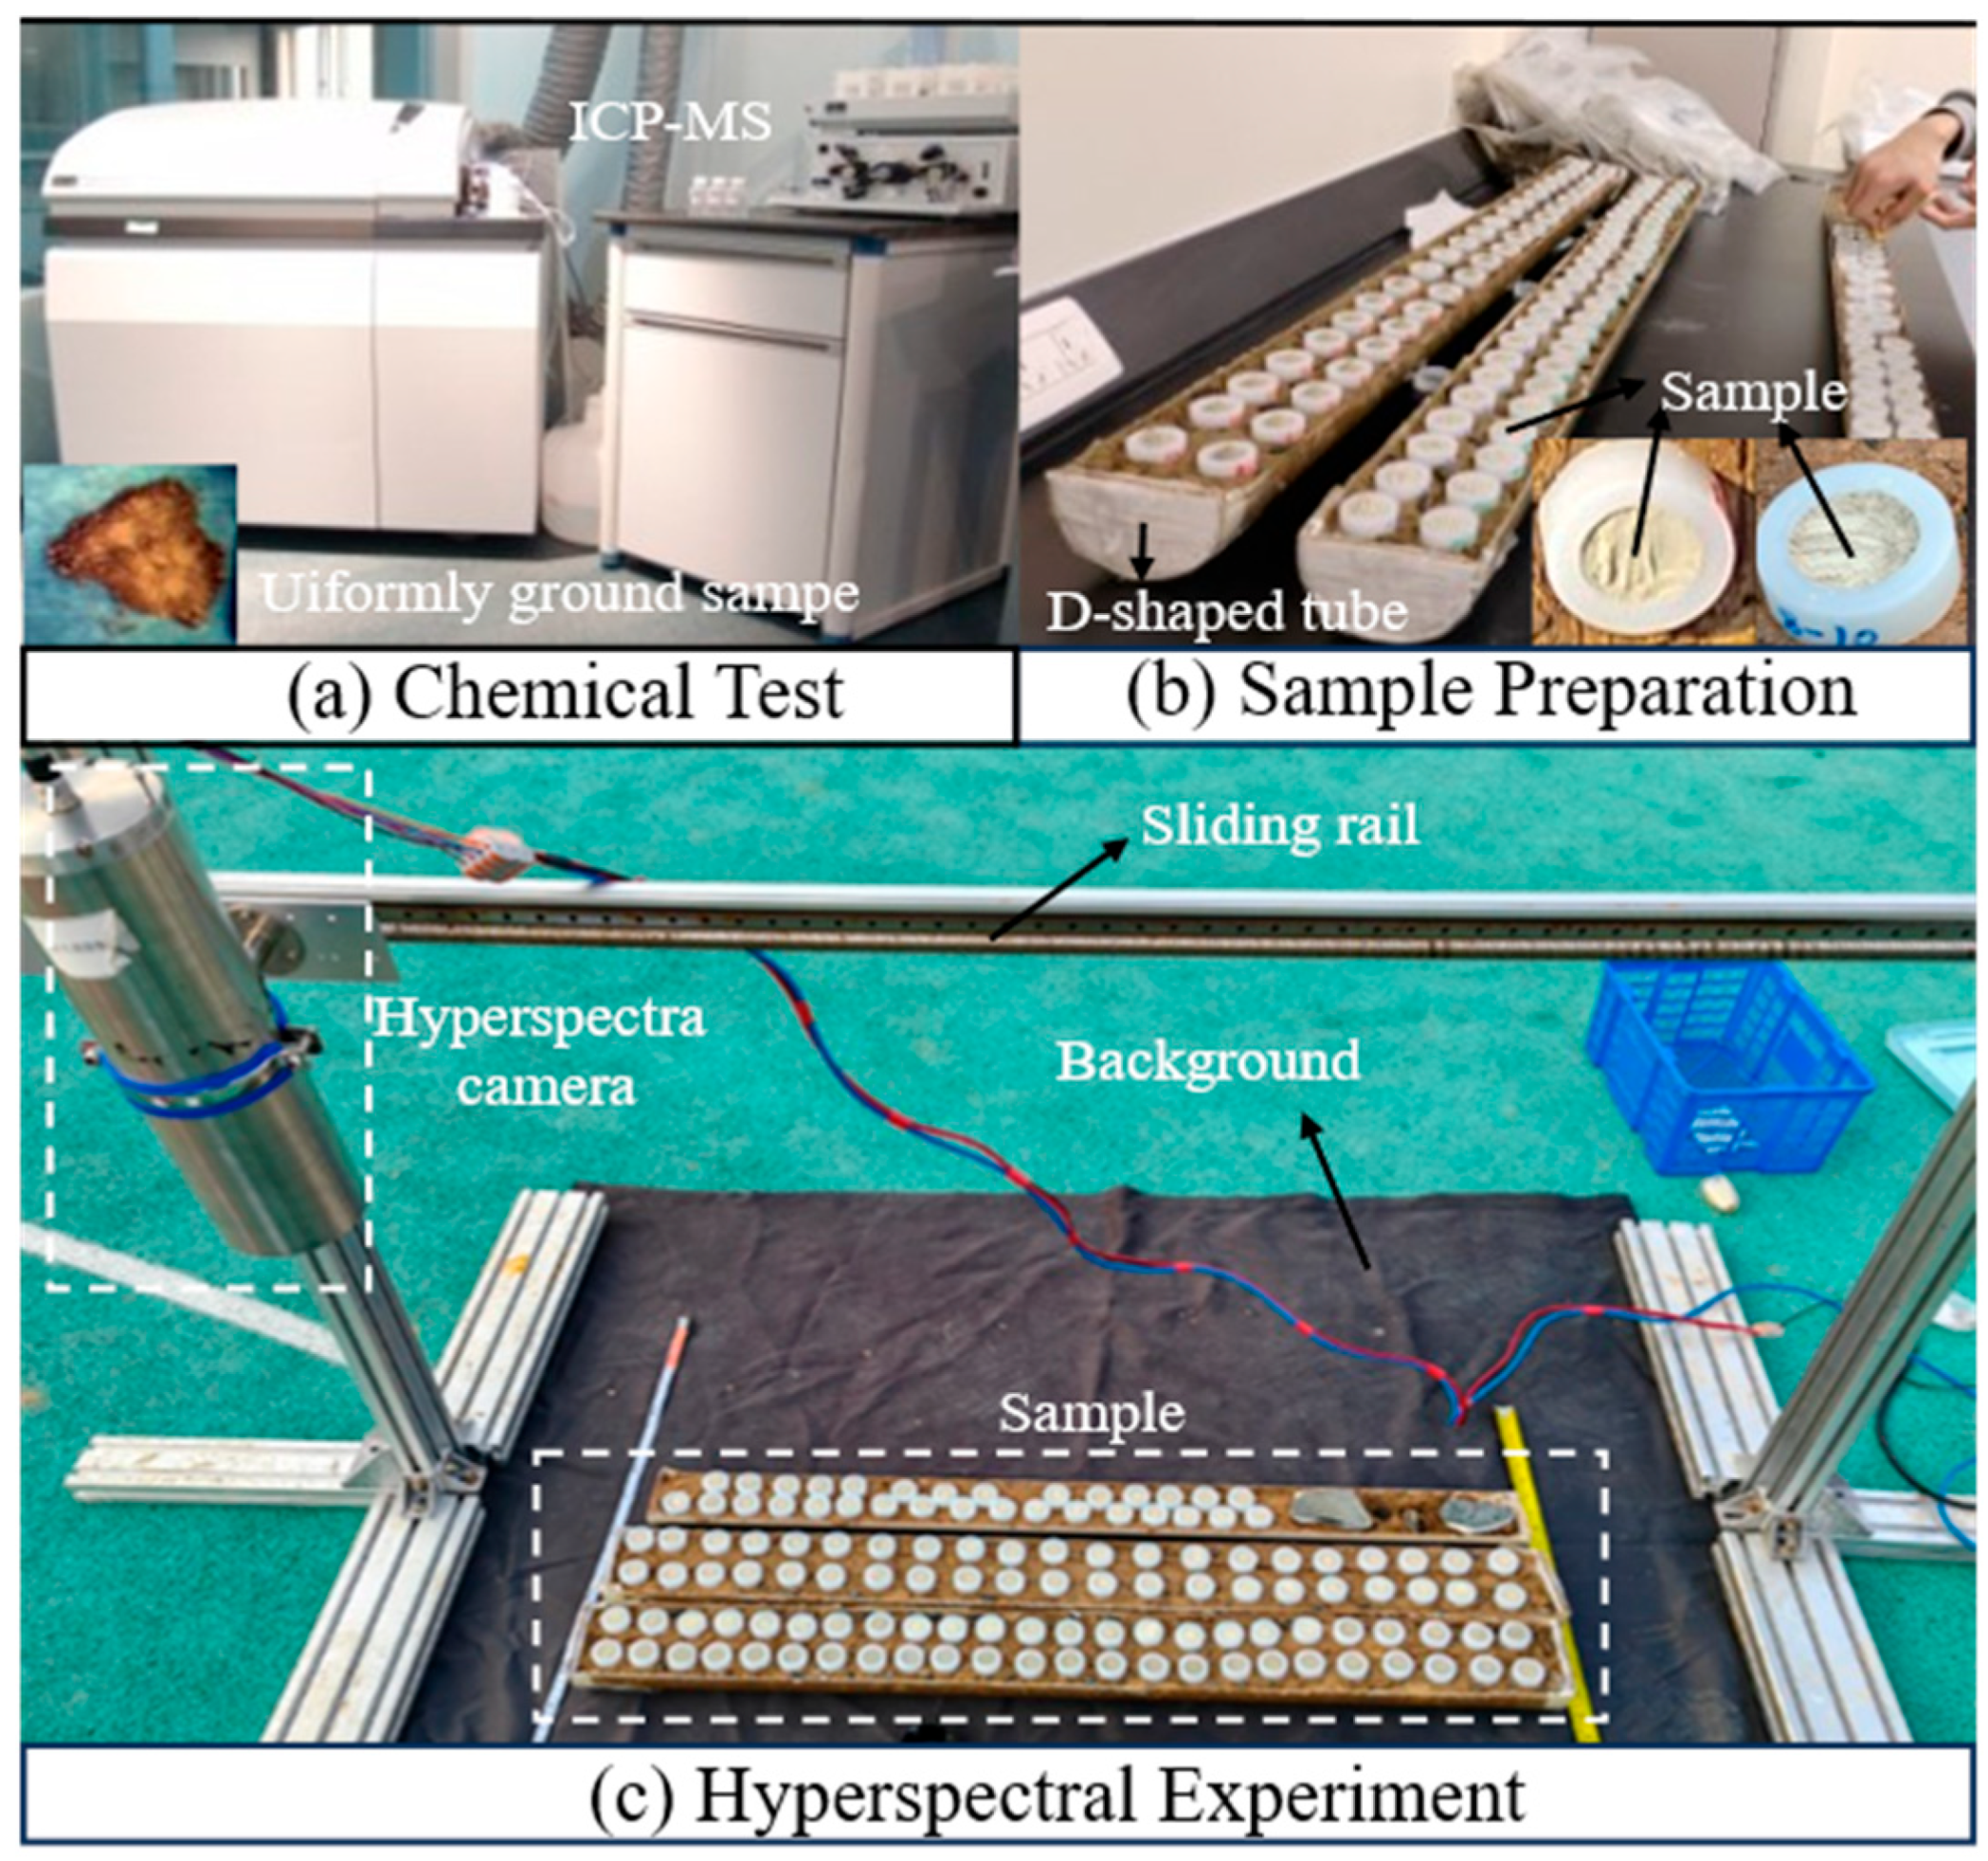
Figure 1. Sample preparation and data collection: (a) ICP-MS chemical testing of sediment samples; (b) Sample preparation before hyperspectral analysis; (c) Hyperspectral data collection under natural light conditions.
Minerals 15 01102 g001
Figure 2. Technical workflow for estimating REE content in marine sediments using hyperspectral data.
Minerals 15 01102 g002
Figure 3. Clustering results of spectral points for each sample. (The background in each subplot is a false-color composite image generated from the first three principal components after PCA. Dark blue areas indicate regions lacking spectral data. The horizontal and vertical axes represent pixel locations. The four spectral classes identified by K-means clustering are labeled ks1 to ks4: ks1-black points, ks2-blue points, ks3-green points, and ks4-red points).
Minerals 15 01102 g003
Figure 4. Stability analysis of various spectral data points after clustering.
Minerals 15 01102 g004
Figure 5. Average spectral curves of each sample after the removal of anomalous data. (Each color corresponds to one sample; Savitzky–Golay smoothing was applied with a window width of 11 and a polynomial order of 3).
Minerals 15 01102 g005
Figure 6. Structure of the MLP model.
Minerals 15 01102 g006
Figure 7. Taylor diagram comparing the prediction results of various feature extraction methods and models for all RREs: The radius of sector represents the standard deviation while the angle indicates the correlation between predicted and measured (true) values; The red arc shows the standard deviation of the measured values; Concentric circles represent the root mean square error (RMSE); The circular red dot is the theoretical optimum, corresponding to the standard deviation of the observed values, with RMSE = 0 and correlation = 1. Model results located closer to this point indicate higher predictive accuracy and reliability; The fitting plot in the upper right corner of the Taylor diagram shows the predicted values from the optimal model and the corresponding measured data. The red line denotes the 1:1 reference line, while the shaded gray and green regions represent the 95% prediction interval and confidence interval, respectively.
Minerals 15 01102 g007
Figure 8. Correlation between the preprocessing outcomes of selected point types and elemental content (La). (a) Normalization (NOR), (b) First-order derivative (FD), (c) Multiplicative scatter correction (MSC), (d) Continuum removal (CR), (e) Logarithmic first derivative (LOG-FD), (f) Reciprocal logarithmic first derivative (TLOG-FD). The four curves represent the correlation between spectrally extracted features and La element content, derived by averaging and processing different combinations of hyperspectral data categories. For example, ks1234 indicates that the spectral points from ks1, ks2, ks3, and ks4 were averaged to generate a composite curve, from which features were extracted and correlated with La content. The area between the two gray dashed lines indicates the valid data range (see Section 2.3).
Minerals 15 01102 g008
Figure 9. Spectral feature extraction results using different methods: (a) Normalization (NOR), (b) First-order derivative (FD), (c) Multiplicative scatter correction (MSC), (d) Continuum removal (CR), (e) Logarithmic first derivative (LOG-FD), (f) Reciprocal logarithmic first derivative (TLOG-FD). The curves represent features extracted from the averaged, preprocessed spectral curves of 53 samples. The region between the two gray dashed lines indicates the valid data points (Section 2.3).
Minerals 15 01102 g009
Figure 10. Analysis of characteristic wavelength bands for the element using different feature extraction methods (using La as an example, the red-shaded area indicates the selected highly correlated band range).
Minerals 15 01102 g010
Figure 11. Potential application of hyperspectral technology in estimating seabed mineral resources.
Minerals 15 01102 g011
Table 1. Statistical analysis of REE content in marine surface sediment samples (mg/kg).
MaxMinMeanSDC.V./%
La67.1011.6727.2911.900.44
Ce158.2323.7858.3730.570.52
Pr14.462.946.252.440.39
Nd50.3611.8223.358.120.35
Sm8.592.404.331.320.31
Eu1.890.551.010.290.29
Gd7.662.153.891.180.30
Tb1.070.290.590.170.28
Dy5.681.493.400.950.28
Ho1.010.270.660.180.27
Er2.880.791.890.510.27
Tm0.430.110.290.080.28
Yb2.720.731.870.510.27
Lu0.430.120.290.080.28
Sc17.193.298.882.810.32
Y27.797.4318.314.900.27
REEs367.3677.61160.6763.160.39
Table 2. Estimation of REE contents in surface sediments of the seafloor.
Element R 2 RMSERPDMAPEMethodModel
La0.81 4.92 × 10 6 2.3516.26%TLOG-FDMLP
Ce0.76 1.38 × 10 5 2.1121.72%TLOG-FDMLP
0.81 1.25 × 10 5 2.3320.53%LOG-FDMLP
Pr0.62 1.40 × 10 6 1.6618.62%TLOG-FDMLP
0.64 1.35 × 10 6 1.7218.37%TLOG-FDSVR
Nd0.67 4.35 × 10 6 1.7916.97%TLOG-FDMLP
Sm0.59 8.04 × 10 7 1.6117.03%TLOG-FDMLP
Eu0.60 1.65 × 10 7 1.6214.17%TLOG-FDMLP
0.71 1.52 × 10 7 1.8913.67%LOG-FDSVR
Gd0.63 6.78 × 10 7 1.7016.09%TLOG-FDMLP
Tb0.67 9.18 × 10 8 1.7314.14%MSCXGBoost
Dy0.53 6.17 × 10 7 1.5117.25%MSCRF
Ho0.40 1.33 × 10 7 1.3219.90%MSCSVR
Er0.38 4.00 × 10 7 1.3021.55%MSCMLP
Tm0.15 7.41 × 10 8 1.0924.74%FDXGBoost
Yb0.37 4.08 × 10 7 1.3018.61%MSCXGBoost
Lu0.40 6.27 × 10 7 1.3221.46%LOG-FDMLP
Sc0.65 1.61 × 10 6 1.7319.50%MSCMLP
Y0.43 3.64 × 10 6 1.3319.04%MSCXGBoost
REEs0.73 2.96 × 10 5 1.9718.14%TLOG-FDSVR
0.67 3.25 × 10 5 1.7918.05%TLOG-FDMLP
Table 3. Number of characteristic bands for different REEs in marine sediments.
ElementNumber of Characteristic BandsElementNumber of Characteristic Bands
La15Dy11
Ce13Ho11
Pr17Er9
Nd7Tm4
Sm12Yb12
Eu13Lu4
Gd22Sc18
Tb22Y8
REEs19
Disclaimer/Publisher’s Note: The statements, opinions and data contained in all publications are solely those of the individual author(s) and contributor(s) and not of MDPI and/or the editor(s). MDPI and/or the editor(s) disclaim responsibility for any injury to people or property resulting from any ideas, methods, instructions or products referred to in the content.