Article

Reconstruction of Ancient Carboniferous Zhibo Volcanic Edifices in Western China Using Magnetotelluric Observations and Comparisons with Active Volcanoes

1
Key Laboratory of Deep Petroleum Intelligent Exploration and Development, Institute of Geology and Geophysics, Chinese Academy of Sciences, Beijing 100029, China
2
College of Earth and Planetary Sciences, University of Chinese Academy of Sciences, Beijing 100049, China
3
State Key Laboratory of Lithospheric and Environmental Coevolution, Institute of Geology and Geophysics, Chinese Academy of Sciences, Beijing 100029, China
4
China Minmetals Corporation, Beijing 100010, China
*
Author to whom correspondence should be addressed.
Minerals 2025, 15(10), 1089; https://doi.org/10.3390/min15101089
Submission received: 7 September 2025 / Revised: 11 October 2025 / Accepted: 15 October 2025 / Published: 19 October 2025

Abstract

Volcanoes serve as the primary pathways for heat and material transfer from Earth’s interior to its surface, providing valuable insights into subsurface processes. Active and potentially active volcanoes have influenced human history and are closely related to current tectonic activity. Consequently, many active volcanoes have been studied using geophysical methods. However, the internal structure of ancient volcano complexes remains poorly understood. We investigated ancient volcano complexes by comparing magnetotelluric (MT) observations from Zhibo (ZB) ancient volcano with active mid-oceanic ridge volcanoes from Iceland and intracontinental volcanoes from north China. The MT responses of magma chambers in these active volcanoes showed similar low-resistivity values ranging from several to tens of Ω·m, indicating a comparable resistivity of the active magma. Assuming that the ancient active volcano chambers had a similar resistivity to that of current active volcanoes, we reconstructed the ancient Carboniferous volcano complex in ZB using the ratio of the lower portion of the MT responses from ZB ancient volcanic edifices and active volcanoes. The results implied the existence of fossil magma chambers at a depth of 5 to 7 km marking the site of a former volcanic center. This finding supports the magmatic origin of the ZB volcanic rock-hosted iron deposits.

Graphical Abstract

1. Introduction

Volcanoes are the main pathways for heat and material within the Earth to the surface, with most being associated with the boundaries of tectonic plates [1,2]. Globally, more than 1400 volcanoes have ever been active, and more than 1500 are active or have been potentially active in the last 10,000 years. Some 1200 volcanoes are thought to have been active during the Pleistocene; however, only a few tens of these are well documented or studied [3,4]. Active and potentially active volcanoes have greatly affected the course of human history and are closely linked to present-day tectonic processes [5,6]. Consequently, several tens of active volcanoes have been subjected to geophysical studies [7,8,9,10,11,12], with magnetotelluric (MT) observations being the main approach for imaging active magma chambers [13,14,15,16,17]. Ancient volcanoes have contributed greatly to the structure, surface, composition, biosphere, and evolution of the Earth [18]. However, very few geophysical observations have been made of ancient volcanoes [19].
The presence of fluids and partial melt in the magma and crystal mush storage reservoirs of active volcanoes results in lower electrical resistivity compared to their hosting geological units, making geo-electrical methods particularly suitable for studying volcanoes [16,20,21]. Among them, MT are widely used due to the great penetration depth and sensitivity to temperature, water content, and metallic mineral content [13,14,15,16,17,22,23,24]. The use of MT has revealed a two-layered conductive structure in many active volcanic systems. The upper layer reflects the hydrothermal system, while the deeper layer or mass indicates the magma or partial melting source [25]. Low-velocity anomalies have also been imaged in magma systems [26]. The energy, volatile materials, and space within a volcano are considered to be crucial factors in the formation of volcano-hosted or related ore deposits. As a result, ancient volcanic edifices play an important role in the formation and storage of mineral, oil, and gas deposits. How to locate and map ancient volcanic edifices using MT, and whether these ancient volcanoes exhibit relatively low-resistivity anomalies similar to active systems, remains unclear.
Iceland is the only large subaerial part of the mid-ocean ridge and provides a unique natural laboratory to study processes at divergent plate boundaries in great detail. Volcanic eruptions are common in Iceland, with small eruptions happening once every 4–5 years. Volcanic activity in Iceland is confined to the active volcanic zones [27,28]. This makes it a perfect location to study the active volcanoes and magma in mid-ocean ridges. Krafla is an active volcanic field and a high-temperature geothermal system in northeast Iceland (IC). Magnetotelluric data has been used to model the electrical resistivity structure at Krafla, and an active magma chamber has been interpreted based on a low MT resistivity anomaly around 5 km in depth [29]. In northern China, Quaternary volcanoes are located in the north and northeast regions, with the Xilingol volcanic group representing one of the longest durations of volcanic activity in the Cenozoic volcanic eruption zone of the Great Xing’an Range-to-Datong. The Late Pleistocene was the period of highest volcanic activity, with the most recent eruption dated to approximately 6800 years ago, confirming its status as a continental active volcano [30,31].
We conducted a broadband MT (BMT, which combined audio magnetotelluric (AMT) and MT methods with a frequency range from 0.001 to 10,000 Hz) exploration of the Zhibo (ZB) submarine volcano rock-hosted iron deposits, which are situated within an ancient volcanic edifice. To reconstruct the ancient volcanic complex, we proposed a novel approach based on a comparative analysis of MT observations from active volcanoes and ZB ancient Carboniferous volcano edifices. Specifically, we calculated the ratio between the average MT responses of two active volcanoes—one in IC and the other in north China (NC) − and those from ZB. Using modeling and inversion techniques, we reconstructed the ZB ancient Carboniferous volcanoes by applying this ratio to the apparent resistivity data within the overlapping frequency ranges of the MT responses from ZB and the IC active volcanoes. The BMT results showed the response of the ancient volcanic edifice, refining the understanding of the volcanic mineral control system in ZB.

2. Geological Setting

The ZB iron deposit is located in the eastern section of Western Tianshan, northwest China. Western Tianshan is in the southwestern part of the Central Asian Orogenic Belt (CAOB, Figure 1), one of the largest Paleozoic accretionary orogenic systems in the world [32]. The CAOB represents a Paleozoic orogenic collage formed by multiple subduction events and the accretion of several terranes between the Junggar Terrane and the Tarim Craton [32,33,34]. The CAOB is a tectonic collage composed of various oceanic fragments (e.g., oceanic plateaus, seamounts), accretionary prisms, and intraoceanic and continental magmatic arcs during the Paleozoic [35,36,37]. It was deformed by the closures of Tethyan branches and microcontinental collision during the Mesozoic, as well as the far-reaching effect of the India−Asia collision during the Cenozoic [36,37]. Furthermore, the CAOB controls the tectonics of Central Asia [32,33,34,35].
The Western Tianshan Metallogenic Belt (WTMB) is a typical submarine volcano rock-hosted iron deposit (MVIR) in China [38,39,40,41,42,43]. It contains several large to medium-sized deposits of submarine Carboniferous volcanic-hosted iron deposits dominated by hematite and magnetite. The Awulale iron deposits belt, located in the eastern section of the WTMB hosts more than 1.2 billion tons of iron ore resources with an average grade of 40%, reaching >60% in some deposits. This area is considered to have an excellent prospecting potential for high-grade iron ore deposits [43,44,45]. All the iron ore deposits are hosted in the widespread Early Carboniferous submarine volcano-related rocks [43]. Some of these deposits are characterized by well-developed skarn assemblages; others are considered to have been directly controlled by the ancient volcanic edifices [41,42,43,44,45].
Extensive surface and mining geological, petrological, and geochemical surveys, as well as surface and aeromagnetic analyses have been conducted to explore the mineral deposits and mineral systems. This has led to many new discoveries about the deposits, and the structure and origin of the mineral systems [38,39,40]. Carboniferous volcanic activity is speculated to control the distribution of the iron deposits in the Awulale Iron Metallogenic Belt in the eastern portion of WTMB. The ZB iron deposit is one of the largest volcanic-hosted magnetite deposits in the WTMB (Figure 1c). It has attracted widespread interest from geologists and mineralogists due to its large size and high grade, and its spatial relationship with ancient volcanic edifices. Previous geochemical and geochronological studies have determined that the iron mineralization at ZB originated from the melting of a mantle wedge fertilized during subduction with subordinate hydrothermal overprinting [38,39,40,41,42,43] or hydrothermal origins [44,45]. The nature and tectonic affinity of the volcanic host rocks are still controversial.
Remote sensing and geological field observations have confirmed the existence of an ancient volcanic edifice. A huge oval caldera named Aikendaban was identified by remote sensing [43]. Aikendaban lies in the eastern Awulale belt where the ZB iron deposit is situated (Figure 1d). Several other large-scale MVIR deposits are also thought to be controlled by this volcanic edifice [42,43,44]. Field studies in ZB have found some typical characteristics of volcano activity, including stomata and almond-shaped structures in the ore deposit [44]. Shen et al. [43] reported new evidence of an ancient volcano edifice, separate from the huge Aikendaban oval caldera, based on field observations of the ZB deposit. They found andesite in volcanic overflow facies as well as tuff and breccia-bearing tuff in volcanic sedimentary facies in the eastern mining area of ZB. Additionally, outcrops of andesitic volcanic breccia and agglomerate rocks have been found in the eastern mining area and in some drill cores. These finds indicate that there were two stages of volcanic activity: the eruptive and overflow volcanic stages. Furthermore, the presence of an arc-shaped fault system and formation, as well as the occurrence of an ore body controlled by the ring fault system, imply the existence of a caldera and weak erosion in the ZB iron deposit.
Figure 1. Tectonic setting of the ZB iron deposit [33]. (a) Tectonic outline of the CAOB and its environs. (b) Location of the IC, NC active volcanoes and Zhibo (ZB) ancient volcanic edifices. (c) Geological map of the ZB iron deposit and the locations of MT stations. (d) Geological map of the Aikengdaban district along the Awulale metallogenic belt; the dashed line shows the location of Aikengdaban volcano based on an interpretation derived from remote sensing [43]. NTAC = North Tianshan Accretionary Complex, KYB = Kazakhstan–Yili Block, KNTS = Kyrgyzstan North Tianshan Block, CTB = Central Tianshan Block, STAC = South Tianshan Accretionary Complex. Major faults: NTF = North Tianshan Fault; NTMF = Northern Tarim Margin Fault [33]. IC: MT data collection station in northeast Iceland; NC: MT data collection station in Xilingol in north China. ZB: Zhibo iron deposit in the ancient volcanic edifices of Aikendaban oval caldera. A-A’ show the lolocation of BMT cross-section.
Minerals 15 01089 g001
Petrological and geochemical analyses have provided substantial evidence supporting the volcanic and magmatic origin of the ZB iron deposit. It has been reported that this deposit is located close to the center of a volcano. U-Pb zircon dating of the host rocks revealed three stages of magmatic activity ranging from 350 to around 300 Ma in three stages [46]. The main magmatic activity in this area occurred during the Carboniferous period, followed by the Permian period. The Permian magmatic rocks are mainly distributed west of Xinyuan County, whereas the Carboniferous magmatic rocks are distributed throughout the entire mineralization zone. Based on their tholeiitic-calc-alkaline affinities, most of the volcanic rocks in ZB are considered to have formed in an active continental margin arc. Primitive mantle-normalized incompatible element diagrams, their relatively complete rock assemblages, and Th/Yb vs. Nb/Yb diagrams indicate that they possess substantial negative Nb, Ta, and Ti anomalies [46]. An electron probe microanalysis indicated that the average Co content of pyrite from the magmatic phase in ZB is about six times higher than that of the hydrothermal phase, while the Co/Ni ratio is about 20 times higher. Moreover, the δ34S value for the pyrite indicates that the sulfur with a magmatic origin is characterized by a deep source [39,46]. A rock geochemical analysis indicated that the ZB iron deposit was mainly formed by the effect of magmatism associated with volcanic activity and hydrothermal metasomatism of magmatic-hydrothermal fluid [38,39]. An ore-forming fluid analysis showed that the metallogenic temperatures during the magmatic mineralization in ZB were about 650–700 °C, with fluid compositions in the inclusions of magnetite dominated by Na+-Cl-(SO42−) species. This indicates that the metallogenic fluids activated during magmatic mineralization were Fe-rich melts [39].

3. Data and Methods

We conducted an AMT and MT study in the ZB iron deposit and its surrounding area. The AMT and MT results were combined to form a BMT data set. Data from 19 stations were acquired in August 2019 (Figure 2), of which eight with relatively low artificial noise were selected for further processing and reconstruction. The working area was characterized by rugged mountainous terrain, making it very difficult to find suitable places to set up a data acquisition system and preventing the survey lines from being laid out in straight paths. Most stations were spaced approximately 100 m apart, although some were spaced at greater or lesser distances. We collected six MT station data sets from the mid-ocean ridge (IC) and inland (NC) to study the MT response of the different types of active volcanoes.
The naturally occurring MT fields are used as the field source of MT and AMT. These natural fields contain electromagnetic waves with different frequency components, which can be used to investigate the underground electrical conductivity of the Earth at different depths [47]. Specifically, frequency components between 10 Hz and 10 kHz are employed for AMT sounding, whereas those ranging from several hundred hertz to less than 0.001 Hz are used for MT sounding. Both AMT and MT measure the orthogonal electric (E) and magnetic (H or B) fields, which behave like plane waves at the Earth’s surface [48,49]. Frequency-based impedance results could be extracted from the amplitude, phase, and directional relationships between the surface electric and magnetic fields. Subsequently, these impedance results were inverted to produce subsurface electrical conductivity distributions [50,51].
We used three MT receiver units for data acquisition. The details of the field operation are described in He et al. [49]. Some stations were located close to an open operational mining pit, and data from these stations were affected by artificial electromagnetic and vibration noise at different levels. Data with excessive noise levels were rejected following further processing. We utilized electromagnetic array profile filtering (EMAP) [52] to correct for topographic static shifts and artificial noise effects. The data were inverted using a Bostick conversion after EMAP filtering [53,54,55,56]. A comparison of the results with and without EMAP filtering is shown in Figure A1. The Bostick conversion (also referred to as a Bostick transform) is a method for generating a resistivity-depth profile by analyzing the asymptotic behavior of the apparent resistivity and phase curves at low frequencies, assuming a layered earth model over an infinite basement [55]. The transform resistivity ρ(D) and depth D at frequency w are expressed using the following equations:
ρ ( D ) = ρ a ( ω ) ( π 2 φ 1 )
D = ρ a ( ω ) μ ω
where D is the depth, ρ(D) is the resistivity at depth D, w is the frequency, ρa(w), φ is the apparent resistivity and phase at frequency w, and μ is the magnetic permeability [55].
The approach for reconstructing ancient volcanic edifices using MT methods is based on the hypothesis that the ancient active magmatic chamber has a similar resistivity to modern active magmatic chambers. This hypothesis is justified because the resistivity of the magmatic chamber is primarily controlled by the temperature and water content. With the cooling and degassing of the magmatic chamber, its resistivity increases. However, resistivity is also a key parameter for determining the burial depth of a magmatic chamber. Although active and ancient magmatic chambers may be located at the same depth, the frequency-to-depth conversion for an active and ancient magmatic chamber differs because the conversion depth is determined by the resistivity of the magmatic chamber. We propose a reconstruction approach using the ratio between the average apparent resistivity of an active volcano and an ancient volcano system. The conversion depth and the resistivity of the ancient volcanic edifices are then reconstructed based on this ratio (Figure A2). Further details on the rationale and methodology for determining this ratio are provided in Section 5.1.

4. Results

We combined the observational results from coincident AMT and MT stations into one BMT curve covering a broad frequency range from greater than 10,040 down to 0.001 Hz. The location of the stations is shown in Figure 1c, and the corresponding curve is shown in Figure 2. The resistivity curves from seven (Sites: 0100, 0102, 0104, 0114, 0118, 0122, and 2126) of the eight stations exhibited a distinct fine-layered electrical structure characterized by alternating high and low-resistivity zones, forming a high-low-high-low-high (H-L-H-L-H) pattern. It proved difficult to identify this structure in the data from the other station (Site: 2120) due to contamination by artificial noise. Figure 3 shows the typical resistivity curves of 12 stations from ZB deposits in the ancient Carboniferous volcanic edifice (Figure 3a), the active volcano in IC as a representative of an active mid-oceanic ridge volcano (Figure 3b), Xilingol in Inner Mongolia in NC with active intraplate volcanoes (Figure 3c), and a non-volcanic area (Figure 3d). The MT resistivity curve from the ZB ancient Carboniferous volcanic edifice and the IC active volcano indicated a very similar geo-electrical structure, characterized as the H-L-H-L-H model; however, the resistivity value at ZB was more than 30 times higher than those at IC. The intraplate active volcanoes in Xilingol in NC exhibited a different H-L-H-L structure, with no distinct low-resistivity layer in the non-volcanic area (Figure 3d).
Figure 3e shows the logarithm of the resistivity as a function of frequency averaged from three selected stations at ZB, IC, and NC. It confirms the similar geo-electrical structures at IC and ZB. The average resistivity at ZB was around 1000 Ω·m for frequencies from 10,000 to 0.001 Hz. There were two relative resistivities around 10 and 0.01 Hz. The average resistivity for IC varied from 100 to tens of Ω·m with two relative lows centered at 1.72 and 0.046 Hz. The resistivity at the NC site varied from high to low to high as the frequency decreased from 320 to 0.094 Hz. The lowest resistivity occurred at 15 Hz followed by a gradual decrease in resistivity from 0.094 to 0.0011 Hz.
The results from IC and NC indicated that the mid-oceanic ridge and intraplate active volcanoes had a similar average resistivity in the low-frequency range. Figure 3f shows a comparison of the results of the one-dimensional (1D) MT models (using the algorithm of Whittall and Oldenburg [54]) for the active and ancient volcanoes. The model of the active volcano was based on the Bostick conversion result of the average resistivity curves for IC, as shown in Figure 3b. The 1D geo-electrical structure of the ancient volcano model was similar to that of the active volcanoes, but the resistivity was 30 times greater than the active model. Overall, the average resistivity of the ancient volcano was 21.88 times greater than that of the active volcano. The ratio of the lowest resistivity in the lower frequency band was around 30.
Figure 4 shows the BMT conversion results from the observational data and the reconstructed data corrected using a ratio of 0.0315 (Table 1). The methodology for determining the correction ratio is discussed in the following section. The profile converted from the pre-reconstructed (raw observational) data (Figure 4a) revealed four distinct layers beneath the top resistant layer: (1) a top layer with a spatially variable resistivity that contained several discrete low-resistivity zones from the surface to 10 km below sea level; (2) an upper high-resistivity layer with a conversion resistivity greater than 1000 Ω·m; (3) an intermediate layer with relatively lower resistivity from 100 to 500 Ω·m located around 35 to 40 km below sea level; and (4) a bottom high-resistivity layer with a resistivity greater than 500 Ω·m. The uppermost low-resistivity layer is likely associated with aqueous fluids and shallow iron deposits in ZB, whereas the overlying high-resistivity layer was interpreted as glacial debris. Figure 4b,c show the resistivity profiles obtained after applying the reconstruction correction ratio at different depth scales. There were two distinct conducting layers with resistivity from 5 to 10 Ω·m. The upper conducting layer was approximately 2 km below the surface. This likely corresponded to iron deposits and their host rocks. The lower conducting layer was speculated to be the reflection of the ancient magma chamber at a depth of 5 to 7 km. A layer with a relatively high resistivity of more than 15 Ω·m separated the two conducting layers.

5. Discussion

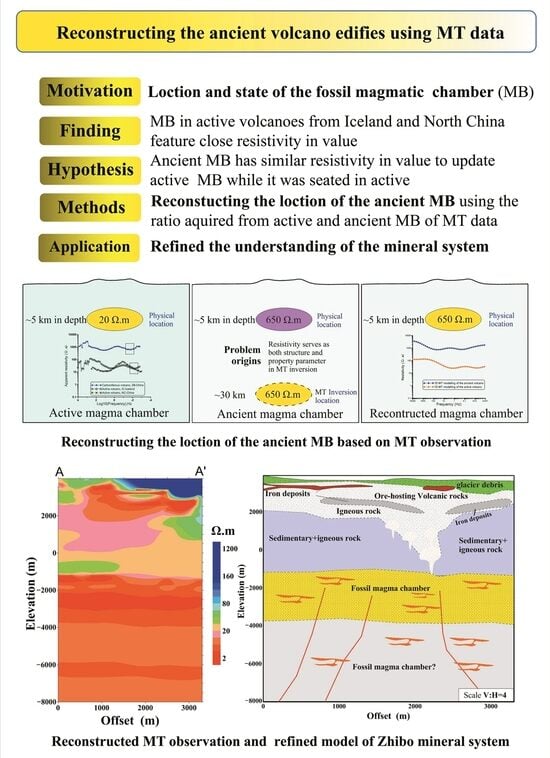
5.1. Determining the Reconstruction Correction Ratio

The magma and melts in the active volcanoes are characterized by high temperatures and contain dissolved water, which reduces their resistivity and results in strong resistivity contrasts between the active magma chamber and hosting units [57]. This pronounced contrast provides an effective framework for the application of electromagnetic methods, such as MT, to study volcanic properties and structures. Active magma chambers are always characterized by a deeply buried low-resistivity layer, and their locations can be inferred from MT conversion results. However, our understanding of the burial depth and electrical properties of fossil magma chambers remains limited. Once a volcano cools and becomes “bone-dry”, the fossil magma chambers can be considered immobile at a certain buried depth, aside from subsequent tectonic uplift and erosion. Several Carboniferous calderas are preserved in the Western Tianshan, which indicates that this area has experienced very weak erosion.
The burial depth of geological units inferred from the observational MT data was mainly determined by two parameters: the impedance (usually expressed in terms of resistivity and phase) and the corresponding frequency range. A simple approximation relates the burial depth to the square root of the resistivity at a given frequency. During the evolution from active to fossil state, magma chambers lose their high temperature and water content and then transform from conductive to resistant at the same burial depth. However, the burial depth would be overestimated by an MT conversion due to the increased observational resistivity. We attempted to reconstruct ancient volcanoes by correcting the observational resistivity of a fossil magma chamber to that of an active magma chamber (Figure A2).
Low-resistivity anomalies (<100 Ω·m) in active volcanoes are generally interpreted as melt, saline fluids, and high temperatures. However, it is difficult to differentiate between fluids and melt with MT alone due to the inherent non-uniqueness of the MT problem and the tendency for conductive bodies to smear vertically in regularized inversions [58]. Temperature exerts only a weak influence on the resistivity of active magma chamber systems due to the presence of the fluid phase [59]. Modeling of bulk resistivity as a function of the fluid fraction by Yang et al. [58] indicated that the bulk resistivity of the melt system would decrease by a factor of 2−3 when the fluid fraction ranged from 7 to 26%. This implies that once conductive fluids are interconnected, the fluid fraction has a relatively weak effect on the resistivity of the chamber system [60,61]. Thus, most active melt chambers likely exhibit similar resistivity values despite variations in temperature and fluid content. The observed MT results from the mid-oceanic ridge (i.e., IC) and intraplate (i.e., NC) active volcanoes (Figure 3e) provide empirical support for this inference.
We assumed that the magma systems of ancient active volcanoes had resistivity values similar to those of present-day active volcanoes. To estimate this, we used the average apparent resistivity acquired from several stations at currently active volcanoes and selected the lowest portion of the apparent resistivity curve in the low-frequency band. The average of nine adjacent frequencies was used to represent the apparent resistivity of an active volcano. Similarly, the apparent resistivity values of ancient volcanoes are related to their fossil chambers. The ratio of the average apparent resistivity of an active volcano and an ancient volcano was used as the reconstruction correction factor (Table 1). A value of 0.0315 was used to recalculate the apparent resistivity for all BMT data sets from each station in the ZB iron deposit. Although this approach remains preliminary, it represents a crucial step toward the reconstruction of ancient volcanic magma chambers.

5.2. Improved Understanding of Marine Volcanic-Hosted ZB Iron Deposits

The ZB iron deposit is a typical example of a volcanic-hosted magnetite deposit in the Awulale belt in the eastern part of the Western Tianshan. However, the exact tectonic setting remains the subject of debate [39,40]. A huge Aikendaban oval caldera was recognized in the eastern Awulale belt where the ZB iron deposit is located. In addition to ZB, several other large-scale MVRI deposits are thought to be controlled by these volcanic edifices [39,45]. Petrological and geochemical analyses have provided many insights into the volcanic and magmatic origin of the ZB iron deposit. It has been reported that this deposit is located close to the center of a volcano [43,44,45].
The MT observations from ZB and an active IC volcano produced resistivity curves with similar shapes (Figure 3). These curves indicated the existence of a volcano system and provided key information for understanding its internal structure. However, the resistivity values at ZB were greater than those of the active volcano system. We reconstructed the ancient volcano system (Figure 5) using MT data based on the assumption that the active magma chambers had almost the same resistivity as the ancient chambers before they cooled and dried.
The result revealed a five-layer geo-electrical structure. The results of a comprehensive model integrating rock physics analysis, geochemical studies, drilling, geological observations, and MT results are presented in Figure 5. The resistive top layer in ZB was mainly composed of glacial deposits and debris, while the upper conductive layer reflected the iron deposits and their related mineralization and alteration deposits. Based on the understanding of active volcanoes, the deeper conductive layer was interpreted as the fossil magma chamber. Prior to reconstruction, the MT data suggested that the fossil magma chamber was located at a depth of 30 km (Figure 4a). The burial depth of the ancient magma chamber was corrected to around 5 to 7 km after reconstruction (Figure 4b). This shallower depth provided space for magmatic mixing and iron enrichment and eventually contributed to the metallogenesis of the ZB iron deposit. This MT study has improved our understanding of the volcano system in the ZB iron deposit.

6. Conclusions

Broadband MT observations revealed similar geo-electrical structures, as reflected in the apparent resistivity curves, in ZB ancient Carboniferous volcanic edifices and active volcanoes in IC, which differed primarily in absolute resistivity values. The MT results from active volcanoes in IC and Xilingol in NC revealed similar geo-electrical values in terms of average apparent resistivity in the corresponding frequency band. This indicated that the magma chambers from the active mid-oceanic ridge and intracontinental volcanoes had similar resistivity properties. Furthermore, the active volcano chambers likely exhibited almost identical resistivity properties when partial melts and/or fluids were present. Based on this hypothesis, a new approach was proposed for the reconstruction of ancient volcanic edifices, using the ZB ancient Carboniferous volcanoes as a case study. The correction ratio of the MT-observed resistivity between the ancient and active volcanoes was about 0.03. Applying this correction refined our understanding of the ZB mineral system when using the reconstructed model. The ZB mineral system was found to be controlled by the magma chamber in the upper crust. This method, using MT responses from active magma chambers as a reference, offers a new approach for investigating and interpreting ancient volcanic edifices.

Author Contributions

Conceptualization, L.H.; methodology, validation, investigation, L.H. and P.S.; resources, L.H. and Z.W.; writing—original draft preparation, L.H., P.S. and X.Z.; writing—review and editing, L.H., P.S., Z.W. and S.H. All authors have read and agreed to the published version of the manuscript.

Funding

This study was supported by funds of the Deep Earth Probe and Mineral Resources Exploration-National Science and Technology Major Project (Grant No. 2024ZD1002305, 2018YFC0604004), Xinjiang Key Research and Development Program (Grant No. 2023B03006-1, 2023B03006-3), the CAS Project for Young Scientists in Basic Research (Grant no. YSBR-082) and the “Tianchi Talent” Plan of Xinjiang Uygur Autonomous Region.

Data Availability Statement

The data used to support the findings of this study are available from the corresponding author upon request.

Acknowledgments

We thank Ling Chen, Rishi Xie, Jianshou Zhang and Changming Yu for their help in this study.

Conflicts of Interest

Xi Zhang is employees of China Minmetals Corporation. The paper reflects the views of the scientists and not the company.

Appendix A

Figure A1. Comparison of the results of BMT section A-A’ without (a,b) with EMAP filtering. (The location of section A-A’ is shown in Figure 1).
Minerals 15 01089 g0a1
Figure A2. Sketch map showing a flowchart of the reconstruction of ancient volcanic edifices.
Minerals 15 01089 g0a2

References

  1. Kusky, T.M. Volcanoes: Eruptions and Other Volcanic Hazards; Infobase Publishing: New York, NY, USA, 2008. [Google Scholar]
  2. Fischer, T.P.; Arellano, S.; Carn, S.; Aiuppa, A.; Galle, B.; Allard, P.; Lopez, T.; Shinohara, H.; Kelly, P.; Werner, C.; et al. The emissions of CO2 and other volatiles from the world’s subaerial volcanoes. Sci. Rep. 2019, 9, 18716. [Google Scholar] [CrossRef]
  3. Fournier, T.; Freymueller, J.; Cervelli, P. Tracking magma volume recovery at Okmok volcano using GPS and an unscented Kalman filter. J. Geophys. Res. 2009, 114, B02405. [Google Scholar] [CrossRef]
  4. Phillipson, G.G.; Sobradelo, R.; Gottsmann, J.H. Global volcanic unrest in the 21st century: An analysis of the first decade. J. Volcanol. Geotherm. Res. 2013, 264, 183–196. [Google Scholar] [CrossRef]
  5. Lopes, R. The Volcano Adventure Guide; Cambridge University Press: Cambridge, UK, 2005. [Google Scholar]
  6. Stoffel, M.; Khodri, M.; Corona, C.; Guillet, S.; Poulain, V.; Bekki, S.; Guiot, J.; Luckman, B.H.; Oppenheimer, C.; Lebas, N.; et al. Estimates of volcanic-induced cooling in the Northern Hemisphere over the past 1500 years. Nat. Geosci. 2015, 8, 784–788. [Google Scholar] [CrossRef]
  7. Sharp, A.D.L.; Davis, P.M.; Gray, F. A low velocity zone beneath Mount Etna and magma storage. Nature 1980, 287, 587–591. [Google Scholar] [CrossRef]
  8. Stanley, W.D.; Mooney, W.D.; Fuis, G.S. Deep crustal structure of the Cascade Range and surrounding regions from seismic refraction and magnetotelluric data. J. Geophys. Res. B Solid Earth 1990, 95, 19419–19438. [Google Scholar] [CrossRef]
  9. Jaxybulatov, K.; Shapiro, N.M.; Koulakov, I.; Mordret, A.; Landès, M.; Sens-Schönfelder, C. A large magmatic sill complex beneath the Toba caldera. Science 2014, 346, 617–619. [Google Scholar] [CrossRef]
  10. Gudmundsson, M.T.; Jónsdóttir, K.; Hooper, A.; Holohan, E.P.; Halldórsson, S.A.; Ófeigsson, B.G.; Cesca, S.; Vogfjörd, K.S.; Sigmundsson, F.; Högnadóttir, T.; et al. Gradual caldera collapse at Bárdarbunga volcano, Iceland, regulated by lateral magma outflow. Science 2016, 353, aaf8988. [Google Scholar] [CrossRef]
  11. Gansecki, C.; Lee, R.L.; Shea, T.; Lundblad, S.P.; Hon, K.; Parcheta, C. The tangled tale of Kīlauea’s 2018 eruption as told by geochemical monitoring. Science 2019, 366, eaaz0147. [Google Scholar] [CrossRef]
  12. Debayle, E.; Bodin, T.; Durand, S.; Ricard, Y. Seismic evidence for partial melt below tectonic plates. Nature 2020, 586, 555–559. [Google Scholar] [CrossRef]
  13. Bai, D.H.; Meju, M.A.; Liao, Z.J. Magnetotelluric images of deep crustal structure of the Rehai geothermal field near Tengchong, southern China. Geophys. J. Int. 2001, 147, 677–687. [Google Scholar] [CrossRef]
  14. Takakura, S.; Matsushima, N. Magnetotelluric Investigation of the Hydrothermal System and Heat Source in the Muine–Toyoha Geothermal Area, Hokkaido, Japan. Resour. Geol. 2003, 53, 213–220. [Google Scholar] [CrossRef]
  15. Azeez, K.K.A.; Harinarayana, T. Magnetotelluric evidence of potential geothermal resource in Puga, Ladakh, NW Himalaya. Curr. Sci. 2007, 93, 324–329. [Google Scholar]
  16. Hill, G.J.; Caldwell, T.G.; Heise, W.; Chertkoff, D.G.; Bibby, H.M.; Burgess, M.K.; Cull, J.P.; Cas, R.A. Distribution of melt beneath Mount St Helens and Mount Adams inferred from magnetotelluric data. Nat. Geosci. 2009, 2, 785–789. [Google Scholar] [CrossRef]
  17. Bertrand, E.A.; Caldwell, T.G.; Hill, G.J.; Wallin, E.L.; Bennie, S.L.; Cozens, N.; Onacha, S.A.; Ryan, G.A.; Walter, C.; Zaino, A.; et al. Magnetotelluric imaging of upper-crustal convection plumes beneath the Taupo Volcanic Zone, New Zealand. Geophys. Res. Lett. 2012, 39, L02304. [Google Scholar] [CrossRef]
  18. Al Habib, J.; Setijadji, L.D.; Maryono, A.; Rompo, I. Identification of Paleovolcanic Centers in the Bima District, East Sumbawa Island (Indonesia) as Guidance for Future Exploration of Cu–Au Deposits. J. Applied Geol. 2024, 9, 64–75. [Google Scholar] [CrossRef]
  19. Liu, Q.; Xuan, F.; Liu, C.; Minghe Zhang, M.H.; Tian, Y.; Hou, H.S. Metallic mineral exploration by using ambient noise tomography in Ashele copper mine, Xinjiang, China. Geophysics 2022, 87, B221–B231. [Google Scholar] [CrossRef]
  20. Poland, M.P.; Miklius, A.; Sutton, A.J.; Thornber, C.R. A mantle-driven surge in magma supply to Kīlauea Volcano during 2003–2007. Nat. Geosci. 2012, 5, 295–300. [Google Scholar] [CrossRef]
  21. Gao, J.; Zhang, H.J.; Zhang, S.Q.; Xin, H.L.; Li, Z.W.; Tian, W.; Bao, F.; Cheng, Z.P.; Jia, X.F.; Fu, L. Magma re-charging beneath the Weishan volcano of the intraplate Wudalianchi volcanic field, northeast China, implied from 3-D magnetotelluric imaging. Geology 2020, 48, 913–918. [Google Scholar] [CrossRef]
  22. Spichak, V.V.; Borisova, V.P.; Fainberg, E.B.; Khalezov, A.A.; Goidina, A.G. Electromagnetic 3D Tomography of the Elbrus Volcanic Center According to Magnetotelluric and Satellite Data. J. Volcanol. Seismolog. 2007, 1, 53–66. [Google Scholar] [CrossRef]
  23. Park, S.K.; Ostos, L.C. Constraints from magnetotelluric measurements on magmatic processes and upper mantle structure in the vicinity of Lassen volcanic center, northern California. Geosphere 2013, 9, 382–393. [Google Scholar] [CrossRef]
  24. Tsukamoto, K.; Aizawa, K.; Chiba, K.; Kanda, W.; Uyeshima, M.; Koyama, T.; Utsugi, M.; Seki, T.; Kishita, T. Three Dimensional Resistivity Structure of Iwo-Yama Volcano, Kirishima Volcanic Complex, Japan: Relationship to Shallow Seismicity, Surface Uplift, and a Small Phreatic Eruption. Geophys. Res. Lett. 2018, 45, 12821–12826. [Google Scholar] [CrossRef]
  25. He, L.F.; Chen, L.; Dorji; Xi, X.L.; Zhao, X.F.; Chen, R.J.; Yao, H.C. Mapping the Geothermal System Using AMT and MT in the Mapamyum (QP) Field, Lake Manasarovar, Southwestern Tibet. Energies 2016, 9, 855. [Google Scholar] [CrossRef]
  26. Pang, G.; Abers, G.A.; Moran, S.C.; Thelen, W.A. Long-lived partial melt beneath Cascade Range volcanoes. Nat. Geosci. 2025, 18, 184–190. [Google Scholar] [CrossRef]
  27. Gudmundsson, A. Infrastructure and mechanics of volcanic systems in Iceland. J. Volcanol. Geotherm. Res. 1995, 64, 1–22. [Google Scholar] [CrossRef]
  28. Gudmundsson, M.T.; Larsen, G.; Höskuldsson, Á.; Gylfason, Á.G. Volcanic hazards in Iceland. Jökull 2008, 58, 251–268. [Google Scholar] [CrossRef]
  29. Lee, B.; Unsworth, M.; Árnason, K.; Cordell, D. Imaging the magmatic system beneath the Krafla geothermal field, Iceland: A new 3-D electrical resistivity model from inversion of magnetotelluric data. Geophys. J. Int. 2020, 220, 541–567. [Google Scholar] [CrossRef]
  30. Shi, Z.W.; Bai, Z.D.; Zhao, Z.D.; Dong, G.C.; Wang, J.W.; Jin, D.B. Late Cenozoic sequence of volcanic eruptions in the Xilinhot area, Inner Mongolia. Acta Petrol. Sin. 2024, 40, 2087–2102. [Google Scholar] [CrossRef]
  31. Wei, H.; Sparks, R.S.; Liu, R.; Fan, Q.; Wang, Y.; Hong, H.; Zhang, H.; Chen, H.; Jiang, C.; Dong, J.; et al. Three active volcanoes in China and their hazards. J. Asian Earth Sci. 2003, 21, 515–526. [Google Scholar] [CrossRef]
  32. Gao, J.; Long, L.L.; Klemd, R.; Qian, Q.; Liu, D.Y.; Xiong, X.M.; Su, W.; Liu, W.; Wang, Y.T.; Yang, F.Q. Tectonic evolution of the South Tianshan orogen and adjacent regions, NW China: Geochemical and age constraints of granitoid rocks. Int. J. Earth Sci. 2009, 98, 1221–1238. [Google Scholar] [CrossRef]
  33. Wang, X.S.; Zhang, X.; Gao, J.; Li, J.L.; Jiang, T.; Xue, S.C. A slab break-off model for the submarine volcanic-hosted iron mineralization in the Chinese Western Tianshan: Insights from Paleozoic subduction-related to post-collisional magmatism. Ore Geol. Rev. 2018, 92, 144–160. [Google Scholar] [CrossRef]
  34. Wan, B.; Wang, X.S.; Liu, X.J.; Cai, K.D.; Xiao, W.J.; Mitchell, R.N. Long-lived seamount subduction in ancient orogens: Evidence from the Paleozoic South Tianshan. Geology 2021, 49, 531–535. [Google Scholar] [CrossRef]
  35. Xiao, W.J.; Windley, B.F.; Allen, M.B.; Han, C.M. Paleozoic multiple accretionary and collisional tectonics of the Chinese Tianshan orogenic collage. Gondwana Res. 2013, 23, 1316–1341. [Google Scholar] [CrossRef]
  36. Zhang, K.J.; Zhang, Y.X.; Tang, X.C.; Xia, B. Late Mesozoic tectonic evolution and growth of the Tibetan plateau prior to the Indo–Asian collision. Earth Sci. Rev. 2012, 114, 236–249. [Google Scholar] [CrossRef]
  37. Zhang, K.J.; Ji, C.; Zhou, Y.Z.; Zhang, Y.J. Tracing oceanic plateau relics in the basement of mainland China: A synthesis of aeromagnetic and seismic refraction data. Earth Sci. Rev. 2024, 255, 104849. [Google Scholar] [CrossRef]
  38. Hou, T.; Zhang, Z.C.; Pirajno, F.; Santosh, M.; Encarnacion, J.; Liu, J.L.; Zhao, Z.D.; Zhang, L. Geology, tectonic settings and iron ore metallogenesis associated with submarine volcanism in China, An overview. Ore Geol. Rev. 2014, 57, 498–517. [Google Scholar] [CrossRef]
  39. Zhang, X.; Tian, J.Q.; Gao, J.; Klemd, R.; Dong, L.H.; Fan, J.J.; Tuo, J.; Hu, C.J.; Qian, Q. Geochronology and geochemistry of granitoid rocks from the ZB syngenetic volcanogenic iron ore deposit in the Western Tianshan Mountains (NW-China): Constraints on the age of mineralization and tectonic setting. Gondwana Res. 2012, 22, 585–596. [Google Scholar] [CrossRef]
  40. Jiang, Z.S.; Zhang, Z.H.; Wang, Z.H.; Duan, S.G.; Li, F.M.; Tian, J. Geology, geochemistry, and geochronology of the ZB iron deposit in the Western Tianshan, NW China: Constraints on metallogenesis and tectonic setting. Ore Geol. Rev. 2014, 57, 406–424. [Google Scholar] [CrossRef]
  41. Zhang, X. The Metallogenic Tectonic Setting and Metallogenesis of the ZB and Chagangnuoer Iron Ore Deposits, Western Tianshan Mountains. Ph.D. Thesis, University of Chinese Academy of Sciences, Beijing, China, 2013. (In Chinese). [Google Scholar]
  42. Zhang, X.; Klemd, R.; Gao, J.; Dong, L.H.; Wang, X.S.; Haase, K.; Jiang, T.; Qian, Q. Metallogenesis of the ZB and Chagangnuoer volcanic iron oxide deposits in the Awulale Iron Metallogenic Belt, Western Tianshan orogen, China. J. Asian Earth Sci. 2015, 113, 151–172. [Google Scholar] [CrossRef]
  43. Shen, P.; Pan, H.D.; Li, C.H.; Feng, H.X.; Wu, Y.; Shi, F.P.; Guo, X.C.; Li, W.G. Carboniferous ore-controlling volcanic apparatus and metallogenic models for the large-scale iron deposits in the Western Tianshan, Xinjiang. Acta Petrol. Sin. 2021, 36, 2845–2868, (In Chinese with English Abstract). [Google Scholar]
  44. Shen, L.J.; Du, Y.S.; Wang, S.X.; Li, D.P.; Ge, S.S.; Wang, K. Magmatic and hydrothermal mineralization of the ZB iron deposit in the western Tian Shan, Xinjiang: Evidence from andesite mineralogy. Geol. Explor. 2014, 50, 0321–0331, (In Chinese with English Abstract). [Google Scholar]
  45. Luo, W.J.; Zhang, Z.H.; Duan, S.G.; Jiang, Z.S.; Wang, D.C.; Chen, J.; Sun, J. Geochemistry of the ZB submarine intermediate–mafic volcanic rocks and associated iron ores, Western Tianshan, Northwest China: Implications for ore genesis. Geol. J. 2018, 53, 3147–3172. [Google Scholar] [CrossRef]
  46. Wang, Z.H.; Zhang, Z.H.; Jiang, Z.S.; Wei, H.; Tian, J.Q. Magnetite composition of ZB iron deposit in western Tianshan mountains and its genetic significance. Miner. Depos. 2012, 31, 983–998. [Google Scholar]
  47. Guo, Z.W.; Xue, G.Q.; Liu, J.X.; Wu, X. Electromagnetic methods for mineral exploration in China: A review. Ore Geol. Rev. 2020, 118, 103357. [Google Scholar] [CrossRef]
  48. Vozoff, K. Magnetotellurics: Principles and practice. Proc. Indian Acad. Sci.–Earth Planet. Sci. 1990, 99, 441–471. [Google Scholar] [CrossRef]
  49. He, L.F.; Chen, L.; Dorji; He, Z.X.; Wang, X.B.; Xiao, B.Y.; Xu, L.G.; Zhao, X.F.; Xi, X.L.; Yao, H.C.; et al. Mapping chromite deposits with audio magnetotellurics in the Luobusa ophiolite of southern Tibet. Geophysics 2018, 83, B47–B57. [Google Scholar] [CrossRef]
  50. Asch, T.H.; Sweetkind, D.S. Audio magnetotelluric characterization of range-front faults, Snake Range, Nevada. Geophysics 2011, 76, B1–B7. [Google Scholar] [CrossRef]
  51. Garcia, X.; Julià, J.; Nemocón, A.M.; Neukirch, M. Lithospheric thinning under the Araripe Basin (NE Brazil) from a long-period magnetotelluric survey: Constraints for tectonic inversion. Gondwana Res. 2019, 68, 174–184. [Google Scholar] [CrossRef]
  52. Torres-Verdin, C.; Bostick, F.X., Jr. Principles of spatial surface electric field filtering in magnetotellurics: Electromagnetic array profiling (EMAP). Geophysics 1992, 57, 603–622. [Google Scholar] [CrossRef]
  53. Goldberg, S.; Loewenthal, D.; Rotstein, Y. An improved algorithm for magnetotelluric and direct current data interpretation. J. Geophys. 1982, 50, 151–158. [Google Scholar]
  54. Whittall, K.P.; Oldenburg, D.W. Inversion of magnetotelluric data for a one-dimensional conductivity. In Geophysical Monograph Series; Society of Exploration Geophysicists: Tulsa, OK, USA, 1992. [Google Scholar]
  55. Goldberg, S.; Rotstein, Y. A simple form of presentation of magnetotelluric data using the Bostick transform. Geophys. Prospect. 1982, 30, 211–216. [Google Scholar] [CrossRef]
  56. Jiracek, G.R. Near-surface and topographic distortions in electromagnetic induction. Surv. Geophys. 1990, 11, 163–203. [Google Scholar] [CrossRef]
  57. Piña-Varas, P.; Ledo, J.; Queralt, P.; Marcuello, A.; Perez, N. On the detectability of Teide volcano magma chambers (Tenerife, Canary Islands) with magnetotelluric data. Earth Planets Space 2018, 70, 14. [Google Scholar] [CrossRef]
  58. Yang, B.; Lin, W.L.; Hu, X.Y.; Fang, H.; Qiu, G.G.; Wang, G. The magma system beneath Changbaishan–Tianchi Volcano, China/North Korea: Constraints from three-dimensional magnetotelluric imaging. J. Volcanol. Geotherm. Res. 2021, 419, 107385. [Google Scholar] [CrossRef]
  59. Wang, Q.; Bagdassarov, N.; Xia, Q.K.; Zhu, B. Water contents and electrical conductivity of peridotite xenoliths from the North China Craton: Implications for water distribution in the upper mantle. Lithos 2014, 189, 105–126. [Google Scholar] [CrossRef]
  60. Zhang, B.H.; Yoshino, T.; Wu, X.P.; Matsuzaki, T.; Shan, S.M.; Katsura, T. Electrical conductivity of enstatite as a function of water content: Implications for the electrical structure in the upper mantle. Earth Planet. Sci. Lett. 2012, 357–358, 11–20. [Google Scholar] [CrossRef]
  61. Zhang, B.H.; Zhao, C.C.; Ge, J.H.; Yoshino, T. Electrical conductivity of omphacite as a function of water content and implications for high conductivity anomalies in the Dabie–Sulu UHPM belts and Tibet. J. Geophys. Res. Solid Earth 2019, 124, 12523–12536. [Google Scholar] [CrossRef]
Figure 2. The apparent resistivity vs. frequency curves of eight BMT stations, showing the general geo-electrical variation with depth. Lower frequencies refer to a greater depth, whereas higher frequencies reflect shallow structures. The relatively low-resistivity layer in the Rxy direction, which might reflect the ancient volcanic edifices, could be identified from the data from six stations.
Minerals 15 01089 g002
Figure 3. The typical MT resistivity responses from selected stations for comparison across different volcanic settings. We selected three stations from ZB, IC, and NC for comparison. Resistivity curves from: (a) the ZB deposits in the ancient Carboniferous volcanoes; (b) the active mid-oceanic ridge volcano in IC; (c) NC with active intraplate volcanoes; and (d) the vicinity of ZB, a non-volcanic area. (e) is the logarithm of the resistivity averaged for three selected stations at ZB, IC, and NC. (f) shows a comparison of 1D MT models of the active and ancient volcanoes. The model of the active volcano used data obtained from a Bostick conversion of the average resistivity curves from IC (b). The ratio of the resistivity of the ancient and active volcano models for each layer was 30. The black box shows the relatively lower resistivity part. The site numbers (054, 000, K102, etc.) are given in the legend.
Minerals 15 01089 g003
Figure 4. Resistivity conversion results across a cross-section from south (A) to north (A’) of the ZB iron deposit derived from BMT data. The reconstructions were conducted by correcting the observed BMT data with a reconstruction correction ratio of 0.0315. (a) Resistivity profile converted from the observational raw data (pre-reconstruction), showing predominantly high resistivity and a relatively low-resistivity layer around 25 to 30 km below sea level. (b) The geo-electrical structure of post-reconstruction. After the correction, the lower deep resistivity layer was located around 1 to 3 km below sea level (5 to 7 km in depth). (c) An enlargement of the upper part of (b).
Minerals 15 01089 g004
Figure 5. Refined and simplified model of the ZB iron deposit mineral system reconstructed from ancient Carboniferous volcanoes based on MT observations. The model represents a typical volcano-hosted iron deposit mineral system, where a near-surface volcanic iron deposit layer constitutes the main ore-bearing layer, and its top portion was verified by drilling a borehole. A fossil magma chamber was located in the upper crust beneath the ZB iron deposit. The red polylines reflect the pathways for heat, magma, and/or fluid. The base map is a geo-electrical section after reconstruction. The vertical scale is four times the horizontal scale (V:H = 4).
Minerals 15 01089 g005
Table 1. The apparent resistivity value used for calculating the reconstruction correction shift coefficient.
NumberRxy-ICRxy-ZBRatio
119.348643.6220.0300
219.701681.6740.0290
318.936647.1650.0290
419.843647.7340.0306
518.944622.4750.0304
619.186632.860.0303
720.876637.3690.0328
823.785654.0740.0364
924.384695.1720.0351
Average20.556651.3490.0315
Disclaimer/Publisher’s Note: The statements, opinions and data contained in all publications are solely those of the individual author(s) and contributor(s) and not of MDPI and/or the editor(s). MDPI and/or the editor(s) disclaim responsibility for any injury to people or property resulting from any ideas, methods, instructions or products referred to in the content.

