Article

Melting Curve of Potassium Carbonate K2CO3 at High Pressures

Department of Earth and Environmental Sciences, University of Michigan, Ann Arbor, MI 48109, USA
*
Authors to whom correspondence should be addressed.
Minerals 2025, 15(3), 217; https://doi.org/10.3390/min15030217
Submission received: 1 January 2025 / Revised: 14 February 2025 / Accepted: 18 February 2025 / Published: 24 February 2025

Abstract

:
Melting of carbonated rocks in the mantle influences the Earth’s deep carbon cycle and the long-term evolution of the atmosphere. Previous studies of the high-pressure melting curve of K2CO3 have yielded inconsistent results, with discrepancies of nearly 200 °C at 3 GPa and more than 400 °C at 12 GPa. Here, we report constraints on the melting curve of K2CO3 at pressures up to 20 GPa from in situ ionic conduction experiments and Pt sphere experiments. To help resolve the large discrepancies, we tested the ionic conduction method against the well-established differential thermal analysis (DTA) method and conventional Pt sphere method at the ambient pressure of 1 bar. Furthermore, ionic conduction experiments were conducted on sodium chloride (NaCl) to reduce uncertainties in pressure calibration of the multi-anvil press. We also modified the configuration of the in situ ionic conduction experiments to minimize the influence of thermal gradient on melting point determination. Finally, we inspected the effect of water by varying the initial sample state and container wall thickness in the Pt sphere experiments and applied X-ray radiography as a reliable and efficient method to examine the products. Compared with the results from the ionic conduction experiments, the melting point of K2CO3 from the Pt sphere experiments was found to be 200~400 °C lower, likely due to a small amount of water trapped by hygroscopic K2CO3 in closed platinum (Pt) capsules. We find that anhydrous K2CO3 remains more refractory than Na2CO3 at elevated pressures.

1. Introduction

The Earth’s carbon cycle is directly linked to global climate change. Recent research has shed light on the significance of the deep carbon cycle involving more than three-quarters of our planet’s carbon stored in the Earth’s interior (e.g., [1,2,3,4]). When hydrothermally altered oceanic lithosphere undergoes subduction, carbonates are transported into the Earth’s interior (e.g., [5]). Eventually, CO2 is released from the mantle through volcanic activity, completing the cycle. The study of alkali carbonate melts is of significant interest due to their unique chemical properties and their role in various geological processes. For instance, the presence of a small amount of carbonate melts may be responsible for the high electric conductivity of the oceanic low-velocity zone (LVZ) [6,7,8]. Furthermore, chemically reactive and highly mobile alkali carbonate melts can facilitate the growth of diamonds [9,10,11]. Evidence of alkali-rich carbonatite melts in nature is found in the eruption of natrocarbonate magma from Oldoinyo Lengai volcano in east Africa, with phenocrysts of nyerereite (Na,K)2Ca(CO3)2 and gregoryite (Na,Ca,K)2CO3 [12,13]. Therefore, it is important to investigate alkali carbonate melts under mantle conditions.
The first step in assessing the role of carbonate melts in mantle structure and processes is determining their melting curves at relevant pressures. The high-pressure melting behaviors of alkaline earth carbonates (MgCO3 and CaCO3) [14,15,16,17] and alkali carbonates (Na2CO3, K2CO3) [16,18,19,20,21], including binary and ternary systems [5,14,15,17,22], have been studied extensively. The melting curve of potassium carbonate (K2CO3), however, remains poorly constrained. Various research groups have reported inconsistent melting points for K2CO3 under high pressures, particularly at 3 to 12 GPa. Experimental results from the ionic conduction method [18] yielded melting temperatures of K2CO3 that were at least 150 °C higher than those using the Pt sphere method to bracket the melting point at 3 GPa [20]. At higher pressure, the discrepancy becomes even larger and reaches 400 °C at 12 GPa [21]. Other studies found that the melting point of K2CO3 increases with increasing pressure [14,15], which supports the trend of ionic conduction experiment data and disagrees with the relatively flat melting curve obtained from the Pt sphere experiments [20,21]. The large discrepancies beyond the experimental uncertainties remained unexplained for more than a decade. Considering the importance of the K2CO3 high-pressure melting curve, the significant discrepancies among existing studies of the Pt sphere method and ionic conduction method must be resolved.
Possible explanations for the discrepancies include (1) uncertainties in pressure calibration; (2) uncertainties in temperature measurements; (3) uncertainties in the melting detection criteria of the ionic conduction method; and (4) trapped water in the sample lowering the melting points of hygroscopic K2CO3 in Pt sphere experiments. In this study, we conduct ionic conduction experiments on sodium chloride (NaCl) to reduce uncertainties in the pressure calibration of the multi-anvil press. A single-sided experimental design is implemented to reduce temperature uncertainties in ionic conduction experiments on K2CO3. To test the validity of the ionic conduction method for determining the melting point of K2CO3, we perform concurrent measurements using the well-established differential thermal analysis (DTA) method and conventional Pt sphere method at 1 bar. Finally, a series of Pt sphere experiments are conducted to test the effect of water on melting point determination of K2CO3 at high pressures.

2. Materials and Methods

The starting materials for the experiments were high-purity K2CO3 (Alfa Aesar 10839, 99.999%, Haverhill, MA, USA) or NaCl (Alfa Aesar 10862, 99.999%).

2.1. Concurrent DTA and Ionic Conduction Experiments at Ambient Pressure (1 Bar)

Differential thermal analysis (DTA) is a conventional technique extensively used in chemistry and material sciences since the 20th century [23]. In the DTA method, the temperature difference is measured between a sample and a reference material as a function of temperature under the same controlled heating program. During heating, the temperature difference peaks at the sample’s melting point as its temperature plateaus due to latent heat absorption, while the reference temperature continues to increase. The ionic conduction (IC) method detects the melting of an ionic compound such as K2CO3 based on a sharp large rise in ionic current at a constant excitation voltage, due to its transition from an insulating solid to a conductive liquid during heating.
To test the validity of the IC method on K2CO3, we conducted concurrent DTA and IC experiments [24] at ambient pressure (1 bar) using a Petit box furnace (Figure S1). Powder of K2CO3 was packed into a 10 mL platinum crucible. For DTA, we used two pairs of type S (Pt-Rh) thermocouples (TCs) with welded junctions. One thermocouple inserted in a 2-bore alumina tube was positioned near the K2CO3 sample surface to measure the reference environment temperature (TRef), while the other TC in a 4-bore alumina tube for sample temperature (T) and two platinum electrodes for ionic current measurements of the IC method were embedded within the sample. Given a constant excitation voltage in the circuit (Figure S2), current through the sample was monitored and a current surge was used as an indicator of melting. Temperatures were recorded by a multi-channel DataQ device. The circuit was powered by 0.1 VAC and 60 Hz excitation voltage. A FLUKE 289 ammeter (Fluke Corporation, Everett, WA, USA) was used to detect ionic current through the sample, and a Mastech variac was used to adjust the excitation voltage. To further test and monitor the existence of melting, a platinum (Pt) sphere (~800 µm in diameter) was placed on the top of the K2CO3 sample without touching the Pt crucible, Pt electrodes or thermocouples. The heating and cooling cycles were repeated multiple times in most experiments, with a heating rate of 0.2 to 1 °C/s. The existence of melting was detected by a latent heat ledge in DTA, a rapid current increase in the IC method and the sinking of the Pt sphere. The verification of the ionic conduction (IC) method is based on the consistency between the measured melting points of K2CO3 at 1 bar by both the DTA and IC methods, with the bottom position of the Pt sphere being further evidence of melting.

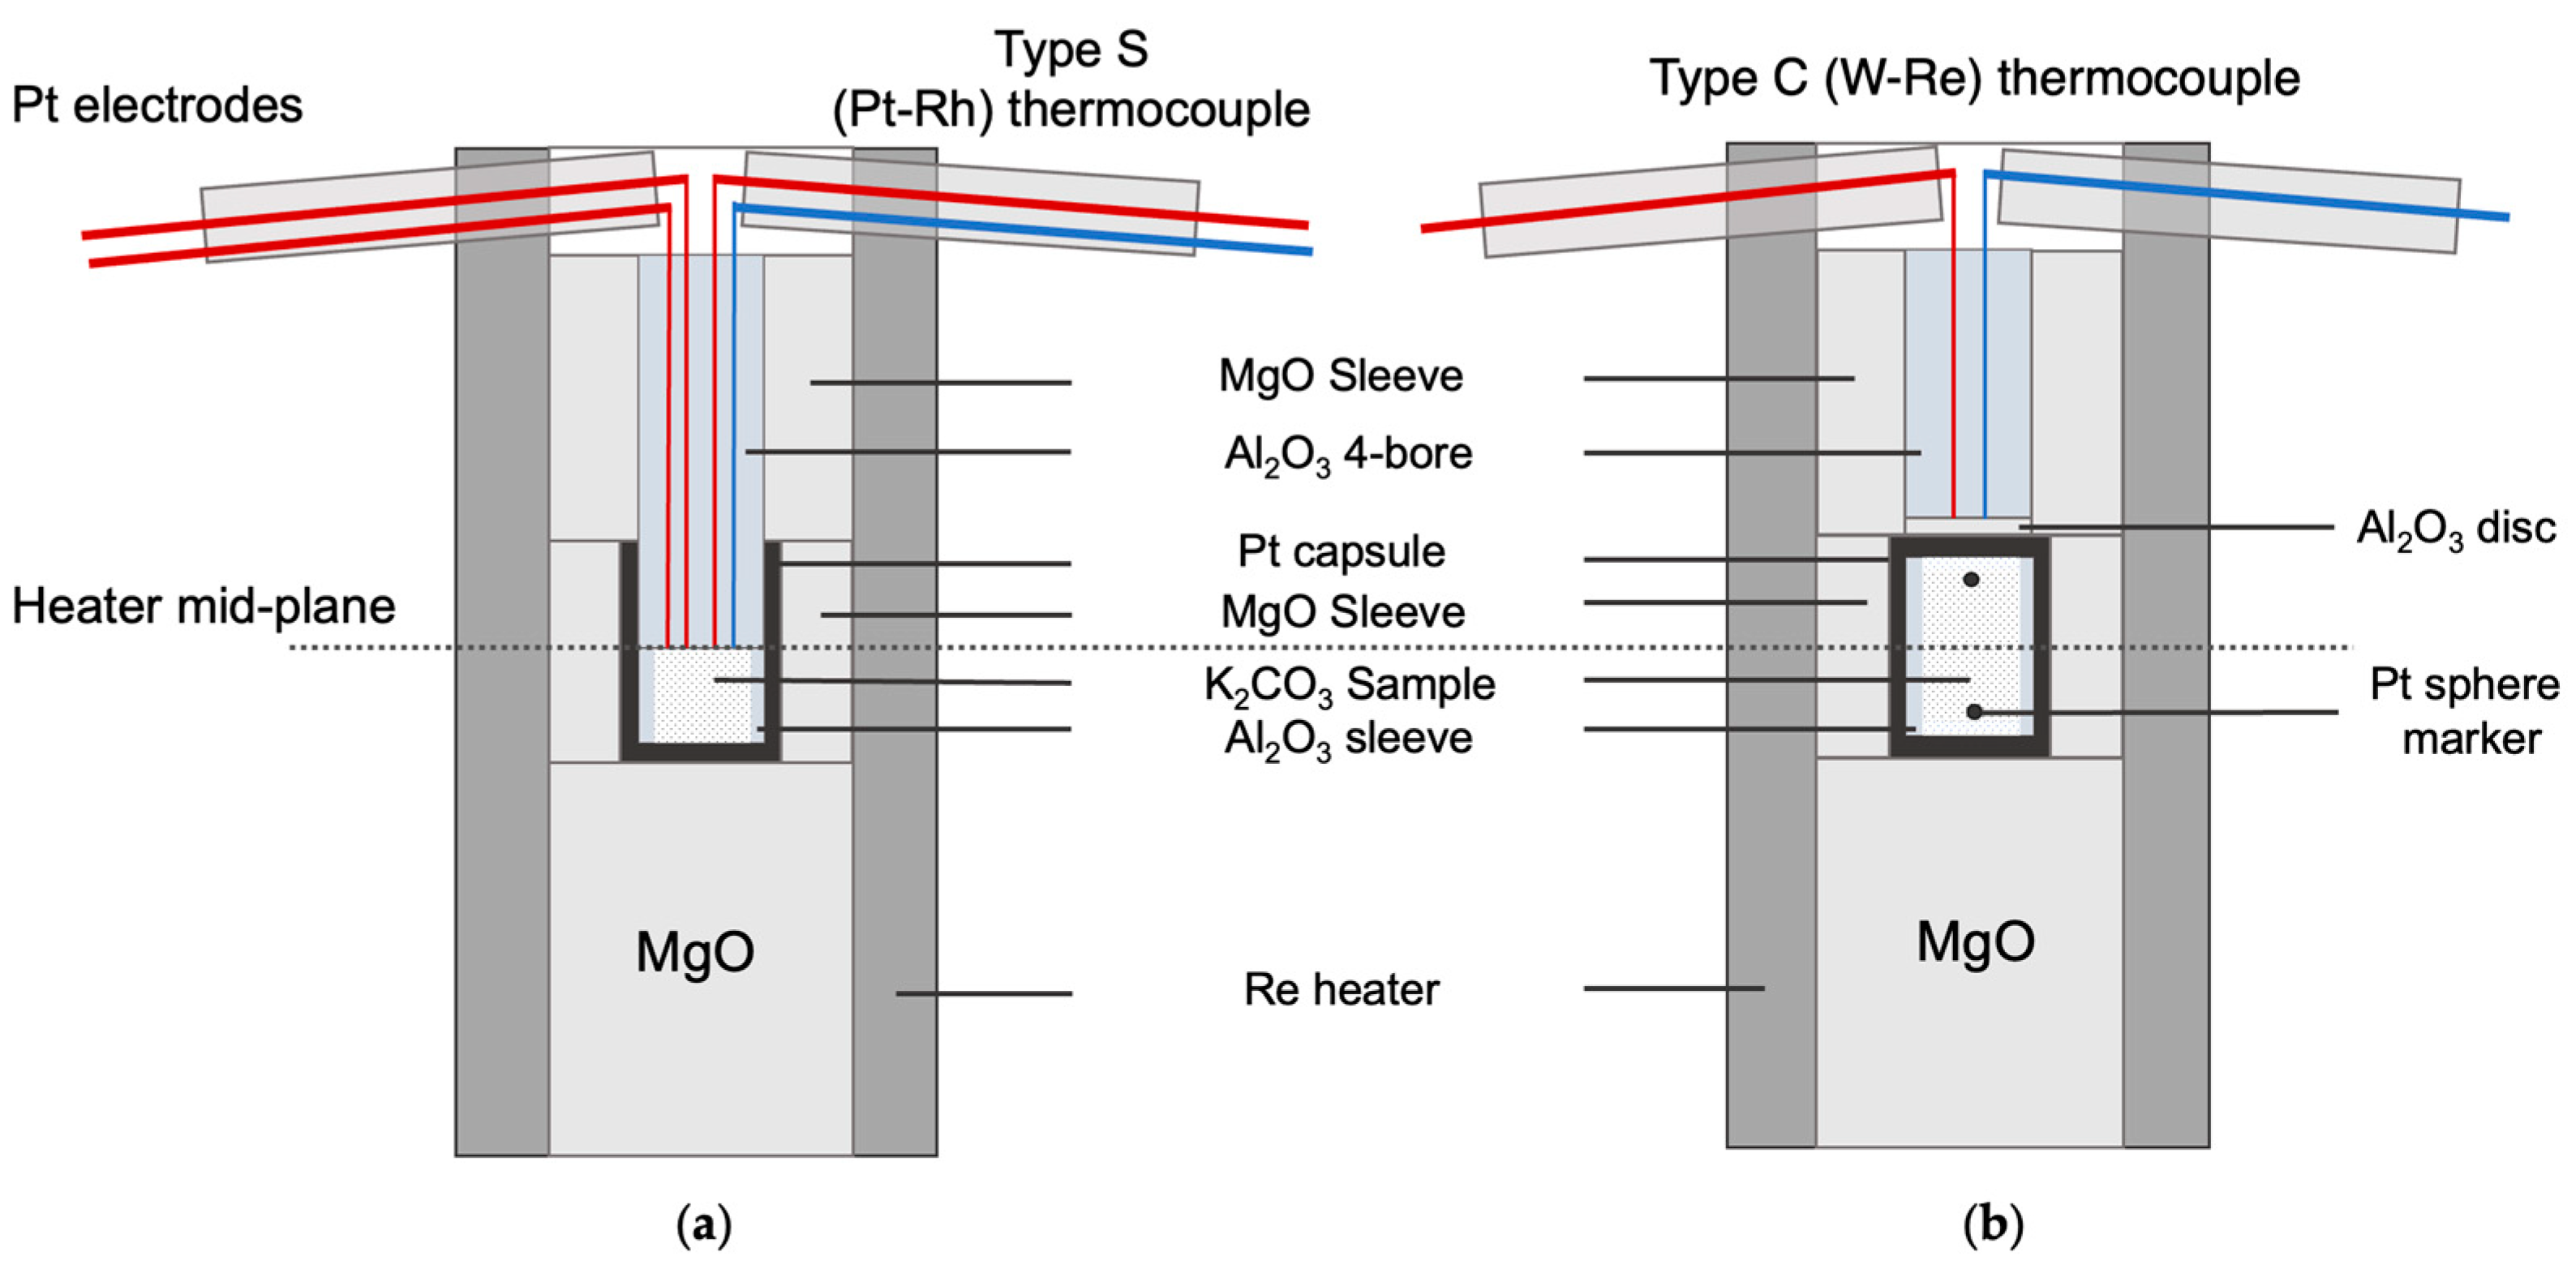
2.2. Ionic Conduction Experiments at High Pressures

In situ ionic conduction experiments were conducted using a 1000-ton Walker-type multi-anvil press at the University of Michigan (Ann Arbor, MI, USA). High pressures were generated using Toshiba-Tungaloy F-grade tungsten carbide cubes with an 8 mm truncation edge length (TEL). Pressure calibration experiments (see details in Appendix A) were performed based on a well-established NaCl melting curve [25] to provide accurate and precise pressure determination [26]. Same as the 1 bar experiments, the temperature was monitored using a type-S thermocouple (TC). An ionic current circuit (Figure S2) through the sample was provided.
A single-sided configuration was used for the IC experiments [24,26] in order to reduce temperature uncertainty in prior studies using a double-sided design [16,18,25,27]. In this configuration (Figure 1a), the Pt electrode wires and thermocouple wires were inserted into a four-bore alumina tubing, which was then positioned axially into the cylindrical rhenium (Re) heater from the top. The electrode tips and thermocouple junction were seated at the heater’s equator (the mid-plane in Figure 1a) and were in direct contact with the sample. By design, the temperature and current readings were from the same region in direct touch with the sample. MgO was used as the confining media instead of the alumina employed in a prior study [26]. Zirconia-based castable Aremco compound 646 octahedra with precast fins were used as the pressure media. Two pairs of grooves were cut in the gasket fins to hold thermocouple wires (corner grooves) and Pt electrodes (side grooves) on the top triangle face of the 646 octahedra.
To remove water and porosity, a recrystallization process (Appendix B and Figure A1) was employed for the K2CO3 and NaCl samples before assembling the Pt sample capsule into an octahedra. Furthermore, the final assembly including the loaded sample capsule was kept at 110 °C in a vacuum oven for more than 24 h before being placed into the multi-anvil press.
During each experiment, we aimed to measure the melting points of samples at several pressures by detecting ionic current surging. The external circuit setup was the same as the 1 bar experiments (Figure S1). At each pressure, the current passing through the sample was recorded over at least two heating and cooling cycles before proceeding to the next target pressure. The heating rate was 0.2~1 °C/s. After heating at all pressures, the sample was rapidly quenched by powering off the system. A Zeiss petrographic microscope and a Leica microscope (Wetzlar, Germany) were employed to examine the experimental products.

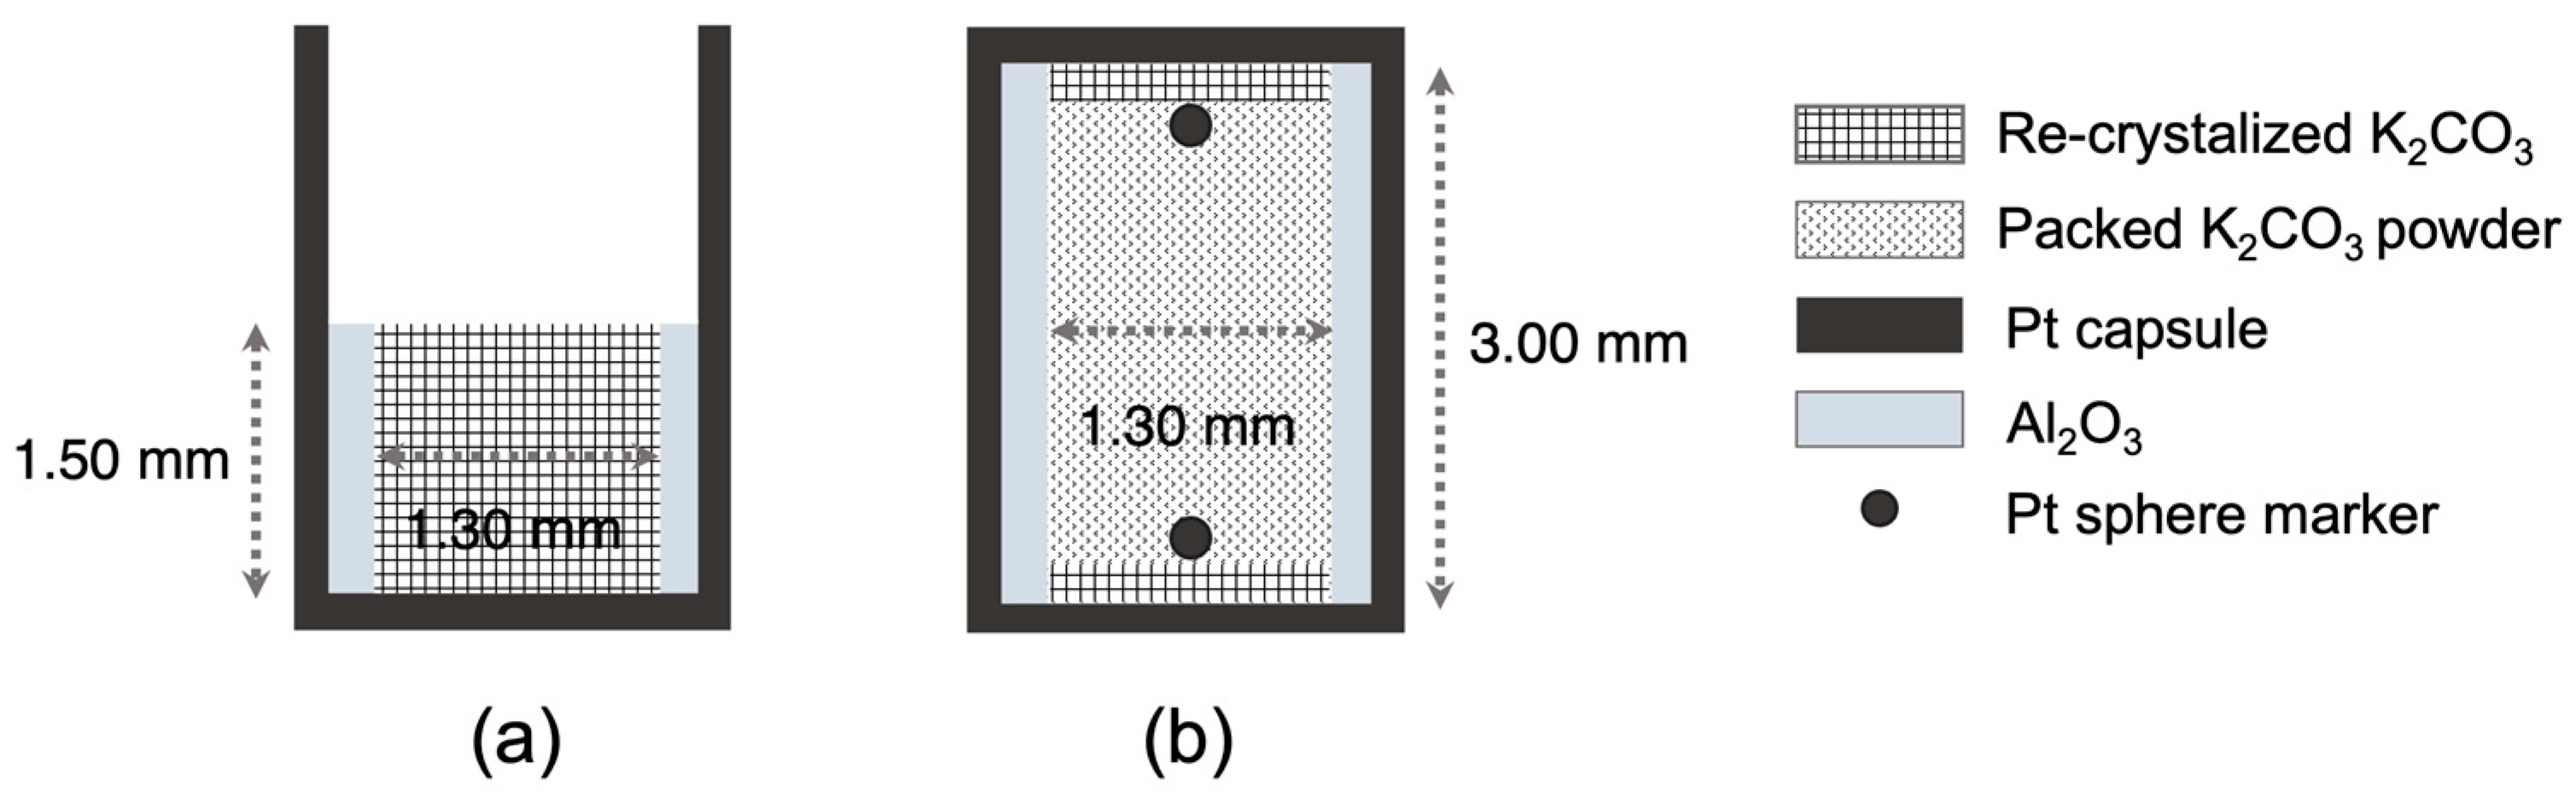
2.3. Pt Sphere Experiments on K2CO3 at High Pressures and X-Ray Radiography

To cross-examine the results of ionic conduction experiments on K2CO3, we conducted platinum (Pt) sphere experiments from 3 GPa to 10 GPa using the multi-anvil press. Tungsten carbide cubic anvils (8 mm TEL) and the 646 octahedra assemblies were used to generate high pressures. The configuration for Pt sphere experiments (Figure 1b) was adjusted from the ionic conduction method (Figure 1a), while closed sample capsules were used in the Pt sphere method. Temperature was monitored by a type C (W-Re) thermocouple. At target pressure, the sample was heated to the target temperature and held for 5~20 min before quenching. Before heating to the target temperature, two Pt spheres (200~300 μm) were positioned at the upper and lower part of the sample capsule, respectively, separated by the solid K2CO3. The two spheres were used to eliminate ambiguity in sample orientation. When K2CO3 melts at high pressures, the upper Pt sphere falls to the lower half of the capsule due to the density difference in Pt and K2CO3 liquid. The movement or stationary positions of Pt spheres in the recovered experimental products indicate whether the sample melted at the target temperatures.
To reduce the effect of sample deformation, partial recrystallization (Figure A1b and Appendix A) was performed during sample loading in most of the Pt sphere experiments, providing two recrystallized K2CO3 spacers between the Pt spheres and sample capsules. The rest of the sample in the capsule was simply packed with K2CO3 powder. To achieve various degrees of dehydration, simple packing of K2CO3 powder without recrystallization and two sample capsule thicknesses (thin: 25.4 μm; thick: 76.2 μm) were also used in the Pt sphere experiments for comparison. All capsules were baked in a vacuum oven at 110 °C for at least 24 h before and after final assembly.
X-ray radiography was collected to non-destructively visualize the internal structure to examine the eventual positions of the Pt spheres. The experimental products (compressed octahedra) were first ground to remove the hard 646 pressure media as much as possible without exposing the sample in order to avoid the effect of moisture on hygroscopic K2CO3. X-ray radiography on the products was scanned in the computed tomography at the Earth and Environmental Sciences (CTEES) facility at the University of Michigan using a Nikon XT H 225ST industrial μCT system (Nikon, Tokyo, Japan) with a Perkin Elmer 1620 X-ray detector panel (Perkin Elmer, Waltham, MA, USA) and a tungsten reflection target. Scan conditions were set at 60~110 kV and 100~142 μA.

3. Results

3.1. Concurrent DTA and Ionic Conduction Experiment on K2CO3 at 1 Bar

The DTA yielded a melting point of 890 °C, where a latent heat ledge was observed upon heating (Figure 2c) and the difference between TRef and T reached the maximum value. From the ionic conduction experiments, the melting point was determined as 891 °C at the peak of dI/dT curve. The current (I) remained below 100 μA along the heating path until the sample temperature (T) reached 840 °C. The current then increased gradually, reaching a local maximum of approximately 500 μA at 885 °C. After the current decreased and stabilized at around 250 μA, it surged to over 900 μA at 891 °C, which is the peak of the dI/dT curve (Figure 2b). With further heating, the current plateaued again. After turning off the furnace at 910 °C, the Pt sphere was found at the bottom of the recovered sample in the 10 mL Pt crucible, indicating the occurrence of melting below 910 °C.
The agreement between the results from the IC method and the well-established DTA method at 1 bar confirms that the ionic conduction method is applicable to K2CO3 and that the peak in the dI/dT curve corresponds to the melting temperature.

3.2. Pressure Calibration Using NaCl Melting Curve

The melting points of NaCl were determined using the ionic conduction method at 30 to 100 bar oil pressure load (Figure S3, Table S1). At each oil pressure, we observed a sharp increase in ionic current through the sample associated with melting (Figure 3). Initially, as the samples were heated from room temperature, the current maintained a low level, varying from a few to several tens of microamps. At approximately 100 °C below the point of steepest current increase, the current began to accelerate, reaching around 400 to 600 μA at the peak. The current–temperature pattern was consistent in all calibration experiments across all pressure points. The temperature of the maximum dI/dT was identified as the melting point at each pressure. Subsequent heating resulted in either a plateau or a small decrease in the current. The maximum current decreases with increasing pressure. The current–temperature relations were reproduced in multiple heating and cooling cycles at each pressure.
The pressure calibration of this study using MgO media (Figure S3, Tables S1 and S2) agrees with the previous NaCl calibration using alumina within ±20 °C [26], indicating a negligible effect of confining media in sample assembly on pressure calibration.

3.3. Ionic Conduction Experiments on K2CO3 at High Pressures

Constraints on the high-pressure melting points of K2CO3 by the single-sided and double-sided IC methods are reported (Table 1 and Figure 3). In each heating cycle of every experiment, in a similar pattern to the 1 bar experiments, the current gradually increased from a few μAs to approximately 200–400 μA and stopped increasing at a current plateau before soaring to several hundred μAs. Melting points were again determined as the peak positions of dI/dT. With a single-sided configuration, we determined the melting point of K2CO3 to rise from 1330 ± 5 °C at 2.5 GPa to 1641 ± 14 °C at 10 GPa. With a double-sided configuration, the melting point was found to increase from 1350 ± 68 °C at 3 GPa to 2158 ± 108 °C at 20 GPa.

3.4. Pt Sphere Experiments on K2CO3 at High Pressures

The results of the Pt sphere experiments provide other constraints on the melting curve of K2CO3 at high pressure (Table 2 and Figure 4). X-ray radiography of the experimental products (Figure 4 and Figure S4) reveals the eventual positions of the spheres, indicating whether the sample melted during heating. Three outcomes were identified based on the upper sphere positions: (1) No sink (“top” position): the upper Pt sphere remained in the upper part of the sample capsule when the compressed K2CO3 did not melt during heating (Figure 4a). Therefore, melting temperatures are higher than thermocouple readings in these cases. (2) Partial sink (“middle” position): the upper sphere sank to a middle position, signifying only part of the sample melted due to the thermal gradient within the sample region (Figure 4b). (3) Sink (“bottom” position): both the upper and lower spheres sank to the bottom of the sample capsule, indicating that melting of K2CO3 existed throughout the entire capsule (Figure 4c).

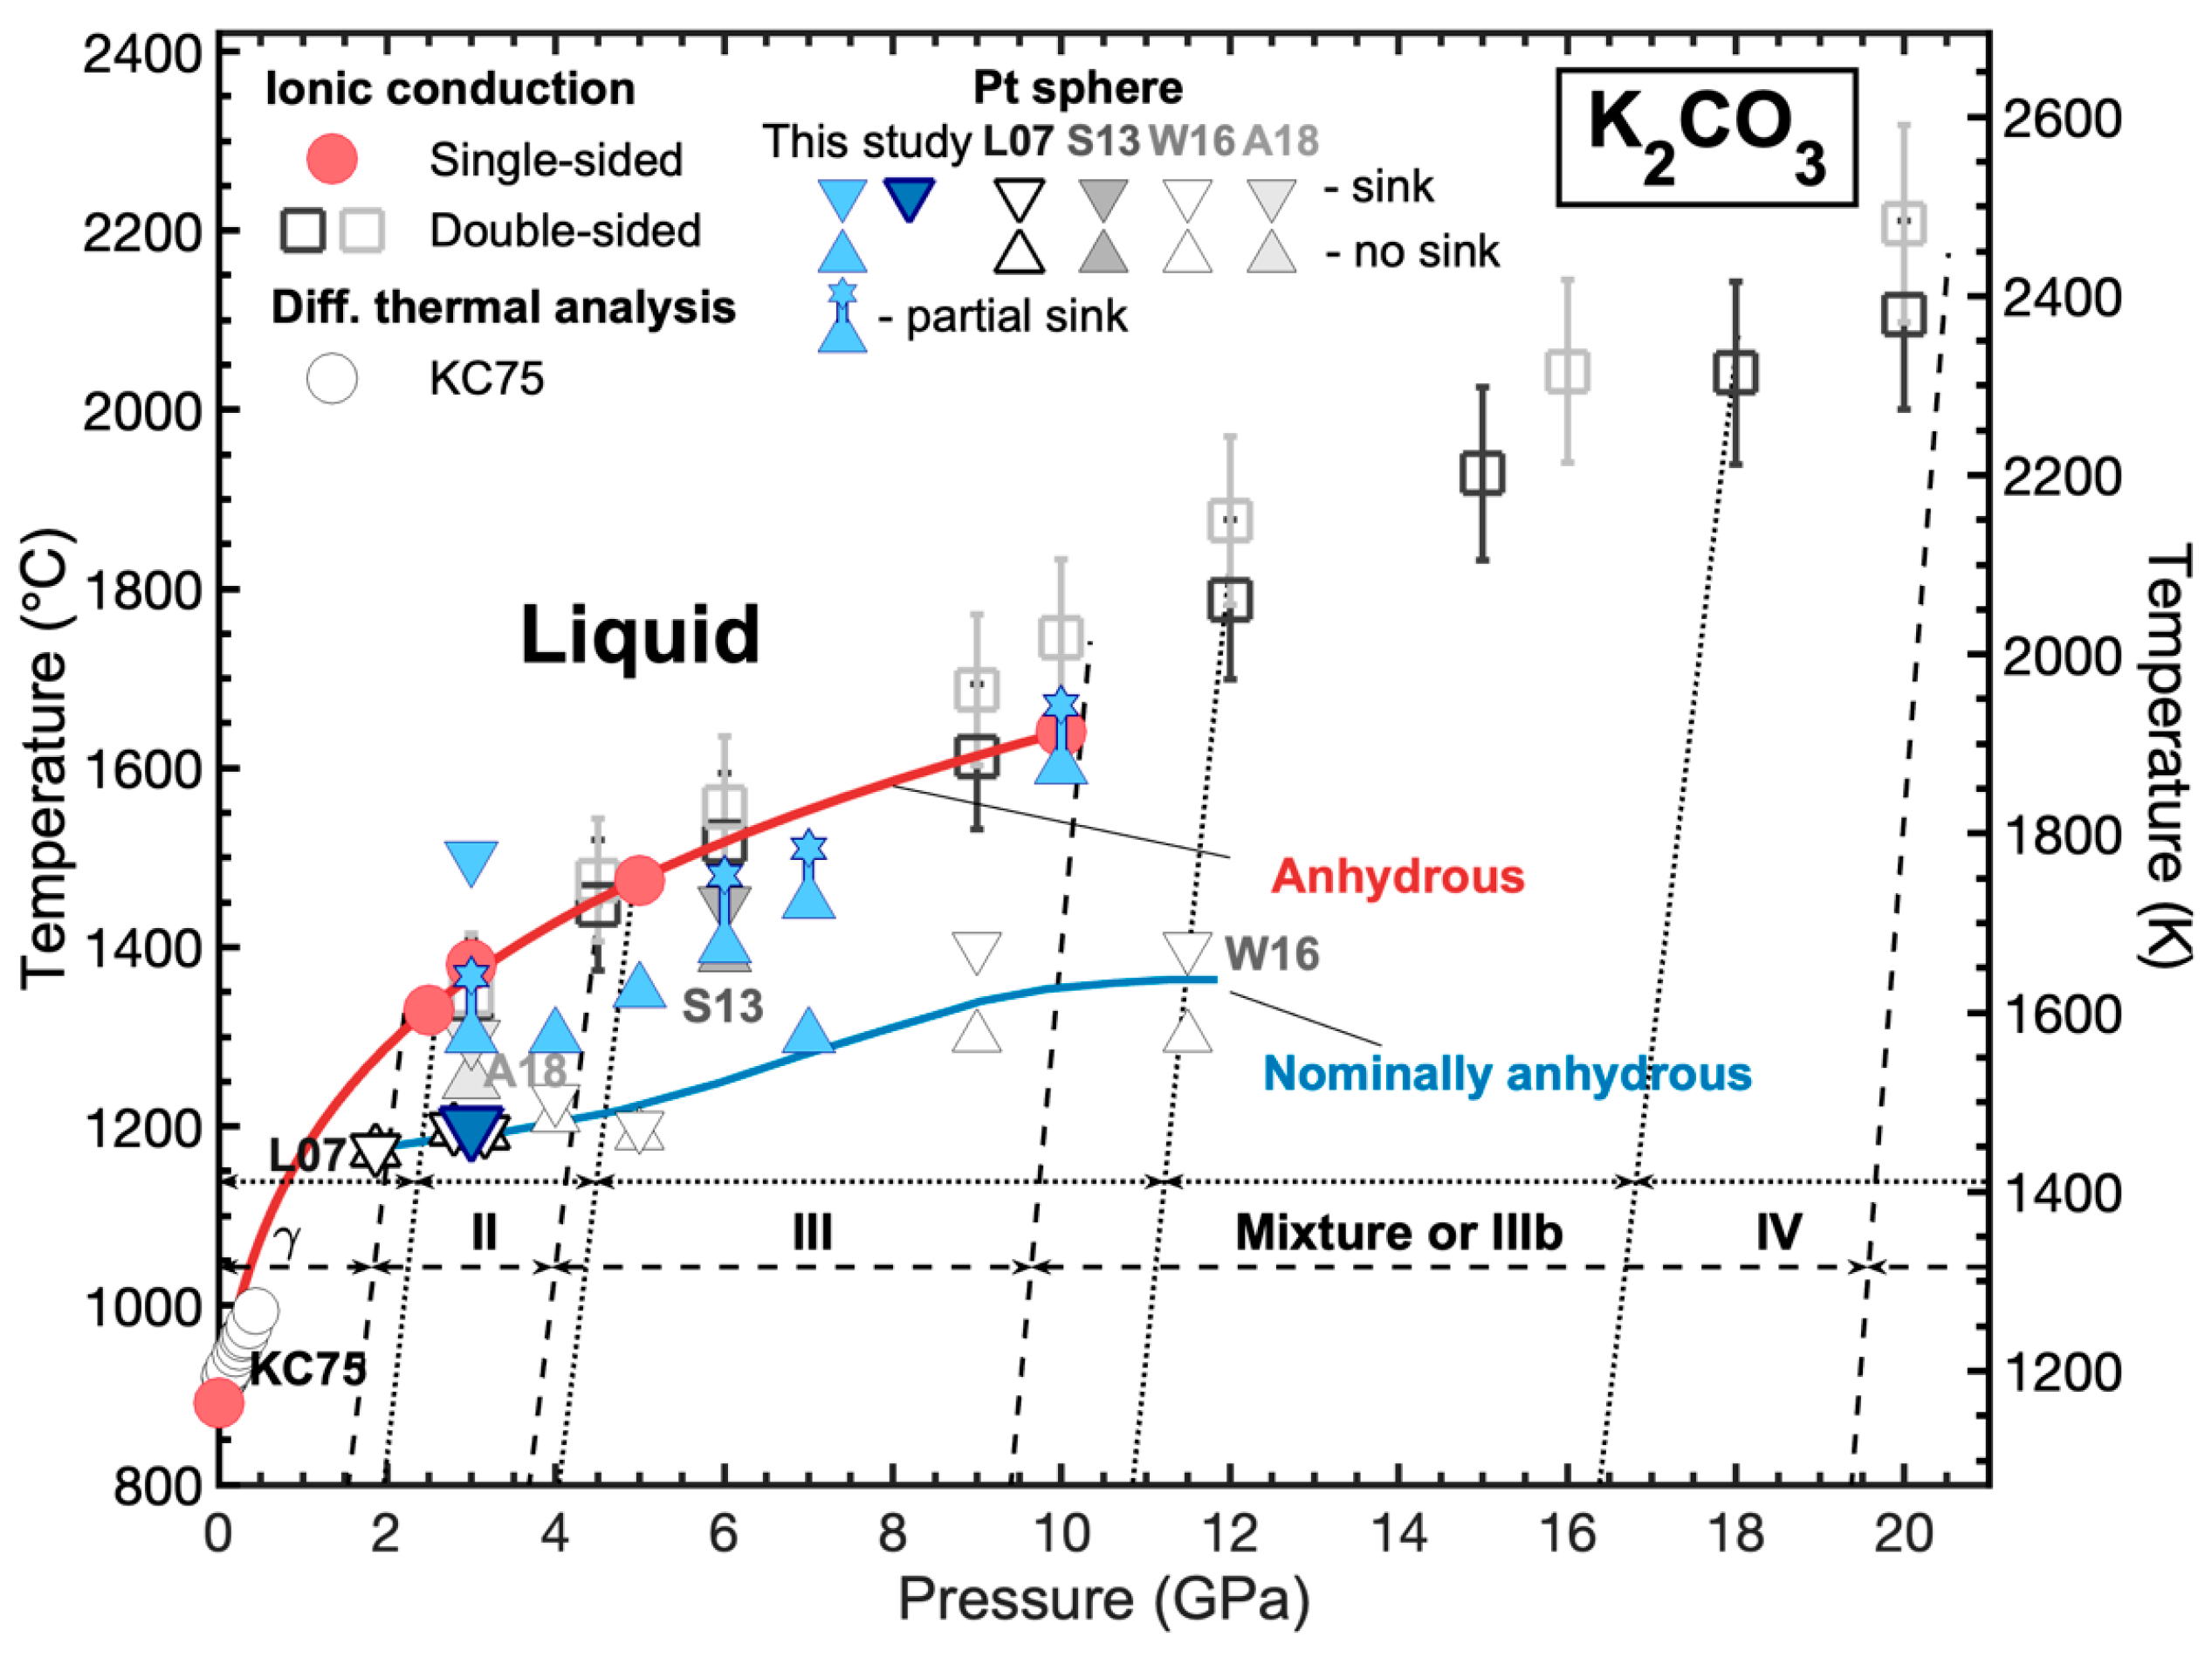
3.5. Melting Curve of K2CO3 at High Pressures

The melting curve of K2CO3 from 1 bar to 10 GPa was fitted to the Simon melting equation [29] from the results of the single-sided ionic conduction experiment in this study. The empirical Simon melting equation is commonly used to fit pressure-dependent melting temperature in the form of (T/T0)c = (PP0)/A + 1, where A and c are constants, and T0 is the melting point of a solid at ambient pressure P0 (1 bar). The Simon melting equation is notable for its simplicity and does not require knowledge of the solid phase’s equation of state (EoS), even though the fitting parameters A and c lack clear physical meanings and are not independent. Taking T0 = 1164.15 K from the 1 bar ionic conduction experiment in this study and the reference pressure P0 = 0.0001 GPa, our fitting yields A = 0.25(4) and c = 7.5(3) (Figure 5). The Simon equation is supposed to fit the melting curve of a solid with a given structure. A previous study [30] reported several phase transitions in K2CO3 between 1 bar and 10 GPa. We found that within experimental error, a single Simon equation adequately fit our data, suggesting negligible effects of phase transitions within this pressure range.

4. Discussion

4.1. Concurrent Ionic Conduction Method and DTA at 1 Bar

The perfect match between the results of the well-established DTA method and the ionic conduction method demonstrates that the ionic conduction change is a reliable criterion for melting temperature determination of K2CO3. The criterion of identifying the melting point by selecting the peak of the dI/dT curve has been confirmed as well in this cross-examination benchmark experiment at 1 bar. Additionally, our results from both the DTA and IC methods are consistent with the melting points reported by previous studies (e.g., 898 °C [20] and 896 °C [31]) and most chemical companies (e.g., 891 °C by Alfa Aesar and J.T. Baker, etc.). Therefore, the 1 bar experiments established the criterion for melting detection in IC experiments by selecting the temperature corresponding to the peak rise in current as the melting point. This criterion serves as the basis for applying the IC method to calibrate pressure using the melting curve of NaCl and determine the melting points of K2CO3 at high pressures in this study.

4.2. Ionic Conduction Experiments on K2CO3 at High Pressures

Accurate pressure determination and temperature measurements in high-pressure experiments are crucial and heavily influenced by the assembly configuration. This study introduces a methodological enhancement by employing a single-sided assembly, which addresses limitations observed in the double-sided assembly used in prior studies on the ionic conduction method, including Li (2015) [18] and subsequent studies [16,24,27]. In double-sided setup, the thermocouple and electrodes were symmetrically placed on opposite sides of the sample chamber under the assumption that they were at the identical temperature due to their equal distance from the hottest mid-plane of the sample, where temperature gradient is expected to be minimized. However, relatively large uncertainties (±85 °C) were reported for the double-sided design due to unpredictable variations in sample geometry and assembly deformation under compression. Improved from the prior double-sided arrangement, a single-sided configuration was used in this study, in which both the thermocouple and electrodes were inserted from the same side onto the sample surface, allowing direct measurements of current and temperature at the same region of the sample. Theoretically, the single-sided design minimizes the temperature gradient between the thermocouple and electrodes to near zero. Temperature uncertainties inevitably arise from melting point selection, as a significant current increase occurred over a 10~40 °C range, and the FWHM of dI/dT peaks was used to quantify uncertainty. Additional melting temperature uncertainties were from fluctuations among multiple heating cycles and duplicated experimental runs.
The rise in ionic current upon melting seems to occur over larger temperature intervals in the single-sided experiments than in the double-sided experiments, likely due to the placements of the electrode tips with respect to thermal gradient. In single-sided experiments, the electrode tips are placed at the hottest part of the assembly and detect melting progressing from the hotter region toward the colder region of the sample during heating; in double-sided experiments [18], the electrode tips are placed at the coldest part and detect melting only when the last portion of the sample melts. While double-sided experiments provide sharper melting signals and allow the use of stronger type C thermocouples, they rely on symmetrical placements of the thermocouple junction and the electrode tips, which can introduce relatively large uncertainties in temperature measurements (e.g., ±85 °C at 10 GPa). Single-sided experiments, with the electrode tips and thermocouple junction placed at the same position, reduce uncertainties in temperature (e.g., ±20 °C at 10 GPa), even though the melting signal is sharper and the type S thermocouple wires are more vulnerable to mechanical failure.
Our pressure calibration against the NaCl melting curve improved pressure constraints using an identical experimental setup under a comparable temperature range to the K2CO3 melting range instead of using the conventional solid-phase transition calibrations [32,33,34,35,36] at lower temperatures employed in prior studies on the ionic conduction method [16,18,24,25,26,27]. This calibration eliminated uncertainties in pressure as the cause of the large discrepancies among studies on melting curves of K2CO3 [14,15,18,20,21]. The pressure uncertainty was estimated at 7%, including calibration errors, pressure drift during heating, and other system-related uncertainties.
One interesting phenomenon found in the ionic current measurements of K2CO3 was the current plateau before the rapid climbing at melting point, which has not been reported in ionic conduction experiments of other carbonates. The current–temperature curves of BaCO3 [27], CaCO3 [16], and Na2CO3 [16] are similar to the trend of NaCl [25]. The cause of the plateau in ionic current is unclear. A possible explanation is solid-state phase transition, such as the transformation of the low-temperature γ-K2CO3 to the high-temperature II-K2CO3 at 3 GPa. However, the current plateau of K2CO3 is consistently observed near 900 °C at all pressures from 2.5 GPa to 10 GPa, which cannot be explained by a small number of phase transitions within this pressure range (Figure 5).
We were unable to recover the samples for texture or chemical analysis because K2CO3 turned into goo upon air exposure. Furthermore, during oil polishing, samples easily chipped and showed no recognizable texture. Despite this limitation, several observations support the robustness of our results: (1) multiple heating and cooling cycles in ionic conduction experiments showed consistent peak ionic currents and melting temperatures, indicating negligible sample leakage or contamination; (2) radiographs of the Pt sphere experiments revealed no visible damage to sample capsules (Figure 4 and Figure S4); and (3) the results from our Pt sphere experiments with partially recrystallized K2CO3 in closed capsules agree with that of our ionic conduction experiments.

4.3. Pt Sphere Experiments on K2CO3 at High Pressures

The combination of the Pt sphere method and X-ray radiography provides a non-destructive and efficient technique for the examination of the eventual positions of Pt spheres covered in hard zirconia-based pressure media after high-pressure experiments. It avoids the complexity and mess of conventional oil/dry polishing and eliminates the possibility of losing samples or Pt spheres during sample recovery or polishing, which helped us make the most effective use of the precious high-pressure experimental products. Notably, the upper sphere sinking to the “middle” position not only indicated melting existed in part of the sample but also visualized the solid–liquid phase boundary of K2CO3, allowing direct estimation of the actual melting point of K2CO3 by considering the thermal gradient in compressed samples. Compared to the conventional bracketing method that requires a series of Pt sphere experiments at different target temperatures under identical pressure conditions, this approach maximized the information obtained from a single experiment, significantly enhancing the efficiency of Pt sphere experiments. However, a key challenge of this method is to select an appropriate target heating temperature to ensure the unknown melting point is covered by the temperature distribution within the sample. The accuracy of estimation depends on good constraints of thermal gradient within the sample assembly.

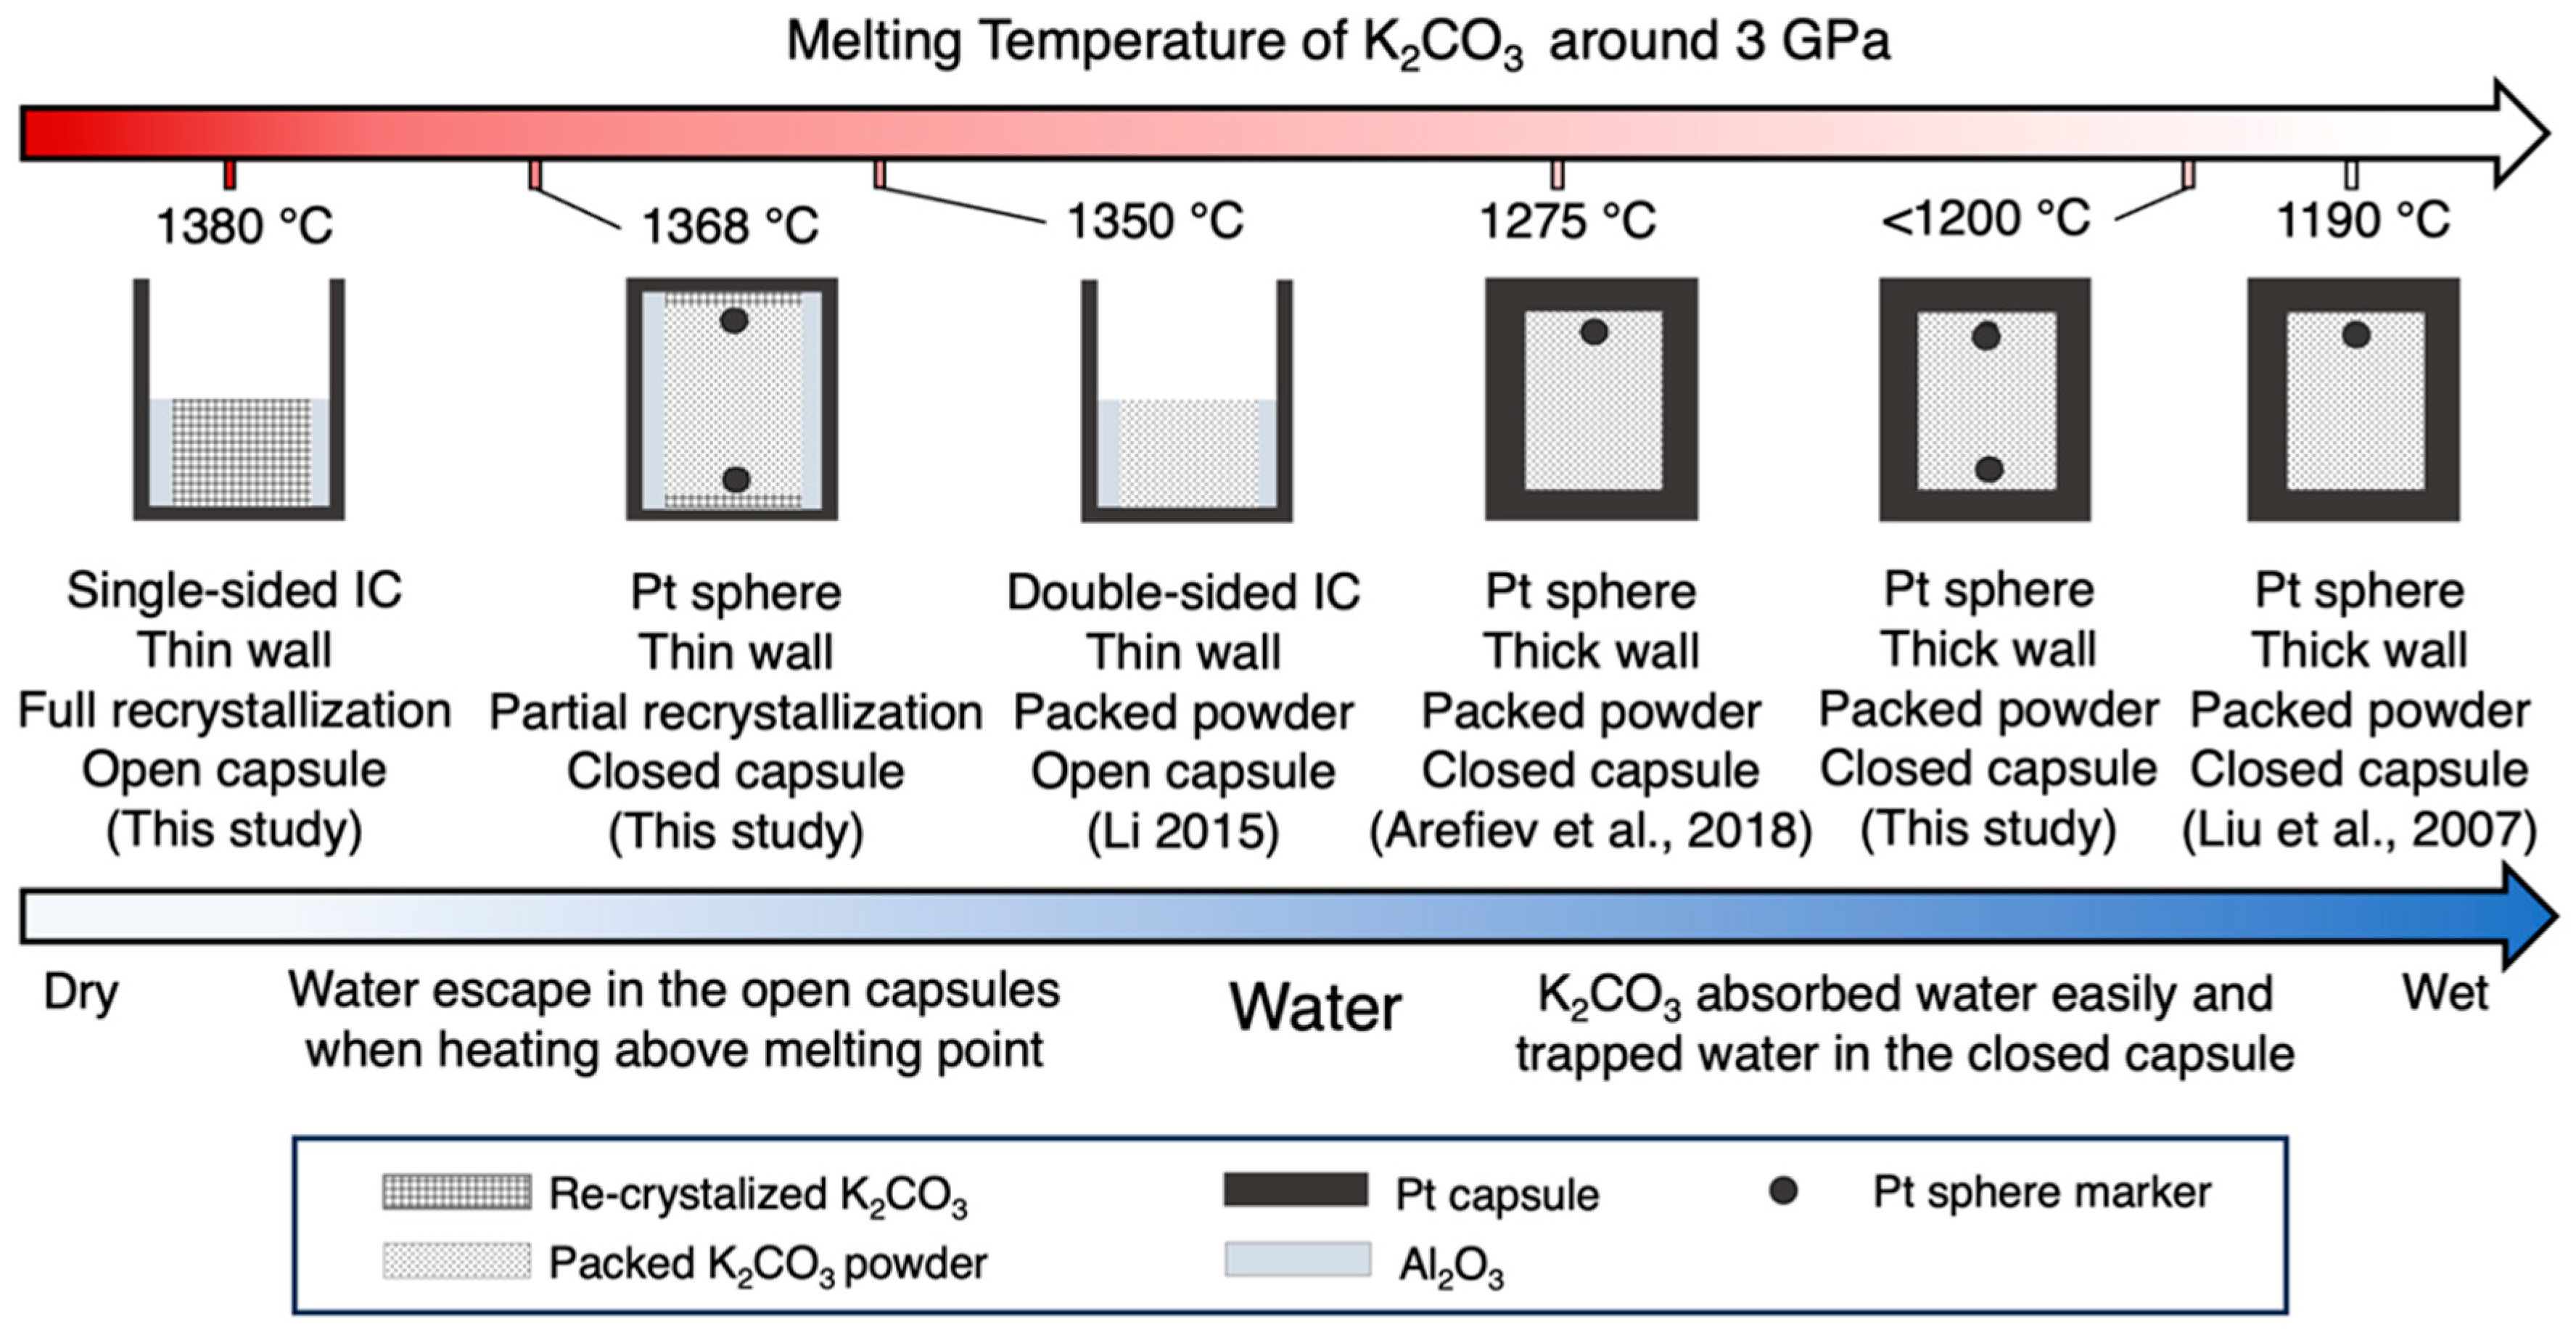
4.4. Discrepancies Among Melting Points of K2CO3 and Effect of Water

The significant effect of water on lowering the melting point of K2CO3 explains long-standing discrepancies between the results from the Pt sphere and ionic conduction (IC) methods. This study measured K2CO3 melting points from 2.5 to 10 GPa using the single-sided IC method, which closely matched values reported by the double-sided IC method [18] but were significantly higher than those from existing Pt sphere studies [14,15,20,21]. For instance, at around 3 GPa, the melting point recorded in this study was 180 °C higher than that in L07 [20] and over 100 °C higher than A18 [14], which cannot be fully explained by the reported uncertainties.
The effect of water was hypothesized to contribute to these discrepancies [14] but lacks extensive investigation. K2CO3 easily absorbs moisture and we even observed that K2CO3 powder became gooey after about 15–20 min of exposure to air with 47% humidity. While prior studies baked samples at 400 °C for hours to remove water, either residual moisture could have persisted, or K2CO3 might have reabsorbed water during assembly or compression for hours due to its hygroscopic nature. The recrystallization process of the starting materials used in this study (Appendix B) ensured minimal water content in samples for both the ionic conduction and Pt sphere methods. With less water trapped in K2CO3, this study measured higher melting temperatures than prior Pt sphere experiments, as expected. In this study, the results of a series of Pt sphere experiments (Figure 6) with various experimental setups and degrees of sample dehydration provide evidence of the significant effect of water on lowering melting point. All Pt sphere experiments used sealed Pt capsules, potentially trapping water if the dehydration was not thorough and lowering the melting point of K2CO3, while the ionic conduction experiments used open capsules, allowing water to escape during multiple heating cycles. For example, at 3 GPa, the single-sided ionic conduction method with complete dehydration (open capsule and recrystallized sample) yielded a melting point of 1380 °C; Pt sphere experiments with a lower dehydration degree (thin capsules and partially recrystallized samples) showed no melting below 1300 °C; however, melting was detected in experiments with the lowest dehydration degree (thick capsules and packed powder sample) at 1200 °C, consistent with L07 [20]. These results confirm that even a small amount of trapped water caused by experimental setups and incomplete dehydration or subsequent rehydration can significantly lower the melting temperature of K2CO3 under high pressures.

4.5. Implications for Diamond Formation

Compared with the melting curves of other carbonates (in Figure 7), the anhydrous melting curve of K2CO3 is slightly higher than Na2CO3, but both alkali carbonates (K2CO3 and Na2CO3) are lower than the alkali earth carbonates (MgCO3 and CaCO3).
The fluid-bearing (alkali-enriched H2O-CO2 fluids) alkali carbonate melts provide a possible media for natural diamond formation, which happens mostly in the sub-continental lithospheric mantle at depths of 140~220 km [9,10,11,37,38]. However, anhydrous K2CO3 melts do not naturally exist in diamond formation conditions based on the phase diagram (Figure 7). According to this study, the presence of water could allow the melting curve of nominally anhydrous K2CO3 to fall into the diamond formation zone. Therefore, it is possible that K2CO3 melts exist under hydrous mantle conditions, which sets the foundation of this hypothesis for diamond formation.

5. Conclusions

Through concurrent differential thermal analysis (DTA) and Pt sphere experiments at 1 bar, we have validated the melting point determination of K2CO3 using the ionic conduction (IC) method. The melting point of K2CO3 at 1 bar determined from the IC measurements is 891 ± 3 °C, which agrees with the DTA result of 890 ± 2 °C.
We have conducted ionic conduction and Pt sphere experiments with various degrees of dehydration to examine the effect of water on the melting points of K2CO3 from 3 GPa to 10 GPa. A comparison between the results of the IC and Pt sphere experiments revealed a significant effect of water on lowering the melting points of K2CO3 at high pressures. Due to the hygroscopic nature of K2CO3, prior Pt sphere experiments may have reported the melting curve of nominally anhydrous K2CO3 with a small amount of water unintendedly trapped in closed sample capsules; thus, the large discrepancies between the results of the IC and Pt sphere experiments may be explained by the effect of water. Our findings suggest that the Pt sphere method may underestimate the melting point of hygroscopic materials at high pressure and must be used with caution.
Applying the IC method with a single-sided configuration, we determined that the melting point of K2CO3 rises from 1330 ± 5 °C at 2.5 GPa to 1641 ± 14 °C at 10 GPa. With a double-sided configuration, the melting point is found to increase from 1350 ± 68 °C at 3 GPa to 2158 ± 108 °C at 20 GPa. Our results show that K2CO3 melts at 100~200 °C lower than alkaline earth carbonates but is more refractory than sodium carbonate under upper mantle conditions. The established melting curve of K2CO3 at 2.5 to 20 GPa provides a valuable basis for systematic thermodynamic modeling of carbonate melting in the mantle.

Supplementary Materials

The following supporting information can be downloaded at: https://www.mdpi.com/article/10.3390/min15030217/s1, Figure S1: Experimental design for concurrent differential thermal analysis (DTA) and ionic conduction method at 1 bar; Figure S2: Circuit configuration of ionic conduction experiments; Figure S3: Pressure calibration using high-pressure melting curve of NaCl; Figure S4: Original X-ray radiography of Pt sphere experiments at high pressures; Table S1: Melting points of NaCl from ionic conduction experiments at high pressures; Table S2: Pressure calibration from NaCl melting curve.

Author Contributions

Conceptualization, J.L. (Jie Li) and R.L.; Formal analysis, J.L. (Jiaqi Lu); Funding acquisition, J.L. (Jie Li); Investigation, J.L. (Jiaqi Lu) and S.H.; Methodology, J.L. (Jiaqi Lu), J.L. (Jie Li) and S.H.; Project administration, J.L. (Jiaqi Lu); Supervision, J.L. (Jie Li); Visualization, J.L. (Jiaqi Lu); Writing—original draft, J.L. (Jiaqi Lu); Writing—review and editing, J.L. (Jiaqi Lu), J.L. (Jie Li), R.L. and S.H. All authors have read and agreed to the published version of the manuscript.

Funding

This research was funded by USA National Science Foundation grant EAR 1763189.

Data Availability Statement

The original contributions presented in this study are included in the article/Supplementary Materials. Further inquiries can be directed to the corresponding authors.

Acknowledgments

Special thanks to Zhengjiu Xu, for her generous assistance with experiments. We want to thank Selena Smith and Jeronimo Morales for their support in collecting the X-ray radiographies. Thanks to Zeyu Li for data collection in the double-sided ionic conduction experiments in 2014. Thanks to David Walker and three anonymous reviewers for providing encouraging, critical and constructive comments. Jiaqi Lu acknowledges the research funding of Scott Turner Awards and Rackham Graduate Student Research Grant from the University of Michigan. Siyuan He acknowledges Stamps Scholars for providing funding for summer research.

Conflicts of Interest

The authors declare no conflicts of interest.

Appendix A

Pressure Calibration Using NaCl Melting Curve at High Pressures

For an 8 mm 646 octahedra assembly, a pressure calibration was performed to provide accurate pressure constraints in our multi-anvil experiments using a well-established melting curve of NaCl [25]. To achieve this, single-sided ionic conduction experiments [24,26] were conducted from at 30 to 100 bar oil pressure load on NaCl using identical assembly for K2CO3 (Figure 1a). For each target oil pressure load (in units of bar), we obtained the actual pressure of the NaCl sample from its melting temperature determined from IC experiments, based on the reported Simon melting equation [23] of NaCl (Equation (A1)). T0 = 1073.6 K and T (in Kelvin) are the melting temperatures at the reference pressure P0 = 1 bar = 0.0001 GPa and P (in gigapascal), respectively; c = 1.06 and A = 3.65.
T T 0 c = P P 0 A + 1
The correlation between the oil pressure load and the actual sample pressure (Figure 3b) is linearly fitted by Equation (A2) using the least square method. Poil is the oil pressure load measured in bar and P is the actual sample pressure in GPa, while a and b are fitting constants with values of 8.8 bar/GPa and 18.7 bar, respectively.
Poil = aP + b

Appendix B

Recrystallization of Starting Materials

A recrystallization process (Figure A1) was developed to dehydrate samples. It also ensures a fully dense pack of starting materials in the platinum sample capsule to avoid instability under high-pressure conditions. The process began with tightly packing powder into the alumina (Al2O3) sleeve within the platinum capsule. The capsule with packed sample powder was then rapidly heated to ~1050 °C for about 10 s using a torch. Significant volume reduction by about ¼ on the recrystallized sample was observed after quench. A U-shaped curvature was noted on the quenched sample where the inside of the sample is lower than the periphery, indicating upward migration of melts along the container wall.
Figure A1. Schematics of recrystallized sample configuration at high pressures. (a) Complete recrystallization for single-sided ionic conduction method: the entire sample was recrystallized. The sample capsule was open and allowed water to escape from the sample during recrystallization. (b) Partial recrystallization for Pt sphere method: two thin layers of recrystallized K2CO3 provide condensed spacers between the Pt sphere and Pt capsule. The recrystallized K2CO3 was formed by melting K2CO3 in powder at about 1050 °C for 10~15 s and quenched.
Minerals 15 00217 g0a1
For ionic conduction experiments with a single-sided configuration, the sample powder was refilled before melting again when the sample volume shrank after the first melting and was usually repeated several times until the recrystallized sample filled up the capsule. For Pt sphere experiments of K2CO3, only two layers of K2CO3 were recrystallized to provide separation between Pt spheres and Pt capsules. The volume of the recrystallized sample was controlled by mass weighed by a Mettler Toledo microbalance. The recrystallization process plays a critical role in ionic conduction experiments. It prevents the formation of a U-shaped curved surface upon crystallization of the sample during cooling, ensuring that the electrodes and thermocouple keep good and direct contact with the same area of the sample for accurate current and temperature measurements during multiple heating cycles at high pressures. Additionally, heating over 1000 °C at 1 bar effectively removed water that may be trapped in hygroscopic K2CO3.

References

  1. Dasgupta, R.; Mallik, A.; Tsuno, K.; Withers, A.C.; Hirth, G.; Hirschmann, M.M. Carbon-Dioxide-Rich Silicate Melt in the Earth’s Upper Mantle. Nature 2013, 493, 211–215. [Google Scholar] [CrossRef] [PubMed]
  2. Dasgupta, R.; Hirschmann, M.M. The Deep Carbon Cycle and Melting in Earth’s Interior. Earth Planet. Sci. Lett. 2010, 298, 1–13. [Google Scholar] [CrossRef]
  3. Dasgupta, R.; Hirschmann, M.M. Melting in the Earth’s Deep Upper Mantle Caused by Carbon Dioxide. Nature 2006, 440, 659–662. [Google Scholar] [CrossRef] [PubMed]
  4. Li, J.; Redfern, S.A.T.; Giovannelli, D. Introduction: Deep Carbon Cycle through Five Reactions. Am. Mineral. 2019, 104, 465–467. [Google Scholar] [CrossRef]
  5. Xu, M.; Jing, Z.; Bajgain, S.K.; Mookherjee, M.; Van Orman, J.A.; Yu, T.; Wang, Y. High-Pressure Elastic Properties of Dolomite Melt Supporting Carbonate-Induced Melting in Deep Upper Mantle. Proc. Natl. Acad. Sci. USA 2020, 117, 18285–18291. [Google Scholar] [CrossRef]
  6. Gaillard, F.; Malki, M.; Iacono-Marziano, G.; Pichavant, M.; Scaillet, B. Carbonatite Melts and Electrical Conductivity in the Asthenosphere. Science 2008, 322, 1363–1365. [Google Scholar] [CrossRef] [PubMed]
  7. Sifré, D.; Hashim, L.; Gaillard, F. Effects of Temperature, Pressure and Chemical Compositions on the Electrical Conductivity of Carbonated Melts and Its Relationship with Viscosity. Chem. Geol. 2015, 418, 189–197. [Google Scholar] [CrossRef]
  8. Sifré, D.; Gardés, E.; Massuyeau, M.; Hashim, L.; Hier-Majumder, S.; Gaillard, F. Electrical Conductivity during Incipient Melting in the Oceanic Low-Velocity Zone. Nature 2014, 509, 81–85. [Google Scholar] [CrossRef] [PubMed]
  9. Pal’yanov, N.; Sokol, A.G.; Borzdov, M.; Khokhryakov, A.F. Fluid-Bearing Alkaline Carbonate Melts as the Medium for the Formation of Diamonds in the Earth’s Mantle: An Experimental Study. Lithos 2002, 60, 145–159. [Google Scholar] [CrossRef]
  10. Timmerman, S.; Spivak, A.V.; Jones, A.P. Carbonatitic Melts and Their Role in Diamond Formation in the Deep Earth. Elements 2021, 17, 321–326. [Google Scholar] [CrossRef]
  11. Pearson, D.G.; Brenker, F.E.; Nestola, F.; McNeill, J.; Nasdala, L.; Hutchison, M.T.; Matveev, S.; Mather, K.; Silversmit, G.; Schmitz, S.; et al. Hydrous Mantle Transition Zone Indicated by Ringwoodite Included within Diamond. Nature 2014, 507, 221–224. [Google Scholar] [CrossRef]
  12. Dawson, J.B. Sodium Carbonate Lavas from Oldoinyo Lengai, Tanganyika. Nature 1962, 195, 1075–1076. [Google Scholar] [CrossRef]
  13. Pyle, D.M.; Dawson, J.B.; Ivanovich, M. Short-Lived Decay Series Disequilibria in the Natrocarbonatite Lavas of Oldoinyo Lengai, Tanzania: Constraints on the Timing of Magma Genesis. Earth Planet. Sci. Lett. 1991, 105, 378–396. [Google Scholar] [CrossRef]
  14. Arefiev, A.V.; Shatskiy, A.; Podborodnikov, I.V.; Litasov, K.D. Melting and Subsolidus Phase Relations in the System K2CO3 –MgCO3 at 3 GPa. High Press. Res. 2018, 38, 422–439. [Google Scholar] [CrossRef]
  15. Shatskiy, A.; Sharygin, I.S.; Gavryushkin, P.N.; Litasov, K.D.; Borzdov, Y.M.; Shcherbakova, A.V.; Higo, Y.; Funakoshi, K.-I.; Palyanov, Y.N.; Ohtani, E. The System K2CO3-MgCO3 at 6 GPa and 900–1450 °C. Am. Mineral. 2013, 98, 1593–1603. [Google Scholar] [CrossRef]
  16. Li, Z.; Li, J.; Lange, R.; Liu, J.; Militzer, B. Determination of Calcium Carbonate and Sodium Carbonate Melting Curves up to Earth’s Transition Zone Pressures with Implications for the Deep Carbon Cycle. Earth Planet. Sci. Lett. 2017, 457, 395–402. [Google Scholar] [CrossRef]
  17. Katsura, T.; Ito, E. Melting and Subsolidus Phase Relations in the MgSiO3-MgCO3 System at High Pressures: Implications to Evolution of the Earth’s Atmosphere. Earth Planet. Sci. Lett. 1990, 99, 110–117. [Google Scholar] [CrossRef]
  18. Li, Z. Melting and Structural Transformations of Carbonates and Hydrous Phases in Earth’s Mantle. Ph.D. Thesis, University of Michigan, Ann Arbor, MI, USA, 2015. [Google Scholar]
  19. Klement, W.; Cohen, L.H. Solid-Solid and Solid-Liquid Transitions in K2CO3, Na2CO3 and Li2CO3: Investigations to ≥5 Kbar by Differential Thermal Analysis; Thermodynamics and Structural Correlations. Berichte Bunsenges. Phys. Chem. 1975, 79, 327–334. [Google Scholar] [CrossRef]
  20. Liu, Q.; Tenner, T.J.; Lange, R.A. Do Carbonate Liquids Become Denser than Silicate Liquids at Pressure? Constraints from the Fusion Curve of K2CO3 to 3.2 GPa. Contrib. Mineral. Petrol. 2007, 153, 55–66. [Google Scholar] [CrossRef]
  21. Wang, M.; Liu, Q.; Inoue, T.; Li, B.; Pottish, S.; Wood, J.; Yang, C.; Tao, R. The K2CO3 Fusion Curve Revisited: New Experiments at Pressures up to 12 GPa. J. Mineral. Petrol. Sci. 2016, 111, 241–251. [Google Scholar] [CrossRef]
  22. Shatskiy, A.; Podborodnikov, I.V.; Arefiev, A.V.; Litasov, K.D.; Chanyshev, A.D.; Sharygin, I.S.; Karmanov, N.S.; Ohtani, E. Effect of Alkalis on the Reaction of Clinopyroxene with Mg-Carbonate at 6 GPa: Implications for Partial Melting of Carbonated Lherzolite. Am. Mineral. 2017, 102, 1934–1946. [Google Scholar] [CrossRef]
  23. Watson, E.S.; O’Neill, M.J.; Justin, J.; Brenner, N. A Differential Scanning Calorimeter for Quantitative Differential Thermal Analysis. Anal. Chem. 1964, 36, 1233–1238. [Google Scholar] [CrossRef]
  24. Zhou, D.; Dong, J.; Si, Y.; Zhu, F.; Li, J. Melting Curve of Potassium Chloride from in Situ Ionic Conduction Measurements. Minerals 2020, 10, 250. [Google Scholar] [CrossRef]
  25. Li, Z.; Li, J. Melting Curve of NaCl to 20 GPa from Electrical Measurements of Capacitive Current. Am. Mineral. 2015, 100, 1892–1898. [Google Scholar] [CrossRef]
  26. Walker, D.; Li, J. Castable Solid Pressure Media for Multianvil Devices. Matter Radiat. Extrem. 2020, 5, 018402. [Google Scholar] [CrossRef]
  27. Dong, J.; Li, J.; Zhu, F.; Li, Z.; Farawi, R. Melting Curve Minimum of Barium Carbonate BaCO3 near 5 GPa. Am. Mineral. 2019, 104, 671–678. [Google Scholar] [CrossRef]
  28. Leinenweber, K.D.; Tyburczy, J.A.; Sharp, T.G.; Soignard, E.; Diedrich, T.; Petuskey, W.B.; Wang, Y.; Mosenfelder, J.L. Cell Assemblies for Reproducible Multi-Anvil Experiments (the COMPRES Assemblies). Am. Mineral. 2012, 97, 353–368. [Google Scholar] [CrossRef]
  29. Simon, F.; Glatzel, G. Bemerkungen zur Schmelzdruckkurve. Z. Anorg. Allg. Chem. 1929, 178, 309–316. [Google Scholar] [CrossRef]
  30. Gavryushkin, P.N.; Bekhtenova, A.; Lobanov, S.S.; Shatskiy, A.; Likhacheva, A.Y.; Sagatova, D.; Sagatov, N.; Rashchenko, S.V.; Litasov, K.D.; Sharygin, I.S.; et al. High-Pressure Phase Diagrams of Na2CO3 and K2CO3. Minerals 2019, 9, 599. [Google Scholar] [CrossRef]
  31. Janz, G.J.; Neuenschwander, E.; Kelly, F.J. High-Temperature Heat Content and Related Properties for Li2CO3, Na2CO3, K2CO3, and the Ternary Eutectic Mixture. Trans. Faraday Soc. 1963, 59, 841. [Google Scholar] [CrossRef]
  32. Bohlen, S.R.; Boettcher, A.L. The Quartz⇋ Coesite Transformation: A Precise Determination and the Effects of Other Components. J. Geophys. Res. 1982, 87, 7073–7078. [Google Scholar] [CrossRef]
  33. Decker, D.L.; Bassett, W.A.; Merrill, L.; Hall, H.T.; Barnett, J.D. High-Pressure Calibration: A Critical Review. J. Phys. Chem. Ref. Data 1972, 1, 773–836. [Google Scholar] [CrossRef]
  34. Zhang, J.; Li, B.; Utsumi, W.; Liebermann, R.C. In Situ X-Ray Observations of the Coesite-Stishovite Transition: Reversed Phase Boundary and Kinetics. Phys. Chem. Miner. 1996, 23, 1–10. [Google Scholar] [CrossRef]
  35. Susaki, J.; Akaogi, M.; Akimoto, S.; Shimomura, O. Garnet-perovskite Transformation in CaGeO3: In-situ X-ray Measurements Using Synchrotron Radiation. Geophys. Res. Lett. 1985, 12, 729–732. [Google Scholar] [CrossRef]
  36. Katsura, T.; Ito, E. The System Mg2SiO4-Fe2SiO4 at High Pressures and Temperatures: Precise Determination of Stabilities of Olivine, Modified Spinel, and Spinel. J. Geophys. Res. 1989, 94, 15663–15670. [Google Scholar] [CrossRef]
  37. Pal’yanov, Y.N.; Sokol, A.G.; Borzdov, Y.M.; Khokhryakov, A.F.; Shatsky, A.F.; Sobolev, N.V. The Diamond Growth from Li2CO3, Na2CO3, K2CO3 and Cs2CO3 Solvent-catalysts at P=7 GPa and T=1700 °C. Diam. Relat. Mater. 1999, 8, 1118–1124. [Google Scholar] [CrossRef]
  38. Sokol, A.G.; Tomilenko, A.A.; Pal’Yanov, Y.N.; Borzdov, Y.M.; Pal’Yanova, G.A.; Khokhryakov, A.F. Fluid Regime of Diamond Crystallisation in Carbonate-Carbon Systems. EJM 2000, 12, 367–375. [Google Scholar] [CrossRef]
Figure 1. Schematic configurations of high-pressure experiments. (a) Configuration of single-sided ionic conduction experiments at high pressures. Type S thermocouple and Pt electrodes contacted the same interface within the sample to ensure the simultaneous measurement of temperature and current. The sample capsule was open and allowed water to escape from the sample during multiple heating cycles. (b) Configuration of Pt sphere experiments at high pressures. A type C thermocouple was used to monitor temperature. Two platinum spheres with a diameter of 200~300 μm (black circles) were placed on the upper and lower positions, and they were both separated from the Pt capsule by a thin layer of K2CO3. The schematics are not to scale. For reference, the sample is 1.30 mm in diameter and 1.5 mm in height; the inner diameter of the Re heater is 3.10 mm.
Minerals 15 00217 g001
Figure 2. Melting points of K2CO3 at 1 bar by concurrent ionic conduction (IC) method and differential thermal analysis (DTA). Red lines in (a,b) are the results of the IC method. Black lines in (c,d) are the results of DTA. (a) Current–temperature relation during heating in the IC method. (b) First derivative of current over sample temperature in the IC method. A sharp peak is present at 891 °C. (c) Reference temperature and sample temperature relation during heating in DTA. A latent heat ledge can be observed at 890 °C when the reference temperature continuously went up, but the sample temperature stopped increasing. (d) The first derivative of reference temperature over sample temperature in DTA. A sharp peak is located at 890 °C. The DTA method reported a melting point of 890 °C and the IC method reported 891 °C for K2CO3 at 1 bar, indicating close agreement between these two techniques.
Minerals 15 00217 g002
Figure 3. Representative results of ionic conduction (IC) experiments on K2CO3 at high pressures. Data were acquired from experiments using single-sided configuration (red, this study) and double-sided configuration (gray, [18]). (a) Current–temperature relation of ionic conduction experiments; (b) first derivative of current (dI/dT) over temperature of single-sided ionic conduction experiments; (c) first derivative of current (dI/dT) over temperature of double-sided ionic conduction experiments. The peak positions of the dI/dT curves are identified as the melting points.
Minerals 15 00217 g003
Figure 4. Representative X-ray radiography images of Pt sphere experimental products. The images were edited for better contrast. Black spheres (marked by red dashed circles) represent the Pt spheres; curved lines are type C thermocouples, the inner black rectangles are Pt sample capsules, and the thick outer lines are Re heaters. Thermocouple readings were labeled on the side of each image near the TC junction. (a) No sink: The radiograph of experiment M062224 shows the upper sphere in the “top” position and no melting of K2CO3 was detected, which means the melting temperature is higher than the TC reading. (b) Partial sink: In M030834, the upper sphere sank to the “middle” position without touching the capsule’s bottom, indicating incomplete melting of K2CO3 due to the thermal gradient. The temperature labeled at the eventual position of Pt spheres was estimated on the basis of the thermal gradient (100 °C/mm) [28]. (c) Sink: In M020424, both spheres sank to the bottom of the capsule, showing complete melting of K2CO3. Radiographs of other Pt sphere experiments are provided in Figure S4.
Minerals 15 00217 g004
Figure 5. Constraints on high-pressure melting curve of K2CO3 from in situ ionic conduction experiments (IC) and Pt sphere experiments. Triangles represent the results from Pt sphere methods (L07 [20]; S13 [15]; W16 [21]; A18 [14]). The dark and light gray squares are from double-sided ionic conduction experiments (L15 [18]). The open circles (KC75) at low pressures are from differential thermal analysis [19]. The red curve is the Simon equation fit to the results of the single-sided ionic conduction experiments from this study (red circles) and represents the melting curve of anhydrous K2CO3. The blue curve is fitted to the results of existing Pt sphere experiments from L07 and W16 (open triangles [20,21]) and represents the melting curve of nominally anhydrous K2CO3. The Pt sphere experiments from this study provide bounds (light and dark blue triangles) or estimations (blue hexagrams) on the melting temperatures of nominally anhydrous K2CO3 with variable degrees of hydration. The boundaries between solid phases (dotted lines from multi-anvil experiments and dashed lines from diamond anvil cell experiments) are shown for reference [30].
Minerals 15 00217 g005
Figure 6. Effect of water on melting temperature detection of K2CO3. The more water in the sample, the lower the melting temperature detected. The ionic conduction experiments used open sample capsules ([18] and this study), allowing water to escape during the heating process. Pt sphere experiments ([14,15,20,21] and this study) used completely sealed capsules, potentially trapping water in the sample. Sample dehydration and experimental setup contributed to the amount of trapped water. Open capsules, recrystallization of starting materials and thin capsules help to provide lower degrees of hydration in the sample; closed capsules, packed powder sample and thick capsules increase the degrees of hydration by trapping water. The schematic is not to scale.
Minerals 15 00217 g006
Figure 7. Melting curves of carbonates at mantle conditions. The melting curve of anhydrous K2CO3 (solid red curve, this study) is 200~400 °C higher than nominally anhydrous K2CO3 (dashed red curve) [20,21]. Compared with K2CO3, CaCO3 (dark gray curve) [16] and MgCO3 (light gray curve) [27] are more refractory, whereas Na2CO3 (black curve) [16] is less refractory. The nominally anhydrous melting curve overlaps with the pressure and temperature conditions for naturally forming diamonds (area enclosed by a dashed black curve) [9], indicating a possible role of carbonate melts in natural diamond formation. Note also that the eutectic Na-K carbonate melt is expected to have a melting curve that is lower than the two end members.
Minerals 15 00217 g007
Table 1. High-pressure melting points of K2CO3 determined by ionic conduction experiments.
Exp. IDPressure 1 (GPa)Melting Temperature 2 (°C)
MeasurementAverage
8 mm TEL single-sided configuration
M100623_82.513281330 ± 2
1331
M110623_83.013851380 ± 7
1375
M100624_85.01475 ± 201475
M061624_810.01641 ± 141641
5 mm TEL double-sided configuration [18]
M081814_53.013371353 ± 14
1364
1359
4.514551456 ± 1
1457
6.015241520 ± 6
1516
9.016231621 ± 3
1619
12.017851788 ± 3
1790
15.019361933 ± 4
1930
18.020502045 ± 7
2040
20.021102108 ± 2
2107
M090214_53.013431348 ± 7
1353
4.514751476 ± 1
1476
6.015581557 ± 1
1555
9.016881688 ± 1
1687
10.017511750 ± 1
1749
12.018751876 ± 1
1876
16.020482046 ± 3
2043
20.022092208 ± 2
2206
1 The pressure uncertainties were estimated at 7%, including calibration uncertainty and pressure drift during heating. 2 Uncertainties in melting temperature measurements were estimated from a combination of the thermocouple uncertainties and full width at half maximum (FWHM) of dI/dT, and are within ±5 °C unless noted in the table. Uncertainty shown in the average is calculated from one standard deviation. For 5 mm TEL double-sided experiments, total temperature uncertainties are estimated as 5% on the basis of a combination of type C thermocouple uncertainties, reproducibility within a single experiment, and variations among duplicate experiments due to sample geometry deformation under compression [18].
Table 2. Results from Pt sphere experiments on K2CO3 at high pressures.
Exp. IDPressure 1 (GPa)Thermocouple Temperature (°C)Upper Sphere PositionUpper Sphere Movement 2Melting Temperature (°C)
M0116244.01300TopNo sink>1380
M0119245.01352TopNo sink>1422
M020424 33.0~1500BottomSink<1500
M0220243.01300MiddlePartial sink1368
M030324 43.01200BottomSink<1200
M0308246.01400MiddlePartial sink 1480
M0310247.01450MiddlePartial sink1510
M0622247.01300TopNo sink>1394
M09292410.01600MiddlePartial sink1670
1 The pressure uncertainties are estimated as 7% based on the pressure drift during heating, calibration uncertainty, and other system uncertainties. 2 No sink: the upper sphere did not sink and no melting was detected; partial sink: the upper sphere sank to the middle but did not reach the bottom of the capsule, indicating part of the sample was melted; sink: the upper sphere sank to the bottom of the capsule and the entire sample melted. 3 Power curve was used to estimate the temperature of M020424. 4 All Pt sphere experiments used a thin Pt sample capsule of 0.001 inch (25.4 μm), except for M030324, which used a thicker Pt capsule of 0.003 inches (76.2 μm).
Disclaimer/Publisher’s Note: The statements, opinions and data contained in all publications are solely those of the individual author(s) and contributor(s) and not of MDPI and/or the editor(s). MDPI and/or the editor(s) disclaim responsibility for any injury to people or property resulting from any ideas, methods, instructions or products referred to in the content.

