Article

Mineralogical and Micro-Computer Tomographic (μCT) Texture Investigations of Egyptian Blue Spheres (Aguntum, East Tyrol; Retznei and Wagna, Flavia Solva, South Styria)

1
Core Facility MicroCT, University Clinic for Radiology, Medical University of Innsbruck, 6020 Innsbruck, Austria
2
Institute of Mineralogy and Petrography, University of Innsbruck, 6020 Innsbruck, Austria
3
Geochemistry Lab, Archaeological Sciences, Austrian Archaeological Institute of the Austrian Academy of Sciences, Dominikanerbastei 16, 1010 Vienna, Austria
4
Human Evolution and Archaeological Sciences (HEAS), University of Vienna, 1010 Vienna, Austria
5
Institute of Archaeologies, University of Innsbruck, 6020 Innsbruck, Austria
*
Author to whom correspondence should be addressed.
Minerals 2025, 15(3), 302; https://doi.org/10.3390/min15030302
Submission received: 14 February 2025 / Revised: 12 March 2025 / Accepted: 13 March 2025 / Published: 15 March 2025

Abstract

:
Egyptian Blue was the first synthetic pigment by humankind. It contains of cuprorivaite, which is a calcium-copper-silicate (CaCuSi4O10). This study reports the results of a mineralogical and computer tomographic study of Egyptian Blue finds from Aguntum in East Tyrol along with Retznei and Wagna (formerly Flavia Solva) from southern Styria in Austria. The present work aims to extend our understanding of the processes involved in the production of the artificial pigment Egyptian Blue. The samples were investigated with respect to their elemental composition and spatial distribution of the calcium-copper-silicate cuprorivaite CaCuSi4O10 and then compared with data from previous studies. Thin sections of an Egyptian Blue sphere from Aguntum were examined using optical microscopy (OP), micro-X-ray fluorescence analysis (μ-XRF) and scanning electron microscopy coupled with energy dispersive X-ray spectroscopy (SEM-EDX). The pigment’s initial mixture as well as the manufacturing process seem to be the decisive factor for the quality of the final product. A relationship between the presence of trace iron (Fe) and titanium (Ti) with the quartz and copper source of the initial mixture is discussed. SEM-EDX analysis revealed that cuprite (Cu2O) was used as a copper source. In addition, micro-computed tomography (µCT) of the Egyptian Blue finds (Aguntum, Retznei, Wagna-Flavia Solva) was performed. Hence, revealing several concise differences between the samples. Texture and volumetric results show a distinctive difference in cuprorivaite content and particle size. To better analyse the spatial distribution, µCT-3D images of the individual mineral phases identified within each sample were obtained. The clear differences in the results may not only enable a differentiation of the production process but also show another potential of non-destructive µCT for assessment of archaeological findings.

1. Introduction

According to various ancient Greek and Roman writers (Vitruvius, Theoprastus and Pliny the Elder), the most widely used blue pigment of antiquity (ca. 800 BC to ca. 600 AD), Egyptian Blue, was invented in Egypt and has been known since the middle of the 3rd millennium BC [1]. Egyptian Blue was the first artificially produced pigment known to humankind. It was used as early as the Late Bronze Age (16th–12th century BC), even far beyond Egypt. Evidence of this is provided by the numerous Bronze Age beads and inlays found in graves [2]. The calcium copper silicate cuprorivaite (CaCuSi4O10), first described by Minguzzi [3], is responsible for the characteristic blue color of the pigment. As the mineral is very rare in nature and there is written evidence regarding the production process, e.g., from Vitruvius in his work De architectura, it can be assumed that the Egyptian Blue finds are synthetically produced material [3,4].

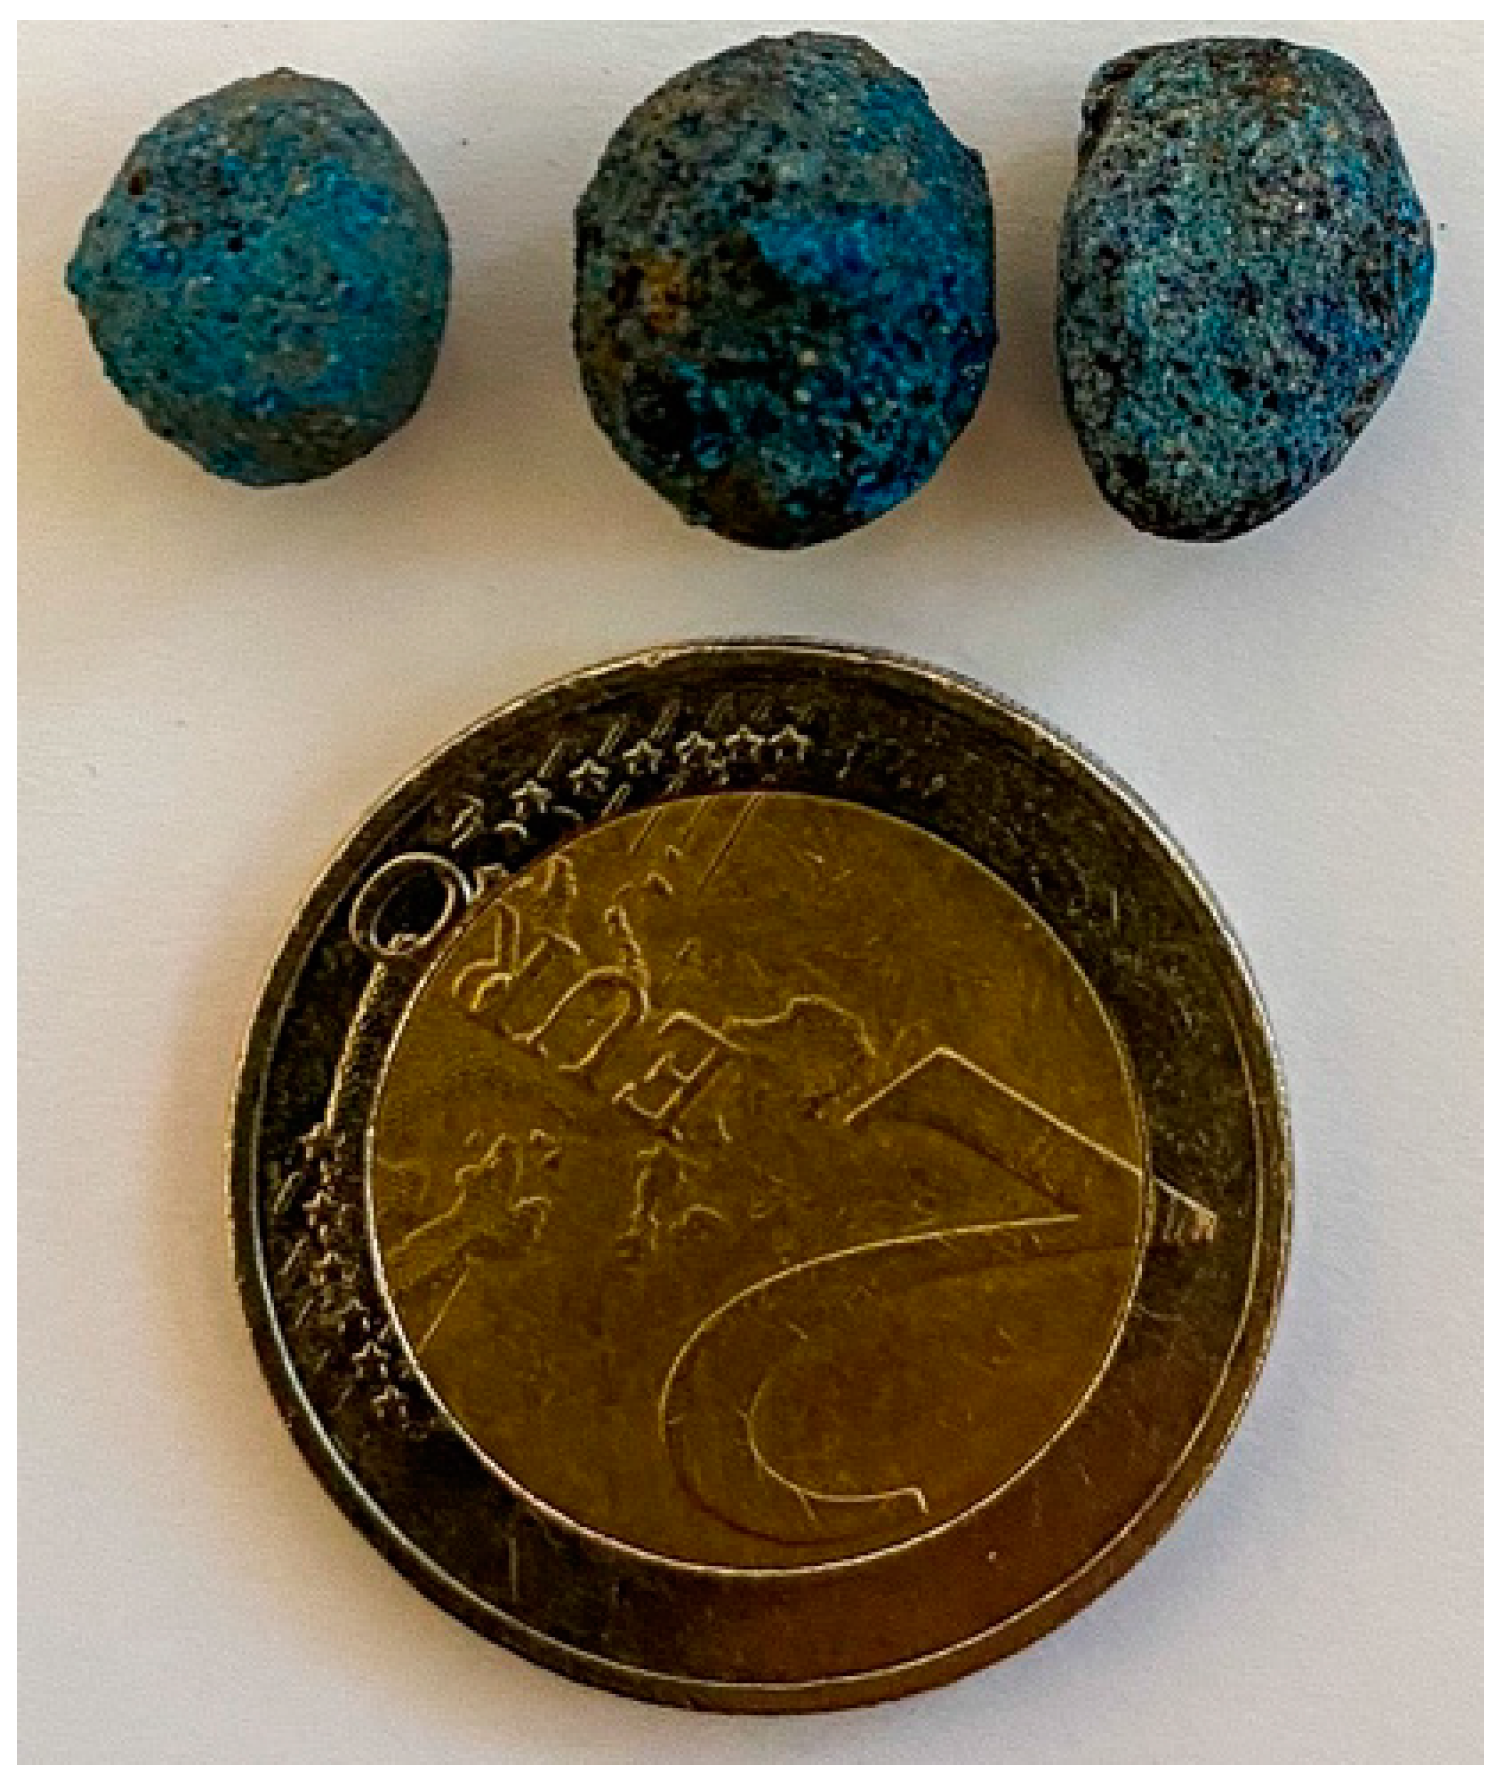
1.1. Use and Significance of Egyptian Blue in Antiquity

Initially, the popular blue pigment was used extensively in Egypt and the Middle East as a component to produce small objects such as beads, statuettes, scarabs and inlays. It was used almost continuously from its first appearance until Roman times. Besides Egypt and the Middle East, the pigment was also used in Minoan (pre-Greek culture) Crete and in the Roman world. During the Roman Empire (8th century BC to 7th century AD), the pigment Egyptian Blue continued to be highly valued and spread from Britain to North Africa and was also used in Asia Minor [5].
Egyptian Blue was used in antiquity as a pigment for paintings on various surfaces such as wood, paper, stone, ceramics, lime plaster and gypsum. It was also used as a colorant in glass and faience. It is even said to have been sought after as eye shadow (make-up) by women in antiquity [6]. Archaeological evidence suggests that the demand for Egyptian Blue increased greatly as the need for pigments for wall paintings increased during the Hellenistic and Roman periods [1]. After the fall of the Roman Empire, the use of Egyptian Blue declined, except in a few areas; there is still some documentation, especially from the Byzantine world (late antiquity). Later, the coveted pigment found its way into medieval wall painting, as well as into the masterpieces of Italian Renaissance painting [6,7]. The technological knowledge on which the production of the blue pigment was based was presumably lost at the end of the first millennium AD and was only rediscovered in the decades around 1900 [8]. According to Mirti et al., it is possible that the use of Egyptian Blue in the post-Roman period was a recycling of lumps produced in the Roman period [5].
Although there are many archaeological finds that prove the wide use of Egyptian Blue, there is little material evidence regarding the production of the pigment [9]. To be able to make further statements regarding the production of the pigment or the formation of the blue-coloring copper phase cuprorivaite (CaCuSi4O10), comprehensive chemical and textural analyses of Egyptian Blue finds must be carried out.
For the present study, samples of Egyptian Blue pellets were taken during an excavation campaign (2013) at a site from the Roman Municipium Claudium Aguntum in East Tyrol (near Lienz) [10]. Furthermore, two pellets from Retznei and Wagna-Flavia Solva also described by Rodler-Rørbo et al. (forthcoming) were available for micro-computed tomography (µCT) [11]. The aim of this work is to determine the spatial distribution of the blue-colored copper phase (cuprorivaite) within the pellets using reflected and transmitted light optical microscopy, micro-X-ray fluorescence analysis (μ-XRF), scanning electron microscopy coupled with X-ray energy dispersion spectroscopy (SEM-EDX) and micro-computed tomography (µCT) and thus to make possible statements about the manufacturing process.

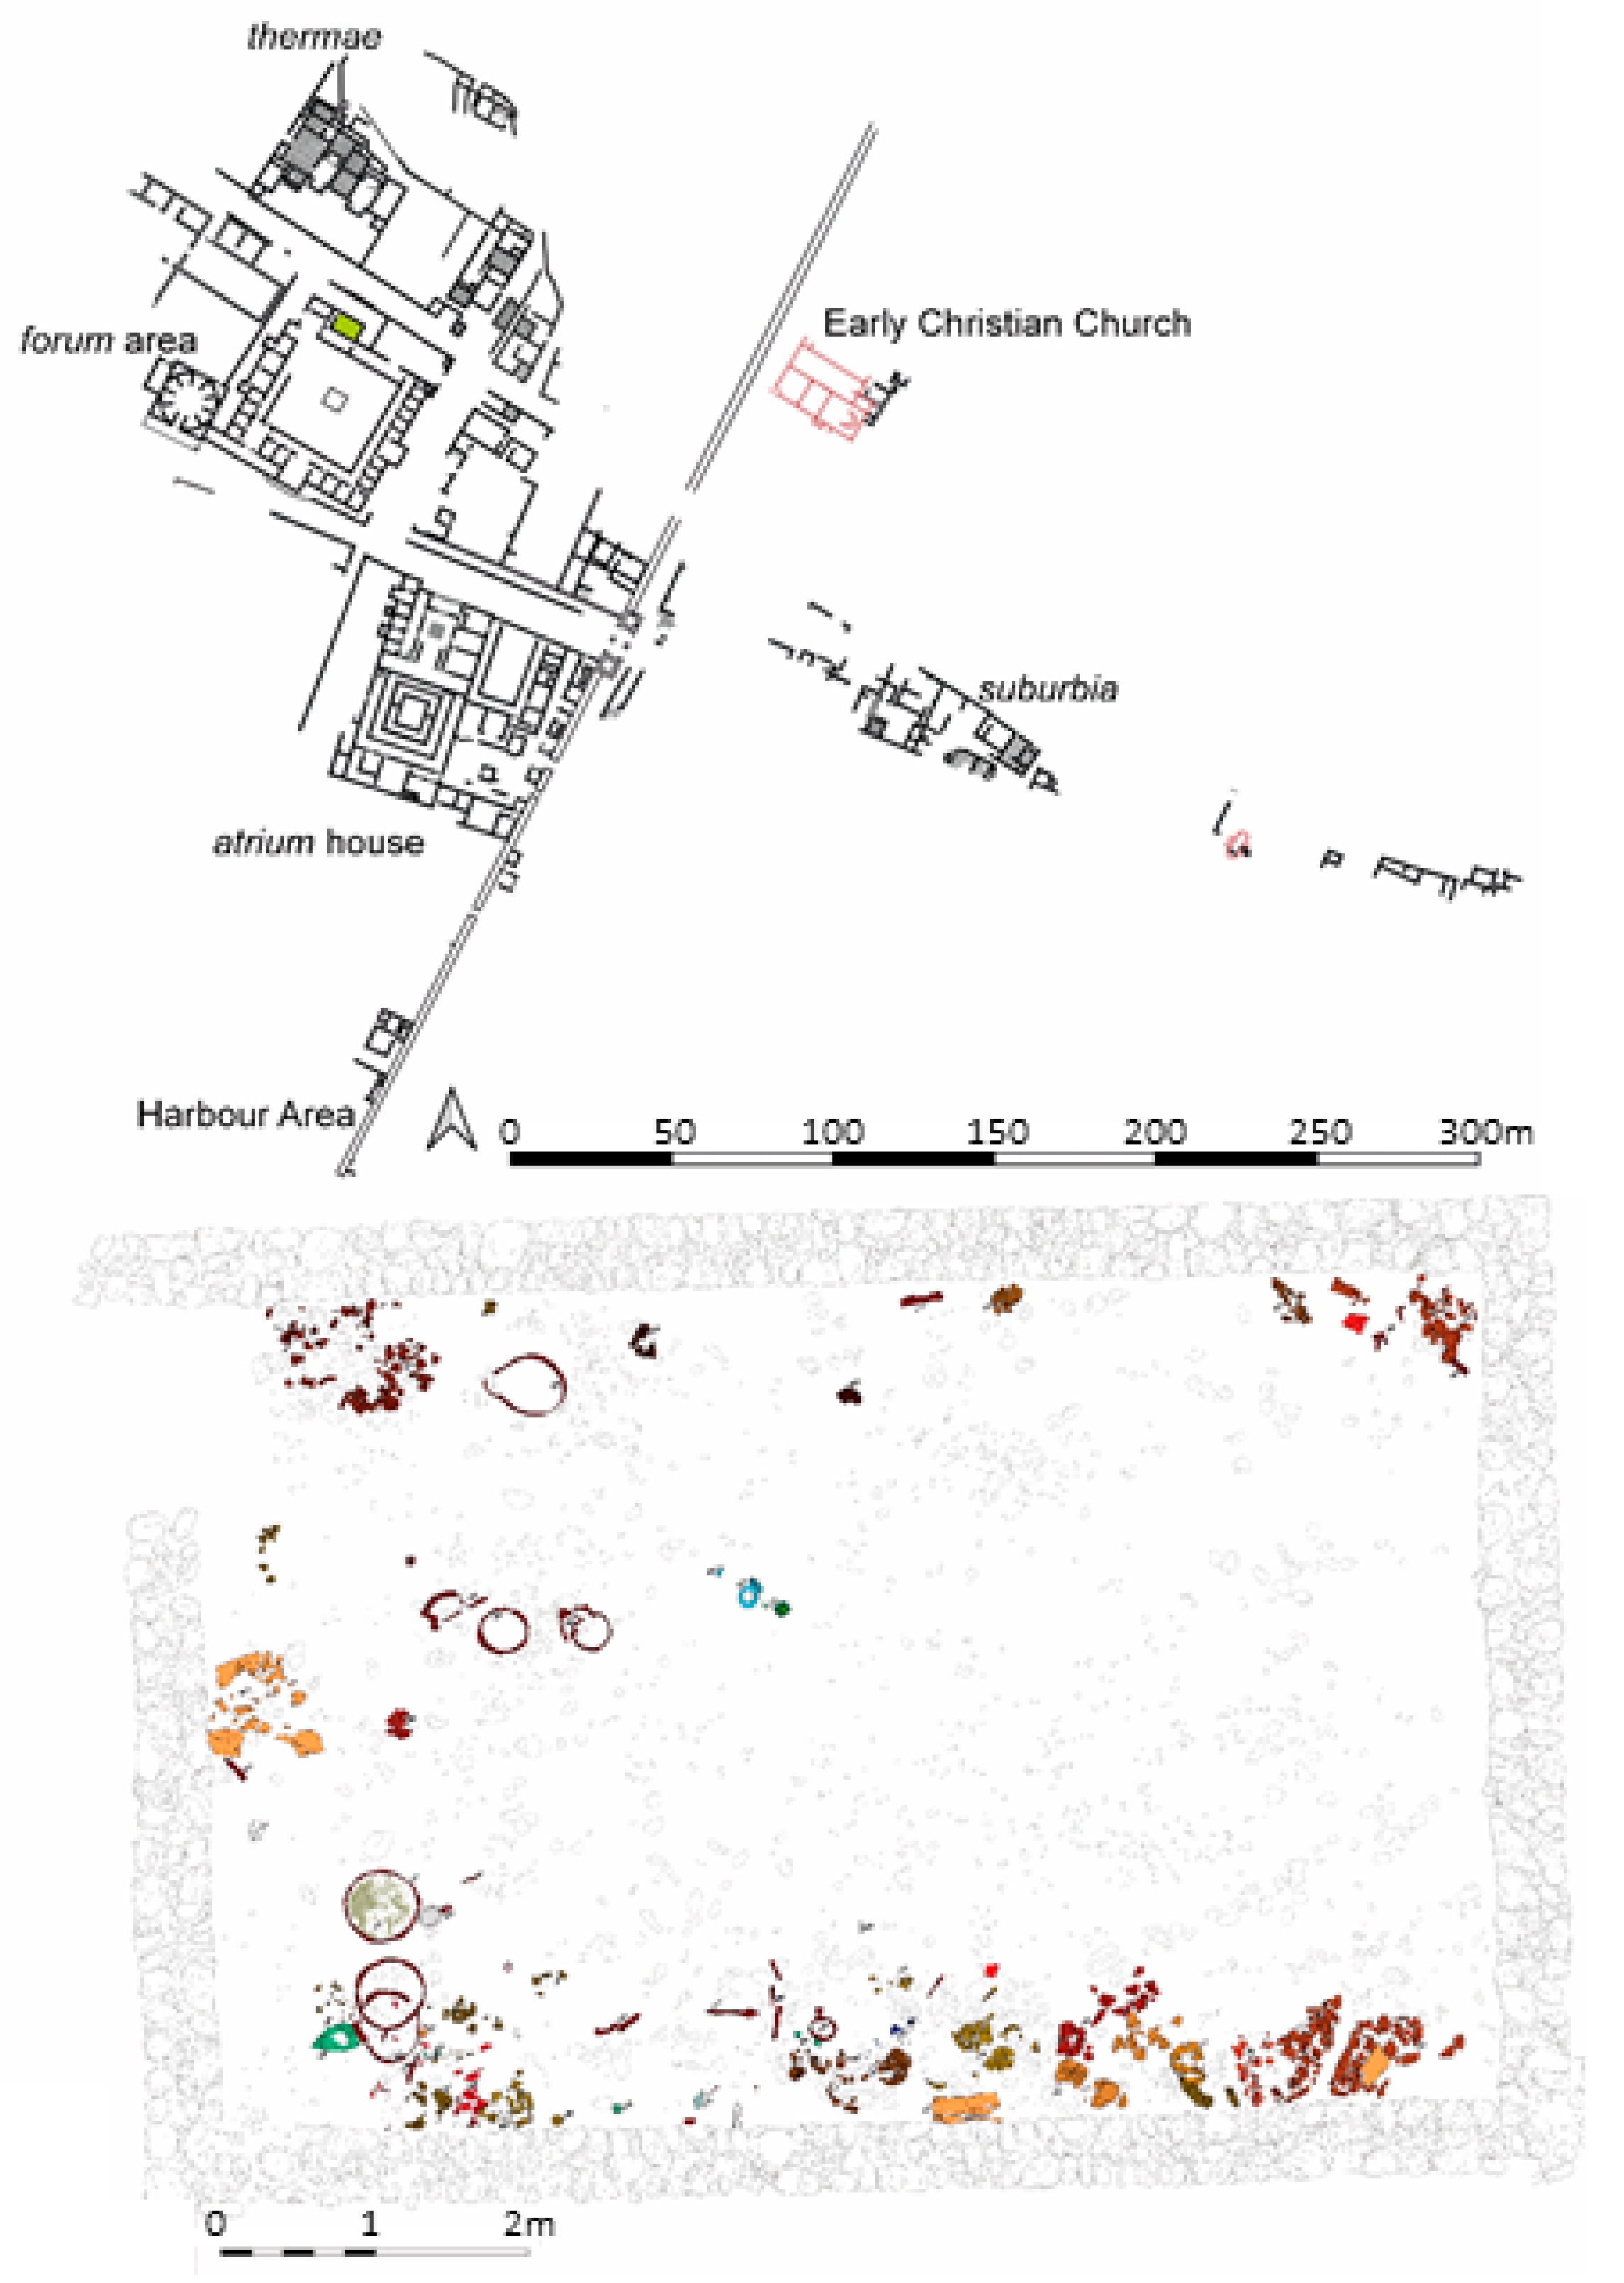
1.2. Geographical Location of the Roman Municipium Claudium Aguntum (Lienz)

The ruins of the Roman town are in East Tyrol in the vicinity of Lienz (Figure 1). They have been known since the 16th century AD and were finally identified as the ancient Municipium Claudium Aguntum by Theodor Mommsen in 1873 (CIL III, Pars II, 1873) [12]. As the area was repeatedly affected by mudslides and flooding in the post-Roman period, new excavations had to be carried out time and again [13]. One of these was the 2013 excavation campaign, during which room 289 in the north of the forum complex was investigated (Figure 1). As part of the excavations at Aguntum in 2013 (led by Michael Tschurtschenthaler and Martin Auer, Institute of Archaeology, University of Innsbruck), “numerous small blue pellets were found in room 289, which were initially addressed as azurite spheres and inventoried under a total of four find numbers (find nos. AG13/203, AG13/251, AG13/314, AG13/323)” [10]. The Egyptian Blue pellets examined in this work are samples from the inventory with the find no. AG13/314.

1.3. Retznei and Flavia Solva (Wagna)

Further samples of Egyptian Blue pellets examined in this work come from the excavation of a Roman villa rustica (country house or estate in the Roman Empire) in the Retznei area (Figure 2). The finds come from the farmyard R26, from which a praefurnium was heated. They were in an Imperial period layer (SE 174), which contained material from the Middle Imperial period as well as oyster shells and some Late Roman finds, so this layer can be defined as a waste layer [14].
The former Roman town of Municipium Flavia Solva (today Wagna) is in southern Styria near Leibnitz in the Leibnitzer Feld (approx. south 40 km from Graz). Egyptian Blue pigment pellets have also been found here (Figure 3). The distance between Retznei and Flavia Solva is approx. 3.6 km.

2. Materials and Methods

Prior to destructive analysis, all five samples were scanned using micro-computed tomography (µCT). In order to determine the spatial distribution of the blue-colored copper phase (Cuprorivaite) within the Egyptian Blue pellets and to be able to make possible statements about the formation process, one (Aguntum 1) of the five samples (Aguntum 1, Aguntum 02, Aguntum 03, Flavia Solva 1, Retznei 1; Figure 4) was also subjected to micro X-ray fluorescence analysis (μ-XRF) and the thin section of the same pellet (Aguntum 1, Figure 5, left pellet) was examined under a reflected and transmitted light microscope (Leica DFC 420, Wetzlar, Germany). In addition, the sample was examined under a scanning electron microscope (SEM).

2.1. Scanning Electron Microscope

The scanning electron microscope was used in combination with an EDX detector (energy dispersive X-ray spectroscopy) to record backscatter electron (BSE) images and perform chemical analysis (SEM-EDX) of the phases. The samples were carbon-coated, and measurements were carried out at 15 kV and 10 nA using the JSM-6010LV (JEOL, Akishima, Japan) scanning electron microscope at the Institute of Mineralogy and Petrography at the University of Innsbruck.

2.2. Micro X-Ray Fluorescence Analysis

One of the three samples from Aguntum was analysed with the Bruker M4 Tornado (Bruker Corporation, Billerica, MA, USA) high performance micro-XRF spectrometer of the Institute of Mineralogy and Petrography. The measurements were carried out using measurement conditions of 50 kV and 600 nA. The step size was 25 μm. Micro-XRF analysis shows the 2D element distribution of Ca, Si, Cu, Fe and Ti within the Egyptian Blue pellet using X-rays.

2.3. Micro-Computed Tomography and Image Post Processing

Five Egyptian Blue pellets from different sites (Aguntum 1-3, Flavia Solva 4, Retznei 5) were examined using µCT (vivaCT40, Scanco Medical, Brüttisellen, Switzerland). The vivaCT40 enables a resolution of up to 10.5 μm for samples with a Field of View (FOV) diameter of 20–38 mm and a length of 154 mm. After optimization and testing, the following scan settings were used: 70 KV anode voltage, 114 µA anode current, 2000 projections with an integration time of 3.5 s and a matrix size of 2048 × 2048 pixels combined with a FOV of 20 mm resulting in an isotropic pixel size of 10.5 µm. A convoluted cone beam reconstruction provided by the manufacturer was used for the image reconstruction. In addition, the ring artifact suppression was increased to the maximum due to the expected influence of the high-density mineral phases. Since the µCT used is calibrated as a quantitative CT, the voxel grayscale values represent the hydroxyapatite density Ca10P6O24OH2, instead of the Hounsfield Unit (HU) scale commonly used in clinical CT. The Unit used to represent the grayscale value is mgHA/mm3. On average, it took about 18 h to scan one sphere. To analyse the µCT data sets, an outer contour detection (to capture the exact volume of the pellet including the pore space) must first be performed. This process makes it possible to precisely enclose the outer contour of the respective pellet [16]. In CT imaging, the convention is that materials with a high attenuation coefficient are displayed light and materials with a low attenuation coefficient are displayed dark gray to black. The attenuation coefficient is composed of three main characteristics, mineral density, mass density and energy-dependent coefficients [17]. The correlation between certain mineral phases and CT density has already been shown by several groups [17,18,19,20]. In our case, the individual phases were derived from SEM-EDX analyses, and based on the previously mentioned observations, the next step was to define brightness ranges (thresholds for segmentation) within the µCT images that represent specific mineral phases. For this reason and to improve segmentation, noise smoothing was also performed using a Gaussian filter (sigma 1.4; Gaussian distance 2). The identification of phases represented in certain areas is based on the overall density of the individual phases and is verified in the spatial correlation between µXRF and a corresponding µCT slice. In all five Egyptian Blue pellets, areas could be defined and assigned to specific mineral phases. This results in six different threshold windows (Table 1):
The segmented volumes were then individually analysed using the bubble growing described by Hildebrandt et al. to assess the mean short-axis diameter of the visible particles [16,21]. The interpretation of the particle in μCT measurements differs from the actual grain size in the measured volume as the aggregation of clasts of grains of the same mineral or same mineral composition has the potential of being not differentiable individually in μCT. Further grains near or below the object resolution of the μCT can also add variability due to the partial volume effect [16].

3. Results

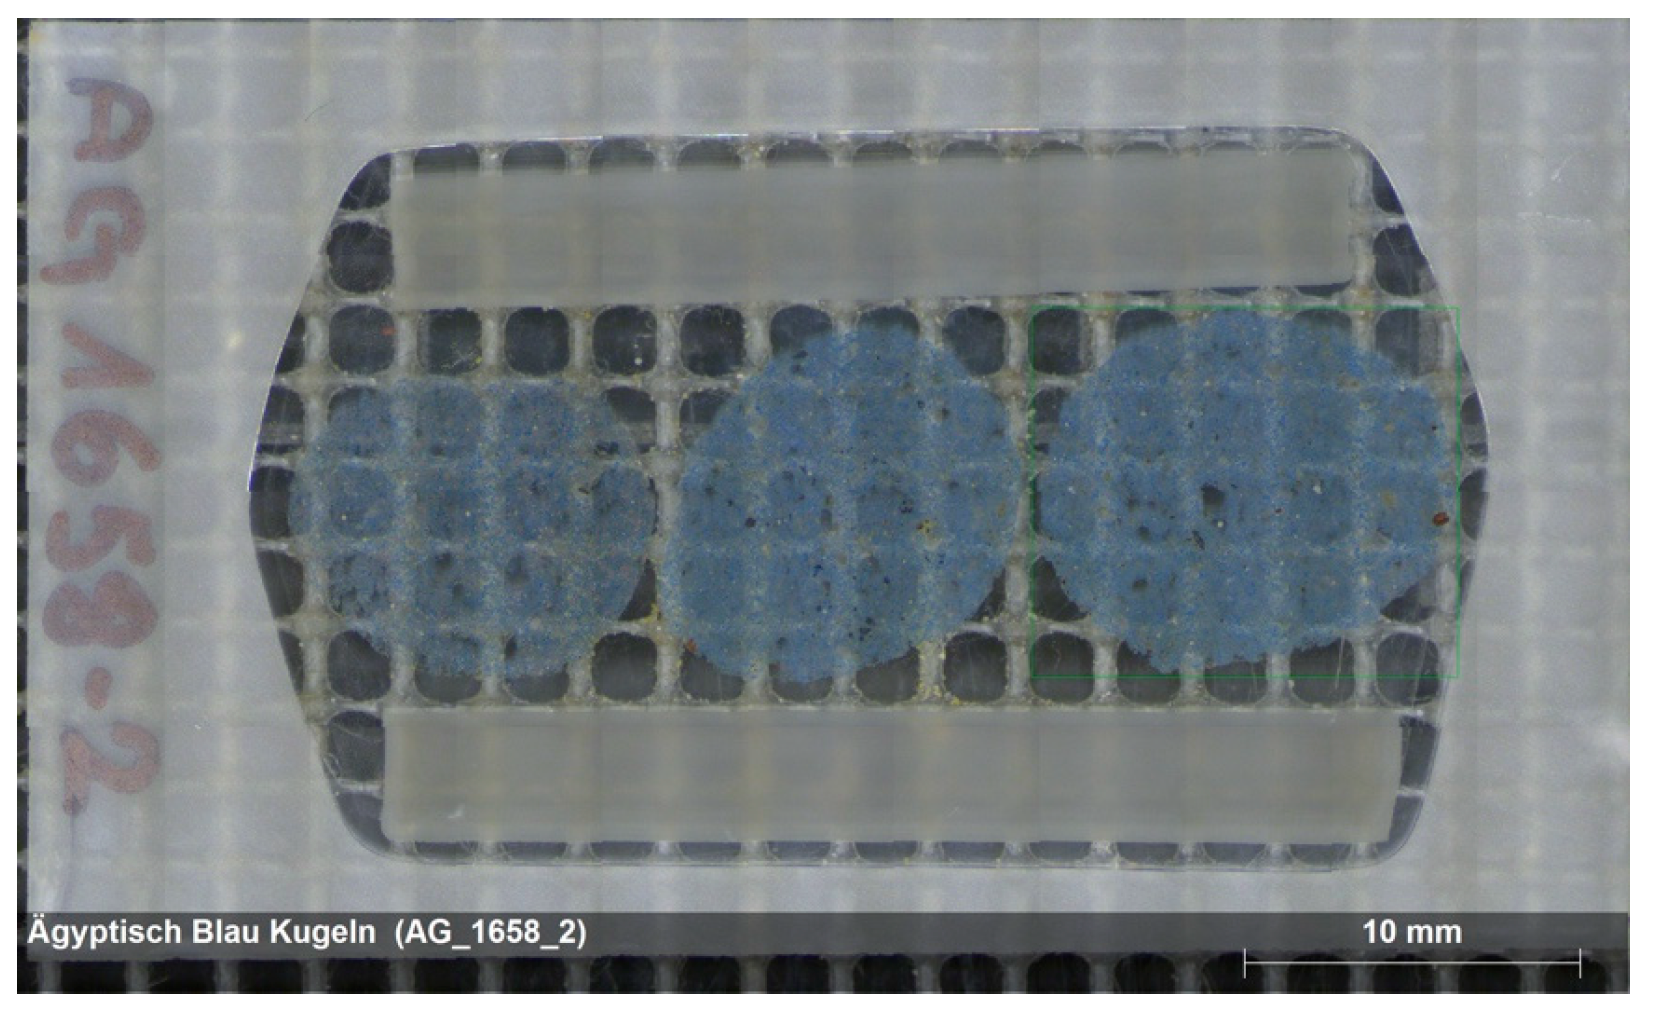
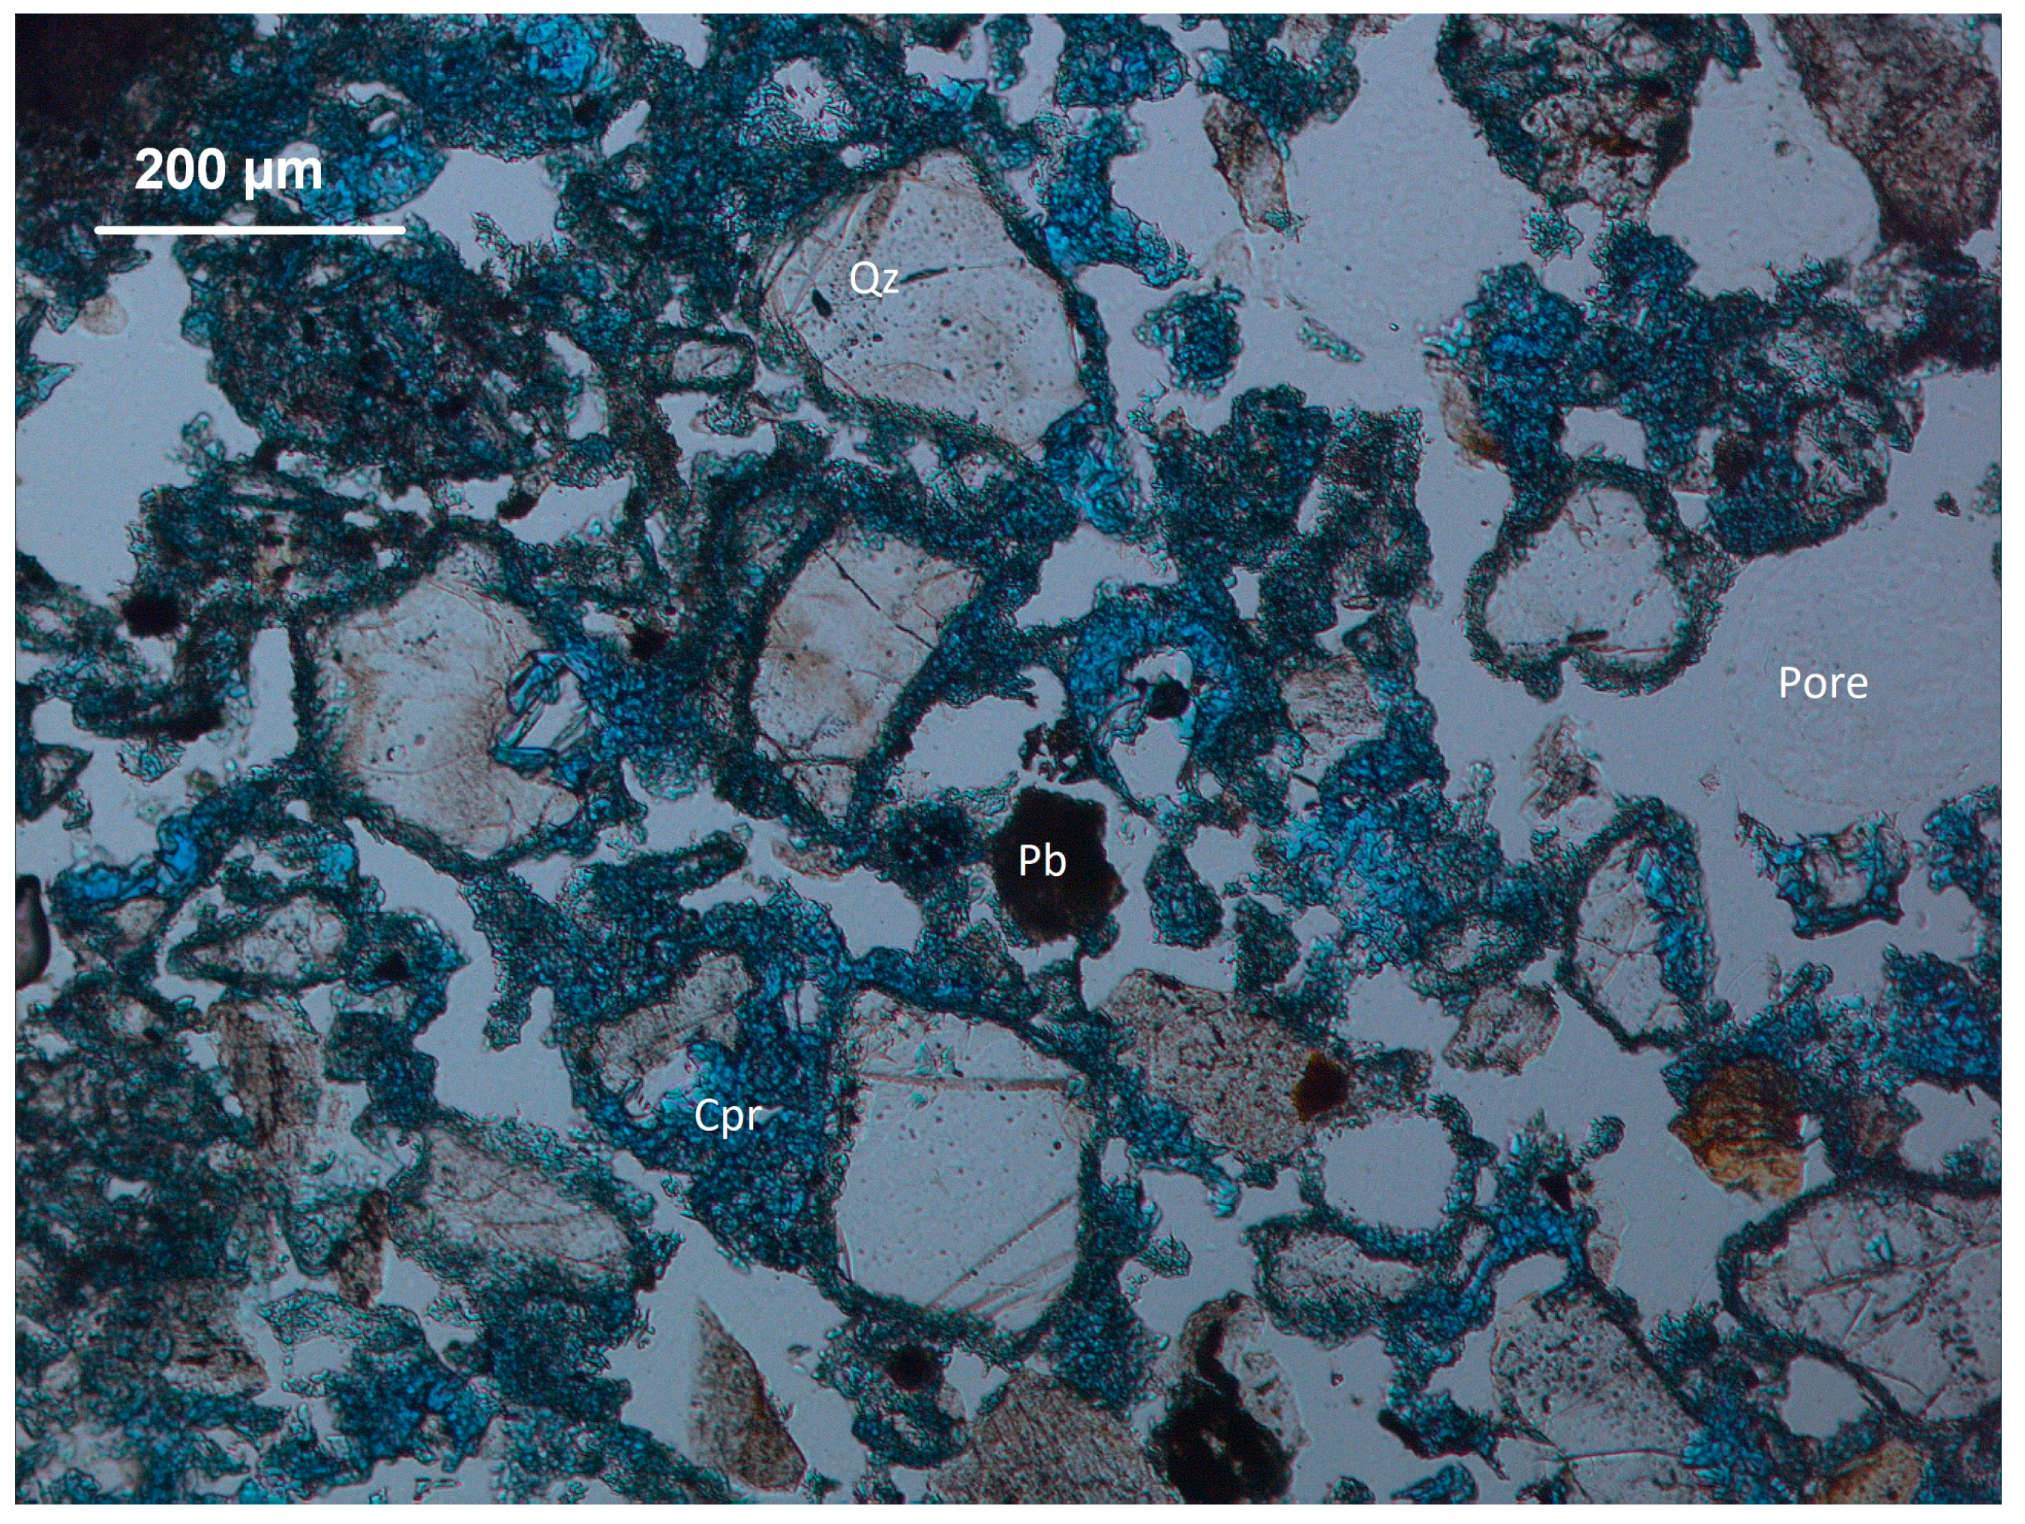
3.1. Thin Section Petrography

The blue cuprorivaite crystals in this Aguntum pellet sample occur only locally, exhibit idiomorphic growth, and are largely in contact with quartz grains (Figure 6). Opaque phases and carbonates are also visible. The microstructure also shows abundant holes.

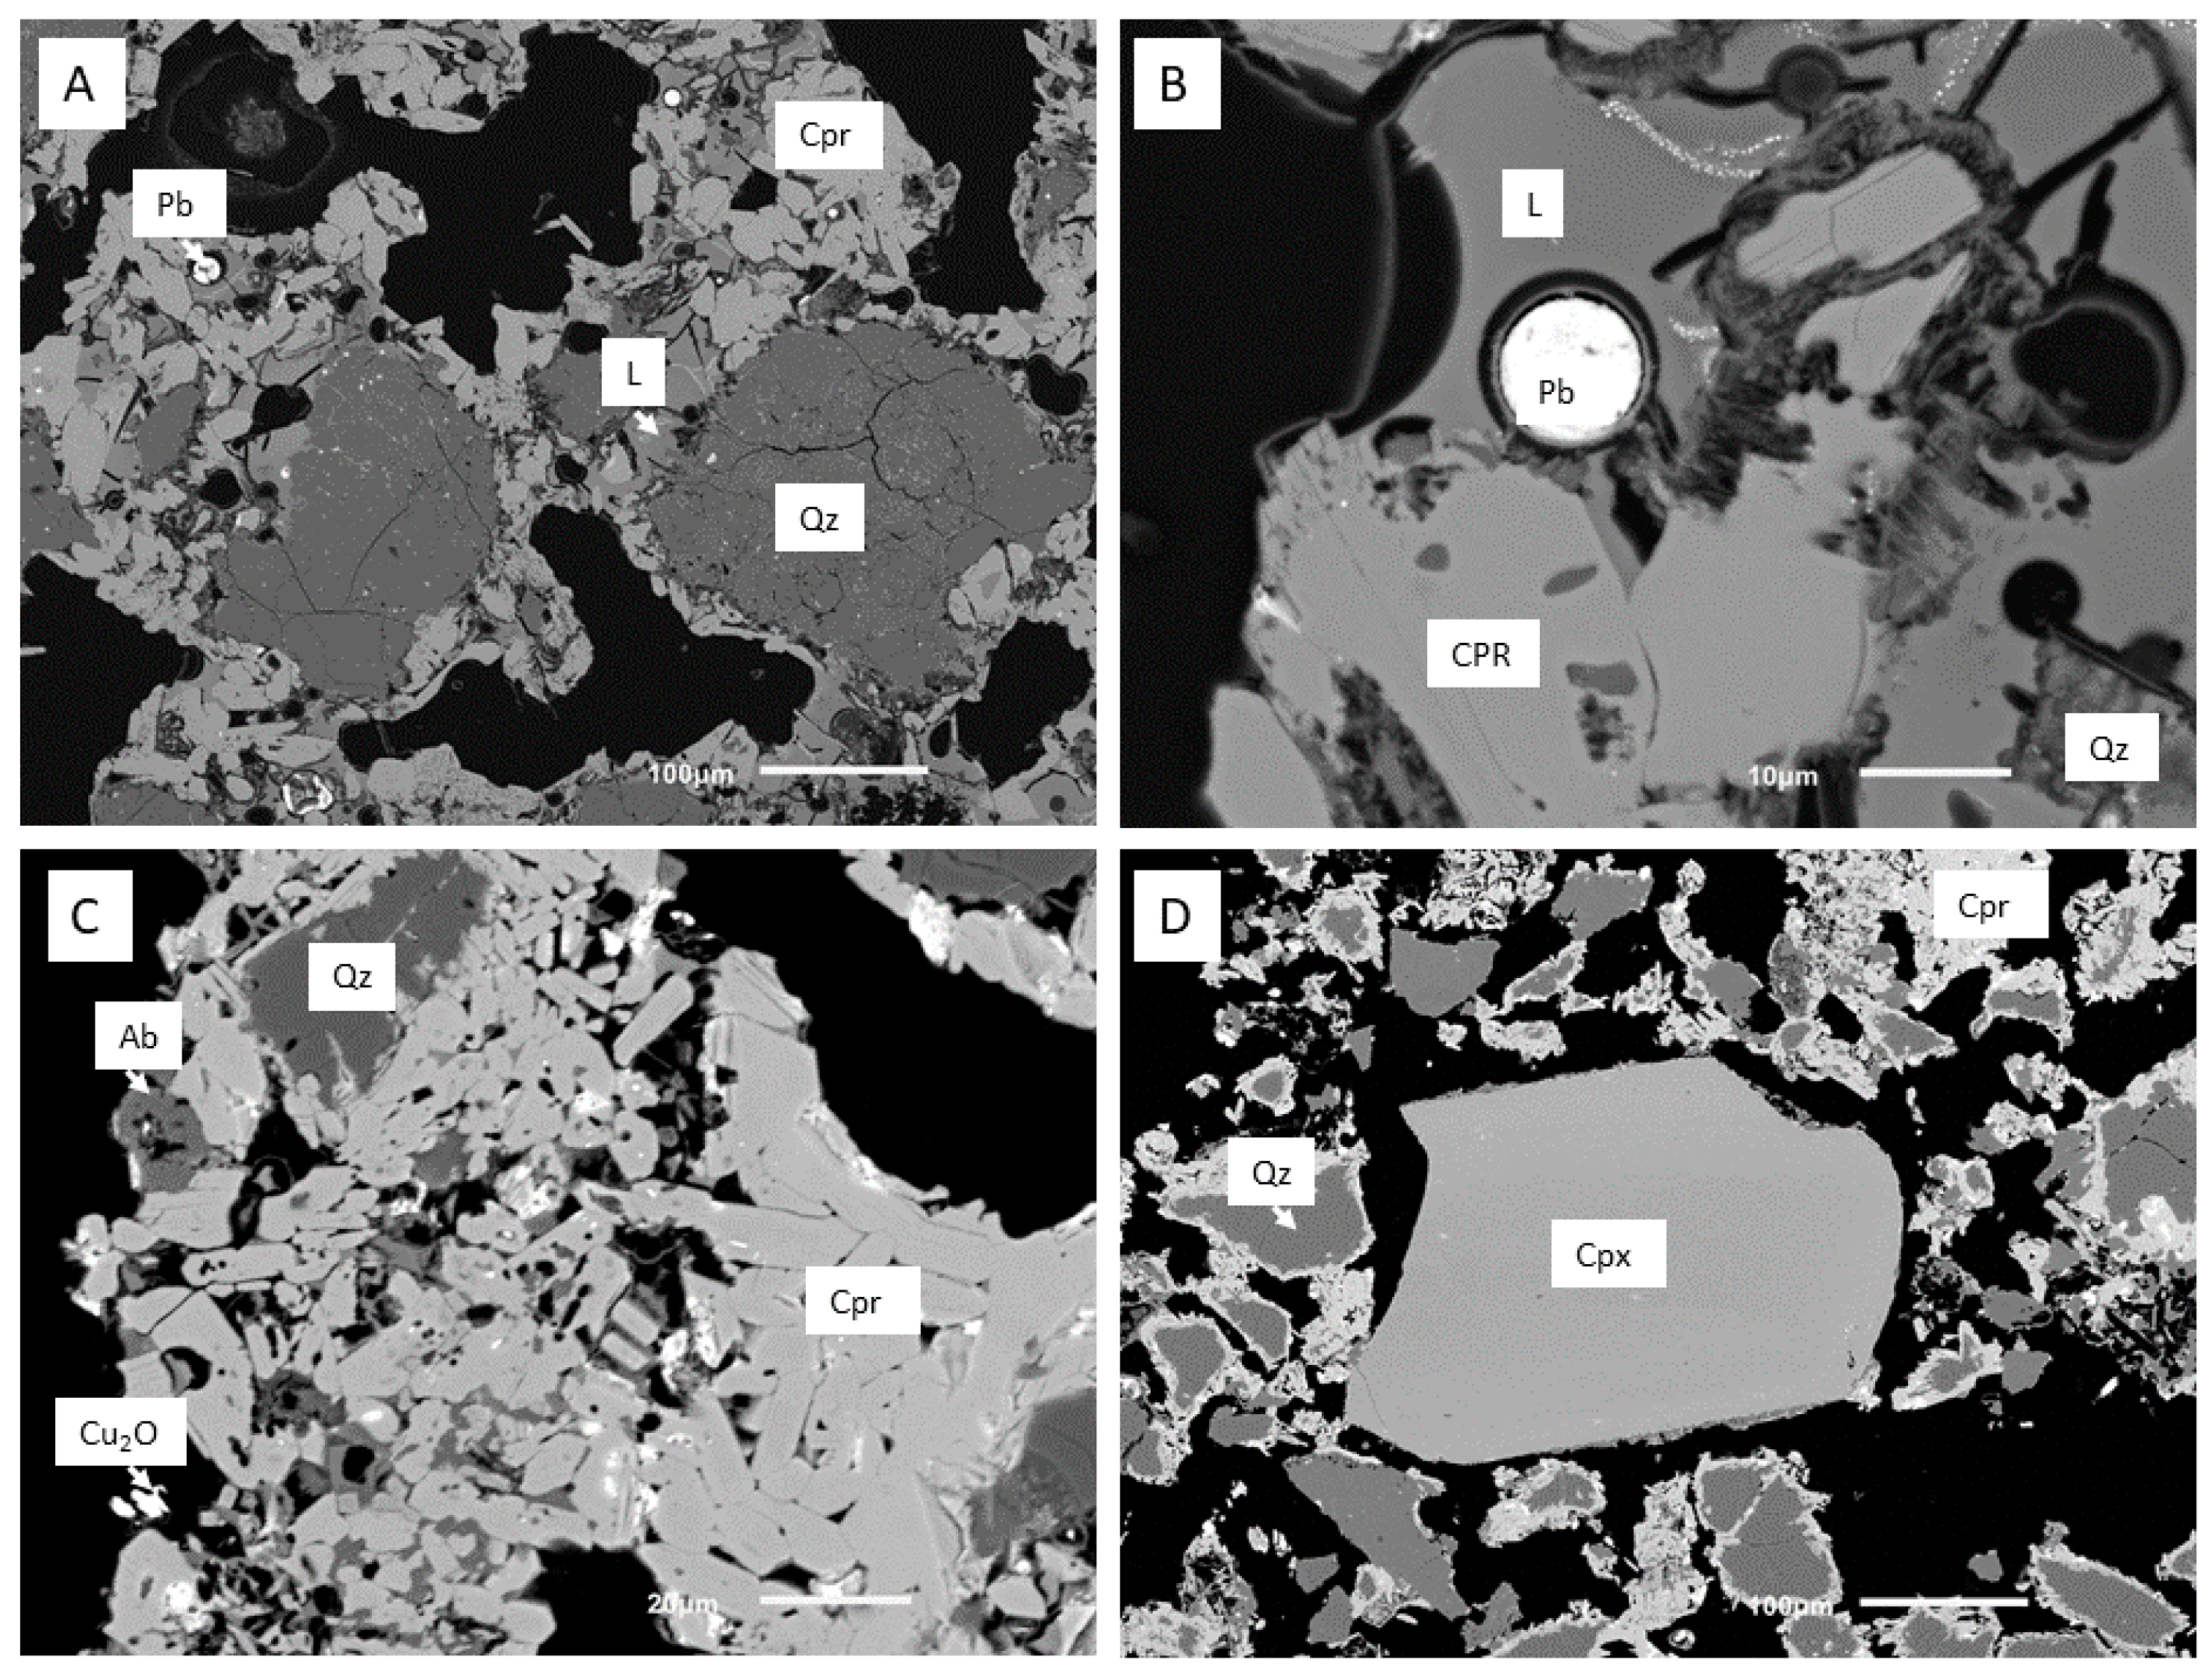
3.2. Scanning Electron Microscope, Energy Dispersive X-Ray Spectroscopy (SEM-EDX)

The semi-quantitative SEM-EDX measurement (EDX not standardized, normalized to 100 wt.% oxides) confirms the presence of cuprorivaite (CaCuSi4O10), a lead silicate (possibly Alamosite, PbSiO3), copper oxide (Cu2O), albite, quartz, alkali feldspar, clinopyroxene, a glass phase as well as unknown clay minerals in the pellet Aguntum 1 (Table 2). This mineral attribution, based on strong electron backscattering in elements with a high atomic number, was confirmed by energy-dispersive X-ray spectroscopy [22]. The SEM images of the Egyptian Blue sample Aguntum 1 in Figure 7A–D show different shades of gray, with the particles in the lighter gray representing the cuprorivaite crystals or agglomerates, those in the darker gray quartz and the gray in between indicating the glassy phase. The round, bright white particle in Figure 7A,B is a Pb-silicate (e.g., alamosite, PbSiO3). It can be observed that the cuprorivait crystals largely form in contact with quartz grains (Figure 7A–D), and together with the glass phase, it is occasionally replaced by clay minerals, most likely due to alteration processes during deposition (Figure 7B). Albite, Cu-oxide (Figure 7C) and clinopyroxene (Figure 7D) also occur interspersed in the cuprorivaite matrix.
SEM-EDX analysis yields oxide concentrations of 60–70 wt.% SiO2, 12–18 wt.% CaO and 16–20 wt.% Cu2O (Table 2). Clinopyroxene shows a solid solution between diopside and hedenbergite. Albite contains 2 wt.% K2O and the glass is alkali-rich with Na2O contents of 6–10 wt.% and K2O contents of 1.6–2.3 wt.% (Table 2).

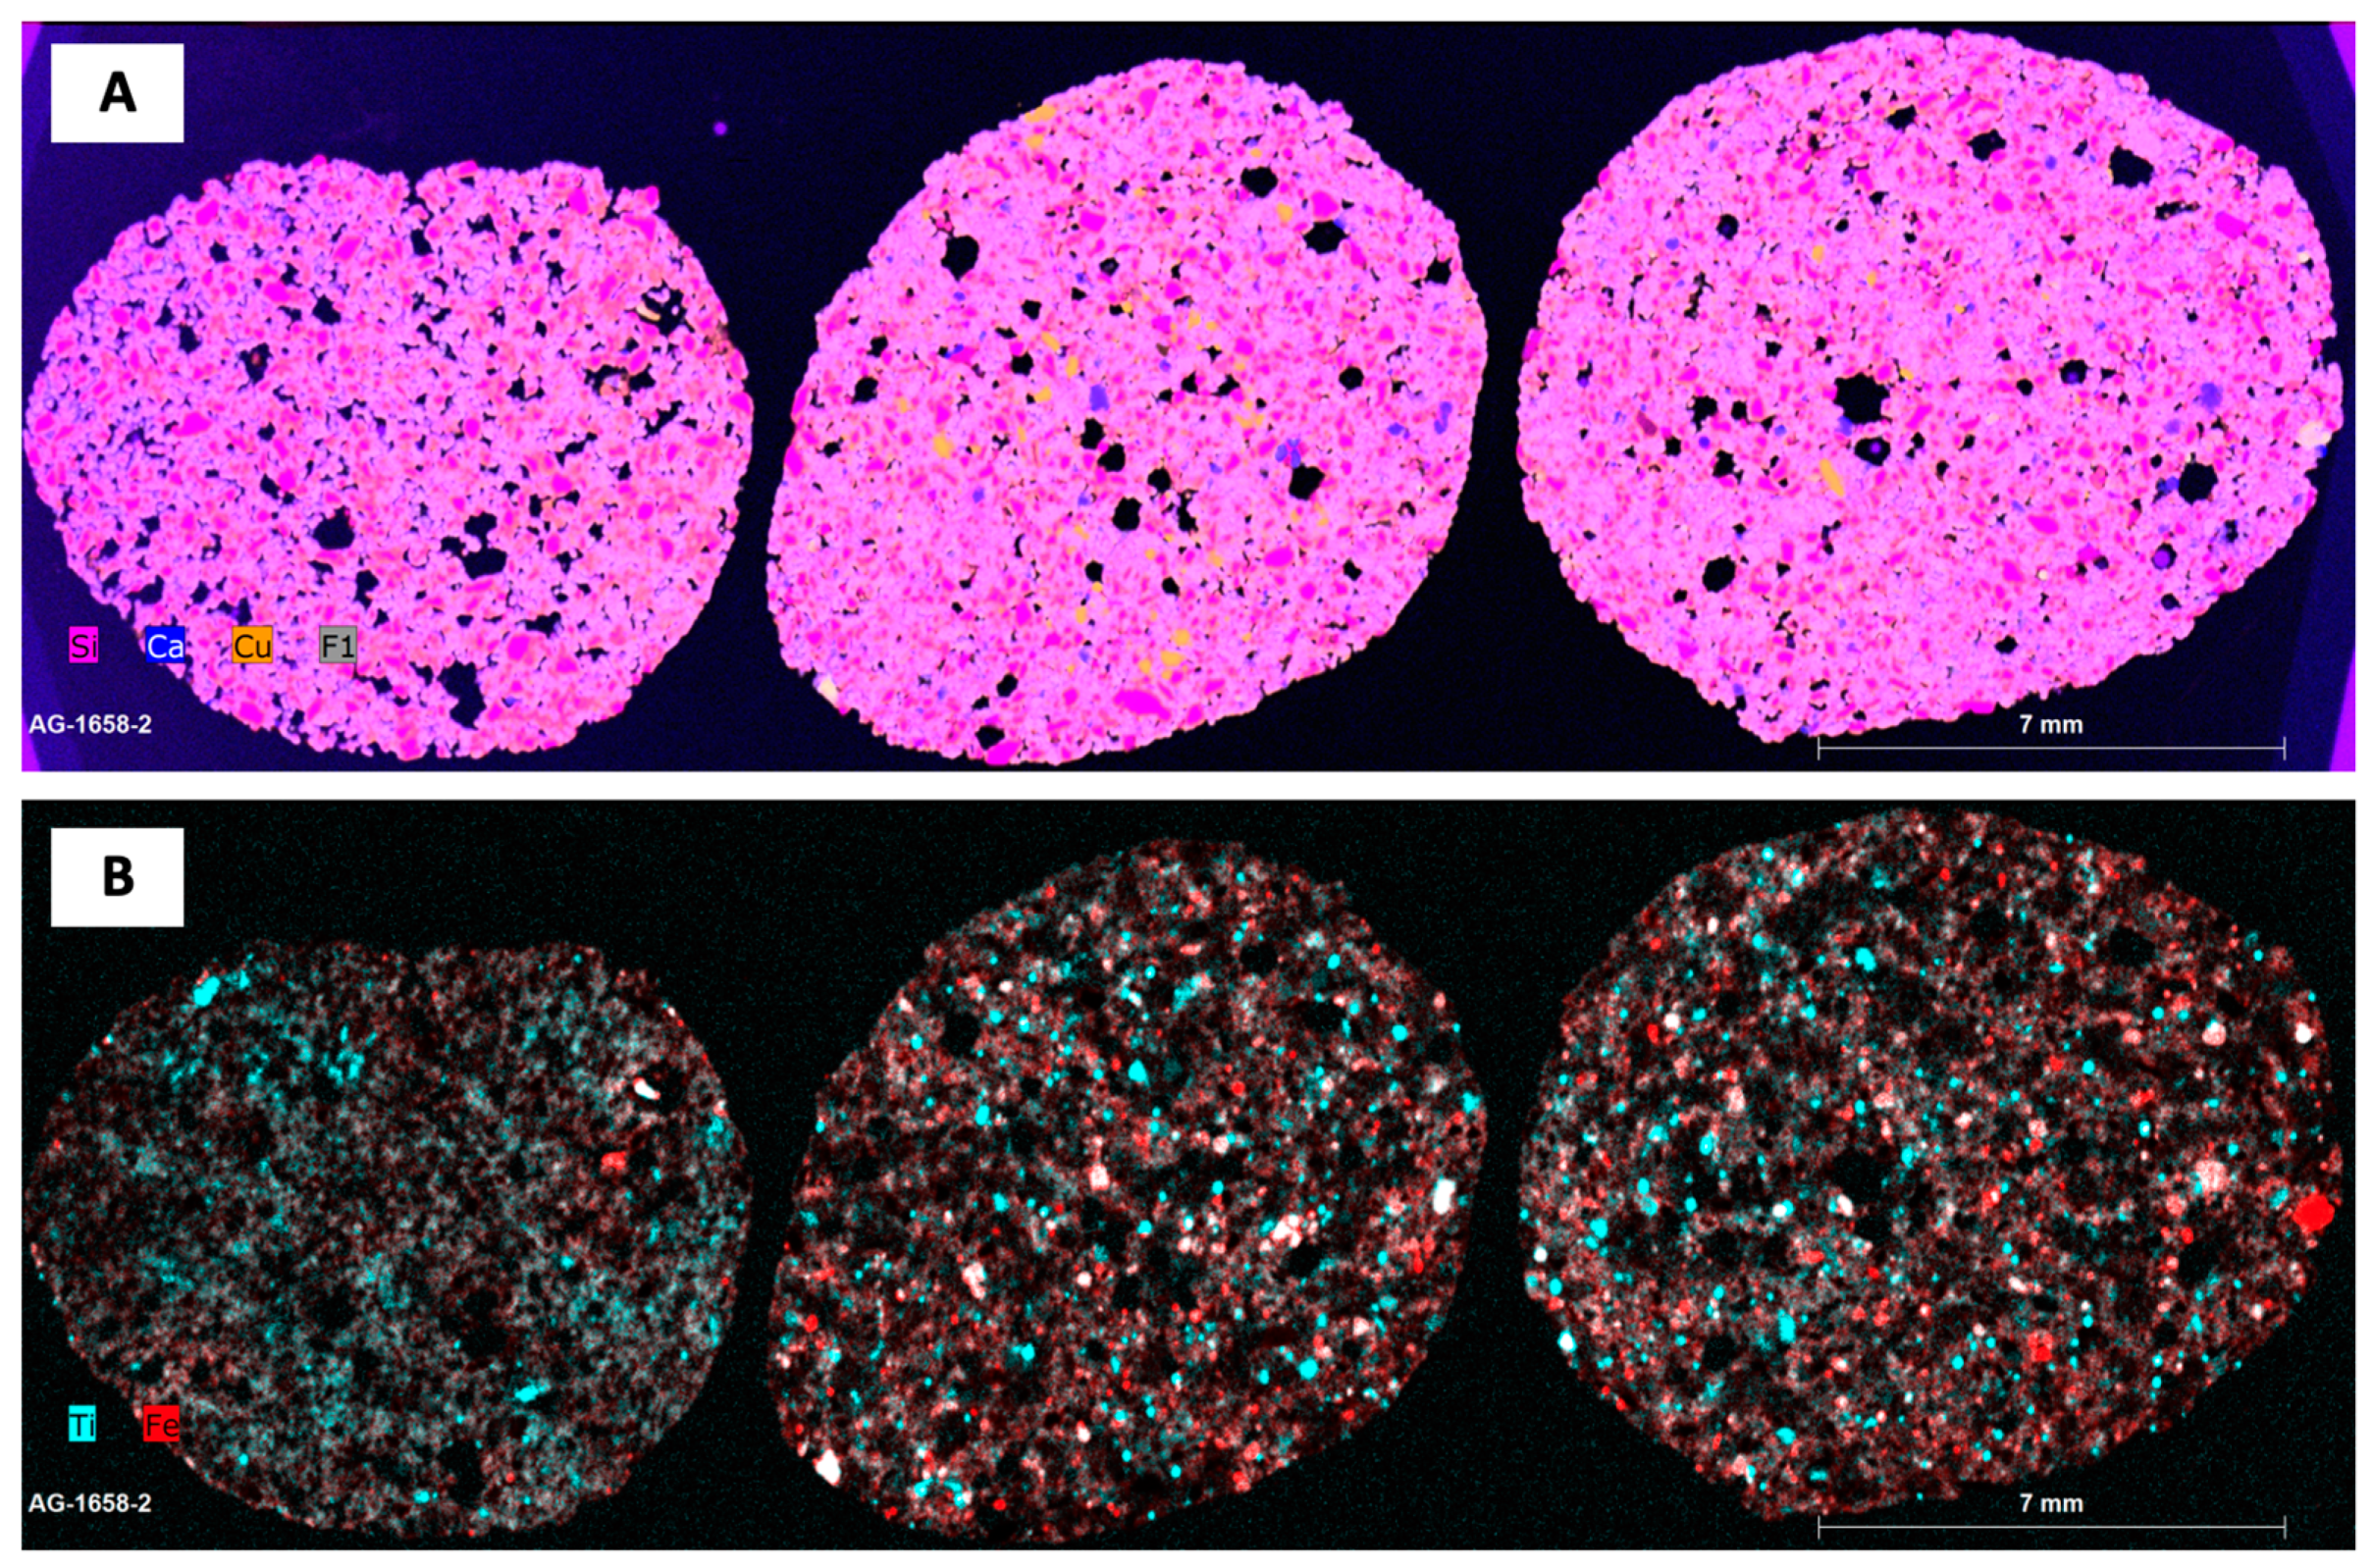
3.3. Micro X-Ray Fluorescence Analysis (μ-XRF)

The thin section of the Egyptian Blue pellets from Aguntum was analysed for its chemical composition (semi-quantitative) using micro X-ray fluorescence spectrometry. μ-XRF is an analytical technique that is particularly suitable for the investigation of archaeological finds, as it is non-destructive and multi-elemental [23]. The Egyptian Blue pellet from Aguntum shows a high proportion of copper (Cu), calcium (Ca) and silicon (Si) and the elements are homogeneously distributed over the entire thin section (Figure 7). The sample also shows slightly lower contents of iron (Fe), aluminum (Al) and magnesium (Mg), as well as traces of other elements such as manganese (Mn), sulfur (S), titanium (Ti), sodium (Na), potassium (K), arsenic (As), chlorine (Cl) and nickel (Ni). The aluminum content is due to the presence of feldspars (albite) in the Egyptian Blue pellet, and the presence of sulfur can allow possible conclusions regarding the copper source (e.g., chalcocite Cu2S) for the production of the pellets. Figure 8A shows a combined map of the main chemical components Ca, Si and Cu, which allows attribution of the phases cuprorivaite (bluish-pink), calcite (blue), quartz (pink) and a Cu phase (orange). The distributions of Fe and Ti are shown in Figure 8B.

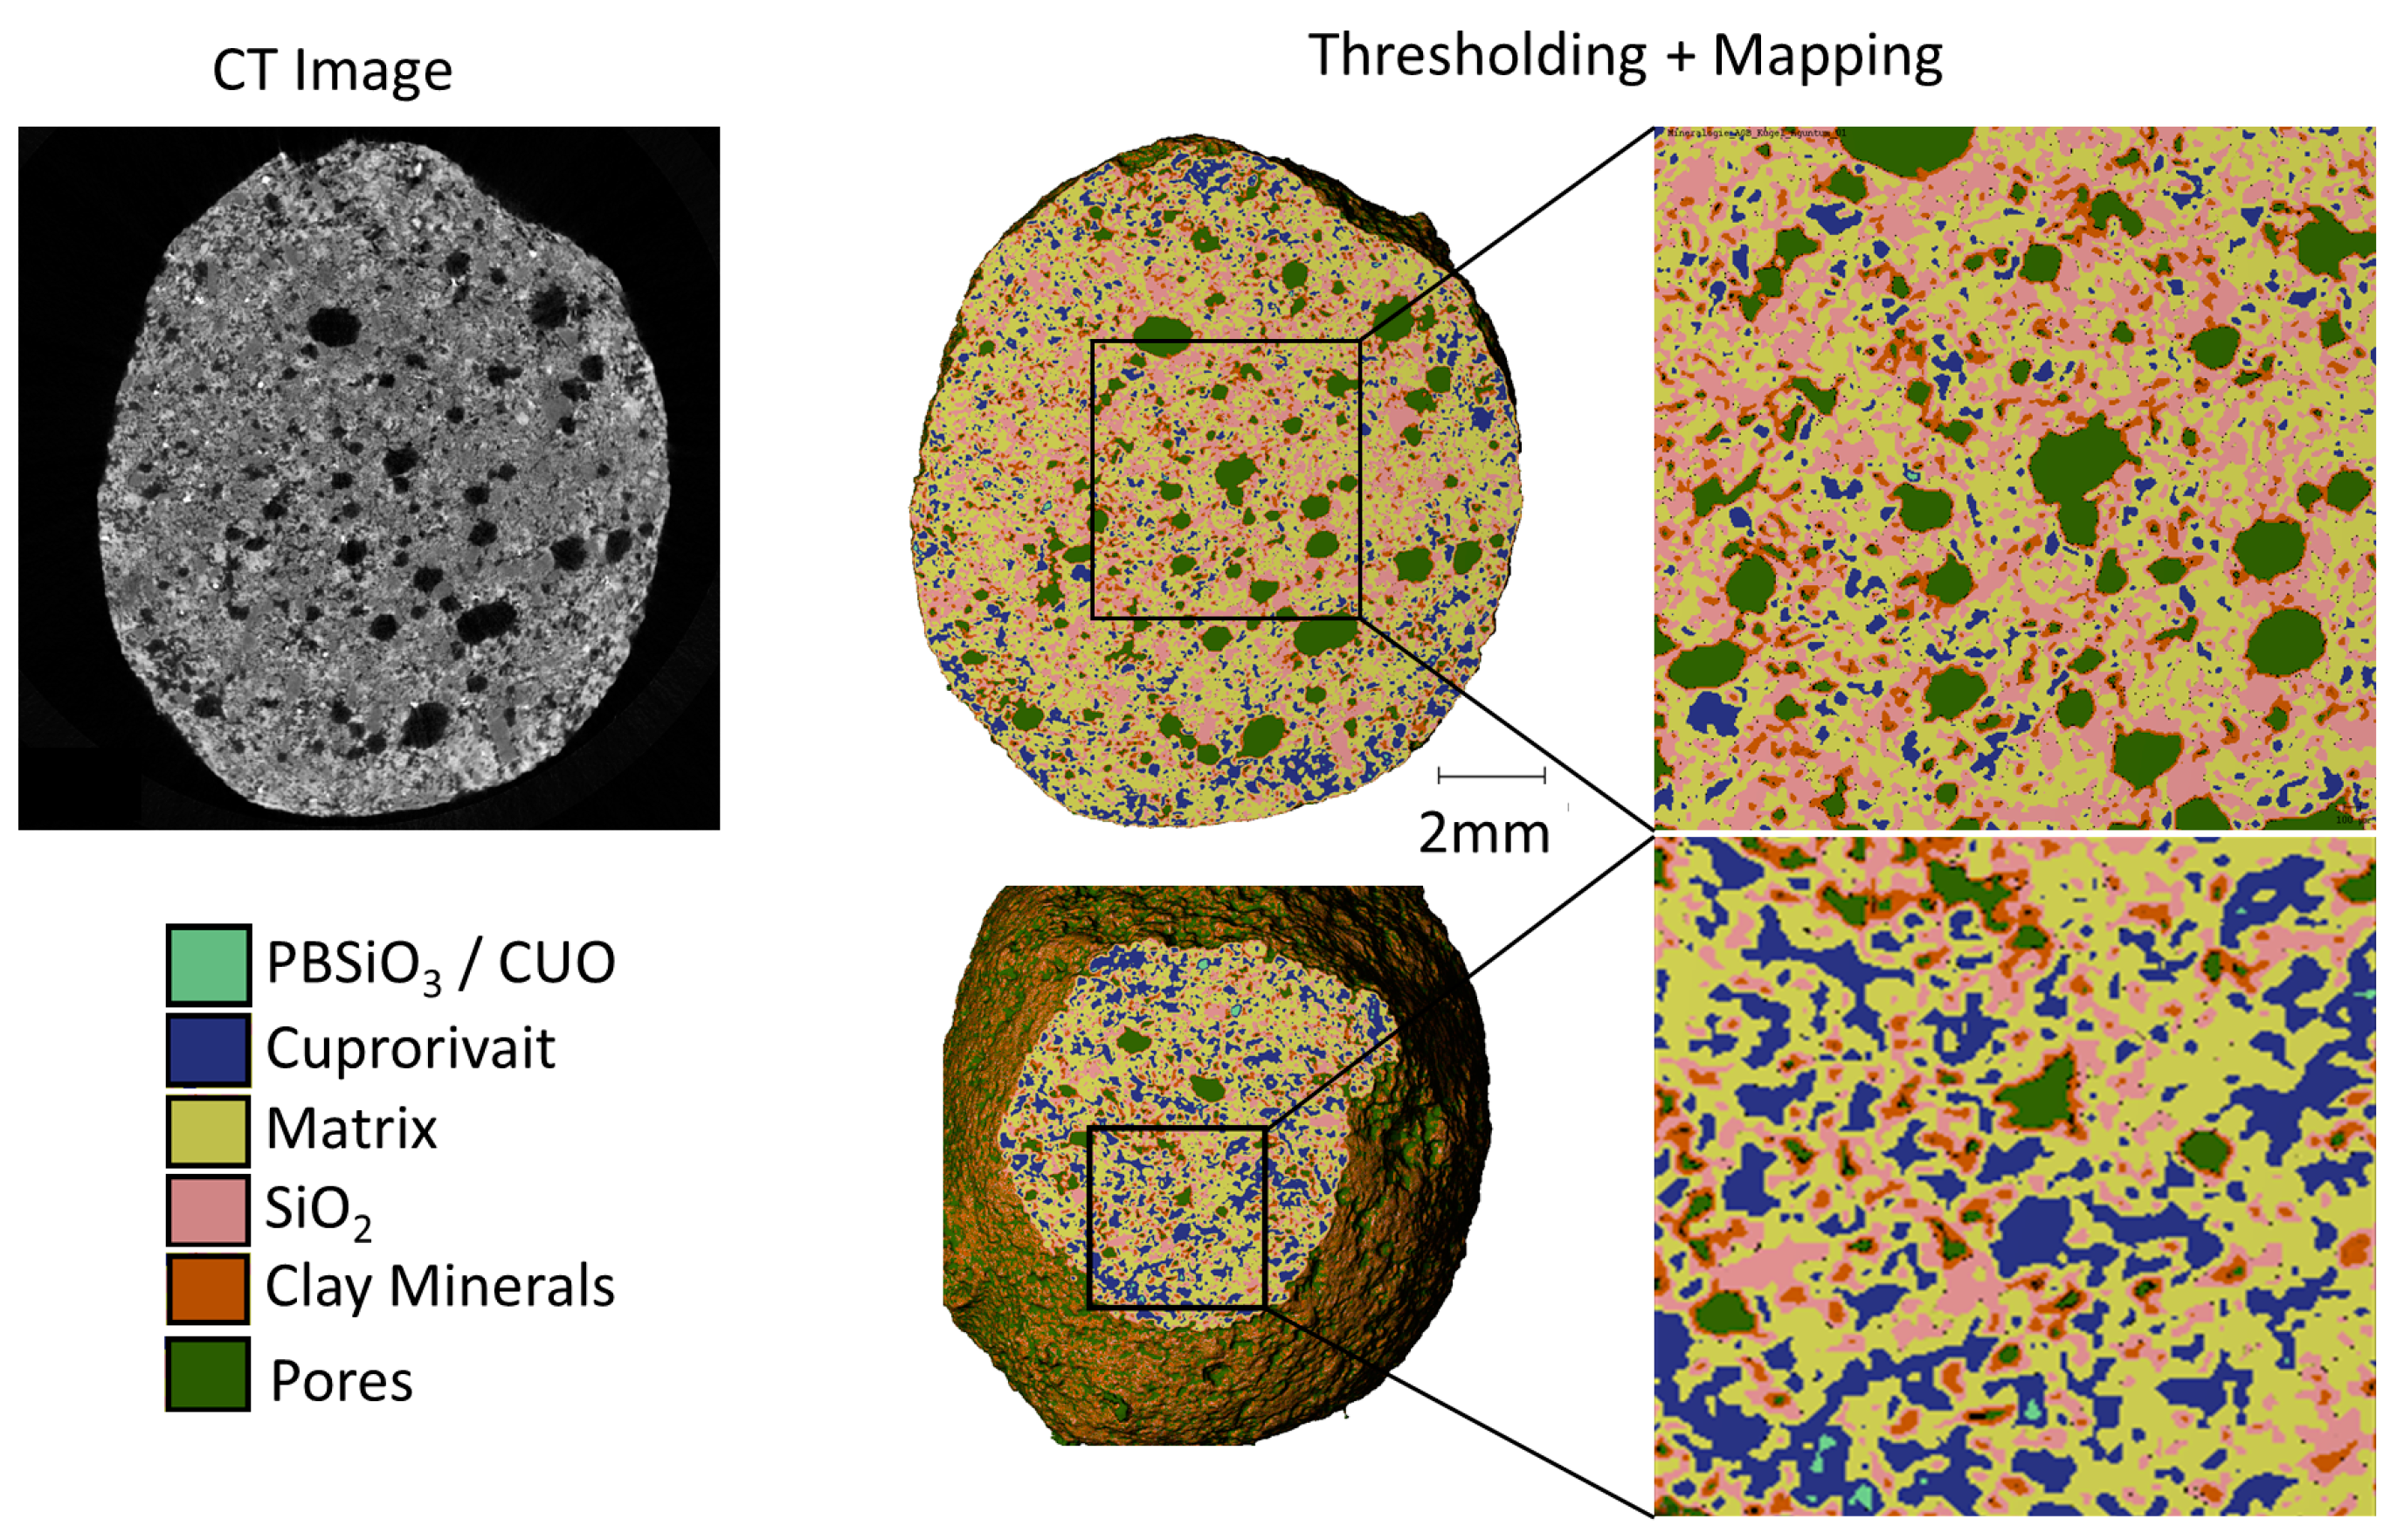
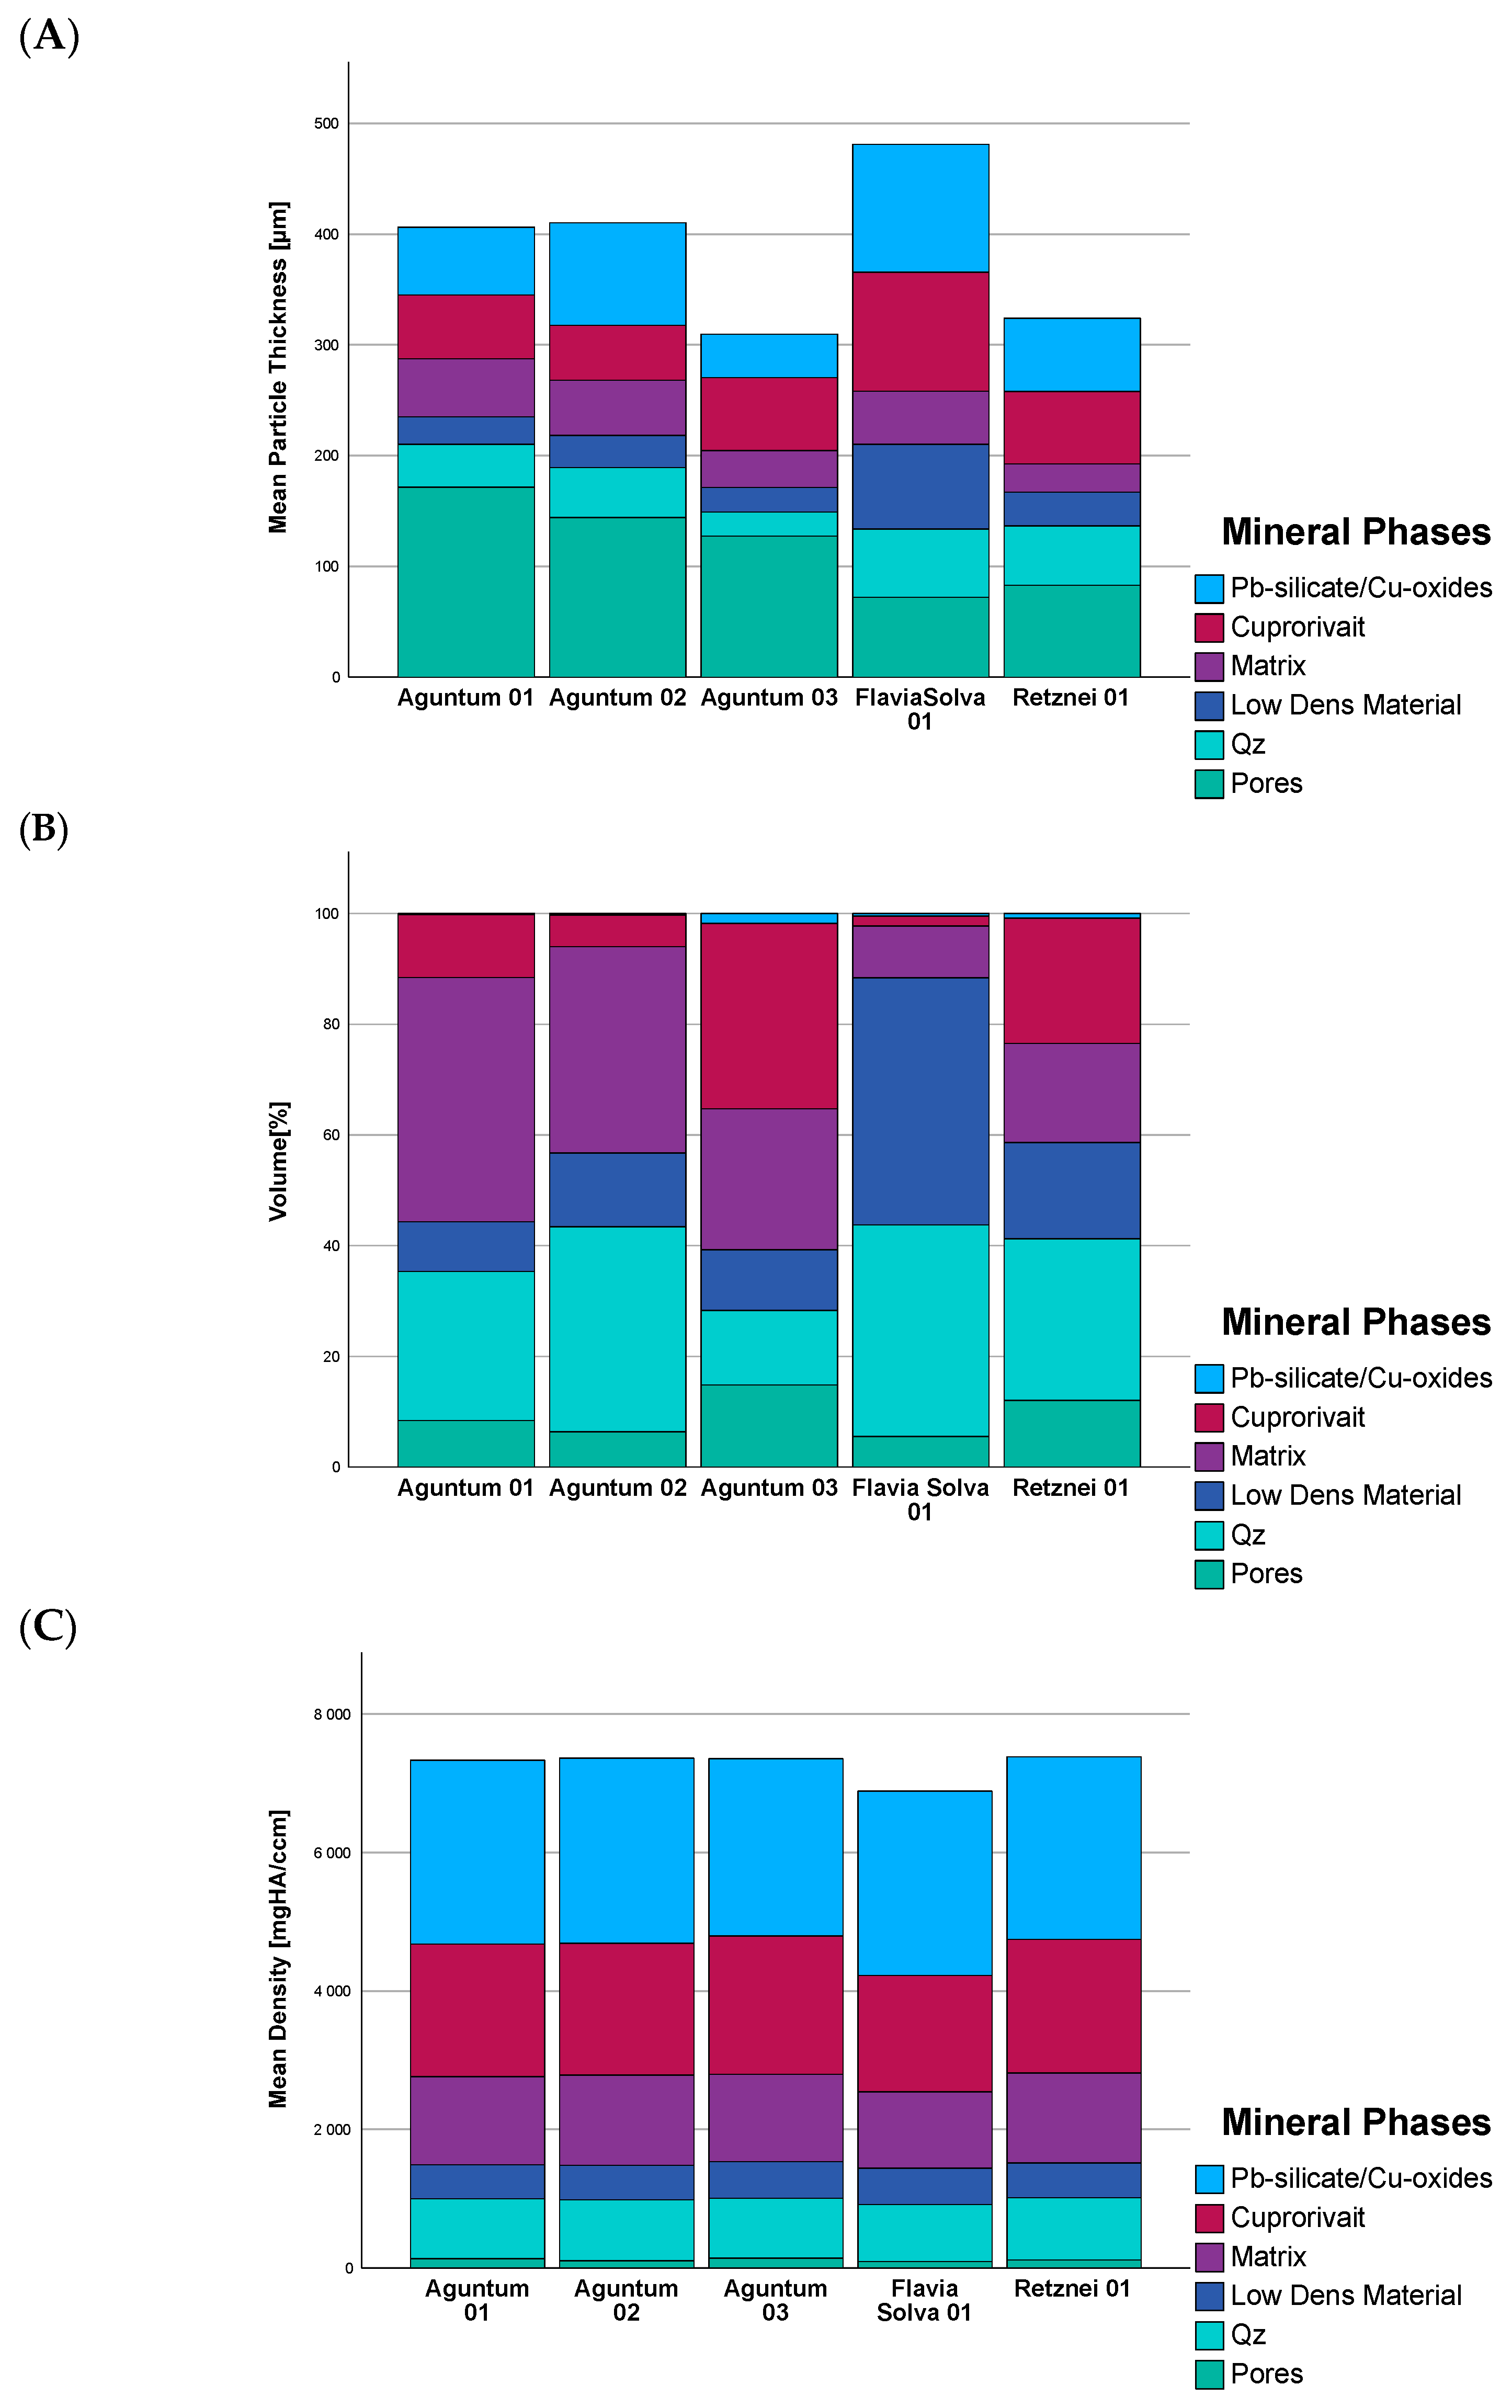
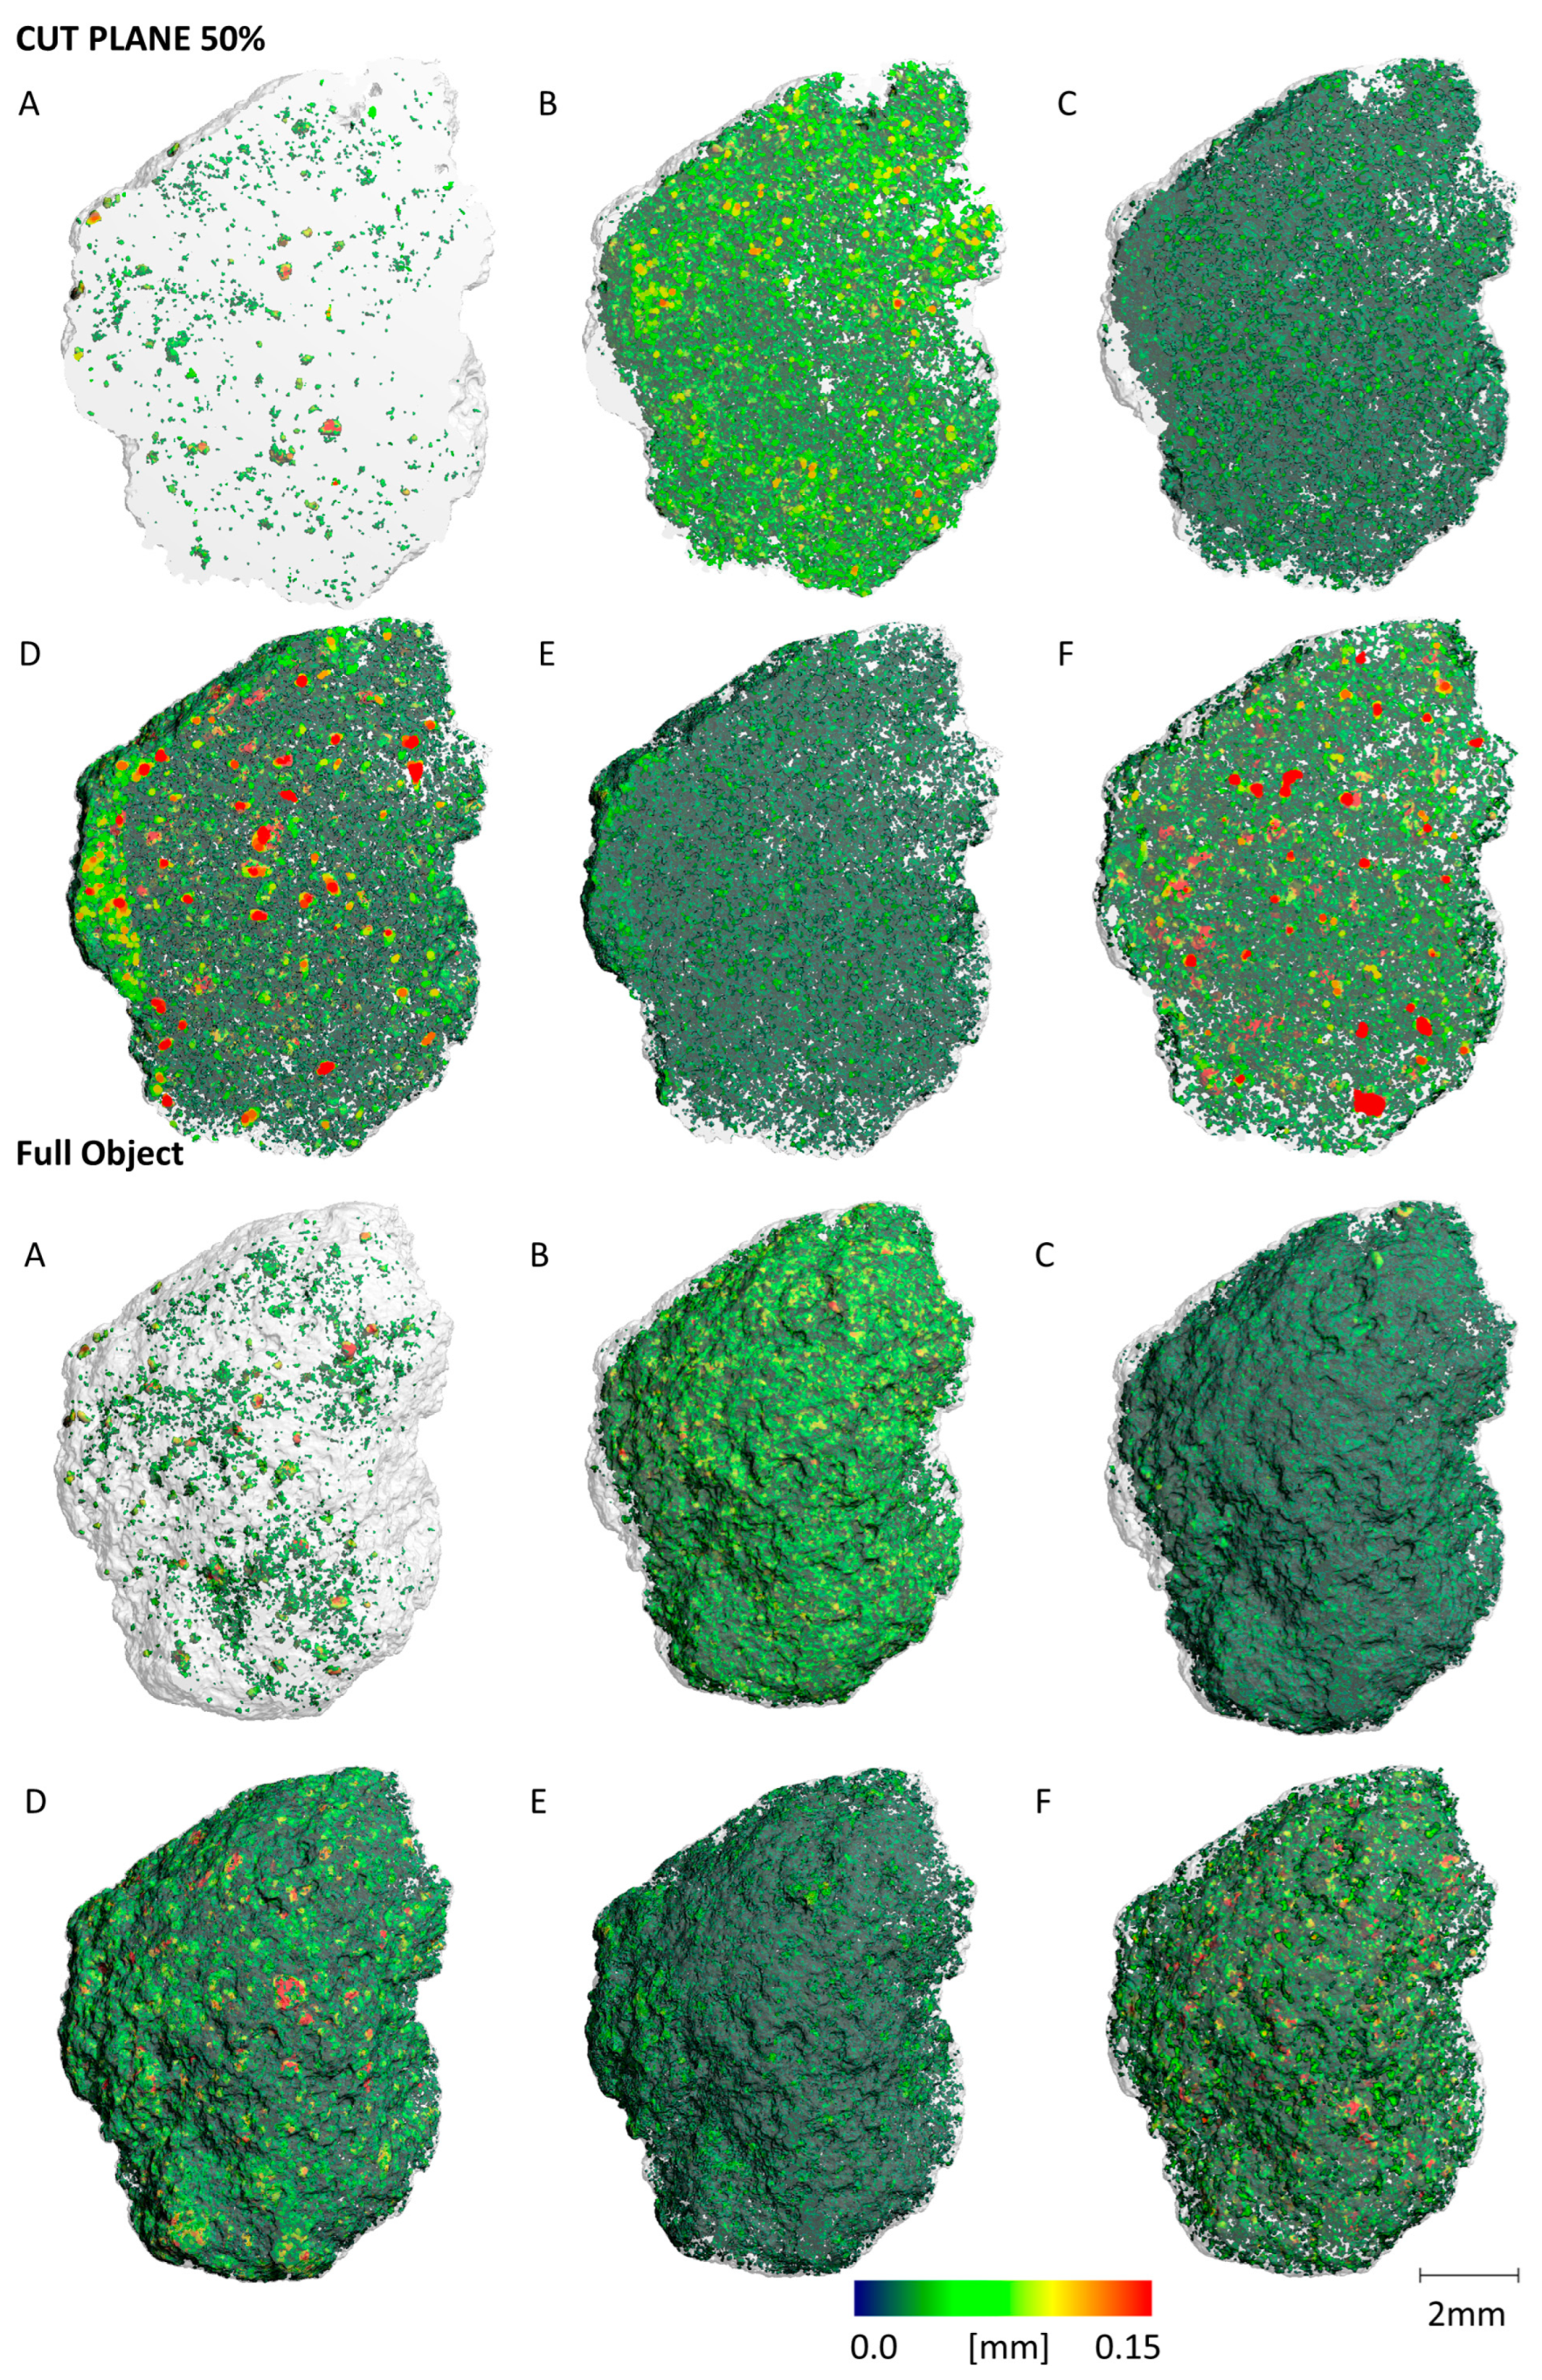
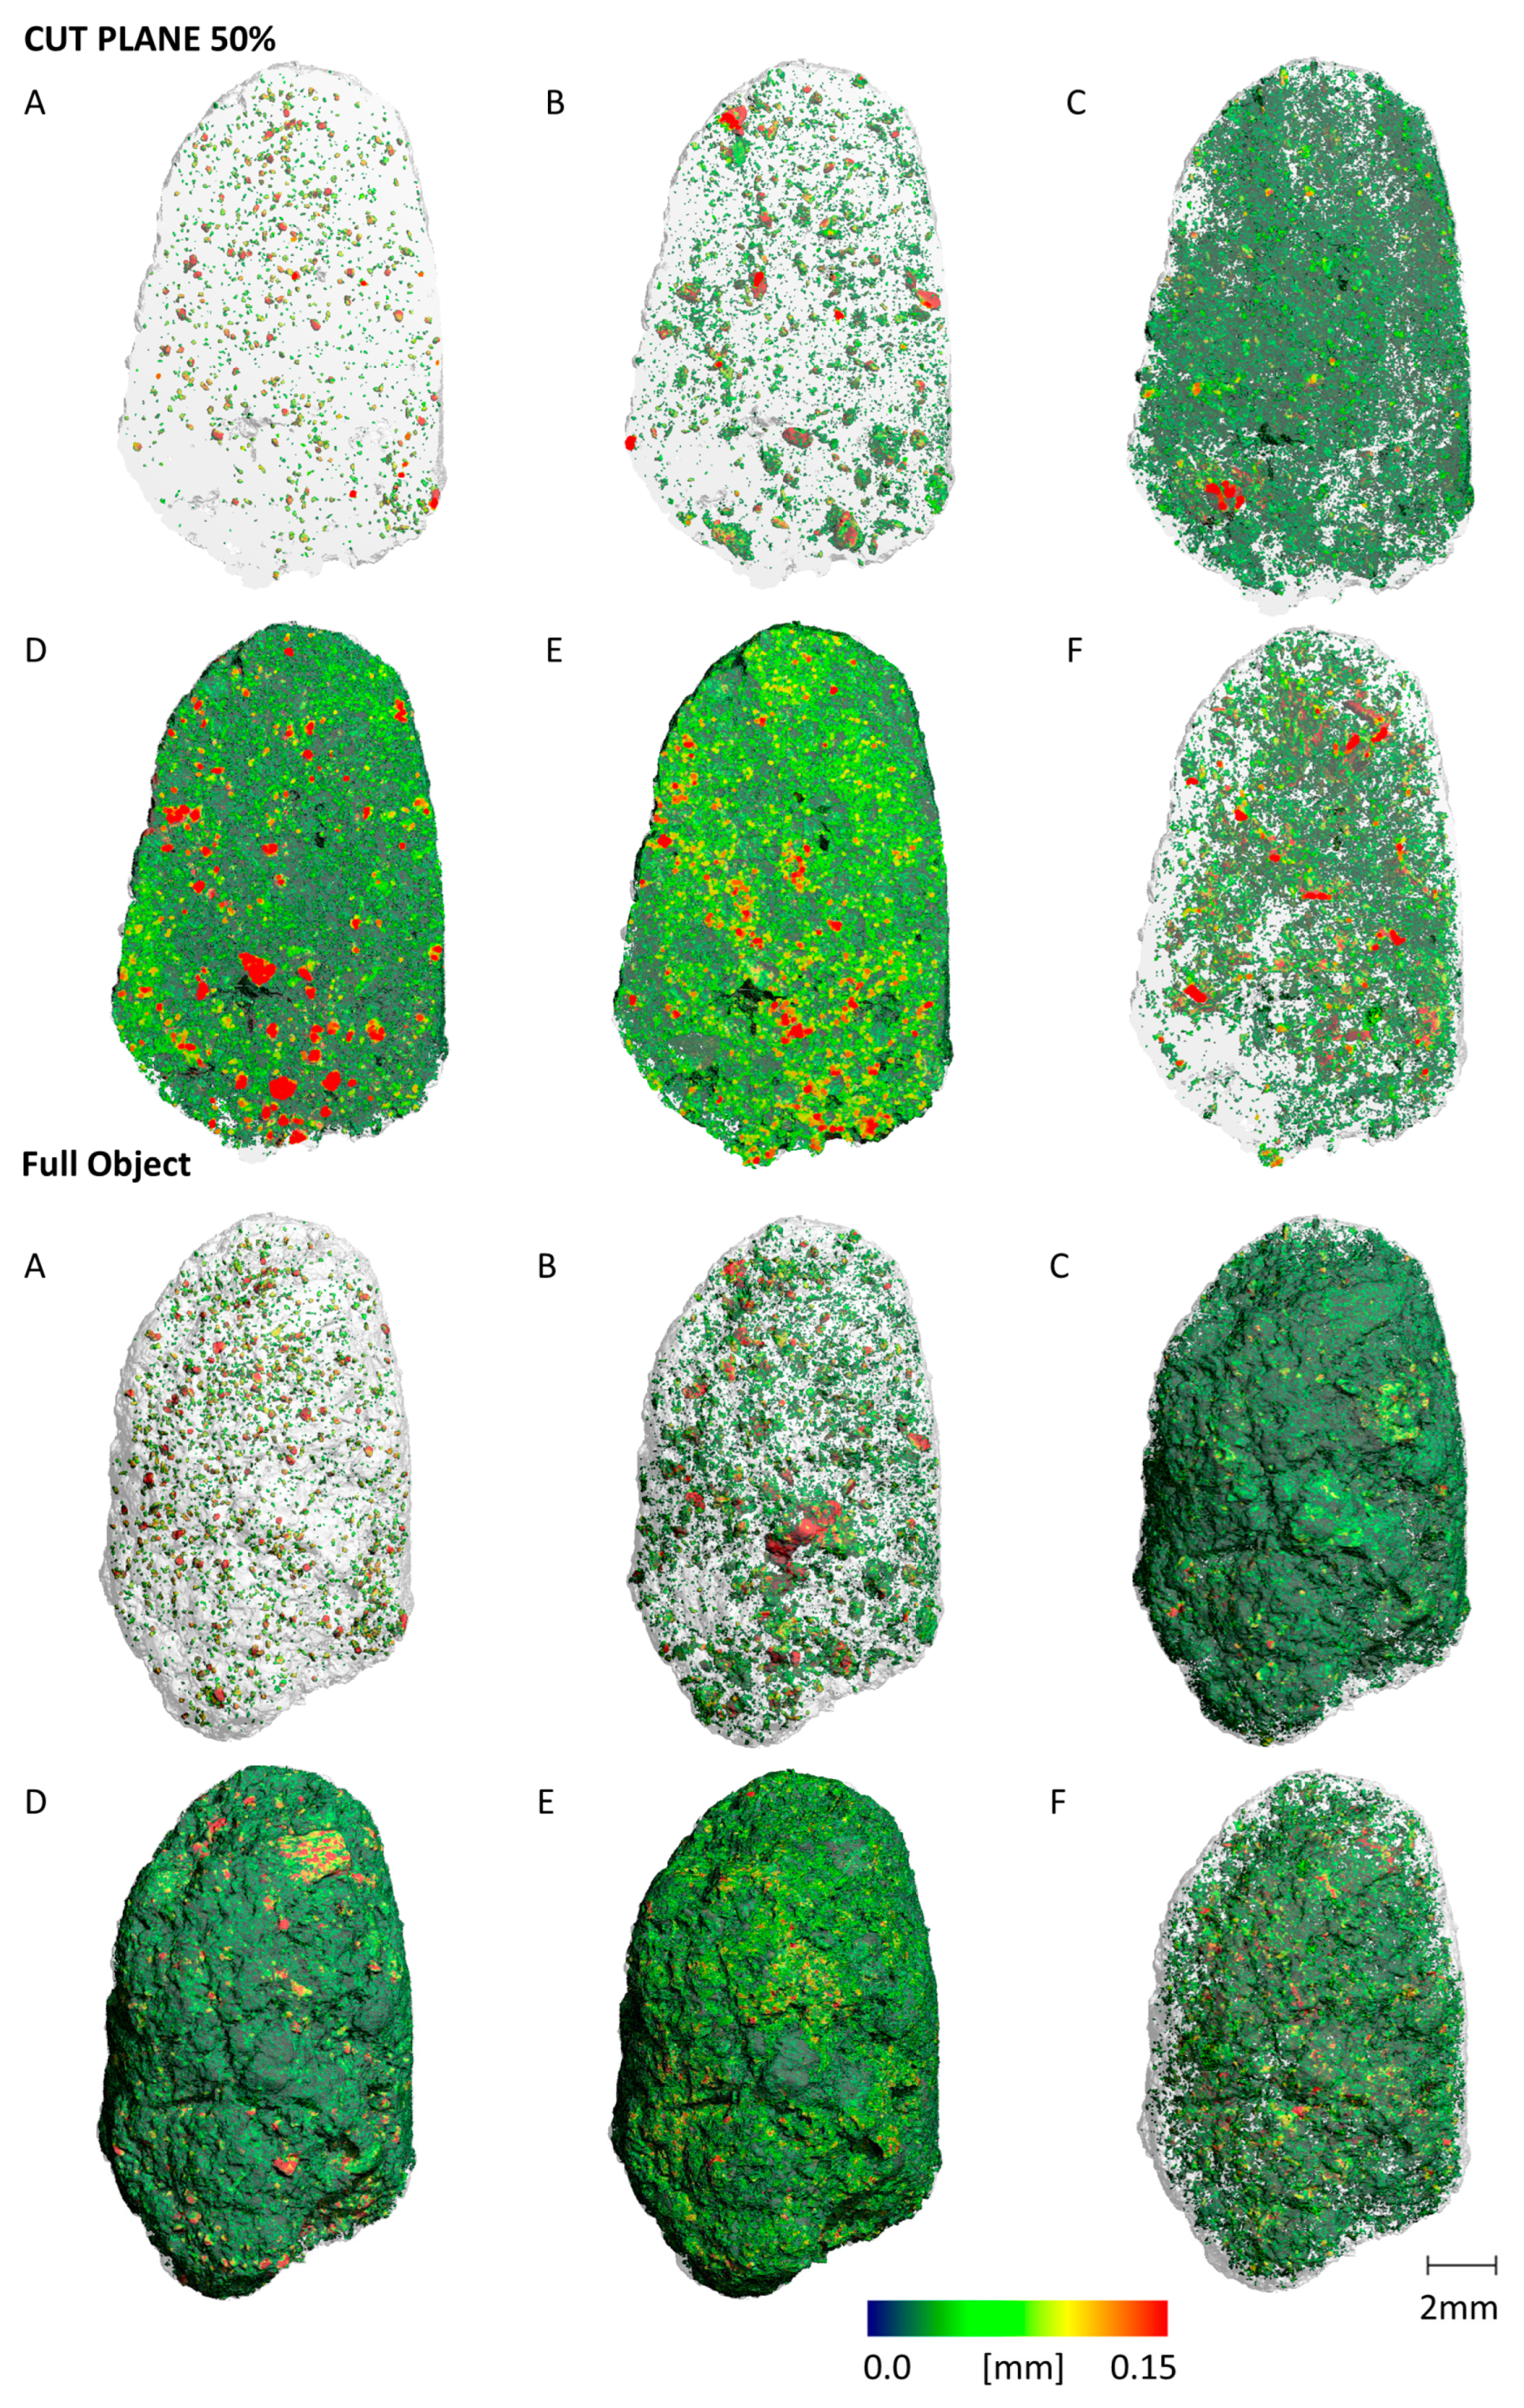
3.4. Micro Computer Tomography (µCT)

Textural and volumetric parameters derived from the µCT scans show distinct similarities and differences between the examined pellets (Figure 9, Figure 10 and Figure 11). Similarities between Aguntum 1 and Aguntum 2 could be found (Figure 9, Figure 11 and Figure 12). Also, Aguntum 3 and Retznei 1 show resemblances to each other (Figure 9, Figure 11 and Figure 13). Flavia Solva 1 is very different texture- and composition-wise and shows hardly any cuprorivaite content (Figure 9, Figure 11 and Figure 14). Aguntum 1 and Retznei 1 show the highest porosity and cuprorivaite content (Figure 9, Figure 11, Figure 12 and Figure 13), whereas the porosity in Aguntum 1 and Aguntum 2 is lower the pore diameter is bigger in comparison to the other samples (Figure 11). Aguntum 3 further shows the lowest quartz content, whereas Retznei 1 has a similar quartz content as Aguntum 1 and Aguntum 2 (Figure 11). The highest particle diameters are observed in the sample Flavia Solva 1, which also shows the roughest texture in the µCT image (Figure 9 and Figure 14). The finest and most homogenous texture is visible in the samples Aguntum 3 and Retznei 1 also apparent in the mean particle diameter. For Aguntum 1 and Aguntum 2, decreasing cuprorivaite content is visible in the center of the samples (Figure 10). Aguntum 3 and Retznei 1 show a homogenous cuprorivaite distribution. The Flavia Solva 1 sample has randomly distributed big cuprorivaite clasts with small speckles over the whole sample (Figure 14). In the samples Aguntum 1 and Aguntum 2, the matrix has the biggest volumetric contribution. In the sample Flavia Solva 1, the clays have the highest contribution (Figure 11).

4. Discussion and Interpretation

Based on the results of micro X-ray spectroscopy (μ-XRF), scanning electron microscopy coupled with energy dispersive X-ray spectroscopy (SEM-EDX) and micro-computed tomography (µCT), the elements Cu, Ca and Si were considered to be the most important chemical components in the Egyptian Blue pellets (Figure 8). In order to better understand the manufacturing processes, 3D images of the phases CuO, Pb-silicate (threshold 1), CaCuSi4O10 (threshold 2) and the holes (threshold 6) were created in addition to the μCT images to determine the spatial distribution of the phases containing copper and calcium (Figure 11, Figure 12, Figure 13 and Figure 14). It was apparent that the largest cuprorivaite crystals are located in the edge area of the samples from Aguntum and Retznei (Figure 9, Figure 10, Figure 12 and Figure 13). The reason for this could be that the raw materials (reactants) were either unevenly distributed and the cuprorivaite crystals therefore have an inhomogeneous size distribution within the sample, or that the firing process during manufacture affected the rims more than the cores of the pellets. The observation that all three samples have a non-negligible proportion of holes in the total volume (Figure 11) can probably be explained by the melting and the associated disappearance of phases during the manufacturing process; it is possible that these holes replace the carbonates that were present in the initial mixture but almost completely reacted during the manufacturing process.
The fact that the Egyptian Blue sample from Flavia Solva only has a very low percentage of cuprorivaite in the total volume could be indicative of a failed production process. Rodler-Rørbo et al. (forthcoming) also found a slightly different mineral assemblage with muscovite and Fe-hydroxides, so far absent from the Aguntum pellet [11]. Previous investigations confirm that the firing temperature required for the production of Egyptian Blue must be in the range between 850 °C and 1050 °C, as no cuprorivaite crystals can form below 850 °C. Above 1050 °C cuprorivaite disintegrates into silicon dioxide and copper oxides [24]. However, the sample from Flavia Solva shows large, homogeneously distributed crystals of calcium copper silicate (albeit with a rather low percentage compared to the total volume). The very low amount of cuprorivaite could rather be an indication that too few raw materials were used or the duration of the process was too short. Of course, the find could also be a waste product. In any case, the Egyptian Blue products from Retznei and Aguntum are of significantly higher quality due to their higher cuprorivaite content, which is responsible for their stronger color intensity [3].

Hypotheses on the Production Process of the Egyptian Blue Pellets from Aguntum

The elements identified in the sample from Aguntum using μ-XRF provide some clues as to the nature of the copper component in the raw material mixture used for the production of Egyptian Blue pellets. Previous studies have shown that the following components are conceivable sources of copper: (i) the copper oxide tenorite CuO, (ii) the mineral chalcocite (copper luster) Cu2S, and (iii) pure copper Cu and/or the copper alloys bronze Cu0.9Sn0.1 and brass Cu0.9Zn0.1. The latter would indicate the use of bronze or brass filings from scrap metals as a copper source [1,7,25,26]. At some point, Pb (metallic or oxide) must have been present in the raw material mixture, which leads to the formation of a Pb-silicate. The associated model reactions for cuprorivaite formation using common Cu-oxides and Cu-sulfides are as follows:
1.
CaCO3 + 4 SiO2 + CuO = CaCuSi4O10 + CO2 (copper source: tenorite);
2.
2 CaCO3 + 8 SiO2 + Cu2O + 0.5 O2 = 2 CaCuSi4O10 + 2 CO2 (copper source: cuprite);
2.
2 CaCO3 + 8 SiO2 + Cu2S + O2 = 2 CaCuSi4O10 + 2 CO2 + 0.5 S2 (copper source: chalcocite);
3.
CaCO3 + 4 SiO2 + Cu + 0.5 O2 = CaCuSi4O10 + CO2 (copper source: Cu metal).
SEM-EDX analysis of the Aguntum pellet has shown that Cu2O was used as a source of copper. This can be described via the model reaction 2. Even μ-XRF analysis shows the presence of small amounts of sulfur in the Egyptian Blue pellet from Aguntum; no correlation with Cu was found and the simultaneous absence of zinc oxide SnO and tin oxide ZnO excludes bronze or brass as reactants. Further finds of Egyptian Blue, dated to the 1st century AD, in the form of incrustations on crucible fragments from Liternum in Campania, Italy, as well as wall painting samples from Pompeii also contain no tin oxide [27,28]. The exact age of the pellets from Aguntum is not yet known, but they were found under a layer of fire, the event of which was dated to the middle of the 3rd century AD by a 14C analysis of a burnt barley grain, which may mean that the pellets are older than the fire event [10,13]. Whether there is a connection between the production processes or even the possibility of a production site of the Egyptian Blue pellets from Aguntum and the Egyptian Blue finds from the other two sites remains to be seen.
The presence of some iron and titanium impurities (e.g., rutile, ilmenite) in the Egyptian Blue sample from Aguntum, as well as the morphology of the quartz particles (angular-rounded edges, SEM-EDX analysis, Figure 6) might be indicative of the use of beach sand as a quartz source [7]. Rodler-Rørbo et al. indicated that the occurrence of feldspar in the spheres of Aguntum and Retznei might also be indicative of the provenance of the raw materials (e.g., beach sands of the Bay of Naples) [11]. The large clinopyroxene (diopside-hedenbergite solid solution) crystal in the Aguntum 1 pellet, which did not grow during the firing process due to its large grain size compared to cuprorivaite, could also act as a provenance indicator. However, further investigations are required to verify this hypothesis.
The BSE images show that cuprorivaite crystals are largely formed in contact with the quartz grains contained in the samples (Figure 7). According to Delamare and Kostomitsopoulou Marketou, this is an indication of a low alkali content in the initial mixture, which leads on the one hand to the formation of a limited glass phase (acts as a catalyst) and on the other hand to spatially limited cuprorivaite formation at the edges of the quartz grains only [1,29]. This micromorphology is characteristic of the process of solid-state production through the solid-state diffusion of elements at the interface to different grains [30]. According to Delamare, this is a typical production process for Roman-Egyptian Blue [1].

5. Conclusions and Outlook

It is clear from the results of this work that the combination of optical microscopy, μCT, μ-XRF, and SEM-EDX investigations provides important information on the 2D and 3D spatial distribution of mineral phases within the Egyptian Blue pellets in much greater detail. Using this combination of methods, it can be shown that the composition and the production results of the blue pigment are strongly dependent on the raw materials and the nature of the production method. The results and the comparison with Egyptian Blue samples from previous studies [11] indicate a low alkali content in the raw materials mixture for the Aguntum pellet and the possible use of copper oxide (tenorite, CuO) as a copper source and beach sand as a quartz source. Based on the observed morphology and size of the phases and pores our results show that the pellets from Aguntum and Retznei have a similar production technology. This conclusion aligns with the results of a previous study [11]. In order to be able to make more precise statements regarding the source materials and production sites of the Egyptian Blue finds, further chemical investigations must be carried out on the samples from Aguntum, Flavia Solva and Retznei. Finally, based on the cuprorivaite content and its 3D distribution within the spheres, the μCT data suggest that the sample from Retznei corresponds to the highest quality product, followed by the Egyptian Blue pellets from Aguntum. Further research is needed to improve our understanding of the cause of the very low cuprorivaite content in the Flavia Solva sample.

Author Contributions

Conceptualization, P.T., J.H. and G.D.; methodology, G.D. and J.H.; formal analysis, P.T. and A.R.-R.; investigation, G.D. and J.H.; resources, B.Z., M.A., A.R.-R. and G.G.; data curation, G.D.; writing—original draft preparation, J.H. and P.T.; writing—review and editing, J.H., P.T. and G.D.; visualization, G.D.; supervision, P.T..All authors have read and agreed to the published version of the manuscript.

Funding

This research received no external funding.

Data Availability Statement

Image and Analysis data can be shared on request to either Peter Tropper or Gerald Degenhart.

Acknowledgments

We are thankful to B. Porod, Universalmuseum Joanneum, for access to sample materials.

Conflicts of Interest

The authors declare no conflicts of interest.

References

  1. Delamare, F. Egyptian blue, the blue pigment of Mediterranean antiquity: From Egyptian hsbd iryt to Roman caeruleum. In Blue Pigments: 5000 Years of Art and Industry; Archetype Publications: London, UK, 2013; pp. 1–36. [Google Scholar]
  2. Panagiotaki, M.; Tite, M.; Maniatis, Y. Egyptian blue in Egypt and beyond: The Aegean and the Near East. In Proceedings of the Tenth International Congress of Egyptologists, Rhodes, Greece, 22–29 May 2008; pp. 1769–1789. [Google Scholar]
  3. Minguzzi, C. Cuprorivaite: Un nuovo minerale. Period. Mineral. 1938, 9, 333–345. [Google Scholar]
  4. Rowland, I.D.; Howe, T.N. (Eds.) . Vitruvius: ‘Ten Books on Architecture’; Cambridge University Press: Cambridge, UK, 2001. [Google Scholar]
  5. Mirti, P.; Appolonia, L.; Casoli, A.; Ferrari, R.P.; Laurenti, E.; Canesi, A.A.; Chiari, G. Spectrochemical and structural studies on a Roman sample of Egyptian blue. Spectrochim. Acta Part A Mol. Biomol. Spectrosc. 1995, 51, 437–446. [Google Scholar] [CrossRef]
  6. Skovmøller, A.; Brøns, C.; Sargent, M.L. Egyptian blue: Modern myths, ancient realities. J. Rom. Archaeol. 2016, 29, 371–387. [Google Scholar] [CrossRef]
  7. Dariz, P.; Schmid, T. Trace compounds in Early Medieval Egyptian blue carry information on provenance, manufacture, application, and ageing. Sci. Rep. 2021, 11, 11296. [Google Scholar] [CrossRef] [PubMed]
  8. Laurie, A.P.; Mclintock, W.F.P.; Miles, F.D. Egyptian blue. Proc. R. Soc. London. Ser. A Contain. Pap. Math. Phys. Character 1914, 89, 418–429. [Google Scholar]
  9. Cavassa, L. La production du bleu égyptien durant l’époque hellénistique et l’Empire romain (IIIe av. J.-C.-Ier s. apr. J.-C.). Bull. Corresp. Hellénique-Supplément 2018, 56, 13–34. [Google Scholar]
  10. Zerobin, B.; Goldenberg, G.; Auer, M.; Töchterle, U.; Angerer, T.; Hejny, C.; Tropper, P. Ägyptisch Blau: Pigmentfunde aus Raum 289 des römischen Municipium Claudium Aguntum. In Alpine Landschaftsnutzung im Ager Aguntinus; Nearchos; Harrassowitz: Wiesbaden, Germany, 2021; pp. 183–192. [Google Scholar]
  11. Rodler-Rørbo, A.; Baragona, A.J.; Auer, M.; Zerobin, B.; Tropper, P.; Schrettle, B. Egyptian blue pellets from Noricum: On pigment production and trade. In Proceedings of the 11th International Round Table on Polychromy in Ancient Sculpture and Architecture, Rome, Italy, 9–12 November 2022. [Google Scholar]
  12. Mommsen, E.T. CIL III, Pars II: Inscriptionum Illyrici partes VI. VII. Res gestae divi Augusti. Edictum Diocletiani de pretiis rerum. Privilegia militum veteranorumque. Instrumenta Dacica. apud G. Reimerum: Berlin, Germany, 1873; ISBN 3-11-003190-6. [Google Scholar]
  13. Auer, M. Municipium Claudium Aguntum. Excavations in the city centre (2006–2015). In New Discoveries Between the Alps and the Black Sea. Results from Roman Sites in the Period Between 2005 and 2015; Janežič, M., Nadbath, B., Mulh, T., Žižek, I., Eds.; 2018; pp. 93–113. [Google Scholar]
  14. Schrettle, B.; Tsironi, S. Retznei: Villa, Vicus, Heiligtum? Ergebnisse der Grabungen der Jahre 2004 bis 2012, mit einem Beitrag von Gabriele Wrolli. Graz-Wien 2021, 84, 174. [Google Scholar]
  15. Heinemann, J. Mineralogische und Computertomographische Untersuchungen an Ägyptisch-Blau Kugeln (Aguntum, Osttirol; Retznei und Wagna, Flavia Solva, Südsteiermark). Bachelor‘s Thesis, University of Innsbruck, Innsbruck, Austria, 2022. Unpublished. [Google Scholar]
  16. Cornard, P.H.; Degenhart, G.; Tropper, P.; Moernaut, J.; Strasser, M. Application of micro-CT to resolve textural properties and assess primary sedimentary structures of deep-marine sandstones. Depos. Rec. 2024, 10, 559–580. [Google Scholar] [CrossRef]
  17. Guntoro, P.I.; Ghorbani, Y.; Koch, P.H.; Rosenkranz, J. X-ray microcomputed tomography (µCT) for mineral characterization: A review of data analysis methods. Minerals 2019, 9, 183. [Google Scholar] [CrossRef]
  18. Wang, Y.; Miller, J.D. Current developments and applications of micro-CT for the 3D analysis of multiphase mineral systems in geometallurgy. Earth-Sci. Rev. 2020, 211, 103406. [Google Scholar] [CrossRef]
  19. Cnudde, V.; Boone, M.N. High-resolution X-ray computed tomography in geosciences: A review of the current technology and applications. Earth-Sci. Rev. 2013, 123, 1–17. [Google Scholar] [CrossRef]
  20. Buyse, F.; Dewaele, S.; Boone, M.N.; Cnudde, V. Contribution of 3D automated mineralogy in unraveling the formation history of Nb-Ta-Sn mineralized LCT pegmatites in the Karagwe-Ankole belt (Central Africa). Geol. Belg. 2024, 27, 1–14. [Google Scholar] [CrossRef]
  21. Hildebrand, T.; Rüegsegger, P. A new method for the model-independent assessment of thickness in three-dimensional images. J. Microsc. 1997, 185, 67–75. [Google Scholar] [CrossRef]
  22. Napporn, T.W.; Canaff, C.; Bere, E.; Hacker, V. Characterization Methods for Components and Materials. In Fuel Cells and Hydrogen; Elsevier: Amsterdam, The Netherlands, 2018; pp. 155–173. [Google Scholar]
  23. Papadopoulou, D.; Sakalis, A.; Merousis, N.; Tsirliganis, N.C. Study of decorated archeological ceramics by micro X-ray fluorescence spectroscopy. Nucl. Instrum. Methods Phys. Res. Sect. A Accel. Spectrometers Detect. Assoc. Equip. 2007, 580, 743–746. [Google Scholar] [CrossRef]
  24. Pradell, T.; Salvado, N.; Hatton, G.D.; Tite, M.S. Physical processes involved in production of the ancient pigment, Egyptian blue. J. Am. Ceram. Soc. 2006, 89, 1426–1431. [Google Scholar] [CrossRef]
  25. El Goresy, A. Polychromatic Wall Painting Decorations in Monuments of Pharaonic Egypt: Compositions, chronology and painting techniques. In Proceedings of the First International Symposium the Wall Paintings of Thera: Proceedings of the First International Symposium Petros M. Nomikos Conference Centre (ed. S. Sherratt), (Thera, Hellas, 1997); 2000; Volume 1, pp. 49–70. [Google Scholar]
  26. Tite, M.S.; Bimson, M.; Cowell, M.R. Technological examination of Egyptian blue. Am. Chem. Soc. 1984, 205, 215–242. [Google Scholar]
  27. Lazzarini, L.; Verità, M. First evidence for 1st century AD production of Egyptian blue frit in Roman Italy. J. Archaeol. Sci. 2015, 53, 578–585. [Google Scholar] [CrossRef]
  28. Hatton, G.D.; Shortland, A.J.; Tite, M.S. The production technology of Egyptian blue and green frits from second millennium BC Egypt and Mesopotamia. J. Archaeol. Sci. 2008, 35, 1591–1604. [Google Scholar] [CrossRef]
  29. Kostomitsopoulou Marketou, A.; Andriulo, F.; Steindal, C.; Handberg, S. Egyptian Blue pellets from the first century BCE workshop of Kos (Greece): Microanalytical investigation by optical microscopy, scanning electron microscopy-X-ray energy dispersive spectroscopy and micro-Raman spectroscopy. Minerals 2020, 10, 1063. [Google Scholar] [CrossRef]
  30. Delamare, F. Sur les processus physiques intervenant lors de la synthèse du bleu égyptien. ArchéoSciences Rev. d’Archéométrie 1997, 21, 103–119. [Google Scholar] [CrossRef]
Figure 1. Plan of the excavated area of Aguntum (upper image). Room 289 is marked in green. The lower image shows an enlargement of room 289 and the finding area of the spheres is also shown in blue [10].
Minerals 15 00302 g001
Figure 2. Excavation plan and location of Egyptian blue pellets from Retznei ((left): red arrow indicating the exact locality in the excavation plan; (right): actual excavation site).
Minerals 15 00302 g002
Figure 3. Excavation plan of Flavia Solva and location of Egyptian blue pellets (© A. Rodler-Rørbo).
Minerals 15 00302 g003
Figure 4. Photomicrograph of Egyptian spheres from the three sample localities. From Left to Right: Aguntum 01, Retznei 01, Flavia Solva 01 [15].
Minerals 15 00302 g004
Figure 5. Photomicrograph of a thin section with three Egyptian pellets (OK, MK, UK) from Aguntum [15].
Minerals 15 00302 g005
Figure 6. Thin section of the Aguntum pellet under transmitted light (magnification 10×). The large quartz grains are surrounded by cuprorivaite crystals. Cpr: cuprorivaite, Qz: quartz; Cc: calcite, Pb: opaque lead-silicate.
Minerals 15 00302 g006
Figure 7. SEM images of Aguntum 1. (A) The light grey rims are cuprorivaite, surrounding large quartz crystals. Interspersed glass and a Pb-silicate occur. (B) close-up of the area around the Pb-silicate immersed in glass coexisting with cuprorivaite, which shows replacement by clay minerals. The glass also shows some schlieren of tiny Pb-silicate droplets. (C) Albite and Cu-oxide occur within the mass of cuprorivaite crystals. (D) Large clinopyroxene crystal between quartz crystals with rims of cuprorivaite. Abbreviations: cuprorivaite: Cpr, quartz: Qz, glass: L, Pb-silicate: Pb, albite: Ab, Cu-oxide: Cu2O, clinopyroxene: Cpx.
Minerals 15 00302 g007
Figure 8. Combined μ−XRF elemental distribution maps of three pellets from Aguntum. (A) elemental distribution of Si (pink), Ca (blue), Cu (orange) overlain on an image of the surface of the pellets (F1). The resulting colors can be attributed to the following minerals—pink: quartz; bluish-pink: cuprorivaite; blue: calcite; and yellow: Cu phase. (B) elemental distribution of Fe (red) and Ti (turquoise) overlain on an image of the surface of the pellets (F1). High Ti concentrations correlate with rutile and high Fe concentrations with either clinopyroxene or magnetite (hematite).
Minerals 15 00302 g008
Figure 9. The upper μCT images show the cuprorivaite distribution within the five pellets (three from Aguntum 1–3, one from Retznei and Flavia Solva).
Minerals 15 00302 g009
Figure 10. μCT slice image of the Aguntum pellet Aguntum 1 (left) and the reconstruction of the pellet based on the chosen thresholds (right). The upper right images show the reconstruction from the core of the pellet and the lower images show the reconstruction of the rim area of the pellet. A clear difference in cuprorivait content between surface near and central area is visible.
Minerals 15 00302 g010
Figure 11. Comparison of the textural, volumetric and density composition of the scanned pellets. (A) Mean particle diameter [mm] of the defined phases, (B) volumetric composition of the defined phases, (C) density distribution of the defined phases.
Minerals 15 00302 g011
Figure 12. Three-dimensional imaging of the μCT-based mineral distribution combined with a false color particle diameter of the Aguntum 1 pellet (top: a virtual cut plane at 50% sample dept was applied; bottom: full 3D sample visualization). ((A): Pb-silicate and Cu-oxides, (B): Cuprorivaite, (C): matrix, (D): Qz, (E): clay minerals, (F): pores).
Minerals 15 00302 g012
Figure 13. Three-dimensional imaging of the μCT-based mineral distribution combined with false color particle diameter of the Retznei 1 pellet (top: a virtual cut plane at 50% sample dept was applied; bottom: full 3D sample visualization). ((A): Pb-silicate and Cu-oxides, (B): Cuprorivaite, (C): matrix, (D): Qz, (E): clay minerals, (F): pores).
Minerals 15 00302 g013
Figure 14. Three-dimensional imaging of the μCT-based mineral distribution combined with false color particle diameter of the Flavia Solva 1 pellet (top: a virtual cut plane at 50% sample dept was applied; bottom: full 3D sample visualization). ((A): Pb-silicate and Cu-oxides, (B): Cuprorivaite, (C): matrix, (D): Qz, (E): clay minerals, (F): pores).
Minerals 15 00302 g014
Table 1. List of phases and their density values.
Mineral GroupsDensity
CuO, PbSiO3 (copper oxide, lead silicate)2301–3000 [mgHA/mm3]
CaCuSi4O10 (cuprorivaite)1521–2300 [mgHA/mm3]
Silicate matrix (clinopyroxene, plagioclase, albite, glass)1041–1500 [mgHA/mm3]
SiO2 (quartz, cristobalite)736–1040 [mgHA/mm3]
Undefined low-density mineral clays (alteration phases)456–735 [mgHA/mm3]
Pores0–455 [mgHA/mm3]
Table 2. Representative EDS-EPMA analyses of minerals from Aguntum 1.
AnalysisSiO2Al2O3FeOMgOCu2OPbOCaONa2OK2OClSum
Clinopyroxene49.412.817.3611.63n.d.n.d.28.79n.d.n.d.n.d.100.00
Pb-silicate32.352.43n.d.1.61n.d.63.62n.d.n.d.n.d.n.d.100.00
Pb-silicate29.961.24n.d.1.00n.d.67.79n.d.n.d.n.d.n.d.100.00
Albite66.8317.373.31n.d.n.d.n.d.n.d.10.482.01n.d.100.00
Glass72.107.272.261.004.27n.d.1.698.702.310.41100.00
Glass68.707.753.13n.d.6.39n.d.2.776.222.342.70100.00
Glass71.186.151.61n.d.6.49n.d.2.5710.021.600.38100.00
Cuprorivaite62.76n.d.n.d.16.5420.70n.d.n.d.n.d.n.d.n.d.100.00
Cuprorivaite61.38n.d.n.d.17.5821.04n.d.n.d.n.d.n.d.n.d.100.00
Cuprorivaite63.11n.d.n.d.16.8220.08n.d.n.d.n.d.n.d.n.d.100.00
Cuprorivaite60.28n.d.n.d.17.7521.98n.d.n.d.n.d.n.d.n.d.100.00
Cuprorivaite61.82n.d.n.d.17.4120.77n.d.n.d.n.d.n.d.n.d.100.00
Disclaimer/Publisher’s Note: The statements, opinions and data contained in all publications are solely those of the individual author(s) and contributor(s) and not of MDPI and/or the editor(s). MDPI and/or the editor(s) disclaim responsibility for any injury to people or property resulting from any ideas, methods, instructions or products referred to in the content.

