Abstract
Ultrafine nano-grinding of silicon–carbon ores combined with sodium hexametaphosphate (SHMP) treatment enhanced silica dispersion and effectively separated silica and carbon particles. The hydrophobic nature of carbon promoted its re-agglomeration and sedimentation, achieving selective carbon enrichment. Characterization via FTIR, Raman spectroscopy, and TEM revealed two types of amorphous carbon with distinct structural features. BET analysis indicated a specific surface area of 92 m2/g for the carbon-rich fraction, suggesting potential applications in catalysis and energy storage after further activation.
1. Introduction
This study investigates a silicon–carbon ore from the Shilukeng mining area (Fengcheng, Jiangxi Province, China), associated with clay minerals including montmorillonite, kaolinite, illite, pyrophyllite, and pyrite. The ore deposit spans 1.83 km2 with an average thickness of 30.53 m, containing >70% SiO2 and >10% carbon. Microscopic analysis reveals intricate mineralogy: fine carbon particles encapsulate gangue minerals (e.g., quartz, kaolinite, pyrite), forming porous, heterogeneous morphologies. Notably, nanoscale needle-like quartz and carbon-coated quartz are observed on ore surfaces [1]. Beneficiation yields micron-sized quartz and mesoporous silica, but carbon–silica intergrowth limits carbon utilization, necessitating advanced separation strategies.
Kowalczuk et al. [2] achieved selective organic carbon–quartz separation in carbonaceous copper shale using polyethylene glycol alkyl ethers (C4E2/C2E2), demonstrating industrial applicability for coarse flotation. Reis et al. [3] developed a pretreatment protocol combining ultrasonic disaggregation and buoyancy-based removal of low-density carbonaceous fractions from schists, enhancing acid processing efficiency.
Wang et al. [4] revealed that phosphate additives elevate aluminosilicate zeta potentials, amplifying electrostatic repulsion. Sodium hexametaphosphate (SHMP) further introduces steric hindrance, synergistically enhancing particle dispersion. Liu et al. [5] corroborated SHMP’s role in modifying surface electrical properties. Zhang et al. [6] identified SHMP’s dual functionality in apatite–dolomite systems: (1) hydrophilizing apatite as a depressant and (2) dispersing dolomite while improving reagent/bubble adhesion. This dual mechanism significantly boosts separation selectivity.
Synthesized via pyrolysis of biomass (fruit shells, wood) or polymers, mesoporous carbon (2–50 nm pore size) is widely used in adsorption, filtration, and purification [7,8,9,10,11,12]. Advances in pore–structure engineering have expanded applications to biomolecule separation, supercapacitors, catalytic supports, and environmental remediation [13,14].
In previous studies, the separation and utilization of silico-carbonaceous minerals have primarily relied on chemical methods; however, direct extraction using ether-based solvents and kerosene has proven to be ineffective. This study aims to achieve effective separation of quartz and carbon by regulating the surface potential of silico-carbonaceous mineral suspensions using SHMP, thereby enriching the carbonaceous components. Additionally, various characterization techniques will be employed to analyze the structural features of the enriched carbonaceous matter, promoting the comprehensive utilization of silico-carbonaceous minerals.
2. Materials and Methods
2.1. Experimental Raw Materials and Equipment
The ore samples studied in this paper were collected from the mining cave in Fengcheng, Jiangxi Province, China. The mineral is tentatively named micro–nano silicon–carbon ore. The ore samples were ultrafinely ground using the GSDM-S1 ultrafine grinding mill provided by Beijing Gu Sheng Dai Technology Co., Ltd. (Beijing, China). The nano-ground samples were produced using the NT-V series horizontal sand mill provided by Langling Machinery Co., Ltd. (Dongguan, Guangdong, China). Sodium hexametaphosphate provided by Zhiyuan Chemical Reagent Co., Ltd. (Tianjin, China) was used to treat the ore.
2.2. Sample Preparation
Grading and grinding of micro–nano silicon–carbon ore: Mineral-phase dissociation is achieved by two-stage wet mechanical chemical grinding. Primary ultrafine grinding was performed for 2 h under optimized parameters: a ball-to-material ratio of 3:1, slurry solid content of 20%, and rotational speed of 3000 rpm. Particle size reduction was monitored in real time until the D90 value fell below 5 μm. Subsequently, secondary nano-grinding was conducted for an additional 2 h with modified conditions: an increased ball-to-material ratio (4:1), reduced solid content (5%), and adjusted rotational speed (2000 rpm). Notably, no grinding aids were employed throughout the process to preserve the intrinsic surface properties of mineral phases. The silicon–carbon slurry after nano-grinding is marked as SC.
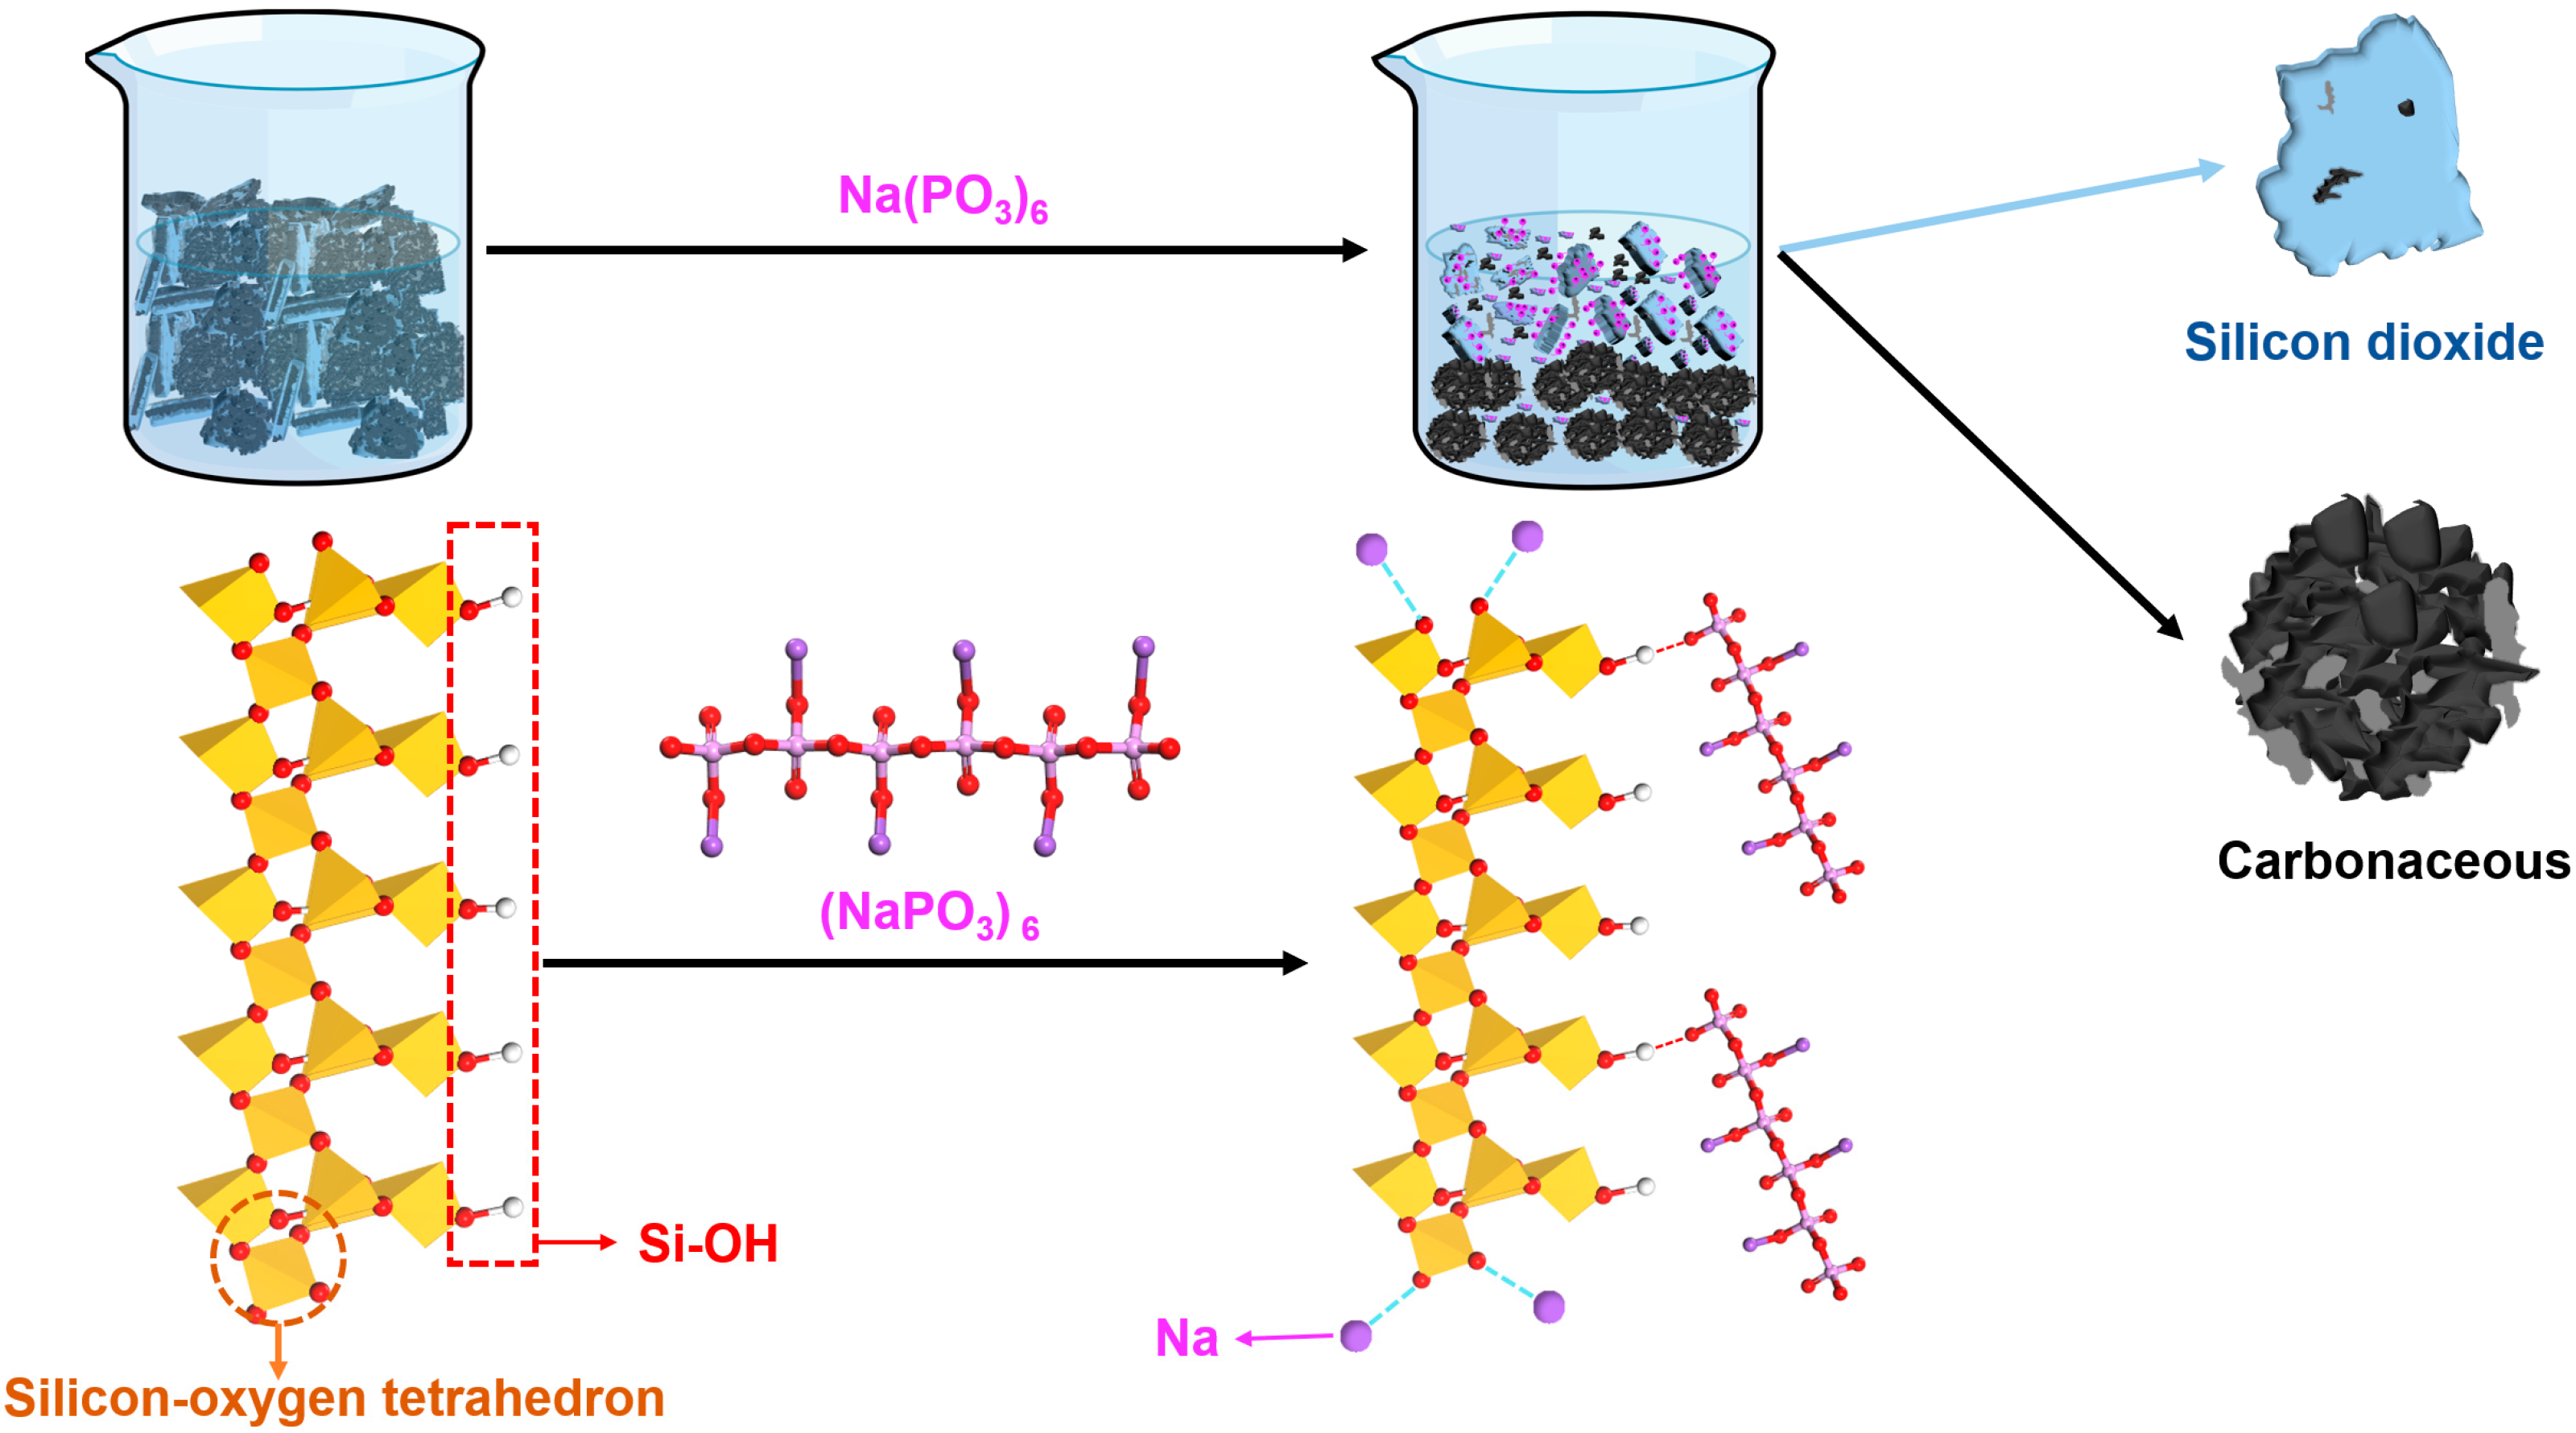
Separation of quartz and carbonaceous components in silicon–carbon ore (as shown in Figure 1): We added a certain amount of sodium hexametaphosphate (SHMP, 6%) to the nano-milled silico-carbon slurry (SC-0), stirred for 5 min and then let it stand for 30 min. Subsequently, we poured out the upper layer of the gray turbid slurry and added an equal mass of distilled water to the lower layer of black solution, stirred for 5 min and let it stand for 30 min, and then poured out the upper layer of solution again. We repeated this process until the upper layer of clear liquid became clear. The separated upper layer of gray slurry (SC-1) and the lower layer of black slurry (SC-2) were subjected to centrifugal treatment, dried at 60 °C to a constant weight, and then ground with a mortar for dispersal.
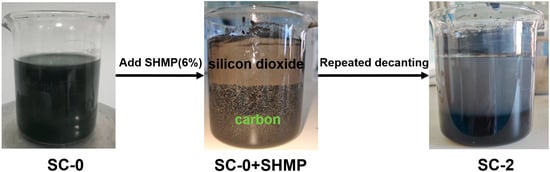
Figure 1.
Flowchart of process for separating quartz and carbonaceous materials in silicon–carbon ores using sodium hexametaphosphate.
The abbreviations of the samples mentioned in this article and their corresponding explanations are shown in Table 1.

Table 1.
The abbreviations and corresponding explanations.
2.3. Testing and Analysis Methods
The particle size of the silicon–carbon ore was tested: The particle size changes of the silicon–carbon ore before and after grinding were tested using a Bettersize laser particle size analyzer.
The zeta potential of the silicon–carbon slurry before and after treatment with hexametaphosphate was tested using a Malvern Zetasizer Nano ZS90 nanoparticle size and potential analyzer (Malvern Panalytical Company, Almelo, The Netherlands).
The carbon content of the silicon–carbon ore was determined as follows: The carbon content in the silicon–carbon ore was measured by using the combustion method. The silicon–carbon ore, after nano-grinding, was fully dried at 90 °C to a constant weight. Then, mass m1 of the silicon–carbon ore before combustion was weighed using an analytical balance. Next, it was placed in a muffle furnace and fully combusted at 800 °C for 1 h to remove carbon. After combustion was completed, the sample was cooled, and mass m2 of the silicon carbide ore was weighed again. The carbon content of the silicon carbide ore can be calculated using the following formula:
In the formula, m1 denotes the mass of the silicon–carbon ore (SC-0, SC-1, SC-2) after drying, and m2 denotes the mass of the same samples after calcination at 800 °C.
The total carbon and organic carbon (TOC) content of the silicon–carbon ore after nano-grinding but before sodium hexametaphosphate treatment was tested using the TOC-L/SSM5000A (SHIMADZU, Kyoto, Japan).
The thermogravimetric curve of the powder was tested. Thermogravimetric curves of B, the WPU-B powder, and the specimens were analyzed using a NETZSCH (Selb, Germany) TG 209 F3 instrument, with a heating rate of 20 °C/min and a temperature range of 30 °C to 1000 °C in a N2 atmosphere.
The infrared spectra of the silicon–carbon ore was tested: The infrared spectra of the silicon–carbon ore before and after treatment with sodium hexametaphosphate was tested using the Nicoletis20 spectrometer from Thermo Fisher (Waltham, MA, USA), with the detection wavenumber range being from 500 to 4000 cm−1.
Laser Raman spectroscopy analysis was conducted on the silicon–carbon ore: A high-resolution confocal micro-Raman spectrometer (LabRAM HR Evolution, manufactured in Palaiseau, France by HORIBA Jobin Yvon) was used to detect the Raman spectral characteristics of the samples before and after treatment with SHMP. The laser wavelength used in the experiment is 532 nm.
The crystal structure of the infrared spectrum of the silicon–carbon ore before and after treatment with sodium hexametaphosphate was tested using an X-ray diffractometer (Rigaku Ultima IV series, Tokyo, Japan), with a scanning speed of 2°/min and a scanning range of 5° to 90°.
The microstructure of the samples was observed using Hitachi Electronics JSM-7610F (Japan Electronics Co. Ltd, Tokyo, Japan). Sample preparation method: After nano-grinding, the samples of silicon–carbon ore before and after sodium hexametaphosphate treatment, as well as those calcined at 800 °C before treatment, were added to anhydrous ethanol to form a solution. After ultrasonic treatment, the solution was dropped onto a silicon wafer using a pipette and then subjected to gold sputtering (20 mA, 120 s).
The microstructure of the samples before and after SHMP treatment was observed and tested using the FEI Talos 200S (Thermo Fisher, Waltham, MA, USA) field emission transmission electron microscope. Sample preparation process: After nano-grinding, the silicon carbide ore samples before and after sodium hexametaphosphate treatment were diluted in anhydrous ethanol until no visible particles remained, and then made into a suspension. After ultrasonic treatment, the samples were dropped onto the support film using a pipette. The following parameters were used: accelerating voltage: 200 kV; electron gun: Schottky thermal field emission ultra-bright electron gun (Thermo Fisher, Waltham, MA, USA); TEM point resolution: 0.25 nm; TEM information resolution: 0.12 nm; STEM resolution(Thermo Fisher, Waltham, MA, USA): 0.16 nm; stilt angle X/Y: ±30°; eresolution of energy spectrum: 136 eV.
Textural analysis (with BET as one of the methods used). The specific surface area and the pore size (BET) of the silicon–carbon ore treated with SHMP were determined by using the BK100B specific surface area and pore size analyzer of Use Microscopic and Advanced Technology Co., Ltd. (Beijing, China).
3. Results and Discussion
3.1. Exploration of Grinding and Separation Mechanism of Silicon–Carbon Ore
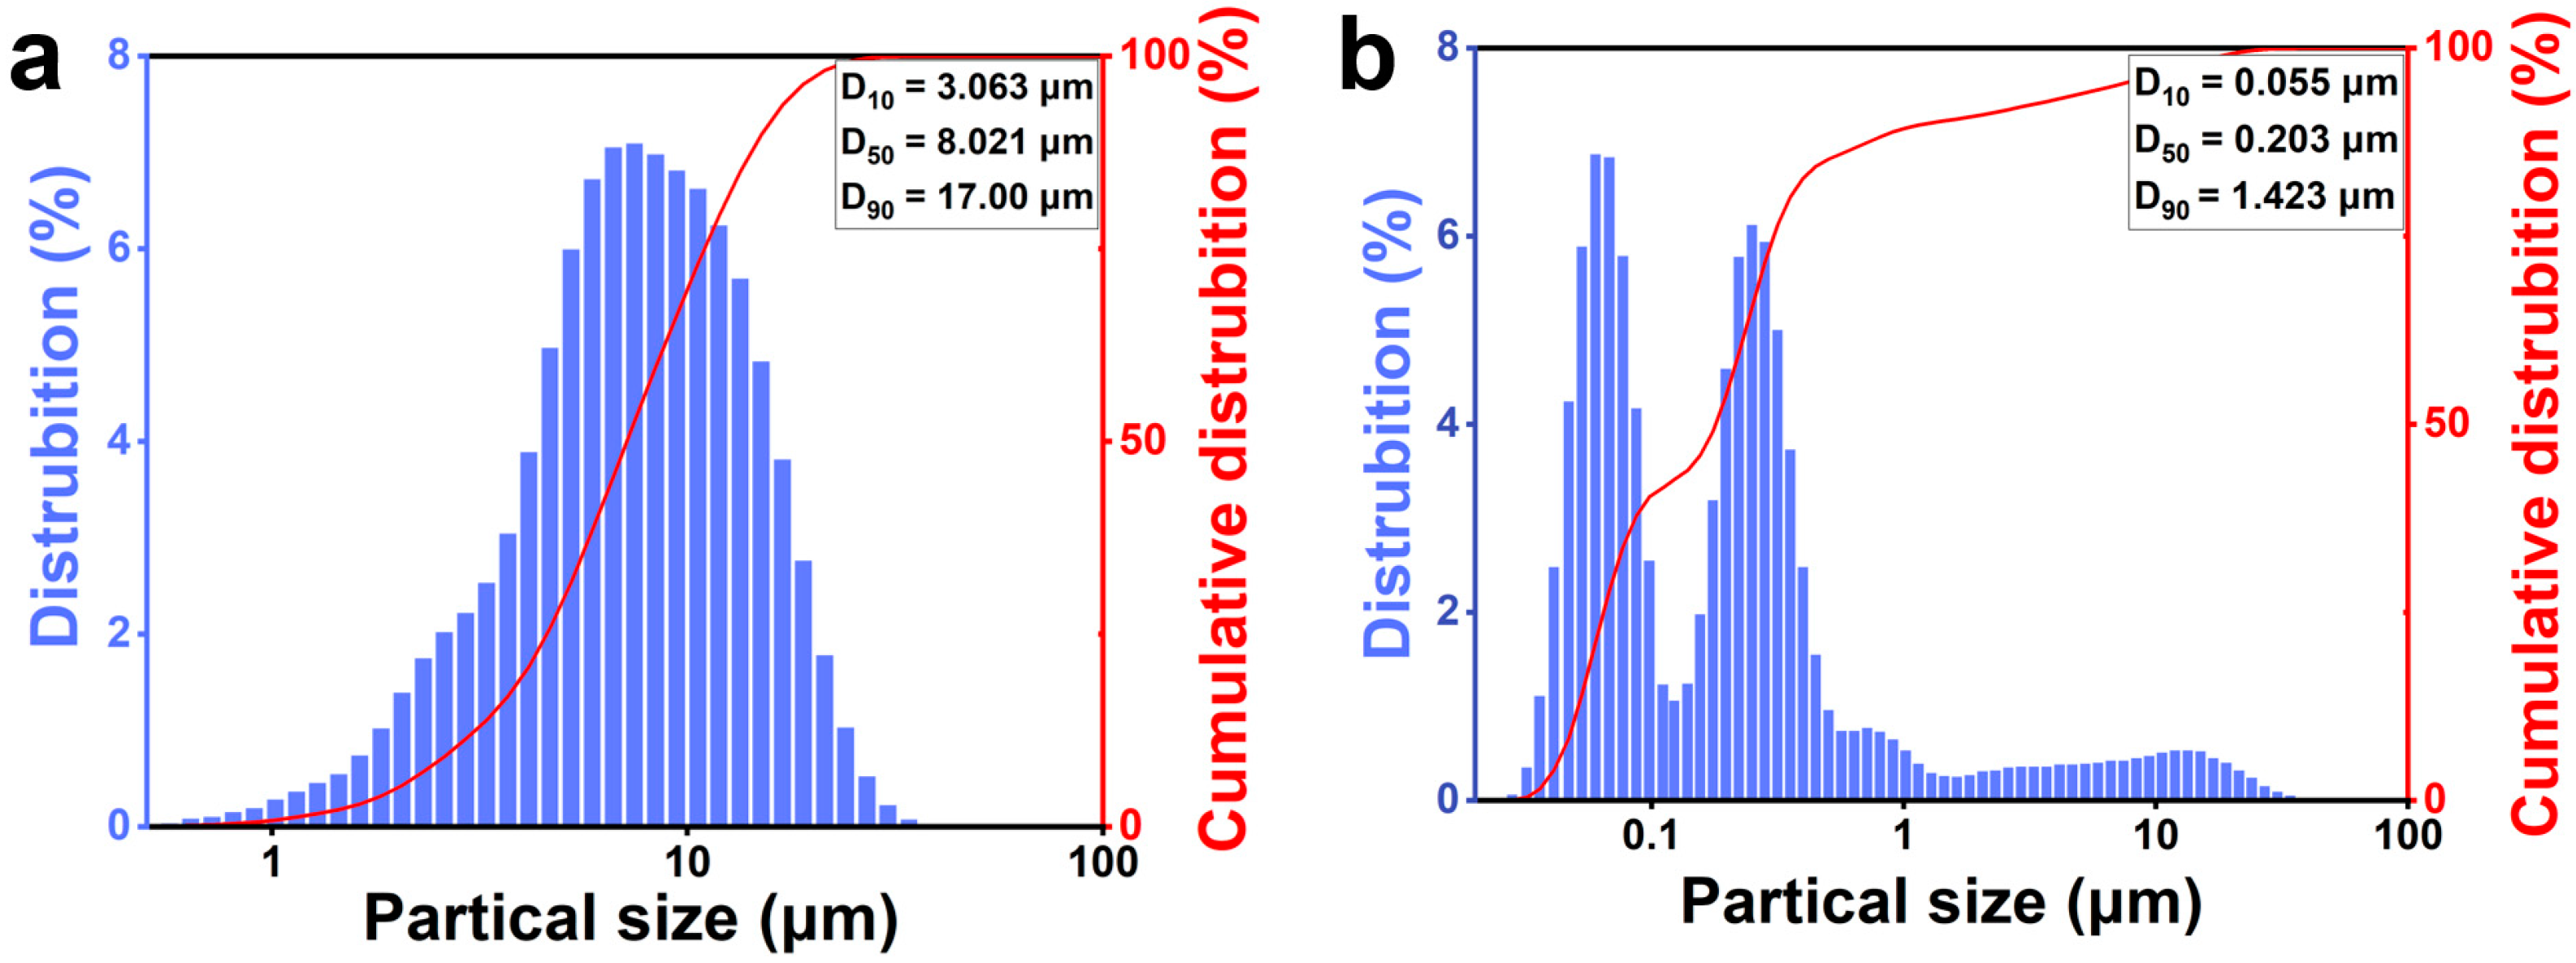
The particle size change of the silicon–carbon ores after nano-grinding is illustrated in Figure 2. As shown in Figure 2a, the particle size distribution shifts from a unimodal profile (D90 = 17.000 μm) to a bimodal distribution (D90 = 1.423 μm) after ultrafine nano-grinding. The bimodality (Figure 2b) likely stems from agglomeration between silica and carbon particles in the absence of dispersants.
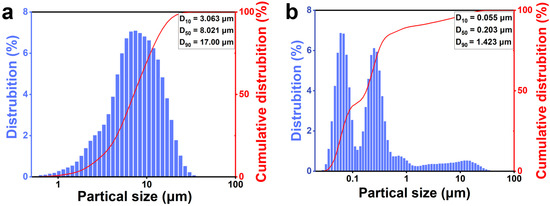
Figure 2.
The particle size changes of silicon–carbon ore before (a) and after (b) ultrafine nano-grinding.
Before adding SHMP, the silicon–carbon ore solution appeared uniformly black. During an initial period of standing, no significant changes were observed. Following the introduction of SHMP, the carbonaceous components in the silicon–carbon ore slurry exhibited pronounced agglomeration (Figure 1). With prolonged quiescence, these aggregates underwent gravitational settling, inducing progressive clarification through phase separation: the supernatant transitioned to a turbid gray suspension, while the denser carbon-rich phase accumulated at the vessel base. To elucidate the colloidal stabilization mechanisms, ζ-potential analysis was systematically performed on two systems: (i) untreated silicon–carbon slurry, and (ii) SHMP-modified slurry systems. As illustrated in Table 2, the ζ-potential of the silicon–carbon ore slurry without SHMP was −4.25 mV. After SHMP addition, the ζ potential decreased to −29.1 mV. These results indicate that SHMP substantially increases the absolute value of the ζ potential of the silicon–carbon ore slurry.
Table 2.
The ζ potential changes in the solution before and after SHMP treatment.
In untreated silicon–carbon ore systems, silica dioxide particles exhibited strong aggregation tendencies driven by van der Waals interactions and inherent surface properties. Carbonaceous components preferentially adsorbed onto quartz and aluminosilicate mineral surfaces through non-covalent interactions. Owing to the abundance of quartz and aluminosilicate phases, substantial carbonaceous matter became entrapped within the silica-dominated agglomerates. Upon SHMP addition, Na⁺ ions electrostatically neutralized negatively charged oxygen moieties on silica surfaces (as illustrated in Figure 3). Concurrently, oxygen atoms within SHMP formed hydrogen bonds with hydroxyl groups on hydrated quartz surfaces, inducing conformational rearrangement of adsorbed SHMP molecules. This synergistic interaction markedly amplified the surface charge density (negative) of silica particles [15]. Post-SHMP adsorption, the elevated surface potential (−29.3 mV) on silica dioxide established robust interparticle electrostatic repulsion forces, effectively suppressing particle aggregation and stabilizing the colloidal dispersion system. In contrast, carbonaceous matter demonstrated a limited SHMP adsorption capacity owing to its inherent hydrophobicity and deficiency in surface hydroxyl groups, leading to diminished electrostatic stabilization. This disparity in surface modification promoted carbon-phase coalescence via hydrophobic attraction and van der Waals interactions, ultimately enabling gravitational segregation of enlarged carbon aggregates from the stabilized silica suspension.
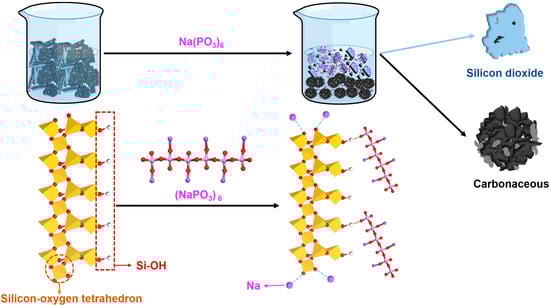
Figure 3.
Mechanism diagram of sodium hexametaphosphate for separating silicon–carbon minerals.
3.2. Characterization and Identification of Carbonaceous Materials in Silicon–Carbon Ore
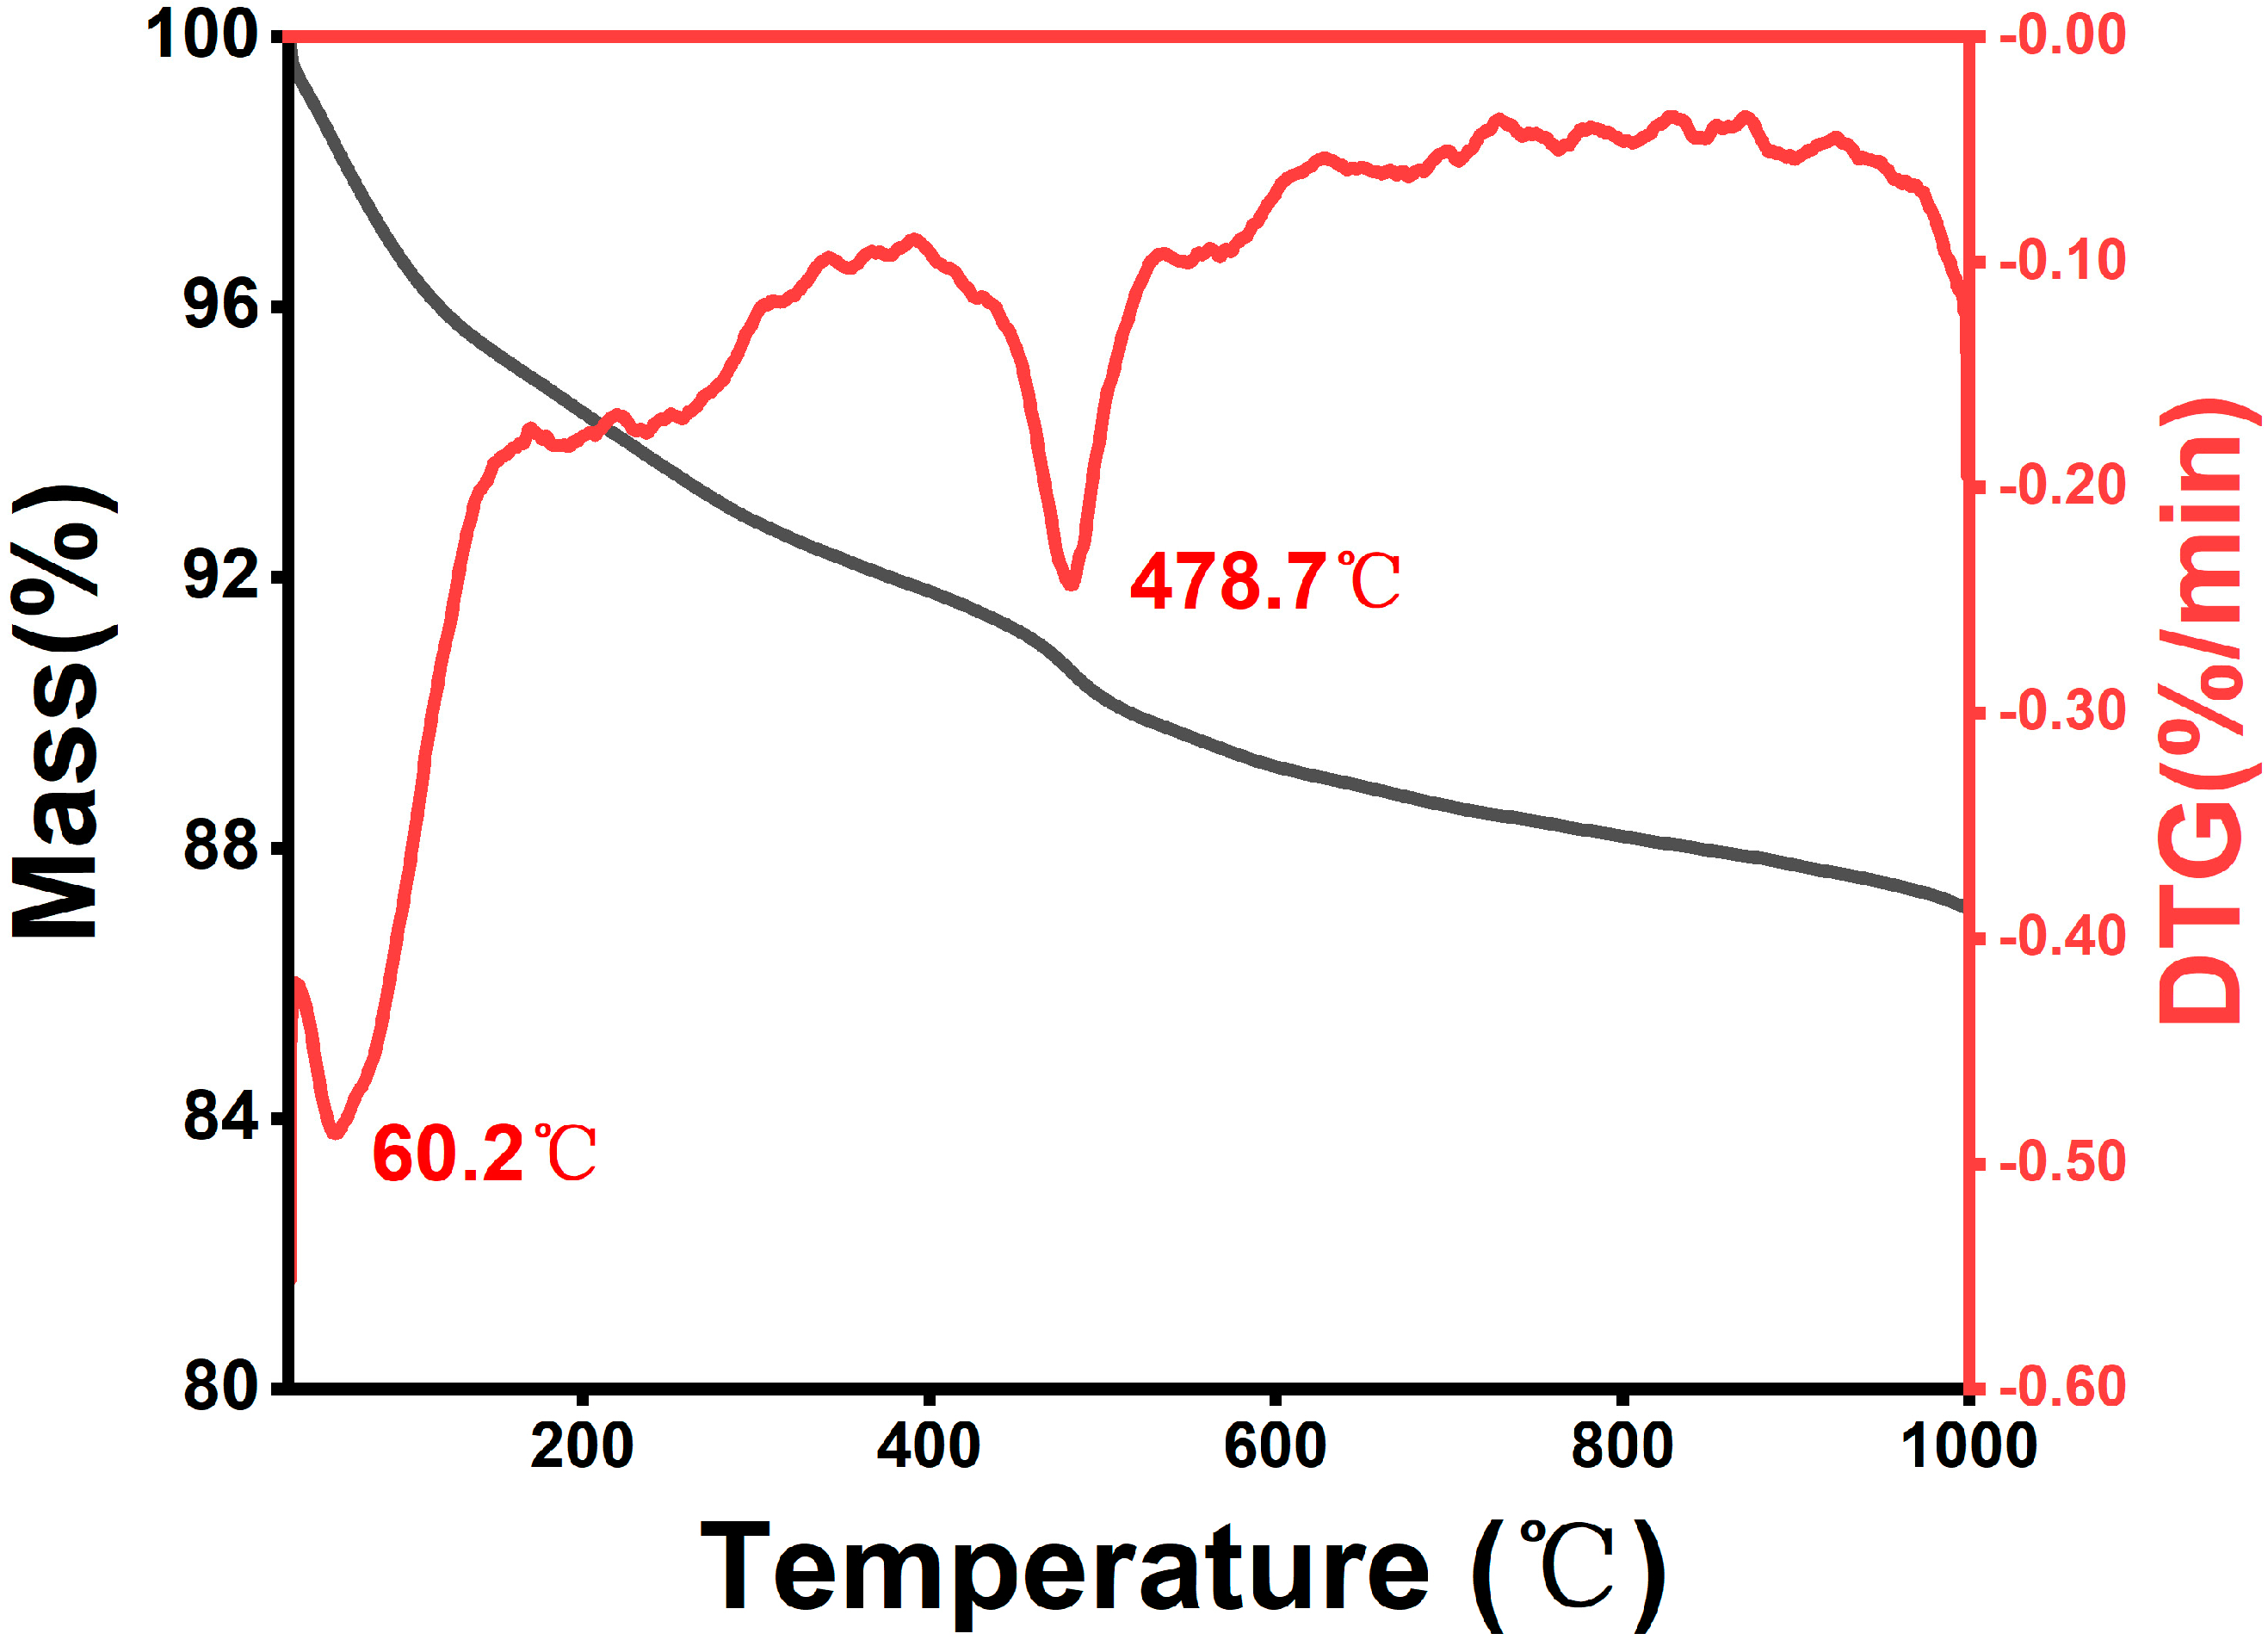
We conducted a total organic carbon (TOC) and TGA analysis on the carbonaceous matter in the silicon–carbon ore (SC-0). The TOC results indicate that the total carbon content (TC) is 11.85%, with the organic carbon content (TOC) accounting for 10.99% and the inorganic carbon content comprising 0.86%. The TGA test results, as shown in Figure 4, indicate that the SC-0 sample experienced significant mass loss within two distinct temperature ranges: 60~200 °C and 438~550 °C. In the lower temperature range (60~200 °C), water and volatile compounds were released from the mineral matrix [16]. In the higher temperature range (438~550 °C), the biomass-derived carbonaceous matter underwent volatilization and oxidation [17,18]. The research results of TOC and TGA indicate that the carbonaceous material in silicon–carbon ore predominantly consists of biomass carbon, a result that is consistent with a previous research conclusion stating that the carbon in silicon–carbon ore mainly originates from fossil deposition and the evolution of plants and animals [1].

Figure 4.
The TGA curve of silicon–carbon ore.
XRF analysis (Table 3) revealed distinct compositional shifts in SHMP-treated silicon–carbon ore samples. SC-1 exhibited elevated SiO2 content (82.8 wt%), aligning with prior studies on phosphate-mediated mineral beneficiation. Conversely, SC-2 demonstrated a fivefold carbon enrichment (from 12.2 wt% to 61.9 wt%), conclusively validating SHMP’s selective quartz–carbon separation efficacy.
Table 3.
XRF changes of silicon–carbon ore before and after SHMP treatment (Unit: wt%).
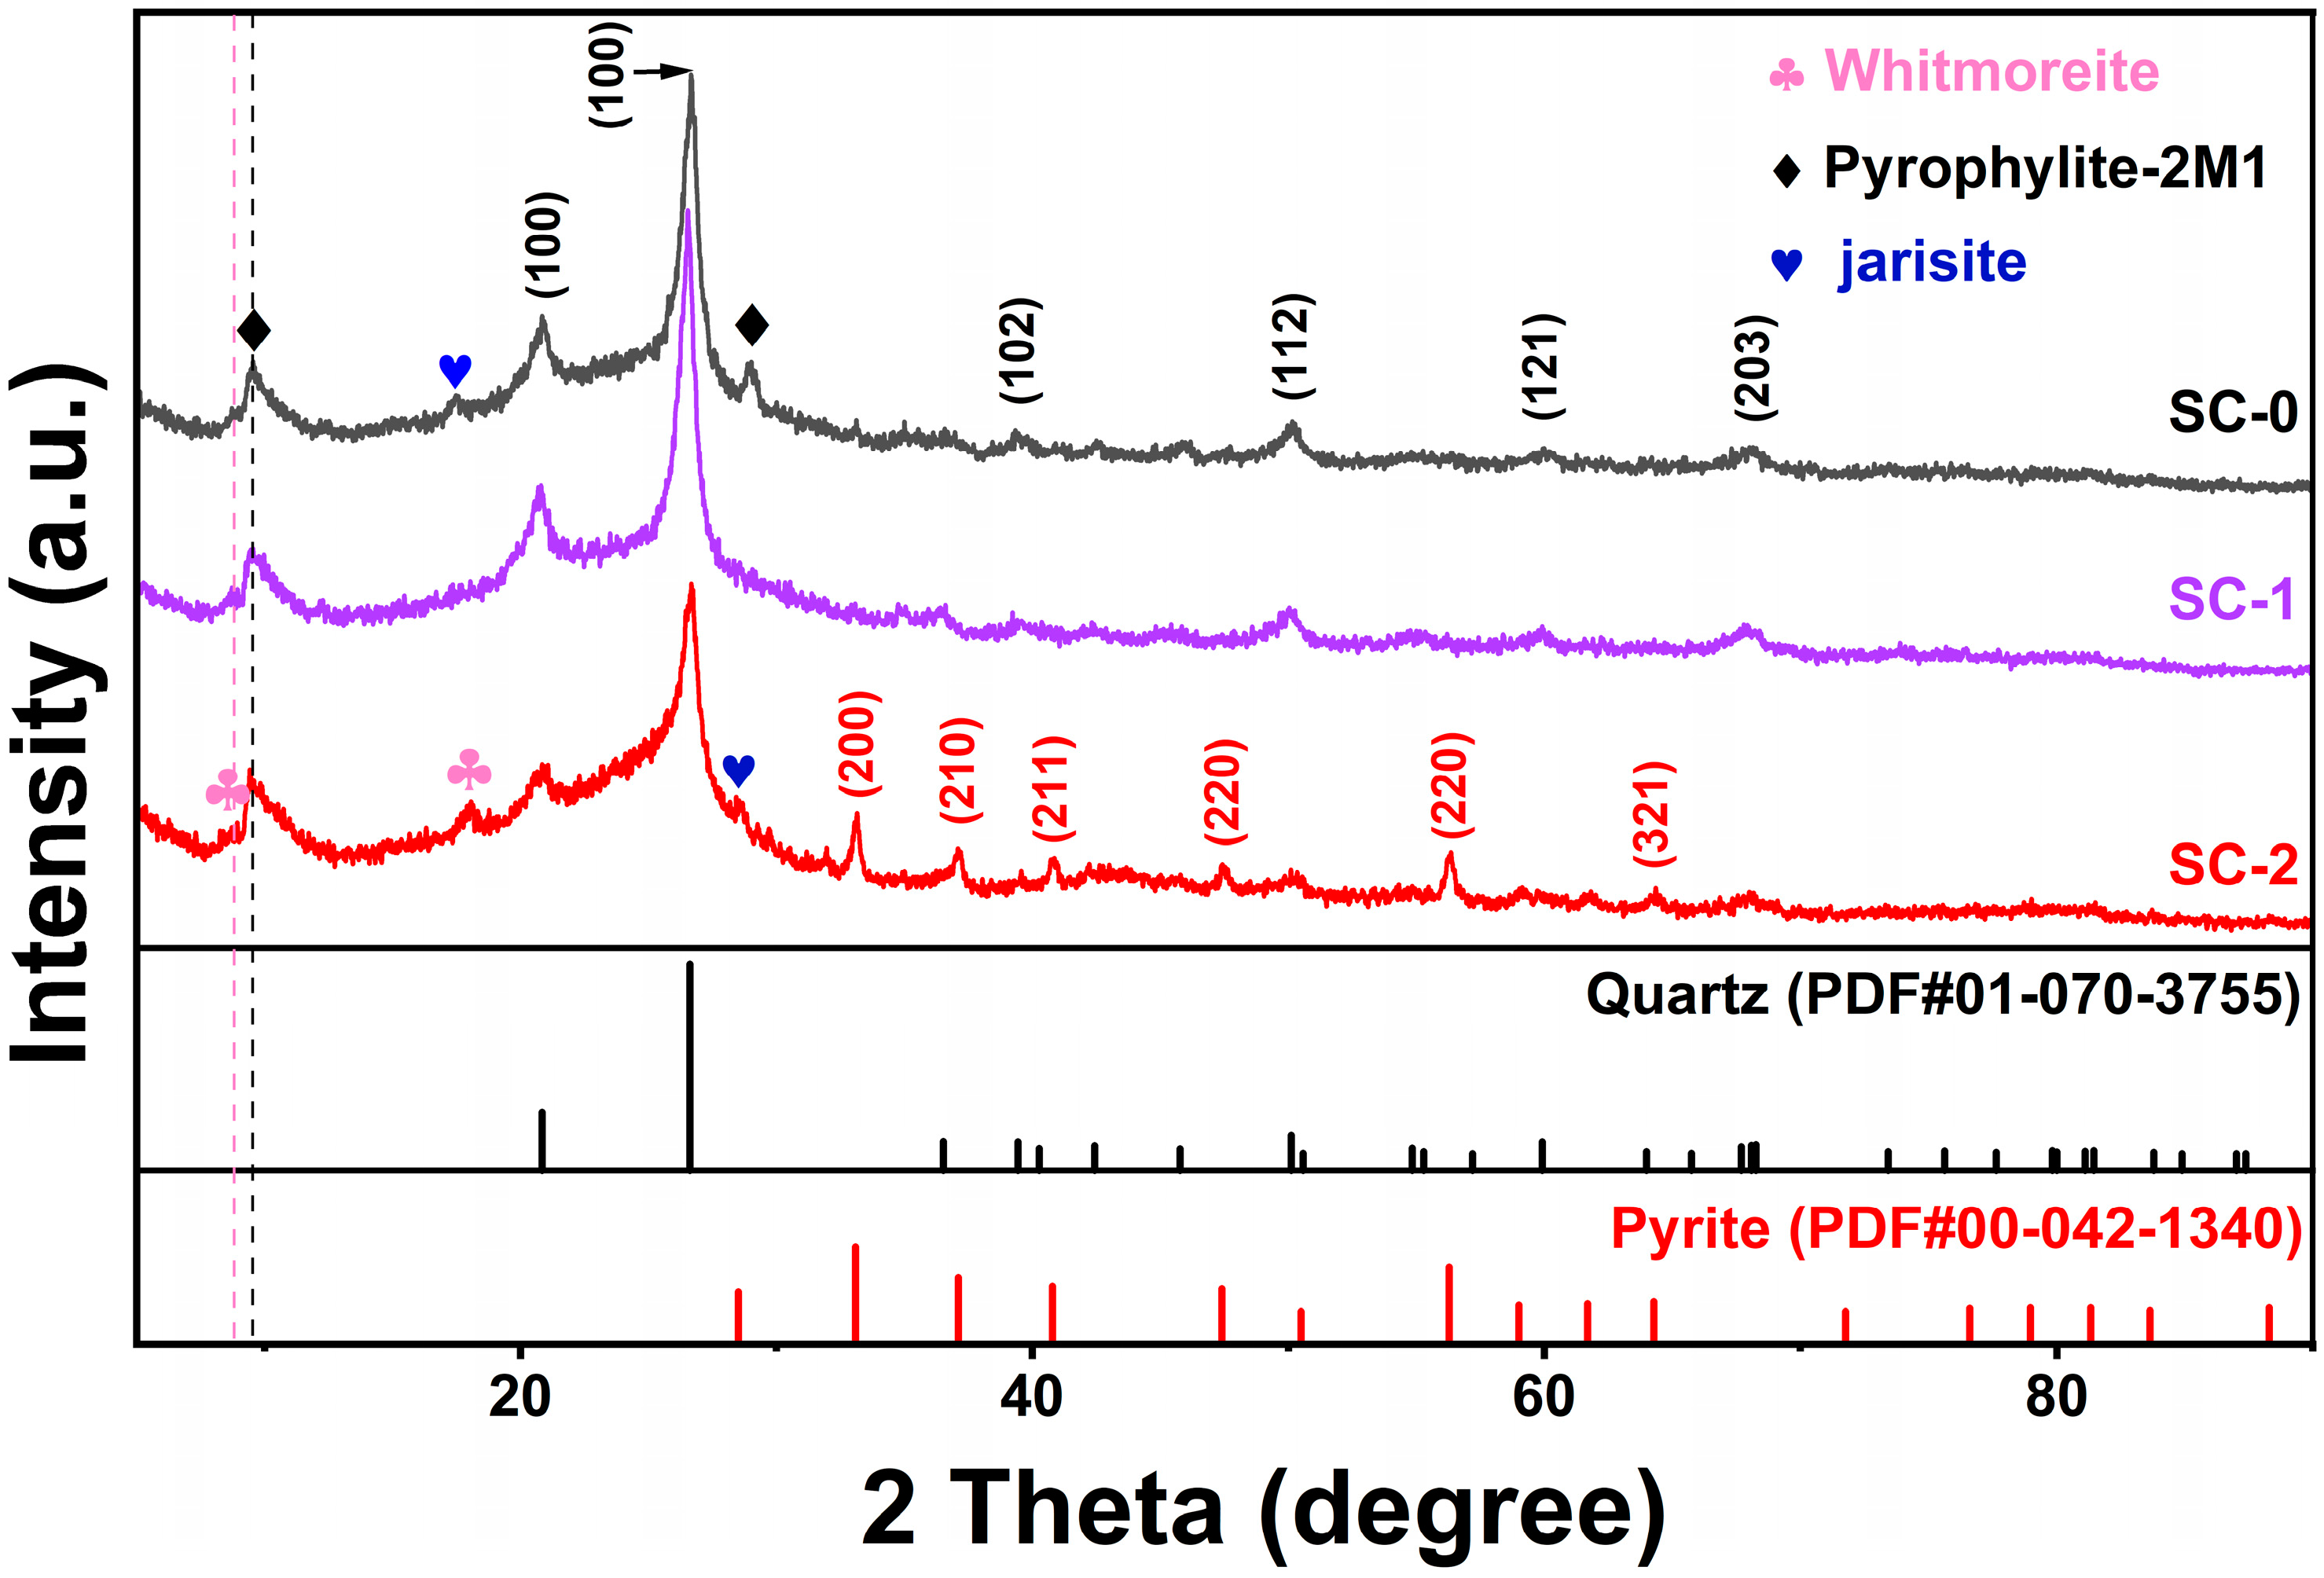
The XRD patterns of silicon–carbon ore before and after SHMP treatment are shown in Figure 5. Due to the presence of amorphous carbonaceous matter, there are miscellaneous peaks in the entire spectrum. The silicon–carbon ore (SC-0) before treatment mainly contains quartz (PDF#01-070-3755), a small amount of pyrite (PDF#00-042-1340), limonite (PDF#00-026-1138), and jarosite as well as pyrophyllite (PDF#01-073-1037) [1]. After separation by SHMP treatment, in the SC-1 sample, the diffraction peak response of the pyrite phase is weak, indicating its low content; meanwhile in the SC-2 sample, the diffraction peak responses of the (200), (210), (211), (220), and (321) crystal planes of the pyrite phase are significantly enhanced, indicating that SC-2 contains a higher proportion of pyrite. This result is consistent with the increase in iron (Fe) and sulfur (S) contents in SC-2 shown in Table 3 by XRF analysis.
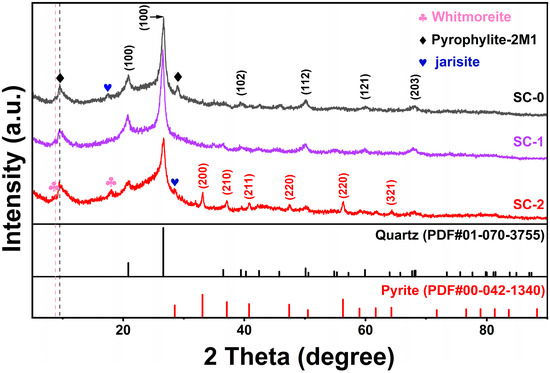
Figure 5.
XRD changes of silica–carbon ore before and after SHMP treatment.
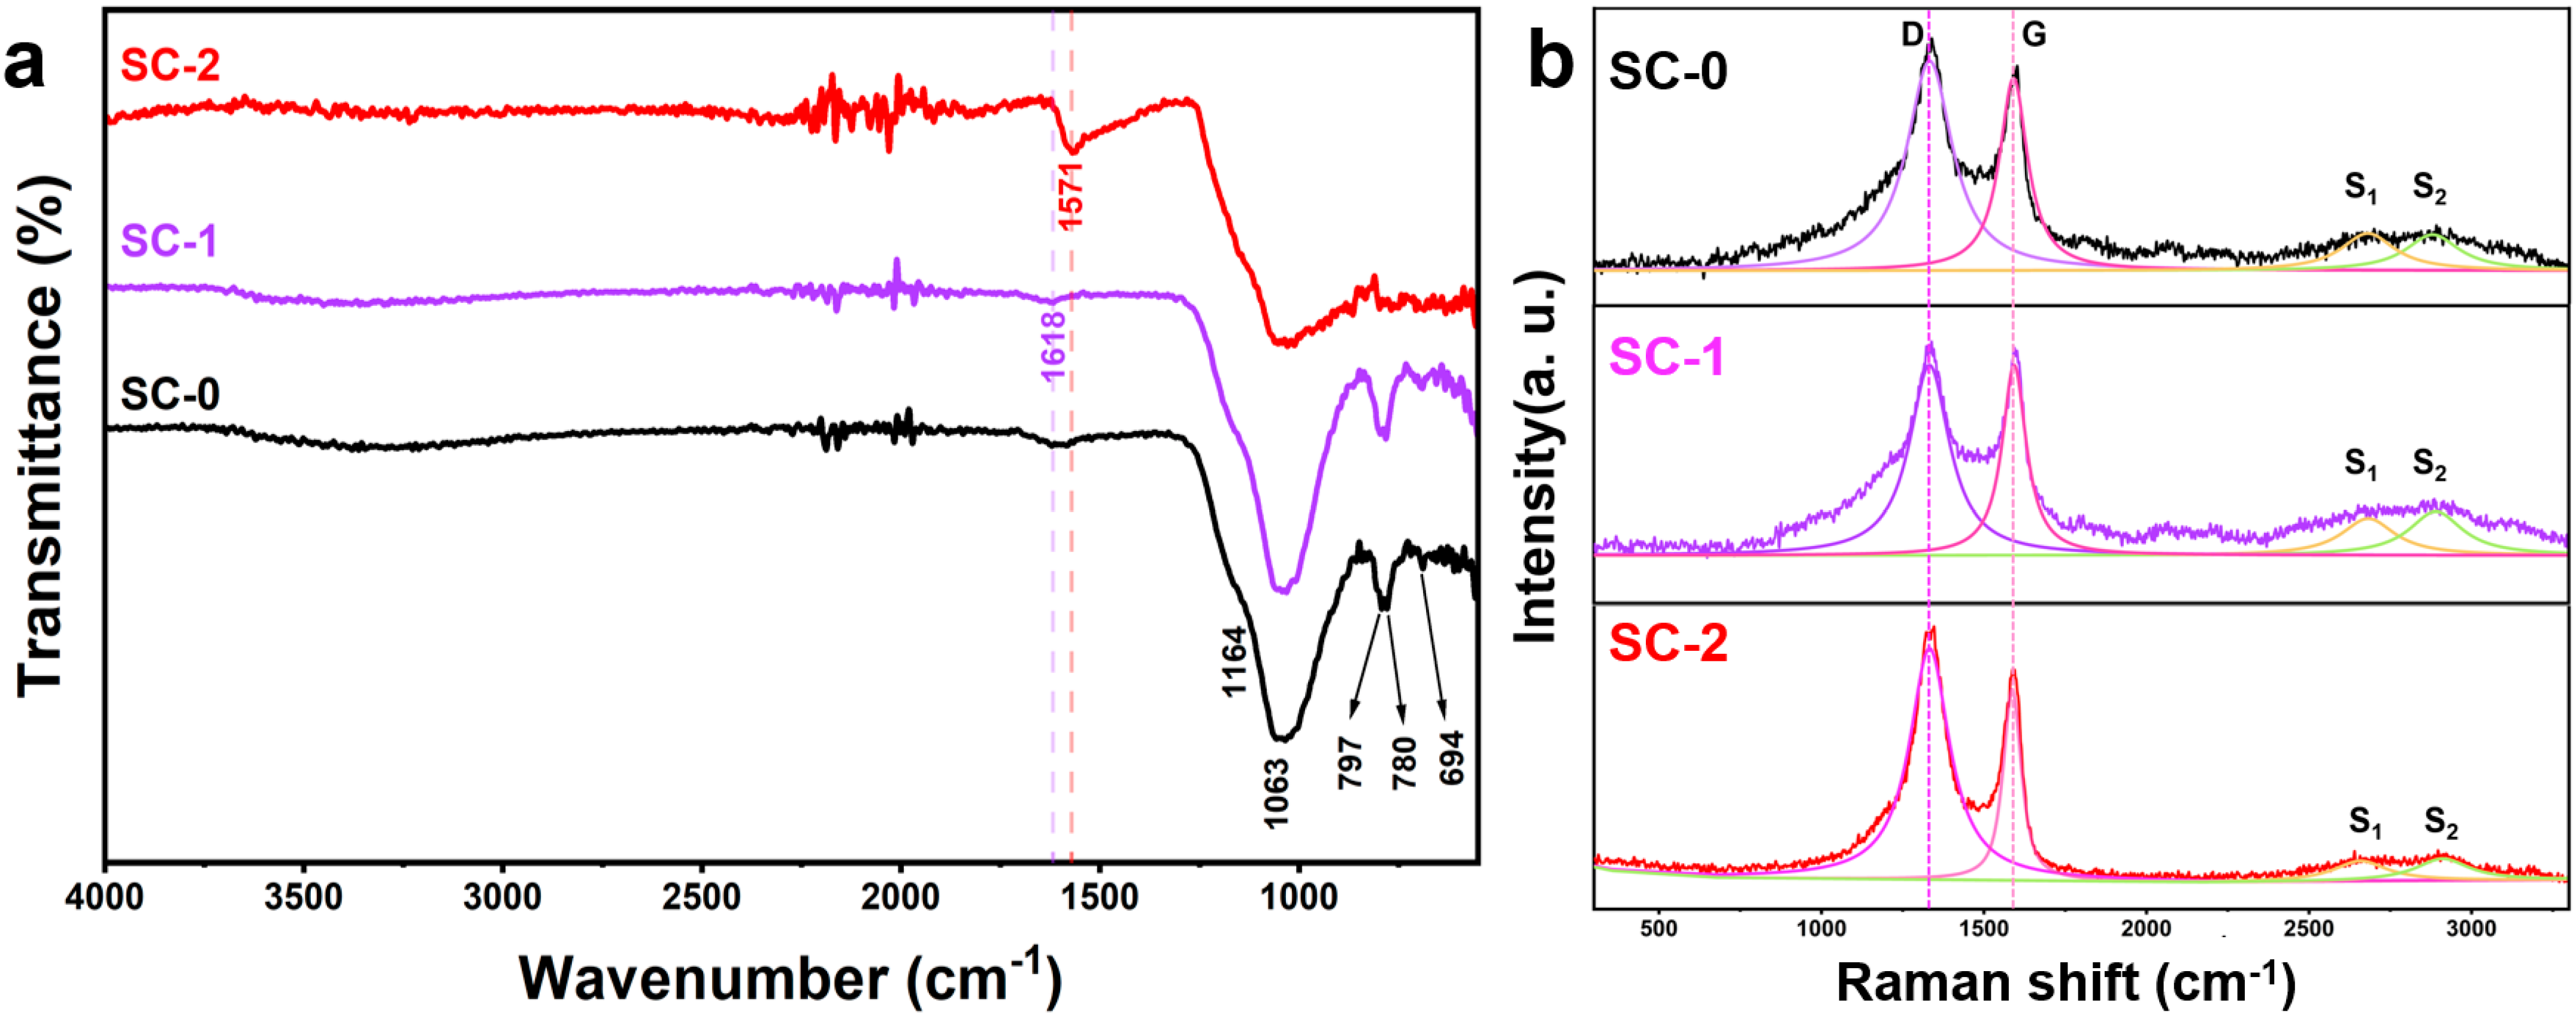
To elucidate carbon speciation evolution, comparative FTIR and Raman analyses were conducted on silicon–carbon ore samples pre- and post-SHMP treatment (Figure 6). Figure 6a illustrates the infrared spectra of the silicon–carbon ore before and after SHMP treatment. In the untreated sample (SC-0), the broad peak near 3300 cm−1 corresponds to the stretching and deformation vibrations of the OH group in adsorbed water within minerals such as pyrophyllite [19]; the peak at 1618 cm−1 is attributed to the C=C stretching vibration of aromatic rings in the graphitic-like carbonaceous material of the silicon–carbon ore [20]; the peak at 1571 cm−1 is attributed to the C-C stretching vibration in carbonaceous substances [1]; the peaks at 1164 cm−1, 1063 cm−1, 797 cm−1, and 780 cm−1 correspond to antisymmetric and symmetric stretching vibrations of SiO2 [21]; the peak at 694 cm−1 represents Al-OH vertical vibration absorption [1]. After SHMP treatment, the SC-1 sample retains the OH group stretching vibration peak near 3300 cm−1, while the SiO2 diffraction peaks at 1164 cm−1, 1063 cm−1, 797 cm−1, and 780 cm−1 become more pronounced, indicating a reduction in carbonaceous substance content and an increase in silica and pyrophyllite mineral content. However, due to the physical separation process, the aromatic ring C=C stretching vibration remains detectable at 1618 cm−1. For the SC-2 sample, with increased carbon content and decreased silica content, the SiO2 and Al-OH absorption peaks weaken, and the OH group stretching vibration peak near 3300 cm−1 disappears. Additionally, a strong C-C stretching vibration peak appears at 1566 cm−1, overshadowing the aromatic ring C=C stretching vibration peak at 1618 cm−1.
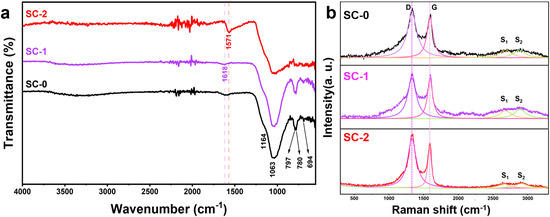
Figure 6.
Infrared spectra (FTIR) of silicon-carbon ore before and after treatment with SHMP (a) and Raman spectra of silicon-carbon ore before and after treatment with SHMP (b).
The Raman spectrum of carbonaceous materials primarily comprises two regions: the first-order region (Raman shift from 1100 cm−1 to 1800 cm−1) and the second-order region (Raman shift from 2500 cm−1 to 3100 cm−1). In the first-order region, the graphite peak (G band) and the disorder peak (D band) are typically observed. The G band, located at approximately 1580 cm−1, corresponds to the in-plane vibration of sp2-hybridized carbon atoms within the graphite layer (E2g mode), indicating the degree of crystallinity of the material [22,23,24,25]. A sharper G band signifies higher crystallinity. The D band arises from breathing modes of carbon atoms associated with structural defects or heteroatoms within the graphite layer (A1g mode) and is commonly split into D1 (around 1350 cm−1) and D2 (around 1620 cm−1). Higher intensity of the D band suggests lower crystallinity and greater disorder in the carbon structure [22]. In the second-order region, peak intensities reflect the three-dimensional ordering of the carbon structure, with common peaks being S1 (approximately 2700 cm−1) and S2 (approximately 2900 cm−1). The S1 peak characterizes the two-dimensional and three-dimensional order of the graphite layer, splitting into two peaks when transitioning from a two-dimensional to a three-dimensional lattice [26,27]. The degree of order in carbonaceous materials is quantified by two parameters: R1 (the height ratio of the D band to the G band) and R2 (the area ratio of the D band relative to the G band). Its calculation formula is as follows [28]:
where D is the peak height of the disordered peak, and G is the peak height of the ordered graphite peak.
Raman spectroscopic analysis revealed structural evolution in silicon–carbon ore upon SHMP treatment (Figure 6b), Besides, we used Labspec6 (6. 4.4.10) software to fit the Raman data using a Gauss–Lorentz function. This analysis yielded detailed parameters for the D, G, S1, and S2 peaks, including their positions, heights, half-widths, and areas, as summarized in Table 4. The untreated sample (SC-0) displayed characteristic first-order D (1342 cm⁻1) and G (1596 cm⁻1) bands with an intensity ratio R1 = 1.05, alongside second-order S1 (2685 cm⁻1) and S2 (2900 cm⁻1) features (R2 = 0.66). Post-SHMP modification, the Raman spectra of samples SC-1 and SC-2 show minimal changes in peak positions for the D, G, S1, and S2 peaks but exhibit significant differences in peak intensity and half-width. Before SHMP treatment, the peak heights of the D and G peaks in the first-order region and the S1 and S2 peaks in the second-order region of SC-0 were 630, 600, 130, and 130, respectively, with corresponding half-widths of 155, 80, 300, and 300. Following SHMP treatment, the peak heights of the D and G peaks in SC-1 increased to 800, while those of the S1 and S2 peaks rose to 200 and 220, respectively. The half-widths of the D and G peaks in the first-order region changed slightly to 150 and 90, whereas the half-widths of the S1 and S2 peaks in the second-order region increased to 300 each. In contrast, the peak heights of the D and G peaks in SC-2 decreased significantly to 370 and 305, respectively, compared to SC-0 and SC-1, while the S1 and S2 peak heights dropped to 35 and 40. Additionally, the half-widths of all peaks in SC-2 narrowed relative to SC-0 and SC-1, with values of 125, 70, 200, and 200 for the D, G, S1, and S2 peaks, respectively. Furthermore, the peak areas obtained from the Gauss–Lorentz fitting were used to calculate the parameters R1 and R2 for the carbonaceous matter, as shown in Table 4. The R1 and R2 values for SC-0 were 1.05 and 0.66, respectively; for SC-1, they were 1.00 and 0.62; and for SC-2, they were 1.78 and 0.68.
Table 4.
Fitting data of Raman spectra of silicon–carbon ore samples.
Spectroscopic characterization (FTIR/Raman) reveals dual-carbon architectures in silicon–carbon ore: a predominant highly disordered amorphous phase (R1 = 2.1) coexisting with minor partially ordered graphitic domains. SHMP treatment induces phase-selective separation through differential surface interactions; the hydrophobic amorphous carbon aggregates via van der Waals forces, enabling efficient segregation from hydrophilic silica. This mechanism explains the enhanced structural disorder in SC-2 carbon concentrate, evidenced by Raman band broadening (FWHM_D increased 25%). Conversely, graphitic components demonstrate residual affinity toward silica surfaces through π-cation interactions with Na⁺, resulting in their partial retention within silicate matrices.
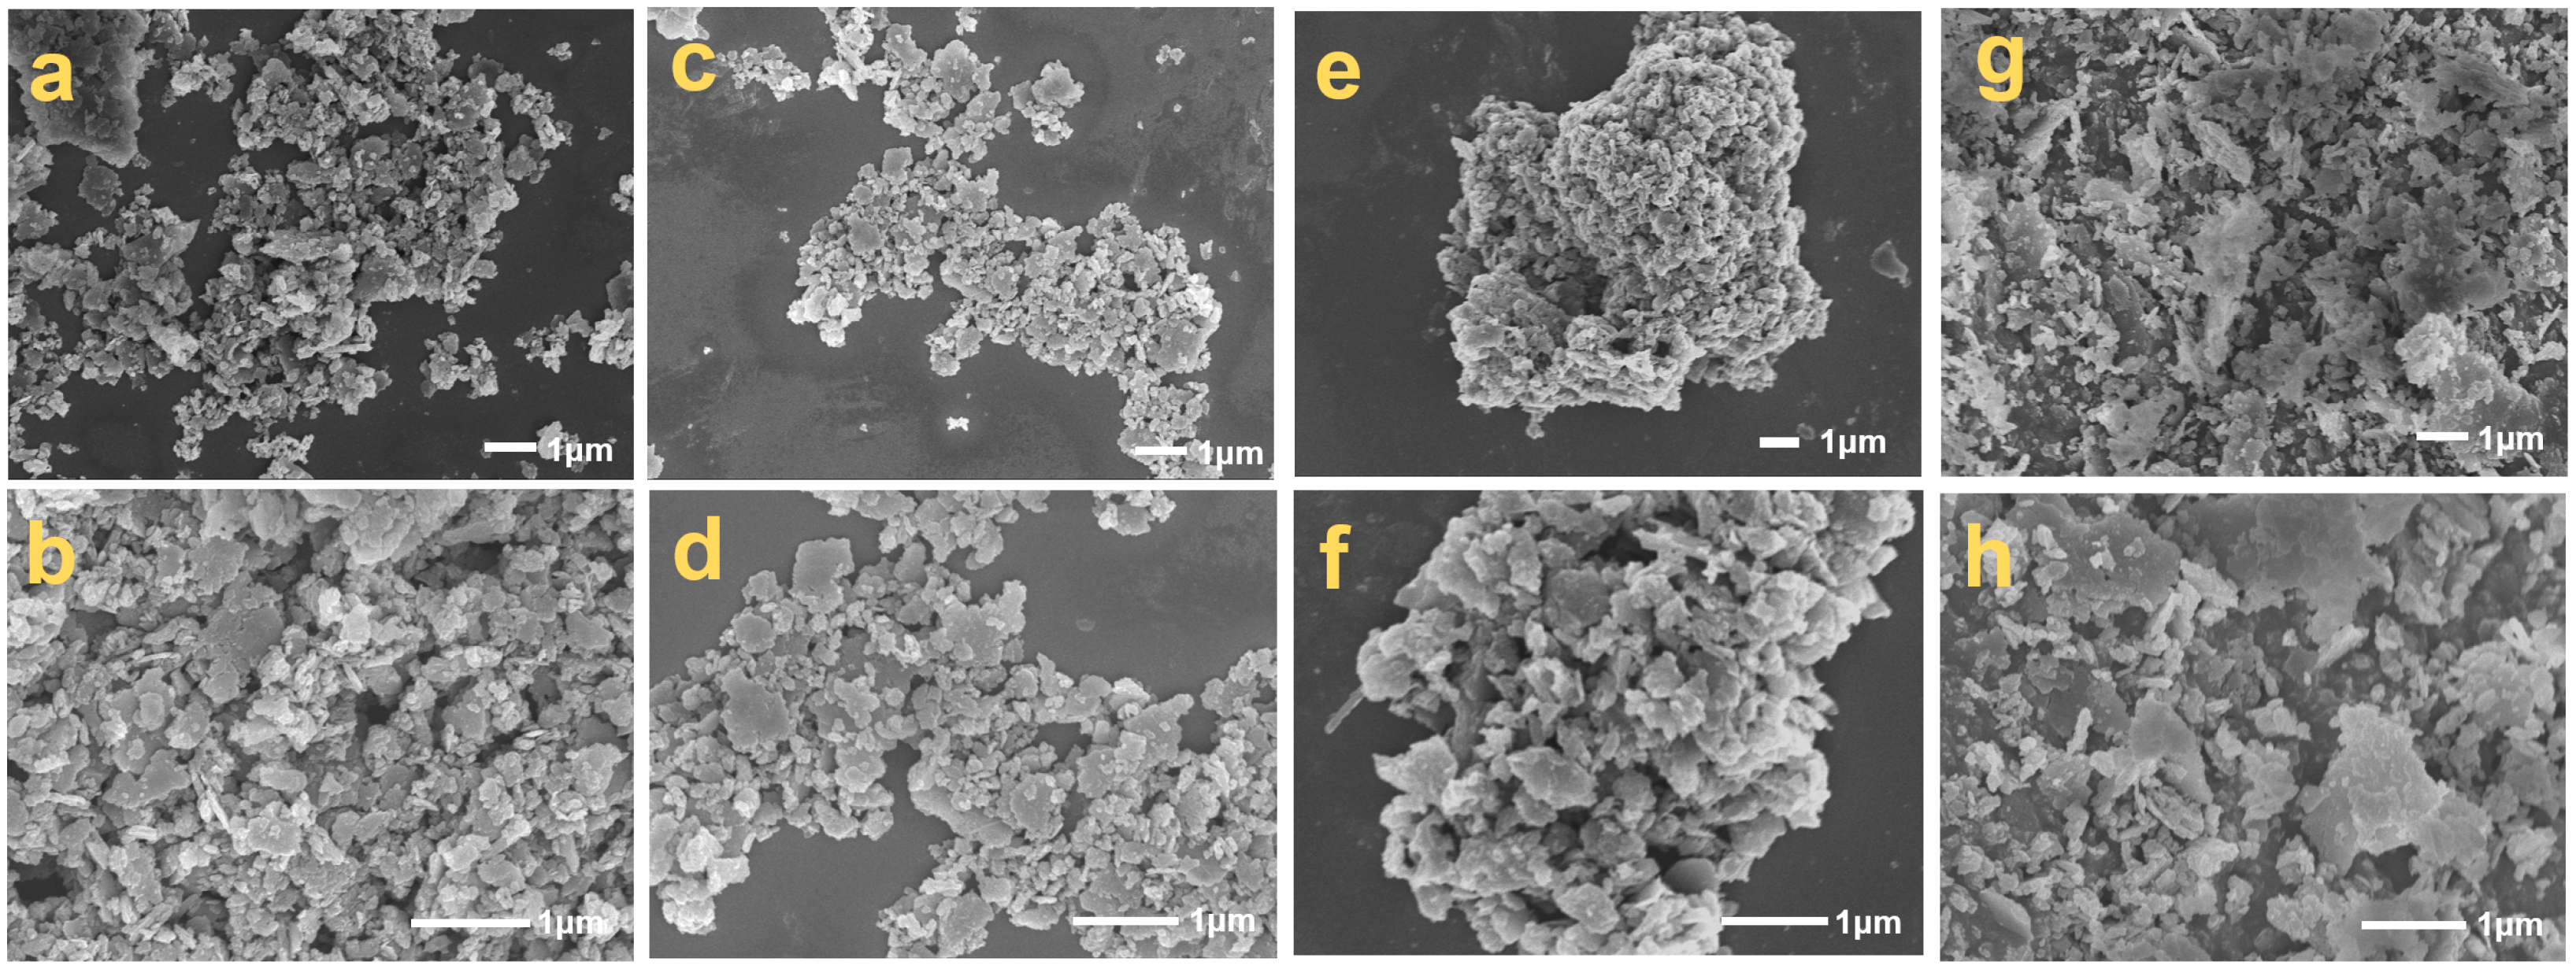
Scanning electron microscopy (SEM) analysis of silicon–carbon ore across treatment stages revealed distinct microstructural transformations (Figure 7). Untreated SC-0 (Figure 7a,b) exhibited a heterogeneous assemblage of 5–20 μm silica platelets, angular carbonaceous particulates (1–5 μm), and carbon-coated fibrous silica structures. SHMP processing induced progressive phase segregation: SC-1 (Figure 7c,d) displayed reduced silica platelet dimensions (2–8 μm) with a diminished angular carbon content, while SC-2 (Figure 7e,f) transitioned to dominant 10–50 μm carbon agglomerates through hydrophobic coalescence. Post-calcination analysis confirmed the core–shell architecture of fibrous particles, featuring silica cores enveloped by graphitic carbon sheaths, with calcination-induced fiber slenderness (Figure 7g,h) [1]. XRF-SEM correlation demonstrated SHMP’s separation efficacy through platelet depletion, carbon enrichment, and fibrous phase refinement, validating the dual mechanism of surface charge modulation (−29.3 mV ζ-potential shift) and hydrophobicity-driven carbon aggregation. This microstructural evolution underscores the precision of SHMP-mediated beneficiation in achieving component-specific liberation while preserving inherent carbon architectures.

Figure 7.
SEM images of silicon–carbon ore before and after SHMP treatment ((a,b) SC-0; (c,d) SC-1; (e,f) SC-2; (g,h) SC-0 after being calcined).
To further explore the existing form of carbonaceous matter, TEM tests were conducted on SC-0 and SC-2. Figure 8 shows the TEM morphology of SC-0. From the elemental distribution, the silicon in silica and carbonaceous matter are randomly distributed. As can be seen from Figure 8a–c, SC-0 contains blocky particles and a large number of rod-like substances. The surface of phytoliths is wrapped in carbonaceous matter, and the interior presents a regular crystal structure. Combined with previous studies [1], these rod-like substances are considered to be phytoliths. In addition, from Figure 8c, it can be seen that there is also a large amount of amorphous carbon around the phytoliths.
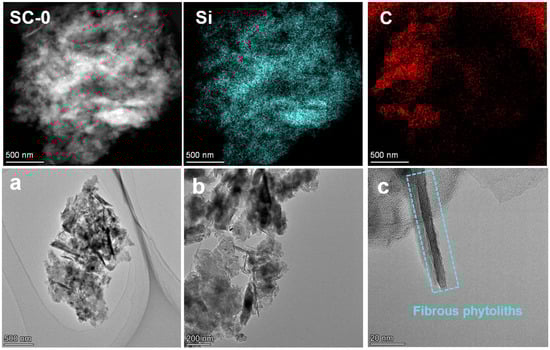
Figure 8.
TEM images of silicon–carbon ore before SHMP treatment ((a–c). Morphological characterization images of the SC-0 sample at different magnifications under a transmission electron microscope).
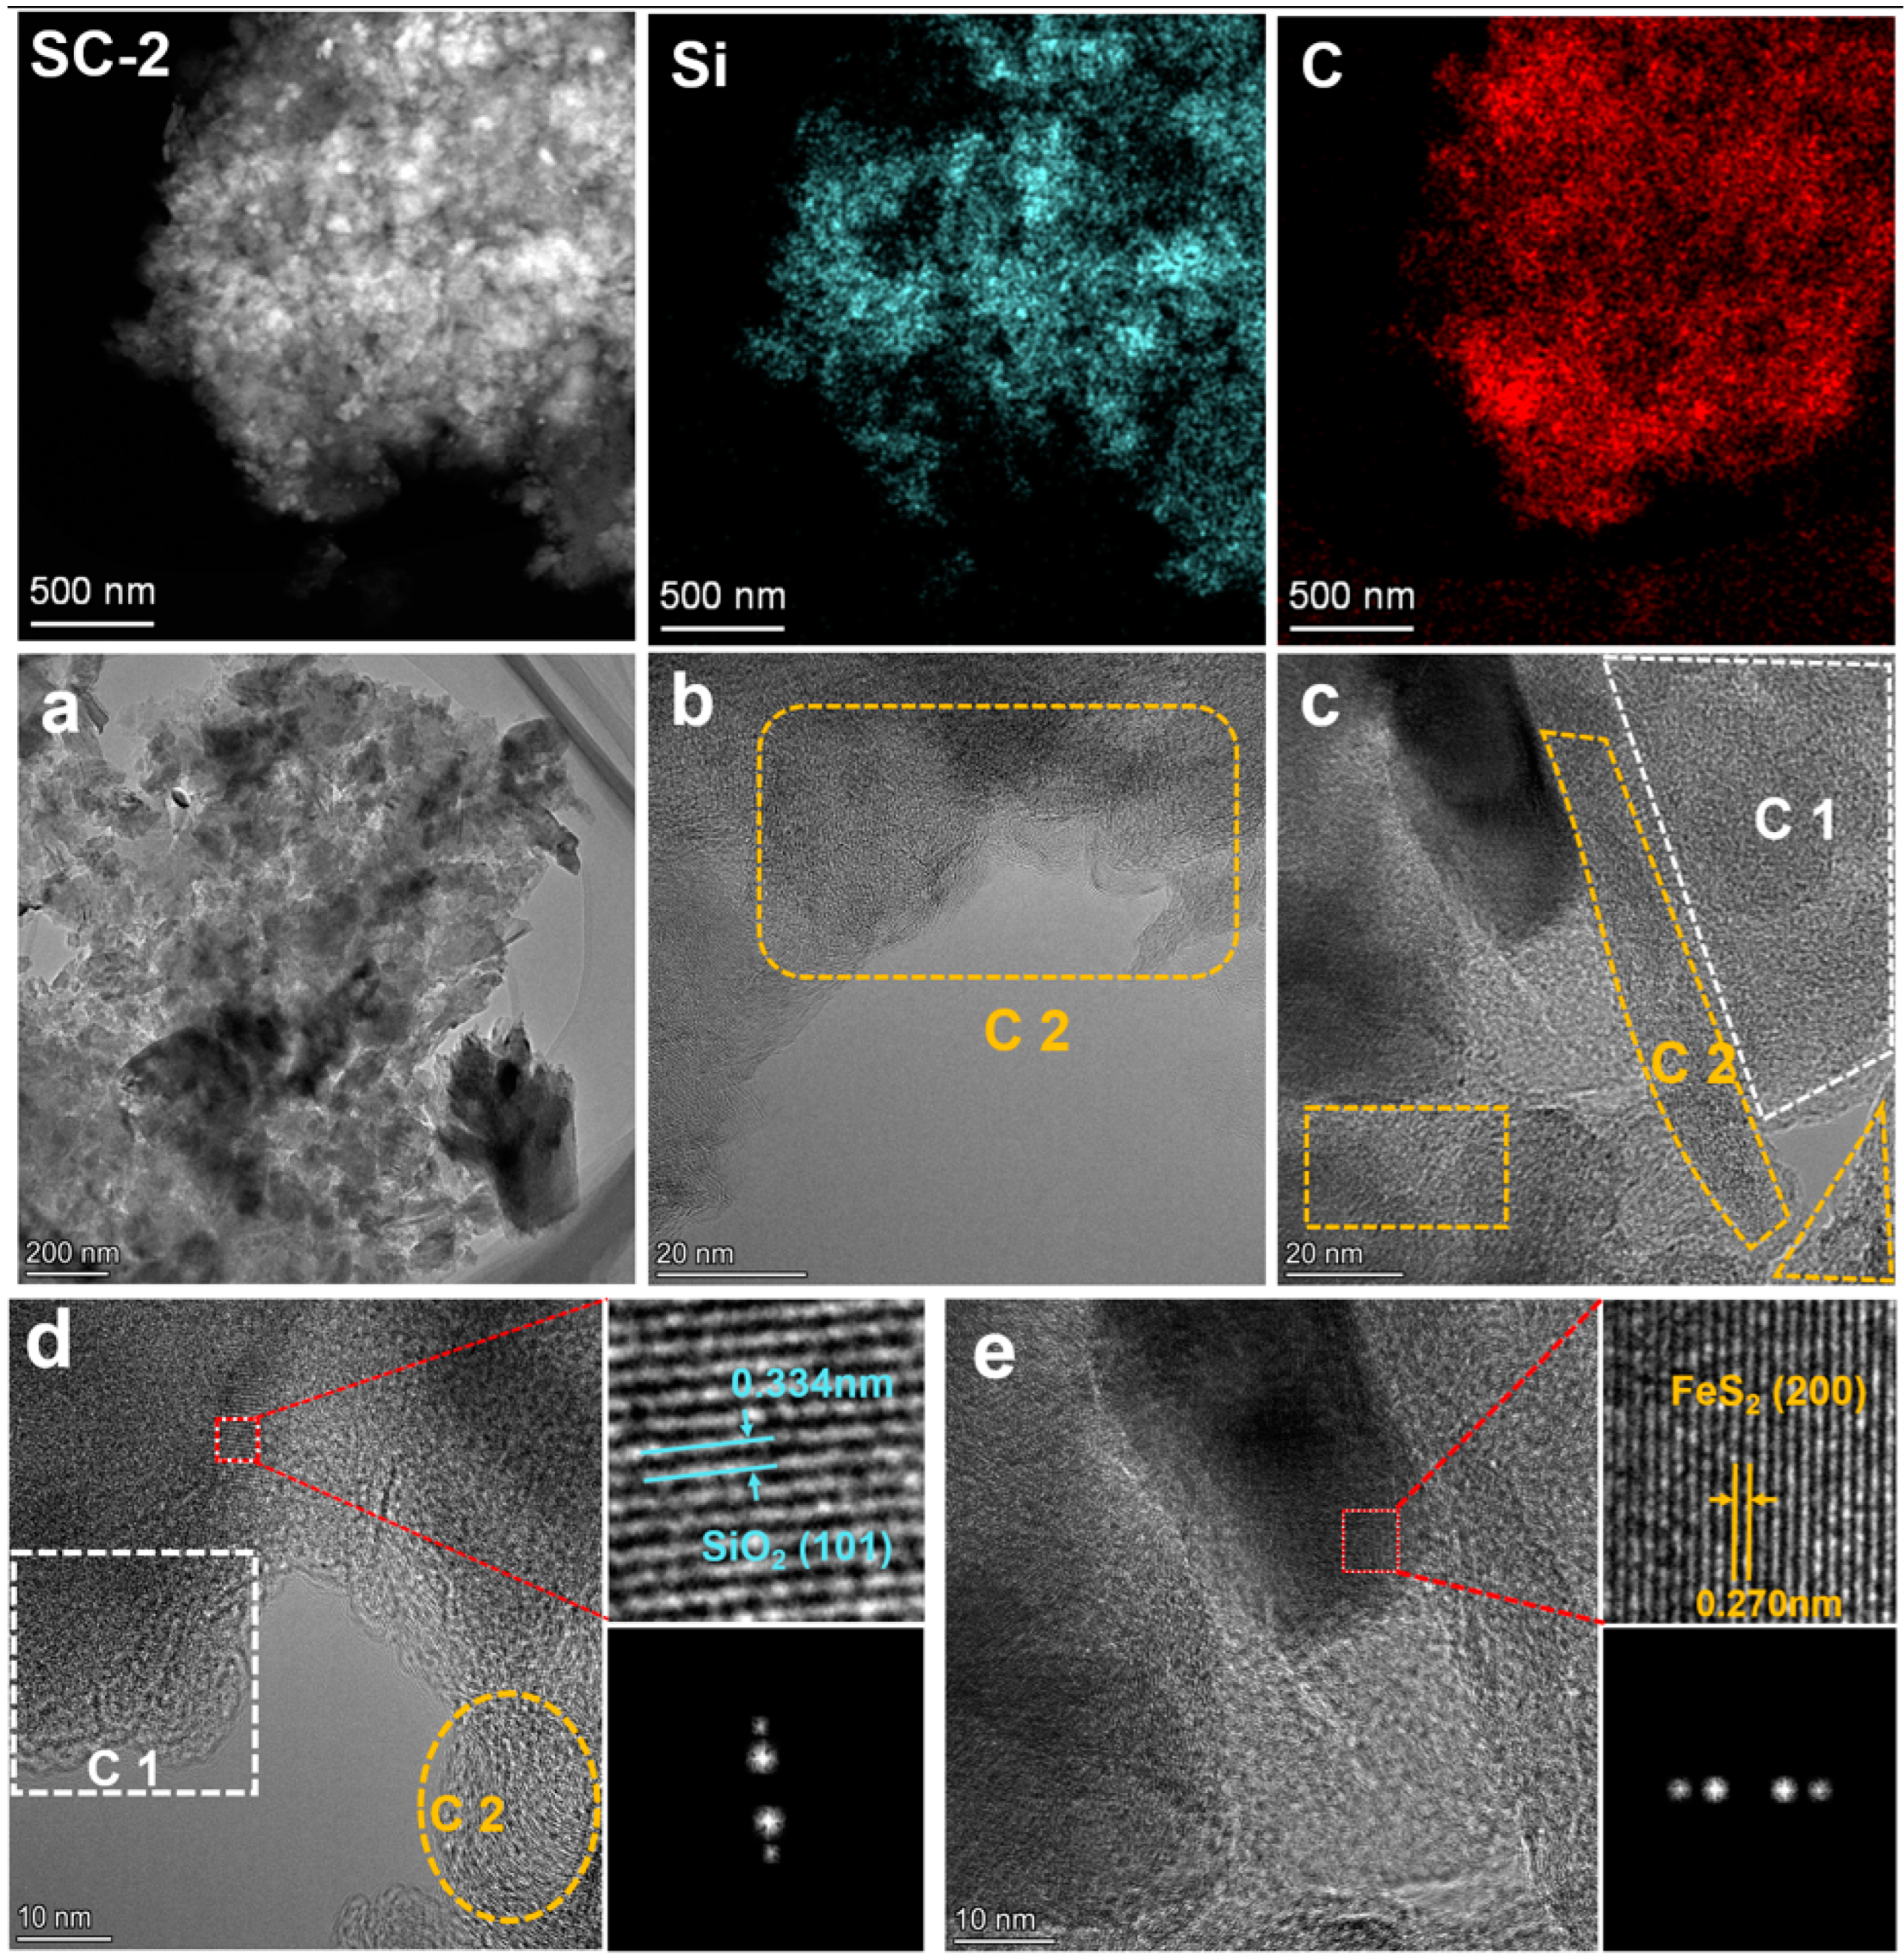
Figure 9 shows the TEM morphology of SC-2. From the perspective of elemental distribution, there is no significant difference compared with SC-0. Notably, in SC-2, the rod-shaped phytoliths decrease, and mainly angular particles are present (Figure 9a), which is consistent with the SEM results. Combining Figure 9b–e, it can be found that there are two types of carbonaceous substances in the silicon–carbon ore: one is C1 with a high degree of amorphization, which is derived from the evolution of animal and plant sedimentary fossils; the other is C2 with a graphite-like structure, which is formed by the gradual graphitization of C1 [29,30]. This result is consistent with the analysis results of total organic carbon (TOC), infrared spectroscopy, and Raman spectroscopy.

Figure 9.
TEM image of silicon–carbon ore sample after SHMP treatment ((a–e). Morphological characterization images of the SC-2 sample at different magnifications under a transmission electron microscope).
3.3. Textural Analysis of Carbonaceous in Silicon–Carbon Ore and Its Application Prospects
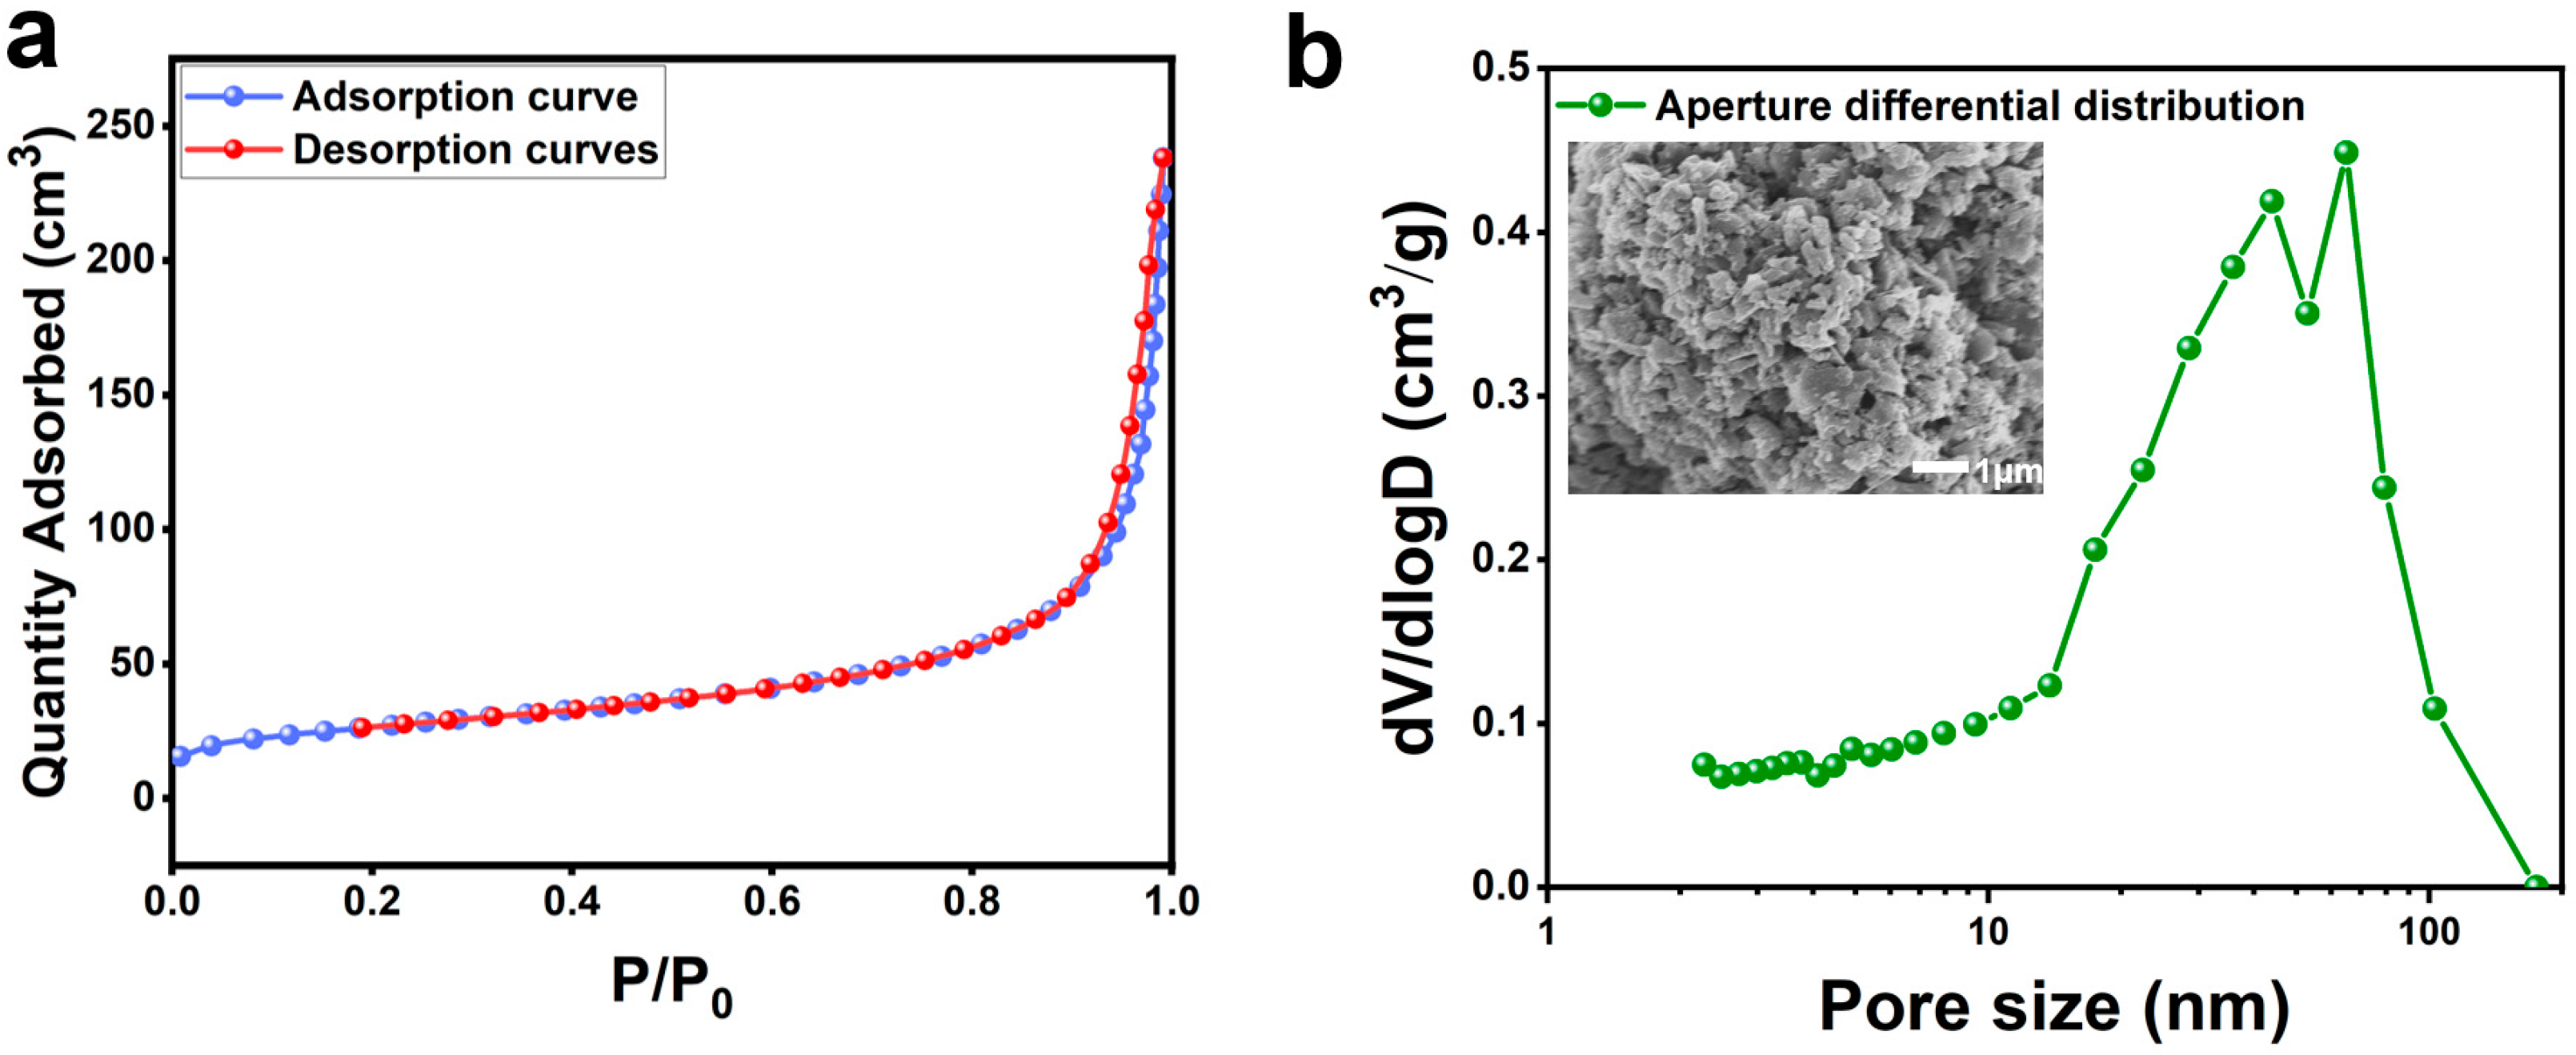
To further explore the potential applications of carbonaceous matter in silicon carbide ore, we conducted BET analysis on SC-2 and results are shown in Table 5. The results revealed that SC-2 has a specific surface area of 92 m2/g, a total adsorption pore volume of 0.35 m3/g, and the average adsorption pore diameter of the material is 15.28 nm.
Table 5.
The BET test results of SC-2.
Figure 10a show the nitrogen adsorption–desorption isotherm of SC-2, which exhibits a typical type II characteristic, indicating a mesoporous material with non-uniform pore diameters. Figure 10b presents the pore size distribution curve of the carbonaceous matter in SC-2, showing pore diameters primarily distributed between 10 and 100 nm, which indicates that SC-2 has an amorphous and irregular pore structure. The initial specific surface area of the carbonaceous material in the silicon–carbon ores was 92 m2/g, which is considered relatively low according to research reports and primarily restricted to adsorption applications [31]. Despite this, the carbonaceous matter in silicon–carbon ores possesses a rich pore structure. If subjected to subsequent nano-grinding and activation treatments to enhance its specific surface area and improve its pore structure, this carbonaceous matter could potentially find applications in adsorption, catalysis, and even capacitor fields.
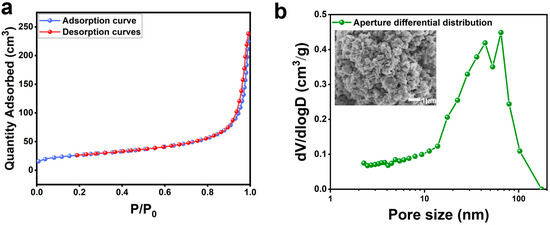
Figure 10.
The adsorption–desorption isotherm (a) and pore size distribution curve (b) of SC-2.
4. Conclusions
Sodium hexametaphosphate (SHMP) enabled dual interfacial control in silicon–carbon slurries: (1) silica activation: SHMP bonding elevated surface charge (ζ: −4→−29.1 mV), optimizing hydrophilic dispersion; (2) carbon coalescence: hydrophobicity and weak repulsion drove particle aggregation, yielding 60% carbon recovery. The methodology combines rapid processing with environmental advantages, establishing a sustainable paradigm for complex ore valorization.
Multimodal characterization (FTIR, Raman, TEM) revealed dual-carbon architectures in silicon–carbon ore: the carbonaceous matter exists predominantly as amorphous carbon (ID/IG = 1.78) and contains two functional groups, and TEM images disclose a dual-phase carbon architecture. The carbonaceous matter consists of a highly disordered amorphous carbon network, while localized domains exhibit short-range graphitic ordering with interfacial lattice fringes.
The carbonaceous component in silicon–carbon ore exhibits moderate surface activity (BET SSA: 92 m2/g), comparable to unprocessed biochar but significantly lower than that of commercial activated carbon (500–1500 m2/g). While currently suitable for macromolecular adsorption, post-treatment such as KOH and ball-milling activation, Hierarchical pore design, and Doping could unlock advanced applications in adsorption, catalysis, and even capacitor fields.
Author Contributions
Conceptualization, X.W. and G.D.; methodology, X.X. and G.D.; software, X.X. and S.S.; validation, X.X., S.S. and H.S.; formal analysis, X.X. and H.S.; investigation, X.X. and G.D.; resources, G.D., J.W. and X.W.; data curation, G.D. and X.W.; writing—original draft preparation, X.X. and H.S.; writing—review and editing, X.X., G.D., X.W., J.W. and H.S.; visualization, X.X. and S.S.; supervision, G.D., X.W. and J.W.; project administration, G.D. and J.W.; funding acquisition, G.D. and X.W. All authors have read and agreed to the published version of the manuscript.
Funding
This research was funded by the Jiangxi Geological Exploration Fund Project under grant number 20220015.
Data Availability Statement
The original contributions presented in this study are included in the article. Further inquiries can be directed to the corresponding author.
Acknowledgments
The authors thank their team members for the valuable discussions and advice.
Conflicts of Interest
The author Gaoxiang Du was employed by the company Beijing Yiyi Star Technology Co., Ltd., Beijing, and the author Xianguang Wang is come from Jiangxi Mineral Resources Guarantee Service Center. The authors Gaoxiang Du and Xianguang Wang declare no conflicts of interest. The all authors declare that the research was conducted in the absence of any commercial or financial relationships that could be construed as a potential conflict of interest. The other authors declare that they have no conflicts of interest.
References
- Tang, S.W.; Shuai, H.; Zhao, R.T.; Du, G.X.; Wang, X.G.; Wang, J. Process Mineralogy of Micro/Nano Silicon-Carbon Ore Obtained from Jiangxi, China. Minerals 2022, 12, 700. [Google Scholar] [CrossRef]
- Kowalczuk, P.B.; Zaleska, E.; Danczak, O. Flotation of carbonaceous copper shale-quartz mixture with poly(ethylene glycol) alkyl ethers. Trans. Nonferrous Met. Soc. China 2015, 25, 314–318. [Google Scholar] [CrossRef]
- Reis, M.; Machado, M.J.C. An ultrasonic method for the separation of carbonaceous material from schists for the determination of graphitization degree by x-ray-diffraction. Chem. Geol. 1992, 100, 191–199. [Google Scholar]
- Wang, Y.; Chen, X.; Hu, Y.; Lan, Y. Influences of phosphates on dispersion of fine alumin-silicate minerals. J. Cent. South Univ. Sci. Technol. 2007, 38, 238–244. [Google Scholar]
- Liu, C.P.; Wang, W.Q.; Sun, J.R.; Liu, L. Effect of sodium hexametaphosphate on the separation of fine quartz-magnetite by magnetic separation: A study of dispersion properties and mechanism. Sep. Purif. Technol. 2025, 359, 130352. [Google Scholar] [CrossRef]
- Zhang, H.Q.; Zhou, F.; Yu, H.; Liu, M.X. Double roles of sodium hexametaphosphate in the flotation of dolomite from apatite. Colloid Surf. A-Physicochem. Eng. Asp. 2021, 626, 127080. [Google Scholar] [CrossRef]
- Gaffney, T.R. Porous solids for air separation. Curr. Opin. Solid State Mater. Sci. 1996, 1, 69–75. [Google Scholar] [CrossRef]
- Liang, C.; Li, Z.; Dai, S. Mesoporous Carbon Materials: Synthesis and Modification. Angew. Chem. Int. Ed. 2008, 47, 3696–3717. [Google Scholar] [CrossRef]
- Ma, T.-Y.; Liu, L.; Yuan, Z.-Y. Direct synthesis of ordered mesoporous carbons. Chem. Soc. Rev. 2013, 42, 3977–4003. [Google Scholar] [CrossRef]
- Wang, Y.; Li, Z.H.; Wang, J.; Li, J.H.; Lin, Y.H. Graphene and graphene oxide: Biofunctionalization and applications in biotechnology. Trends Biotechnol. 2011, 29, 205–212. [Google Scholar] [CrossRef]
- Hu, Z.; Srinivasan, M.P. Mesoporous high-surface-area activated carbon. Microporous Mesoporous Mater. 2001, 43, 267–275. [Google Scholar] [CrossRef]
- Biener, J.; Stadermann, M.; Suss, M.; Worsley, M.A.; Biener, M.M.; Rose, K.A.; Baumann, T.F. Advanced carbon aerogels for energy applications. Energy Environ. Sci. 2011, 4, 656–667. [Google Scholar] [CrossRef]
- Liu, B.; Liu, L.; Yu, Y.; Zhang, Y.; Chen, A. Synthesis of mesoporous carbon with tunable pore size for supercapacitors. New J. Chem. 2020, 44, 1036–1044. [Google Scholar] [CrossRef]
- Zhao, P.; Wang, L.; Sun, C.; Jiang, T.; Zhang, J.; Zhang, Q.; Sun, J.; Deng, Y.; Wang, S. Uniform mesoporous carbon as a carrier for poorly water soluble drug and its cytotoxicity study. Eur. J. Pharm. Biopharm. 2012, 80, 535–543. [Google Scholar] [CrossRef] [PubMed]
- Yang, S.Q.; Luo, X.P.; Zhou, H.P.; Tang, X.K.; Liu, Z.S.; Guo, J.F.; Shen, L.Y. Effect of sodium hexametaphosphate on the flotation separation of lepidolite and quartz: MD study. Physicochem. Probl. Miner. Process. 2024, 60, 192882. [Google Scholar] [CrossRef]
- Rish, S.K.; Tahmasebi, A.; Yu, J.L. A DSC study on the impact of low-temperature oxidation on the behavior and drying of water in lignite. J. Therm. Anal. Calorim. 2020, 139, 3507–3517. [Google Scholar] [CrossRef]
- Wang, Q.; Wang, G.W.; Zhang, J.L.; Le, J.Y.; Wang, H.Y.; Wang, C. Combustion behaviors and kinetics analysis of coal, biomass and plastic. Thermochim. Acta 2018, 669, 140–148. [Google Scholar] [CrossRef]
- Cheng, X.J.; Shi, L.; Liu, Q.Y.; Liu, Z.Y. Heat effects of pyrolysis of 15 acid washed coals in a DSC/TGA-MS system. Fuel 2020, 268, 117325. [Google Scholar] [CrossRef]
- Huang, H.Y.; Liu, J.Y.; Liu, H.; Evrendilek, F.; Buyukada, M. Pyrolysis of water hyacinth biomass parts: Bioenergy, gas emissions, and by-products using TG-FTIR and Py-GC/MS analyses. Energy Convers. Manag. 2020, 207, 112552. [Google Scholar] [CrossRef]
- Tucureanu, V.; Matei, A.; Avram, A.M. FTIR Spectroscopy for Carbon Family Study. Crit. Rev. Anal. Chem. 2016, 46, 502–520. [Google Scholar] [CrossRef]
- Farias, T.M.B.; Gennari, R.F.; Chubaci, J.F.D.; Watanabe, S. FTIR spectra and TL properties of quartz annealed at high temperatures. In Proceedings of the International Conference on Luminescence and Optical Spectroscopy of Condensed Matter (ICL’08), Lyon, France, 7–11 July 2008; pp. 493–496. [Google Scholar]
- Ohtomo, Y.; Kakegawa, T.; Ishida, A.; Nagase, T.; Rosing, M.T. Evidence for biogenic graphite in early Archaean Isua metasedimentary rocks. Nat. Geosci. 2014, 7, 25–28. [Google Scholar] [CrossRef]
- Hu, S.Y.; Evans, K.; Craw, D.; Rempel, K.; Bourdet, J.; Dick, J.; Grice, K. Raman characterization of carbonaceous material in the Macraes orogenic gold deposit and metasedimentary host rocks, New Zealand. Ore Geol. Rev. 2015, 70, 80–95. [Google Scholar] [CrossRef]
- Henry, D.G.; Jarvis, I.; Gillmore, G.; Stephenson, M. Raman spectroscopy as a tool to determine the thermal maturity of organic matter: Application to sedimentary, metamorphic and structural geology. Earth Sci. Rev. 2019, 198, 102936. [Google Scholar] [CrossRef]
- Beyssac, O.; Goffé, B.; Petitet, J.P.; Froigneux, E.; Moreau, M.; Rouzaud, J.N. On the characterization of disordered and heterogeneous carbonaceous materials by Raman spectroscopy. Spectroc. Acta A Molec. Biomolec. Spectr. 2003, 59, 2267–2276. [Google Scholar] [CrossRef]
- Wopenka, B.; Pasteris, J.D. Structural characterization of kerogens to granulite-facies graphite: Applicability of Raman microprobe spectroscopy. Am. Mineral. 1993, 78, 533–557. [Google Scholar]
- Lespade, P.; Marchand, A.; Couzi, M.; Cruege, F. Caracterisation de materiaux carbones par microspectrometrie Raman. Carbon 1984, 22, 375–385. [Google Scholar] [CrossRef]
- Tuinstra, F.; Koenig, J.L. Raman Spectrum of Graphite. J. Chem. Phys. 1970, 53, 1126–1130. [Google Scholar] [CrossRef]
- Li, K.; Liu, Q.F.; Cheng, H.F.; Hu, M.S.; Zhang, S. Classification and carbon structural transformation from anthracite to natural coaly graphite by XRD, Raman spectroscopy, and HRTEM (vol 249, 119286, 2021). Spectroc. Acta A Molec. Biomolec. Spectr. 2023, 303, 123247. [Google Scholar] [CrossRef]
- Li, K.; Zhang, H.; Wu, Y.T.; Hu, M.S.; Liu, Q.F. Graphite microcrystals growth in naturally graphitized coal from Hunan, China. J. Cryst. Growth 2022, 582, 126530. [Google Scholar] [CrossRef]
- Fan, Q.W.; Song, C.Y.; Fu, P. Advances in the improvement of the quality and efficiency of biomass-derived porous carbon: A comprehensive review on synthesis strategies and heteroatom doping effects. J. Clean Prod. 2024, 452, 142169. [Google Scholar] [CrossRef]


Disclaimer/Publisher’s Note: The statements, opinions and data contained in all publications are solely those of the individual author(s) and contributor(s) and not of MDPI and/or the editor(s). MDPI and/or the editor(s) disclaim responsibility for any injury to people or property resulting from any ideas, methods, instructions or products referred to in the content. |
© 2025 by the authors. Licensee MDPI, Basel, Switzerland. This article is an open access article distributed under the terms and conditions of the Creative Commons Attribution (CC BY) license (https://creativecommons.org/licenses/by/4.0/).