Article

Geophysics and Geochemistry Reveal the Formation Mechanism of the Kahui Geothermal Field in Western Sichuan, China

1
School of Geophysics and Information Technology, China University of Geosciences, Beijing 100083, China
2
Tianjin Geothermal Exploration and Development-Designing Institute, Tianjin 300250, China
3
Observation and Research Station of Tianjin Low-Medium Temperature Geothermal Resources, Ministry of Natural Resources, Tianjin 300250, China
4
Yalong River Hydropower Development Company, Chengdu 610051, China
*
Author to whom correspondence should be addressed.
Minerals 2025, 15(4), 339; https://doi.org/10.3390/min15040339
Submission received: 8 February 2025 / Revised: 4 March 2025 / Accepted: 21 March 2025 / Published: 25 March 2025

Abstract

:
This study investigated the formation mechanism of the Kahui Geothermal Field in Western Sichuan, China, using geophysical and geochemical approaches to elucidate its geological structure and geothermal origins. This study employed a combination of 2D and 3D inversion techniques involved in natural electromagnetic methods (magnetotelluric, MT, and audio magnetotelluric, AMT) along with the analysis of hydrogeochemical samples to achieve a comprehensive understanding of the geothermal system. Geophysical inversion revealed a three-layer resistivity structure within the upper 2.5 km of the study area. A geological interpretation was conducted on the resistivity structure model, identifying two faults, the Litang Fault and the Kahui Fault. The analysis suggested that the shallow part of the Kahui Geothermal Field is controlled by the Kahui Fault. Hydrochemical analysis showed that the water chemistry of the Kahui Geothermal Field is of the HCO3−Na type, primarily sourced from atmospheric precipitation. The deep heat source of the Kahui Geothermal Field was attributed to the partial melting of the middle crust, driven by the upwelling of mantle fluids. This process provides the necessary thermal energy for the geothermal system. Atmospheric precipitation infiltrates through tectonic fractures, undergoes deep circulation and heating, and interacts with the host rocks. The heated fluids then rise along faults and mix with shallow cold water, ultimately emerging as hot springs.

1. Introduction

In recent years, the growing global emphasis on environmental protection, combined with the increasing complexity of the international fossil fuel situation, has driven a rapid increase in the demand for renewable energy sources [1,2,3]. Among these, geothermal energy has garnered significant attention for its ability to provide a stable and low carbon energy supply. This is particularly relevant in regions such as the eastern margin of the Tibetan Plateau, where intense tectonic activity and high heat flow values make it an ideal area for geothermal resource exploration.
The eastern margin of the Tibetan Plateau, located at the junction of the Yangtze Block, Songpan–Ganzi Block, Sichuan–Yunnan Block, and Qiangtang Block, was one of the most tectonically active regions in China during the Cenozoic era [4,5]. The continuous collision between the Indian and Eurasian plates has led to crustal thickening and a significant increase in heat flow values in this area [6]. Against this backdrop of high heat flow, the presence of numerous geothermal manifestations—such as boiling springs, geysers, and fumaroles—highlights the region’s vast potential for geothermal resource development. Notably, hydrothermal activity in the eastern margin of the Tibetan Plateau is predominantly concentrated along major fault zones, including the Xianshuihe Fault Zone, the Jinsha River Fault Zone, and the Ganzi–Litang Fault Zone [7]. Research indicates that geothermal fluids migrate laterally and vertically through faults or fractures. The fracture network, characterized by high permeability, serves as the primary conduit for fluid transport. For instance, in the Taupo Volcanic Zone of New Zealand, the geothermal system utilizes fault zones to convey deep seated hydrothermal fluids to hot springs several kilometers away from the source [8]. In the Reykjanes geothermal field of Iceland, fluids ascend from the deep magma chamber through high angle faults, ultimately forming high-temperature hot springs [9]. Fractures of different scales dominate fluid diffusion at both macroscopic and local levels. Microfractures (<1 mm) govern local fluid diffusion, while macroscopic fractures (>1 m) provide long distance migration pathways. For example, steam production in the Geysers geothermal field of the United States relies on the connectivity of multiscale fracture networks [10].
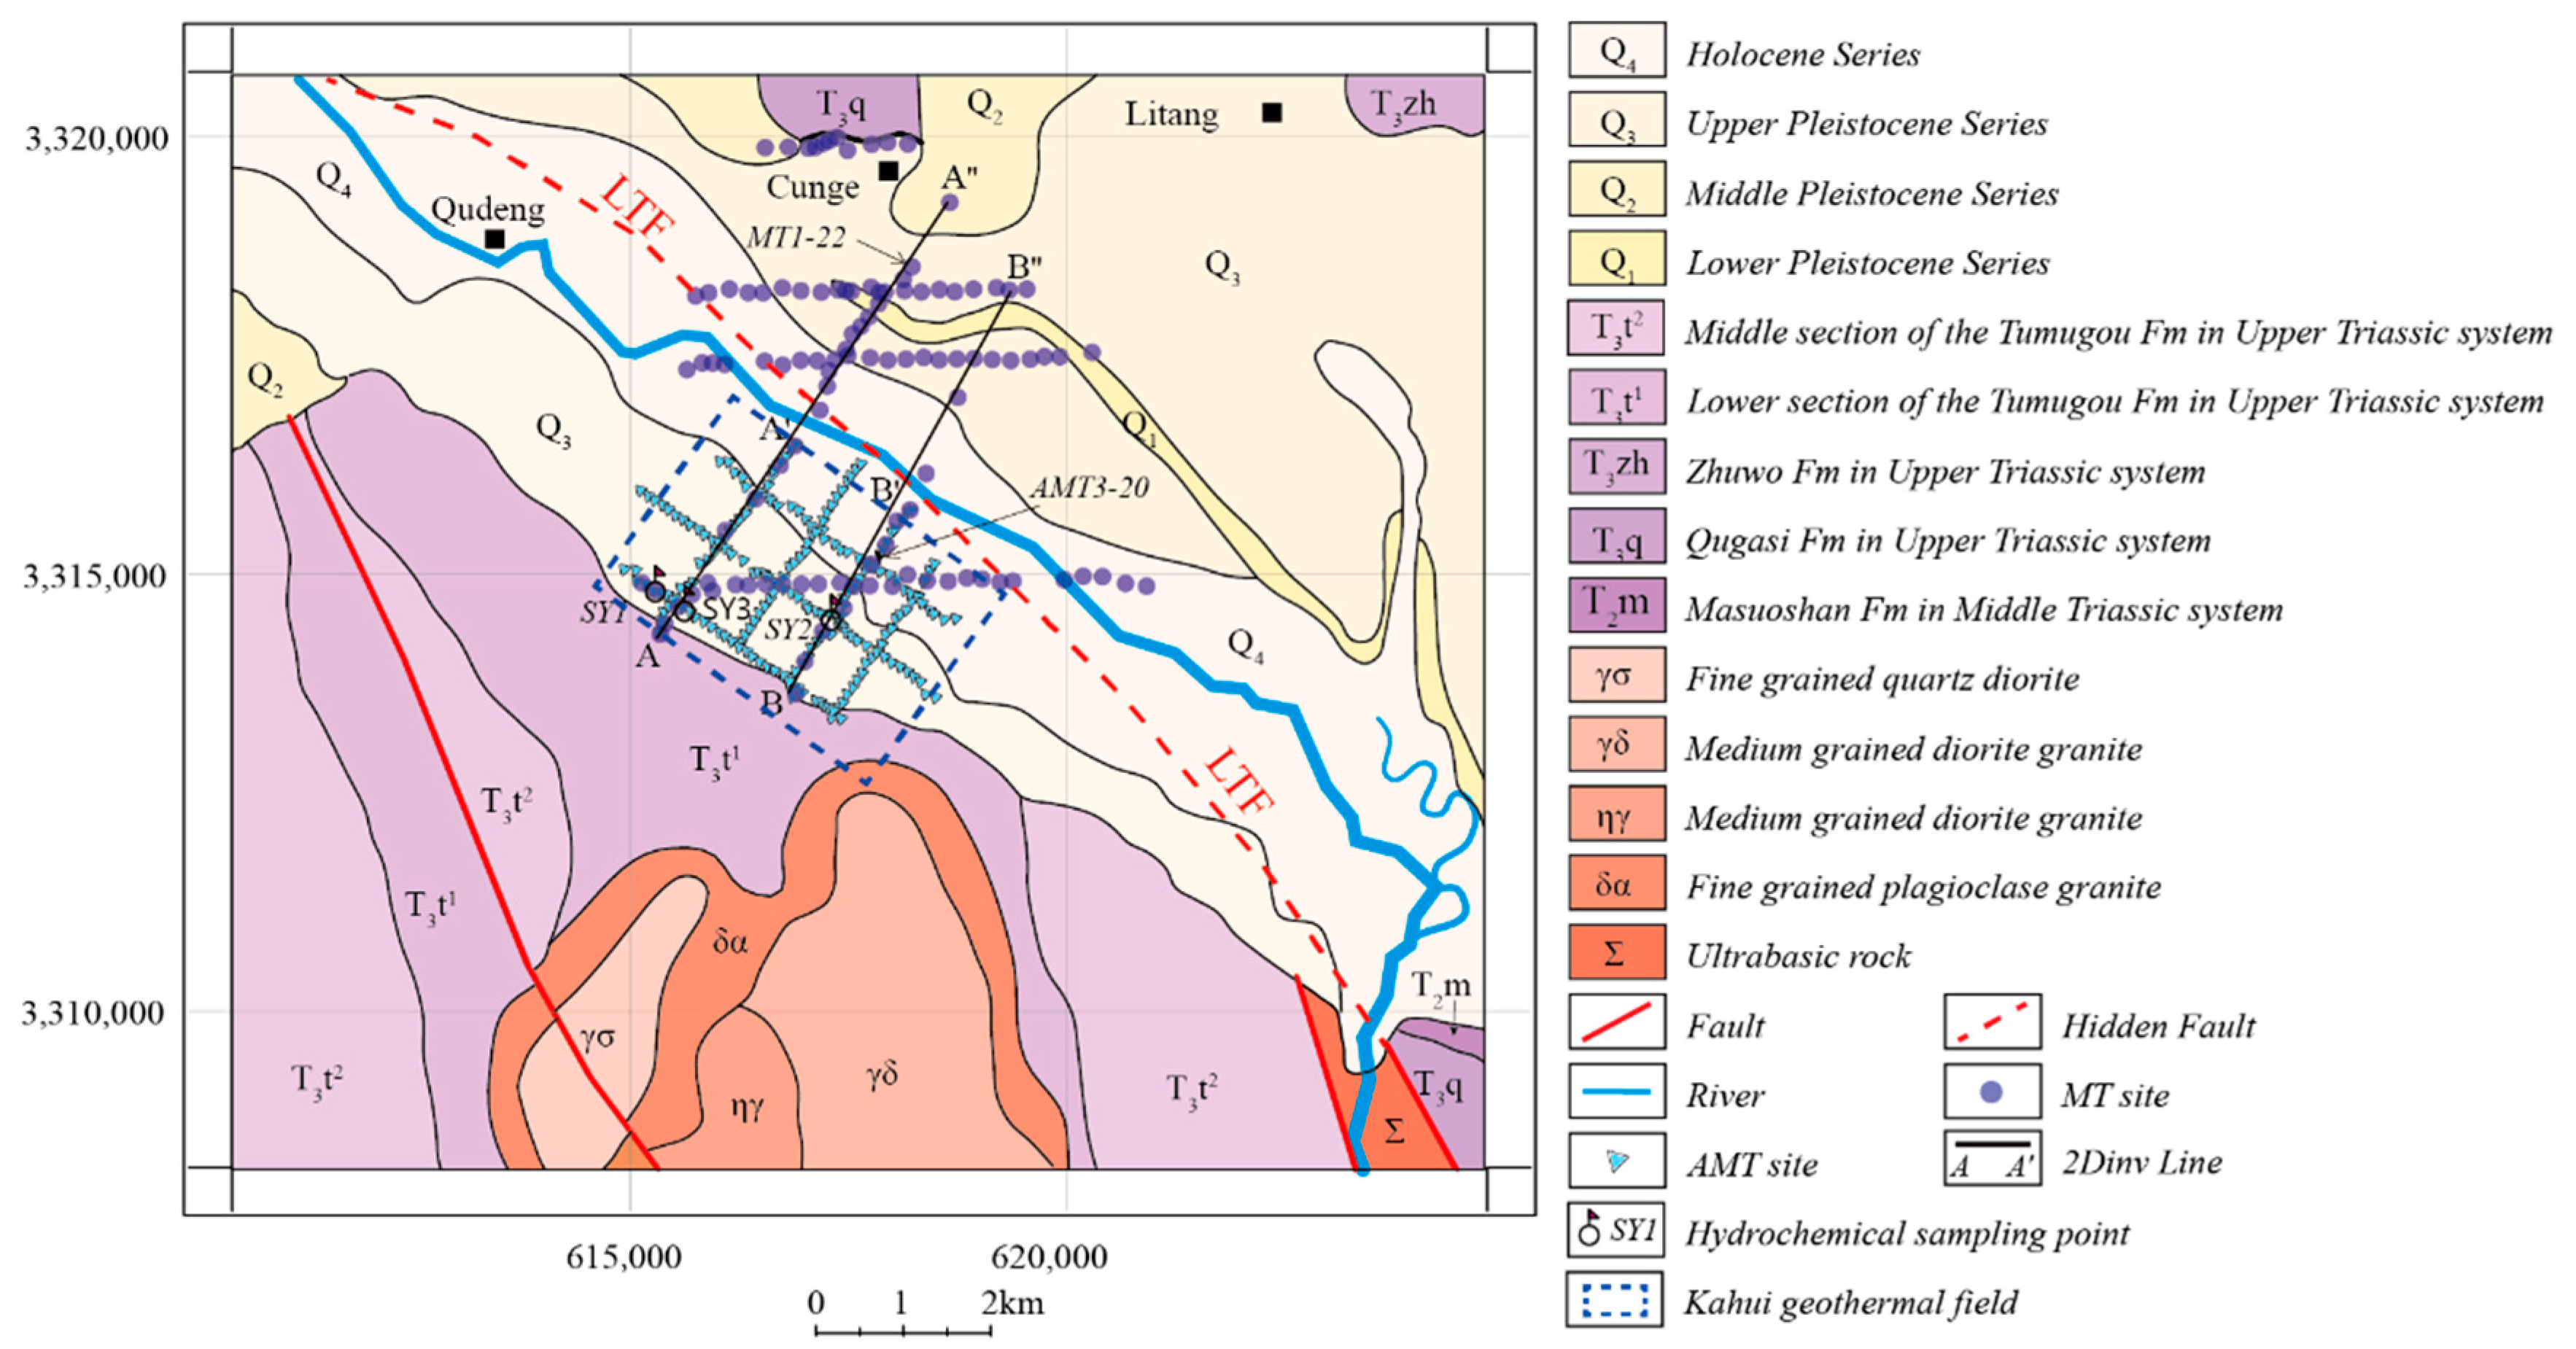
The Kahui Geothermal Field, situated in the western region of Sichuan Province, China, represents an underdeveloped yet highly promising geothermal resource with substantial potential for future exploitation. Situated at the intersection of the Ganzi–Litang Fault Zone and the Litang Fault Zone (Figure 1), this geothermal field currently exhibits three thermal manifestations on the surface, with water temperatures ranging from 58 to 82 °C. To distinguish it from the Maoya hot spring on the north bank of the Wuliang River, the Kahu Geothermal Field is defined in this study as the area where the Kahu hot spring emerges on the south bank of the Wuliang River, as shown in Figure 2, covering an area of approximately 12 km2. Previous studies have primarily focused on the hydrogeochemical characteristics of the geothermal fluids, revealing that the main source of these fluids is atmospheric precipitation, followed by meltwater from snow, ice, and groundwater infiltration [11,12]. However, these studies have largely relied on hydrogeochemical data, lacking geophysical support, and thus fails to elucidate the deep geological structure and nature of the main faults in the Kahui Geothermal Field.
To address this research gap, our study integrated geophysical and geochemical methods to explore the formation mechanism of the Kahui Geothermal Field. We employed natural electromagnetic methods (MT and AMT) to reveal the subsurface resistivity structure of the study area and identify the controlling faults. Additionally, we analyzed hydrogeochemical samples to investigate the fluid sources and the role of water–rock interactions in the geothermal system. This comprehensive approach not only provides a holistic understanding of the Kahui Geothermal Field but also offers valuable insights for geothermal exploration in other tectonically active regions.

2. Geological Overview

Figure 2 presents the geological structure of the Kahui Geothermal Field. The field manifests as a cluster of springs along the rear edge of the third terrace on the southern bank of the Wuliang River. The northern section of the geothermal field is overlain by Quaternary and Tertiary deposits, predominantly composed of lacustrine, slope, and alluvial materials such as clays, sands, gravelly sands, and conglomerates, with an abundance of pebbles visible on the surface. In the northern mountainous area, exposures include the Upper Triassic Zhuwo Formation and Qugasi Formation. The Zhuwo Formation is distinguished by its gray to dark gray, thin to thick bedded metamorphic feldspar quartz sandstone, fine sandstone, siltstone, and gray silty slate. The Qugasi Formation primarily consists of limestone, marble, and volcanic rocks. The southern portion of the geothermal field reveals the middle and lower segments of the Upper Triassic Tumugou Formation, the Upper Triassic Qugasi Formation, the Middle Triassic Masuoshan Formation, as well as intrusive and basic igneous rocks. The Tumugou Formation is characterized by sandstone, slate, and limestone interbedded with volcanic rocks, whereas the Masuoshan Formation features limestone interbedded with siltstone and slate. The predominant intrusive activity occurred during the Indosinian orogeny, with intrusions into the middle segment of the Upper Triassic Tumugou Formation.
Field investigations and previous studies indicate that faults are the primary controlling factors for the distribution of hot springs in the Kahui Geothermal Area, with the Litang Fault being a regionally significant fault. The Litang Fault originates from the northern edge of the Xiaomaoyaba Basin at the source of the Wuliang River in Litang County, Sichuan Province, and extends southeastward through the Maoya Basin, Litang Basin, Jiawa Basin, and Kangga Basin, terminating south of Dewu. The fault is approximately 145 km long and is one of the important northwest-striking left-lateral strike-slip faults on the western Sichuan Plateau. It is an intracontinental, secondary block-bounding strike-slip fault that plays a crucial role in the eastward extrusion of materials within the Tibetan Plateau [17,18,19]. Since the Quaternary period, the fault has been characterized mainly by left-lateral strike-slip movement, with significant activity. Along the fault, not only are hot springs distributed linearly, but there are also evident displacements of drainage systems and mountain ridges. The left-lateral-slip rate of the Litang Fault is about 2–4 mm/year, making it an important seismogenic structure in the Litang area of western Sichuan. According to research by Yang et al. [20], the Litang Fault is a basin-controlling fault dipping to the northeast. Near the study area, the Litang Fault is concealed within the Litang Basin, which is an irregular triangular structural basin trending northwest to southeast, with a width of 1–10 km, a length of about 25 km, and an elevation of approximately 3900 m [21].
Figure 2. Geological map (modified from Yang et al., 2023 [20]) and MT/AMT survey locations of the Kahui geothermal field.
Minerals 15 00339 g002

3. Data Acquisition and Processing

3.1. Geophysical Data Acquisition and Processing

3.1.1. Data Acquisition

To investigate the subsurface resistivity distribution of the Kahui Geothermal Field, a total of 109 MT (magnetotelluric) and 203 AMT (audio magnetotelluric) sites were surveyed using the MTU-5A (Canada) magnetotelluric sounding instrument manufactured by Phoenix Geophysics, Canada (Figure 2). The data acquisition was conducted in 2024 by the Tianjin Geothermal Exploration and Development Design Institute. During the measurements, tensor measurements were employed to observe the four horizontal components of the electromagnetic field (Ex, Ey, Hx, Hy). The coordinate system was oriented with the north to south direction of the geographic coordinate system as the x axis and the east to west direction as the y axis. The acquisition time for each MT site exceeded 3 h, with an average site spacing of approximately 200 m. For the AMT sites, the acquisition time was greater than 1 h, and the average site spacing was about 80 m.

3.1.2. Data Processing

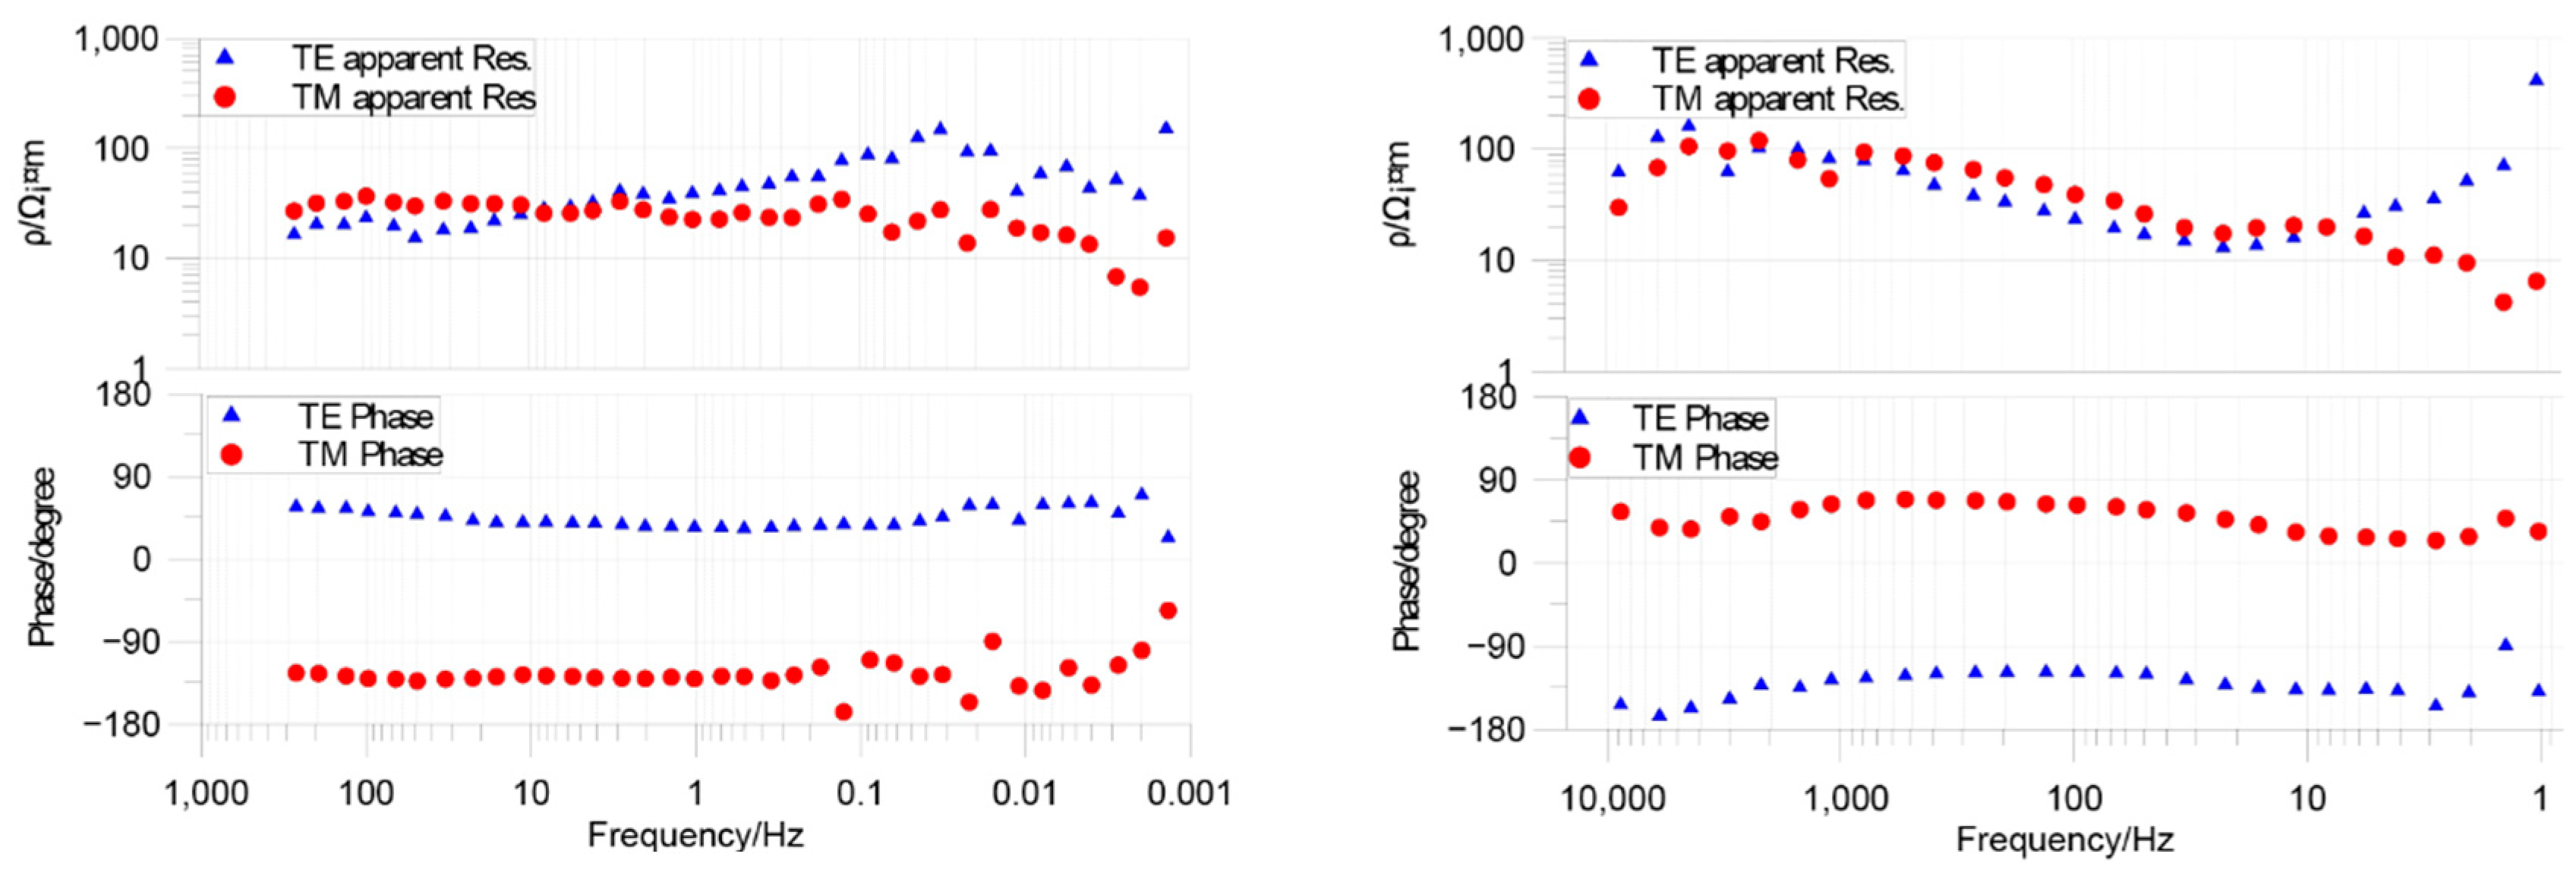
The electric and magnetic field data collected during the measurements were processed using Phoenix Geophysics’ SSMT2000 0.6.0.69 software. This software was employed to calculate the apparent resistivity (ρaxy, ρayx) and phase (∅xy, ∅yx) for each MT and AMT measurement site across various frequencies. Specifically, ρaxy and ∅xy represent the apparent resistivity and phase calculated from the north to south electric field (Ex) and the east to west magnetic field (Hy), while ρayx and ∅yx are the apparent resistivity and phase derived from the same electric field (Ex) but with the east to west magnetic field (Hy) oriented differently. Figure 3 illustrates the typical apparent resistivity and phase curves for the MT and AMT sites within the study area, with the exact locations of these sites shown in Figure 2. The data quality was notably good for the MT sites at frequencies above 0.01 Hz and for the AMT sites at frequencies above 1 Hz, indicating overall robust data integrity.

3.1.3. 2D Inversion

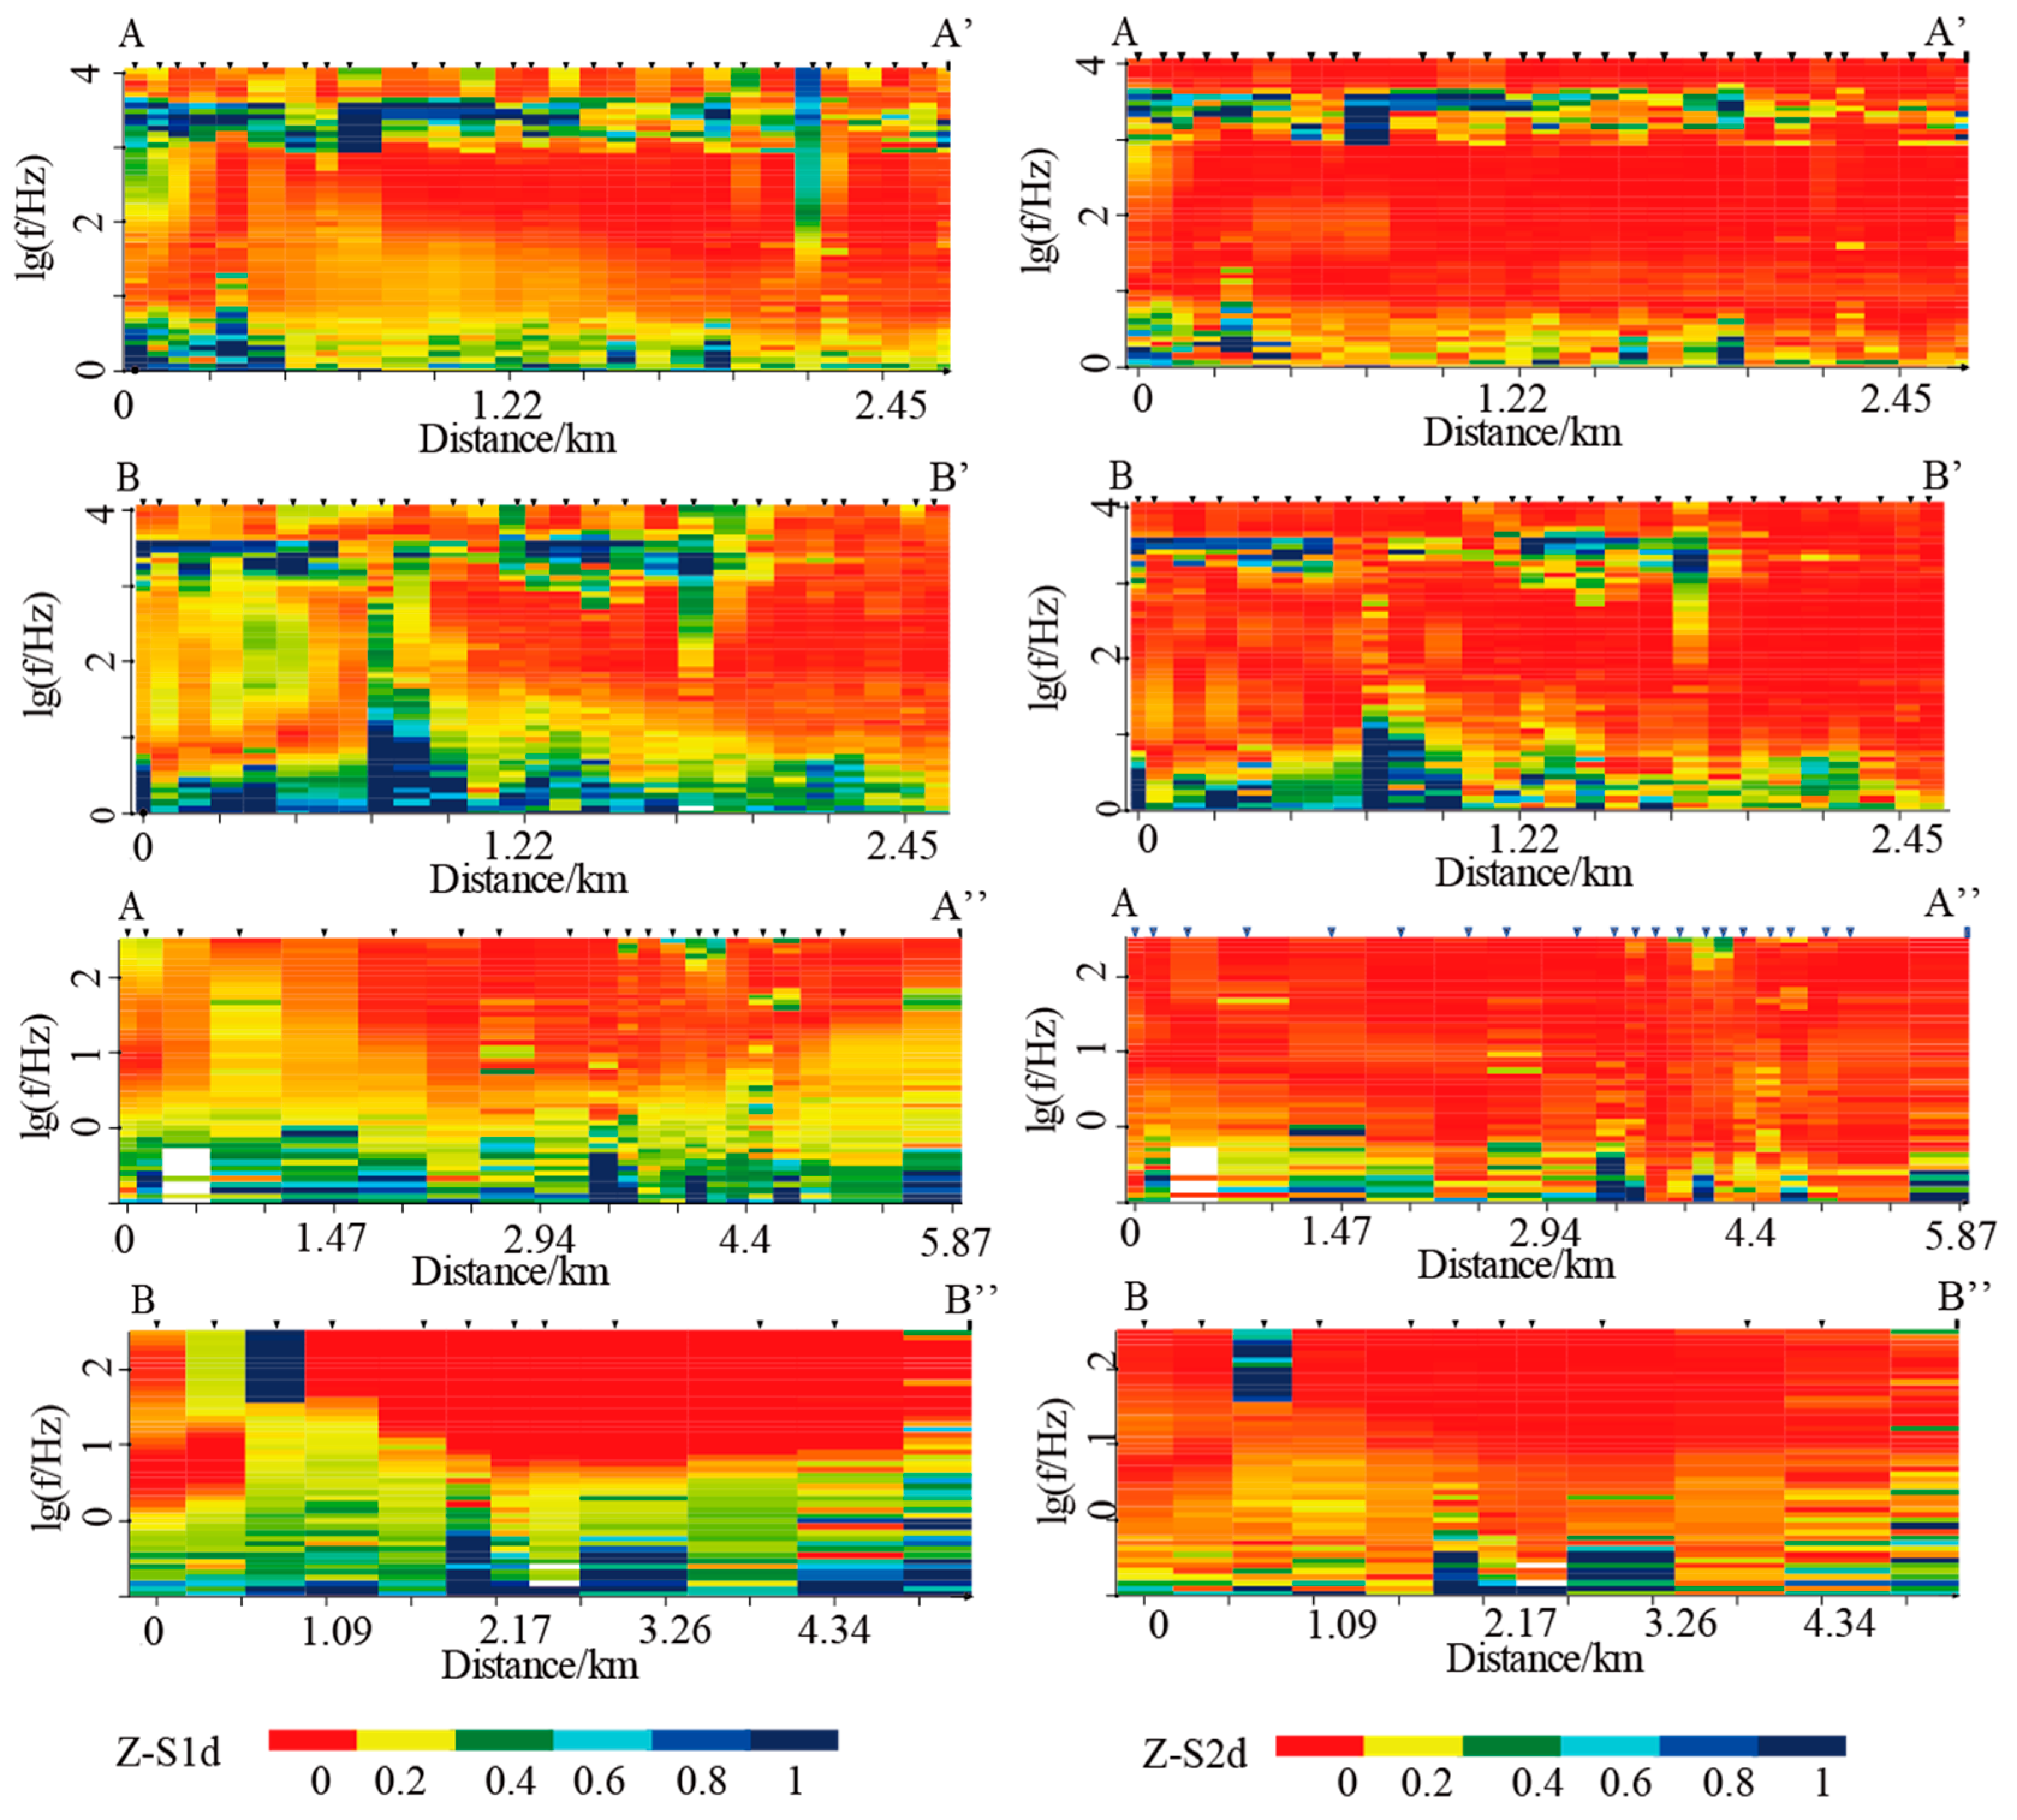
Prior to conducting the 2D inversion, we performed Groom–Bailey (GB) decomposition on both the MT and AMT data [22,23]. The 1D and 2D skewness values of the MT and AMT data in the study area were statistically analyzed (Figure 4). The results indicate that a significant proportion of frequency points exhibited 1D skewness values exceeding 0.2, necessitating consideration of 2D or 3D inversion approaches. Furthermore, 2D skewness values at the MT stations with frequencies > 1 Hz and AMT stations with frequencies > 10 Hz were predominantly below 0.3. Following impedance tensor rotation, these datasets demonstrated sufficient dimensionality reduction to justify 2D inversion implementations. The 2D inversion was then carried out using the MTPioneer 6.05 software. During the inversion process, we tested various inversion parameters and modes, ultimately selecting the TM mode, which is defined as the configuration where the electric field is oriented parallel to the structural strike direction while the magnetic field is perpendicular to it. The model parameters were set as follows: a uniform half space with a resistivity of 100 Ω·m, a smoothing factor (tau) of 7, data errors at 10%, and an error floor of 10%. The number of iterations was set to 100, and the final root mean square (RMS) error of the inversion was kept below 3, ensuring robust results.

3.1.4. 3D Inversion

The 3D inversion was conducted using the ModEM system, a modular electromagnetic inversion software package [24]. The inversion employed a joint inversion mode combining Zxx/Zyy and Zxy/Zyx components. The AMT frequency range spanned from 1000 Hz to 1 Hz, covering three frequency bands with a total of 13 discrete frequencies. In the core area, the horizontal grid spacing was set at 50 m, expanding outward by a factor of 1.5 for 12 additional grids. Vertically, the initial layer thickness was 10 m, expanding outward by a factor of 1.1 for 40 grids, followed by a further expansion by a factor of 1.5 for 15 grids to satisfy the infinite boundary conditions. This resulted in a final model grid of 94 × 106 × 60. The error floor was set at 10% for the diagonal components (Zxx and Zyy) and 5% for the off-diagonal components (Zxy and Zyx). A uniform half space with a resistivity of 100 Ω·m was used as the initial model. After 55 iterations, the inversion yielded a 3D resistivity model with an RMS error of 1.047, as shown in Figure 5.

3.2. Geochemical Data Acquisition

The geochemical data for the Kahui Geothermal Field were collected in 2024, with three sampling sites (Figure 2). Prior to on-site sampling, the coordinates of the sampling sites were measured using RTK (Real Time Kinematic (China) technology, and the temperature of the hot spring water was measured on site using a mercury thermometer. For the major and trace element analyses, the samples were filtered (0.2 or 0.45 µm cellulose acetate) into acid-washed polypropylene bottles. For the major cation and trace element analyses, the samples were acidified using ultra purified HNO3 (1 mL of acid to 100 mL of sample). For the anion determination, the samples were not further treated. The major cation concentrations were analyzed using inductively coupled plasma optical emissions spectroscopy (Optima8300 (USA)) and inductively coupled plasma mass spectrometry (7700×). The major anion concentrations were analyzed using ion chromatography (OPUS Electronic Titrator (Germany)). For the pH analyses, the samples were analyzed by an acidity meter (PHS-3C). The TDS concentrations of the samples were determined gravimetrically. Samples were pre-filtered (0.45-µm cellulose acetate) to remove suspended solids. Then, samples were added to a carefully cleaned, dried, and weighed beaker, evaporated to dryness in a 105 °C drying oven, and finally the TDS value was found as the mass of the dry residue per liter of sample. The analytical precision for major and selected trace elements based on duplicate analyses of each sample was found to be <3% at the 95% confidence level, and the precision for the pH was found to be better than ±0.05. The analytical results are presented in Table 1.

4. Results

4.1. Resistivity Model

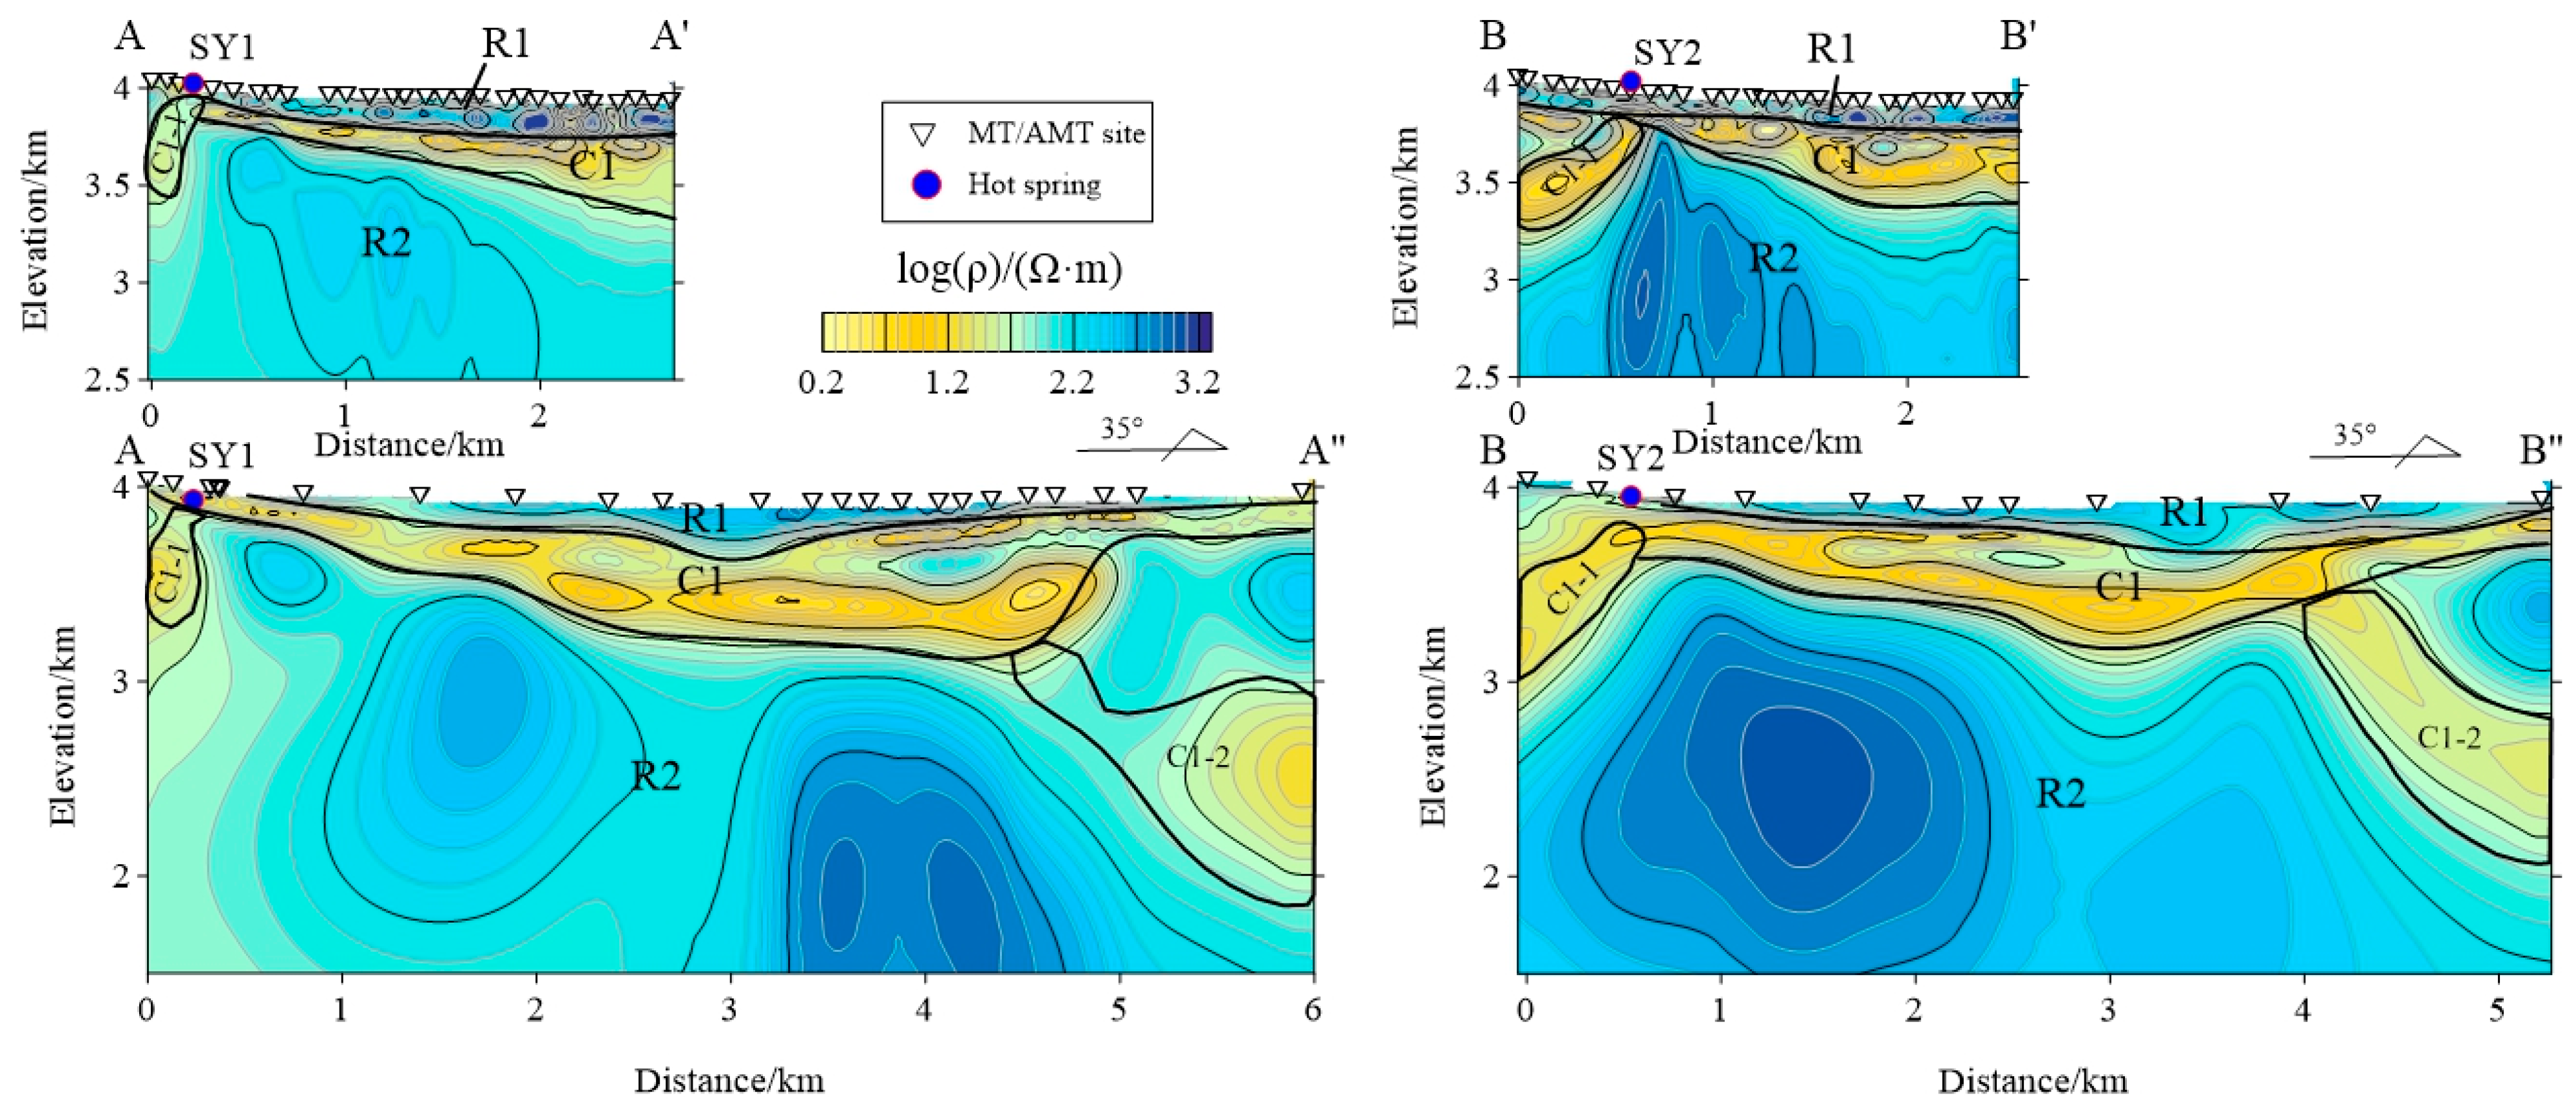
Figure 5 presents the 2D inversion results for the profiles AA′ and BB′. The inversion indicated that within a depth of 2.5 km beneath the study area, there are three distinct resistivity layers. The first layer is a high resistivity zone (R1) with values exceeding 100 Ω·m, extending from the surface to approximately 200 m in depth. Below R1 lies the second layer, a low resistivity zone (C1) with values less than 100 Ω·m, and in the core area, these values drop below 10 Ω·m. The base of C1 deepens gradually from south to north, with an elevation ranging from approximately 3700 to 3000 m. Beneath C1 is the second high resistivity zone (R2), also with values exceeding 100 Ω·m. Notably, in the short-profile AMT inversion results (profiles AA′ and BB′), a south-dipping low resistivity body (C1-1) was identified within the top 600 m on the left side of the profile, connected to the upper part of C1 and extending close to the surface in profile AA’. In the long-profile MT inversion results (profiles AA″ and BB″), the low resistivity body C1-1 remained clearly visible. Additionally, a north-dipping low resistivity body (C1-2) was identified within the top 2000 m on the right side of the profile, connected to the upper part of C1 and extending downward to the right side of the profile.
The 3D inversion results were consistent with the 2D inversion results (Figure 6), both revealing a three-layer resistivity structure model: a high resistivity layer in the shallow section, a low resistivity layer in the middle, and a high resistivity layer in the deep section. As shown in Figure 6, within the AMT inversion range, the shallow section (−0.108 km) exhibited overall high resistivity characteristics, with a more continuous low resistivity band extending in the east to west direction in the middle section, which may be related to the resistivity heterogeneity in the shallow section. At a depth of 0.187 km, the low resistivity zone in the middle section expanded, while the north and south sides remained high resistivity areas. From 0.295 km to 0.596 km in depth, the northern section showed low resistivity characteristics, while the southern section featured high resistivity with embedded low resistivity bands, which were visible on multiple sections from −0.403 km to −1.053 km. On the sections from 0.794 km to −1.053 km in depth, the northern section exhibited high resistivity characteristics.

4.2. Water Chemistry Type

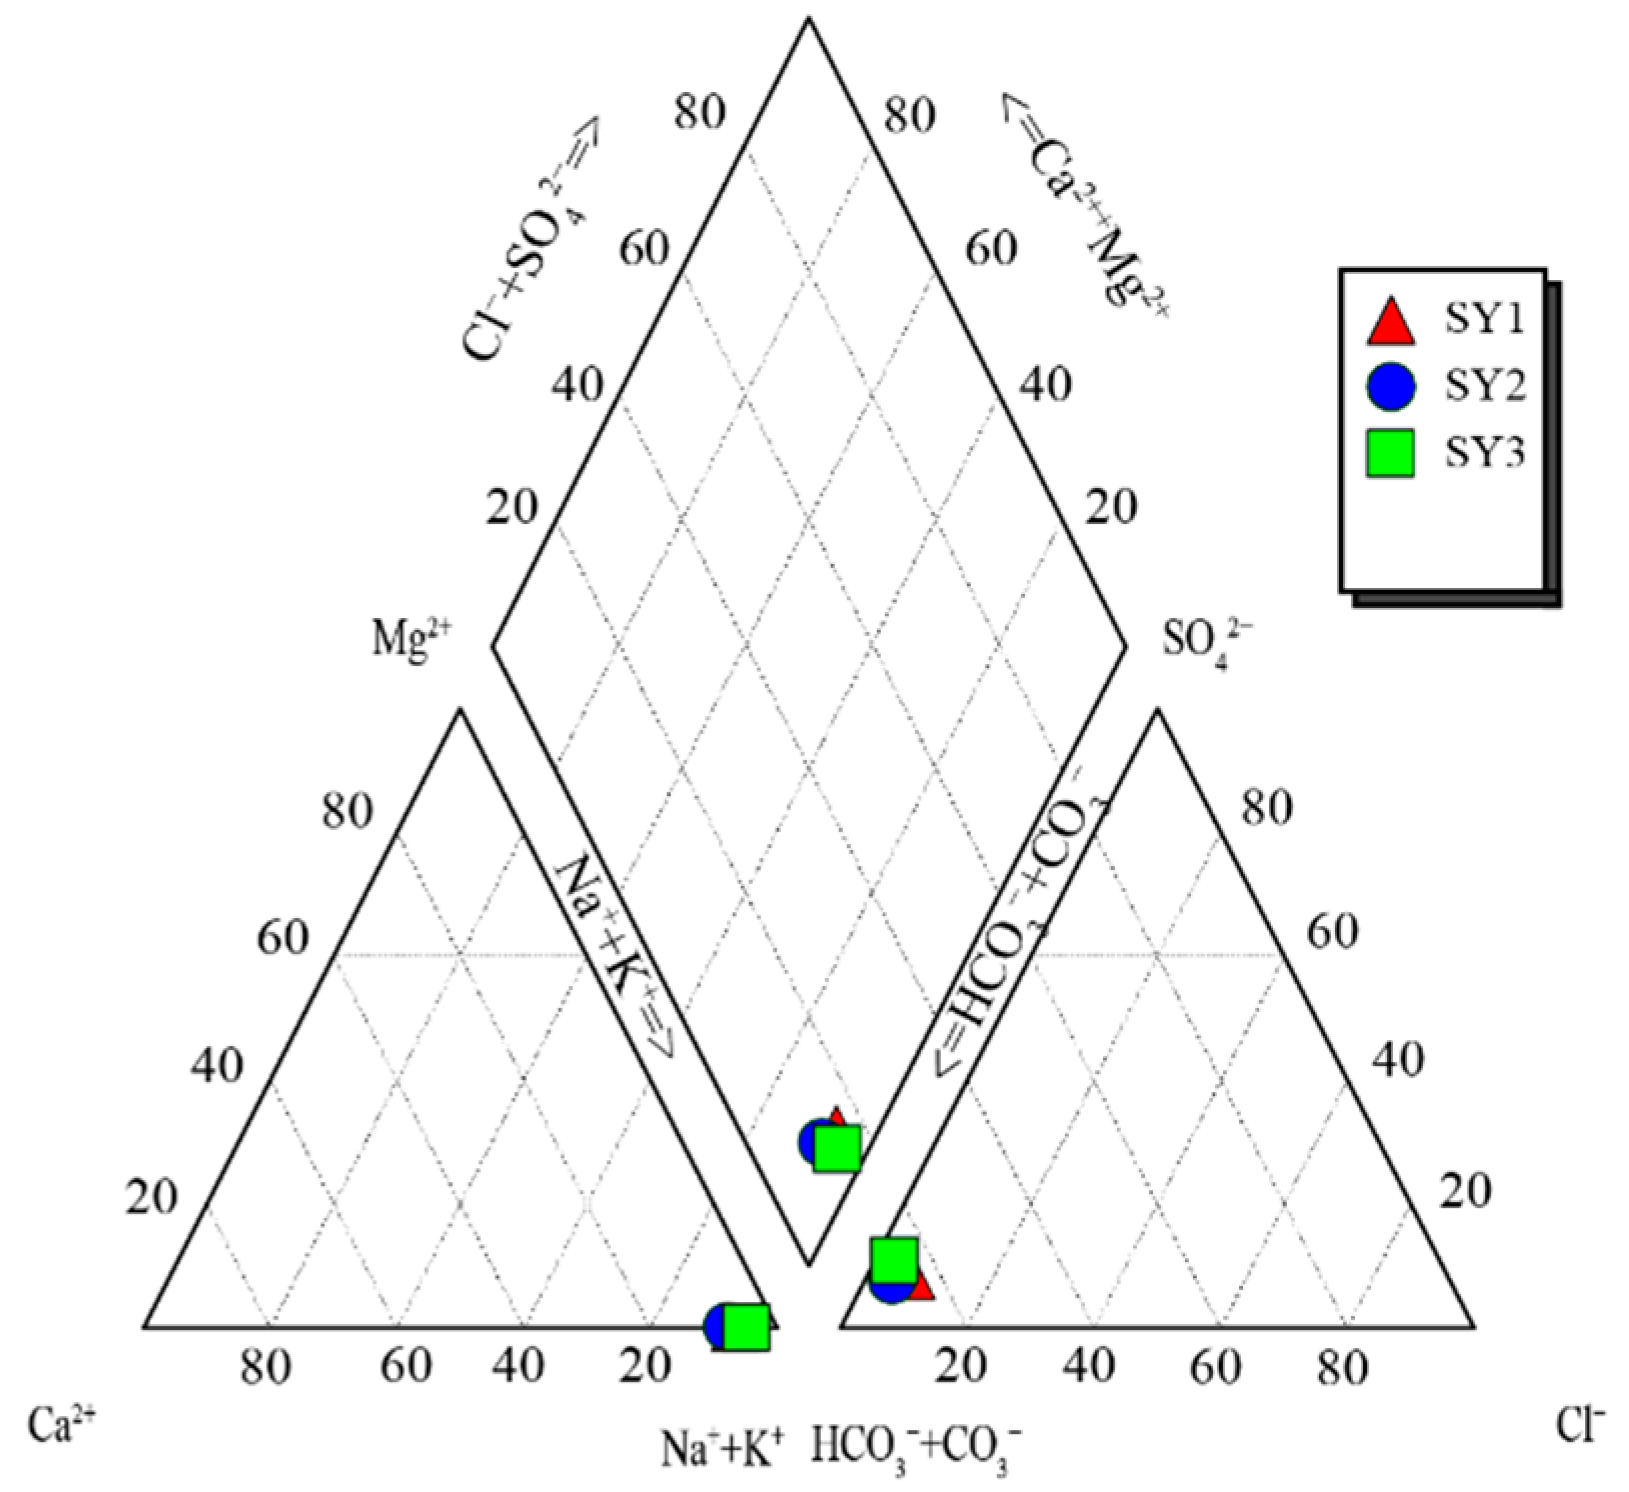
The hot spring waters of the Kahui Geothermal Field exhibited temperatures ranging from 58 °C to 82 °C and pH values from 8.34 to 8.67, indicating a weakly alkaline nature. The total dissolved solids (TDS) content ranged from 150 mg/L to 342 mg/L, classifying these waters as freshwater. Following the hydrochemical facies classification method proposed by Shukarev, all three samples exhibited a HCO3–Na type hydrochemical signature (Figure 7), with Na+ being the predominant cation and HCO3 the primary anion. The hydrochemical types of the geothermal fluids analyzed in this study were consistent with those reported by Wang [26] for six samples collected between 2017–2019 and Shen et al. [12] for one sample, all classified as the HCO3–Na type. However, discrepancies were observed when compared to earlier measurements by Wei and Hu [11]. In their analysis of four geothermal fluid samples from the Kahui geothermal field, Wei et al. identified three higher temperature samples as the HCO3–SO4–Na type, while the lower temperature sample exhibited an HCO3–Na type signature. More pronounced differences were evident in the recent findings of Zhang et al. [25], where three higher temperature samples from the same field were classified as the HCO3–SO4−Na type with significantly elevated SO42− concentrations, and the lower temperature sample, though categorized as an HCO3–Na type, still retained markedly higher SO42− levels than those measured in the present study. These discrepancies highlight substantial inconsistencies in the foundational hydrochemical data of the Kahui geothermal field, underscoring the necessity for further systematic investigations to resolve conflicting interpretations.
The Na–K–Mg trilinear diagram, introduced by Giggenbach in 1988 [27], is a widely used tool for assessing the equilibrium state of geothermal fluids. It has become one of the most frequently cited tools for characterizing geothermal fluids, particularly in volcanic hydrothermal systems, active tectonic regions, continental geothermal areas, and aquifers [28]. The Na, K, and Mg mass fractions of the three fluids were projected onto the Na–K–Mg trilinear diagram, resulting in Figure 8. The diagram revealed that SY2 falls within the partially equilibrated water zone, while SY1 and SY3 are in the transition zone between non-equilibrated and partially equilibrated waters. This positioning was due to SY2 having a lower proportion of mixed upper cold water compared to SY1 and SY3, which had a higher proportion of mixed upper cold water. This higher mixing ratio caused SY1 and SY3 to be in the transition zone and results in their significantly lower discharge temperatures compared to SY2.

5. Discussion

5.1. Geological Interpretation

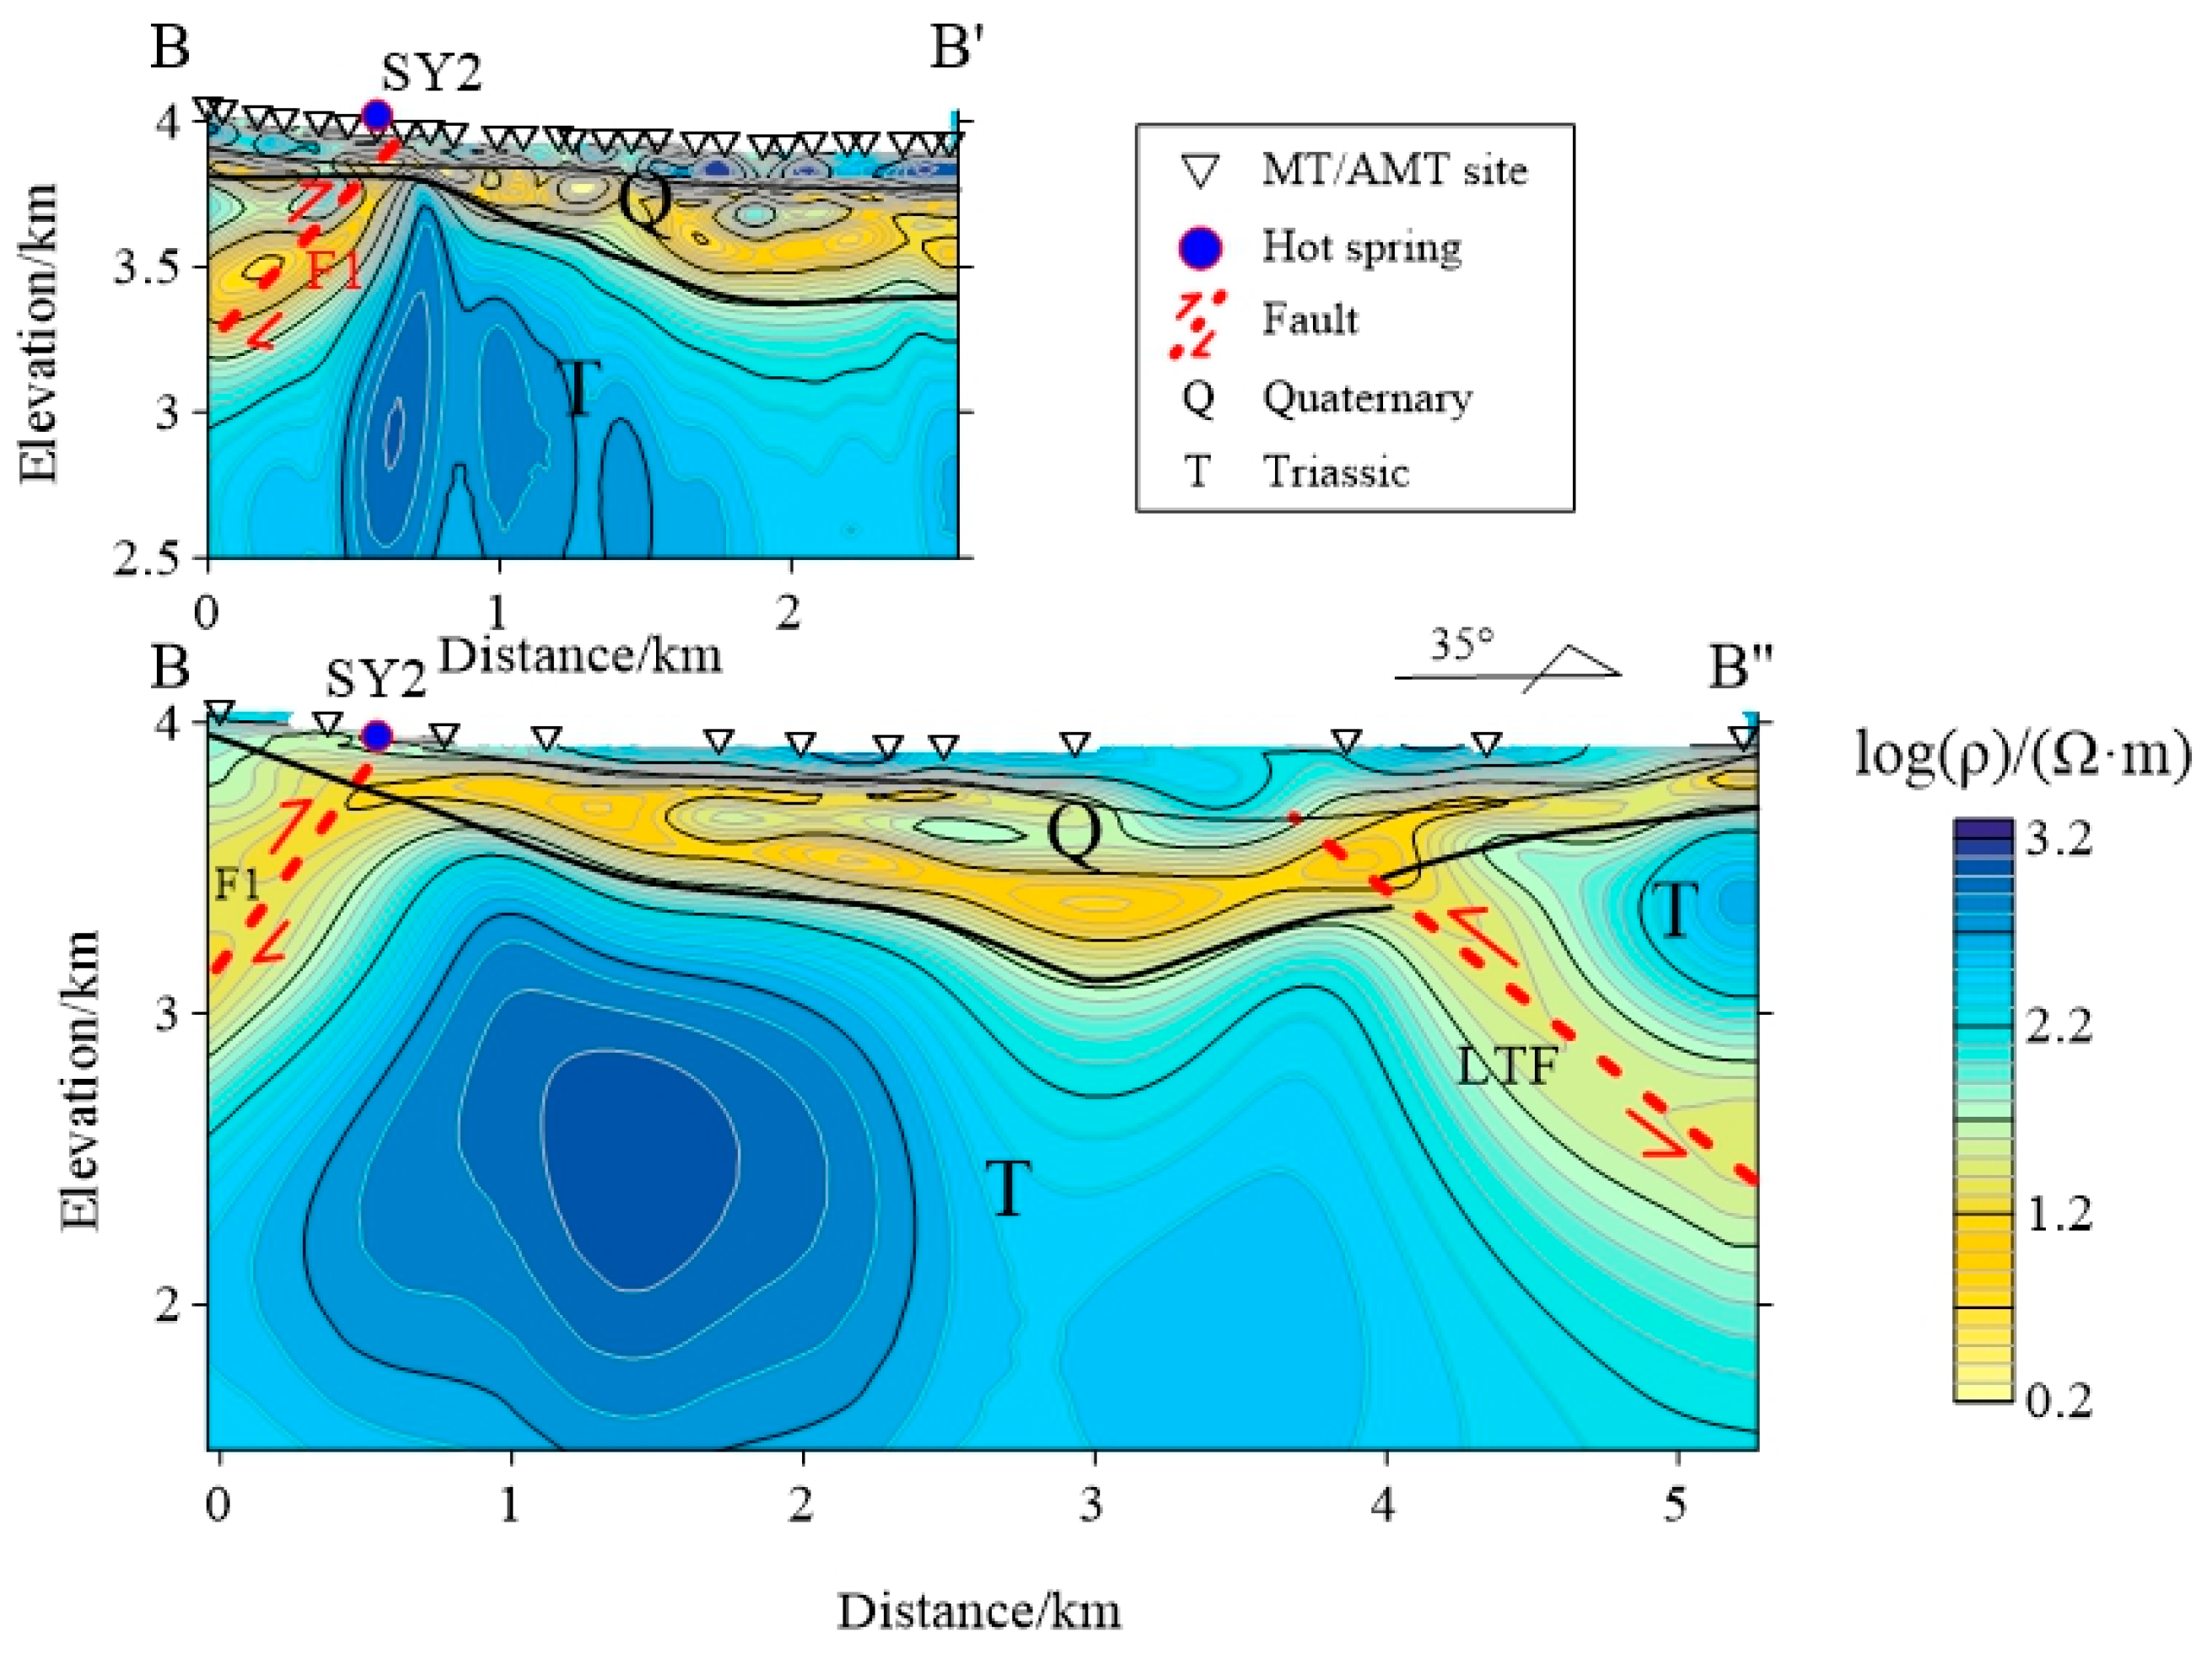
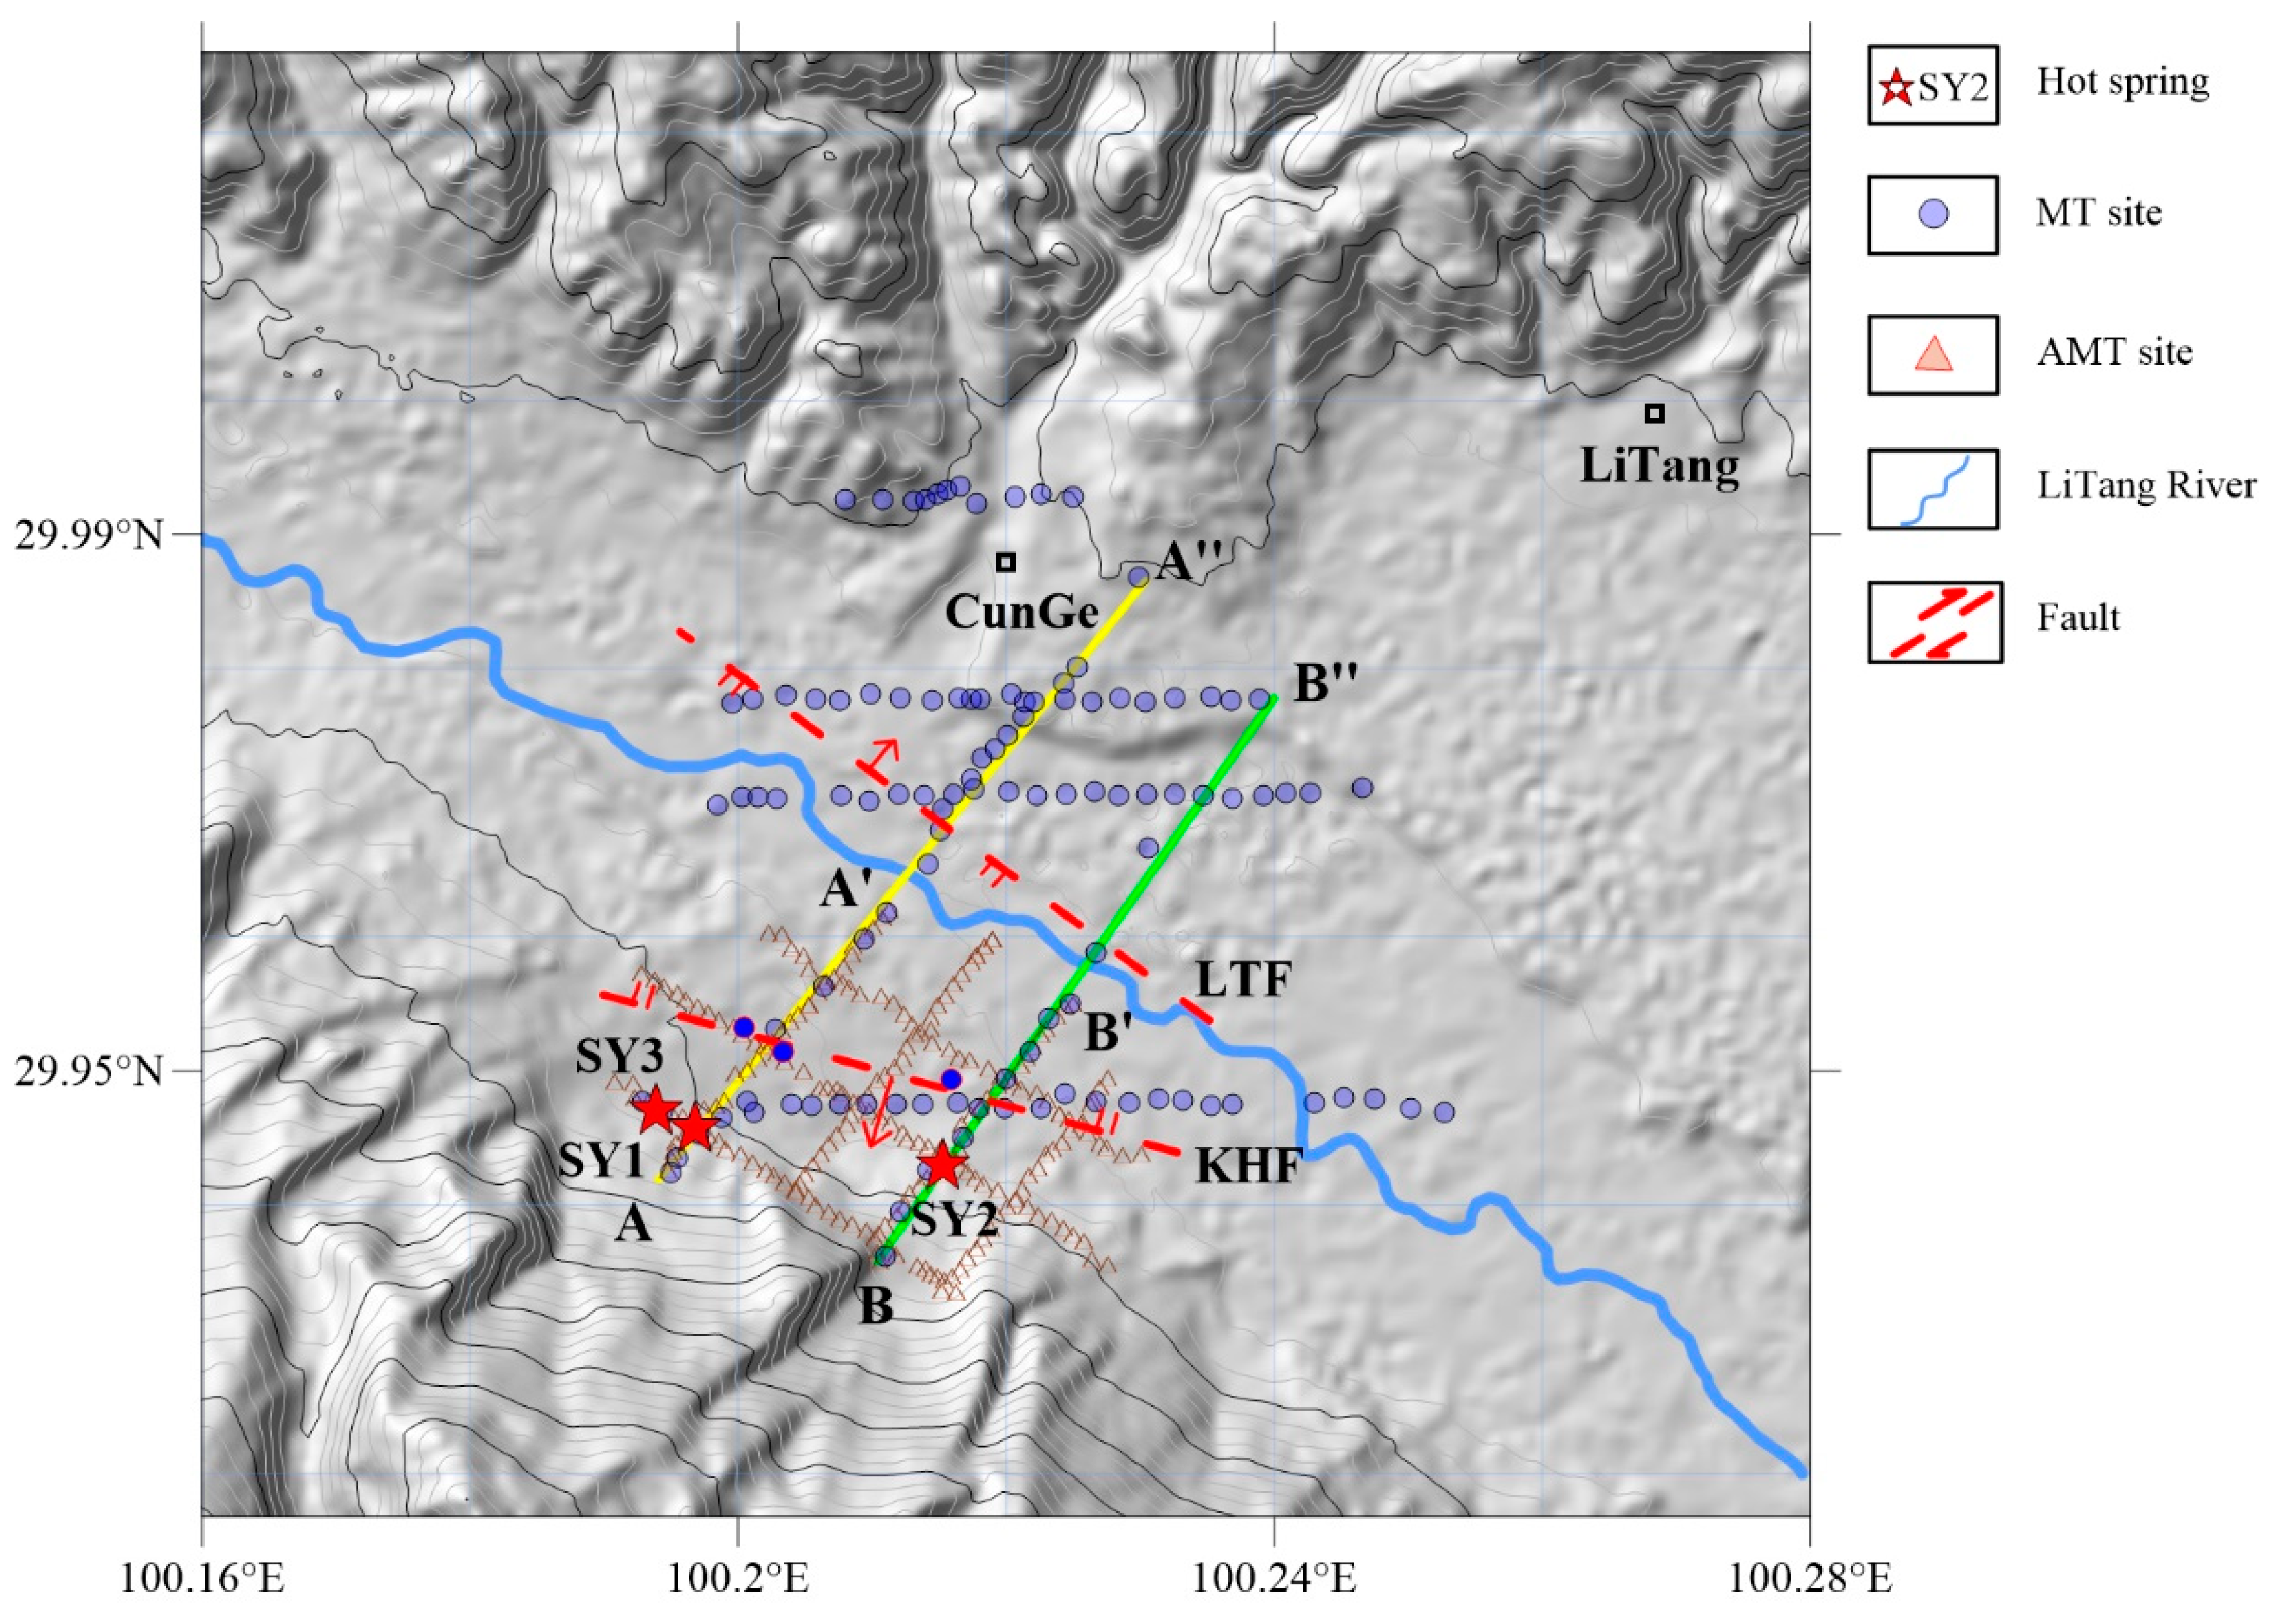
The 2D and 3D inversion results from the AMT and MT data indicated that the resistivity structure of the study area, to a depth of 2.5 km, exhibits a layered characteristic in the vertical direction. Integrating the outcrop conditions of regional strata (Figure 2), geological interpretations were made along the profiles BB′ and BB″ (Figure 9). The figure shows that along profile BB″, the strata are divided into two main units from top to bottom, representing Quaternary (Q) and Triassic (T) strata, respectively. The upper part of the Quaternary strata showed high resistivity, while the lower part exhibited low resistivity. Based on field observations, the Litang region hosts sporadic permafrost patches (covering 15%–30% of the area), primarily distributed in moisture retentive zones such as shaded slopes and swampy wetlands [29,30,31]. Previous MT surveys have demonstrated that unfrozen Quaternary sedimentary layers typically exhibit low resistivity. Given that the study area is situated within the Litang Basin, intersected by perennial river systems, and characterized by elevated groundwater saturation, it meets the hydrogeological prerequisites for permafrost formation. Consequently, the high resistivity anomalies detected in the shallow subsurface profile were interpreted as permafrost layers. The low resistivity is indicative of unfrozen, unconsolidated, loose sediments from alluvial, lacustrine, and slope deposits. It was also observed that the thickness of the Quaternary strata was greatest near the center of the basin, gradually thinning towards the north and south sides. Around SY1 and SY3, Triassic slates and other strata were exposed at the surface. Two faults were identified: the F1 Fault and the Litang Fault. As shown in Figure 9, the F1 Fault is located within the Kahui Geothermal Field on the southern flank of the Wuliang River. Given that it is being formally described for the first time, it has been named the Kahui Fault (Figure 10). The Litang Fault, proximal to the Wuliang River, constitutes the master fault of the Litang Fault Zone. The Kahui Fault extends upward to the surface, while the Litang Fault does not reach the surface. However, according to research by Xu et al. [32], the Litang Fault is an active fault, and trenching work has confirmed its activity at the surface. Integrating all inversion results, the planar locations and attitudes of the two faults were inferred (Figure 10). The Kahui Fault is located in the southwestern part of the study area, striking southeast-northwest, and dipping to the southwest with a dip angle of approximately 60–70°. The Litang Fault is situated in the northern and central parts of the study area, striking southeast-northwest, and dipping to the northeast with a dip angle of approximately 40–50°. The spatial alignment of the Litang Fault showed strong consistency with its previously mapped positions derived from remote sensing interpretation, field investigations, and paleoseismic trenching studies [33,34].
Wei and Hu [11] proposed that three faults significantly influence the formation of the Kahui Geothermal Field: the Wona Fault, the Litang–Mayan Fault, and the Jiaxu Fault. Among these, the Litang–Mayan Fault, as the master fault of the Litang Fault Zone, acts as the primary structural control for the geothermal system. In contrast, Wang [26], while studying geothermal resources in the Litang region, conceptualized the Maoya and Kahui geothermal zones as a unified Litang Geothermal Field. Their thermal source model posited that the region’s location along the Ganzi–Litang Fault Zone enables deep seated heat ascent through fault conduits, with the Kahui Geothermal Field being predominantly governed by the Litang Fault and its secondary active faults. However, due to limitations in exploration depth and spatial coverage in the current study, the deep structural interactions between the Litang Fault and the Kahui Geothermal Field remain unresolved. Nevertheless, shallow geothermal fluid dynamics in the Kahui field are unequivocally controlled by the Kahui Fault rather than the Litang Fault.

5.2. Fluid Sources

The hot spring fluids in the Kahui Geothermal Field are primarily replenished by atmospheric precipitation, with secondary contributions from meltwater and groundwater infiltration [11,12]. This conclusion is consistent with studies on other geothermal fields in the eastern margin of the Tibetan Plateau, highlighting the universal role of atmospheric precipitation in regional geothermal fluid recharge [35]. Based on geomorphological and geological structural distributions, the main recharge area for the Kahui Geothermal Field is likely located in the mountainous region surrounding Mount Maoheshan. Fluids infiltrate along tectonic fractures under the influence of gravity, circulating deep into the subsurface and eventually forming high temperature geothermal fluids [7]. This process is closely related to the complex tectonic background of the eastern margin of the Tibetan Plateau, where tectonic fractures provide pathways for deep fluid circulation [36,37].

5.3. Ion Source Analysis

The primary cation in the geothermal fluids of the Kahui Geothermal Field was Na+, and its high concentration reflects the interaction between the fluids and rocks during deep circulation. Studies indicate that the enrichment of Na+ is mainly derived from two processes: ① The Dissolution of Feldspar Minerals: The surrounding granitic and metamorphic rocks of the geothermal field are rich in sodium feldspars (such as albite and potash feldspar). Under high temperature and high pressure conditions, these feldspar minerals dissolve, releasing substantial amounts of Na+ into the fluids [27,28]. The longer the fluid circulation path, the more Na+ is dissolved. ② Cation Exchange Reactions: As the fluids ascend, Na+ can further enrich through cation exchange reactions. The Ca2+ and Mg2+ in the geothermal fluids exchange with sodium silicate minerals in the rocks, leading to an increase in Na+ concentration and a decrease in Ca2+ and Mg2+ concentrations. These exchange reactions frequently occur at the contact surfaces between fluids and rocks, especially as the fluids rise through fault zones [35,38].
The primary sources of HCO3 in geothermal fluids can be attributed to two main processes: ① The Dissolution of Carbonate Minerals: During deep circulation, geothermal fluids interact with carbonate minerals in the strata, such as calcite (CaCO3) and dolomite (CaMg(CO3)2). These minerals dissolve under high temperature and high pressure conditions, releasing significant amounts of HCO3 into the fluids. This dissolution process is particularly pronounced under such extreme conditions. For example, the dissolution reaction of calcite can be represented as:
CaCO 3 + H 2 O + CO 2 Ca 2 + + 2 HCO 3
This process is well documented in various geological settings, including those involving geothermal systems. ② The Oxidation of Organic Matter: In certain cases, HCO3 in geothermal fluids can also originate from the oxidation of organic matter. Organic compounds within deep fluids are oxidized under high temperature conditions, producing CO2, which subsequently reacts with water to form HCO3. This process also leads to an increase in the concentration of Ca2+ ions. This mechanism is more common when fluids pass through strata rich in organic matter [38].
During fluid migration, the dissolution of silicate minerals leads to an increase in the concentration of SO42. The interaction of Ca2+ and SO42 with sodium silicate minerals in the Triassic sandstones and slates of the study area results in cation exchange reactions. These reactions lead to an increase in the concentration of Na+ and a corresponding decrease in Ca2+ in the geothermal fluids, ultimately forming HCO3–Na+ type geothermal fluids. The SO42 is oxidized to H2S gas in the shallow subsurface, which imparts a distinct rotten egg odor to the geothermal fluids.
The high concentrations of Na+ and HCO3 in the geothermal fluids of the Kahui Geothermal Field reflect significant interactions between the fluids and rocks during deep circulation. The Na+ is primarily sourced from the dissolution of feldspar minerals and cation exchange reactions, while the HCO3 mainly originates from the dissolution of carbonate minerals and the oxidation of organic matter. These processes collectively contribute to the unique HCO3–Na+ geochemical signature of the Kahui Geothermal Field.

5.4. Heat Source Analysis

The western Sichuan region is located within the high heat flow zone of the Tibetan–Yunnan region and belongs to the Mediterranean–Himalayan geothermal belt. The distribution of heat flow in this area reflects the thermal transfer effects associated with the northeastward thrusting of the “eastern syntaxis” of the Tibetan Plateau [6,39]. Studies have shown that the heat flow in the Kahui Geothermal Field primarily originates from the crust, with crustal heat flow accounting for approximately 60.62% of the total surface heat flow [40]. This indicates that the residual heat from Cenozoic granite magmatism and radiogenic heat production in the upper crust are the main heat sources for the Kahui Geothermal Field. The thickened crust and the low-velocity, high-conductivity layer in the middle to lower crust of the eastern margin of the Tibetan Plateau are likely key factors in the formation of high temperature geothermal systems [41,42]. Additionally, the upwelling of mantle fluids may also provide a deep heat source for the Kahui Geothermal Field [43].

5.5. Tectonic Control for Geothermal Formation

The formation of the Kahui Geothermal Field is closely related to the tectonic activities along the eastern margin of the Tibetan Plateau. This region, located at the junction of the Yangtze Block, Songpan–Ganzi Block, and Sichuan–Yunnan Block, is one of the most tectonically active areas in the Cenozoic era [4,5]. The Litang Fault, a significant left-lateral strike-slip fault in the region, controls the spatial distribution of many geothermal fields [17,20]. Although this study identifies the Kahui Fault as the direct controller for the development of the Kahui Geothermal Field, the activity of the Litang Fault still has a significant impact on geothermal activity in the area [32]. Tectonic fractures not only provide pathways for the circulation of geothermal fluids but also facilitate the conduction of heat from deep within the crust [44,45]. Given that all the exposed hot springs within the Kahui Geothermal Field are spatially aligned with the Kahui Fault, it can be inferred that the Kahui Fault and its associated fracture network serve as the primary structural conduits and reservoir space for geothermal fluid accumulation.

5.6. Formation Mechanism of the Kahui Geothermal Field

An integrated analysis of geophysical, geochemical, and geological data has led to the development of a formation mechanism model for the Kahui Geothermal Field (Figure 11). The upwelling of deep mantle fluids results in partial melting of the middle crust, providing a deep heat source for the geothermal field [43]. Atmospheric precipitation and snowmelt infiltrate along the tectonic fractures under the influence of gravity, circulating deep into the subsurface. Along their path, these fluids absorb residual heat from magmatic intrusions and mechanical and frictional heat generated by active faults, ultimately forming high temperature geothermal fluids [35]. The Kahui Fault serves dual functions as both a conduit for fluid circulation and a reservoir for geothermal fluid storage within the Kahui Geothermal Field. As the geothermal fluids ascend, they mix with shallow cold water, leading to a reduction in the temperature of the discharging fluids [27,28].

6. Conclusions

  • Deep Geological Structure and Controlling Fault Identification: Geophysical inversion results revealed a three layer resistivity structure beneath the Kahui Geothermal Field, characterized by a high resistivity layer near the surface, a low resistivity layer in the middle, and a high resistivity layer at depth. This resistivity structure reflects the geological characteristics of the geothermal field. The shallow part of the Kahui Geothermal Field is controlled by the Kahui Fault. Recognizing the Kahui Fault offers new insights into the circulation pathways and discharge mechanisms of geothermal fluids in the region and provides crucial geological evidence for exploring other geothermal fields in western Sichuan.
  • The Geochemical Characteristics and Recharge Sources of Geothermal Fluids: Hydrochemical analysis indicated that the fluid type in the Kahui Geothermal Field is HCO3−Na, primarily sourced from atmospheric precipitation, with secondary contributions from snowmelt and groundwater recharge. During deep circulation, interactions with rocks—particularly the dissolution of feldspar minerals and cation exchange reactions—lead to the enrichment of Na+ and HCO3. Additionally, variations in the SO42 concentration reflected the oxidation of sulfides in the shallow oxidizing environment. These findings not only elucidate the chemical evolution of fluids in the Kahui Geothermal Field but also provide a scientific basis for understanding fluid sources in similar geothermal systems.
  • Deep Heat Source and Geothermal Formation Mechanism: The deep heat source of the Kahui Geothermal Field mainly originates from the partial melting of the middle crust due to upwelling mantle fluids, which provides the high temperature heat source necessary for heating atmospheric precipitation during deep circulation. Integrating the regional tectonic context, the formation mechanism of the Kahui Geothermal Field can be summarized as follows: Atmospheric precipitation infiltrates through tectonic fractures, absorbs heat during deep circulation, and mixes with shallow cold water upon ascent, ultimately emerging as hot springs at the surface. This model not only explains the formation process of the Kahui Geothermal Field but also serves as a reference for understanding the formation mechanisms of other geothermal fields in the western Sichuan region.

Author Contributions

Conceptualization, Z.L.; methodology, G.Y.; software, Z.L. and H.D.; validation, G.Y. and B.X.; resources, Z.L.; and H.W.; data curation, Z.L. and H.Z.; writing—original draft preparation, Z.L.; writing—review and editing, Z.L.; supervision, B.X. All authors have read and agreed to the published version of the manuscript.

Funding

This research received no external funding.

Data Availability Statement

For access to the research data, please contact the corresponding author, Zhilong Liu, via email at lzl_tjdry@163.com.

Conflicts of Interest

Huan Wang is an employee of Yalong River Hydropower Development Company. The paper reflects the views of the scientist and not those of the company.

References

  1. Ford, B.J. Geothermal: Our ultimate energy source. Process Eng. 2023, 10–13. [Google Scholar]
  2. Hassan, Q.; Viktor, P.; Al-Musawi, T.J.; Ali, B.M.; Algburi, S.; Alzoubi, H.M.; Al-Jiboory, A.K.; Sameen, A.Z.; Salman, H.M.; Jaszczur, M. The renewable energy role in the global energy Transformations. Renew. Energy Focus 2024, 48, 100545. [Google Scholar] [CrossRef]
  3. Teixeira, R.; Cerveira, A.; Pires, E.J.S.; Baptista, J. Advancing Renewable Energy Forecasting: A Comprehensive Review of Renewable Energy Forecasting Methods. Energies 2024, 17, 3480. [Google Scholar] [CrossRef]
  4. Fan, J.; Zhu, J.S.; Jiang, X.T.; Wu, P.; Yang, Y.H. Lithosphere and asthenosphere structure on eastern margin of qinghai-tibet plateau in China. China Mater. Prog. 2015, 42, 746–752. [Google Scholar] [CrossRef]
  5. Li, J.; Wang, X.B.; Qin, Q.Y.; Zhang, G.; Li, D.H.; Zhou, J. Deep physical structure and geotectonic implications of the eastern margin of the Qinghai–Tibet plateau. Earth Sci. Res. J. 2016, 20, A1–A8. [Google Scholar] [CrossRef]
  6. Hu, S.-B.; He, L.-J.; Wang, J.-Y. View Correspondence. Compilation of heat flow data in the China continental area. Acta Geophys. Sin. 2001, 44, 611–626. [Google Scholar]
  7. Li, J.-N.; Han, Z.-J.; Luo, J.-H.; Guo, P. Characteristics and implications of seismic activity around Minshan active block in eastern margin of Qinghai-Tibet Plateau. Seismol. Geol. 2021, 43, 1459–1484. [Google Scholar] [CrossRef]
  8. Rowland, J.V.; Simmons, S.F. Hydrologic, Magmatic, and Tectonic Controls on Hydrothermal Flow, Taupo Volcanic Zone, New Zealand: Implications for the Formation of Epithermal Vein Deposits. Econ. Geol. 2012, 107, 427–457. [Google Scholar] [CrossRef]
  9. Fridleifsson, G.O.; Elders, W.A. The Iceland Deep Drilling Project: A search for deep unconventional geothermal resources. Geothermics 2006, 34, 269–285. [Google Scholar] [CrossRef]
  10. Faulkner, D.; Jackson, C.; Lunn, R.; Schlische, R.; Shipton, Z.; Wibberley, C.; Withjack, M. A review of recent developments concerning the structure, mechanics and fluid flow properties of fault zones. J. Struct. Geol. 2010, 32, 1557–1575. [Google Scholar] [CrossRef]
  11. Wei, Y.; Hu, Y. Analysis on the formation mode of hot springs in Kahui area of Litang County. Geol. Disasters Environ. Prot. 2014, 25, 78–82. [Google Scholar]
  12. Shen, H.; Yang, Y.; Zhou, Z.; Rui, X.; Liao, X.; Zhao, D.; Liang, M.; Chen, M.; Guan, Z.; Ren, H. Genesis and Deep Geothermal Process of Maoya Hot Springs in Litang, Western Sichuan. Seismol. Geol. 2023, 45, 689–709. [Google Scholar]
  13. Chen, Y.L.; Li, D.P.; Zhou, J.; Liu, F.; Zhang, H.F.; Nie, L.S.; Jiang, L.T.; Song, B.; Liu, X.M.; Wang, Z. U-Pb dating, geochemistry, and tectonic implications of the Songpan-Ganzi block and the Longmen Shan, China. Geochem. J. 2009, 43, 77–99. [Google Scholar] [CrossRef]
  14. Li, S.H.; Su, T.; Spicer, R.A.; Xu, C.L.; Sherlock, S.; Halton, A.; Hoke, G.; Tian, Y.M.; Zhang, S.T.; Zhou, Z.K.; et al. Oligocene Deformation of the Chuandian Terrane in the SE Margin of the Tibetan Plateau Related to the Extrusion of Indochina. Tectonics 2020, 39, e2019TC005974. [Google Scholar] [CrossRef]
  15. Shao, Y.M.; Yan, D.P.; Qiu, L.; Mu, H.X.; Zhang, Y. Late Permian High-Ti and Low-Ti Basalts in the Songpan-Ganzi Terrane: Continental Breakup of the Western Margin of the South China Block. Minerals 2022, 12, 1391. [Google Scholar] [CrossRef]
  16. Gao, Z.J.; Sun, Y.; Huang, J.W.; Li, Q. The crustal deformation mechanism of southern Chuandian block: Constrained by S wave velocity and its azimuthal anisotropy. Geosci. Lett. 2024, 11, 40. [Google Scholar] [CrossRef]
  17. Gao, S.P.; Chen, L.C.; Li, Y.B.; Wang, H.; Han, M.M.; Feng, J.H.; Lu, L.L.; Peng, S.X.; Jin, C.; Liu, L.T. Rupture Behavior of the Litang Fault within the Sichuan-Yunnan Active Block, Southeastern Tibetan Plateau. Lithosphere 2021, 2021, 8773676. [Google Scholar] [CrossRef]
  18. Wang, S.Y.; Zhou, R.J.; Liang, M.J.; Liu, S.; Liu, N.N.; Long, J.Y. Co-Seismic Surface Rupture and Recurrence Interval of Large Earthquakes along Damaoyaba-Litang Segment of the Litang Fault on the Eastern Margin of the Tibetan Plateau in China. J. Earth Sci.-China 2021, 32, 1139–1151. [Google Scholar] [CrossRef]
  19. Cao, K.; Zhang, D.; Shen, X.M.; Zhang, J.F.; Wang, D.; Xu, Y.D.; Wang, G.C. Middle Miocene Onset of the Litang Fault System Records Kinematic Change in Eastern Tibet. Tectonics 2023, 42, 8773676. [Google Scholar] [CrossRef]
  20. Yang, Y.; Liang, M.J.; Ma, C.; Li, J.; Shen, H.L.; Du, F.; Luo, S.; Liu, S.; Rui, X.L. A palaeoearthquake event and its age revealed by the travertine layer along the Litang fault in the southeastern margin of the Qinghai-Tibetan plateau. Earthq. Res. Adv. 2023, 3, 100215. [Google Scholar]
  21. Yan, S.T.; Ding, A.L.; Dai, X.J.; Liu, T.; Li, H.; Dai, H.R.; Chen, P.; Wu, Q.S.; Zhu, L.D. Triassic oceanic—Continental transition of the Ganzi—Litang Ocean basin: Evidence from high-Mg andesites and Nb-enriched basalts in the Litang area, Eastern Tibet. J. Asian Earth Sci. 2024, 266, 106136. [Google Scholar] [CrossRef]
  22. Groom, R.W.; Bailey, R.C. Decomposition of Magnetotelluric Impedance Tensors in the Presence of Local 3-Dimensional Galvanic Distortion. J. Geophys. Res.-Solid 1989, 94, 1913–1925. [Google Scholar] [CrossRef]
  23. Groom, R.W.; Bailey, R.C. Analytic Investigations of the Effects of near-Surface 3-Dimensional Galvanic Scatterers on Mt Tensor Decompositions. Geophysics 1991, 56, 496–518. [Google Scholar] [CrossRef]
  24. Kelbert, A.; Meqbel, N.; Egbert, G.D.; Tandon, K. ModEM: A modular system for inversion of electromagnetic geophysical data. Comput. Geosci. 2014, 66, 40–53. [Google Scholar] [CrossRef]
  25. Zhang, Y.H.; Yao, R.W.; Deng, C.D.; Huang, X.; Lv, G.; Li, X.; Wang, Y. Genetic mechanism of geothermal water in the sandstone reservoir of western Sichuan, SW China: Evidence from hydrochemistry and δD−δ18O isotopes. Ore Geol. Rev. 2024, 167, 105994. [Google Scholar] [CrossRef]
  26. Wang, H. Study on the Characteristics and Causes of High Temperature Hydrochemistry in Litang Geothermal Field in Western Sichuan. Master’s Thesis, China University of Petroleum, Beijing, China, 2020. [Google Scholar]
  27. Giggenbach, W.F.V.C. Geothermal solute equilibria. Derivation of Na-K-Mg-Ca geoindicators. Geochim. Cosmochim. Acta 1988, 52, 2749–2765. [Google Scholar] [CrossRef]
  28. Romano, P.; Liotta, M. Using and abusing Giggenbach ternary Na-K-Mg diagram. Chem. Geol. 2020, 541, 119577. [Google Scholar] [CrossRef]
  29. Yang, M.X.; Nelson, F.E.; Shiklomanov, N.; Guo, D.L.; Wan, G.N. Permafrost degradation and its environmental effects on the Tibetan Plateau: A review of recent research. Earth-Sci. Rev. 2010, 103, 31–44. [Google Scholar] [CrossRef]
  30. Yang, Y.; Hopping, K.; Wang, G.; Chen, J.; Peng, A.; Klein, J. Permafrost and drought regulate vulnerability of Tibetan Plateau grasslands to warming. Ecosphere 2018, 9, e02233. [Google Scholar] [CrossRef]
  31. Wang, X.J.; Ran, Y.H.; Pang, G.J.; Chen, D.L.; Su, B.; Chen, R.; Li, X.; Chen, H.W.; Yang, M.X.; Gou, X.H.; et al. Contrasting characteristics, changes, and linkages of permafrost between the Arctic and the Third Pole. Earth-Sci. Rev. 2022, 230, 104042. [Google Scholar] [CrossRef]
  32. Xu, X.W.; Wen, X.Z.; Yu, G.H.; Zheng, R.Z.; Luo, H.Y.; Zheng, B. Average slip rate, earthquake rupturing segmentation and recurrence behavior on the Litang fault zone, western Sichuan Province, China. Sci. China Ser. D 2005, 48, 1183–1196. [Google Scholar] [CrossRef]
  33. Zhang, C.Q.; Wu, Z.H.; Zhou, C.J.; Tian, T.T.; Li, Y.H.; lI, J.B. Paleoearthquake events and inhomogeneous activity characteristics in the Benge-Cunge section of the Litang fault zone in the western Sichuan Province. Acta Geol. Sin. 2020, 94, 1295–1303. [Google Scholar]
  34. Zhang, X.B.; Yang, Z.; Zhong, N.; Yu, H.; Guo, C.B.; Yang, G.F.; Li, H.B. Late Quaternary activity and paleoearthquake recurrence characteristics of the Litang fault in western Sichuan. Acta Geol. Sin. 2023, 98, 2084–2100. [Google Scholar]
  35. Zhao, J.Y.; Wang, G.L.; Zhang, C.Y.; Xing, L.X.; Li, M.; Zhang, W. Genesis of Geothermal Fluid in Typical Geothermal Fields in Western Sichuan, China. Acta Geol. Sin.-Engl. 2021, 95, 873–882. [Google Scholar] [CrossRef]
  36. Bai, D.H.; Unsworth, M.J.; Meju, M.A.; Ma, X.B.; Teng, J.W.; Kong, X.R.; Sun, Y.; Sun, J.; Wang, L.F.; Jiang, C.S.; et al. Crustal deformation of the eastern Tibetan plateau revealed by magnetotelluric imaging. Nat. Geosci. 2010, 3, 358–362. [Google Scholar] [CrossRef]
  37. Li, X.F.; Li, H.Y.; Shen, Y.; Gong, M.; Shi, D.N.; Sandvol, E.; Li, A.B. Crustal Velocity Structure of the Northeastern Tibetan Plateau from Ambient Noise Surface-Wave Tomography and Its Tectonic Implications. Bull. Seism. Soc. Am. 2014, 104, 1045–1055. [Google Scholar] [CrossRef]
  38. Peiffer, L.; Inguaggiato, C.; Wurl, J.; Fletcher, J.M.; Martinez, M.G.Q.; Martinez, D.C.; Legrand, D.; Morales, P.H.; Reinoza, C.E.; Tchamabe, B.C.; et al. Geochemistry of coastal geothermal systems from southern Baja California peninsula (Mexico): Fluid origins, water-rock interaction and tectonics. Chem. Geol. 2024, 670, 122316. [Google Scholar] [CrossRef]
  39. Li, Y.L.; Wang, C.S.; Dai, J.G.; Xu, G.Q.; Hou, Y.L.; Li, X.H. Propagation of the deformation and growth of the Tibetan–Himalayan orogen: A review. Earth-Sci. Rev. 2015, 143, 36–61. [Google Scholar] [CrossRef]
  40. Zhang, J.; Li, W.; Tang, X.; Tian, J.; Wang, Y.; Guo, Q.; Pang, Z. Geothermal Analysis of High-Temperature Hydrothermal Activity Area in Western Sichuan. Sci. China Earth Sci. 2017, 47, 899–915. [Google Scholar]
  41. Enkin, R.J.; Yang, Z.Y.; Chen, Y.; Courtillot, V.E. Paleomagnetic Constraints on the Geodynamic History of the Major Blocks of China From the Permian to the Present. J. Geophys. Res. Part B Solid Earth 1992, 97, 13953–13989. [Google Scholar] [CrossRef]
  42. Zhong, S.L.; Wu, J.P.; Fang, L.H.; Wang, W.L.; Fan, L.P.; Wang, H.F. Surface wave Eikonal tomography in and around the northeastern margin of the Tibetan plateau. Chin. J. Geophys. 2017, 60, 2304–2314. [Google Scholar] [CrossRef]
  43. Kang, J.; Han, J.; Gao, R.; Liu, L.; Xin, Z.; Meng, F.; Guo, Z.; Wang, T. Electrical Response of a Reactivated Ancient Suture Revealed by Three-Dimensional Magnetotelluric Inversion Across the Jinsha River Suture, Northern Tibetan Plateau. J. Geophys. Res. Solid Earth 2023, 128, e2022JB026264. [Google Scholar] [CrossRef]
  44. Wang, K.M.; Lu, L.Y.; Maupin, V.; Ding, Z.F.; Zheng, C.; Zhong, S.J. Surface Wave Tomography of Northeastern Tibetan Plateau Using Beamforming of Seismic Noise at a Dense Array. J. Geophys. Res. Solid Earth 2020, 125, e2019JB018416. [Google Scholar] [CrossRef]
  45. Yu, N.; Unsworth, M.; Wang, X.B.; Li, D.W.; Wang, E.C.; Li, R.H.; Hu, Y.B.; Cai, X.L. New Insights Into Crustal and Mantle Flow Beneath the Red River Fault Zone and Adjacent Areas on the Southern Margin of the Tibetan Plateau Revealed by a 3-D Magnetotelluric Study. J. Geophys. Res. Solid Earth 2020, 125, e2020JB019396. [Google Scholar] [CrossRef]
Figure 1. Simplified tectonic geomorphological scheme (modified from Chen et al. 2009 [13], Li et al. 2020 [14], Shao et al. 2022 [15] and Gao et al. 2024 [16]), QTB: Qiangtang Block, CDB: Chuandian Block, SPGZB: Songpan–Ganzi Block, YTC: Yangtze Craton, JSJF: Jinshajiang (Jinsha River) Faults, XSHF: Xianshuihe Faults, LMSF: Longmenshan faults, GZLTF: Ganzi–Litang Fault, LTF: Litang Faults.
Minerals 15 00339 g001
Figure 3. Plots of apparent resistivity and phase curves for measurement sites (Left: MT1-22; Right: AMT3-20).
Minerals 15 00339 g003
Figure 4. 1D and 2D skewness plots from GB decomposition of the AMT and MT data.
Minerals 15 00339 g004
Figure 5. The 2D inversion results for profiles AA′ and BB′. Profiles AA′ and BB′ represent the 2D inversion results for the AMT data (top), while profiles AA″ and BB″ correspond to the MT data (bottom).
Minerals 15 00339 g005
Figure 6. AMT 3D inversion resistivity distribution maps at different depths.
Minerals 15 00339 g006
Figure 7. Piper diagram for water samples from Kahui Geothermal Field.
Minerals 15 00339 g007
Figure 8. The Na–K–Mg triangle diagram for geothermal waters in Kahui.
Minerals 15 00339 g008
Figure 9. Geophysical interpretation diagram.
Minerals 15 00339 g009
Figure 10. The distribution map of the Inferred Fault. LTF: Litang Fault, KHF: Kahui Fault.
Minerals 15 00339 g010
Figure 11. Conceptual model of the Kahui geothermal field. Abbreviations: LTF: Litang Fault, KHF: Kahui Fault.
Minerals 15 00339 g011
Table 1. Chemical constituents of the water samples along the Kahui Geothermal Field (all the units are mg/L).
SampleLon. (E)Lat. (N)pHTemp/°CTDSK+Na+Ca2+Mg2+ClSO42−HCO3CO3NO3FSulfide (Calculated as S2)Radon (Bq/L)SiO2δD(‰)δ18O (‰)Hydrochemical Type
SY1100.196829.94578.34771902.5162.23.880.0657.111.9145.82.40.042.457.313.94HCO3-Na
SY2100.215329.94298.67823422.9272.13.310.0273.516.6148.390.042.852.421.23
SY3100.193829.94708.56581501.7850.63.750.0613.58.66110.46.611.864.030.822
LT-7 [12]8.579.61681.657.24.10.07.620.5158.60.159.5−161.9−21.4HCO3-Na
S1100.148729.63218.678394.52.8586.327.640.200.9148.21165.872.01−157.5−20.32HCO3·SO4-Na
S2100.134929.63358.476354.13.0270.655.030.170.7047.67135.823.02−157.0−20.26
S3100.135429.63488.577351.82.0369.543.820.151.5348.12119.212.54−156.8−20.67
S4 [25]100.160729.96498.555254.11.8351.886.020.210.6323.41132.502.41−156.9−20.61HCO3-Na
Six
samples
[26]
min0.655.482.781.752.8230.511.20−163−21.5HCO3-Na
max2.8072.324.327.0016.66161.71.27−159−21.2
average2.2155.413.712.6313.52127.61.23−161.8−21.38
Q018.7–8.872–74112.6HCO3-Na
Q028.583110.5
Q038.57896.93
Q04 [11]8.25558.12HCO3·SO4-Na
Disclaimer/Publisher’s Note: The statements, opinions and data contained in all publications are solely those of the individual author(s) and contributor(s) and not of MDPI and/or the editor(s). MDPI and/or the editor(s) disclaim responsibility for any injury to people or property resulting from any ideas, methods, instructions or products referred to in the content.