Review

Techniques of Pre-Concentration by Sensor-Based Sorting and Froth Flotation Concentration Applied to Sulfide Ores—A Review

by
Evandro Gomes dos Santos
*,
Irineu Antonio Schadach de Brum
and
Weslei Monteiro Ambrós
Laboratory of Mineral Processing, Federal University of Rio Grande do Sul, Porto Alegre 91501-970, RS, Brazil
*
Author to whom correspondence should be addressed.
Minerals 2025, 15(4), 350; https://doi.org/10.3390/min15040350
Submission received: 30 January 2025 / Revised: 16 March 2025 / Accepted: 19 March 2025 / Published: 27 March 2025
(This article belongs to the Special Issue Mineral Processing Technologies of Low-Grade Ores)

Abstract

:
The use of pre-concentration and optimization of concentration methods have been the focus of the modern mineral industry. Sensor-based sorting equipment and flotation are key players in that movement. This study provides an overview of the main sensor-based sorting techniques and their uses, focusing on sulfides, addressing performance analysis methodologies, and giving the advantages and limitations of the method. An overview of the flotation technique is also presented, covering its basic principles of operation, as well as its main applications in sulfides, its interactions with pre-concentration, and some opportunities and perspectives on the method, such as water reuse impacts, tailing reprocessing, etc. Case studies are presented addressing the influence of the techniques on each other and some future prospects for the mining sector, such as deep-sea mining (DSM) and the use of artificial intelligence (AI).

1. Introduction

The importance of employing pre-concentration methods (especially sensor-based sorting) and the continuous drive to improve flotation processes are the focus of current mineral processing, aligning with cost reduction (both environmental and financial) and ensuring the rational exploitation of mineral deposits. The general trend of declining average ore grades in deposits has made the mining of low-grade ores a reality for many operations worldwide, a subject extensively studied by various authors [1,2,3,4,5,6].
On another front, the economic reuse of old deposits—such as tailings, waste, and low-grade ores—has also been widely considered [7,8]. These materials, generated during the mining of old high-grade deposits, often contain grades comparable to those of natural mineral deposits today. According to estimates by Barros et al. [2], it is projected that by the 2040s, all copper (Cu) deposits in major producing countries (e.g., Chile, USA, Peru, Australia, Mexico, and Indonesia) will have grades below 0.5% Cu. This trend is also observed for other mineral commodities, as demonstrated by Mudd [6], who illustrated the decline in grades for Ag, Cu, Pb, Au, Zn, Ni, U, and diamonds from 1840 to 2006.
Flotation is widely regarded as the most important beneficiation method globally, used in mineral concentration and recycling. During the 20th century, flotation was a revolutionary technique in mineral processing, with significant contributions in research, development, new devices, etc. [9,10,11]. However, despite its current importance, the high energy consumption associated with flotation, particularly in grinding, has spurred the search for alternative methods.
Sensor-based sorting (SBS) technology, including smart equipment utilizing machine learning, has emerged as a key area of research for engineering students and professionals in the field [5]. However, although research using sensor-based sorting has been ongoing for many years, it was only after the early 2000s that this technology gained prominence in the mining industry [12]. Prior to this, processing techniques using fine granulometries like flotation dominated this scenery, as practically the sole route in the mineral processing of sulfides.
Typically, SBS alone cannot achieve the enrichment ratios required for major mineral commodities, primarily due to the limited degree of liberation achievable in the particle size ranges handled by such equipment. Nevertheless, flotation without pre-concentration requires the grinding of high proportions of gangue minerals to particle sizes below 200 µm, a process that generates high demand for mill components and energy. Thus, the combination of pre-concentration and concentration methods appears to be the natural path forward for the modern mineral industry.
Figure 1, adapted from Murphy et al. [13], demonstrates the potential impact of introducing pre-concentration processes into traditional processing routes. In traditional routes, costs tend to increase steadily as ore grades decline. In contrast, routes incorporating pre-concentration are expected to mitigate this cost progression due to the benefits provided by sensor-based sorting techniques.
The objectives of the present study were as follows:
  • To conduct a critical review of the main concepts and techniques of froth flotation and pre-concentration by sensor-based sorting;
  • To identify potential and limitations in the application of the technique, as well as future perspectives on the subject.

2. Beneficiation of Metallic Sulfides

Metallic sulfides are characterized by the association of a given element with sulfur (Me + S), forming a molecule that often includes more than one type of metal atom. These sulfides are named according to their predominant metal and most industrial metals occur in this form.

2.1. Main Metallic Sulfides and Their Beneficiation

The majority of metallic mineral commodities occur in as sulfides, which are included in the group of industrial metals. The main metals beneficiated from sulfides are Cu, Zn, Pb, and Ni, representing 12%, 7%, 2%, and 1% of the total, respectively, as shown in Figure 2 [14].
Copper is the third most mined industrial metal in the world (Figure 2), accounting for 12% of the total production, with global reserves potentially reaching 3.5 billion tons [14]. Cu occurs in both sulfide and oxide forms, with the majority of production (approximately 80%) coming from sulfides [15]. Its larger mines are located in Chile, Australia, Peru, China, the USA, and Mexico [2], with flotation the most employed method of concentration. Table 1 provides the nomenclature and chemical compositions of the main copper minerals.
The most common zinc mineral is the sulfide sphalerite (ZnS), also known as blende. Other zinc minerals include silicates like willemite (Zn2SiO4) and hemimorphite (Calamine) (Zn4Si2O7(OH)2H2O), oxides such as zincite (ZnO) and franklinite (ZnFe2O4), and the carbonate smithsonite (ZnCO3) [16,17]. Zinc beneficiation is typically carried out by the flotation process, although leaching and gravimetric methods are also used.
The primary lead mineral is galena (PbS), a dense sulfide that exhibits a metallic shine [16]. Due to its high density, lead is usually processed using gravity methods for coarse fractions and flotation for fine particles.
As for nickel, it accounts for 2% of industrial metal production, with approximately 40% occurring as sulfides [14]. Nickel is widely used in metal alloys (with Cu, for example), special steels, and technological equipment such as nickel–cadmium batteries and catalysts. The main nickel sulfide is pentlandite (FeNiS), often associated with chalcopyrite or pyrrhotite, and these are concentrated by flotation.
Polymetallic deposits, where multiple economically valuable minerals occur together, are common among sulfides. Classic examples of this type of formation are occurrences of lead–zinc [16], copper–lead [18], copper–lead–zinc [19,20], copper–silver [21], and copper–silver–gold. The beneficiation process for these deposits is typically divided into several stages, where flotation can be used to selectively depress or float certain elements, maximizing metallurgical recoveries.

2.2. Concentration by Flotation

2.2.1. General Flotation Concepts

Flotation is a technique for the separation/concentration of minerals based on the wettability of mineral surfaces, a property that can be selectively altered through the use of chemical reagents. The process involves three key processes in solid (mineral), liquid (water), and gas (air) phases [22]:
  • Collision of mineral particles with air bubbles;
  • Adhesion (adsorption) and/or formation of air bubble–particle aggregate;
  • Transport of the aggregate to the liquid surface, where the particles are collected in a froth format.
Figure 3, adapted from [9,10], illustrates this process.
Metallic sulfides generally exhibit very similar behavior during flotation, enabling operational techniques for their separation from gangue minerals through bulk and/or selective flotation [23]. The performance of flotation is influenced by several key factors, including ore characteristics, mechanical cell parameters (such as cell design and configuration), and operating conditions (e.g., pH, pulp density, and aeration rate) [24,25]. Additionally, the selection and use of reagents (collectors, frothers, and modifiers) play a fundamental role in the success of the flotation process. For further insights into these topics, additional studies provide detailed discussions [9,10,11,23,24,25,26,27,28,29,30,31].

2.2.2. Challenges and Opportunities in Flotation

Michaux et al. [32] proposed a model for simulations of mineral-processing scenarios that rationalize water use by considering the impacts of recycled water on the process. However, the composition of recycled or alternative water can significantly affect flotation performance and plant reliability, necessitating careful consideration of its potential negative impacts [33].
Regarding alternative sources, Castro [34] states that marine or saline waters are often considered detrimental to the flotation of copper and molybdenum ores. However, the effect of sodium chloride and other electrolytes can enhance the floatability of some naturally hydrophobic minerals. Therefore, salinity itself should not be regarded as a limitation to its use in flotation.
Over 60% of the world’s copper deposits are porphyry deposits, e.g., Chilean and North American deposits, which collectively produce over 175 million metric tons [35] annually. However, traditional routes of flotation frequently struggle to process these ores and several deposits like them economically. SBS offers a potential solution by pre-concentrating these ores to a grade suitable for flotation. Cetin et al. [36] precisely studied this situation and obtained promising results for copper pre-concentration using sensor-based sorters equipped with multisensors, and CSIRO [37] presented interesting information as well. Tabelin et al. [35] and Tanaka et al. [38] are other examples of studies on flotation possibilities to process complex ores.
Tailing reprocessing is another emerging opportunity, given the global decline in ore grades. Hence, studies such as those by Santander and Valderrama [8] have explored the recovery of sulfides from old tailings using flotation. Videla et al. [39] determined the positive influence of ultrasound use in the flotation of copper tailings from a mine in Chile, with a copper content of 0.12%. More examples can be found in [40,41,42].
Innovations in flotation technology, such as carrier flotation using glass bubbles, aerosol collectors, and fluidized bed flotation, have shown the potential to enhance performance [43,44,45,46,47,48,49,50,51,52]. These technologies, along with others, confirm the potential for improving the overall efficiency and effectiveness of flotation processes.

3. Pre-Concentration by Sensor-Based Sorting (SBS)

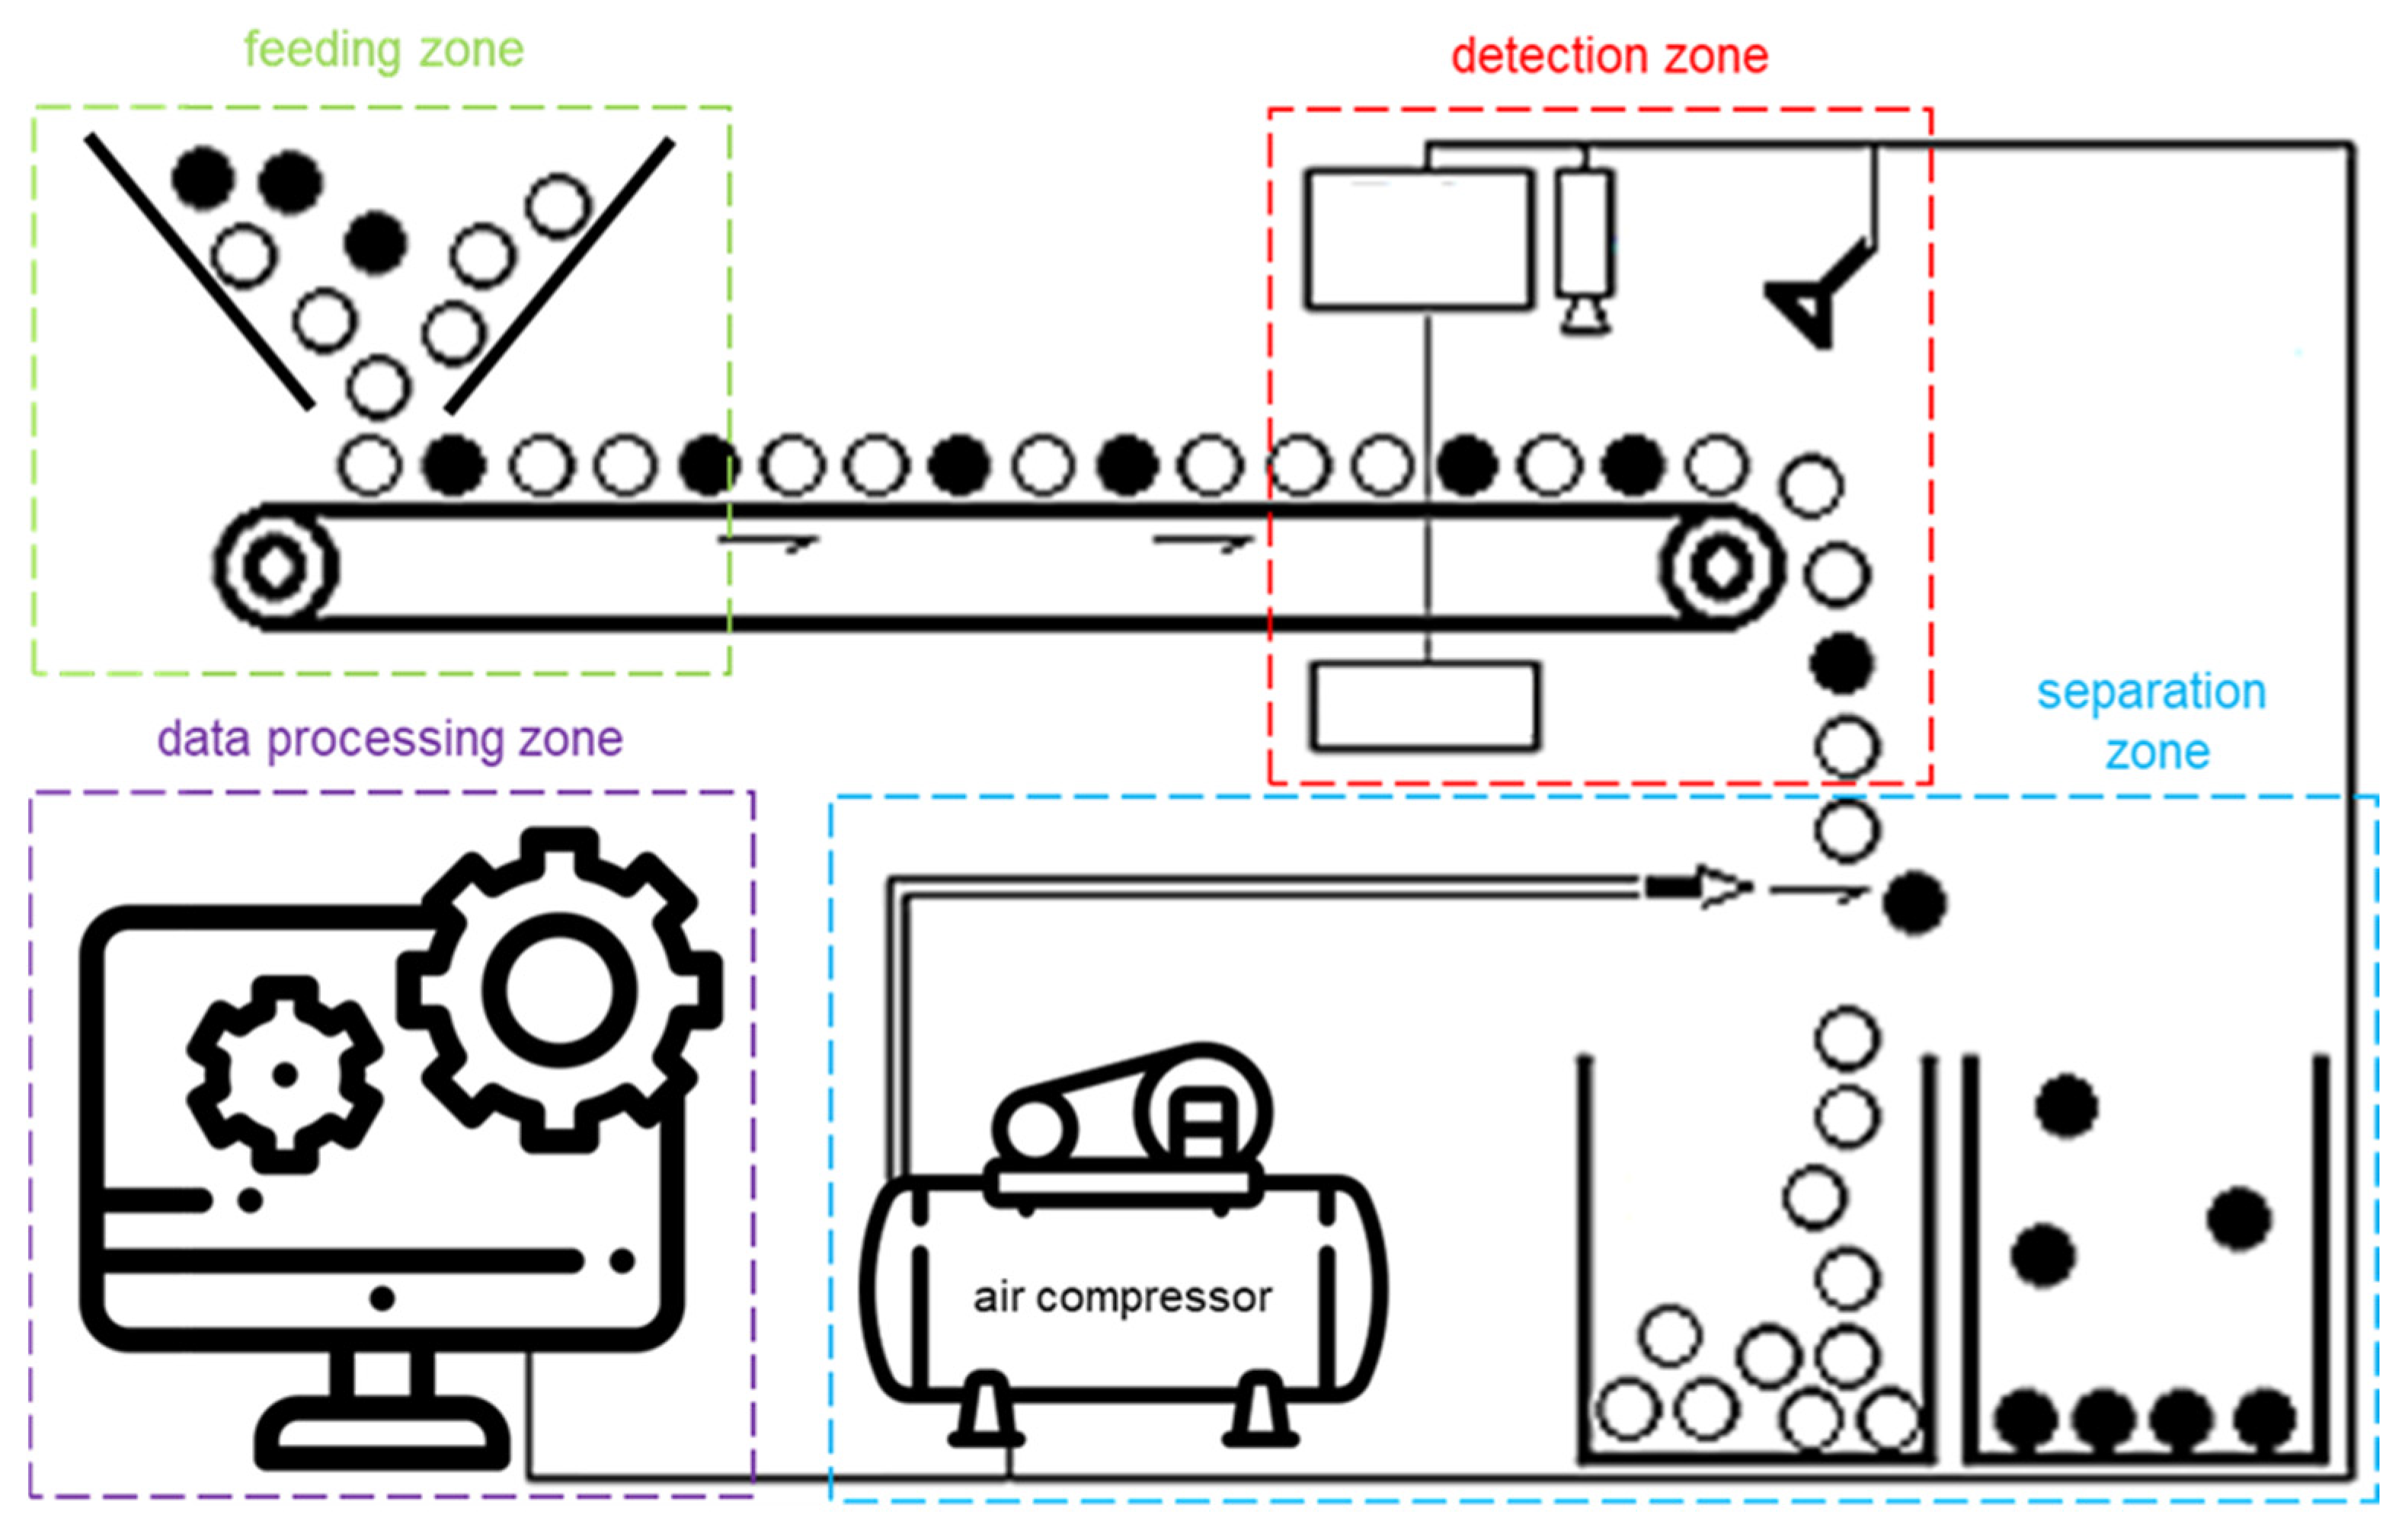
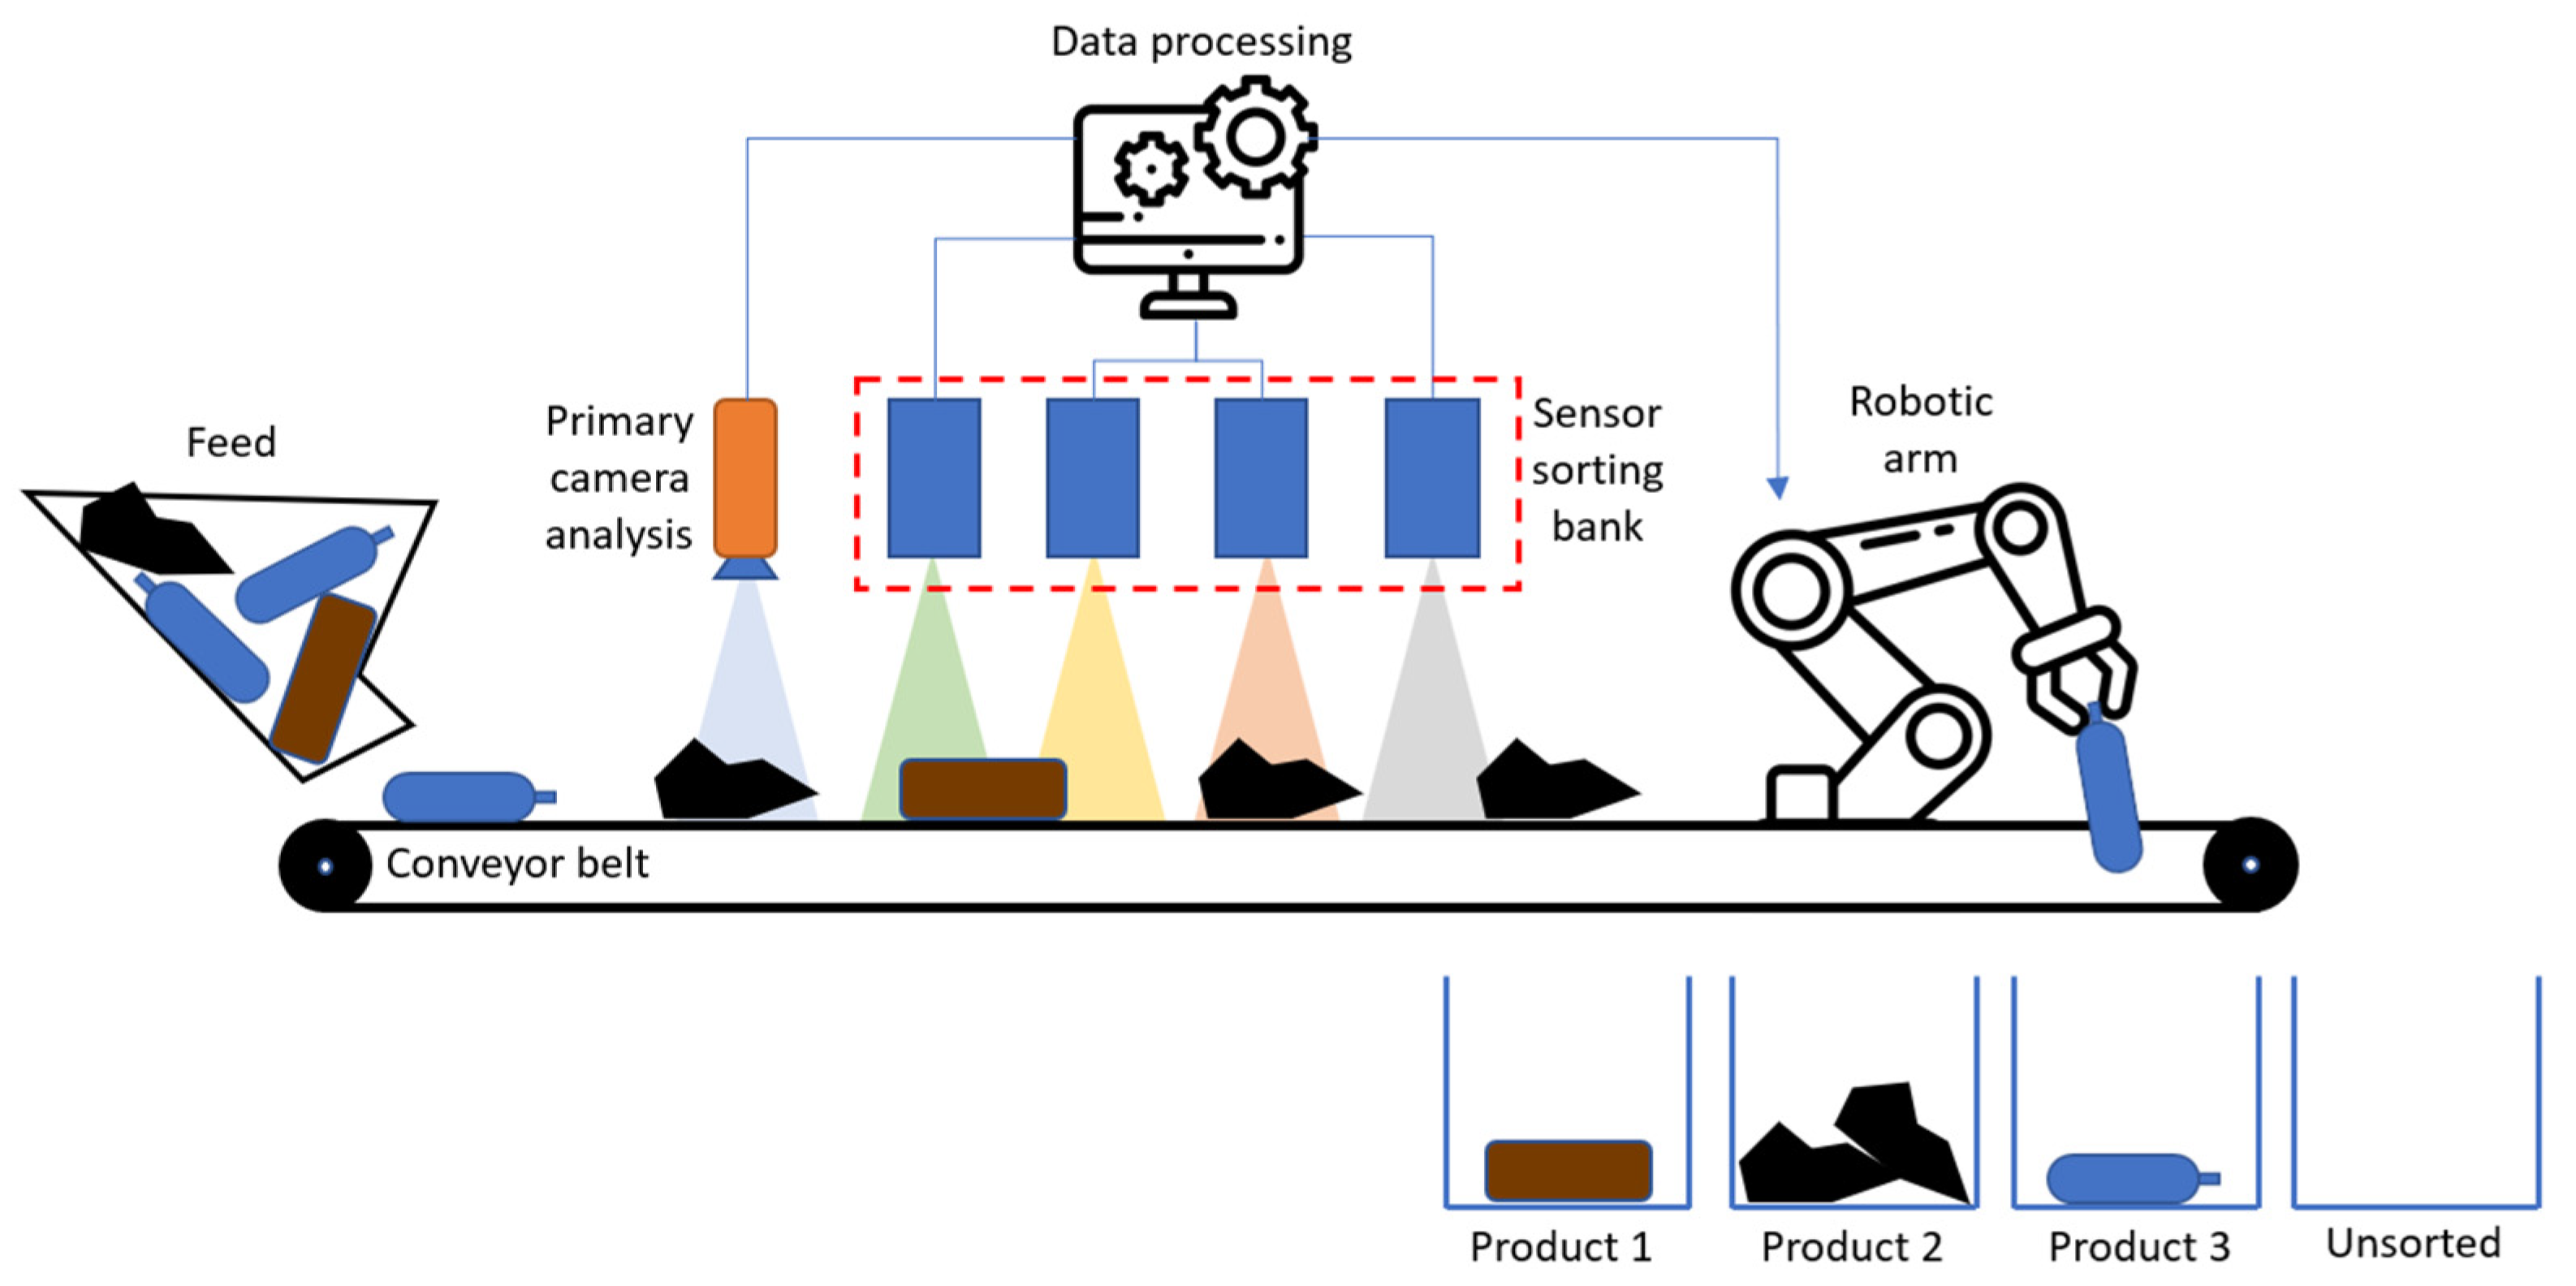
3.1. General SBS Concepts

The process of pre-concentration by SBS serves essentially to enact pre-concentration (primarily for low-grade ores), quality control of final products, and separation of ores into high-grade and low-grade fractions [12]. Among the options, the most commonly employed strategy in the mining industry is the use of sensor-based sorting for pre-concentration. This is typically implemented between the crushing and grinding processes to remove waste rocks, thereby improving the efficiency of downstream processing [53].
According to Ergün et al. [54], sensor-based sorting equipment (ore-sorter) consists of four basic components:
  • Feeding presentation system;
  • Detection system (sensor/sensors);
  • Processing system;
  • Material separation system.
The basic layout of such equipment is shown in Figure 4. Additionally, a key feature of SBS equipment is its ability to operate and perform analyses without direct contact with the material, enabling non-destructive and efficient processing [55].
For each of the previous stages, there are specific considerations that need to be made in order to achieve the optimal equipment performance. These considerations involve five basic steps (Table 2):
Another important consideration is the method of material analysis, which can be divided in two categories: bulk ore sorting (BOS) or particle sorting. In BOS separation, a volume of ore is analyzed on the conveyor belt and the whole composition is considered; therefore, the preservation of the natural heterogeneity between ore and waste during feeding is very important to efficient separation. This method is particularly effective for large-scale operations where rapid processing of bulk material is required.
On other hand, the particle sorting is based on the features of each particle individually, demanding that the particles are separated from each other and presented to the sensors in just one layer on the conveyor belt. This method allows for highly precise separation, as each particle is analyzed and sorted independently, making it particularly useful for high-value ores or when a high degree of accuracy is required.

3.2. Techniques and Equipment

The types of features detectable by sensors in sensor-based sorting include surface features, whole-particle features, secondary features (such as color, reflection, brightness, conductivity, density, magnetic susceptibility, etc.), and primary properties (mineralogical, chemical, and physical composition) [12]. Table 3 provides an overview of the main sensor types applied to sulfide selection [12,56].

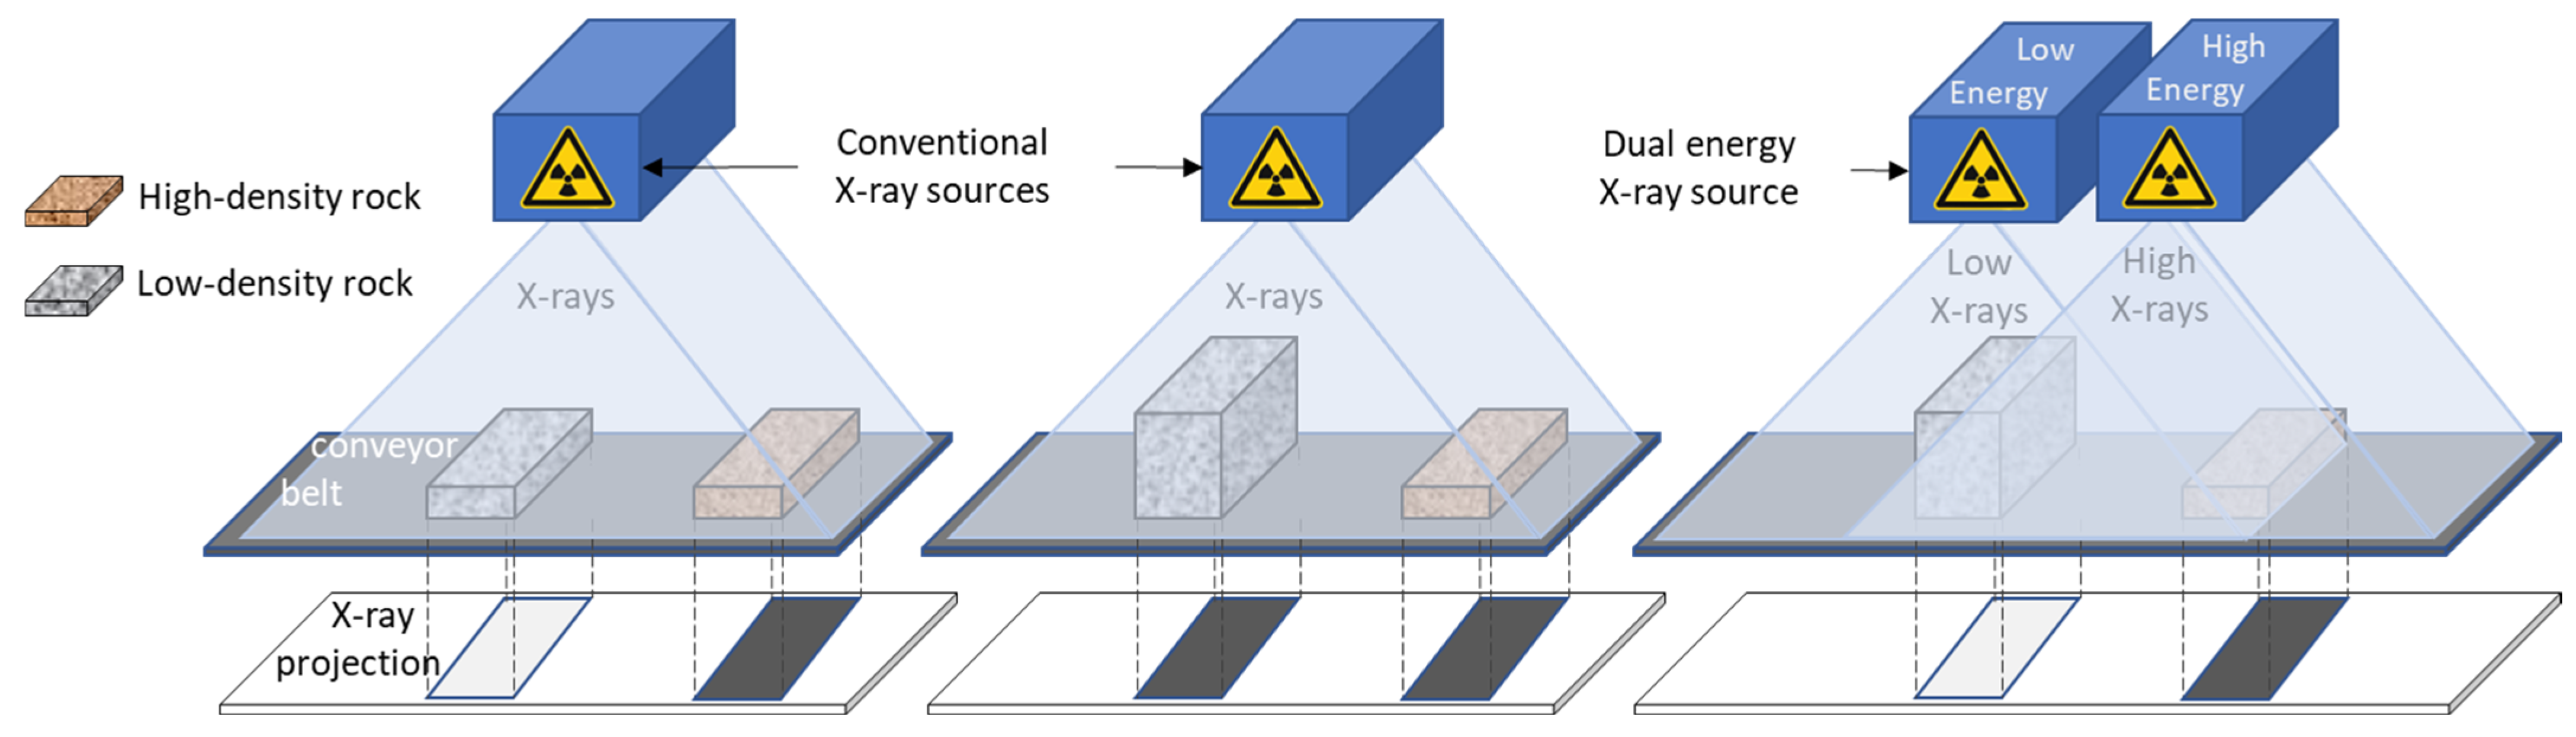
3.2.1. X-Ray Sensors

X-ray transmission (XRT) sensors are arguably the most versatile type of sensor, finding widespread use in applications where a measurable density difference exists between ore and gangue or between two types of ore [13]. This atomic density difference attenuates radiation differently, either proportionally (using single-energy methods) or non-proportionally (using dual-energy methods), based on the thickness of the specimens [57].
The effect of thickness, as described by [58], is as significant as variations in particle thickness. In other words, if the range of these differences is as large as the density variation, simple energy sensors are not suitable. As noted by Strauss [57], this issue can be mitigated through conditioning, such as using classifiers to limit the range between the largest and smallest particles to a ratio of approximately 1:3.
With dual-energy sensors, which are widely used, radiation is generated in two bands, allowing each pixel to be classified according to its specific atomic density, attenuating the effect of thickness. The DE-XRT sensor system records the interaction of radiation with the material through two channels of different radiation intensities (high and low energies). Figure 5 provides a complete illustration of this phenomenon.
This process generates grayscale images, where dark colors represent denser areas and light colors represent less dense areas. Specialized software can then process these images, producing a single image with a hierarchical color scale (false color) for enhanced analysis [59].

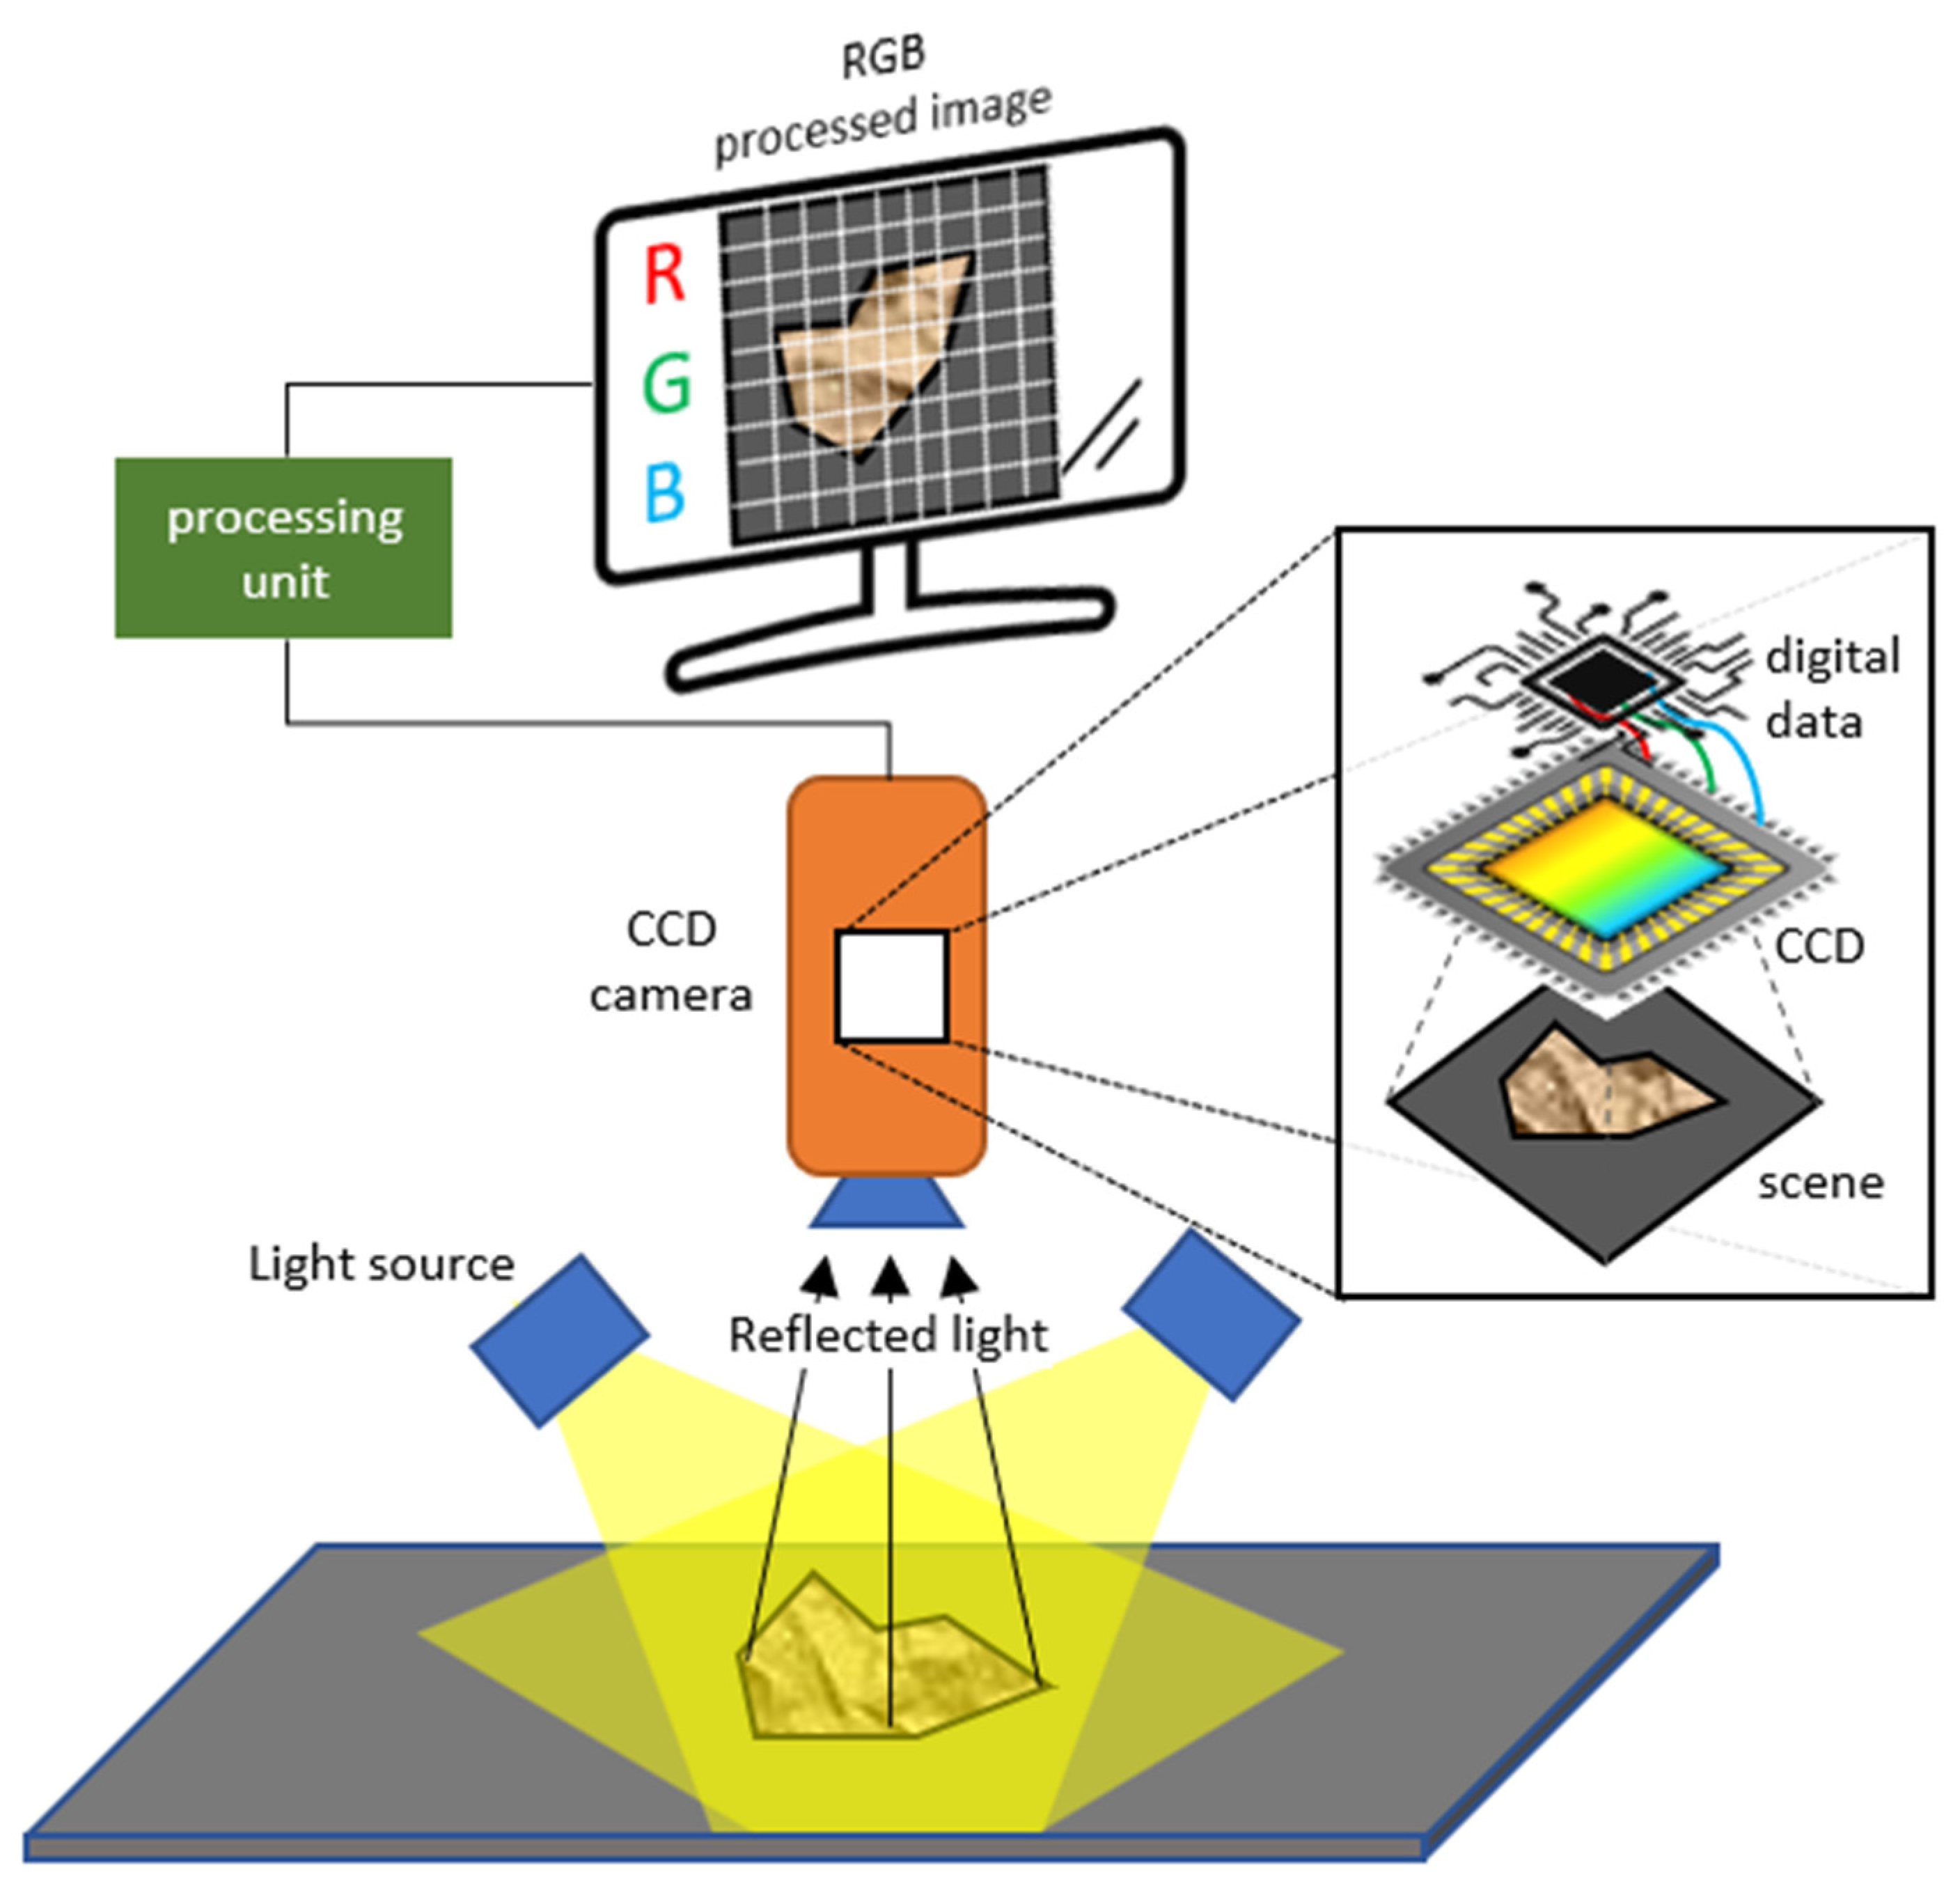
3.2.2. Visible Light
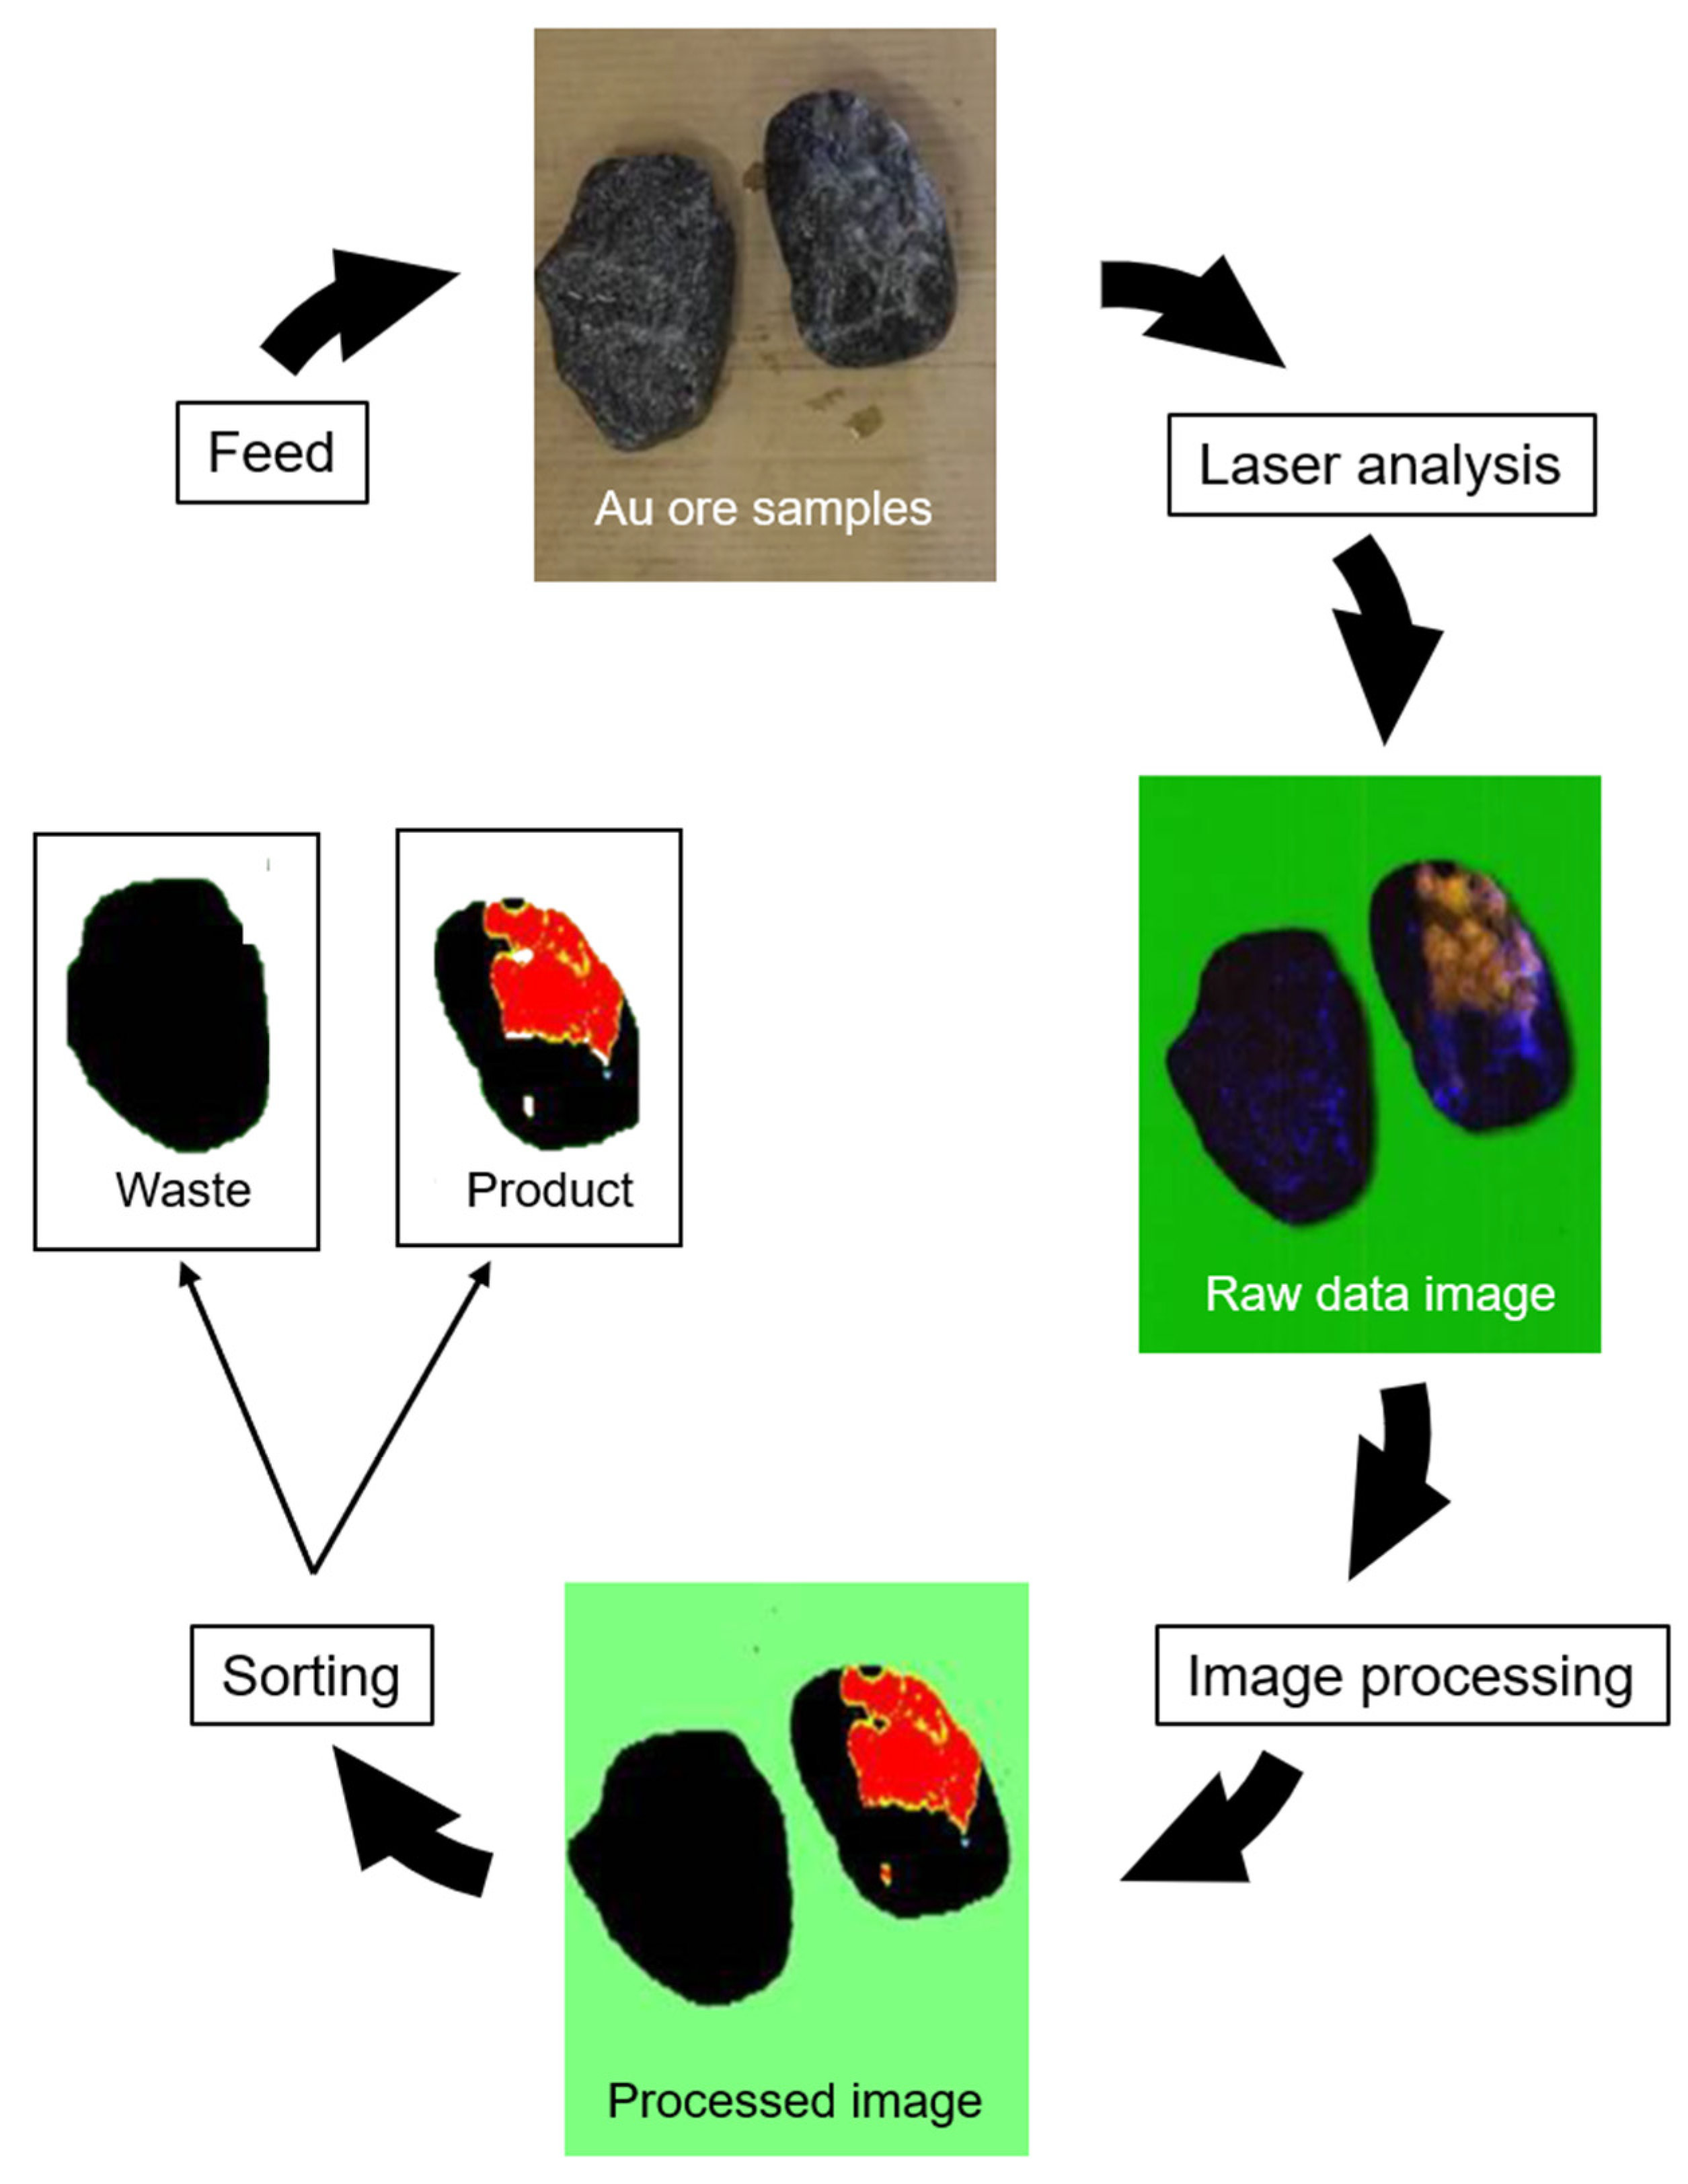
Visual sensor technology (or VISs—visual image sensors) operates within the wavelength range of the human eye’s vision sensitivity (390–780 nm). These sensors possess a photosensitive area that, upon interacting with varying light intensities reflected by a specific object, generates measurable electrical signals. Devices that work in conjunction with optical systems are commonly referred to as digital cameras [60].
These cameras utilize a component known as a charge-coupled device (CCD), which functions similarly to photographic film. Additionally, cameras equipped with complementary metal-oxide semiconductors (CMOSs) are now widely used as sensors. This system adopts the same technology as other typical semiconductors, resulting in reduced costs [61].
The Figure 6 presents the scheme of operation, where the light reflected from the sample is captured by the CCD camera, transformed in digital data and sent to a processing unit. The images generated by these sensors are composed using a color model, with RGB (red, green, and blue) being the most commonly used. Thus, each color can assume 28 or 256 different intensity values, ranging from 0 to 255.
These sensors have a wide range of applications in sensor-based sorting [54]; depending on the nature of the deposit, optical classification can be used for pre-concentration or to obtain a high-quality final product for various minerals, such as magnesite, limestone, quartz, feldspar, coal, barite, or copper. Another important consideration, according to Kolacz [62], is the conditioning of the material before feeding it to the equipment. The material should be as free as possible from impurities on its surface. While washing is the most traditional method for cleaning these materials, it can pose challenges if there are restrictions on moisture in subsequent processes or if the material cannot be wetted due to intrinsic reasons or water scarcity at the deposit site.

3.2.3. Laser

Three-dimensional laser sensors provide information about surface characteristics, including shape, size, roughness, and brightness. When used in conjunction with other sensors, they allow for precise determination of the particle’s exact position on the conveyor belt, facilitating accurate ejection. In summary, their operation relies on the detection of laser reflection and diffraction from the surface of the analyzed particles [57].
LIBS (laser-induced breakdown spectroscopy) is a detection system that considers the elemental composition of the material being analyzed. It generates plasma when a pulsed laser interacts with the material, with responses potentially reaching temperatures of 10,000 K. The photons emitted by the plasma are captured by a spectrophotometer that can be calibrated across different spectral ranges [63].
For laser-based sensor sorting equipment, separation is based on the penetration of light according to the material’s structure. Strauss [57] notes that some materials lacking sufficient contrast for color-based separation but exhibiting compositional differences can respond well to laser use. Figure 7 illustrates an example of detecting a quartz-rich area in a rock sample, which in this case hosts gold mineralization. Further details about the technique can be found in [60,63,64,65].

3.2.4. Near-Infrared and Short-Wave Infrared (VNIR-SWIR)

Sensor-based sorting systems that operate using near-infrared (NIR) spectroscopy analyze the interaction between electromagnetic radiation and rock [66]. According to Robben and Wotruba [67], the advantage of this type of sensor is that it is based on the primary properties of minerals. Each mineral species emits a different spectral response when exposed to NIR, allowing for precise identification and separation.
In operational terms, the equipment exposes the material to a source of energy in the NIR range. Some of the radiation is absorbed by the mineral molecules, while another portion is reflected and detected, resulting in a specific spectral signature that is recorded [67]. These devices can operate over a wider particle size range since the analysis considers the chemical composition of the ore and is independent of thickness or other physical features.
VNIR-SWIR hyperspectral sensors work in the wavelength range of 380–2500 nm and have been widely used in material identification and characterization across various scientific fields [68,69]. Regarding their use specifically in the SBS field, studies such as [70,71,72] are examples of the successful use of these sensors on metallic minerals.

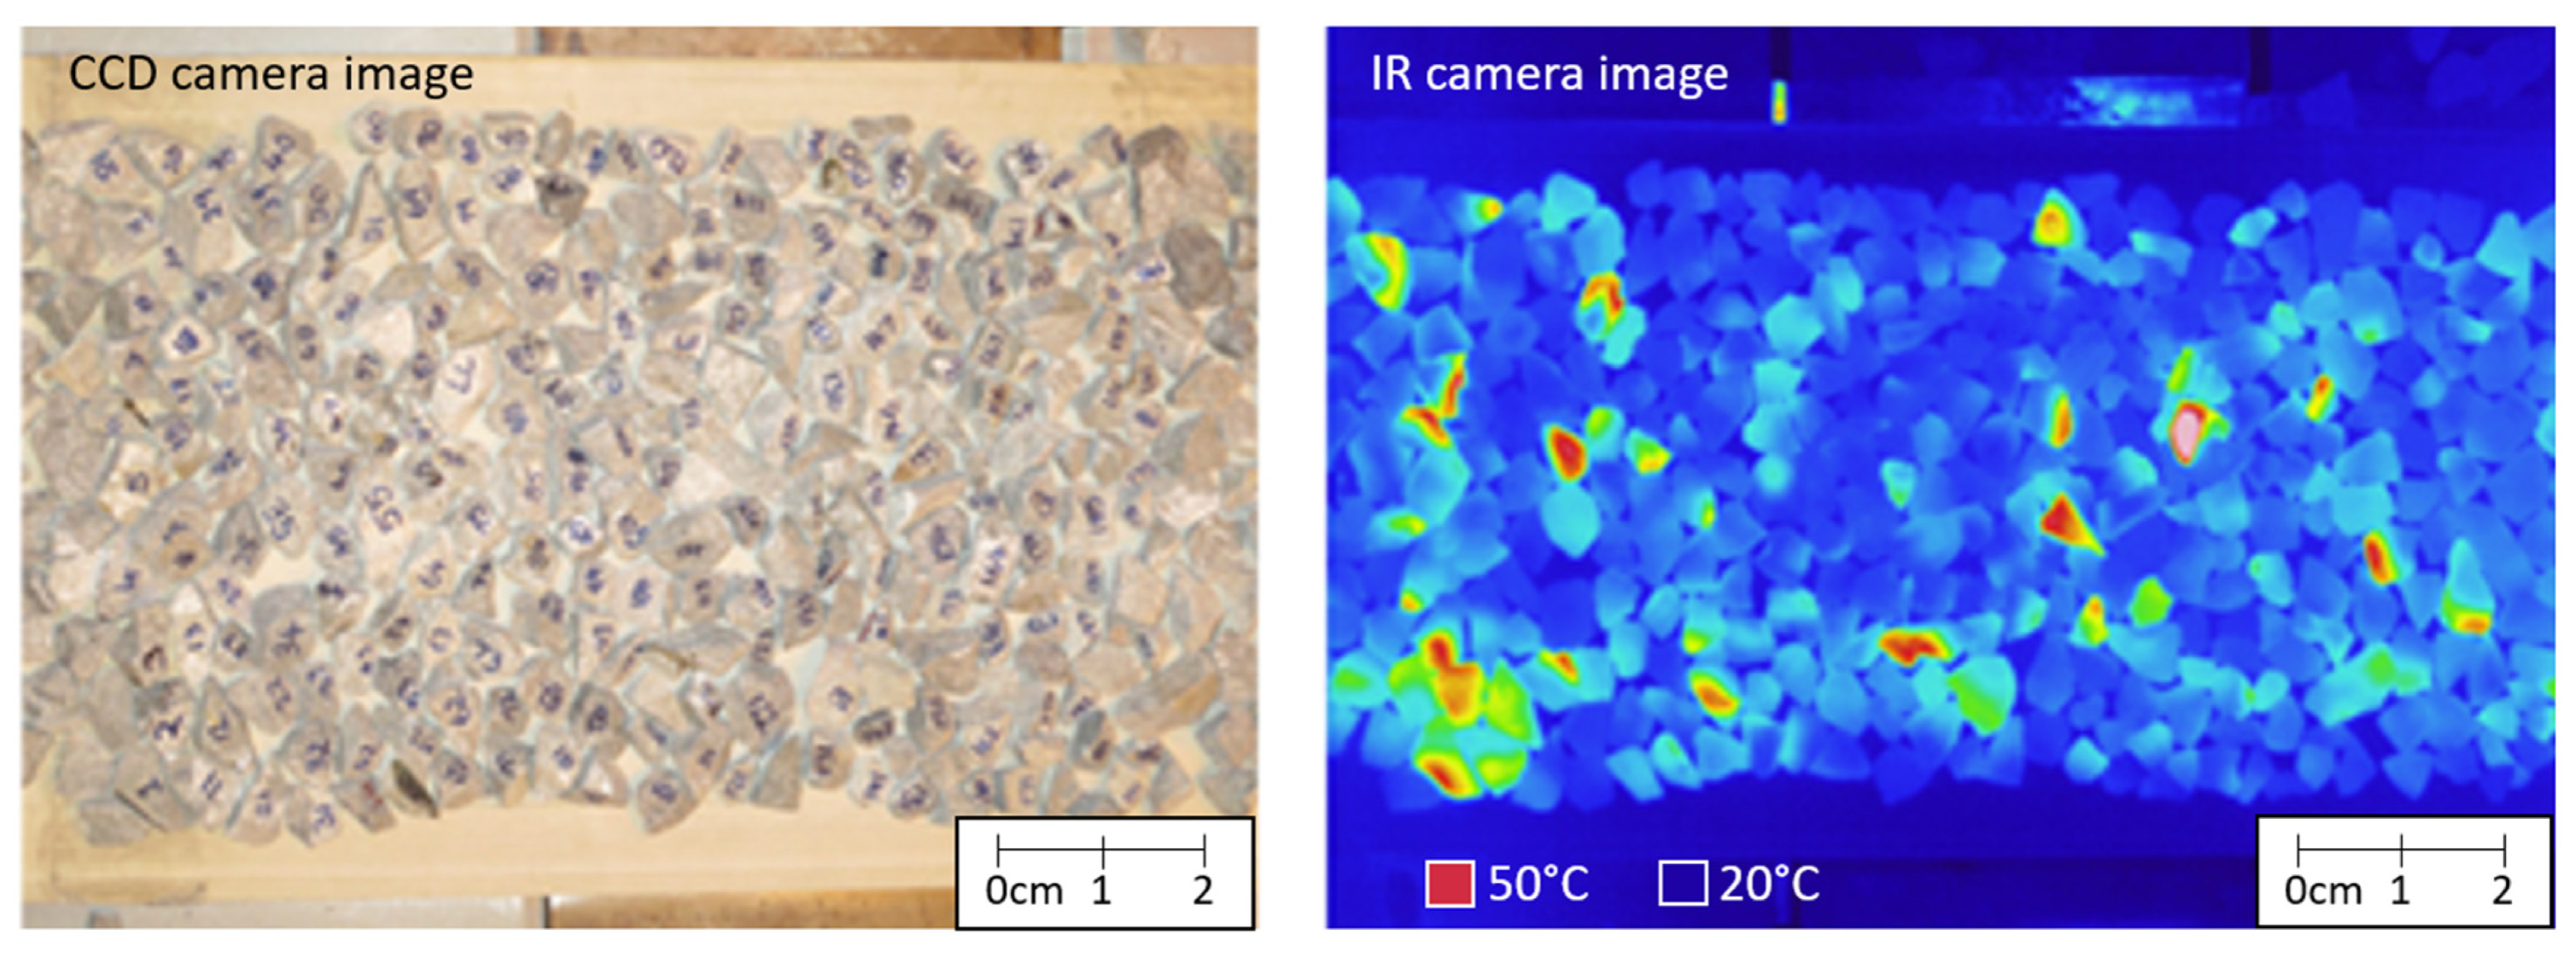
3.2.5. Microwaves (MW-IRT)

Microwave (MW) heating has been proposed as a selection technique based on the differential elevation of temperatures of ore particles, enabling the distinction between different grades and/or compositions. This method relies on the dielectric properties of the material, which is linked to its ability to heat to varying degrees when exposed to MW heating. Additionally, consequent changes in the electromagnetic field can be measured to further differentiate materials [73,74].
This mechanism is highly effective for elements that strongly absorb microwaves (e.g., nickel, copper, gold, and other metallic sulfides) as well as minerals containing molecular or free water (e.g., smectite clays, which may also have undesired effects) [75]. These minerals can be separated from those that exhibit little or no response to MWs, such as quartz, feldspar, mica, and other non-sulfide minerals [73]. Examples of this differential heating can be observed in Table 4, which was adapted from [64].
The detection of this sample heating is performed by thermal image sensors (infrared thermal—IRT), which collect information immediately after exposure to microwaves (MWs). In the IR spectrum, the heating can be observed on the samples surface and differentiated from other samples using a false color [64,74]. Figure 8 presents a group of copper ore samples analyzed in laboratory, where the response under a MW source could be determined by a thermal scan, showing hot zones (red/yellow) coinciding with high-grade particles and cold zones (green/blue) coinciding with low-grade or non-mineralized particles.

3.2.6. Radiowaves

This technique is capable of detecting the mineral signature based on the radiofrequency pulses that are returned by each one, also known as magnetic resonance (MR). Due to the inherent resonance difference between two distinct material types, the echo magnitude is proportional to the number of crystalline units of a specific mineral, varying according to its composition/concentration, as shown in Table 5, which was adapted from [76].
The most relevant works related to radiofrequency wave resonance (RF) are associated with Australia’s National Science Agency [37], which has proposed the use of this technique as a potential revolution in the sensor-based sorting sector. Because it is based on the compositional characteristics of minerals, this technique can easily discriminate between different types of ores and gangues without the need for recalibration. However, according to [36], there are also some limitations, such as the inability of the technique to detect certain mineral species, for example, bornite (one of the most abundant Cu sulfides).
Ferrari-John et al. [75] mention another application of RF waves, used for differential particle heating. According to the authors, this method can yield better results than using microwaves (MWs), avoiding the potential noise generated by hydrated or free-water minerals. Further details on this application can be found in their paper.

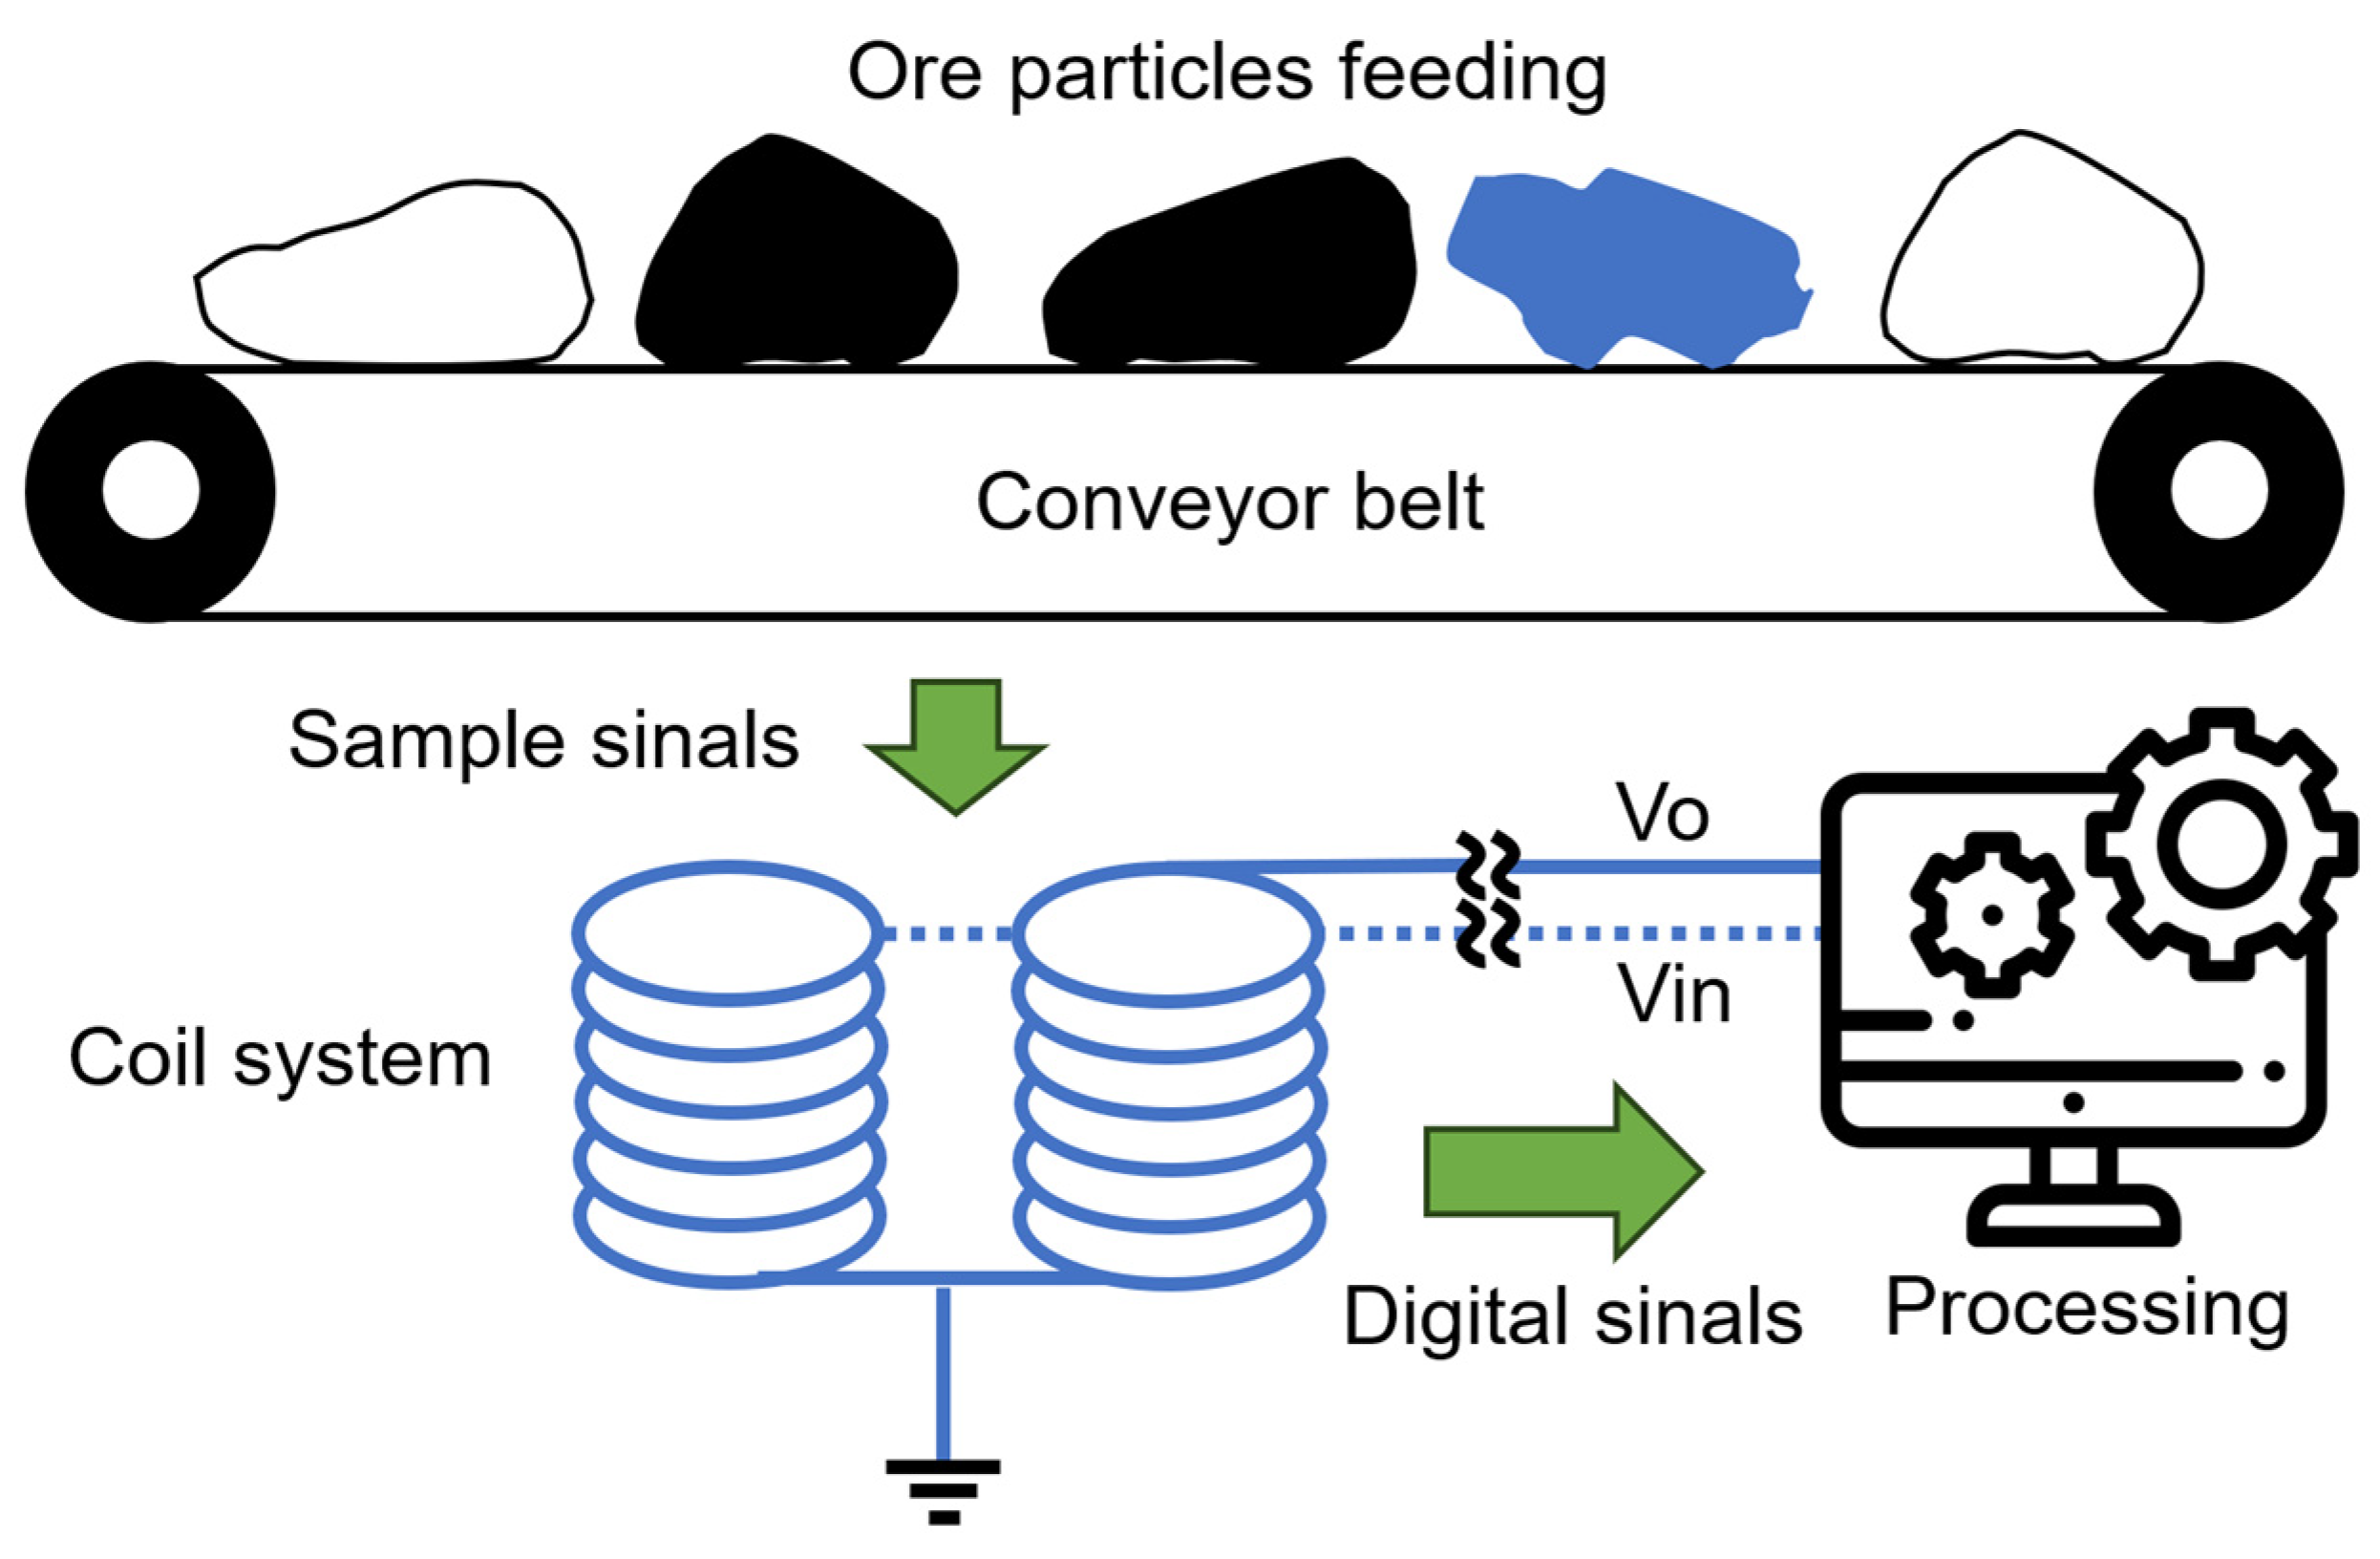
3.2.7. Electromagnetic Devices

In recent years, ore sorters based on electromagnetic methods have been rapidly developed, showing significant potential for pre-concentration, particularly due to their possible use in small particle sizes. Two approaches are feasible for this separation: one exploits the galvanic characteristics of particles, while the other focuses on inductive properties [77].
The galvanic method has several limitations, which can be found in the literature. However, the inductive method, which measures rock impedance based on Faraday’s law, is highly applicable. In this method (Figure 9), a pair of electrodes is installed beneath the conveyor belt (coil system) generating a magnetic field and variations in voltage when rocks are subjected to this field are measured (processing) and used as separation criteria [77].
Magnetic sorting is also considered a type of ore sorter; however, its reliance on a magnetic roll and the absence of advanced sensor systems raise questions about its classification as a true sensor-based sorting method. As a result, these devices will not be addressed in this paper. For those interested in further details, references [78,79] can be consulted.

3.2.8. Sensor Fusion

In addition to sensors that inherently require a combination of devices for their operation, such as MW + IR or laser + camera, various complex mineral materials only exhibit a good response to sensor-based sorting when multiple sensors are used simultaneously. In such cases, one sensor can compensate for any limitations of the other. Kattentidt et al. [80] asserts that the use of equipment combining multiple sensors holds significant potential for gains in the processes where they are employed. This potential is realized in the sensor-based sorting equipment currently manufactured by major industry players.
The concept of technical synergy, as reported by Cetin et al. [36], confirms that sensor fusion techniques provide higher precision for grade measurements. The authors cite an example of using MR (magnetic resonance) in conjunction with PGNAA (prompt gamma neutron activation analysis) for low-grade copper concentration. Individually, each sensor may lack economic viability or exhibit very low performance [net smelter return (NSR) close to zero or below]. However, when both techniques are used in combination, the phenomenon of “technical synergy” emerges, resulting in a positive net smelter return (NSR) in all simulated scenarios. Both these cases are presented in Figure 10.

3.2.9. Other Techniques

In addition to the previously mentioned techniques, Table 6 provides examples of other sensors that are predominantly employed for different types of ores, such as diamonds. Works such as [56,64,81,82,83,84,85,86,87] serve as valuable sources for further details.

3.3. Technical Challenges

The primary criteria for successfully applying the SBS technique are threefold [64,88]:
  • Existence of a sufficient degree of ore vs. gangue liberation;
  • Feasibility of identifying ore and gangue using an available SBS technique;
  • Production rate.
Regarding the first criterion, the degree of liberation is directly linked to the material’s particle size distribution. In other words, the smaller the particle size, the greater the likelihood that ore minerals are separated from gangue minerals. However, operating SBS in excessively small size ranges becomes a significant challenge, as equipment productivity drops substantially and comminution costs rise. For instance, the capacity of a DE-XRT device decreases from 110 t/h·m in a 40–75 mm range to 15 t/h·m in a 6–8 mm range [88].
Several studies indicate that better performance results are not necessarily achieved in smaller particle size ranges, even though a higher degree of liberation is expected. Dias Júnior [89] conducted tests on chromite ore, analyzing recovery and grades through concentration using a DE-XRT sensor and neural network simulation. In both cases, the highest metallurgical recoveries were observed in the coarser size fraction (+4–5″), with 91.56% and 54.59%, respectively. These values dropped to 18.49% and 31.88% in the intermediate fraction (+3–4″) and to 1.91% and 13.33% in the finest fraction (+2–3″). Amorim Júnior [90] tested DE-XRT sensors applied to zinc ore, obtaining metallurgical recoveries ranging from 45% to 90% for the finer fraction (+16–35 mm) and from 45% to 97% for the coarser fraction (+35–100 mm).
Building on the work of Peukert et al. [91] and Bamber [3], Figure 11 illustrates the distribution of metallurgical recovery versus particle size for 49 results from several studies, such as [92,93,94,95,96,97,98,99] (the complete dataset is available in the Supplementary Materials, Table S1). Notably, all metallurgical recoveries below 85% fall within the smaller particle size ranges (i.e., particle sizes below 110 mm), as delineated by the red lines.
Sensor resolution is also a key factor, as smaller particle sizes result in lower representativity in terms of pixel count or sensor response, eventually reaching the operational limit of the equipment. Therefore, the optimal particle size range for each SBS operation should be determined by comparing the responses of different size fractions and their respective performance during separation, aiming for the best possible balance between the degree of liberation and the characteristics of the sensor used.
Further analyzing the database used to construct the previous graph (Figure 11) reveals notable trends, as shown in the histograms in Figure 12. Specifically, 75% of the analyzed results exhibited metallurgical recoveries above 85%. In terms of feed particle size, the most commonly used range was between 98 and 128 mm. However, it is also evident that more than 60% of the studies employed particle size ranges below 98 mm, which tends to result in lower recoveries.
Regarding the second criterion, Section 3.2 provided a detailed overview of the most commonly used SBS techniques and their affinities with various types of sulfide mineral commodities. This information can serve as a reference for determining the feasibility of identifying ore and gangue using available SBS techniques.
As the third criterion, the production rate, referring to the capacity per meter of belt width for SBS equipment (t/h×m), as parametrized by Robben et al. [88], is presented in Table 7. The results, simulated using data from the previous 49 studied cases, show that approximately 30% of these cases had a production limit of 60 t/h×m. In practical terms, achieving a production rate of 180 t/h would require at least three ore sorters with a 1 m width. However, this rate is still considered low for large-scale mining operations.

3.4. Performance Analysis

Traditional performance indicators used in beneficiation processes are also applied to ore sorters. These include the enrichment ratio, mass recovery, metallurgical recovery, economic indicators, and more [36,89,90,100,101,102,103,104]. When it comes to analyzing the performance of separators, relevant concepts for graphical representation of these indices are detailed in the publications by [105,106]. These studies demonstrate the possibility of using techniques already employed in other binary classifications for a more detailed performance analysis of sensor-based sorting [107].
Among these indices are accuracy, precision, specificity, sensitivity, true/false positives/negatives, and others. These indicators are related to the so-called confusion matrix (Table 8), which represents the mass balance obtained during separation. The formulas for calculating these indices are given by Equations (1)–(3).
Accuracy = (TP + TN)/(P + N),
Specificity = TN/(FP + TN) = TN/N = 1−FPr
Sensitivity = TP/(FN + TP) = TP/P = TPr
When speaking about specificity and sensitivity indices, it is worth noting that these are the indicators used in constructing the so-called ROC (receiver operating characteristics) curve. The ROC curve is plotted with sensitivity values ranging from 0 to 1 on the y-axis, representing the true positive rate (TPr) (Figure 13). Meanwhile, the x-axis represents the false positive rate (FPr), obtained by subtracting 1 from specificity [107,108,109].
These indicators were employed in the performance analysis of the separation of magnesite, quartz, lignite, hematite, copper ore, and gold ore samples [103]. They simulated separation scenarios across various particle size ranges, ranging from −50 + 9.5 mm to −150 + 18 mm, while also considering variations in the hourly feed tonnage.
The authors’ main conclusions were as follows:
  • Samples with higher ore vs. reject contrast (e.g., magnesite and quartz) yielded better results than samples with moderate contrast (lignite and hematite) or low contrast (copper and gold).
  • Efficiency of classification decreased as the feed rate increased.
This method of performance analysis, or sortability, has also been applied by other researchers [36,73,74,108,109].

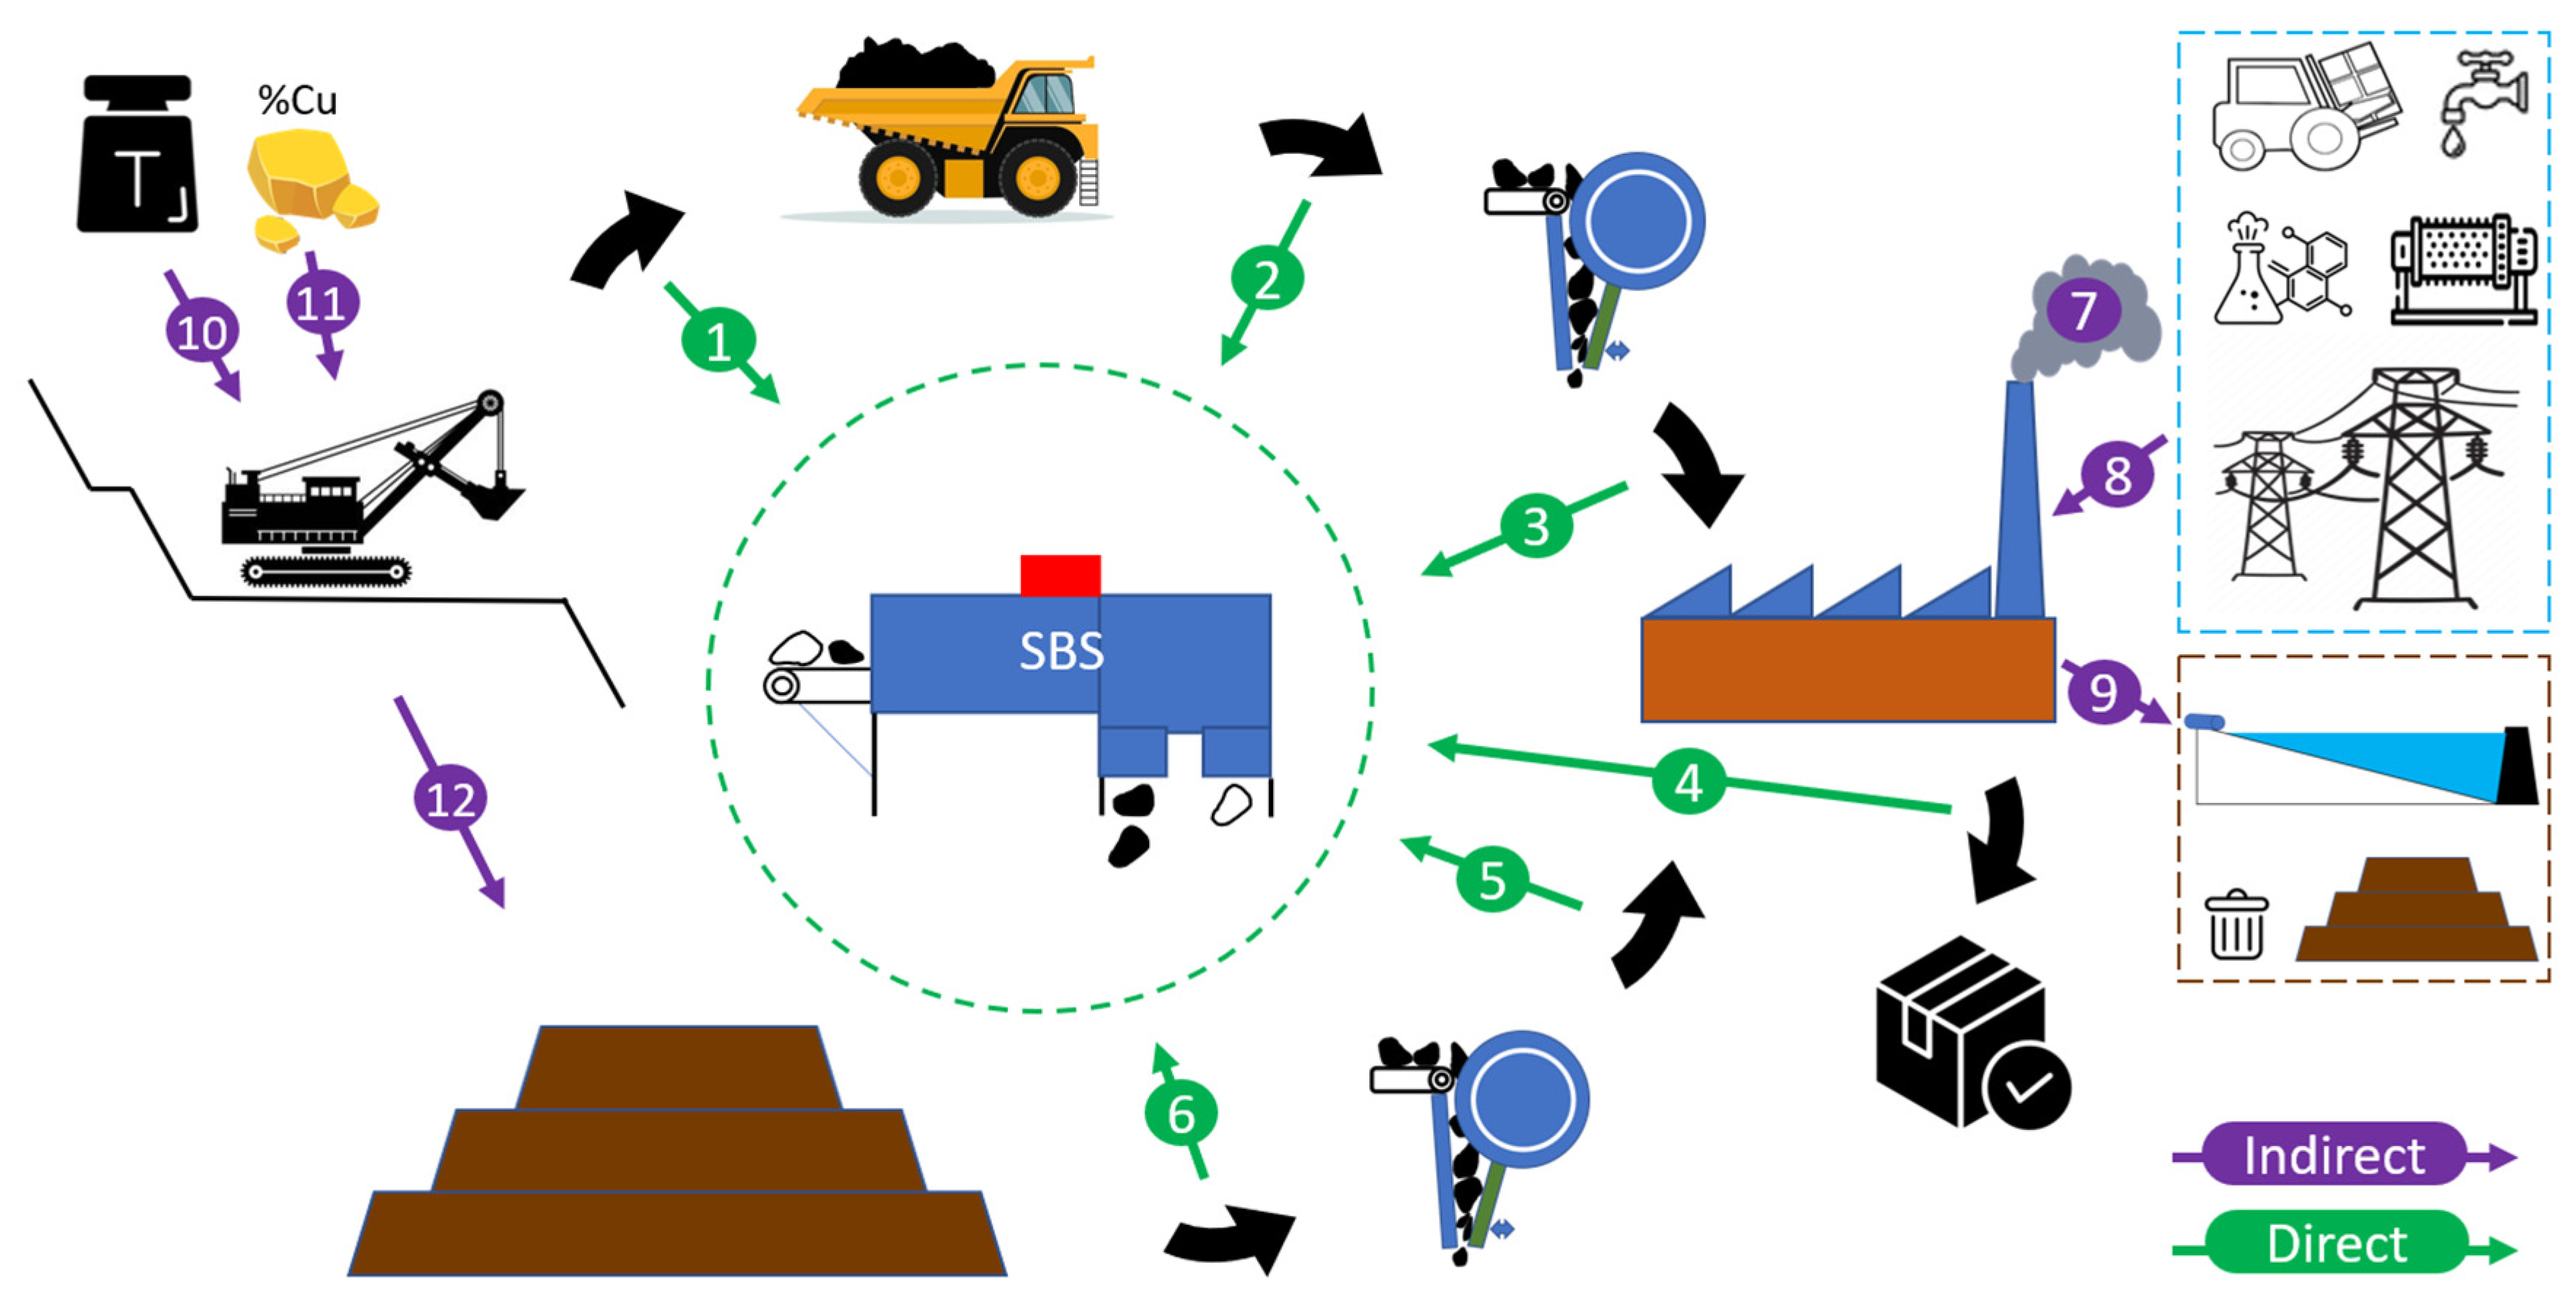
4. Impacts of Pre-Concentration in the Beneficiation Process

Given the lack of direct and explicit studies on the impacts of pre-concentration in the mineral beneficiation process, substantial contributions in this area remain scarce [110]. The studies presented in this topic underscore the need for further research to address that gap.

4.1. Case Study I: QZ Ohio Ore—Australia

A study conducted by Rizmanoski [74] in Australia tested the applicability of microwave (MW) technology for separating copper ore known as “QZ Ohio Ore”. The study analyzed the impact of this separation on subsequent grinding and flotation stages. The ore was divided into three cut-off grades based on its response to MWs (approximately 2 kg each): a hot fraction (highest sensor response), an intermediate fraction, and a cold fraction (lowest response).
As shown in Figure 14A, for the two tested grinding times, the P75 particle size distribution exhibited a significant reduction, indicating a positive influence of pre-concentration on grinding efficiency. When considering the 15 min grinding curve, the particle size reduction was approximately 15%, while for the first 10 min, it was around 17%.
There was also a similarly significant contribution to the flotation results, showing an increase in mass recovery for the “hot” fraction, which was approximately 30% higher at all times compared to the other fractions. The graph presented in Figure 14B displays cumulative Cu recovery data over flotation time, where the curve representing the hot material yielded the best results within the first minute of flotation, indicating better kinetics in practice and requiring less residence time in the tanks for metal recovery.

4.2. Case Study II: Polymetallic Ore—Aripuanã, Brazil

A case study conducted by Lopes at al. [111] investigated the application of pre-concentration using sensor-based sorting for polymetallic ore (Zn, Pb, Cu). Approximately 20 tons of samples were processed using XRT sensors. The results for Zn and Pb are demonstrated in Figure 15. The pre-concentration circuit increases the overall metallurgical recovery of zinc and lead, by 2% and 11%, respectively. The mass reductions in the total ROM almost equal 40% and, additionally, there were gains in all of other aspects analyzed in the plant mass balance. Notably, the Pb fraction exhibited more significant improvements, with a reduction in losses from 15.9 tons per day (tpd) to 9.3 tpd and with recovery increasing from 68.8 to nearly 80.0 tpd.
It is also worth noting that the study considered reducing the plant’s feed mass while keeping the initial feed constant. However, if there was an increase in feed from the mine, it would be possible to adjust the pre-concentration product to achieve roughly the same current initial feed (but with a higher grade), thereby increasing daily metal production.

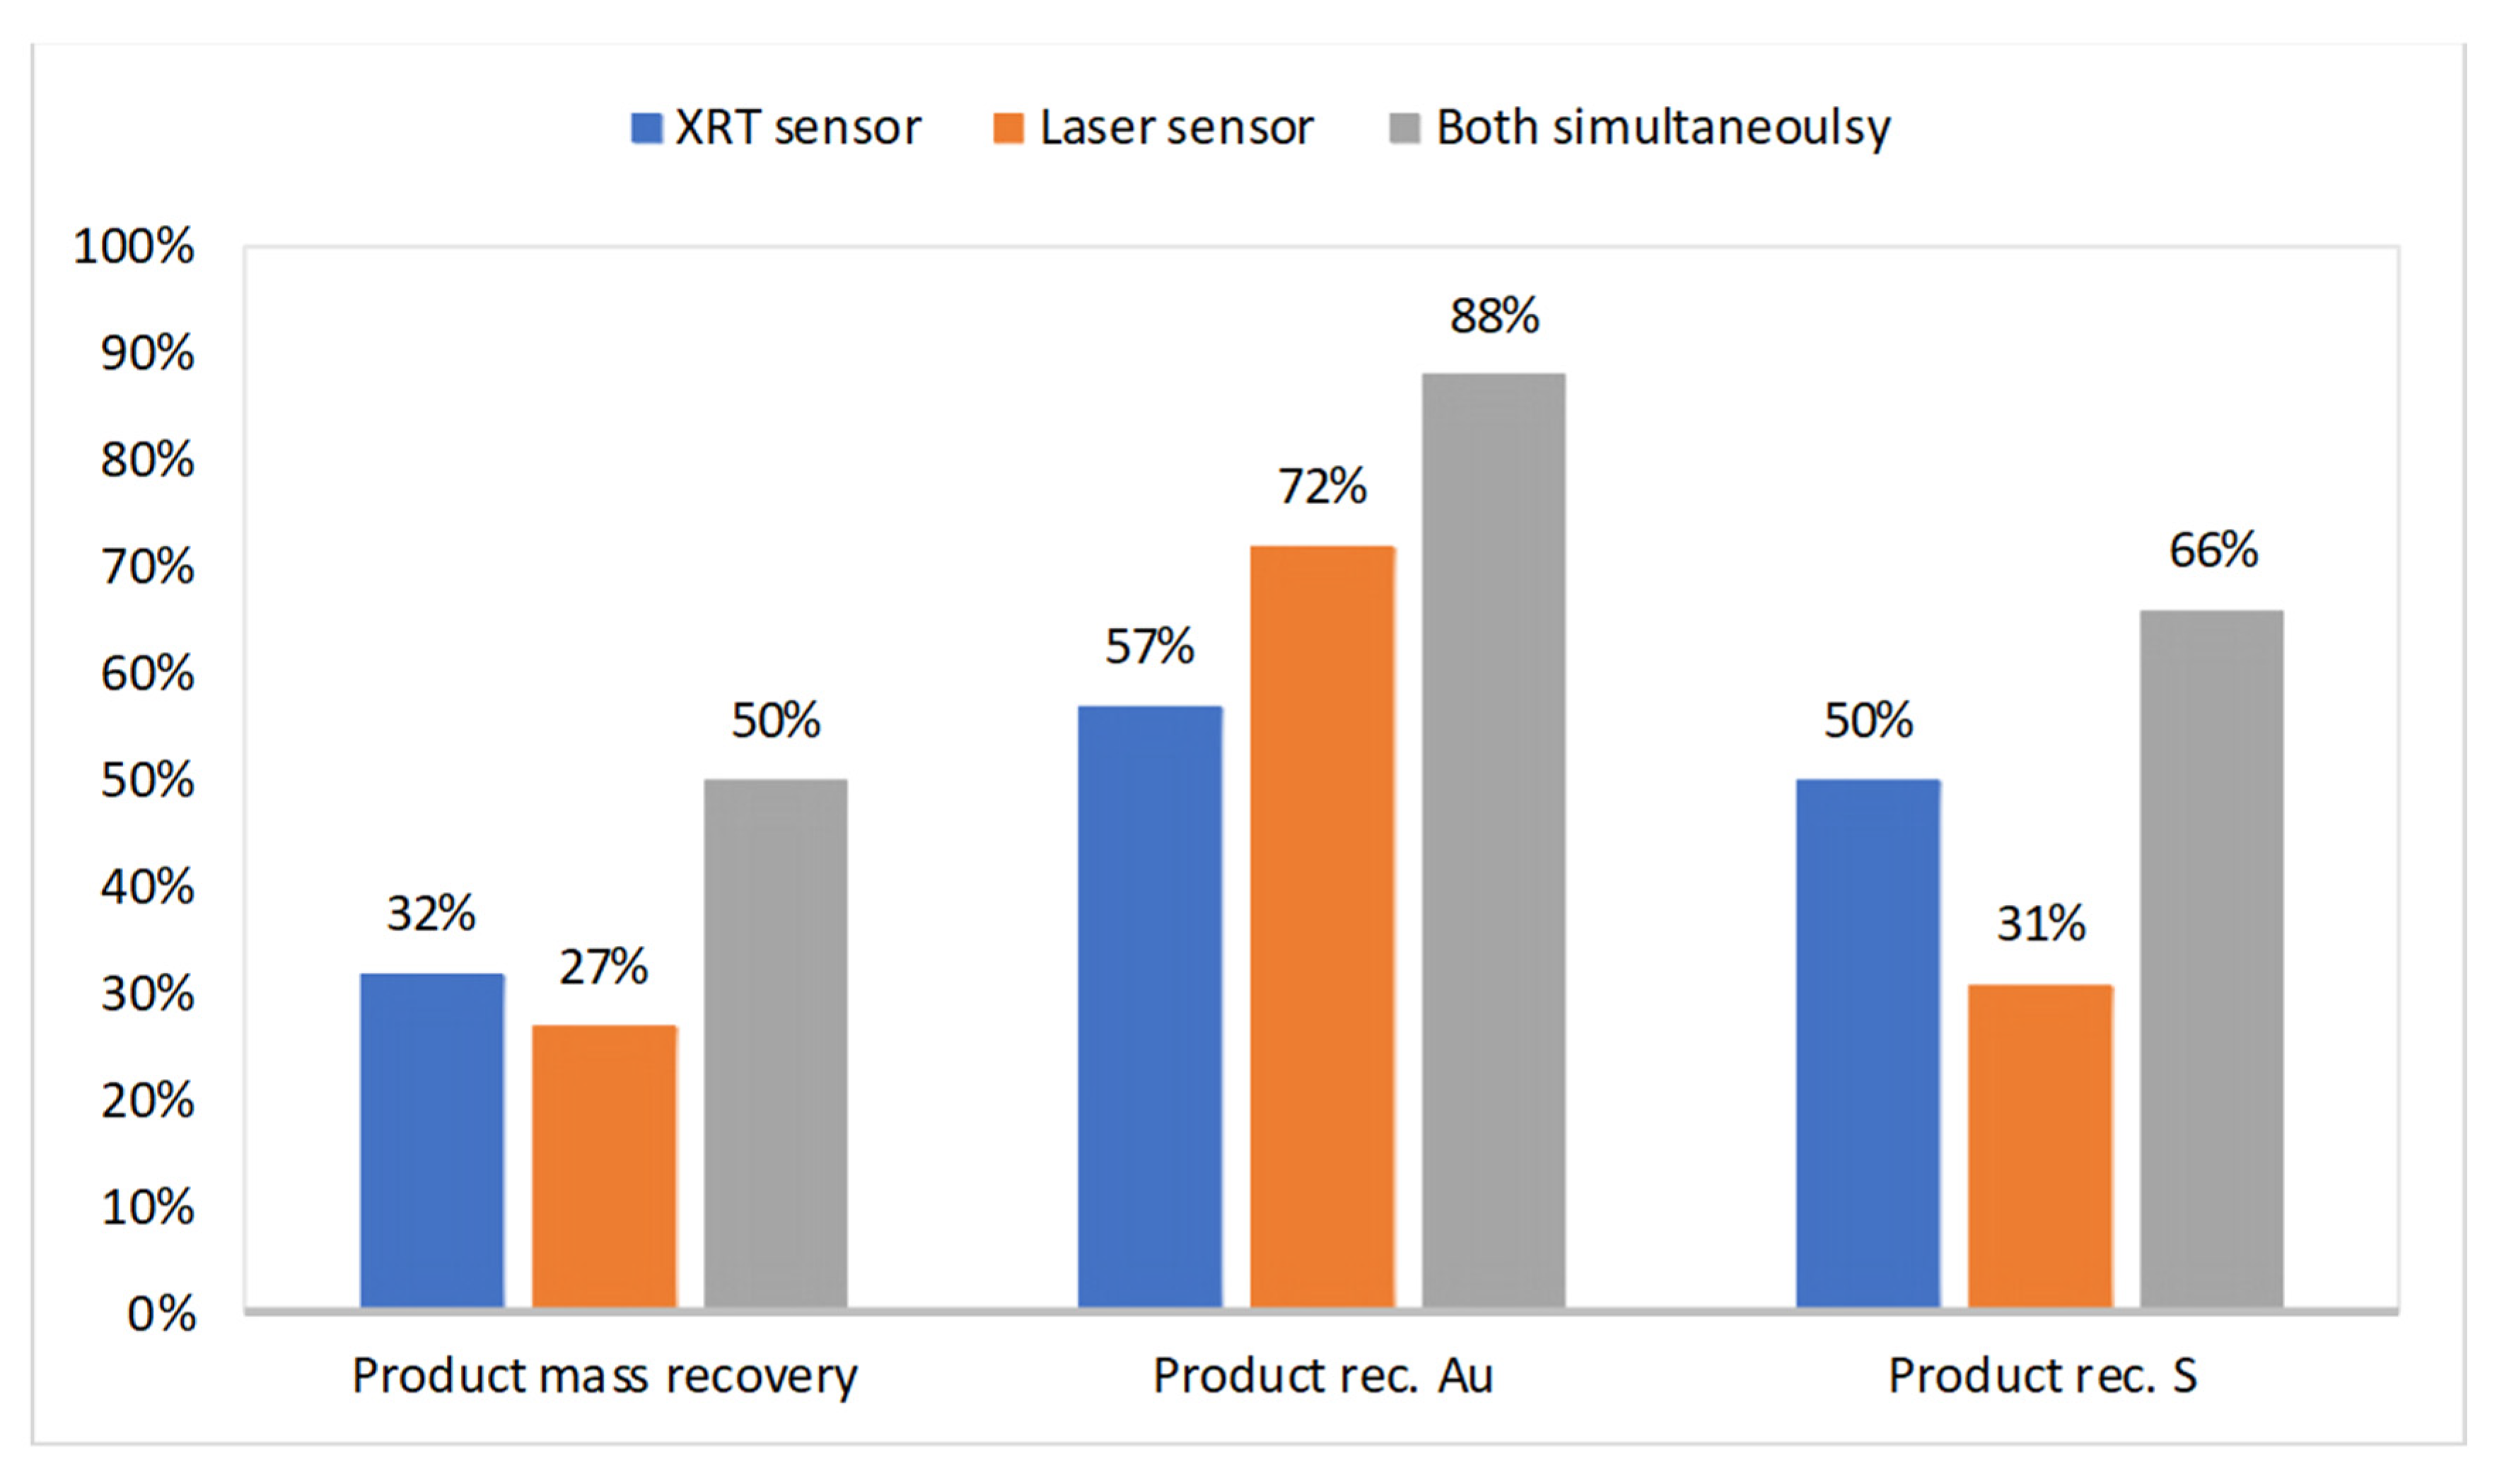
4.3. Case Study III: Córrego do Sítio Mine—Brazil

A study conducted by Assis et al. [112] compared the performance of two sensor-based sorting techniques, namely XRT and laser, applied to a gold ore from the Córrego do Sítio Mine in the state of Minas Gerais, Brazil. Figure 16 demonstrates the results obtained with each sensor, highlighting that the best recoveries were achieved when both techniques were used simultaneously. Notably, this approach resulted in good material removal and higher recovery of the target ore (Au).
When considering the two techniques separately, it can be asserted that the laser achieved a superior performance. Specifically, it recovered more gold (72%) from a smaller mass (27% of the feed), although sulfur (S) recovery was lower. In contrast, the XRT sensor recovered only 57% of the gold, while recovering a bigger amount of the mass (32%).
This same study also tested gravity separation and flotation as subsequent concentration processes. When focusing on flotation, it achieved gold recovery rates of up to 89.55%, with an average of 87.41% across three tests. Unfortunately, the study did not provide data on the current flotation process without pre-concentration, making a direct comparison impossible.

4.4. Case Study IV: Phu Kam Mine—Laos

An interesting study conducted by Reple [113] utilized copper ore from the Phu Kam mine, analyzing the impact of bulk ore sorting (BOS) through computational simulations. The study considered both upstream (resources and reserves) and downstream (beneficiation) effects. Figure 17 illustrates the reserve gains for the same grade with the inclusion of BOS (orange curve) versus without BOS (blue curve). For instance, at a copper grade of 0.8% Cu, the reserves increase from 5000 kilotons (kt) to approximately 7500 kt when the SBS equipment is implemented.
According to data, in one of the scenarios, it would be possible to increase the feed grade of the plant from 0.47% Cu to 0.61%, while keeping the mass of fed ROM and produced metal practically unchanged, resulting in approximately 5% profitability gains in the cash flow. On the other hand, if capacity was installed to increase the feed, profitability gains could reach 62%, with plant production going from 63 Kt to 89 Kt.

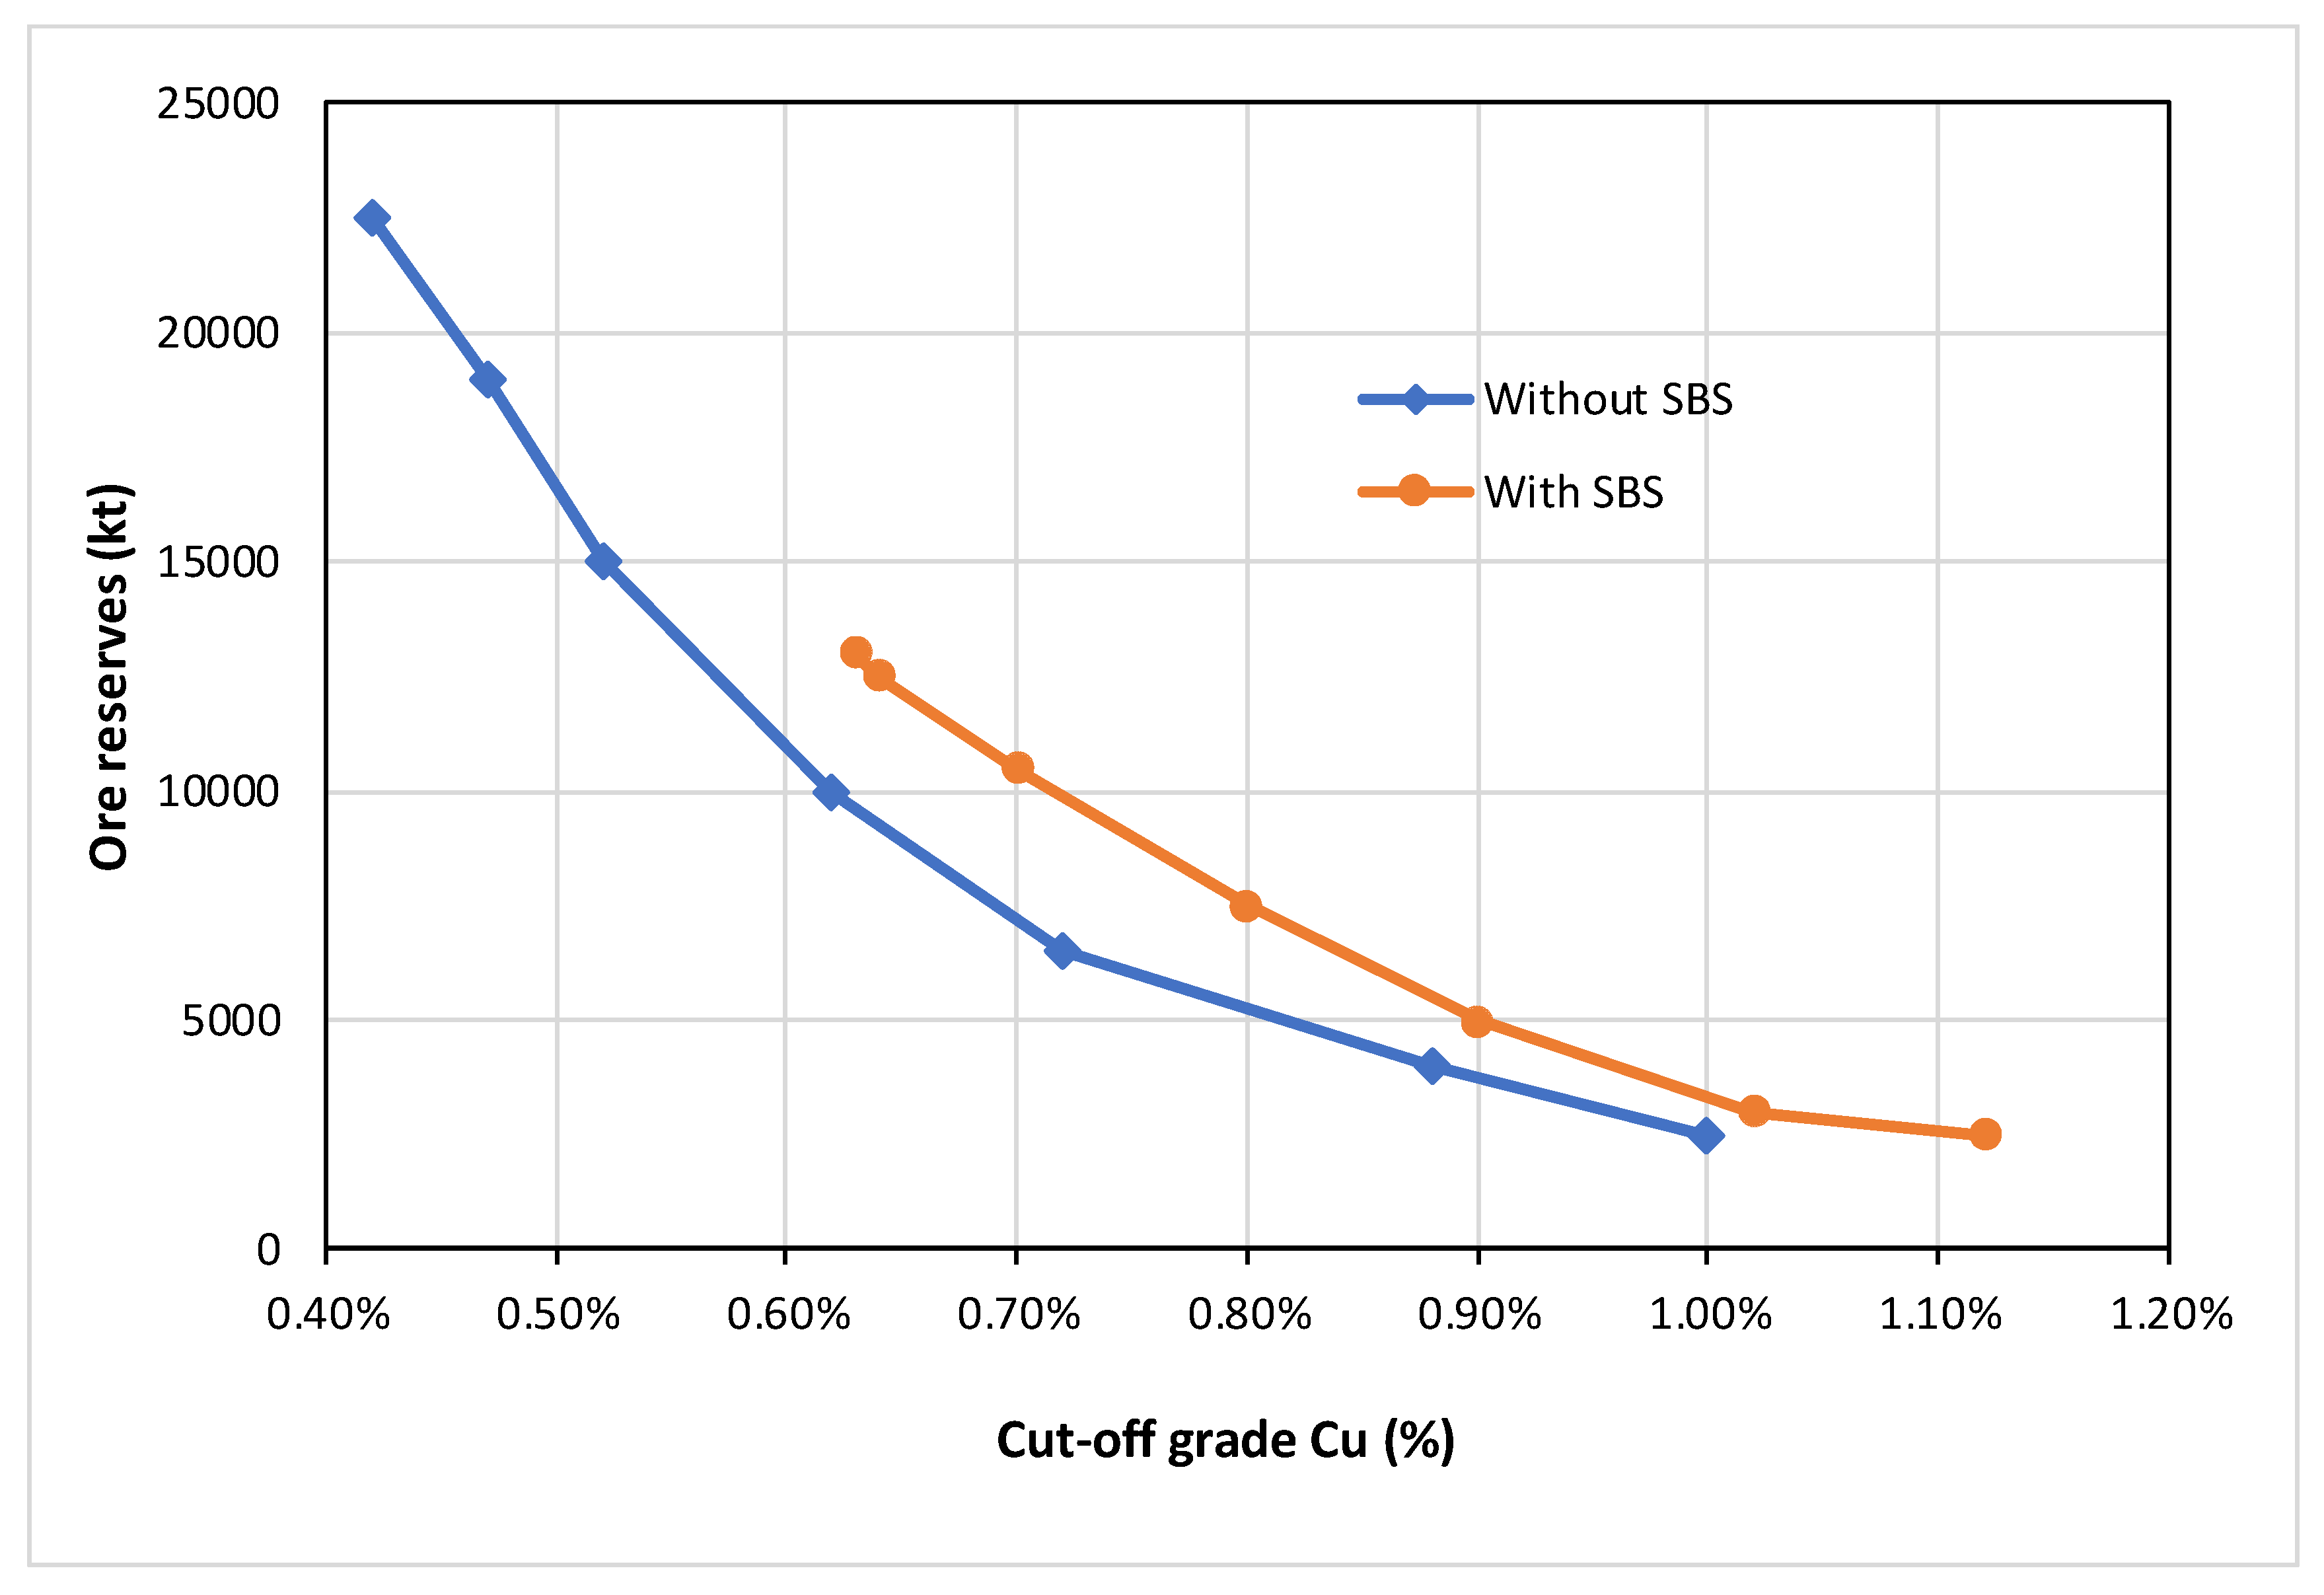
4.5. Case Study V: San Rafael Tin Mine—Peru

Robben et al. [88] analyzed the SBS system implanted on the San Rafael mine, the largest underground tin mine operating in the world. The SBS device has operated since 2016 and is based on XRT sensor technology, equipped with four ore sorters that work in parallel, with the feed flow divided in four ranges of size: 6–11 mm, 11–22 mm, 22–38 mm, and 38–70 mm.
As the main advantages from this application, the author pointed out six improvements:
  • Value addition, through the possibility of treating the material below the cut-off grade (0.9% Sn). In other words, the SBS plant is fed with ore within 0.2%–1.1% Sn, allowing recovery until old marginal piles and generating a pre-concentrated plant feed with 1.9% Sn;
  • The plant capacity was increased by 105 t/d, from 2950 to 3200 t/d;
  • The plant metal recovery was increased from 90.5 before SBS to 92.5% after it;
  • There was an increase in ore reserves, once the SBS feed was composed of 24% low-grade ore, contributing to the overall reserve tonnage and the mine life-span;
  • The potential of acid mine drainage generation was reduced, because old stock piles could be recovered after the SBS implantation;
  • Another important environmental feature, the tailing disposal, and consequently, the tailing storage facilities, was importantly reduced, replacing it with cheaper and safer dump piles.

4.6. Case Study VI: Souzmetallresource (SMR) Molybdenum Mines—Russia

This study conducted by Lessard et al. [114] aimed to achieve its objectives at two mine sites, called Mine A and Mine B, both mineralized by the main same ore: molybdenite (MoS2). The work sought to reduce the power consumption and increase the ROM production by applying SBS DE-XRT equipment and making improvements in the plant design model.
For both Mines A and B, the work tested three different thresholds, called relaxed, moderate, and aggressive, where the first is focused on higher concentration factors and the last on higher metal recoveries (Table 9).
With regard to the reduction in power consumption, the authors pointed out that if the company sustained the ROM feed at the same rate as before SBS technology (3455 t/h), the reduction in gangue material contents in comminution feeding could reduce the total crushing power demand from 5.9 MW to 3.2 MW and the milling demand from 51.0 MW to 16 MW. Using the example of Mine A, the global investment to produce Mo could be reduced from 32,951 kWh/t Mo to 12,775 kWh/t Mo.
Despite the hypothesis above, commonly, companies prefer to keep the plant feed and increase the ROM, offering to their plants a higher-grade ore and more global advantages. Accordingly, the authors presented the possibility of Mine A reducing energy costs from 32,951 kW/t Mo to 12,789 kWh/t Mo. That was possible thanks to the increase in Mo grade at the flotation plant from 0.05% to 0.138%. However, the ROM feed necessarily increased from 3455 t/h to 10,631 t/h. In Mine B, the benefits were the same, with a power consume reduction from 32,951 to 14,606 kWh/t Mo, an increase in Mo grade for the flotation plant from 0.050 to 0.125, and a need to increase the ROM feeding from 3455 to 13,340 t/h.

5. Summary of Sensor-Based Sorting

5.1. Main Advantages and Limitations

Figure 18 illustrates twelve aspects related to the implementation of sensor-based sorting systems in a mining operation, and how sensor-based sorting (SBS) systems can interact with various mine and plant processes, both directly and indirectly. The paragraphs below explore these aspects in accordance with each of these numbers, beginning with advantages.
The proximity to mining faces (1) is an important aspect, as sensor-based sorting (SBS) systems can be deployed near mining fronts, reducing transportation costs and optimizing deposit utilization. Bulk ore sorting (BOS), for example, needs to operate using the natural heterogeneity of the ore, which is higher close to the mine than after several charge and discharge processes. As a result, the pre-concentrated run-of-mine (ROM) material is directly fed to the primary crusher (2), reducing gangue crushing costs and ensuring a more consistent feed grade for the plant. For instance, the energy demand from SBS equipment is around 1–3 kWh/t, while in a milling system, it is around 12–15 kWh/t [64]. Also, BOS can be considered near to the plant, removing gangue before comminution processes and allowing the pre-concentration of ore from more than one mine.
The use of SBS post-primary crushing (3) is the most widely implemented system, even at coarse granulometry. It is typically applied across multiple particle size ranges, removing a significant portion of gangue, reducing grinding and processing costs, and ensuring a more consistent feed grade for the concentration processes. It can also split the plant feed into two streams (high- and low-grade), directing high-grade material to flotation and low-grade material to leaching, for example. Also, the use of SBS in quality control for final products (4) offers a possible application [64], ensuring compliance with customer requirements.
The (5) and (6) arrows show the possibility of using SBS to recover old waste piles (dumps); these can be reprocessed directly from deposits by BOS, if it offers reliable intrinsic heterogeneity, or by particle sorting using crusher facilities. This recovery can contribute largely to reducing acid mine drainage (ADM) generation and, moreover, can generate a new source of ore and expand the total metal resources.
Regarding plant emissions (7), optimizing its operation using SBS can reduce gas emissions and dust from mineral processing, as well as providing the opportunity to process the same amount of metal with less feed tonnage. Moreover, the demand for inputs, such as electricity, water, fuels, chemical reagents, and grinding components, can be reduce importantly, as the work index (WI) of the pre-concentrated material is often lower.
A decrease in tailing generation (9), including pulp and dry tailings, leads to a smaller environmental footprint, demands smaller tailing storage facilities (TSFs), and allows an easier process when obtaining governmental and populational licenses. Another positive impact can be achieved at the mine, with reduced ore losses (12). Furthermore, a lower cut-off grade can be expected (11) and a significant increase in the mineable reserves (10), maximizing the recovery of low-grade ores and/or utilizing marginal or diluted ore zones.
Regarding limitations, the technique can face some difficulty, starting from remote deposits lacking access to energy and other technological resources. Moreover, intrinsic ore features, such as dissemination with low heterogeneity, can also limit SBS use, due to losses from discarding batches with high-grade individual particles (FN) and consequently economic infeasibility. The need to remove fines, retaining a maximum particle range of 3:1 within each size fraction, is also a limitation, because the crusher discharge needs to be divided into three or more flows in multiple deck screens. This limitation leads to a demand to use several parallel SBS devices. The required degree of liberation and the maximum top-size of ROM material can also negatively impact crusher production.
The nature is normally very irregular, mainly with regard to ore deposits, but in some cases, the homogeneity of resources can become a limitation to SBS application, which is expected in disseminated and low-grade deposits. In the same way, old waste dumps that could present conditions for recovery, according to the exploitation features, can also presents low heterogeneity and, consequently, low SBS performances.

5.2. Future Perspectives

There are indications that installing pre-concentration equipment using sensor-based sorting or gravity methods underground could be an interesting alternative for underground mines [13]. Considering the costs associated with transporting material from underground to surface beneficiation plants, where traditional beneficiation processes take place, the possibility of pre-discarding gangue minerals (or a significant portion of them) near the mining faces can be highly advantageous. The following points highlight its benefits:
  • Reduction in overall energy consumption (electricity, fuels, etc.);
  • Potential use of hydraulic transport systems (hydraulic hoisting);
  • Feasibility of more productive bulk mining techniques, as greater ore dilution during extraction becomes viable;
  • Opportunity to employ backfill techniques to both optimize mining and prevent future environmental subsidence issues.
Another similar hypothesis is presented by Li et al. [115], exploring the heterogeneity of block caving mining systems, particularly in the edge zones of ore bodies, with similar benefits. The authors cite a system implemented at the Kiruna mine in Sweden, where sensor-based sorting systems examine the load transported by LHDs or underground transport trains. These systems can serve as both online control systems and decision-makers for discarding or utilization (similar to BOS). Other similar studies are [116,117].
The use of artificial intelligence (AI) has been a trend in the sensor-based sorting sector, mainly regarding the ability to generate real-time data and how it can be used in modern sampling systems (much faster and more efficient than traditional systems) [65]. Therefore, several studies are underway that utilize machine learning techniques to optimize sensor-based sorting processes.
Shatwell et al. [53] used a database generated from RGB images and the textures of ore samples containing gold and silver, which were described by experts. They achieved an over 90% correlation in rock sample classification using machine learning models, with a delay of 19 to 44 milliseconds (ms). Other similar studies can be found in [103,118,119].
Following the path of significant technological advancements in intelligent ore sorting, as highlighted by [5], the proposed Autonomous Sorter System (ASS) appears to be the most novel and revolutionary development in sensor-based sorting as of today [120,121]. These authors advocate for the use of AI-powered equipment with multiple sensors, known as the Cyber-Physical Sorting System (CPSS), which can be adapted to various industry segments, including recycling, construction and demolition, mining, and urban mining.
The equipment (Figure 19) consists of a conveyor belt feeding the system, a bank of visual multisensors (hyper-spectral, industrial, and short-wave infrared) capturing images, a robust processing system, and a robotic arm (or multiple rows of laterally arranged air nozzles) separating items into various possible destinations.

6. Conclusions

After reading and analyzing over 150 scientific articles and publications, this study provides a comprehensive review of the current state of pre-concentration by sensor-based sorting and flotation, with a primary focus on sulfides. Regarding sensor-based pre-concentration, it can be stated that among the ten detection techniques presented, X-ray sensors have found the most applicability in sulfide minerals. Notably, combinations of different devices (e.g., laser or PGNA) demonstrate significant performance enhancements.
In terms of performance analysis, until the mid-2010s, publications rarely addressed specific analytical methods, which were primarily limited to enrichment ratios and other indicators commonly used in beneficiation processes. However, there is now a growing use of methods involving confusion matrices and ROC curves, providing a more comprehensive analysis of equipment efficiency.
Regarding the flotation process, the current trend in sulfide flotation is to develop methods that enable operation at low grades and/or coarser particle sizes. This trend aligns with the global decrease in ore grades for all metals, making economic exploitation more challenging. Consequently, numerous studies are attempting to improve and innovate the flotation process. However, most research revisits strategies tested in the past, seeking to determine their contemporary applicability. For example, fluidized bed flotation has been studied since at least 1984 [52].
Another interesting conclusion is the effectiveness of combining techniques (referred to as “technical synergy” by [36]). Examples include using different collectors in flotation, employing multiple sensors simultaneously in sensor-based pre-concentration, and the benefits of combining pre-concentration and concentration techniques. The latter pair, although less common until a few years ago, has become a trend in the current mineral industry, especially with the growth and popularization of sensor-based sorting systems. However, there is still a scarcity of studies quantitatively correlating the impacts of these processes.
In summary, we are currently experiencing an unprecedented period of research and development opportunities, revolutionizing various industries (particularly through artificial intelligence). This progress is already leading to innovative recycling and mining methods, such as deep-sea mining (DSM) [122,123], urban mining, and (why not?) space mining, which already appears as a future trend in publications such as [124,125].

Supplementary Materials

The following supporting information can be downloaded at https://www.mdpi.com/article/10.3390/min15040350/s1, Table S1: Data from several SBS studies, showing the feed size, % rejected, and % metal recovery, adapted from Bamber [3] and Peukert et al. [91].

Author Contributions

Conceptualization, E.G.S., I.A.S.B. and W.M.A.; methodology, E.G.S.; software, E.G.S., I.A.S.B. and W.M.A.; investigation, E.G.S.; resources, I.A.S.B. and W.M.A.; writing—original draft preparation, E.G.S.; writing—review and editing, I.A.S.B. and W.M.A.; supervision, I.A.S.B.; project administration, I.A.S.B.; funding acquisition, I.A.S.B. and W.M.A. All authors have read and agreed to the published version of the manuscript.

Funding

This work was supported by the Conselho Nacional de Desenvolvimento Científico e Tecnológico—CNPq (Brazilian Council for Scientific and Technological Development), funding numbers: 140238/2022-0 and 407828/2022-2.

Acknowledgments

We express our gratitude to the Brazilian Council for Scientific and Technological Development (CNPq) and the Federal University of Rio Grande do Sul. We also thank Glaydson Simões dos Reis for providing important motivation to complete this work.

Conflicts of Interest

The authors declare no conflicts of interest.

References

  1. Kumar, D.R.; Srinivas, R.D.; Ram, R.P.S. Magnetic Separation Studies for a Low Grade Siliceous Iron Ore Sample. Int. J. Min. Sci. Technol. 2013, 23, 1–5. [Google Scholar]
  2. Barros, K.S.; Vielmo, V.S.; Moreno, G.; Riveros, G.; Cifuentes, G.; Bernardes, A.M. Chemical Composition Data of the Main Stages of Copper Production from Sulfide Minerals in Chile: A Review to Assist Circular Economy Studies. Minerals 2022, 12, 250. [Google Scholar] [CrossRef]
  3. Bamber, A.S. Integrated Mining, Pre-Concentration and Waste Disposal Systems for the Increased Sustainability of Hard Rock Metal Mining. Ph.D. Thesis, University of British Columbia, Vancouver, BC, Canada, 2008. [Google Scholar]
  4. Hassanzadeh, A.; Safari, M.; Hoang, D.H.; Khoshdast, H.; Albijanic, B.; Kowalczuk, P.B. Technological Assessments on Recent Developments in Fine and Coarse Particle Flotation Systems. Miner. Eng. 2022, 180, 107509. [Google Scholar]
  5. Luo, X.; Kunzhong, H.; Zhang, Y.; He, P.; Zhang, Y. A Review of Intelligent Ore Sorting Technology and Equipment Development. Int. J. Miner. Metall. Mater. 2022, 29, 1647. [Google Scholar] [CrossRef]
  6. Mudd, G.M. The Sustainability of Mining in Australia: Key Production Trends and Their Environmental Implications for the Future; Research Report No RR5; Department of Civil Engineering, Monash University and Mineral Policy Institute: Melbourne, Australia, 2009; Available online: https://users.monash.edu.au/~gmudd/files/SustMining-Aust-Report-2009-Master.pdf (accessed on 6 February 2024).
  7. Bilal, M.; Park, I.; Hornn, V.; Ito, M.; Hassan, F.U.; Jeon, S.; Hiroyoshi, N. The Challenges and Prospects of Recovering Fine Copper Sulfides from Tailings Using Different Flotation Techniques: A Review. Minerals 2022, 12, 586. [Google Scholar] [CrossRef]
  8. Santander, M.; Valderrama, L. Recovery of Pyrite from Copper Tailings by Flotation. J. Mater. Res. Technol. 2019, 8, 4312–4317. [Google Scholar] [CrossRef]
  9. Baltar, C.A.M. Flotação em Nova Abordagem; UFPE: Recife, Brazil, 2021. [Google Scholar]
  10. Mondal, S.; Acharjee, A.; Mandal, U.; Saha, B. Froth Flotation Process and Its Application. Vietnam. J. Chem. 2021, 59, 417–425. [Google Scholar]
  11. Varela, J.J.; Brum, I.A.S. Reagentes e Equipamentos Aplicados ao Processo de Flotação no Tratamento de Minérios; XXII ENTMME/VII MSHMT: Ouro Preto, Brazil, 2007. [Google Scholar]
  12. Arvidson, B.R.; Wotruba, H. Ore Sorting. In Mineral Processing and Extractive Metallurgy: 100 Years of Innovation; Society for Mining Metallurgy and Exploration (SME): Englewood, CO, USA, 2014; pp. 209–221. [Google Scholar]
  13. Murphy, B.; Van Zyl, J.; Domingo, G. Underground Preconcentration by Ore Sorting and Coarse Gravity Separation. In Proceedings of the Narrow Vein Mining Conference, Perth, Australia, 26–27 March 2012. [Google Scholar]
  14. U.S. Geological Survey. Mineral Commodity Summaries 2023; U.S. Geological Survey: Washington, DC, USA, 2023. [Google Scholar]
  15. Dimitrijević, M.; Kostov, A.; Tasić, V.; Milosević, N. Influence of Pyrometallurgical Copper Production on the Environment. J. Hazard. Mater. 2009, 164, 892–899. [Google Scholar]
  16. Valeriano, C.M.; Dias, P.H.A.; Carvalho, M.O.; Heilbron, M. Recursos Minerais de Minas Gerais; RMMG—CODEMGE: Belo Horizonte, Brazil, 2018. [Google Scholar]
  17. Russo, M.L.C. Beneficiamento de Rejeito de Minério de Zinco. Master’s Thesis, Federal University of Ouro Preto, Ouro Preto, Brazil, 2007. [Google Scholar]
  18. Özçelik, S.; Ekmekçi, Z. Reducing Negative Effects of Oxidation on Flotation of Complex Cu–Zn Sulfide Ores. Minerals 2022, 12, 1016. [Google Scholar] [CrossRef]
  19. Luz, A.B.; Penna, M.T.M.; Souza Filho, L.G. Estudo do Beneficiamento do Minério de Cobre, Chumbo e Zinco de Palmeirópolis; Mines and Energy Ministry, Department of Mineral Production, Centro de Tecnologia Mineral—CETEM: Rio de Janeiro, Brazil, 1982. [Google Scholar]
  20. Brito, L.F.; Juliani, C.; Lago, S.B. O Depósito de Santa Maria e as Ocorrências de Metais de Base na Bacia do Camaquã. Geol. USP Série Cient. 2023, 23, 187–206. [Google Scholar] [CrossRef]
  21. Aguia Resourses. Andrade Copper Deposit—Updated Resource Estimate and Scoping Study Showing Positive Economics; ASX Market Announcements: Sydney, Australia, 2021. [Google Scholar]
  22. Medeiros, A.R.S.; Baltar, C.A.M. Importance of Collector Chain Length in Flotation of Fine Particles. Miner. Eng. 2018, 122, 179–184. [Google Scholar] [CrossRef]
  23. Chaves, A.P.; Leal Filho, L.S.; Braga, P.F.A. Flotação. In Tratamento de Minérios, 5th ed.; Luz, A.B., Sampaio, J.A., França, S.C.A., Eds.; CETEM: Rio de Janeiro, Brazil, 2010. [Google Scholar]
  24. Agheli, S.; Hassanzadeh, A.; Hassas, B.V.; Hasanzadeh, M. Effect of Pyrite Content of Feed and Configuration of Locked Particles on Rougher Flotation of Copper in Low and High Pyritic Ore Types. Int. J. Min. Sci. Technol. 2019, 28, 167–176. [Google Scholar] [CrossRef]
  25. Hassas, B.V.; Caliskan, H.; Guven, O.; Karakas, F.; Cinar, M.; Celik, M.S. Effect of Roughness and Shape Factor on Flotation Characteristics of Glass Beads. Colloids Surf. A Physicochem. Eng. Asp. 2016, 492, 88–99. [Google Scholar]
  26. Rao, S.R.; Labonte, G.; Finch, J.A. Electrochemistry in the Plant. In Innovations in Flotation Technology; Mavros, P., Matis, K.A., Eds.; NATO ASI Series: Kallithea, Greece, 1991; pp. 57–100. [Google Scholar]
  27. Shammas, N.K.; Bennett, G.F. Principles of Air Flotation Technology. In Handbook of Environmental Engineering; Wang, L.K., Shammas, N.K., Selke, W.A., Aulenbach, D.B., Eds.; Flotation Technology; Springer: New York, NY, USA, 2010; Volume 12, pp. 20–48. [Google Scholar]
  28. Bulatovic, S.M. Handbook of Flotation Reagents: Chemistry, Theory and Practice: Flotation of Sulfide Ores; Elsevier Science & Technology Book; Elsevier: Amsterdam, The Netherlands, 2007. [Google Scholar]
  29. Nguyen, A.V. Froth Flotation. In Reference Module in Chemistry, Molecular Sciences and Chemical Engineering; Elsevier: Amsterdam, The Netherlands, 2013. [Google Scholar]
  30. Braga, A.S.; Souza Pinto, T.C.; Matai, P.H.L.S.; Leal Filho, L.S. Concentração Micelar Crítica e Concentração Crítica de Coalescência de Reagentes de Flotação. Ph.D. Thesis, University of São Paulo (USP-SP), São Paulo, Brazil, 2015. Available online: https://www2.ifrn.edu.br/ojs/index.php/HOLOS/article/view/3824/1281 (accessed on 11 December 2023).
  31. Kawatra, S.K. Fundamental Principles of Froth Flotation. In SME Mining Engineering Handbook, 3rd ed.; Darling, P., Ed.; Society for Mining Metallurgy and Exploration: Littleton, CO, USA, 2011; Volume 2. [Google Scholar]
  32. Michaux, B.; Rudolph, M.; Reuter, M.A. Challenges in Predicting the Role of Water Chemistry in Flotation through Simulation with an Emphasis on the Influence of Electrolytes. Miner. Eng. 2018, 125, 252–264. [Google Scholar]
  33. METSO. Process Water Recycling Plant. Available online: https://www.metso.com/portfolio/process-water-recycling-plant (accessed on 28 December 2023).
  34. Castro, S. Challenges in Flotation of Cu–Co Sulfide Ores in Sea Water. In The First International Symposium on Water in Mineral Processing; Society for Mining, Metallurgy & Exploration (SME): Littleton, CO, USA, 2012; pp. 29–40. [Google Scholar]
  35. Tabelin, C.B.; Park, I.; Phengsaart, T.; Jeon, S.; Villacorte-Tabelin, M.; Alonzo, D.; Yoo, K.; Ito, M.; Hiroyoshi, N. Copper and Critical Metals Production from Porphyry Ores and E-Wastes: A Review of Resource Availability, Processing/Recycling Challenges, Socio-Environmental Aspects, and Sustainability Issues. Resour. Conserv. Recycl. 2021, 170, 105610. [Google Scholar]
  36. Cetin, M.C.; Klein, B.; Futcher, W. A Conceptual Strategy for Effective Bulk Ore Sorting of Copper Porphyries: Exploiting the Synergy between Two Sensor Technologies. Miner. Eng. 2023, 201, 108182. [Google Scholar]
  37. CSIRO (Commonwealth Scientific and Industrial Research Organisation). MRI for Rapid Copper Ore Sorting. Available online: https://www.csiro.au/en/work-with-us/industries/mining-resources/Sensing/Ore-sorter (accessed on 8 November 2023).
  38. Tanaka, Y.; Miki, H.; Suyantara, G.P.W.; Aoki, Y.; Hirajima, T. Mineralogical Prediction on the Flotation Behavior of Copper and Molybdenum Minerals from Blended Cu–Mo Ores in Seawater. Minerals 2021, 11, 869. [Google Scholar] [CrossRef]
  39. Videla, A.R.; Morales, R.; Saint-Jean, T.; Gaete, L.; Vargas, Y.; Miller, J.D. Ultrasound Treatment on Tailings to Enhance Copper Flotation Recovery. Miner. Eng. 2016, 99, 89–95. [Google Scholar] [CrossRef]
  40. Aras, A.; Rasa, M.H. Investigation of Flotation Conditions for Cobalt Recovery from Mine Tailings. Min. Metall. Explor. 2023, 40, 939–948. [Google Scholar]
  41. Zhang, L.; Gao, J.; Khoso, S.A.; Liu, Y.; Tian, M. Interaction Mechanism of the Adopted Reagents in the Flotation Recovery of Sphalerite and Pyrite from a Galena Flotation Tailing: First-Principles Calculations. Colloids Surf. A Physicochem. Eng. Asp. 2021, 617, 126378. [Google Scholar]
  42. Amar, H.; Benzaazoua, M.; Elghali, A.; Taha, Y.; El Ghorfi, M.; Krause, A.; Hakkou, R. Mine Waste Rock Reprocessing Using Sensor-Based Sorting (SBS): Novel Approach toward Circular Economy in Phosphate Mining. Miner. Eng. 2023, 204, 108415. [Google Scholar]
  43. Arriagada, S.; Acuña, C.; Vera, M. New Technology to Improve the Recovery of Fine Particles in Froth Flotation Based on Using Hydrophobized Glass Bubbles. Miner. Eng. 2020, 156, 106364. [Google Scholar]
  44. Chen, P.; Chen, Y.; Liu, H.; Li, H.; Chai, X.; Lu, X.; Sun, W.; Wang, H.; Luo, Y.; Wang, X. Novel Approach for Fine Ilmenite Flotation Using Hydrophobized Glass Bubbles as the Buoyant Carrier. Minerals 2021, 11, 231. [Google Scholar] [CrossRef]
  45. Brill, C.; Verster, I.; Franks, G.V.; Forbes, L. Aerosol Collector Addition in Coarse Particle Flotation—A Review. Miner. Process. Extr. Metall. Rev. 2023, 44, 522–531. [Google Scholar]
  46. Patil, D.P.; Laskowski, J.S. Development of Zero Conditioning Procedure for Coal Reverse Flotation. Miner. Eng. 2008, 21, 373–379. [Google Scholar]
  47. Pattanaik, A.; Venugopal, R. Role of Surfactants in Mineral Processing: An Overview. In Surfactants and Detergents; Dutta, A.K., Ed.; IntechOpen: London, UK, 2019. [Google Scholar]
  48. Han, J.; Chen, P.; Liu, T.; Li, Y. Research and Application of Fluidized Flotation Units: A Review. J. Ind. Eng. Chem. 2023, 126, 50–68. [Google Scholar]
  49. Han, J.; Liu, T.; Li, Y.; Chen, P.; Yin, M.; Ma, M.; Evans, G.M. Bed Hydrodynamics of a New Three-Phase Fluidized Bed Flotation Column with Steel Ball Particles. Miner. Eng. 2022, 184, 107669. [Google Scholar]
  50. Awatey, B.; Thanasekaran, H.; Kohmuench, J.N.; Skinner, W.; Zanin, M. Optimization of Operating Parameters for Coarse Sphalerite Flotation in the HydroFloat Fluidised-Bed Separator. Miner. Eng. 2013, 50, 99–105. [Google Scholar]
  51. Jameson, G.J.; Emer, C. Coarse Chalcopyrite Recovery in a Universal Froth Flotation Machine. Miner. Eng. 2019, 134, 118–133. [Google Scholar] [CrossRef]
  52. Schulze, H.J. Physicochemical Elementary Processes in Flotation; Elsevier: Amsterdam, The Netherlands, 1984. [Google Scholar]
  53. Shatwell, D.G.; Murray, V.; Barton, A. Real-Time Ore Sorting Using Color and Texture Analysis. Int. J. Min. Sci. Technol. 2023, 33, 659–674. [Google Scholar] [CrossRef]
  54. Ergün, L.Ş.; Gülsoy, Ö.Y.; Gülsoy, G. Optical Sorting of Iron and Chromite Ores; Sensor Based Sorting: Aachen, Germany, 2012. [Google Scholar]
  55. Veras, M.M.; Young, A.S.; Born, C.R.; Szewczuk, A.; Bastos Neto, A.C.; Petter, C.O.; Sampaio, C.H. Affinity of Dual Energy X-Ray Transmission Sensors on Minerals Bearing Heavy Rare Earth Elements. Miner. Eng. 2020, 147, 106151. [Google Scholar] [CrossRef]
  56. Duffy, K.W.; Valery, A.; Jankovic, P.; Holtham, P. Integrating Bulk Ore Sorting into a Mining Operation to Maximise Profitability. In Proceedings of the MetPlant 2015: Plant Design and Operating Strategies—World’s Best Practice, Perth, Australia, 7–8 September 2015. [Google Scholar]
  57. Strauss, T. Ore Sorting in Mining; Association of Mining Analysts, Merlyn Consulting. 2016. Available online: http://merlyn-consulting.com/wp-content/uploads/2016/04/Ore-Sorting-in-Mining.pdf (accessed on 29 December 2023).
  58. Robben, M.; Knapp, H.; Dehler, M.; Wotruba, H. X-Ray Transmission Sorting of Tungsten Ore. In OCM 2013—Conference Proceedings; Beyerer, J., León, F.P., Längle, T., Eds.; Scientific Publishing: Karlsruhe, Germany, 2013; pp. 245–258. [Google Scholar]
  59. Ketelhodt, L.; Bergman, C. Dual Energy X-Ray Transmission Sorting of Coal. In Proceedings of the 16th International Coal Preparation Congress, Lexington, KY, USA, 25–30 April 2010. [Google Scholar]
  60. Nienhaus, K.; Vallone, B.; Renzi, F.; Wiedenmann, J.; Nienhaus, G.U. Crystallization and Preliminary X-Ray Diffraction Analysis of the Red Fluorescent Protein eqFP611. Acta Crystallogr. D 2003, 59, 1253–1255. [Google Scholar] [CrossRef]
  61. Scuri, A.E. Fundamentos da Imagem Digital; Tecgraf/PUC-Rio: Rio de Janeiro, Brazil, 2002. [Google Scholar]
  62. Kolacz, J. Sensor Based Sorting with Signal Pattern Recognition: The New Powerful Tool in Mineral Processing. In Proceedings of the XXVII International Mineral Processing Congress, Santiago, Chile, 20–24 October 2014; pp. 106–115. [Google Scholar]
  63. McMillan, N. Laser-Induced Breakdown Spectroscopy (LIBS); SERC, National Science Foundation. 2023. Available online: https://serc.carleton.edu/msu_nanotech/methods/libs.html (accessed on 2 January 2024).
  64. Wotruba, H. Sensor Sorting Technology—Is the Minerals Industry Missing a Chance? In Proceedings of the XXIII International Mineral Processing Congress, Istanbul, Turkey, 3–8 September 2006. [Google Scholar]
  65. Robben, C.; Wotruba, H. Review Sensor-Based Ore Sorting Technology in Mining—Past, Present and Future. Minerals 2019, 9, 523. [Google Scholar] [CrossRef]
  66. Clark, R.N. Spectroscopy of Rocks and Minerals, and Principles of Spectroscopy. In Manual of Remote Sensing; Rencz, A.N., Ed.; John Wiley & Sons: New York, NY, USA, 1999; Volume 3, pp. 3–58. [Google Scholar]
  67. Robben, M.; Wotruba, H. Near-Infrared Sorting for Minerals; RWTH Aachen University, Department of Mineral Processing: Aachen, Germany, 2010. [Google Scholar]
  68. Jacq, K.; Rapuc, W.; Benoit, A.; Coquin, D.; Fanget, B.; Perrette, Y.; Sabatier, P.; Wilhelm, B.; Debret, M.; Arnaud, F. Sedimentary structure discrimination with hyperspectral imaging in sediment cores. Sci. Total Environ. 2022, 817, 152018. [Google Scholar] [CrossRef] [PubMed]
  69. Teodoro, L.P.R.; Estevão, R.; Santana, D.C.; Oliveira, I.C.; Lopes, M.T.G.; Azevedo, G.B.; Rojo Baio, F.H.; Silva Junior, C.A.; Teodoro, P.E. Eucalyptus species discrimination using hyperspectral sensor data and machine learning. Forests 2024, 15, 39. [Google Scholar] [CrossRef]
  70. Dalm, M.; Buxton, M.W.N.; Van Ruitenbeek, F.J.A. Ore–Waste Discrimination in Epithermal Deposits Using Near-Infrared to Short-Wavelength Infrared (NIR-SWIR) Hyperspectral Imagery. Math. Geosci. 2019, 51, 849–875. [Google Scholar] [CrossRef]
  71. Tuşa, L.; Kern, M.; Khodadadzadeh, M.; Blannin, R.; Gloaguen, R.; Gutzmer, J. Evaluating the performance of hyperspectral short-wave infrared sensors for the pre-sorting of complex ores using machine learning methods. Miner. Eng. 2020, 146, 106150. [Google Scholar] [CrossRef]
  72. Okada, N.; Nozaki, H.; Nakamura, S.; Manjate, E.P.A.; Gebretsadik, A.; Ohtomo, Y.; Arima, T.; Kawamura, Y. Optimizing multi-spectral ore sorting incorporating wavelength selection utilizing neighborhood component analysis for effective arsenic mineral detection. Sci. Rep. 2024, 14, 11544. [Google Scholar] [CrossRef]
  73. Batchelor, A.R.; Ferrari-John, R.S.; Katrib, J.; Udoudo, O.; Jones, D.A.; Dodds, C.; Kingman, S.W. Pilot scale microwave sorting of porphyry copper ores: Part 1–Laboratory investigations. Miner. Eng. 2016, 98, 303–327. [Google Scholar] [CrossRef]
  74. Rizmanoski, V. The Effect of Microwave Heating on Ore Sorting. Ph.D. Thesis, University of Queensland, Brisbane, Australia, 2012. [Google Scholar]
  75. Ferrari-John, R.S.; Batchelor, A.R.; Katrib, J.; Dodds, C.; Kingman, S.W. Understanding selectivity in radio frequency and microwave sorting of porphyry copper ores. Int. J. Miner. Process. 2016, 155, 64–73. [Google Scholar] [CrossRef]
  76. Magnetic Resonance. Nextore LTD. Our Technology. Silverwater-Australia. 2023. Available online: https://nextore.com.au/technology/ (accessed on 8 November 2023).
  77. Vatcha, M.T.; Cochrane, L.B.; Rousell, D.H. Pre-concentration by magnetic sorting of Ni-Cu ore at Whistle mine, Sudbury, Canada. Trans. Inst. Min. Metall. C Miner. Process. Extr. Metall. 2000, 109, 156–160. [Google Scholar] [CrossRef]
  78. YouTube. Future Materials. Magnetic Separation. Available online: https://www.youtube.com/watch?v=y0-FQ423gAE (accessed on 14 February 2023).
  79. Li, M.; Caushaj, A.; Silva, R.; Lowther, D. A neural network for electromagnetic based ore sorting. COMPEL Int. J. Comput. Math. Electr. Electron. Eng. 2018, 37, 691–703. [Google Scholar]
  80. Kattentidt, H.U.R.; de Jong, T.P.R.; Dalmijn, W.L. Multi sensor identification and sorting of bulk solids. Control. Eng. Pract. 2011, 11, 41–47. [Google Scholar]
  81. Wheeler, M.G.B. The development of a model for the simulation of the radiometric sorting of gold and uranium ores. J. S. Afr. Inst. Min. Metall. 1989, 89, 313–322. [Google Scholar]
  82. Clark, G.J.; Dickson, B.L.; Gray, F.E. Ore Sorting Using Natural Gamma. Radiation. Patent Code 16034794, 6 July 1978. [Google Scholar]
  83. Silva, D.P. Ore Sorting Technology in Cariba Mining. In the Mine. 29 September 2021. Available online: https://www.inthemine.com.br/site/tecnologia-ore-sorting-na-mineracao-caraiba/ (accessed on 8 November 2023).
  84. Fickling, R.S. An introduction to the rados XRT ore sorter. In Proceedings of the 6th Southern African Base Metals Conference, Phalaborwa, South Africa, 18–22 July 2011. [Google Scholar]
  85. Raman, C.V.; Jayaraman, A. The luminescence of diamond and its relation to crystal structure. Proc. Indian Acad. Sci. (Math. Sci.) 1950, 32, 65. [Google Scholar]
  86. Van der Westhuyzen, P.; Bouwer, W.; Jakins, A. Current Trends in the Development of New or Optimization of Existing Diamond Processing Plants, with Focus on Beneficiation. J. S. Afr. Inst. Min. Metall. 2014, 114, 537–546. [Google Scholar]
  87. Mironov, V.P.; Emelyanova, A.S.; Shabalin, S.A.; Bubyr, E.V.; Kazakov, L.V.; Martynovich, E.F. X-ray Luminescence in Diamonds and Its Application in Industry. AIP Conf. Proc. 2021, 2392, 020010. [Google Scholar]
  88. Robben, C.; Condori, P.; Pinto, A.; Machaca, R.; Takala, A. X-Ray-Transmission-Based Ore Sorting at the San Rafael Tin Mine. Miner. Eng. 2020, 145, 105870. [Google Scholar]
  89. Dias Júnior, E.A. Análise de Dados de Rochas de Cromita Visando a Melhoria de um Algoritmo de Classificação Baseada em Sensores; Monograph, Federal University of Minas Gerais: Belo Horizonte, Brazil, 2023. [Google Scholar]
  90. Amorim Júnior, G.S. Estudo da Aplicação de ore Sorting Para Minério Silicatado de Zinco. Master’s Thesis, Federal University of Minas Gerais, Belo Horizonte, Brazil, 2022. [Google Scholar]
  91. Peukert, D.; Xu, C.; Dowd, P. A Review of Sensor-Based Sorting in Mineral Processing: The Potential Benefits of Sensor Fusion. Minerals 2022, 12, 1364. [Google Scholar] [CrossRef]
  92. Wilkinson, S. Techniques for Coarse Particle Beneficiation of Some Gold Ores and Methods of Determining Potential for Sorting Any Gold Operation. In Proceedings of the 17th Annual Meeting of The Canadian Mineral Processors—CIM, Ottawa, ON, Canada, 13–31 January 1985; pp. 258–284. [Google Scholar]
  93. Sivamohan, R.; Forssberg, E. Electronic Sorting and Other Pre-Concentration Methods. Miner. Eng. 1991, 4, 797–814. [Google Scholar] [CrossRef]
  94. Collins, D.N.; Bonney, C.F. The Separation of Coarse Particles (>1 mm) Using Sorting Methods Based on Optical, Electrical, Gravity, and Magnetic Processes; MIRO: West Yorkshire, UK, 1995; Volume 18. [Google Scholar]
  95. Kowalcyk, P. Radiometric Ore Sorting Study, South Deep Mine; Placer Dome Internal Report; Placer Dome: Vancouver, BC, Canada, 2002. [Google Scholar]
  96. Neto, D.J.; Bergerman, M.G.; Young, A.S.; Petter, C.O. Pre-Concentration Potential Evaluation for a Silicate Zinc Ore by Density and Sensor-Based Sorting Methods. Rev. Esc. Minas 2019, 72, 335–343. [Google Scholar] [CrossRef]
  97. Kern, M.; Tusa, L.; Leißner, T.; van den Boogaart, K.G.; Gutzmer, J. Optimal Sensor Selection for Sensor-Based Sorting Based on Automated Mineralogy Data. J. Clean. Prod. 2019, 234, 1144–1152. [Google Scholar] [CrossRef]
  98. Jin, J.; Lin, C.-L.; Miller, J.D.; Zhao, C.; Li, T. X-Ray Computed Tomography Evaluation of Crushed Copper Sulfide Ore for Pre-Concentration by Ore Sorting. Min. Metall. Explor. 2022, 39, 13–21. [Google Scholar] [CrossRef]
  99. Cardenas-Vera, A.; Hesse, M.; Möckel, R.; Merker, R.G.; Heinig, T.; Van Phan, Q. Investigation of Sensor-Based Sorting and Selective Comminution for Pre-Concentration of an Unusual Parisite-Rich REE Ore, South Namxe, Vietnam. Miner. Eng. 2022, 177, 107371. [Google Scholar] [CrossRef]
  100. Valente, B.A.; Bechir, J.L.C.; Silva, T.A.V.D.; Pina, P.D.S.; Souza, A.D.D.; Mazzinghy, D.B. Aplicação de Tecnologia de Ore Sorting para Aproveitamento de Minérios de Baixo Teor de Zinco em Vazante/MG. In Proceedings of the XXVIII National Meeting of Mineral Treatment and Extractive Metallurgy, Belo Horizonte, Brazil, 4–8 November 2019. [Google Scholar]
  101. Moreira, B.H.M.; Uehara, B.H.; Neto, D.J.; Bergerman, M.G. Avaliação do Consumo de Energia em Circuitos de Moagem Alimentados com Produtos de Pré-concentração de Minérios de Vanádio e Cobre. In Proceedings of the XXVII National Meeting of Mineral Treatment and Extractive Metallurgy, Belem, Brazil, 23–27 October 2017. [Google Scholar]
  102. Valery, W.; Duffy, K.A.; Prati, F.; Reple, A.C.S.; Holtham, P. Evaluation of Bulk Ore Sorting for Pre-concentration of Copper Ore at Pan Aust Phu Kham Operation. In Proceedings of the 24th World Mining Congress, Rio de Janeiro, Brazil, 18–21 October 2016. [Google Scholar]
  103. Sanches, J.G.; Neto, D.J.; Bergerman, M.G. Comparação das Etapas de Flotação e Lixiviação de um Minério Silicatado de Zinco entre Circuito com e sem Pré-concentração. In Proceedings of the XXVIII National Meeting of Mineral Treatment and Extractive Metallurgy, Belo Horizonte, Brazil, 4–8 November 2019. [Google Scholar]
  104. Filippov, L.O.; Filippova, I.V.; Crumiere, G.; Sousa, R.; Leite, M.M.; Sousa, A.B.; Korbel, C.; Tripathy, S.K. Separation of Lepidolite from Hard-rock Pegmatite Ore via Dry Processing and Flotation. Miner. Eng. 2022, 187, 107768. [Google Scholar] [CrossRef]
  105. Fawcett, T. An Introduction to ROC Analysis. Pattern Recognit. Lett. 2006, 27, 861–874. [Google Scholar] [CrossRef]
  106. Ooms, D.; Palm, R.; Leemans, V.; Destain, M.F. A Sorting Optimization Curve with Quality and Yield Requirements. Pattern Recognit. Lett. 2010, 31, 983–990. [Google Scholar] [CrossRef]
  107. Gülcan, E.; Gülsoy, Ö.Y. Performance Evaluation of Optical Sorting in Mineral Processing—A Case Study with Quartz, Magnesite, Hematite, Lignite, Copper and Gold Ores. Int. J. Miner. Process. 2017, 169, 129–141. [Google Scholar]
  108. Santos, E.G. Análise da Performance dos Sensores Óptico e por Transmitância de Raios-X no Processo de Classificação de Calcário em Mina de Caçapava do Sul/RS. Master’s Thesis, Federal University of Pampa, Bagé, Brazil, 2018. [Google Scholar]
  109. Paranhos, R.S.; Santos, E.G.; Veras, M.M.; Guadagnin, F.; Pasetto, G.A. Performance Analysis of Optical and X-Ray Transmitter Sensors for Limestone Classification in the South of Brazil. J. Mater. Res. Technol. 2020, 9, 1305–1313. [Google Scholar] [CrossRef]
  110. Lessard, J.; Sweetser, W.; Bartram, K.; Figueroa, J.; Mchugh, L. Bridging the Gap: Understanding the Economic Impact of Ore Sorting on a Mineral Processing Circuit. Miner. Eng. 2016, 91, 92–99. [Google Scholar] [CrossRef]
  111. Lopes, L.M.C.E.; Pina, P.S.; Oliveira, A.C.R.; Mayrink, A.C.S. Aplicação da Tecnologia de Ore Sorting para Pre-concentração de Minérios Sulfetados Polimetálicos de Aripuanã. In Proceedings of the XIX National Meeting of Mineral Treatment and Extractive Metallurgy, Rio de Janeiro, Brazil, 25–28 September 2022. [Google Scholar]
  112. Assis, V.M.; Henriques, A.B.; Lemos, M.G.; Dumont, J.A. Technological Innovation in Córrego do Sítio Mineração—A Study of Technical and Economic Aspects by Using Sensor-Based Sorting for Refractory Gold Ore. REM Int. Eng. J. 2021, 74, 117–125. [Google Scholar]
  113. Reple, A.C.S. Bulk Ore Sorter: Um Estudo de Caso para a Mina de Phu Klam. Master’s Thesis, Federal University of São Paulo, São Paulo, Brazil, 2017. [Google Scholar]
  114. Lessard, J.; de Bakker, J.; McHugh, L. Development of Ore Sorting and Its Impact on Mineral Processing Economics. Miner. Eng. 2014, 65, 88–97. [Google Scholar] [CrossRef]
  115. Li, G.; Klein, B.; Sun, C.; Kou, J. Insight in Ore Grade Heterogeneity and Potential of Bulk Ore Sorting Application for Block Cave Mining. Miner. Eng. 2021, 170, 106999. [Google Scholar]
  116. Cetin, M.C.; Li, G.; Klein, B.; Futcher, W. Key Factors Determining the Bulk Ore Sorting Potential in a Caving Mine. Miner. Eng. 2023, 201, 108237. [Google Scholar]
  117. Nadolski, S.; Samuels, M.; Klein, B.; Hart, C.J.R. Evaluation of Bulk and Particle Sensor-Based Sorting Systems for the New Afton Block Caving Operation. Miner. Eng. 2018, 121, 169–179. [Google Scholar]
  118. Xu, Y.; Klein, B.; Li, G.; Gopaluni, B. Evaluation of Logistic Regression and Support Vector Machine Approaches for XRF Based Particle Sorting for a Copper Ore. Miner. Eng. 2023, 192, 108003. [Google Scholar]
  119. Jia, W.; Zhang, Z.; Shan, Q.; Zhang, J.; Hei, D.; Zhang, Y.; Sun, A.; Liao, M.; Ling, Y. Determination of Molybdenum in Geological Ores by Laser-Induced Breakdown Spectroscopy (LIBS) with Support Vector Machine Regression (SVMR) and Data Preprocessing. Anal. Lett. 2024, 57, 2004–2017. [Google Scholar]
  120. Konstantinidis, F.K.; Sifnaios, S.; Tsimiklis, G.; Mouroutsos, S.G.; Amditis, A.; Gasteratos, A. Multi-sensor Cyber-Physical Sorting System (CPSS) Based on Industry 4.0 Principles: A Multi-functional Approach. Procedia Comput. Sci. 2023, 217, 227–237. [Google Scholar]
  121. Tan, W.; Duan, Q.; Yao, L.; Li, J. A Sensor Combination Based Automatic Sorting System for Waste Washing Machine Parts. Resour. Conserv. Recycl. 2022, 181, 106270. [Google Scholar]
  122. Koschinsky, A.; Heinrich, L.; Boehnke, K.; Cohrs, J.C.; Markus, T.; Shani, M.; Singh, P.; Stegen, K.S.; Werner, W. Deep-Sea Mining: Interdisciplinary Research on Potential Environmental, Legal, Economic, and Societal Implications. Integr. Environ. Assess. Manag. 2018, 14, 672–691. [Google Scholar]
  123. Mizell, K.; Hein, J.R.; Au, M.; Gartman, A. Estimates of Metals Contained in Abyssal Manganese Nodules and Ferromanganese Crusts in the Global Ocean Based on Regional Variations and Genetic Types of Nodules. In Perspectives on Deep-Sea Mining; Sharma, R., Ed.; Springer: Cham, Switzerland, 2022; pp. 53–80. [Google Scholar]
  124. Hornsey, M.J.; Fielding, K.S.; Harris, E.A.; Bain, P.G.; Grice, T.; Chapman, C.M. Protecting the Planet or Destroying the Universe? Understanding Reactions to Space Mining. Sustainability 2022, 14, 4119. [Google Scholar] [CrossRef]
  125. Deberdt, R.; Le Billon, P. Outer Space Mining: Exploring Techno-Utopianism in a Time of Climate Crisis. Ann. Am. Assoc. Geogr. 2023, 113, 1878–1899. [Google Scholar]
Figure 1. Generic scheme of increasing demand for processing stages and the growth of costs as grades decline, adapted from [13].
Minerals 15 00350 g001
Figure 2. The main industrial metals mined globally in 2022.
Minerals 15 00350 g002
Figure 3. Diagram of a flotation cell, highlighting its main components and the mineral separation process, adapted from [9,10].
Minerals 15 00350 g003
Figure 4. General layout of an SBS system, presenting the feeding (green), detection (red), data processing (violet) and separation (blue) zones.
Minerals 15 00350 g004
Figure 5. Operating scheme of the two processes of X-ray transmission systems: conventional (XRT) and dual energy (DE-XRT).
Minerals 15 00350 g005
Figure 6. Operating scheme of a CCD camera, where the light reflected from the sample is captured by the CCD camera, transformed in digital data and sent to a processing unit.
Minerals 15 00350 g006
Figure 7. Example of a response from a pair of rock samples analyzed by a laser-equipped sensor. The red highlighted area (red) corresponds to the mineralized zone, adapted from [57].
Minerals 15 00350 g007
Figure 8. Example response from a group of samples exposed to a microwave source. The CCD camera image corresponds to the visible spectrum, and the IR camera image shows the temperature after MW exposition, where hot samples (red/yellow) correspond to high-grade particles and cold samples (green/blue) correspond to low-grade or non-mineralized particles. Adapted from [73], Pilot scale microwave sorting of porphyry copper ores: Part 1–Laboratory investigations, Batchelor, A.R.; Ferrari-John, R.S.; Katrib, J.; Udoudo, O.; Jones, D.A.; Dodds, C.; Kingman, S.W., Miner. Eng. 2016, 98, 303–327, with permission from Elsevier.
Minerals 15 00350 g008
Figure 9. Basic layout of a model of an electromagnetic separator, adapted from [77], where samples of different compositions (white, black and blue) can be identified.
Minerals 15 00350 g009
Figure 10. Pre-concentration scenario for copper ore. The red rectangle presents the NSR results using each technique individually: MR (a) or PGNAA (b). The green rectangle presents the NSR scenarios combining MR and PGNAA techniques, modeled using the machine learning algorithms Distributions difference Cu (c) and Linear regression (d). Adapted from [36], A Conceptual Strategy for Effective Bulk Ore Sorting of Copper Porphyries: Exploiting the Synergy between Two Sensor Technologies, Cetin, M.C.; Klein, B.; Futcher, W., Miner. Eng. 2023, 201, 108182, with permission from Elsevier.
Minerals 15 00350 g010
Figure 11. Scatter plot graphic presenting the distribution of data between metal recovery and particle size, considering 49 studies from 1985 to 2022. The red lines show the zone of lower recoveries in particle sizes less than 110 mm.
Minerals 15 00350 g011
Figure 12. Histograms of metal recovery and feed size, considering 49 studies from 1985 to 2022.
Minerals 15 00350 g012
Figure 13. Example of an ROC graphic, where the red point represents a sorting configuration that obtains an almost perfect separation, adapted from [108,109].
Minerals 15 00350 g013
Figure 14. Graphs demonstrating the reduction in P75 particle size for MW-pre-concentrated material vs. untreated material (A) and the copper grade data in the concentrates obtained during flotation for each time interval (B), adapted from [74].
Minerals 15 00350 g014
Figure 15. Recovery and loss data for Zn and Pb, in % and tons per day (tpd), with pre-concentration (PC) and without PC, adapted from [111].
Minerals 15 00350 g015
Figure 16. Gold (Au) and sulfur (S) recoveries using an XRT sensor, laser sensor, and both techniques simultaneously, adapted from [112].
Minerals 15 00350 g016
Figure 17. Grade vs. tonnage curve for the Phu Kam mine with and without sensor-based sorting, adapted from [113].
Minerals 15 00350 g017
Figure 18. Scheme illustrating twelve aspects related to the implementation of sensor-based sorting systems in a mining operation, and how sensor-based sorting (SBS) systems can interact with various mine and plant processes, directly (arrows 1–6) and indirectly (arrows 7–12).
Minerals 15 00350 g018
Figure 19. Scheme of a CPSS system, showing a bank of sensors and a robotic arm that allow the separation of several materials simultaneously (brown, blue and black examples), modified from [120].
Minerals 15 00350 g019
Table 1. Nomenclature and chemical composition of the main Cu minerals.
Type Mineral Formula
SulfidesChalcociteCu2S
CovelliteCuS
ChalcopyriteCuFeS2
BorniteCu5FeS4
StanniteCu2FeSnS4
EnargiteCu3AsS4
TennantiteCu12As4S13
FamatiniteCu3SbS4
TetrahedriteCu12Sb4S13
OthersCupriteCu2O
TenoriteCuO
Chrysocolla(Cu,Al)2H2Si2O5(OH)4·nH2O
AtacamiteCu2Cl(OH)3
MalachiteCu2CO3(OH)2
AzuriteCu3(CO3)2(OH)2
Table 2. Five basic steps for optimal sensor-based sorting performance.
StepConsiderations
1Preparation- Material may need to be washed, depending on the property being detected.
- Key factors: removing surface contaminants, improve sensor accuracy.
2Feeding- Preliminary classification based on a specific particle size range (typically maintaining a 3:1 ratio between larger and smaller particles).
- Key factors: belt or feeder fill factor, feeding speed, and liberation degree.
3Presentation to the sensor- Proper arrangement of the material on the conveyor belt is critical.
- Key factors: fill factor of the belt and uniformity of particle distribution, distance between the samples and the sensor, conveyor belt velocity.
4Sensor detection- Detectable contrast between particles is essential.
- Appropriate sensor selection (or combination of sensors) must align with material properties.
- Key factors: sensor resolution, calibration and recalibration, especially to account for deposit variations.
5Separation- Considerations include the quality of the air feeding the ejection system and the type of separation device used to ensure precise and efficient material sorting.
Table 3. Techniques of sensor-based sorting applied to sulfide ores, adapted from [12,56].
SpectrumDetected FeaturesPenetrationInteraction with Examples of Applications
X-ray transmission (XRT)Primary features, atomic densityDeepTransmission of RX through the materialMetals, precious metals, industrial minerals, coal, diamonds, recycling
Visible light (VIS)Secondary featuresSuperficialReflection, absorption, transmission, luminescenceIndustrial minerals, precious stones, recycling, diamonds
Near-infrared (NIR)Secondary featuresSuperficialMonochromatic reflection and absorptionBase metal ores, industrial minerals, precious stones, diamonds
Infrared (IR) + microwavesSecondary featuresSuperficialHeat dissipation after microwave submission Metals, industrial minerals
Radiowaves [magnetic resonance (MR)]Primary features, mineralogyDeepExcitation and detection of spectral radiowave lines Bulk ore sorting (BOS), calcopyrite
Alternating current (AC)Secondary featuresDeepConductivity, magnetic susceptibilityIron and other base metals, recycling
Table 4. Heating responses when using the microwave sensor for various mineral groups, adapted from [64].
CategoryMineralTemp. (°C)Time (min)
Easy heatingFeS210196.75
PbS9567.00
CuFeS29201.00
Hard heatingSiO2797.00
Al2O3784.50
KAlSi3O8677.00
CaCO3744.25
Table 5. Response to radiowaves by mineral type.
MineralCategoryMR Sensitivity
ChalcopyriteCopperHigh
CubaniteCopperHigh
CovelliteCopperMedium
ChalcociteCopperMedium
EnargiteCopperLow
TennantiteCopperLow
Cuprite + delafossitesCopperHigh
TenoriteCopperLow
ArsenopyriteArsenicHigh
OrpimentArsenicHigh
RealgarArsenicHigh
LollingiteArsenicHigh
NiccoliteNickel/ArsenicMedium
HematiteIronHigh
MagnetiteIronVery High
MaghemiteIronHigh
PyrrhotiteIronHigh
Bismuthinite + othersSeveralMedium
Stibnite + othersSeveralHigh
ZirconZirconLow
CobaltiteCobaltHigh
Table 6. Other sensor-based sorting techniques commonly used for non-sulfide ores.
SpectrumDetected FeaturesPenetrationInteraction with Examples of Applications
Gamma-radiationSecondary features, emissionDeepNatural gamma radiationUranium and other radioactive minerals, precious metals
X-ray fluorescence (XRF)Secondary features, emissionSuperficialElectrons of external atomic layerDiamonds, sample analysis
X-ray luminescence (XRL)Secondary featuresSuperficialExcitation of luminescence by X-raysDiamonds
Ultraviolet (UV)Secondary featuresSuperficialReflection, absorption, transmission, luminescenceDiamonds
Table 7. Number of the 49 studied cases classified within each range of production capacity in SBS equipment. Adapted from [88].
Particle Size Interval (mm)Capacity Limit (t/h×m)No. of Cases%
5.6–81512.04%
8–203012.04%
20–40601326.53%
>40>1103469.39%
49100.00%
Table 8. Example of a confusion matrix, adapted from [105,106].
FeedProductWaste
Positive fractionTrue positives (TPs)False negatives (FNs)
Negative fractionFalse positives (FPs)True negatives (TNs)
Product fraction (P)Waste fraction (N)
Table 9. Results from SBS tests in Souzmetallresource mines, adapted from [114].
Mine AMine B
Relaxed thresholdMetal recovery86.4%65.5%
Concentration factor8.819.8
Waste fraction90.0%93.7%
Moderate thresholdMetal recovery88.0%79.7%
Concentration factor5.110.2
Waste fraction82.9%79.2%
Aggressive thresholdMetal recovery93.4%87.0%
Concentration factor2.96.0
Waste fraction66.5%54.8%
Disclaimer/Publisher’s Note: The statements, opinions and data contained in all publications are solely those of the individual author(s) and contributor(s) and not of MDPI and/or the editor(s). MDPI and/or the editor(s) disclaim responsibility for any injury to people or property resulting from any ideas, methods, instructions or products referred to in the content.

