Article

Lower Cretaceous Carbonate Sequences in the Northwestern Persian Gulf Basin: A Response to the Combined Effects of Tectonic Activity and Global Sea-Level Changes

1
School of Geosciences, Yangtze University, Wuhan 430100, China
2
Key Laboratory of Exploration Technologies for Oil and Gas Resources, Ministry of Education, Yangtze University, Wuhan 430000, China
*
Authors to whom correspondence should be addressed.
Minerals 2025, 15(4), 363; https://doi.org/10.3390/min15040363
Submission received: 27 February 2025 / Revised: 28 March 2025 / Accepted: 28 March 2025 / Published: 31 March 2025

Abstract

:
In the northern Persian Gulf Basin, a carbonate succession developed during the Berriasian–Valanginian of the Early Cretaceous, constituting an important reservoir in the Middle East. The genetic types of this succession are highly variable and controlled by sequence evolution. However, the sequence construction processes and sedimentary model evolution remain poorly understood. To analyze sedimentary models and sequence-controlling factors, this study examines sequence stratigraphic characteristics. The analysis is based on core thin sections, well logs, seismic data, and global sea-level records. The results indicate that: (1) During the Berriasian to Valanginian, one retrogradational sequence (SQ1) and three progradational sequences (SQ2–SQ4) were identified, arranged from bottom to top. The three sequences (SQ2 to SQ4) exhibit a vertically stacked progradational pattern towards the northeast. (2) SQ1 is dominated by shelf facies, while SQ2 to SQ4 are characterized by platform facies. Within each sequence (SQ2 to SQ4), the depositional environments transition from basin to slope, platform margin, and finally restricted platform facies. Specifically, during the SQ2 period, the platform margin had a low dip angle (<1.0°), indicating a gently sloping platform. In contrast, during the SQ3 to SQ4 sequences, the platform margin exhibited a steeper dip angle (1.2–1.5°), suggesting a rimmed platform. (3) SQ1 is governed by the global marine transgression during the Early Cretaceous, representing a global sea-level sequence. SQ2 to SQ4 are influenced by the combined effects of tectonic activities and sea-level changes, constituting tectonic/global sea-level change sequences. The transgressive sequences have developed high-quality source rocks, while the regressive sequences have formed extensive reservoirs, together creating favorable hydrocarbon source–reservoir assemblages. The reef and shoal distribution model developed in this study offers valuable insights for reservoir prediction. Additionally, the interpreted transgressive sequences may have global correlation potential.

1. Introduction

The Mesozoic stratigraphy of the Arabian Plate hosts many important source rocks and reservoirs, particularly in the Jurassic and Cretaceous system [1]. The Cretaceous system accounts for 45% of the region’s oil reserves, with over 90% of these reserves hosted in carbonate reservoirs [2,3]. In recent years, Lower Cretaceous carbonate successions (Berriasian–Valanginian) have emerged as a key exploration target in the Middle East [4]. The stratigraphy exhibits nomenclatural discrepancies due to three key factors: (1) its transboundary distribution across multiple countries and regions; (2) pronounced lateral variations in sedimentary phases and lithologies; and (3) divergent naming conventions adopted by petroleum companies. In Iraq, these strata are classified as the Sulaiy and Yamama Formations, whereas in the Persian Gulf Basin, they are classified as part of the Fahliyan Formation. To maintain terminological consistency, this study uniformly applies the Iraqi stratigraphic nomenclature (Sulaiy/Yamama) in all subsequent analyses. First defined by Steineke and Bramkamp (1952) in Saudi Arabian Mesozoic sections [5], the Yamama Formation comprises bioclastic tuff strata within the Lower Cretaceous Thamama Group. As a major Lower Cretaceous carbonate reservoir, the Yamama Formation is widely distributed across the Zagros Basin, with its thickest development in the northern Persian Gulf. In the southern Mesopotamian Basin, the Yamama Formation serves not only as an excellent reservoir, but also as a high-quality source rock [6]. The Yamama Formation is a key exploration target in the northern Persian Gulf and southern Iraq oil fields. This is due to the widespread development of platform facies reservoirs, gentle structural relief, and well-defined traps with significant hydrocarbon accumulation. Additionally, its close proximity to the organic-rich deep-water Sulaiy Formation enhances its prospectivity [7,8].
Numerous scholars have conducted extensive studies on the stratigraphy of the Berriasian–Valanginian stages in the Persian Gulf Basin. Bahrehvar (2021) [9] divided the stratigraphy of the Berriasian–Valanginian stages into four sequences. Through lithofacies analysis, four subfacies (lagoon, algal patch reef/mound, shoal, and open marine) and ten microfacies were identified within these strata. He proposed a slope-type carbonate platform model for the depositional setting of these sequences. Additionally, reservoir property studies revealed eight hydraulic flow units and four reservoir facies types, each following by a specific and predictable sequence stratigraphic framework. K. Abd (2024) [10] identified two major units within this stratigraphic interval through seismic sequence analysis. These units represent transgressive and regressive facies deposited in highstand system tracts. Various seismic facies were identified, reflecting deposition in a gentle slope environment. Seismic attribute analysis revealed carbonate buildups and progradational stacking patterns, which define three major seismic sequence indices. These indices reflect the facies of shallow-water carbonate deposits during the final depositional cycle of the Yamama Formation. Rayan Khalil (2024) [11] conducted field investigations that revealed the Yamama Formation consists of thin- to thick-bedded, massive to nodular limestones, with minor shale and marl intercalations. Petrographic studies identified four distinct types of microfacies associations within the formation. These associations are dominated by mudstone, wackestone, packstone, and grainstone lithologies, representing deposition in various slope environments.
Overall, previous studies on this stratigraphy mainly focus on stratigraphic delineation and sedimentary microphase [9,10,11,12,13]. However, discussions on its depositional model types, evolutionary patterns, and controlling factors remain insufficiently detailed. Therefore, the primary objective of this study is to analyze data from two seismic profiles and 11 wells in the study area. This analysis aims to elucidate the sequence development and sedimentary evolution of the Berriasian to Valanginian strata in the northwestern Persian Gulf Basin. This will provide technical reference for reservoir studies and oil and gas exploration in the region.

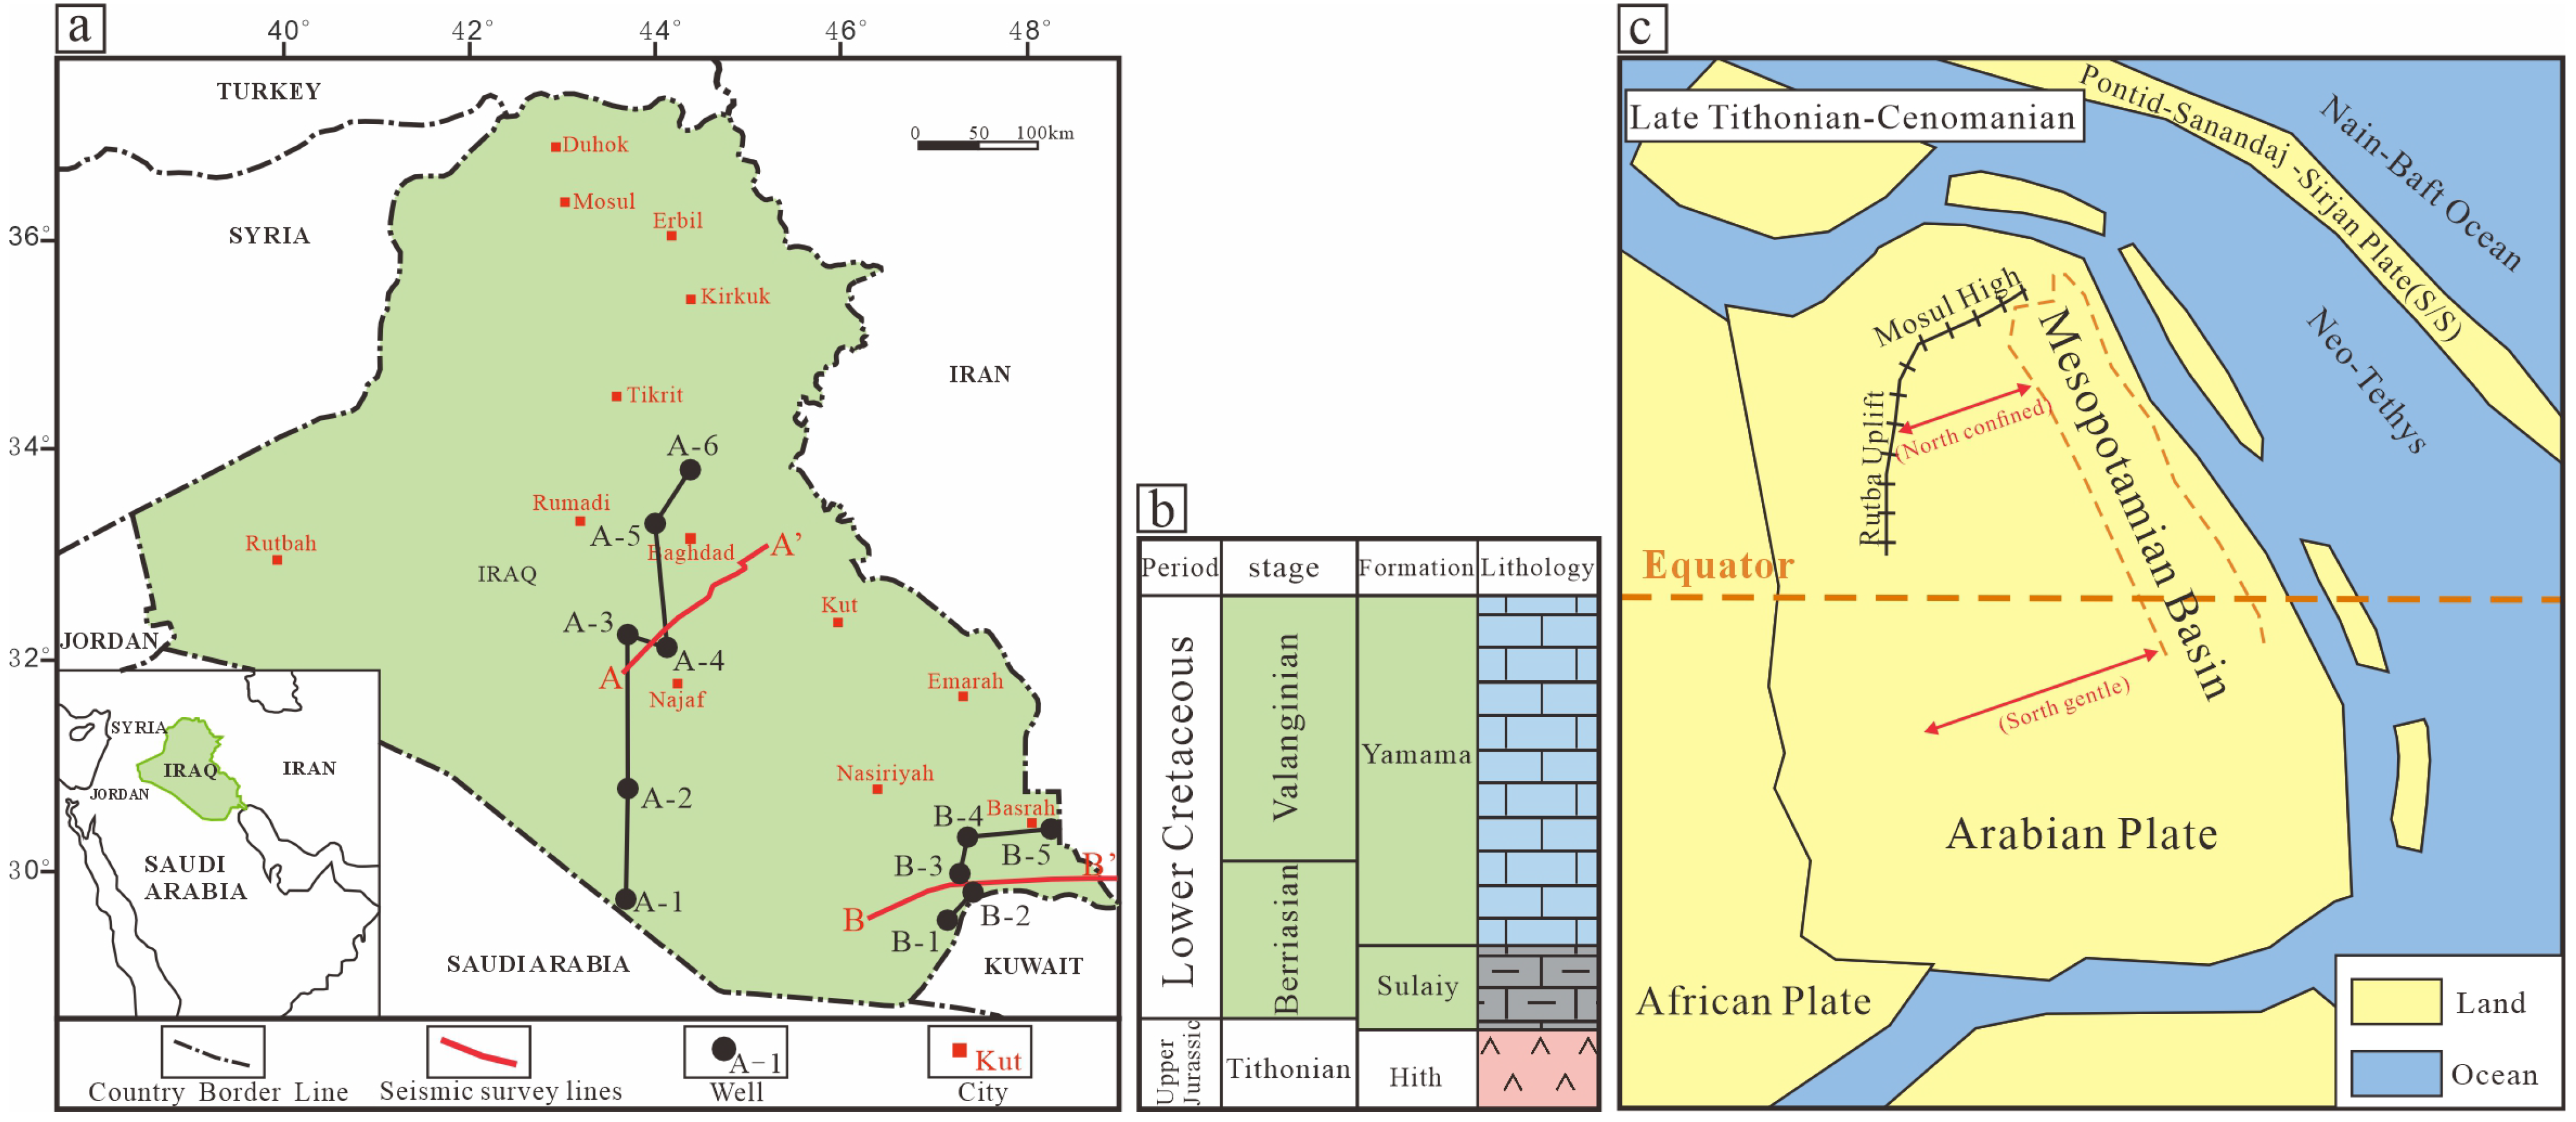
2. Geological Overview

The oil and gas resources of the Middle East are mainly located in the Jurassic and Cretaceous [14,15]. The Cretaceous and Jurassic of the Arabian Plate are situated within a passive continental margin environment. This environment gradually developed from the Late Permian, coinciding with the formation of the Neotethys Ocean [16]. Throughout most of the Cretaceous, the Arabian Plate inherited the sedimentary framework established during the Jurassic, characterized by a shallow marine carbonate platform depositional environment [17]. During this period, the northeastern margin of the Arabian Plate (including the Persian Gulf) was situated at the equator [18,19], where high and continuous sedimentation rates resulted in the formation of large-scale source rocks and reservoirs [20]. During the Late Berriasian to Valanginian age, a shallow marine carbonate platform facies sequence developed, covering most of the eastern Arabian Plate. In the Middle to Late Jurassic, the Iraq region was situated within the Gotinia restricted basin. Influenced by the northeastward subduction of the Neo-Tethys Ocean, microcontinental blocks, such as the Bitlis in the northeastern Arabian Plate, began to rift, impeding water exchange between the basin and open marine environments. Peripheral uplifts surrounding the basin caused periodic isolation from the open sea. Meanwhile, continuous subsidence under weak extensional conditions facilitated the development of deep-water hydrocarbon source rocks and thick evaporite deposits [21]. In the Early Cretaceous, the southern Neo-Tethys Ocean expanded, leading to the separation of the Bitlis-Bisitoun microcontinental block from the Arabian Plate, transforming this area into a semi-restricted basin. During the Berriasian–Valanginian stages, the Iraq region sequentially developed from west to east: inner ramp sandstone facies (now eroded), Ratawi Formation lagoon facies, and Yamama Formation shallow-water shelf carbonate facies. The Sulaiy Formation’s argillaceous limestones were deposited in the eastern marginal inner shelf basin [22]. Compared to the open marine environment in the southern part of the Arabian Plate, the northern part, influenced by the subduction of the Rutba Uplift and Mosul High, experienced a relatively restricted depositional environment (Figure 1c). Therefore, in terms of depositional model, the wide, gently sloping open environment in the south was more conducive to the deposition of a carbonate ramp model. In the north, due to the relatively restricted environment, it is likely that a high-energy, steeper, and narrower platform margin carbonate model may have formed more readily.
The Sulaiy Formation and Yamama Formation of the Cretaceous System belong to the Berriasian-Aptian cycle. This cycle consists of the Zubair, Ratawi, Yamama, Shuiaba, and Sulaiy formations, ranging from the coastline to the deep basin [23]. The Yamama Formation is primarily composed of limestone, with some dolostone and shale found in certain areas [24]. The Yamama Formation is in conformable contact with both the underlying Sulaiy Formation and the overlying Ratawi Formation, with no distinct stratigraphic boundaries (Figure 1b). The Sulaiy Formation was deposited during the Late Tithonian to Early Berriasian stages, consisting of argillaceous limestone and small benthic foraminifera. It is a high-quality source rock formation [25,26]. The Yamama sequence transitions upward into the Ratawi Formation, which is a heterogenous sequence composed of limestone, shale, siltstone, and sandstone. It serves as the cap rock for the Yamama Formation [27,28]. Where the Ratawi Formation thins or disappears, the Zubair Formation directly overlies the Yamama Formation. The Sulaiy, Yamama, Ratawi, and Zubair Formations represent a sea-retreating carbonate cyclone terminated by clastic intrusion of the fluvial deltaic phase of the Zubair Formation [29].
Figure 1. Stratigraphic Stacking Relationships and Plate Tectonic Evolution Map of the Northern Margin of the Persian Gulf Basin during the Late Jurassic to Early Cretaceous. (a) Location map of the study area. (b) Upper Jurassic-Lower Cretaceous stratigraphy of the northern margin of the Persian Gulf Basin. (c) Late Jurassic-Early Cretaceous plate evolution map (based on the literature [30,31,32,33]).
Minerals 15 00363 g001

3. Materials and Methods

This study uses two seismic lines data from eleven single wells and numerous core thin-section photographs from the published literature [34,35,36,37]. It aims to investigate and discuss the sequence architecture and depositional model evolution of the Berriasian–Valanginian stage. The research methodology includes the following steps: (1) By compiling core thin sections of this formation from the published literature and analyzing their rock types, grain texture, biogenic components, pore structure, and other characteristics, the characteristics and types of sedimentary microfacies are summarized [34,35,36,37]. (2) Seismic reflection termination patterns, such as downlap and truncation, were analyzed to identify low-frequency sequence boundaries. This helped determine the sequence-building processes during different periods. By integrating well-log curve characteristics (e.g., box-shaped, bell-shaped) and lithological associations (e.g., grainstone, wackestone) with Petrel geological software, single wells were projected onto corresponding positions on the seismic lines. This allowed for the identification and delineation of facies boundaries. (3) Using Resform software, two well-tie cross-sections were constructed from the eleven single wells in the study area. Based on lithological variations and well-log curve morphologies, the depositional facies types and their planar distribution characteristics during different sequence development periods were determined. Planar evolution maps of depositional facies for the SQ2–SQ4 periods were subsequently generated. (4) Using Petrel software, the basal interfaces of the corresponding strata for the SQ2–SQ4 periods were flattened. The thickness (H) of the highest point of the platform margin and its distance (L) to the slope were measured, and their ratios were calculated to determine the platform margin angles. The angles for the SQ2 interval were 0.75° and 0.69°; for the SQ3 interval, they were 1.23° and 1.21°; and for the SQ4 interval, they were 1.42° and 1.37°. Based on M.E. Tucker’s (1981) [38] classification scheme for platform margins, the types of platform margins were determined. (5) Global sea-level changes, biological and climatic factors, and tectonic settings were comprehensively analyzed. The controlling factors of sequence development and platform margin evolution were then identified.

4. Results

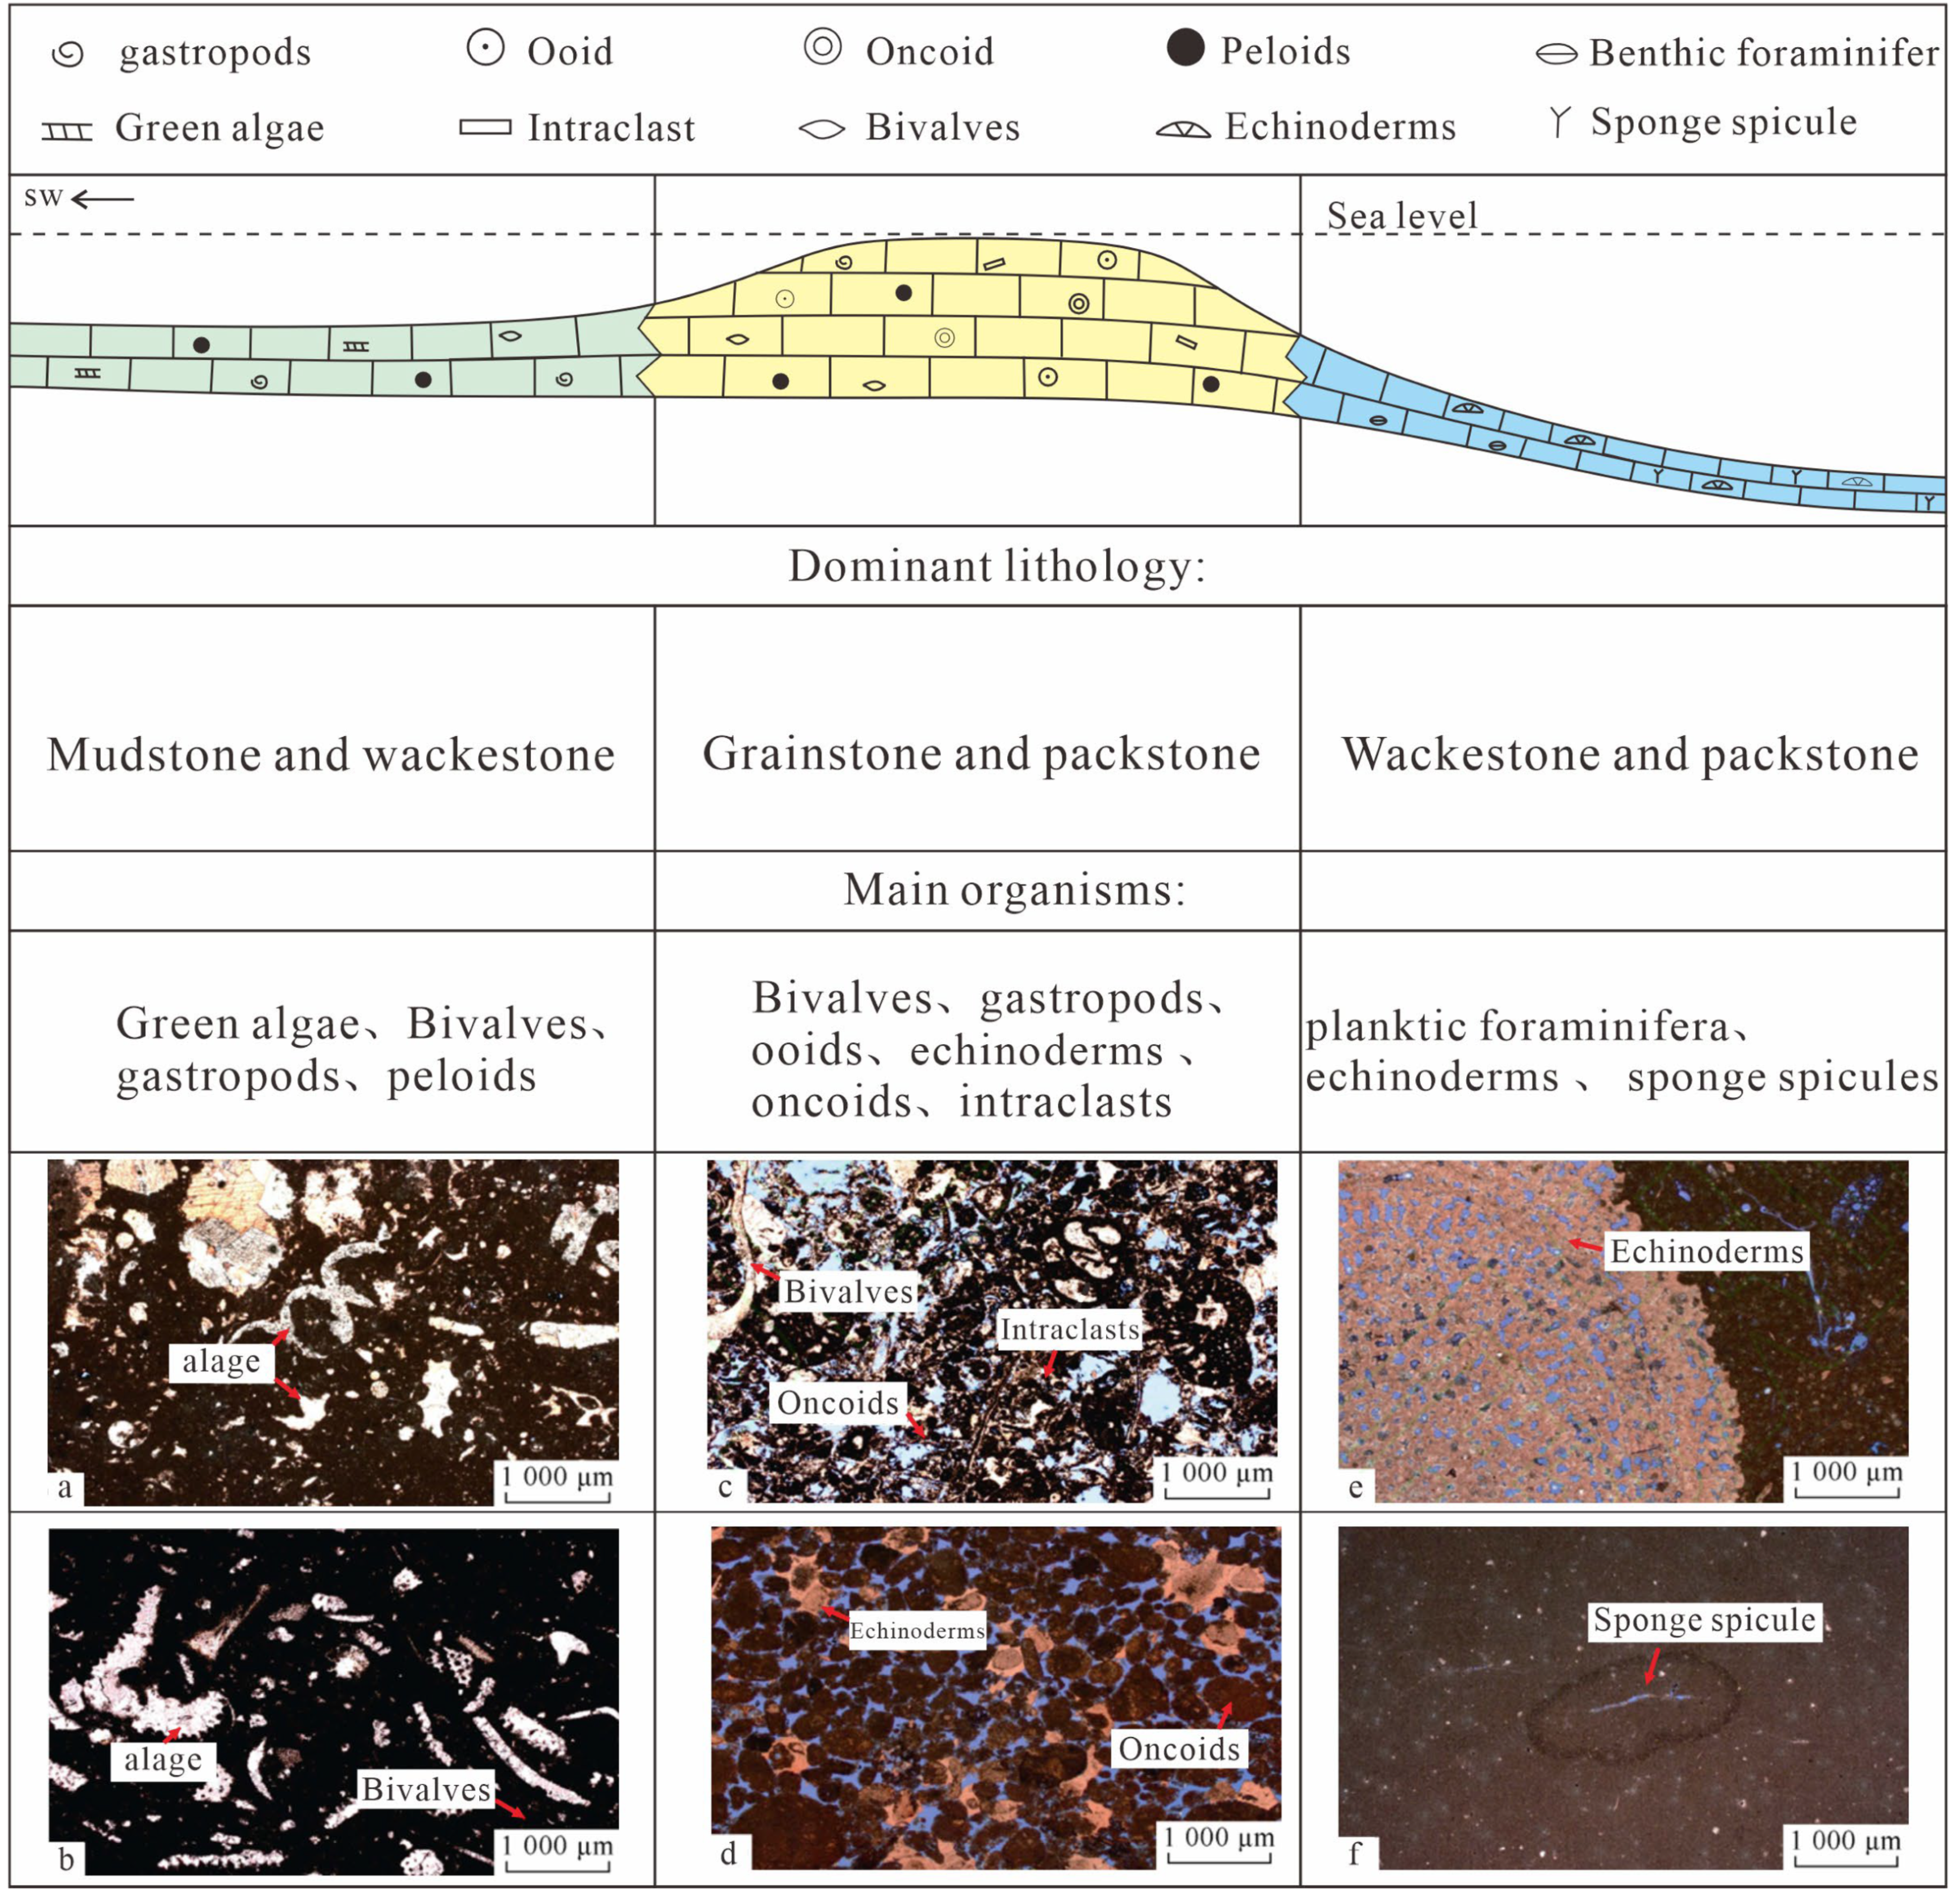
4.1. Lithofacies Characteristics

Previous studies on the sedimentary microfacies characterization of the Yamama and Sulaiy formations have made significant contributions [34,35,36,37]. By examining the variations in biotic components, frameworks, non-framework elements, and sedimentary structures displayed in core thin sections, it has been determined that the Yamama Formation predominantly represents a shallow marine carbonate platform facies [34,35,36,37]. The Sulaiy Formation predominantly develops a shelf facies [39,40]. Based on the review of the publicly available literature [34,35,36,37], the petrographic characteristics of the Yamama Formation in the study area can be classified into three types (Figure 2).

4.1.1. Lithofacies Association 1: Various Types of Bioclastic Grainstone to Packstone

This lithofacies association consists of various grainstones and some packstones with a grain-supported structure. The composition includes various types of bioclasts debris, bivalves, gastropods, ooids, oncoids and intraclasts. The presence of diverse grainstones and microorganisms, along with moderate to high sorting and roundness, indicates deposition in a high-energy environment, such as a shoal, reef, or grainy beach.

4.1.2. Lithofacies Association 2: Bioclast Mudstone to Wackestone

This lithofacies association includes peloid bioclast mudstone to wackestone with mud-dominated textures. Green algae, bivalves and gastropods are notable skeletal grains, and peloids are dominant non-skeletal components. The occurrence of mudstone and wackstone indicates deposition under low-energy conditions, such as lagoons or other relatively restricted, low-energy environments.

4.1.3. Lithofacies Association 3: Wackestone and Packstone

This lithofacies association encompasses mud to grain-supported facies with wackestone and packstone textures that contain open marine indicator fauna, such as planktic foraminifera, echinoderms, and sponge spicules. Moderate to poor sorting and textural characteristics indicate their deposition in open marine settings, such as the middle to outer ramp environments.
Figure 2. Spatial Distribution of Dominant Lithology and Main Organisms in the Yamama Formation of the Study Area. (a,b) Algal-bioclastic wackestone. (c,d) Well-sorted bioclastic oncoids grainstone. (e) Sponge bioclastic packstone. (f) Bioclastic wackstone (based on the literature [21,34,35,36,37]).
Minerals 15 00363 g002

4.2. Sequence Identification and Facies Belt Division Based on Well-Seismic Integration

By identifying low-frequency sequence boundaries on seismic profiles and correlating with lithological features from individual wells, the construction process of the carbonate platform margin during different stages of the Berriasian to Valanginian interval is determined. Based on the sequence stratigraphy framework of Vail et al. [41], sequence boundaries in carbonate strata typically include unconformities, facies change surfaces, and exposure surfaces. The definition of sequence boundaries in carbonate strata can be approached from both scientific and applied perspectives. Regional unconformities can serve as sequence boundaries, while the surfaces marking the transition of sedimentary facies belts can also represent sequence boundaries. This study primarily uses the surfaces marking the transition of sedimentary facies belts as the basis for sequence boundary division.

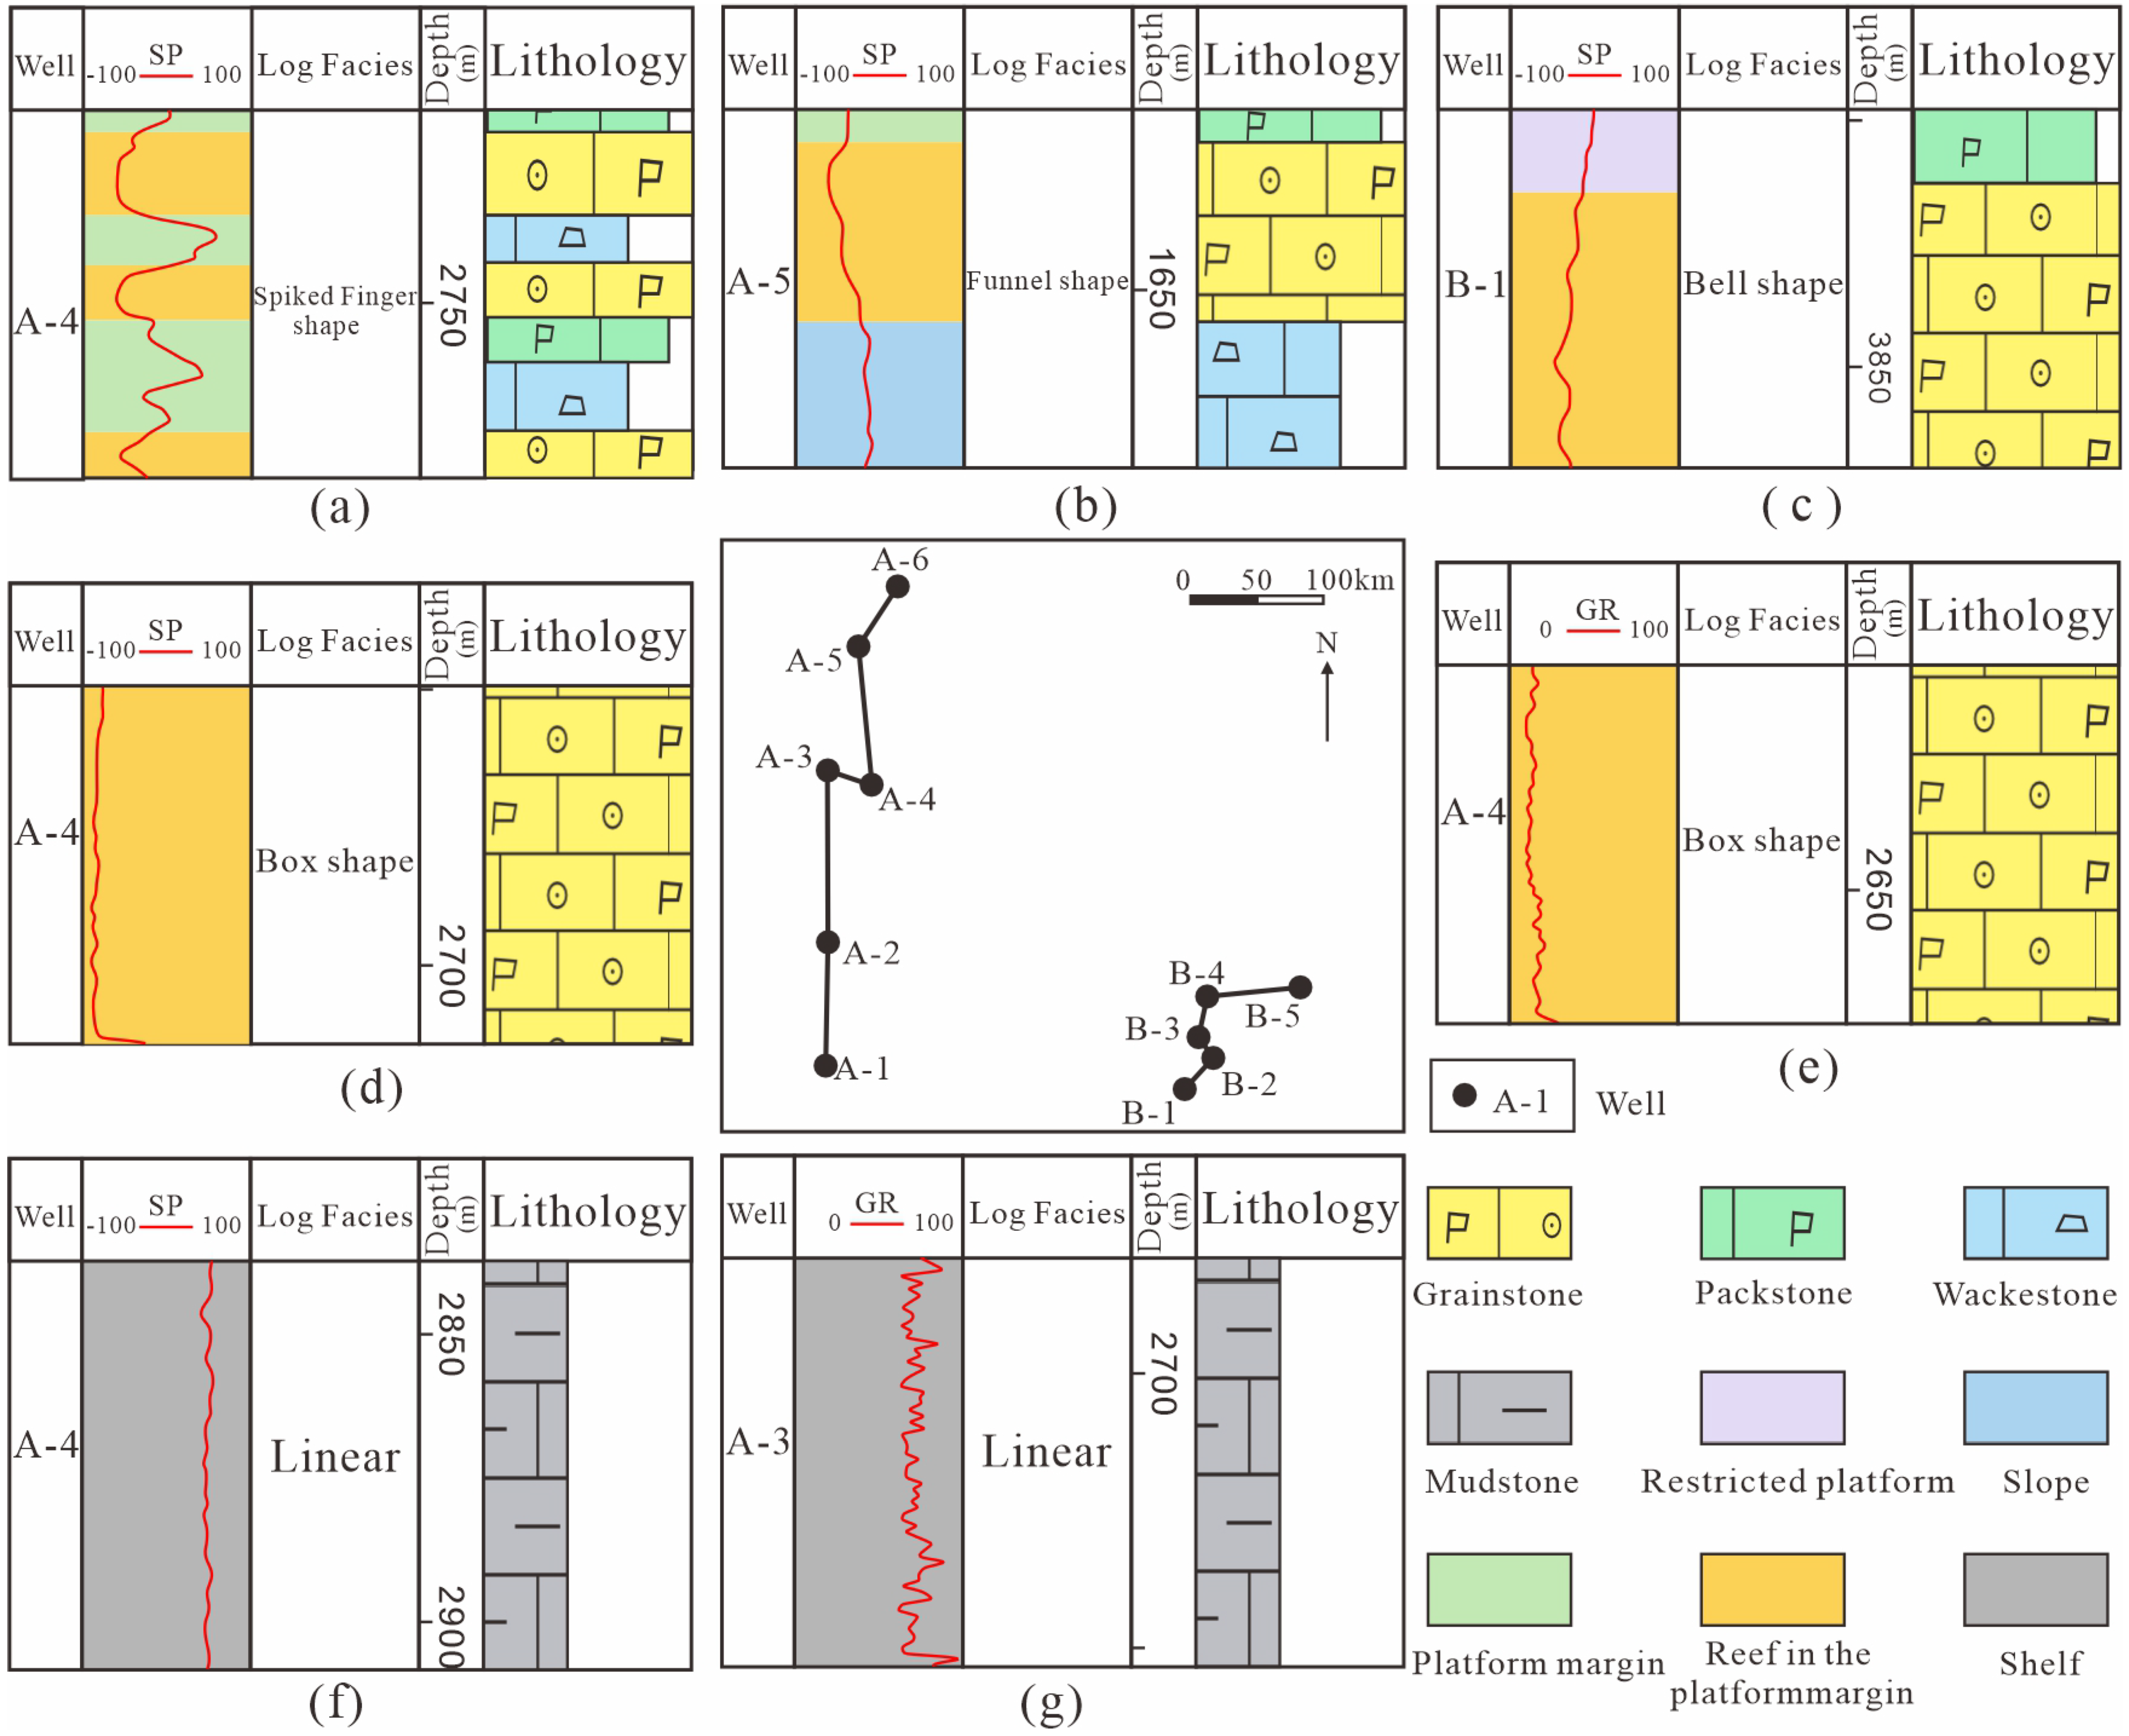
4.2.1. Well-Log Facies Characteristics

In the study area, the Yamama formation primarily develops five types of natural potential (SP) log curves, including box-shaped, finger-shaped, funnel-shaped, and bell-shaped, as well as box-shaped, natural gamma (GR) curves. The Sulaiy formation develops linear SP curves and tooth-shaped linear GR curves.
(1)
Finger-shaped (Figure 3a): This curve type exhibits the largest amplitude of variation, presenting a smooth finger-like or spike-shaped form. The SP curve is mostly medium to high in value, with occasional low-value segments, reflecting a depositional environment with relatively low energy in this section. Combined with lithology, which is mainly wackestone and packstone, it usually indicates a platform margin intertidal sedimentary response.
(2)
Funnel-shaped (Figure 3b): This type of SP curve shows a clear decreasing trend from bottom to top, indicating a gradual increase in hydrodynamic conditions over time. The lithology transitions from wackstone to grainstone, usually indicating a transition from slope or intertidal to platform-margin shoal facies.
(3)
Bell-shaped (Figure 3c): This type of curve is the opposite of the funnel-shaped one, with SP values gradually increasing from bottom to top, suggesting a weakening of hydrodynamic conditions from bottom to top. The lithology transitions from grainstone to packstone, typically indicating a transition from the platform margin to the inner platform.
(4)
Box-shaped (Figure 3d,e): The GR curve of this type shows a micro-toothed morphology (while the SP curve is relatively smooth). There is no significant change, and the values are relatively low, with abrupt contacts at both the top and bottom, representing stable and strong hydrodynamic conditions. The lithology is mainly grainstone, typically indicating high-energy microfacies, such as platform margin reefs and shoals. This curve morphology is a symbol of favorable reservoir development.
(5)
Linear (Figure 3f,g): This type of GR curve presents weakly toothed linear morphology (while the SP curve is relatively smooth). The curve is more gradual with higher values, reflecting stable and weak hydrodynamic conditions. The lithology is mainly Mudstone, typically in basin or deep shelf environments, which are usually favorable for hydrocarbon source rock development.
Figure 3. Well-Log Facies Characteristics Map of the Yamama and Sulaiy Formations in the Study Area. (a) Spiked finger shape, (b) Funnel shape, (c) Bell shape, (d,e) Box shape, (f,g) Linear shape.
Minerals 15 00363 g003

4.2.2. Seismic Sequence Identification

The third-order sequence boundaries are primarily identified on seismic profiles through seismic reflection relationships and differences in seismic reflection characteristics. In this study, five sequence boundaries (SB1, SB2, SB3, SB4, and SB5) can be identified along two seismic profiles in the southwest–northeast direction (leveled along SB2). These boundaries divide the strata deposited during the Berriasian–Valanginian interval into four sequences, from the bottom to the top: SQ1 to SQ4. SB1 represents the interface between the Hith Formation and the Sulaiy Formation. Both the Sulaiy Formation and the Hith Formation exhibit similar seismic reflection characteristics on seismic profiles, characterized by good continuity and medium to strong amplitude (Figure 4a). The underlying Hith Formation consists of a set of evaporites developed during the Late Jurassic, which is manifested by extremely low GR values on well logs. In contrast, the overlying Sulaiy Formation shows relatively high GR values on well logs, indicating a significant change compared to the Hith Formation. The lithology of the Sulaiy Formation is primarily argillaceous limestone, and the entire formation is situated in a shelf environment (Figure 4b). SB2 is the sequence boundary between SQ3 and SQ2, and serves as the conformable boundary between the Sulaiy and Yamama formations. Above the SB2 interface, multiple downlapping reflections can be observed. In the seismic profile, the SQ2 strata reveal several mound-shaped reef bodies, exhibiting discontinuous reflections and weak amplitude. The dominant lithology is Grainstone, and the log curve shows a serrated box shape, indicating that this section corresponds to a region with a higher sedimentation rate at the platform margin. On seismic profile A, the thickness of SQ2 begins to thin at the well projection of A-4. The lower part of SQ2 in well A-4 mainly consists of wackestone. The strata to the right of the well show good continuity and medium to strong amplitude, indicating that this area transitions into a slope-basin environment (Figure 4a,b).
SB3 is the sequence boundary between sequence SQ3 and SQ2. Above the SB3 surface, multiple downlap reflection terminations are observed. In SQ3, above the interface, small hummocky seismic facies can be identified in the southwestern part. These hummocky reef banks are recognized at the projection of well A-3 on profile A and well B-1 on profile B. The lithology is primarily grainstone, representing localized reef banks developed within the platform interior. In the middle of SQ3, the thickness increases, showing poor continuity, weak amplitude, and obvious progradational features. At the A-4 well projection on Profile A, the SP log curve of SQ3 displays a box shape, with the primary lithology being grainstone, indicating a rapidly deposited platform margin area. To the northeast, the SQ3 sequence gradually thins, exhibiting medium to good continuity and medium to strong amplitude, suggesting a transition towards the slope-basin area in the northeast direction (Figure 4a,b).
SB4 represents the boundary between sequences SQ3 and SQ4. Above the SB4 interface, multiple downlap reflection terminations are observed. Sequence SQ4, similar to SQ3, also shows numerous small-scale hummocky seismic facies in the southwestern part, which are point reefs developed within the platform interior. As SQ4 extends northeastward, it gradually transitions into the platform margin zone. In this part, the thickness of the strata increases, exhibiting poor continuity, weak amplitude, and prominent progradational features. Further northeastward along seismic profile A, the strata become thinner with improved continuity, indicating a transition into the slope-basin area (Figure 4a,b).
SB5 is the conformable boundary between the overlying Ratawi Formation and the Yamama Formation. The Ratawi Formation is a heterogenous sequence consisting of limestone, shale, sandstone, and siltstone, acting as the cap rock for the Yamama Formation. Below the SB5 interface, truncation is observable. Above the interface, the seismic response of the Ratawi Formation exhibits relatively better continuity and stronger amplitude compared to the Yamama Formation (Figure 4a).
Overall, SQ1 develops a shelf facies and corresponds to a transgressive phase, while SQ2 to SQ4 develop platform facies. Each sequence is characterized by the development of numerous reef and shoal deposits in relatively shallow-water environments. The stacking pattern of these reefs shows a vertical progradation towards the northeast in each sequence, indicating a regression phase overall.

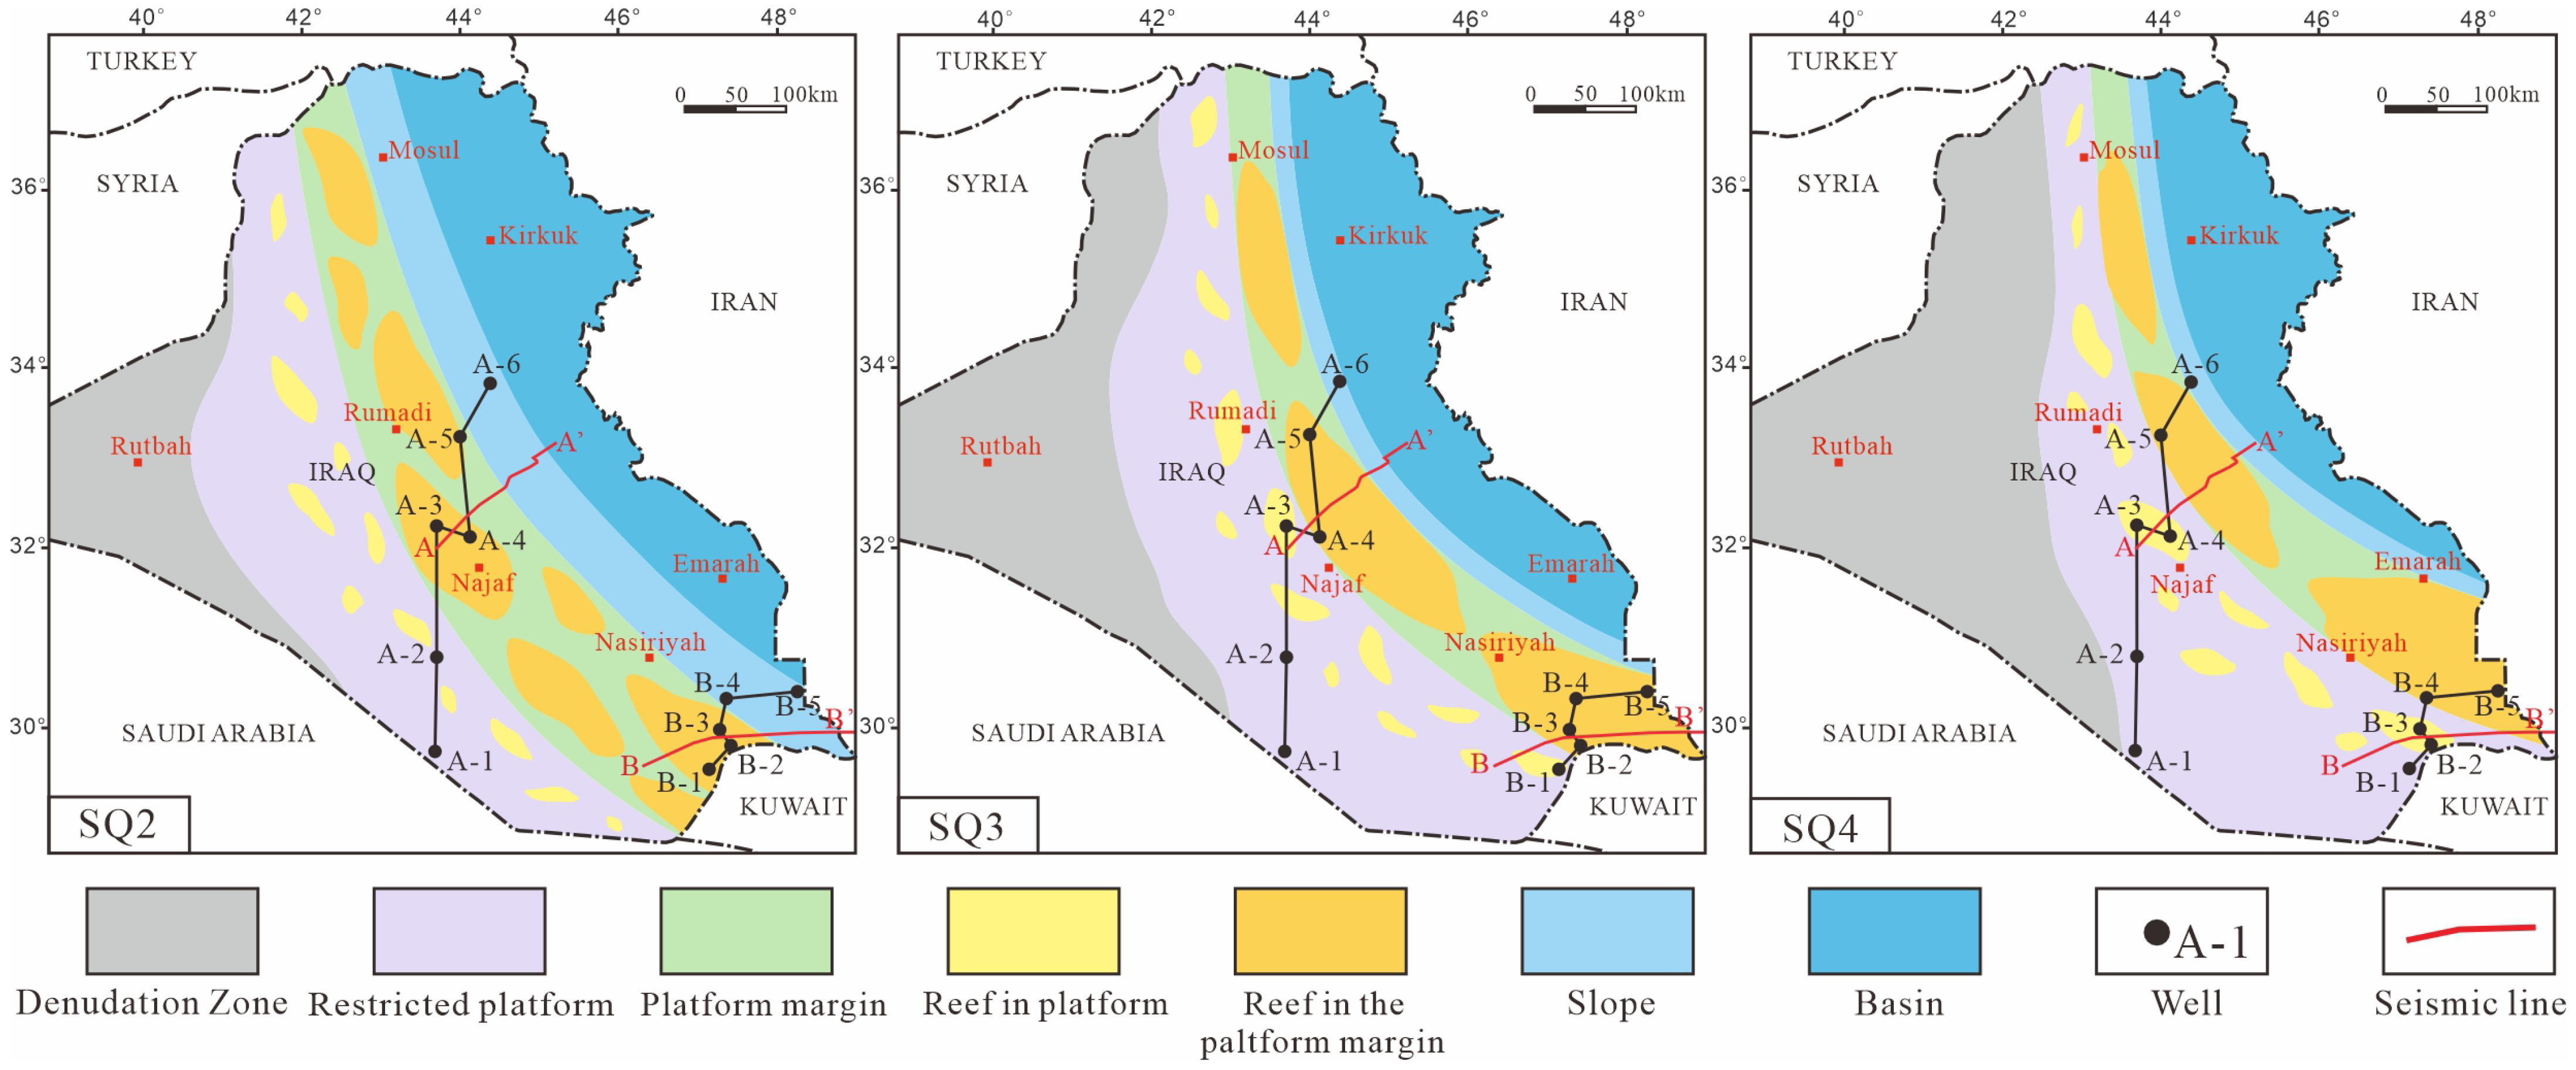
4.3. Distribution of Sedimentary Systems Within the Sequence Framework

Based on previous studies of sedimentary facies in Berriasian–Valanginian strata within the study area [10], this research integrates the seismic sequence framework and vertical evolutionary characteristics of reef–shoal complexes. Sequence division was performed on contemporaneous connected well profiles, followed by systematic analysis of sedimentary facies distribution patterns. The study shows that the SQ1 strata exhibit characteristics of slow transgression and rapid regression, with sedimentary facies primarily consisting of shelf facies. The strata of sequences SQ2 to SQ4 each display characteristics of rapid transgression followed by slow regression, with sedimentary facies including restricted platform, platform margin, slope, and basin. The reef facies show an evolutionary trend of gradually migrating towards the basin in the vertical direction (Figure 5 and Figure 6).
During the SQ1 period, in the southwest–northeast-oriented well-log profile A (well-log profile B SQ1 drilling encountered incomplete), the strata thickness shows a thin–thick–thin pattern. The lithology is mainly mudstone, with higher GR values on the well logs, indicating a shelf environment. During the SQ2 period, in well-log profile A, the strata thickness also exhibits a thin–thick–thin pattern. Based on lithological variations and well-log characteristics, the sequence is divided into a restricted platform facies, platform margin facies, and slope-basin facies in succession. In wells A-1 and A-2, the lithology is mainly wackestone, with relatively high SP values on the well logs. The strata are thin in this region, which is classified as a restricted platform facies. In the upper sections of wells A-3, A-4, and A-5, the lithology is mainly grainstone, with relatively lower GR or SP values, displaying boxy and bell-shaped curves, and the strata are thicker. This region is classified as a platform margin facies with abundant reef deposits. In the lower sections of wells A-4, A-5, and A-6, the lithology is mainly wackestone, with relatively higher GR and SP values, and the strata are thinner. This region is classified as a slope-basin facies. In another southwestern–northeastern-oriented well correlation profile B, SQ2 shows a thick–thin pattern. In wells B-1, B-2, and B-3 (some undrilled), the strata are significantly thicker. Based on lithology and well-log characteristics, this part is classified as a platform margin facies with abundant reef deposits. In wells B-4 and B-5, the strata are noticeably thinner. Based on lithology and well-log features, this region is classified as a slope-basin facies.
During the SQ3 period, the well correlation profile A exhibits a thin–thick–thin stratigraphic thickness variation, while profile B shows a thin–thick stratigraphic thickness variation. Based on lithological changes and well-log curve characteristics, wells A-1 and A-2 are classified as limited platform facies; A-3 and B-1 are classified as platform interior point reef areas; A-4, A-5, B-2, B-3, B-4, and B-5 are classified as platform margin facies; and A-6 is classified as slope-basin facies. Compared to the SQ2 period, during the SQ3 period, the platform margin facies in profile A migrated from wells A-3 and A-4 to the A-4 and A-5 region. In profile B, the platform margin facies migrated from wells B-1, B-2, and B-3 to the B-2, B-3, B-4, and B-5 region, showing an overall migration of high-energy zones towards the basin. The SQ4 period is generally similar to the SQ3 period. In wells A-1, A-2, A-3, A-4, and A-5, as well as the B-1, B-2, and B-3 regions, tidal flat-limited platform facies develop. In wells A-5, B-4, and B-4, platform margin facies develop, and in well A-6, slope-basin facies develop. Compared to the SQ3 period, during the SQ4 period, the high-energy zone similarly shows a migration towards the basin (Figure 6).

5. Discussion

5.1. Depositional Model

This study is based on the analysis of well logs and seismic facies, referencing the marginal platform model of Tucker [38] and the carbonate ramp model proposed by Irwin [42], Wilson [43]. Additionally, it incorporates previous studies of the Persian Gulf Basin [34,35,36,37]. The sedimentary environment of the Yamama Formation during the SQ2–SQ4 period has been analyzed in detail. This led to a clear definition of the sedimentary facies classification scheme. The strata during the SQ2–SQ4 period in the study area were deposited in a shallow marine carbonate platform environment. In the early stage (SQ2), a gently sloping platform developed, which evolved into a rimmed platform during the middle to late stages (SQ3–SQ4) (Figure 7). The depositional environments include four types: restricted platform, platform margin, slope, and basin. These facies exhibit an east-west differentiation and a north-south banded distribution pattern. Vertically, the reefs gradually migrated towards the basin, reflecting a continuous sea-level decline. Based on the previous analysis in this study, a sedimentary facies evolution profile for the SQ2–SQ4 period in the study area was systematically constructed (Figure 8).
The base interfaces of Sections 1–3 (corresponding to sequences SQ2–SQ4) were flattened and the angle, using the highest topographic point H and the distance L to the slope, was calculated (Table 1). Based on Tucker’s [41] definition of a rimmed platform, the platform margin type for sequences SQ2–SQ4 was determined. For the Section-1 interval deposited during the SQ2 period, the angles of survey lines A and B are 0.75° and 0.69°, respectively. The sedimentary model during this period is classified as a ramp-type carbonate platform. In this period, large-scale reefs developed over a wide area, including A-3, A-4, B-1, B-2, and B-3 wells (Figure 6), located at topographic high points (Figure 8). Gently sloping platforms are characterized by relatively flat topography without a distinct rimmed margin at the platform edge. Shallow-water shoals developed at the platform margin, providing some obstruction to water exchange. The platform interior mainly features tidal flat and lagoonal deposits, while point reefs developed in areas with relatively open water exchange (Figure 7a).
In the Section-2 interval developed during the SQ3 period, the angles of survey lines A and B are 1.23° and 1.21°, respectively, which correspond to the angle characteristics of a rimmed platform margin. At this time, the platform margin area has become relatively narrower compared to the SQ2 period. In the A-4, A-5, B-2, B-3, B-4, and B-5 wells and their extending areas, thick reef deposits developed (Figure 6), located at topographic high points in the profile. Compared to the SQ2 period, the reefs developed during the SQ3 period show a clear migration toward the basin, reflecting a sea-level fall trend (Figure 8). The characteristics of a rimmed platform include a prominent slope with a distinct break in angle between the platform margin and the basin. The platform margin is typically characterized by large bioherms, though reef distribution shows lateral discontinuity. Within the platform interior, locally open water circulation creates strong hydrodynamic conditions in certain areas, with grain shoals developed in well zones A-3 and B-1 (Figure 6). Diverse reef types occur, while lagoonal facies are preserved in adjacent low-energy restricted environments (Figure 7b).
In the Section-3 interval developed during the SQ4 period, the angles of survey lines A and B are 1.42° and 1.37°, respectively. These angles conform to the definition of a rimmed platform, indicating that this area belongs to the rimmed platform margin. It is noteworthy that, compared to the SQ3 period, the angles are steeper, and the slope break in the topography is more pronounced. At this time, thick reef deposits developed in the A-5, B-4, and B-5 well regions, located at topographic high points (Figure 6). In the A-3, A-4, B-1, and B-2 well regions, the platform interior developed a few isolated patch reefs. Compared to the SQ3 period, the reef deposits along the platform margin in the SQ4 period have clearly migrated further toward the basin, reflecting a continuous sea-level fall trend (Figure 8).

5.2. Controls on Sequence Development

In general, regional tectonic activities exert a pivotal influence on sedimentary processes [44,45]. This study employs seismic data and well-log interpretations to analyze the Berriasian–Valanginian sequence development in the study area through integrated sequence stratigraphy and sedimentary facies analysis, elucidating dual controls of global eustasy and regional tectonic activities on depositional processes. It should be emphasized that subjective factors in seismic facies interpretation (e.g., recognition of stratigraphic termination types) and ambiguous well-log responses (e.g., gamma-ray lows potentially reflecting dolomitization or calcareous shale) may compromise sequence boundary identification accuracy, requiring constraints from core calibration and multi-attribute inversion.
Sedimentary facies evolution in well A-4 reveals a sequential transition from shelf facies (SQ1) to platform facies (SQ2), platform-margin facies (SQ3), and restricted platform facies (SQ4), demonstrating an overall shallowing-upward trend with relative sea-level fall. This evolutionary pattern markedly diverges from global sea-level curves [46,47], highlighting tectonic overprinting on sequence architecture (Figure 9).
During the early Berriasian (SQ1), global sea-level rise facilitated extensive shelf facies deposition in the Sulaiy Formation [46,47], coeval with hydrocarbon source rock development in the Tugulu Formation of China’s Junggar Basin [48]. The study area was then situated in a passive continental margin setting, with sedimentation predominantly controlled by global transgression. The abrupt shift from slope-basin facies to platform facies during late Berriasian–early Valanginian (SQ2–SQ3) suggests two plausible mechanisms: (1) a transient global sea-level fall inducing hydrodynamic intensification and water shallowing; (2) regional differential subsidence driving basin-ward migration of carbonate platforms, creating distinct facies-transition boundaries.
A critical paradox occurs in SQ4 (late Valanginian), where restricted platform facies development contradicts the predicted transgression in global sea-level reconstructions [46,47], strongly implying tectonic uplift dominance. Notably, while southern Persian Gulf basins maintained open platform sedimentation during this interval [12], our study area likely evolved into a compression-induced restricted environment. The potential development of evaporites within these restricted facies may constitute effective regional seals. Future investigations should prioritize 3D characterization of evaporite distribution and numerical simulations of paleostress fields to unravel tectonic–sedimentary coupling mechanisms governing hydrocarbon seal formation.

6. Conclusions

In the northwestern part of the Persian Gulf Basin, an important stratigraphic sequence was deposited during the Late Berriasian to Valanginian. This study focuses on sequence construction, evolutionary patterns, and controlling factors, with the main conclusions as follows:
(1)
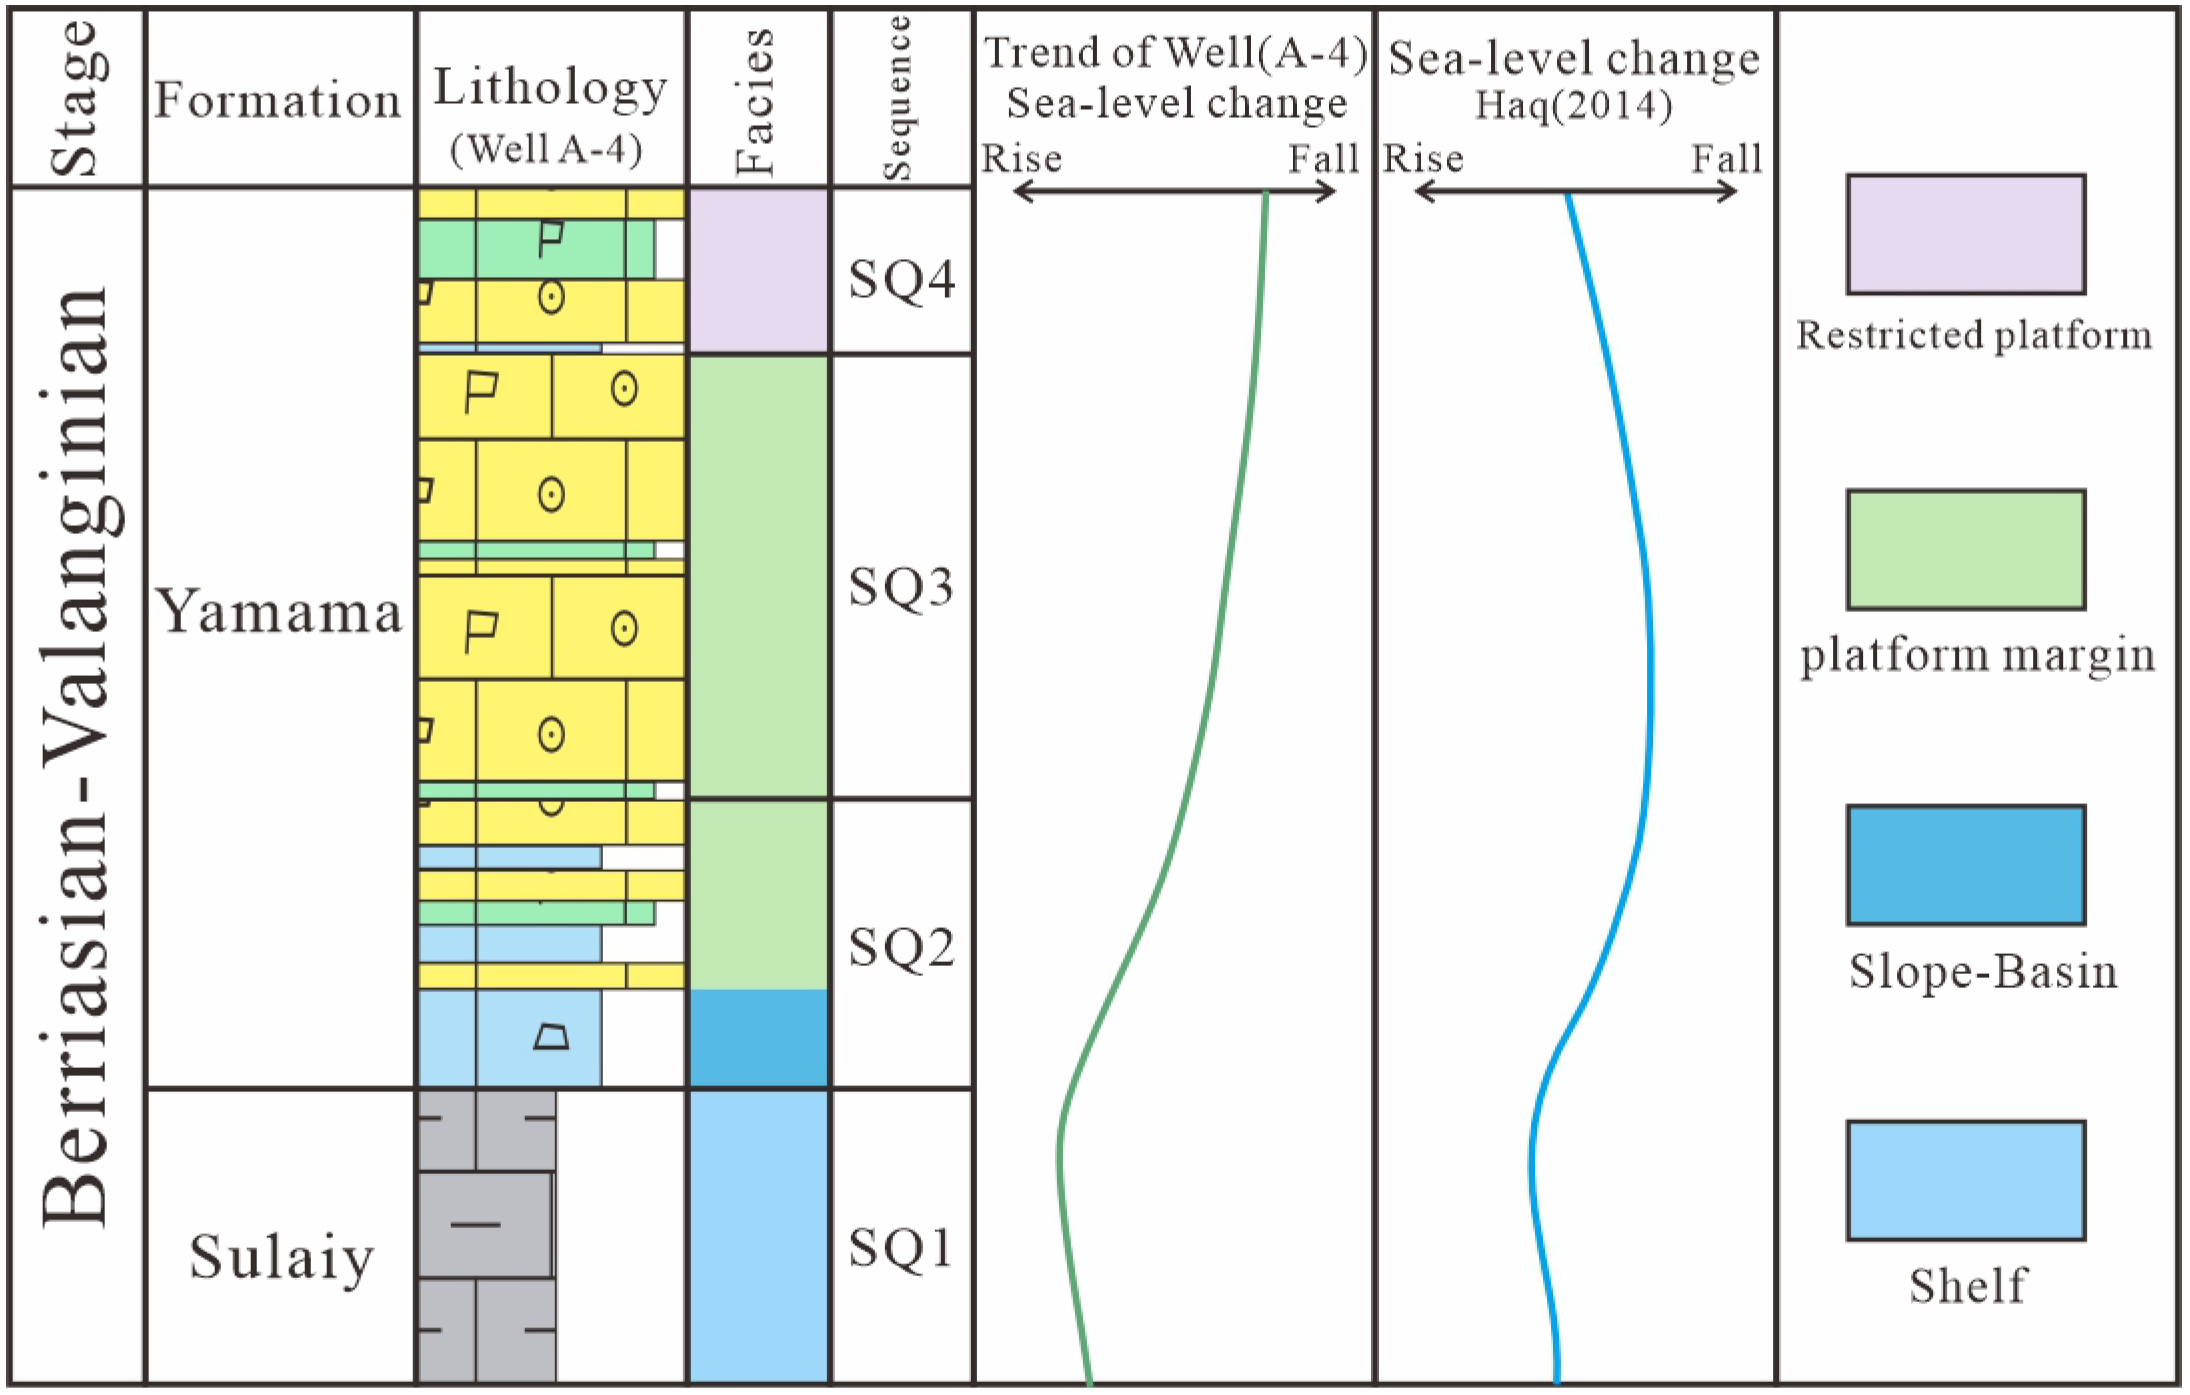
The Yamama Formation predominantly develops a carbonate platform facies, while the Sulaiy Formation predominantly develops a shelf facies. Seismic reflection termination relationships, such as downlap and truncation, were identified. Based on these relationships, five sequence boundaries (SB1, SB2, SB3, SB4, and SB5) were recognized on the seismic profiles. These boundaries correspond to one retrogradational sequence (SQ1) and three progradational sequences (SQ2, SQ3, and SQ4), with the SQ2–SQ4 strata displaying distinct progradational features.
(2)
Each sequence from SQ2 to SQ4 develops in a basin-slope-platform margin-restricted platform configuration, with large reefs developed in each sequence. Vertically, the facies prograde to the northeast. During the SQ2 period, the platform margin dip angle (<1°) indicates a ramp-type platform margin. In the SQ3 and SQ4 sequences, the platform margin dip angle is larger (1.2–1.5°), indicating a rimmed platform margin.
(3)
SQ1 is controlled by the Early Cretaceous global transgression, representing a sequence controlled by global sea-level changes. SQ2–SQ4 are controlled by the combined effects of tectonic activity and sea-level fluctuations, representing a tectonically influenced/global sea-level fluctuation sequence.

Author Contributions

Writing—original draft, Methodology, Software, Validation, Y.W.; Investigation, Writing—review and editing, Q.C.; Data curation, Formal analysis, Methodology, X.C.; Formal analysis, W.H.; Methodology, R.H.; Formal analysis, G.G. All authors have read and agreed to the published version of the manuscript.

Funding

National Natural Science Foundation of China (41472098).

Institutional Review Board Statement

Not applicable.

Informed Consent Statement

Not applicable.

Data Availability Statement

All data and materials are available on request from the corresponding author. The data are not publicly available due to ongoing research using a part of the data.

Conflicts of Interest

The authors declare no conflicts of interest.

References

  1. Weilin, Z.; Guoping, B.; Jinsong, L. Oil and Gas Basins in the Middle East; Science Press: Beijing, China, 2014. [Google Scholar]
  2. Sharland, P.R.; Archer, R.; Casey, D.M.; Davies, R.B.; Simmons, M.D. Arabian Plate Sequence Stratigraphy. In GeoArabia; Gulf Petrolink: Tulsa, OK, USA, 2001. [Google Scholar]
  3. Naxin, T.; Jinyin, Y.; Chongzhi, T.; Fanjun, K. Petroleum geology and resources assessment of major basins in Middle East and Central Asia. Oil Gas Geol. 2017, 38, 10. [Google Scholar]
  4. Al-Iessa, I.A.; Zhang, W.Z. Facies evaluation and sedimentary environments of the Yamama Formation in the Ratawi oil field, South Iraq. Sci. Rep. 2023, 13, 5305. [Google Scholar] [CrossRef] [PubMed]
  5. Arkell, W.J.; Bramkamp, R.; Steineke, M. Jurassic ammonites from Jebel Tuwaiq, central Arabia with stratigraphical introduction. Philos. Trans. R. Soc. Lond. Ser. B Biol. Sci. 1952, 236, 241–314. [Google Scholar]
  6. Setudehnia, A. The mesozoic sequence in south-west Iran and adjacent areas. J. Pet. Geol. 2010, 1, 3–42. [Google Scholar]
  7. Motiei, H. Stratigraphy of Zagros. Treatise Geol. Iran 1993, 60, 237–245. [Google Scholar]
  8. Lasemi, Y.; Kondroud, K.N. Sequence stratigraphic control on prolific HC reservoir development, Southwest Iran. Oil Gas J. 2008, 106, 34–38. [Google Scholar]
  9. Bahrehvar, M.; Mehrabi, H.; Akbarzadeh, S.; Rahimpour-Bonab, H. Depositional and diagenetic controls on reservoir quality of the uppermost Jurassic–Lower Cretaceous sequences in the Persian Gulf; A focus on J–K boundary. J. Pet. Sci. Eng. 2021, 201, 108512. [Google Scholar] [CrossRef]
  10. Abd, O.K.; Abd, N. Seismic Sequence Stratigraphic Model and Hydrocarbon Potential of Yamama Formation in Al-Fao Area, Southeastern Iraq. Iraqi Geol. J. 2024, 57, 56–69. [Google Scholar]
  11. Khalil, R.; Jan, J.A. Facies analysis, depositional environment and diagenetic processes of the Lower Cretaceous Yamama Formation, Riyadh, Saudi Arabia. Carbonates Evaporites 2024, 39, 1–18. [Google Scholar]
  12. Mohsin, S.A.; Mohammed, A.H.; Alnajm, F.M. Facies Architecture and Depositional Marine Systems of the Yamama Formation in Selected Wells, Southern Iraq. Iraqi J. Sci. 2023, 64, 730–749. [Google Scholar]
  13. Rostamtabar, M.; Khanehbad, M.; Gharaie, M.H.M.; Mahboubi, A.; Hajian-Barzi, M. Facies analysis and sequence stratigraphy of the Lower Cretaceous strata (Fahliyan Formation) in Izeh Zone, Zagros Basin, SW Iran. Carbonates Evaporites 2022, 37, 1–19. [Google Scholar]
  14. Changqian, Z.; Qingchun, Z.; Haigang, D.; Fanqin, Z.; Xueling, W.; Xiaozhou, W. Characteristic and Favorable Area Prediction of Jurassic Plays in Iraq. Xinjiang Pet. Geol. 2013, 34, 116–120. [Google Scholar]
  15. Haiying, H.; Rui, G.; Jun, W.; Guosheng, Q.; Xiaowei, S.; Yichang, Y.; Haiyang, S.; Yang, G. Sequence stratigraphic framework and sedimentary evolution of the Cretaceous in southern Iraq. Earth Sci. Front. 2023, 30, 122–138. [Google Scholar]
  16. Guo-ping, B. A preliminary study of main control factors on oil and gas distribution in Persian Gulf Basin. J. China Univ. Pet. 2007, 31, 28–32, 38. [Google Scholar]
  17. HuCheng, D.; Wen, Z.; Rui, G.; MeiYan, F.; RunCheng, X.; WenLing, C.; XianFeng, P.; Rui, X. Pore structure characteristics and control factors of carbonate reservoirs: The Middle-Lower Cretaceous formation, AI Hardy cloth Oilfield, Iraq. Acta Petrol. Sin. 2014, 30, 801–812. [Google Scholar]
  18. Mehrabi, H.; Rahimpour-Bonab, H.; Al-Aasm, I.; Hajikazemi, E.; Esrafili-Dizaji, B.; Dalvand, M.; Omidvar, M. Palaeo-exposure surfaces in the Aptian Dariyan Formation, offshore SW Iran: Geochemistry and reservoir implications. J. Pet. Geol. 2018, 41, 467–494. [Google Scholar]
  19. Al-Fares, A.; Bouman, M.; Jeans, P. A New Look at the Middle to Lower Cretaceous Stratigraphy, Offshore Kuwait. GeoArabia 1998, 3, 543–560. [Google Scholar]
  20. Changqian, Z.; Qingchun, Z.; Peiguang, Y.; Haigang, D. Main controlling factors of hydrocarbon accumulation in Mesopotamia Basin. Pet. Geol. Exp. 2013, 35, 296–301. [Google Scholar]
  21. Yang, W.; Fengfeng, L.; Lixin, R.; Rui, G.; Ning, X.; Poppelreiter, M.; Gomes, J.C.; Lei, L. Carbonate rock characteristics and favorable reservoir origin in a slightly restricted depositional setting: A case study of Lower Cretaceous Yamama Formation in Oilfield A, Central Arabian Basin. Pet. Explor. Dev. 2024, 51, 1–15. [Google Scholar] [CrossRef]
  22. Huan, W.; Bo, L.; Kaibo, S.; Hangyu, L.; Bo, H. Characteristics of tectonic-sedimentary evolution from Jurassic to Cretaceous in Iraq-Iran area. Lithol. Reserv. 2021, 33, 15. [Google Scholar]
  23. Buday, T. The Regional Geology of Iraq; Publications of Geological Survey of Iraq: Baghdad, Iraq, 1980. [Google Scholar]
  24. Jassim, S.Z.; Goff, J.C. Geology of Iraq; Geological Society of London: London, UK, 2006. [Google Scholar]
  25. Al-Ameri, T.; Al-Musawi, F.; Batten, D. Palynofacies indications of depositional environments and source potential for hydrocarbons: Uppermost Jurassic-basal Cretaceous Sulaiy Formation, southern Iraq. Cretac. Res. 1999, 20, 359–363. [Google Scholar]
  26. Abdullah, F.; Connan, J. Geochemical study of some Cretaceous rocks from Kuwait: Comparison with oils from Cretaceous and Jurassic reservoirs. Org. Geochem. 2002, 33, 125–148. [Google Scholar]
  27. Mahdi, T.A. Stratigraphic Reservoir Characterization of Ratawi Formation in Southern Iraq. Iraqi Geol. J. 2024, 57, 65–77. [Google Scholar]
  28. Hakam, I.; Toomey, N.; Ghose, S.; Ponthier, J.; Zimmerman, J. Stratigraphic trap potential in the Lower Cretaceous Ratawi interval, Partitioned Zone PZ, Saudi Arabia and Kuwait. In Proceedings of the SPE Middle East Oil and Gas Show and Conference, Sanabis, Bahrain, 28 November–1 December 2021. [Google Scholar]
  29. Sadooni, F.N. Stratigraphic sequence, microfacies, and petroleum prospects of the Yamama Formation, Lower Cretaceous, southern Iraq. AAPG Bull. 1993, 77, 1971–1988. [Google Scholar]
  30. Beiwei, L.; Qingchun, Z.; Haigang, D.; Mingsheng, L.; Congsheng, B.; Ningning, Z.; Peiguang, Y.; Nai, W. Sedimentary response of Cretaceous tectonic evolution in the Middle East Rub Al Khali Basin and its inspirations for oil exploration. China Pet. Explor. 2020, 25, 115–124. [Google Scholar]
  31. Xiaobin, L.; Zhixin, W.; Zhaoming, W.; Zhengjun, H.; Chenpeng, S. Structural characteristics and main controlling factors on petroleum accumulation in Zagros Basin, Middle East. Nat. Gas Geosci. 2018, 29, 973–981. [Google Scholar]
  32. Bolin, Z. The Control of Arabian Plate Evolution on Oil and Gas Enrichment. Master’s Thesis, China University of Petroleum, Beijing, China, 2020. [Google Scholar]
  33. Aqrawi, A.A.M.; Goff, J.C.; Horbury, A.A.; Sadooni, F. The Petroleum Geology of Iraq; Scientific Press: Christchurch, New Zealand, 2010. [Google Scholar]
  34. Aliwi, H. Yamama Reservoir Characterization in the West Qurna Oil Field, Southern Iraq. Iraqi J. Sci. 2016, 57, 938–947. [Google Scholar]
  35. Mafraji, T.G.Z.A.; Al-Zaidy, A.A.H. Microfacies Architecture and Stratigraphic Development of the Yamama Formation, Southern Iraq. Iraqi J. Sci. 2019, 60, 1115–1128. [Google Scholar]
  36. Saleh, A.H. Microfacies and environmental study of the lower cretaceous yamama formation in Ratawi field. Arab. J. Geosci. 2014, 7, 3175–3190. [Google Scholar]
  37. Adabi, M.H.; Salehi, M.A.; Ghabeishavi, A. Depositional environment, sequence stratigraphy and geochemistry of Lower Cretaceous carbonates (Fahliyan Formation), south-west Iran. J. Asian Earth Sci. 2010, 39, 148–160. [Google Scholar]
  38. Tucker, M.E.; Wright, V.P. Carbonate Sedimentology; John Wiley & Sons: Hoboken, NJ, USA, 2009. [Google Scholar]
  39. Al-Ameri, T.K.; Al-Musawi, F.A.a. Hydrocarbon generation potential of the uppermost Jurassic—Basal Cretaceous Sulaiy formation, South Iraq. Arab. J. Geosci. 2011, 4, 53–58. [Google Scholar]
  40. Wolpert, P.; Bartenbach, M.; Suess, P.; Rausch, R.; Aigner, T.; Le Nindre, Y.M. Facies analysis and sequence stratigraphy of the uppermost Jurassic–Lower Cretaceous Sulaiy Formation in outcrops of central Saudi Arabia. GeoArabia 2015, 20, 67–122. [Google Scholar]
  41. Vail, P. Seismic stratigraphy and the evaluation of depositional sequences and facies. Geophys. J. R. Astron. Society 1983, 73, 278. [Google Scholar]
  42. Irwin, M. General theory of epeiric clear water sedimentation. AAPG Bull. 1965, 49, 445–459. [Google Scholar]
  43. Wilson, J.L. Carbonate Facies in Geologic History; Springer Science & Business Media: Berlin/Heidelberg, Germany, 2012. [Google Scholar]
  44. Liu, E.; Wang, H.; Pan, S.; Qin, C.; Jiang, P.; Chen, S.; Yan, D.; Lü, X.; Jing, Z. Architecture and depositional processes of sublacustrine fan systems in structurally active settings: An example from Weixinan Depression, northern South China Sea. Mar. Pet. Geol. 2021, 134, 105380. [Google Scholar]
  45. Liu, E.; Wang, H.; Feng, Y.; Pan, S.; Jing, Z.; Ma, Q.; Gan, H.; Zhao, J.-x. Sedimentary architecture and provenance analysis of a sublacustrine fan system in a half-graben rift depression of the South China Sea. Sediment. Geol. 2020, 409, 105781. [Google Scholar]
  46. Haq, B.U. Cretaceous eustasy revisited. Glob. Planet. Change 2014, 113, 44–58. [Google Scholar]
  47. Gale, A.S.; Mutterlose, J.; Batenburg, S.; Gradstein, F.M.; Agterberg, F.P.; Ogg, J.G.; Petrizzo, M.R. The Cretaceous Period. In Geologic Time Scale 2020; Elsevier: Amsterdam, The Netherlands, 2020; Volume 2, pp. 1023–1086. [Google Scholar]
  48. Zhichao, P.; Dongsheng, J.; Min, L.; Lei, S.; Jing, L.; Ziyang, G.; Lingyun, W.; Jun, W.; Yucai, D. Jurassic-Cretaceous oil-gas accumulation conditions and exploration potential in the thrust belt at the southern margin of Junggar Basin. Acta Pet. Sinica. Acta Pet. Sin. 2023, 44, 1258–1273. [Google Scholar]
Figure 4. Low-frequency sequence division and facies belt variation characteristics of the Berriasian–Valanginian strata (profile location shown in Figure 1). (a) Seismic facies profile, (b) Sedimentary facies profile.
Minerals 15 00363 g004
Figure 5. Well Correlation Sedimentary Facies Comparison Profile under Sequence Stratigraphic Framework of the Yamama Formation in the Study Area.
Minerals 15 00363 g005
Figure 6. Planar Evolution Diagram of Sedimentary Facies during SQ2 to SQ4 Period in the Study Area.
Minerals 15 00363 g006
Figure 7. Depositional models of the Yamama Formation in different periods. (a) Gently sloping platform, (b) Rimmed platform.
Minerals 15 00363 g007
Figure 8. Depositional facies profile evolution of the Yamama Formation during the SQ2–SQ4 periods.
Minerals 15 00363 g008
Figure 9. Sequence evolution of the Yamama Formation under the combined control of sea level and tectonic activity (modified from references [46,47]).
Minerals 15 00363 g009
Table 1. Platform margin stratigraphic angle.
LineSectionL (m)H (m)Specific ValueAngle
A-A′Section-116,0002100.0131250.75
Section-211,2002400.0214291.23
Section-310,5002600.0247621.42
B-B′Section-114,0001700.0121430.69
Section-295002000.0210531.21
Section-392002200.0239131.37
Disclaimer/Publisher’s Note: The statements, opinions and data contained in all publications are solely those of the individual author(s) and contributor(s) and not of MDPI and/or the editor(s). MDPI and/or the editor(s) disclaim responsibility for any injury to people or property resulting from any ideas, methods, instructions or products referred to in the content.

