Article

Thermodynamic Stability of Clay Minerals in Boreal Forest Soil and Its Relationship to the Properties of Soil Organic Matter

by
Igor V. Danilin
1,
Yulia G. Izosimova
2,
Ruslan A. Aimaletdinov
2 and
Inna I. Tolpeshta
2,*
1
V.V. Dokuchaev Soil Science Institute, 119017 Moscow, Russia
2
Soil Science Faculty, Lomonosov Moscow State University, 119991 Moscow, Russia
*
Author to whom correspondence should be addressed.
Minerals 2025, 15(4), 430; https://doi.org/10.3390/min15040430
Submission received: 28 January 2025 / Revised: 14 April 2025 / Accepted: 18 April 2025 / Published: 20 April 2025
(This article belongs to the Section Environmental Mineralogy and Biogeochemistry)

Abstract

:
This paper assesses the thermodynamic stability of clay minerals in the upper organo-mineral horizon of podzolic soil, as well as in the rhizosphere of Norway spruce (Picea abies (L.) H. Karst.) and Norway maple (Acer platanoides L.). Moreover, it determines the impact of soil organic matter on the thermodynamic stability of clay minerals. Calculations of ΔGf and the saturation index (SI) for clay minerals in laboratory experiments simulating soil conditions without soil moisture outflow allowed us to find out that the thermodynamic stability of clay minerals decreased in the series kaolinite > illite > vermiculite > chlorite. In the rhizosphere of spruce, kaolinite, vermiculite and illite have the lowest, and in the soil under maple-the highest thermodynamic stability, which is associated with differences in the properties of soil organic matter of rhizospheres of different tree species. Laboratory experiments on the sorption of soil humic acid (HA) on clay minerals demonstrated that sorbed HA decreased the thermodynamic stability of biotite and increased the thermodynamic stability of kaolinite and muscovite. Thermodynamic stability of clay minerals decreased with increased proportion of sorbed thermolabile organic matter.

1. Introduction

The approach to assessing the stability of clay minerals in rocks and soils using the principles of equilibrium thermodynamics became widespread in the second half of the 20th century [1,2,3] and is still used today [4,5,6]. The relevance of this approach for soil science is determined by the fact that the main source of K+, Ca2+, and Mg2+, especially in low-fertility soils of forest ecosystems, is clay minerals [7,8,9]. In acidic forest soils, the availability of nutrients is a factor that inhibits plant growth [10,11,12]. Weathering of minerals in the soil is considered the main factor in the sustainable development of forests [13]. Knowledge of how individual plant species and their communities affect mineral weathering is crucial to predict ecosystem productivity in the long term and develop ecosystem development strategies [14].
It is well-known that the processes of mineral weathering occur with greater intensity in the rhizosphere than in the bulk soil. This is due to the fact that the rhizosphere continuously receives the main agents of mineral dissolution and transformation, i.e., root exudates and metabolites of microorganisms, which contain protons and anions of organic acids with high complexing capacity [15,16,17,18]. This statement is confirmed by numerous experimental studies on different soils. Nevertheless, a number of studies that assess the thermodynamic stability of individual minerals in relation to the solution composition in the rhizosphere of various plant species and in the bulk soil are very limited [7,19]. The study of rhizosphere processes, including mineral weathering, allows us to expand and clarify our understanding of carbon biogeochemistry, the availability of various nutrients, and the toxicity of some pollutants.
The most sensitive indicator of the rhizosphere chemical state is soil organic matter due to the release of exudates, accumulation, and transformation of the necromass of plants and microorganisms. Information on the influence of soil organic matter on the thermodynamic stability of clay minerals is few [20,21], and the result of such influence is still poorly understood.
The aim of this work is to assess the thermodynamic stability of kaolinite, illite, vermiculite, and hydroxy-interlayered vermiculite in the rhizosphere of Norway spruce (Picea abies (L.) H. Karst.) and Norway maple (Acer platanoides L.), as well as in the corresponding bulk podzolic soil. In addition, this paper will study the impact of soil organic matter on their thermodynamic stability.

2. Materials and Methods

The objects of this study are 100–200 g samples of the rhizosphere of Picea abies, Acer platanoides, and bulk soil, taken from the organo-mineral horizon AE (3–10 sm) of Retisol [22] on the territory of the Central Forest State Natural Biosphere Reserve (the Tver region, Russian Federation). The sampling was carried out in a 5-fold repetition. The AE horizon is the most acidic of the mineral horizons of the studied soils. In different years, the pН of water suspension (1:2.5) in this horizon varies from 4.39 to 4.58 [23,24]. The soil solid phase and the soil solution in this horizon are characterized by the highest concentrations of organic matter (Corg) in comparison with other mineral horizons of the podzolic soil and vary by years and seasons of observation in the range from 2.6 to 6.4% and from 22 to 34 mg/L, respectively [25,26].
The parent material is represented by two-layered deposits: mantle loam that is 35–45 cm thick is underlain by loamy moraine [24]. The climate of the territory is temperate continental with a mean annual temperature of +4 °C, and a mean annual precipitation of 731 mm [27].
The clay fraction of the soil was isolated by sedimentation without preliminary chemical treatment to minimize the impact on the crystal lattices of the clay minerals. The suspensions were coagulated with a 1 M CaCl2 solution and washed to remove excess chloride ions by dialysis against distilled water. The mineral composition of the clay fraction of the samples was determined by X-ray diffractometry using a MiniFlex 600 diffractometer (Rigaku, Tokyo, Japan) in the following mode: CuKα radiation, voltage and current in the X-ray tube 30 kV and 15 mA, detector—D/teX. The analysis was carried out for oriented samples of clay fractions in the air-dry state, saturated with ethylene glycol, and calcined at temperatures of 350 °C and 550 °C. To assess the chemical composition of the mineral phases, X-ray diffractometry was carried out for non-oriented samples.
The total content of Al, Si, Na, K, Ca, Mg, Fe, Mn, and Ti in the clay fractions was measured by X-ray fluorescence analysis (S2 Picofox, Bruker, San Jose, CA, USA). The content of Al, Si, Fe, and Mn of non-silicate soil minerals was estimated by the ICP-OES analysis of dithionite-citrate-bicarbonate extract (spectrometer Agilent 5110 ICP-OES, Santa Clara, CA, USA).
The equilibrium soil liquid phase was obtained after incubating the dried and sifted soil through a 1 mm sieve in laboratory beakers at 10 °C and 70% (mass) humidity for 72 h with periodic stirring. This sample preparation protocol was necessary to ensure the reproducibility of the results. The optimal duration of water–soil interaction in order to obtain an equilibrium liquid phase was estimated in a preliminary experiment. In a series of soil incubations with water at 70% (mass) humidity, the concentration of metal cations, pH, and total organic carbon were measured. The optimal incubation duration was considered to be the period at which the concentration of cations ceased to change significantly (see Table A1 in Appendix A). At the same time, a long incubation period can lead to the development of undesirable secondary processes [28,29].
The liquid phase was isolated by centrifugation in test tubes with a perforated bottom equipped with a liquid phase collector designed in our laboratory. Centrifugation was performed at 16,639× g (Eppendorf 5804 centrifuge, FA-45-6-30 rotor, Hamburg, Germany) for 15 min.
In the obtained liquid phase, pH and specific electric conductivity (EC) were measured with an ion meter from Mettler Toledo SevenGo pro, Switzerland. EC values were used to calculate ion activity. Also, the concentrations of Al, Si, Na, K, Ca, Mg, Fe, Mn, Ti (spectrometer Agilent 5110 ICP-OES, Santa Clara, CA, USA), chloride, sulfate, nitrate ions (capillary electrophoresis system Kapel-105M, Lumex, St. Petersburg, Russia), C, and N (analyzer TOC-L CPH, Shimadzu, Kyoto, Japan). The activity of ions in the liquid phase was calculated in the program Visual MINTEQ using the NICA-Donnan model (https://vminteq.com).
The thermodynamic stability of minerals was assessed by calculating the saturation index (SI). For each mineral, the reaction constant K of congruent dissolution in an acidic medium was calculated based on an assessment of the thermodynamic characteristics of the minerals. Experimentally obtained values of ion activity in solution were substituted into the expression for K, which is called the reaction quotient (Q). The saturation index is as follows:
SI = logQ − logK
where K is the reaction constant for the congruent dissolution of the mineral, and Q is the reaction quotient.
Negative values indicate that the solution is unsaturated in relation to the mineral.
Diffuse reflectance infrared Fourier-transform spectroscopy (DRIFTS) was carried out for clay samples using an FT-801 device with a PRIZ adapter (Simex, Novosibirsk, Russia) in the range of 550–4000 cm−1. Before the analysis, the soil samples were additionally heated to 105 °C for 15 min to remove adsorbed moisture. All spectra were recorded at a resolution of 2 cm−1; each spectrum of the sample was obtained by averaging 36 scans. The obtained spectra were smoothed by the moving average method (window size—15) and subjected to multiplicative scatter correction and baseline correction. Peak identification was performed using the second derivatives of the spectra.
Thermal analysis was performed for clay samples on a TGA/DSC 3+ analyzer (Mettler Toledo, Greifensee, Switzerland) in a synthetic air atmosphere (80% N2, 20% O2) at a heating rate of 10 °C/min. Before analysis, the samples were stored for several days in a desiccator over a saturated calcium nitrate solution to maintain a constant relative humidity of 55%. All measurements were made in duplicate. The experimental curves were processed using STARe Evaluation Software (v. 16.40). The Fityk program (v. 1.3.1) was used to calculate the area of the exothermic peaks; the baseline was drawn using a spline function with extreme points in the ranges of 150–200 °C and 550–800 °C [30].
Samples of kaolinite (Prosyanovsk deposit (Ukraine)), muscovite (produced by JSC “GEOKOM”), and biotite (Cherry Mountains, Urals, Russian Federation) were used for sorption experiments to assess the impact of sorbed humic acid on the thermodynamic stability of these typical for soils clay minerals. Humic acid isolated by the IHSS method (https://humic-substances.org) from the organogenic horizon of peaty-podzolic-gleyic soil (PPG), collected near the sampling site of the aforementioned podzolic soil, was used as a sorbate. Kaolinite, muscovite, and biotite were preliminarily treated with 10% HCl to remove calcium and magnesium carbonates. After that, the clay fraction was isolated by sedimentation (precipitant—1 M CaCl2 solution). The resulting clay fraction was washed of excess chloride ions by dialysis against distilled water, dried, and ground in an agate mortar. A solution of HA (100 mg/l) at pH = 4.5 (5 mM acetate buffer) was added to the weighed portions of the minerals prepared as described above in a mineral–solution ratio of 1:1000 (0.1 g per 100 mL). The resulting suspension was agitated on a shaker at 150 rpm for 5 h at room temperature. The supernatant was separated from the sediment by centrifugation at 489× g for 15 min. The resulting sediment was quantitatively transferred to evaporation dishes and dried at 40 °C. The resulting material was ground in an agate mortar, and the above was repeated twice. Distilled water was added to the sediment obtained after three sorption cycles in a 1:1000 ratio. The suspension was then shaken on a shaker for 5 h at 150 rpm at room temperature. It was subsequently centrifuged again and dried in a drying oven at 40 °C.
The incubation experiment with minerals, without, and after treatment with an HA solution was carried out for 150 days at a temperature of 25 °C and periodic stirring. A sterile model soil solution based on bidistilled water (pH = 3.5, acidification with chemically pure hydrochloric acid, with the addition of NaN3 to a concentration of 0.05% by weight) in hermetically sealed polypropylene tubes was added (ratio of 1 g per 100 mL) to the mineral samples. After the specified incubation time, the suspensions were centrifuged at 16,639× g (Eppendorf 5804 centrifuge, FA-45-6-30 rotor) for 15 min and filtered through a cellulose acetate membrane filter with a pore diameter of 0.45 μm. The analysis of the liquid phase composition was carried out by the ICP-OES (Agilent 5110 ICP-OES spectrometer).
Statistical processing and visualization of data were performed using the R programming language. The Spearman test was used for correlation analysis. The Wilcoxon test was used for the comparison of means. The significance level in all statistical analyses was set to 5%. In the text, all mentioned differences in means and correlation coefficients are significant, unless otherwise stated.

3. Results

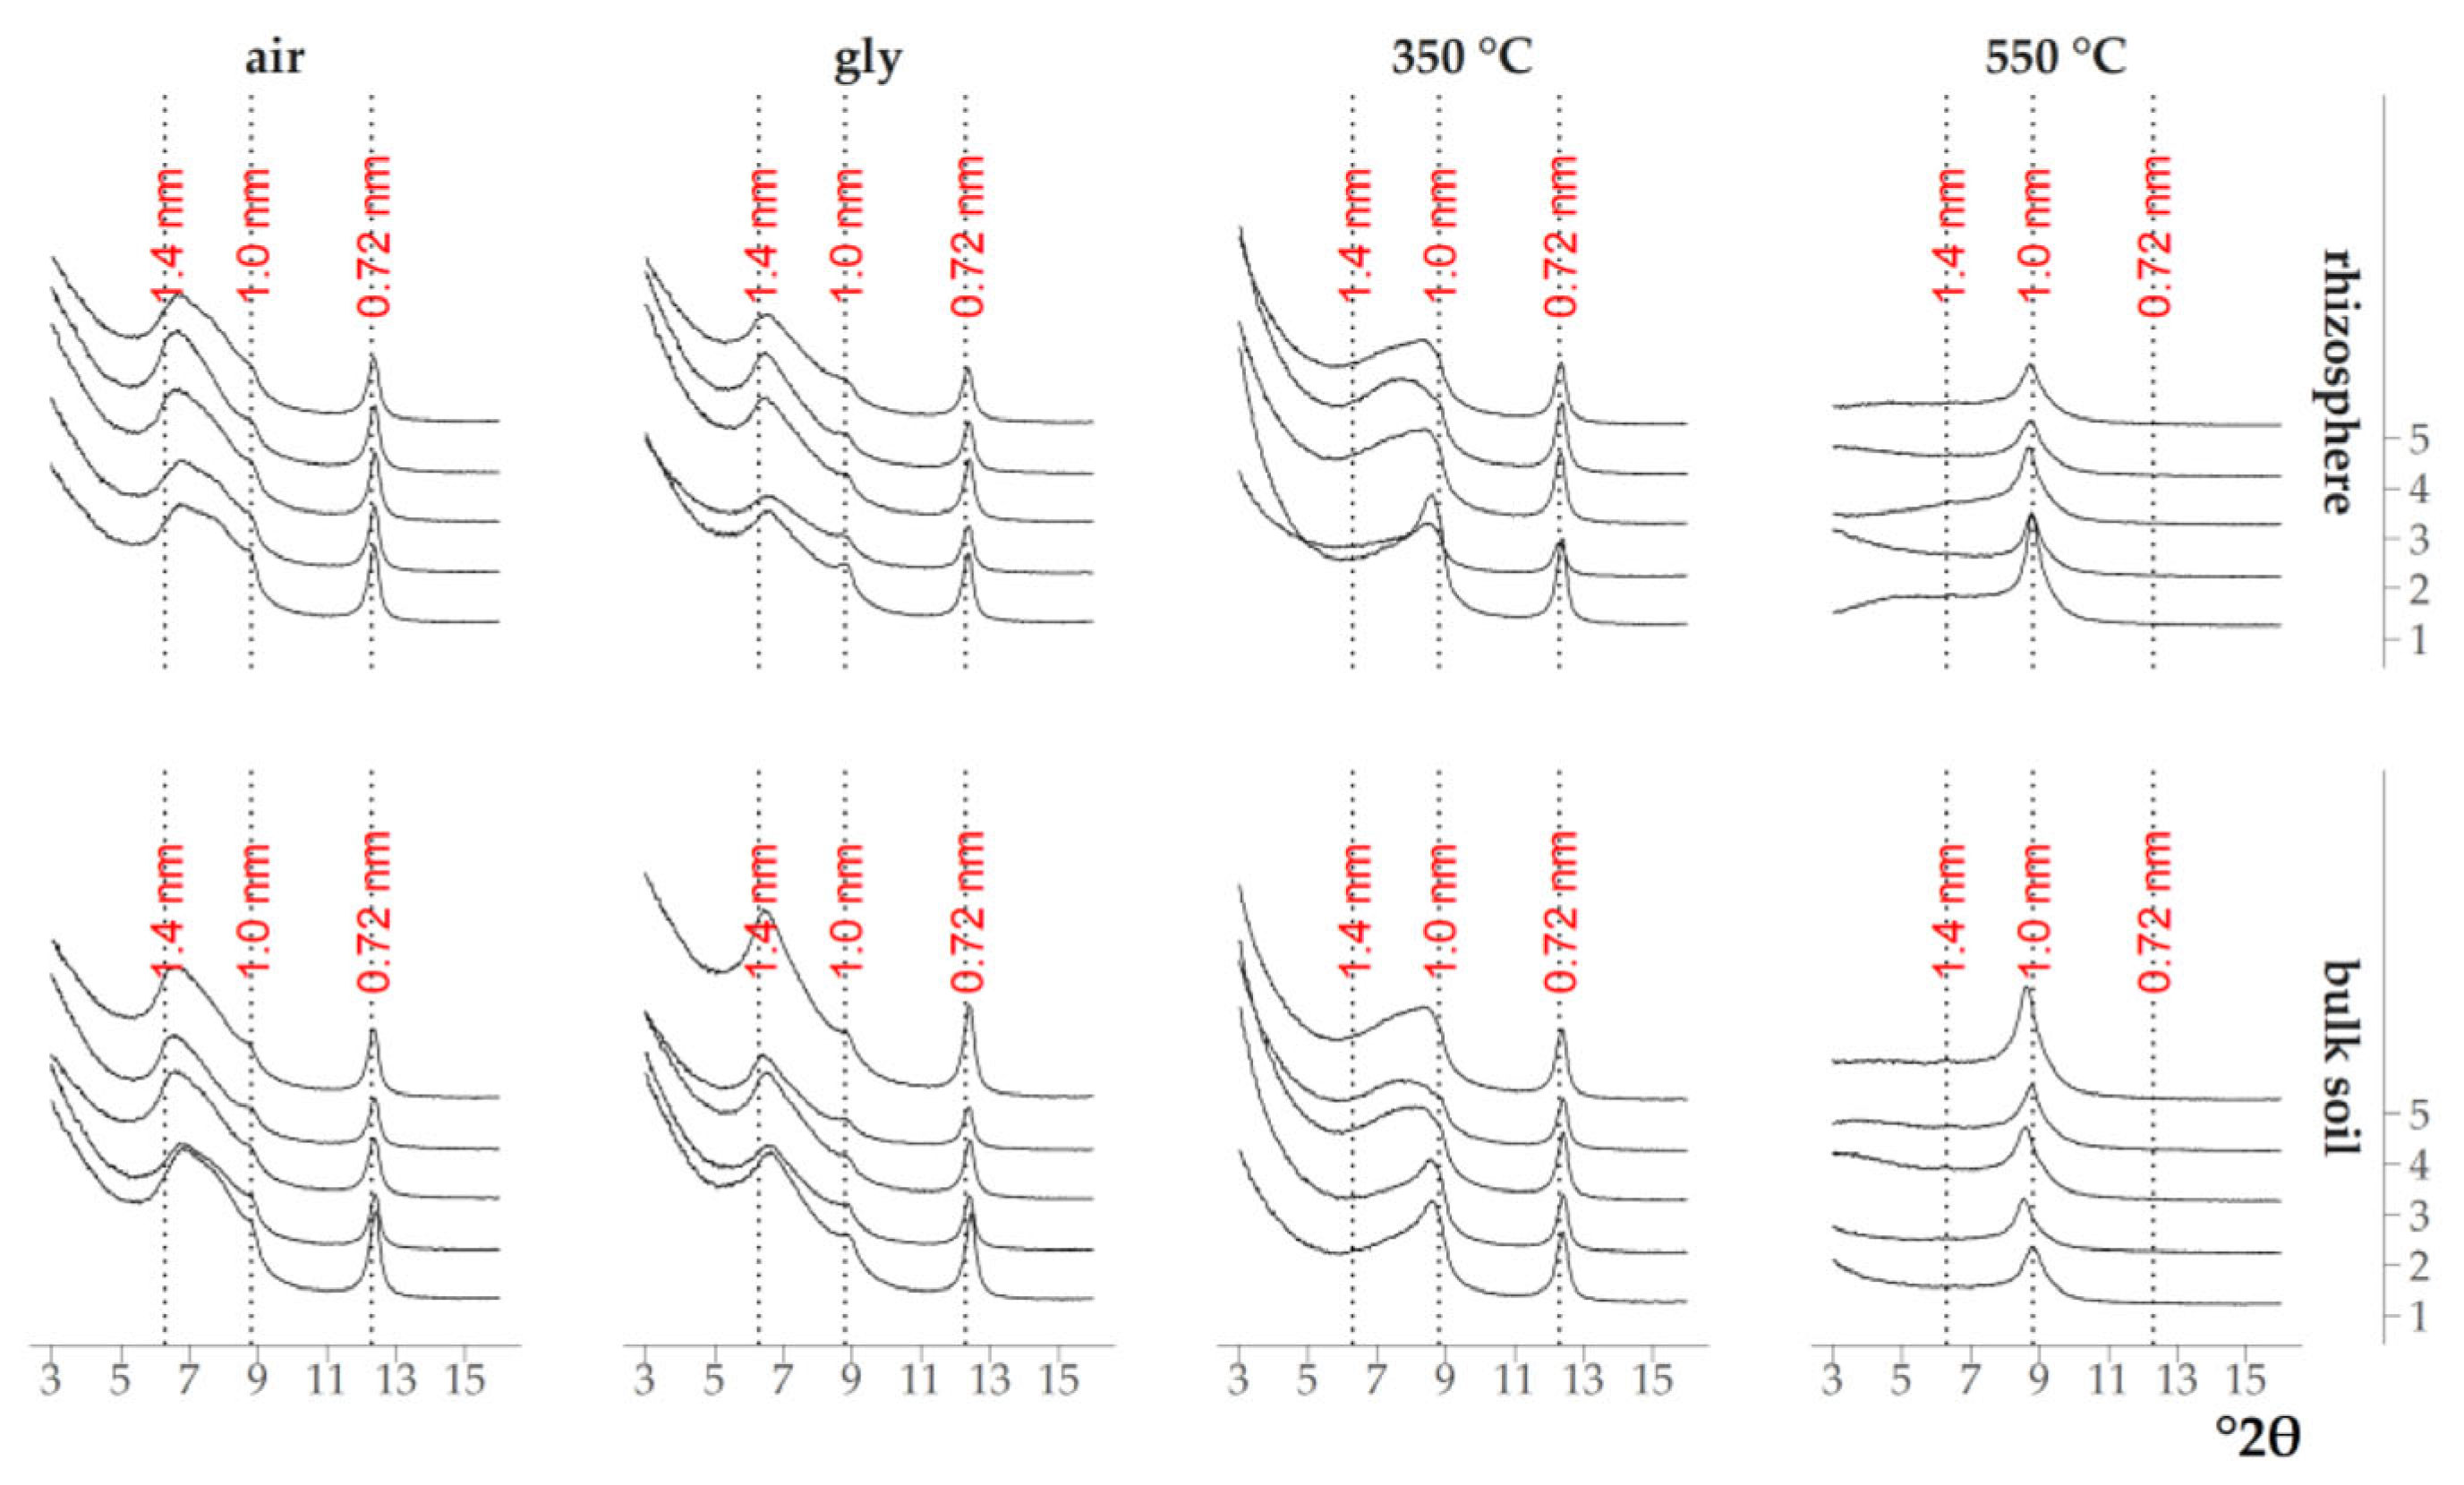
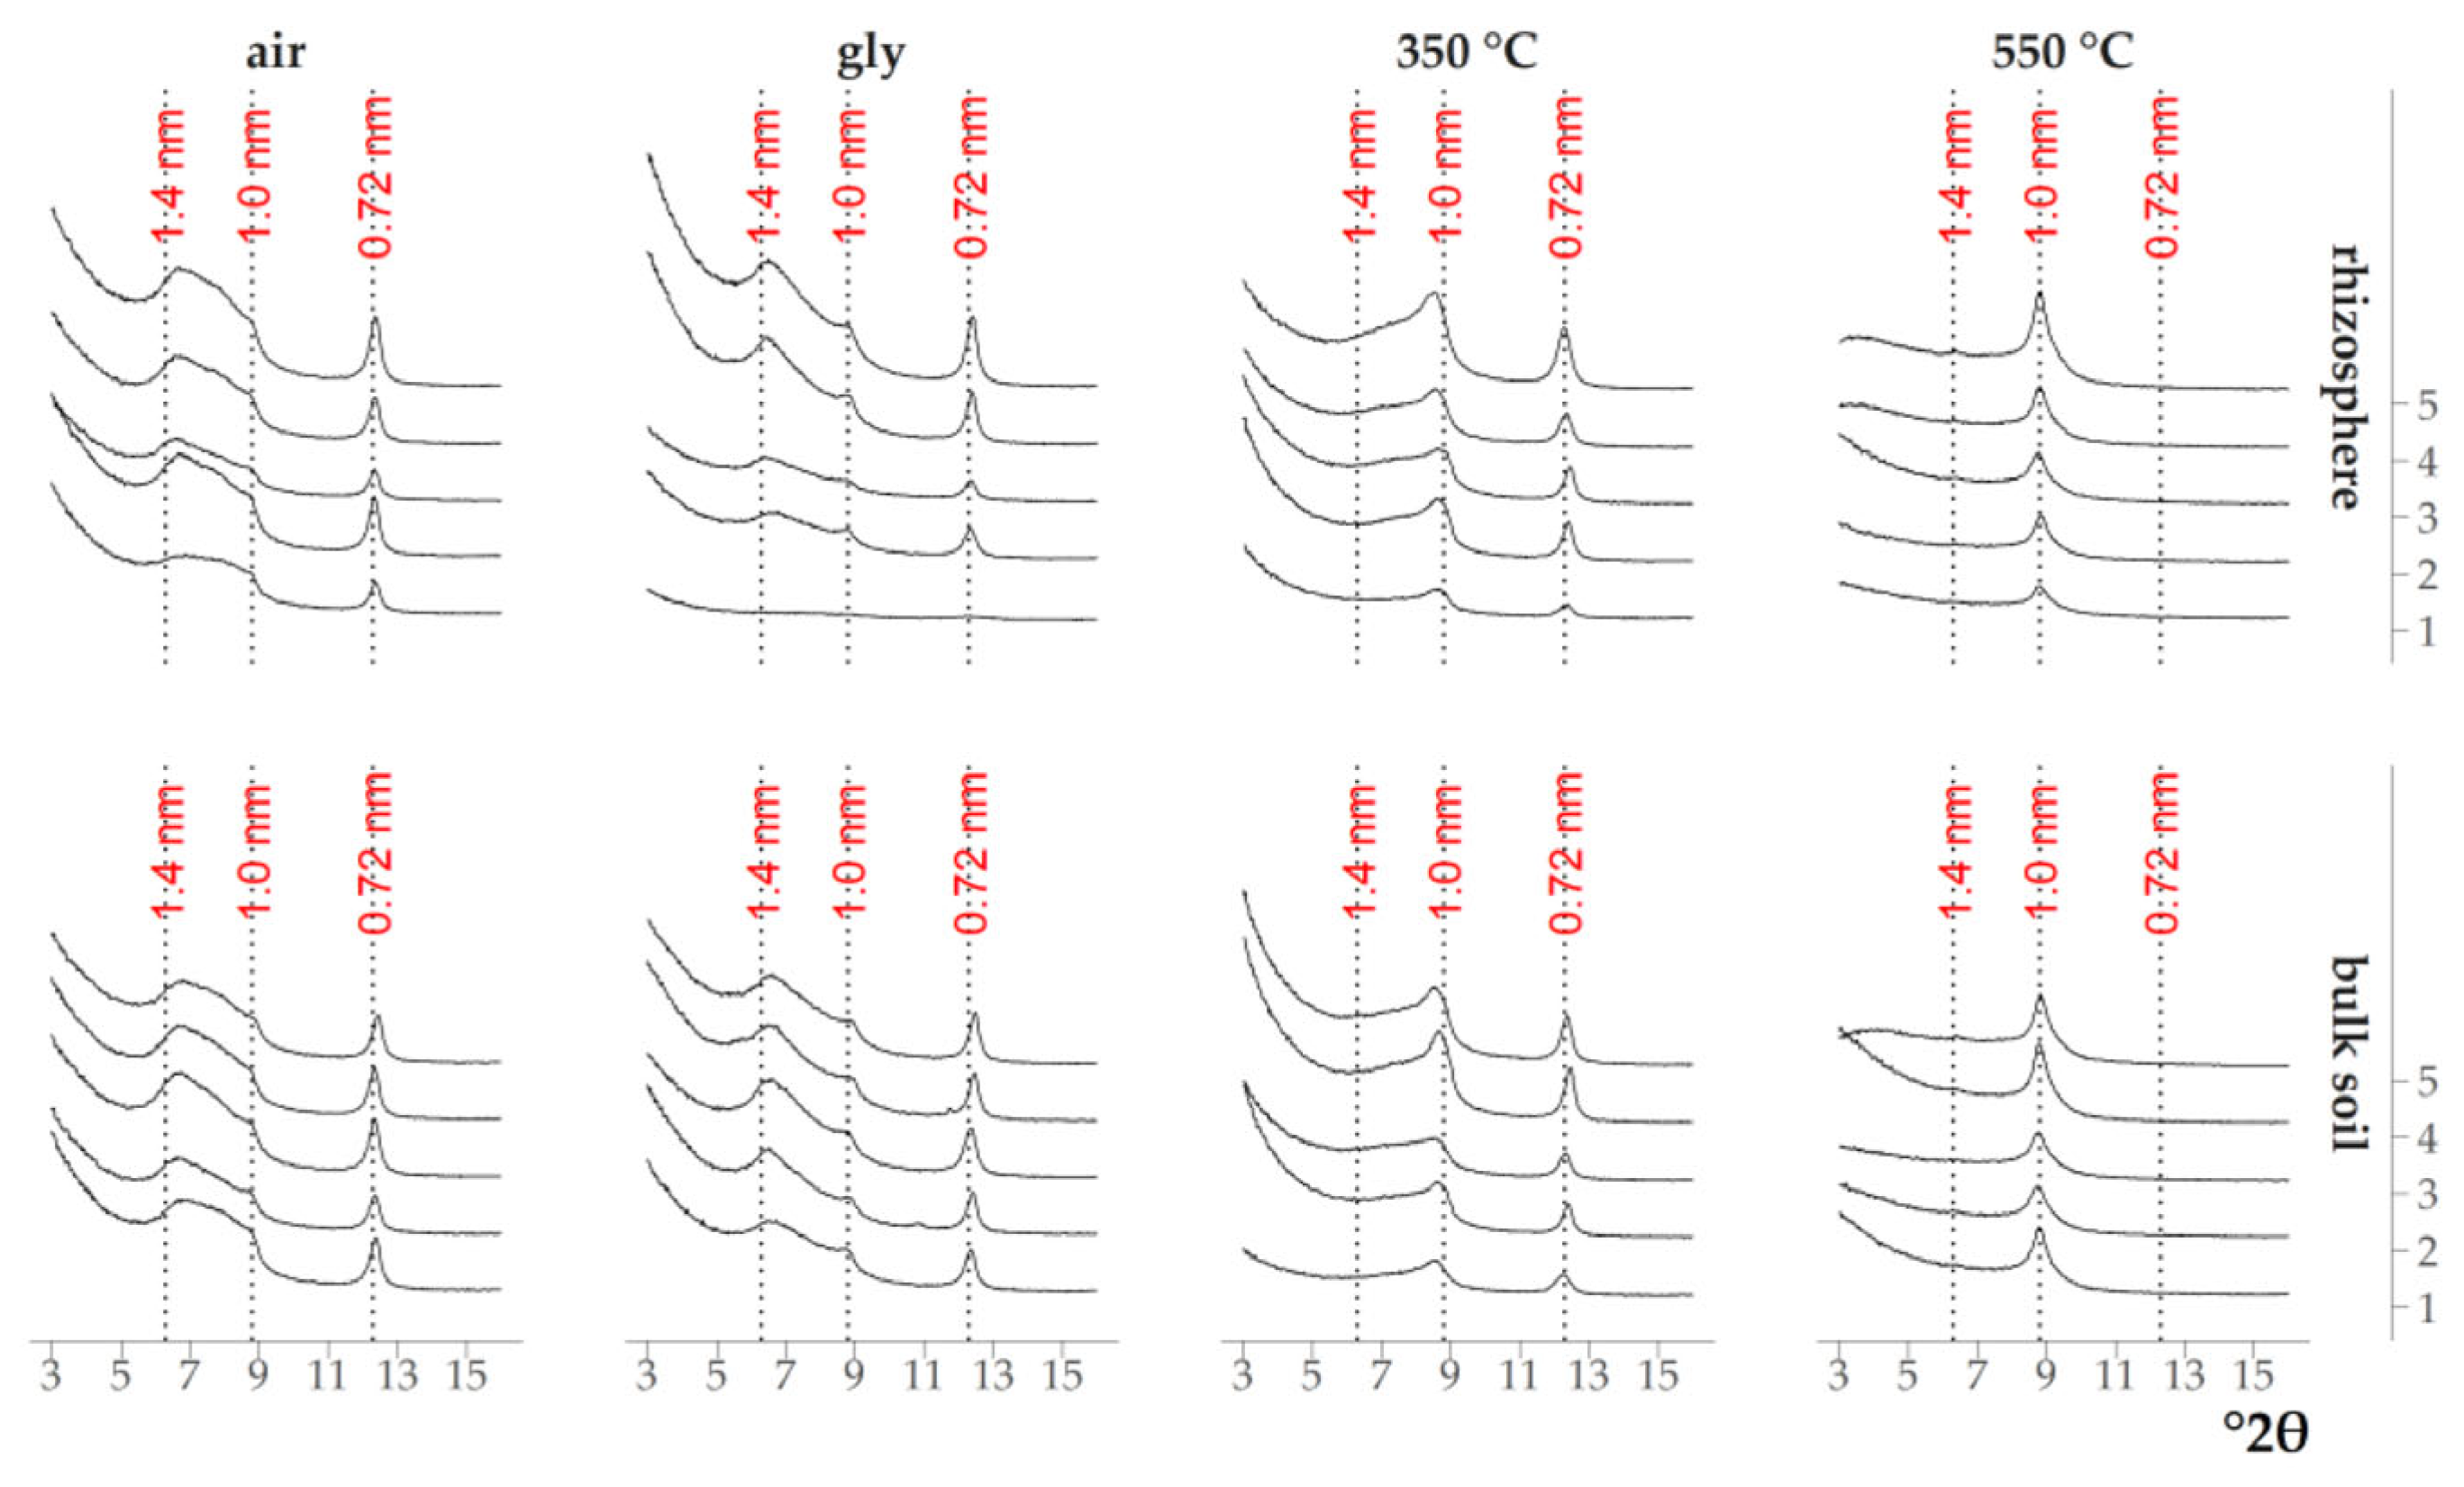
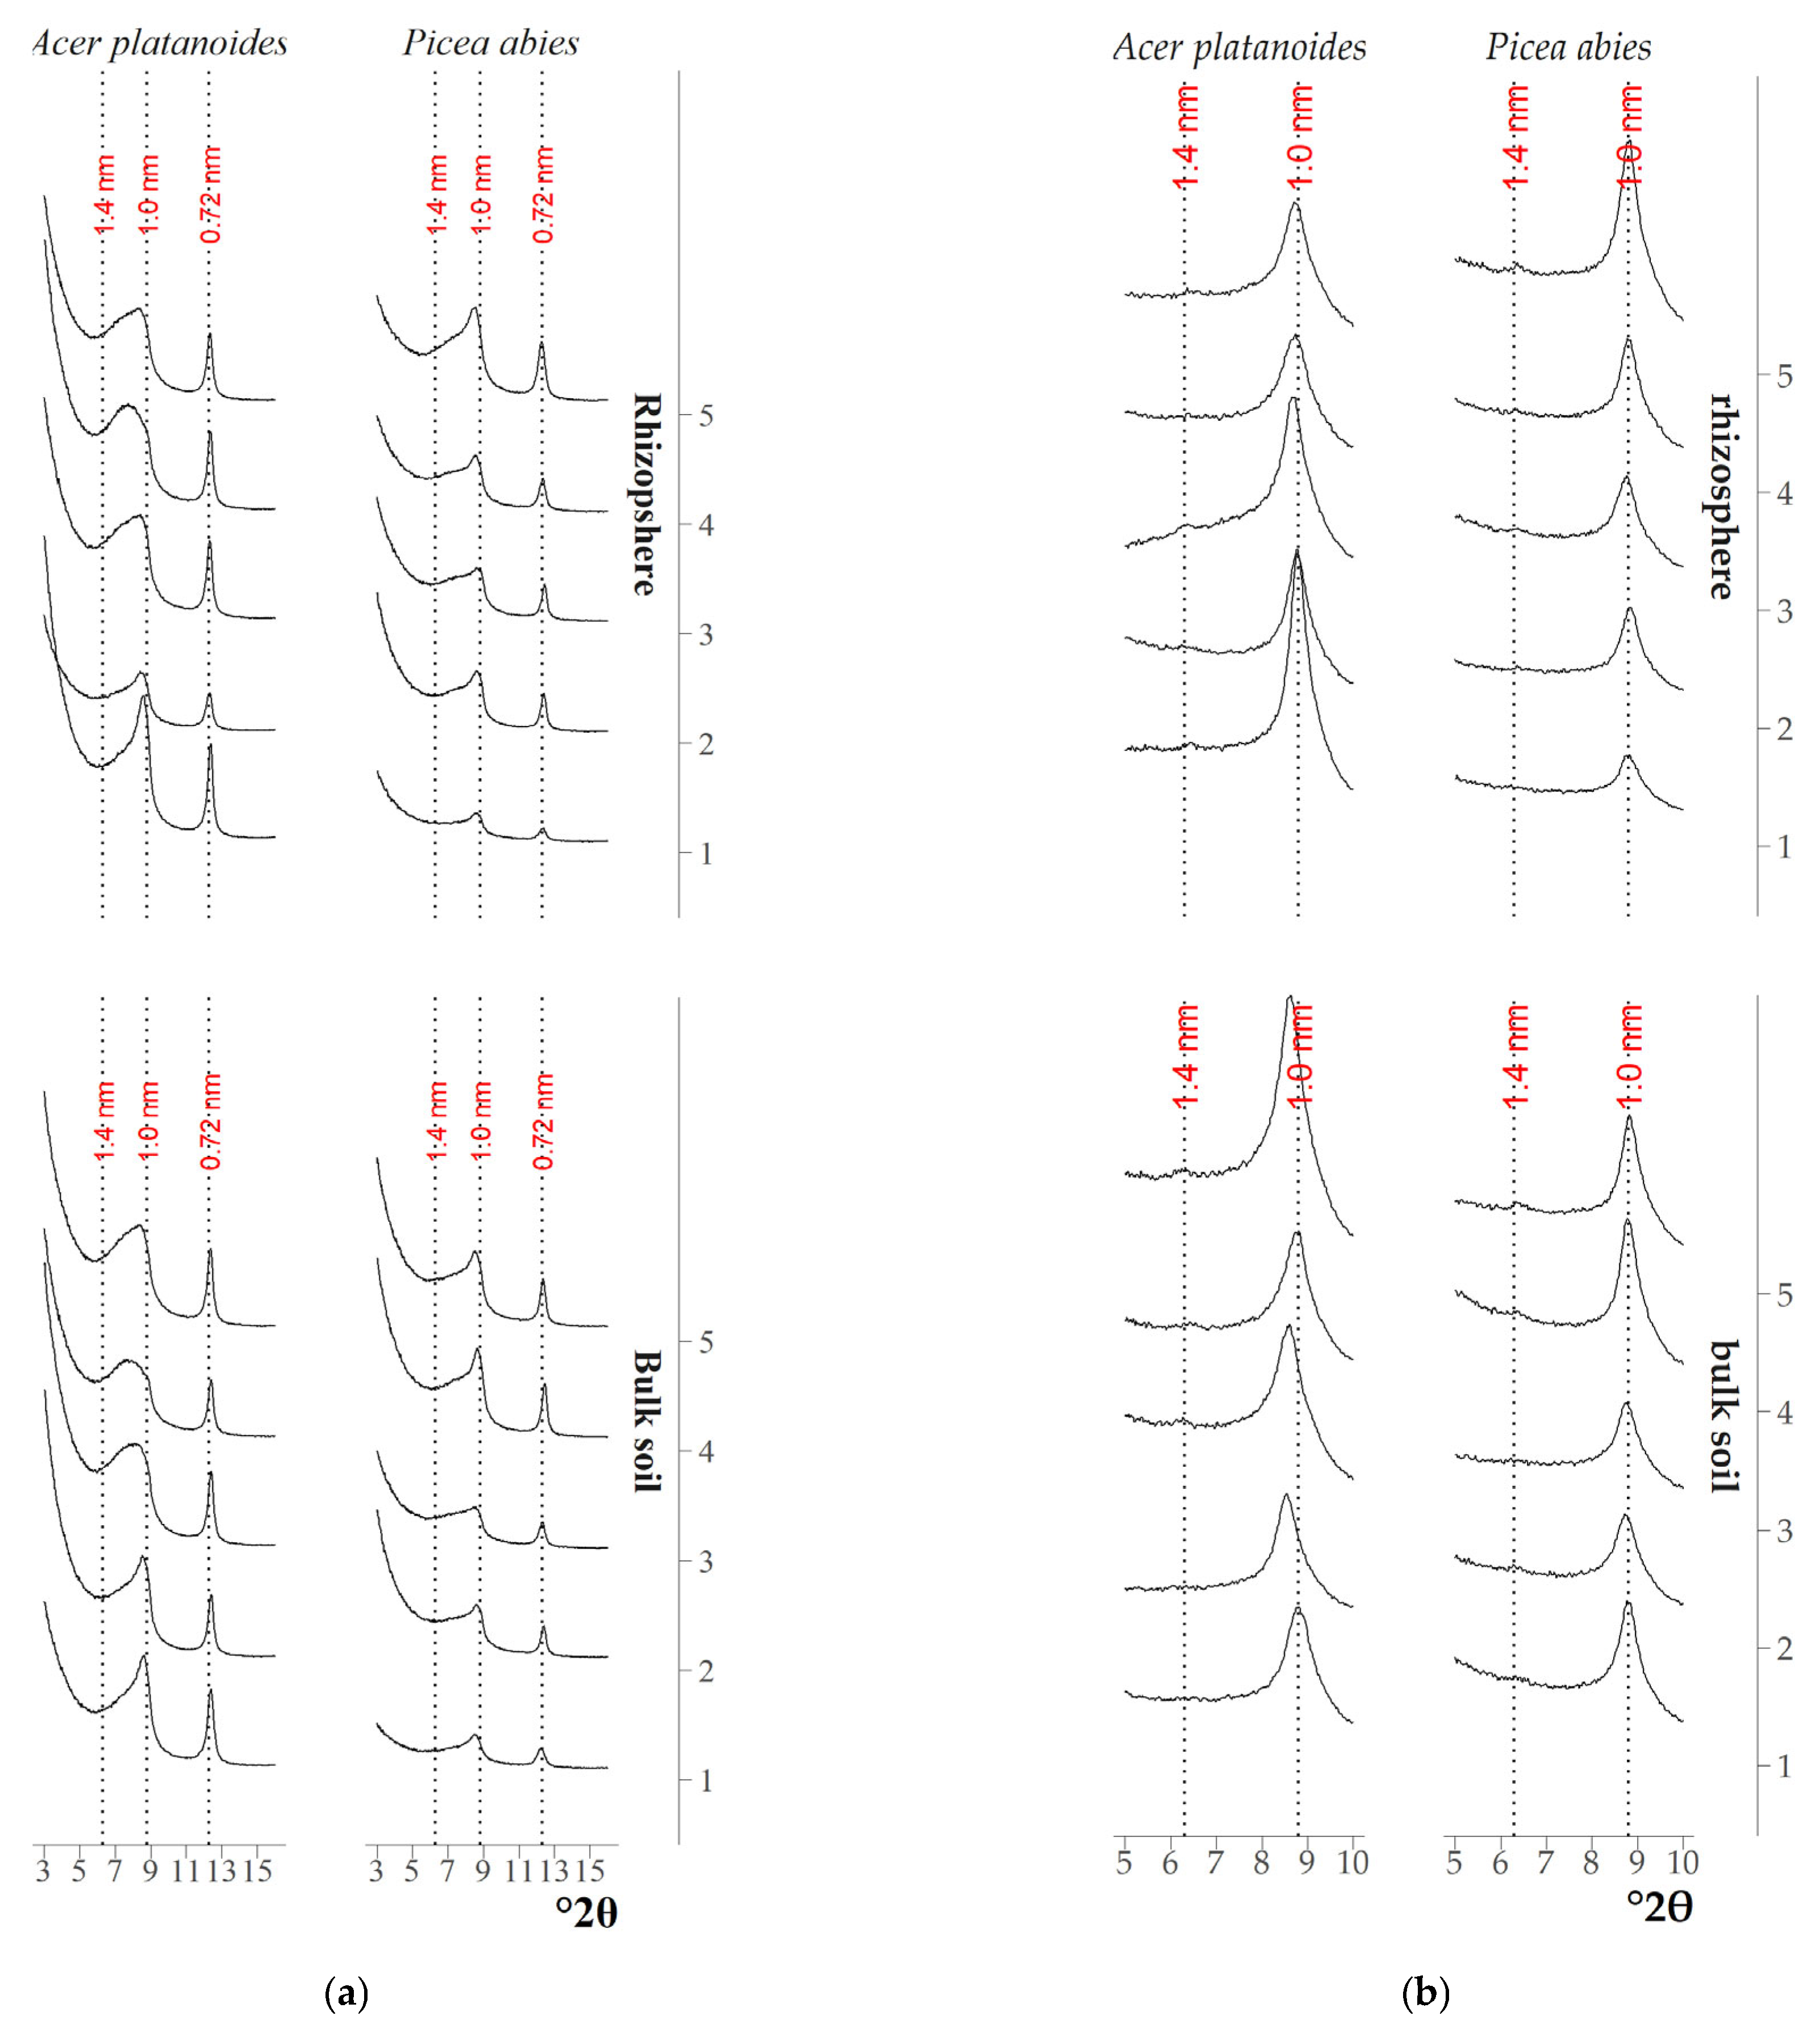
3.1. Qualitative Analysis of the Mineral Composition of Clay Fractions in Soil and Rhizosphere

The X-ray diffraction patterns of the clay fractions of all air-dried samples were visually indistinguishable (Figure 1 and Figure 2): all of them contained a symmetrical intense kaolinite peak with a maximum at 12.4°2θ (d/n 0.72 nm) which did not change upon saturation with ethylene glycol and calcination at 350 °C but disappeared after calcination at 550 °C and also a weak shoulder at 1 nm which was designated to illite. All of them also contained an asymmetrical peak in the range of 9.0–5.5°2θ (d/n in the region of 1.0–1.6 nm) in the air-dried state, which shifted toward larger °2θ after calcination at 350 °C and became bimodal after saturation with ethylene glycol. The change in the position of the peaks on the X-ray patterns after the above treatments indicated the presence of vermiculite and/or vermiculite layers in the mixed-layer illite–vermiculite [31]. The presence of a low-intensity peak with a maximum at 6.3°2θ (d/n 1.4 nm) on the X-ray patterns of the samples calcined at 550 °C (Figure 1 and Figure 2), indicated a trace amount of chlorite in the samples.

3.2. Assessment of Chemical Composition of Mineral Phases of Clay Fractions in Soil and Rhizosphere

Elemental analysis of the mineral part of the clay fraction samples (XRF) and the analysis of the citrate-dithionite-bicarbonate extract allowed us to assess the chemical composition of silicates in the clay fraction. Using the Rietveld full-profile modeling of diffraction patterns for mineral phases identified in the clay fractions (the method is implemented in Rigaku proprietary software), such as kaolinite, chlorite, illite, and vermiculite, we selected minerals with a crystallochemical formula that best corresponded to the experimental X-ray diffraction pattern of the clay fraction samples. Modeling was not performed for hydroxy-interlayered vermiculite (HIV), since there is no database with crystallochemical formulas for HIV. Comparing the chemical composition of the clay fraction and crystallochemical characteristics of the candidate phases resulted in the chemical formulas of the phases for kaolinite, chlorite, illite, and vermiculite in the clay fraction of the podzolic soil (Table 1). These formulas can be an average estimate of the chemical composition of the corresponding minerals and were used for thermodynamic calculations. Determining the exact chemical composition of each present mineral phase was not possible due to the presence of mixed-layer minerals, complex mineral composition of the clay fraction, and distortions in the X-ray diffraction patterns associated with organic matter and non-silicate Fe compounds.
For mineral phases with a known chemical composition, the Gibbs free energy of crystallization was calculated in the ClayTherm software (v. 1.1.) [4] based on the ΔG estimation models proposed in the literature, considering the chemical composition of minerals [4,6,25,32]. The equilibrium constants of the reaction of congruent dissolution of minerals at 10 °C (the temperature of the incubation experiment for the extraction of the equilibrium liquid phase of soils) were calculated (Table 1) on the basis of the ΔG of the mineral phases of the clay fraction, as well as the minimum and maximum ΔG values of the corresponding minerals known from literature sources.
Table 1. Structural formulae calculated from the Rietveld method and thermodynamic characteristics of clay minerals of podzolic soil and comparison with literature data [1,2,3,4,33,34,35,36,37,38] (ND—not determined).
MineralStructural FormulaКΔG, kcal/molΔG Theor.
Min., kcal/mol
ΔG Theor.
Max., kcal/mol
К Theor.
Min.
К Theor.
Max.
KaoliniteAl2Si2O5(OH)46.9−906.2−912.1−898.42.312.9
Chlorite(Mg,Fe)5(Al,Si)5O10(OH)861.3−2112.7−1974.0−1938.263.176.8
Illite(K0.71Ca0.01Na0.01)(Al1.86Mg0.15Fe0.04)(Si3.27Al0.73)O10(OH)213.3−1312.0−1313.6−1250.512.917.1
Vermiculite(Mg0.38Ca0.03Na0.02)2
(Mg2.46Al0.3Fe0.22Ti0.021)2
((Si2.83Al1.17)O10)2
OH4 (H2O)3.4
33.8−1363.2−1298.0−1364.820.245.2
Hydroxy-interlayered vermiculite (HIV)NDNDND−1842.7−1418.04.6140.9

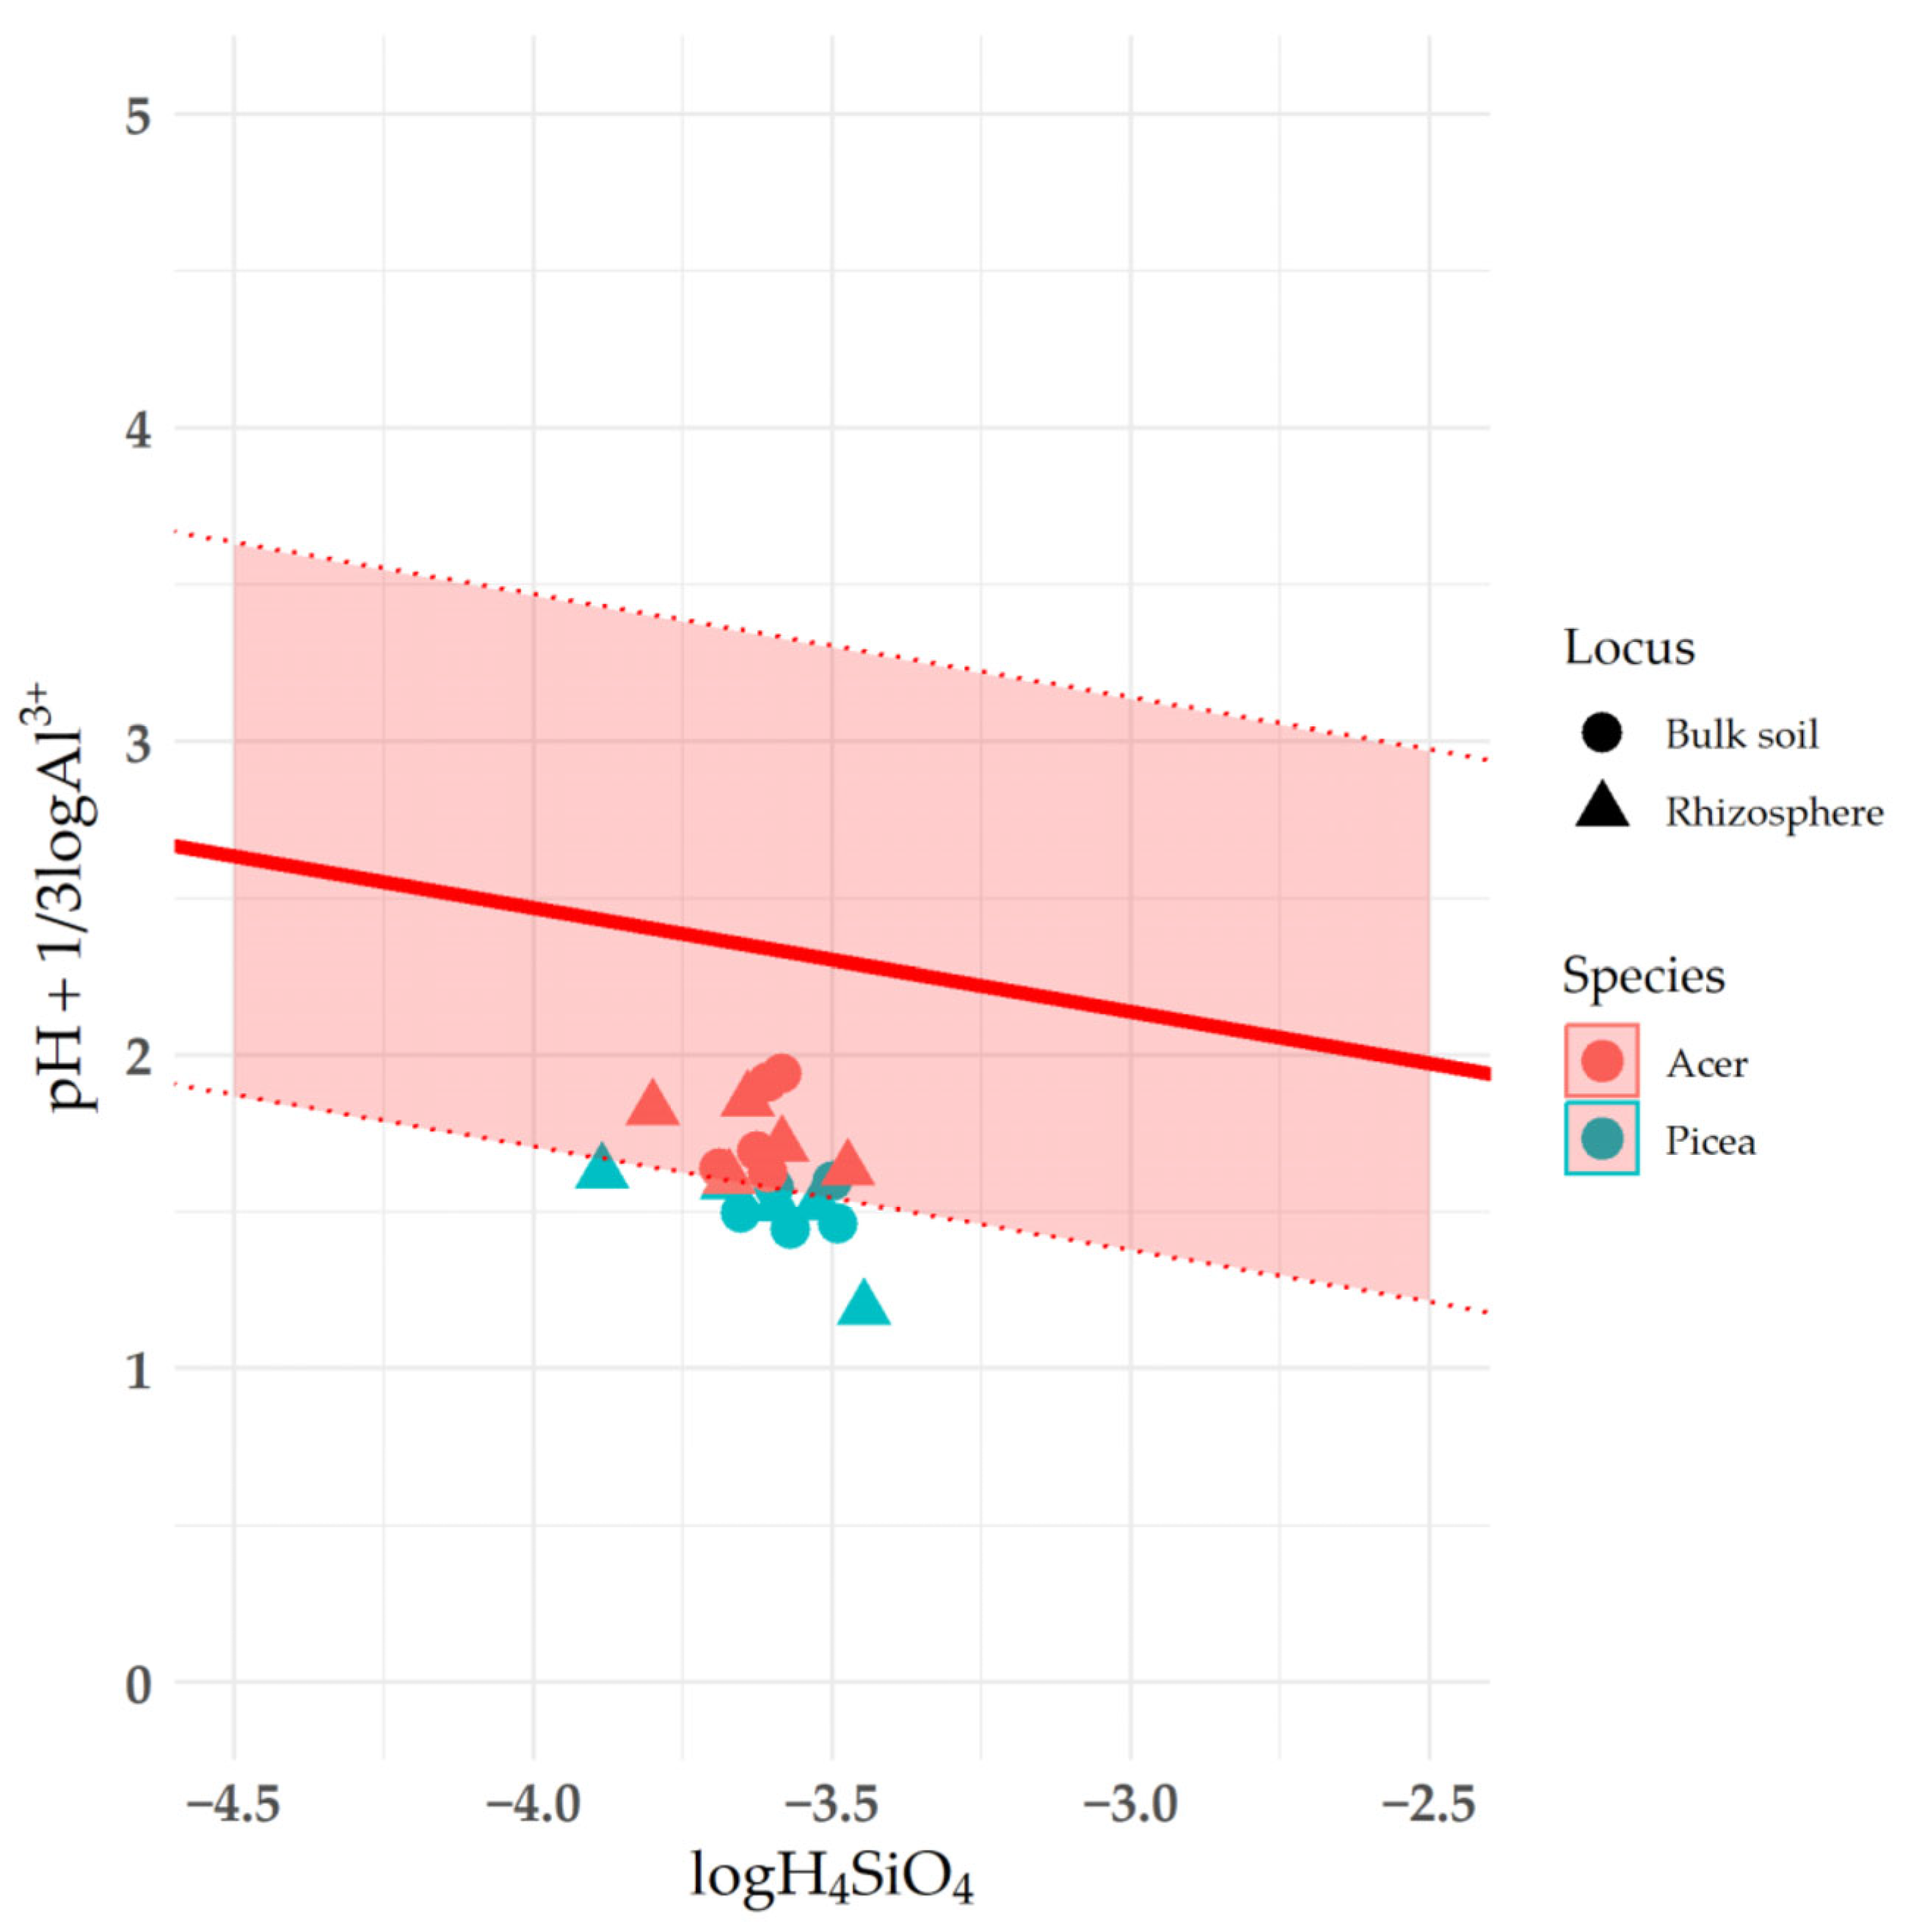
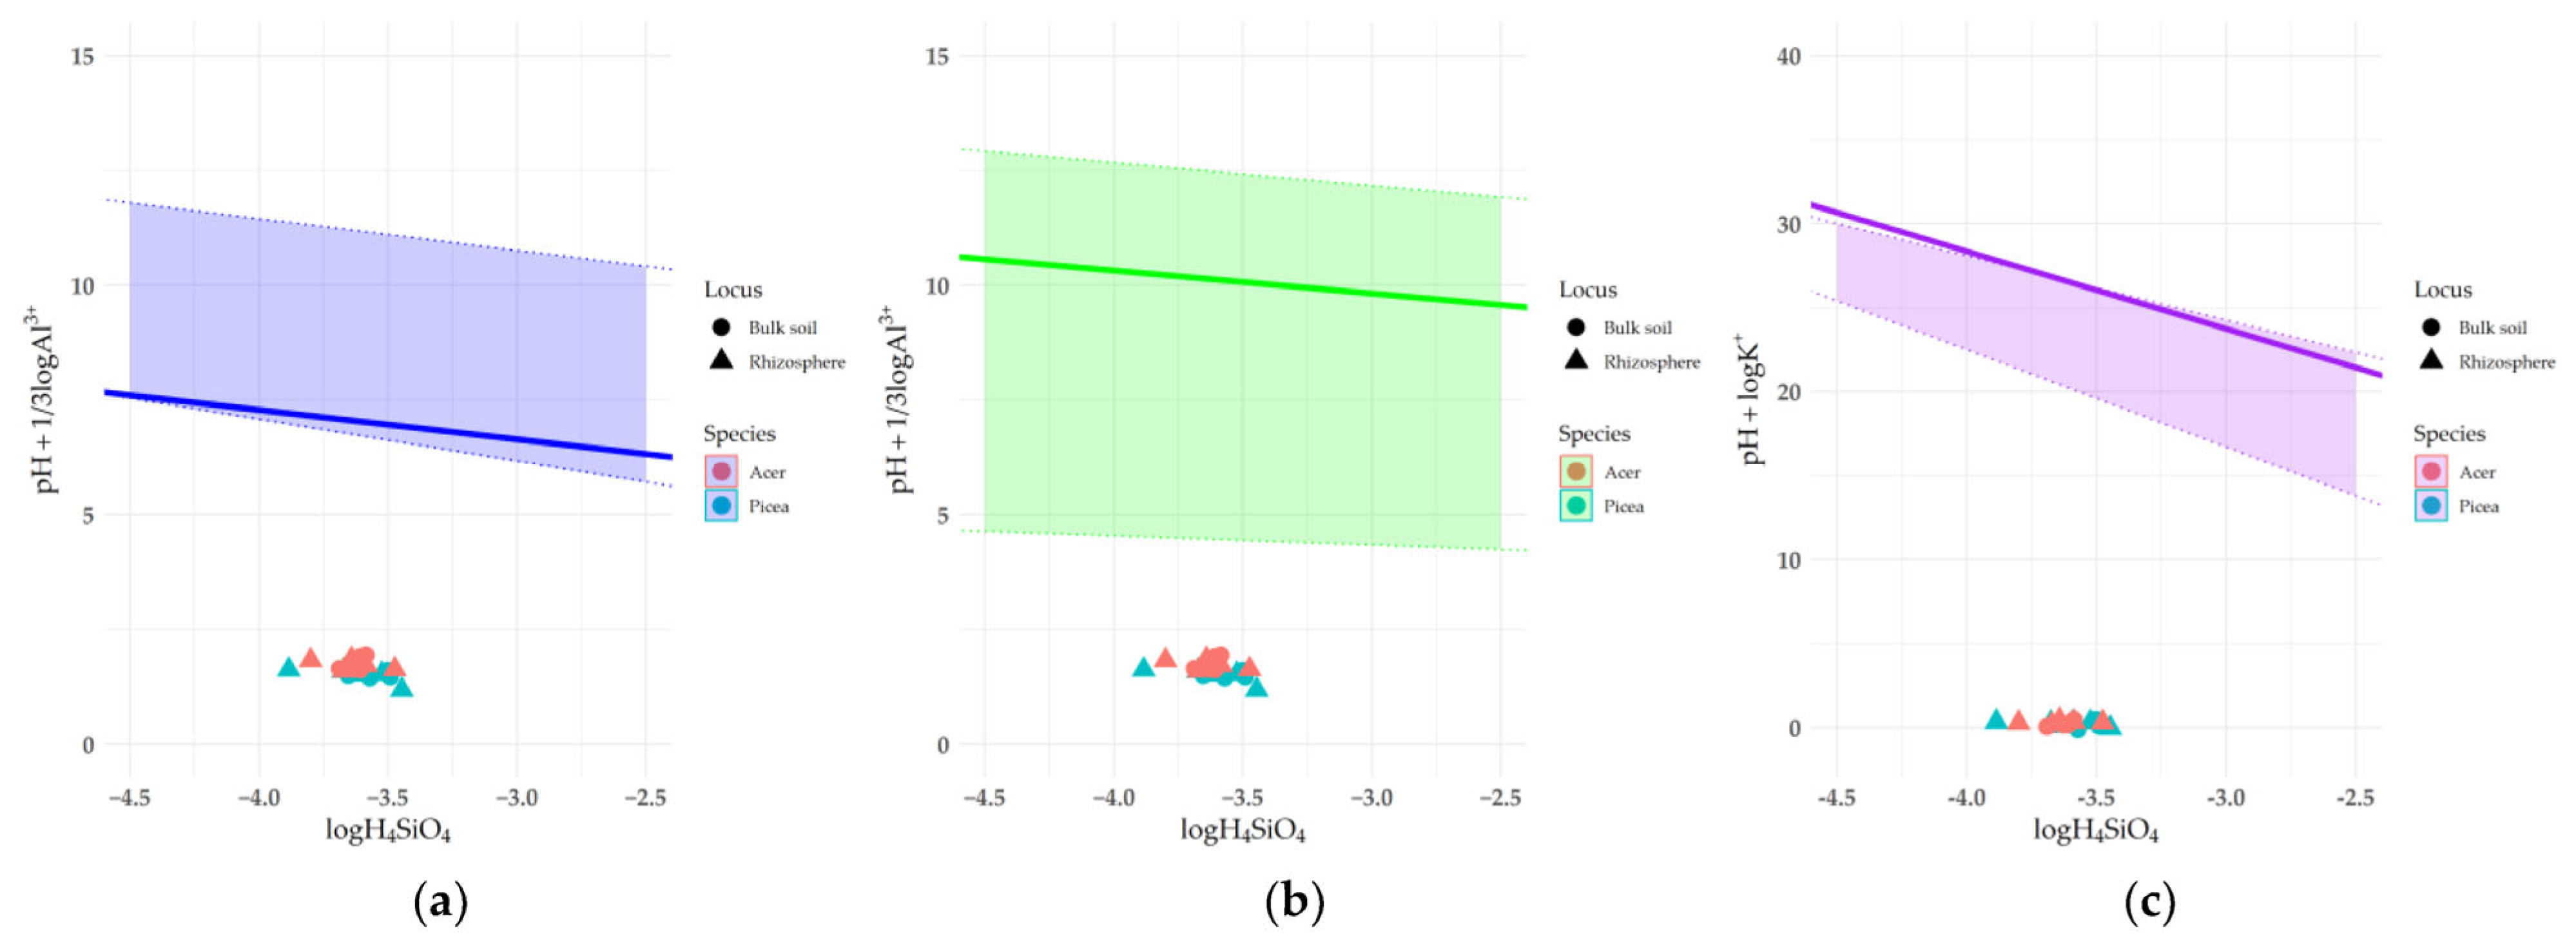
3.3. Assessment of Mineral Thermodynamic Stability in the Composition of Clay Fractions in Soil and Rhizosphere

Calculation of the SI for each mineral phase with a known chemical composition showed that the thermodynamic stability of minerals decreased in the series kaolinite > illite > vermiculite > chlorite (Table 2) under conditions of water-saturated podzolic soil. In all experiment variants, the SI value was significantly less than 0, indicating unsaturation of the liquid phase of the podzolic soil relative to the predominant clay minerals. The minerals exhibiting the least stability were found in the rhizosphere of Picea abies, while the minerals demonstrating the highest stability were present in the soil under Acer platanoides. The results on the composition analysis of the equilibrium liquid soil phase are given in Appendix A (Table A2).
The saturation index does not take into account the heterogeneity of the chemical composition of individual mineral phases. Therefore, saturation diagrams were constructed with lines corresponding to the minimum and maximum thermodynamic stability of the mineral phase according to literature data. These lines form a stability zone that corresponds to a state close to equilibrium and can also be used to assess mineral thermodynamic stability.
The dissolution of kaolinite group minerals in the soil under Picea abies was a thermodynamically allowed process relative to the phase with experimentally estimated composition (Figure 3, solid line). In contrast, in the soil under Acer platanoides, kaolinite fell into the stability band.
The dissolution of vermiculite, chlorite, and minerals of the mica and illite group was a thermodynamically allowed process in all samples (Figure 4, Table 2).
The liquid phase of the soil was almost at the lower boundary of the stability zone with HIV (Figure 5). However, since it was not possible to establish the chemical composition of HIV, the corresponding diagrams do not contain a line corresponding to the chemical composition of HIV. Instead, only the predicted stability zone is given.

3.4. Organic Matter Properties of Clay Fractions in Soil and Rhizosphere

The chemical composition of the soil organic matter (SOM) in the clay fraction assessed by DRIFTS was more affected by rhizosphere processes, regardless of the plant species (Figure 6a), than by the source of litter (Acer platanoides or Picea abies) (Figure 6b). At the same time, the clay fraction exhibited less pronounced clustering of samples compared to the soil not separated into fractions. The discrimination between the rhizosphere and non-rhizosphere space was attributed to the bands in the ranges of 1000–1200 cm−1 and 1800–2000 cm−1 associated with carbohydrates and carboxyl groups, respectively [39,40]. The SOM of the rhizosphere clay fraction showed a relative accumulation of polysaccharides (1000–1200 cm−1), while the clay fraction of the bulk soil accumulated compounds enriched in carboxyl groups (1800–2000 cm−1) (Figure 6a).
The DSC curves of the clay fractions (Figure 7) identify three main thermal effects: the endothermic effect of dehydration (50–150 °C), the endothermic effect of kaolinite dehydroxylation (500–550 °C), and the exothermic effect of SOM thermal destruction in the range of 250–450 °C. The thermal effect of SOM thermal destruction was satisfactorily described after deconvolution of the experimental curves by three conditional components with peaks in the region of 240–260, 280–300, and 330–350 °C named Exo1, Exo2, and Exo3, respectively.
To clarify the possible chemical nature of the thermal fractions of SOM, a correlation analysis was conducted between the areas exhibiting thermal effects and the intensities of the DRIFTS spectrum bands. The results of this analysis indicated a high degree of interrelation between various combinations of these parameters (Figure 8). The areas of thermal effects at 240–260, 280–300, and 330–370 °C (Exo1–Exo3) positively correlated with the bands of 1099, 1160, 1185, 1238, 2860, and 2927 cm−1, indicating their predominant connection with carbohydrates (including cellulose), soil lipids, and other aliphatic substances [39,40].

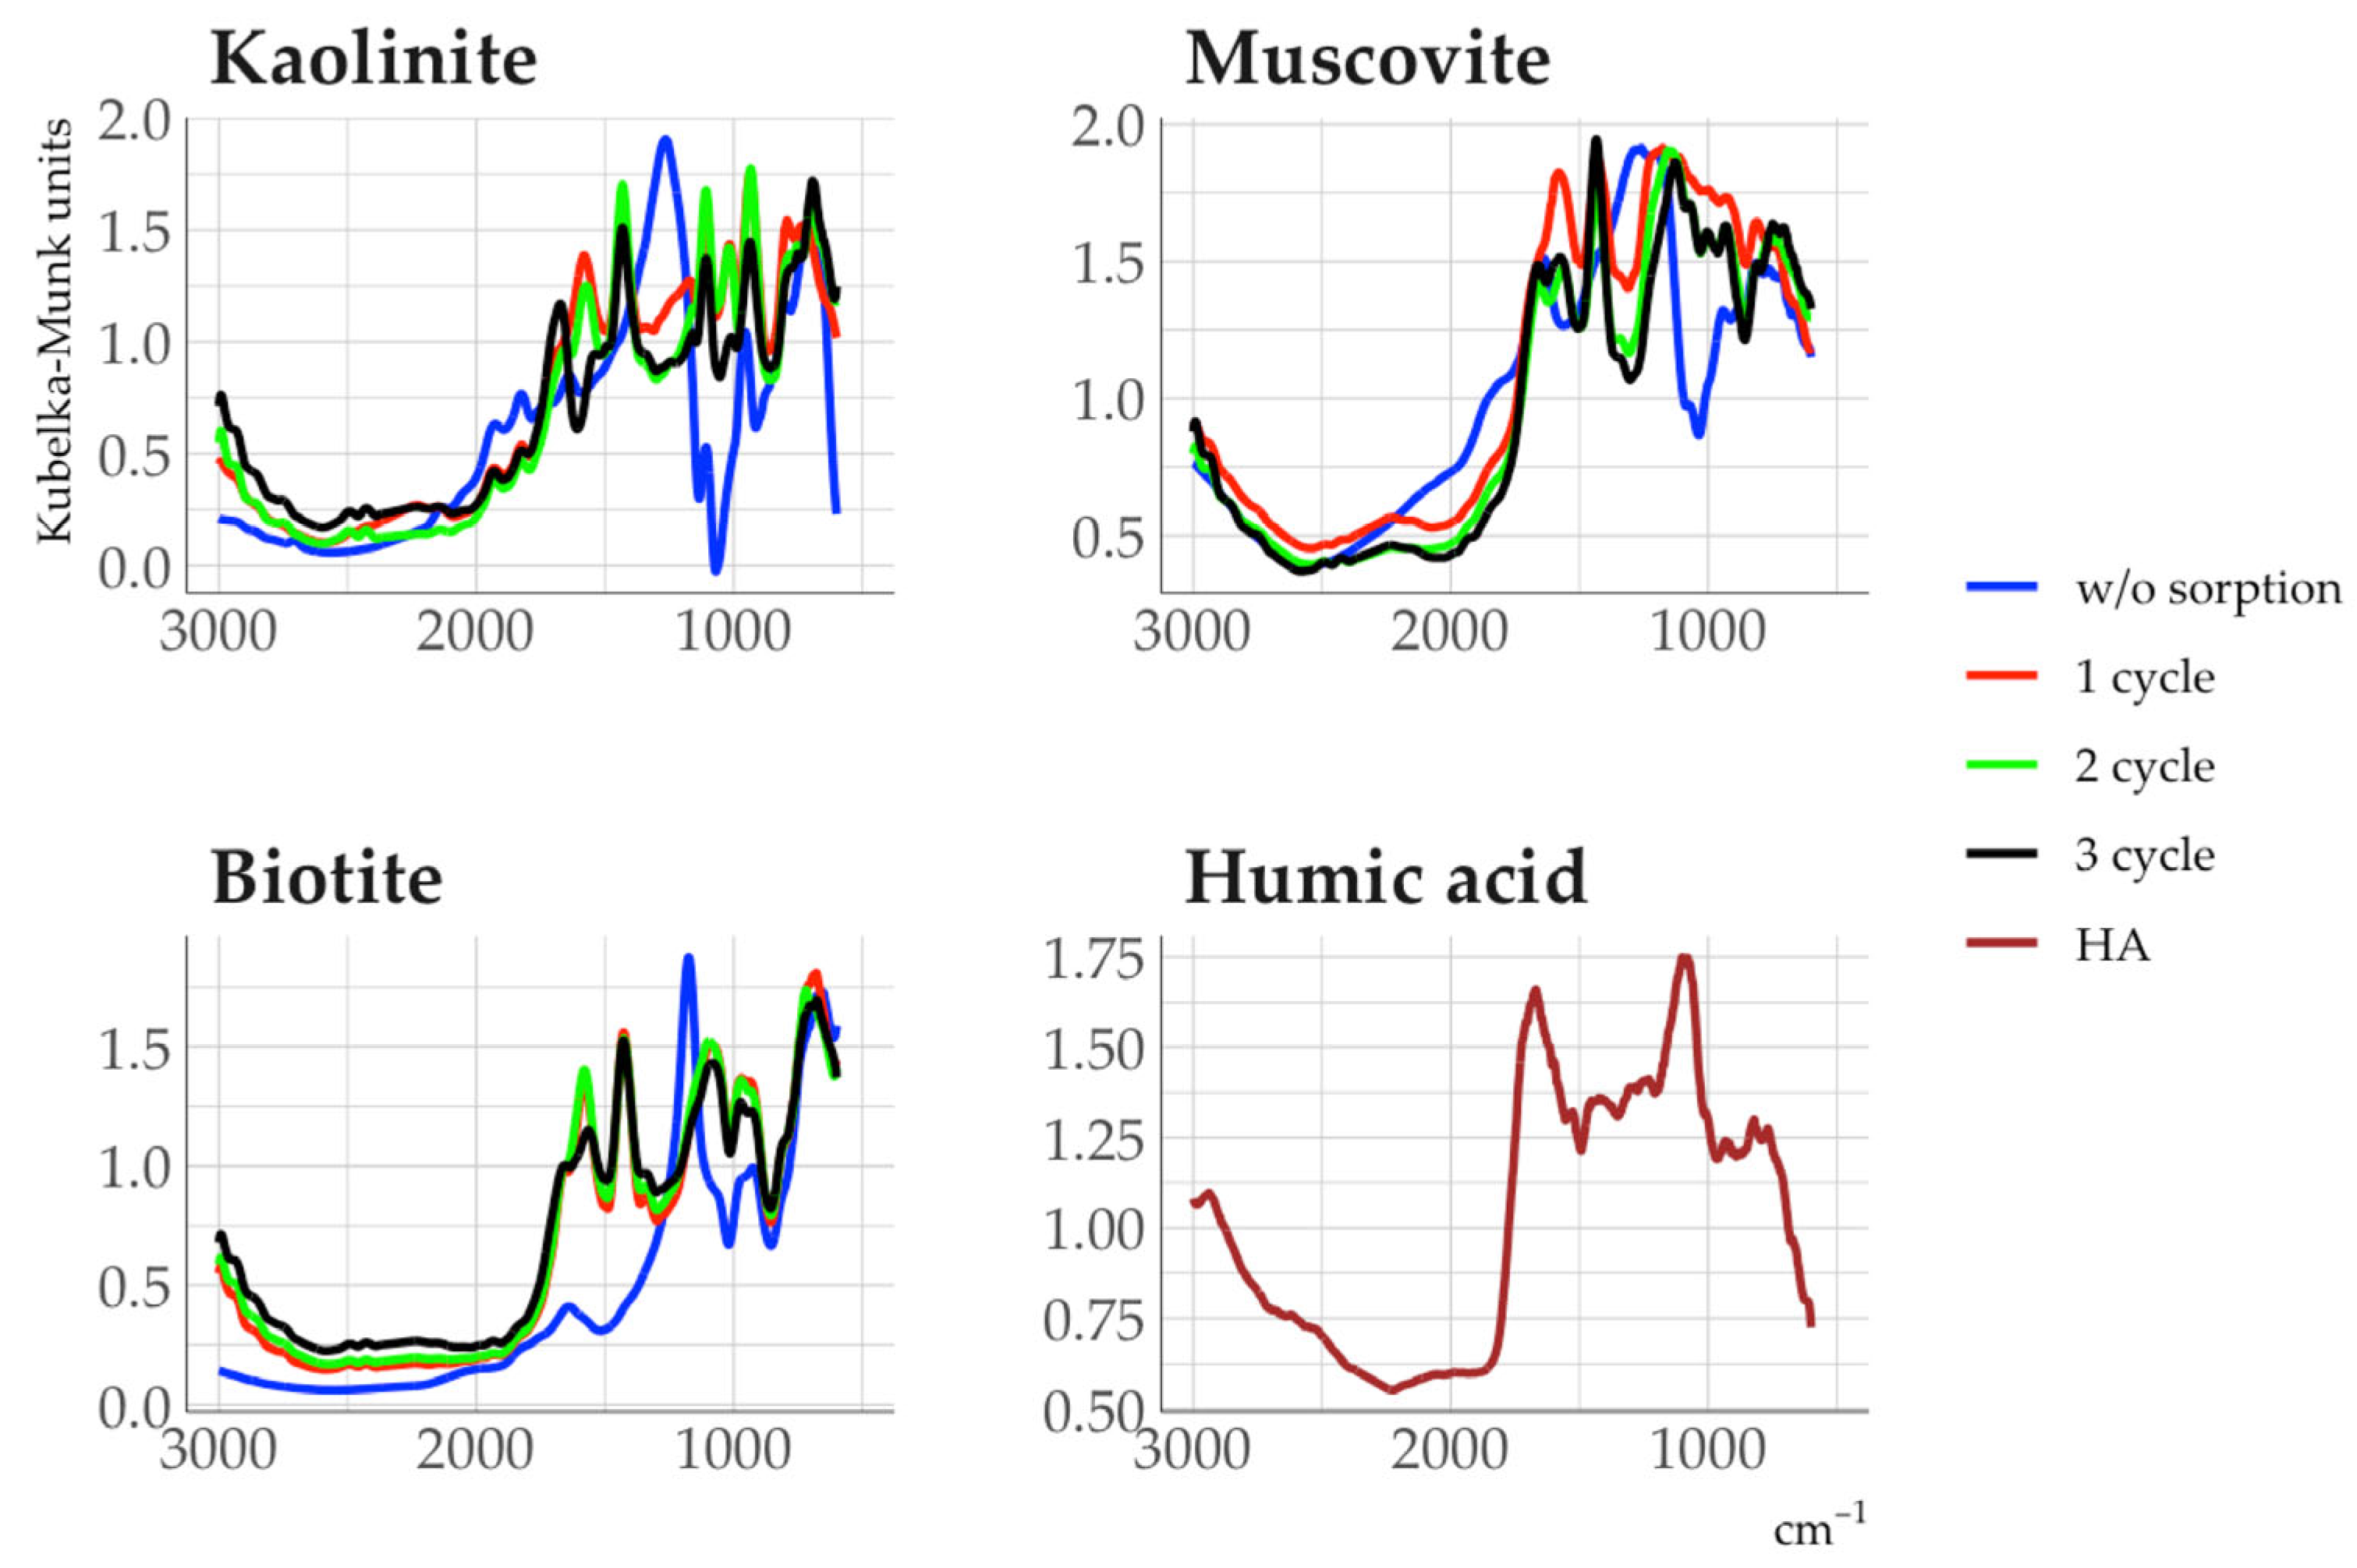
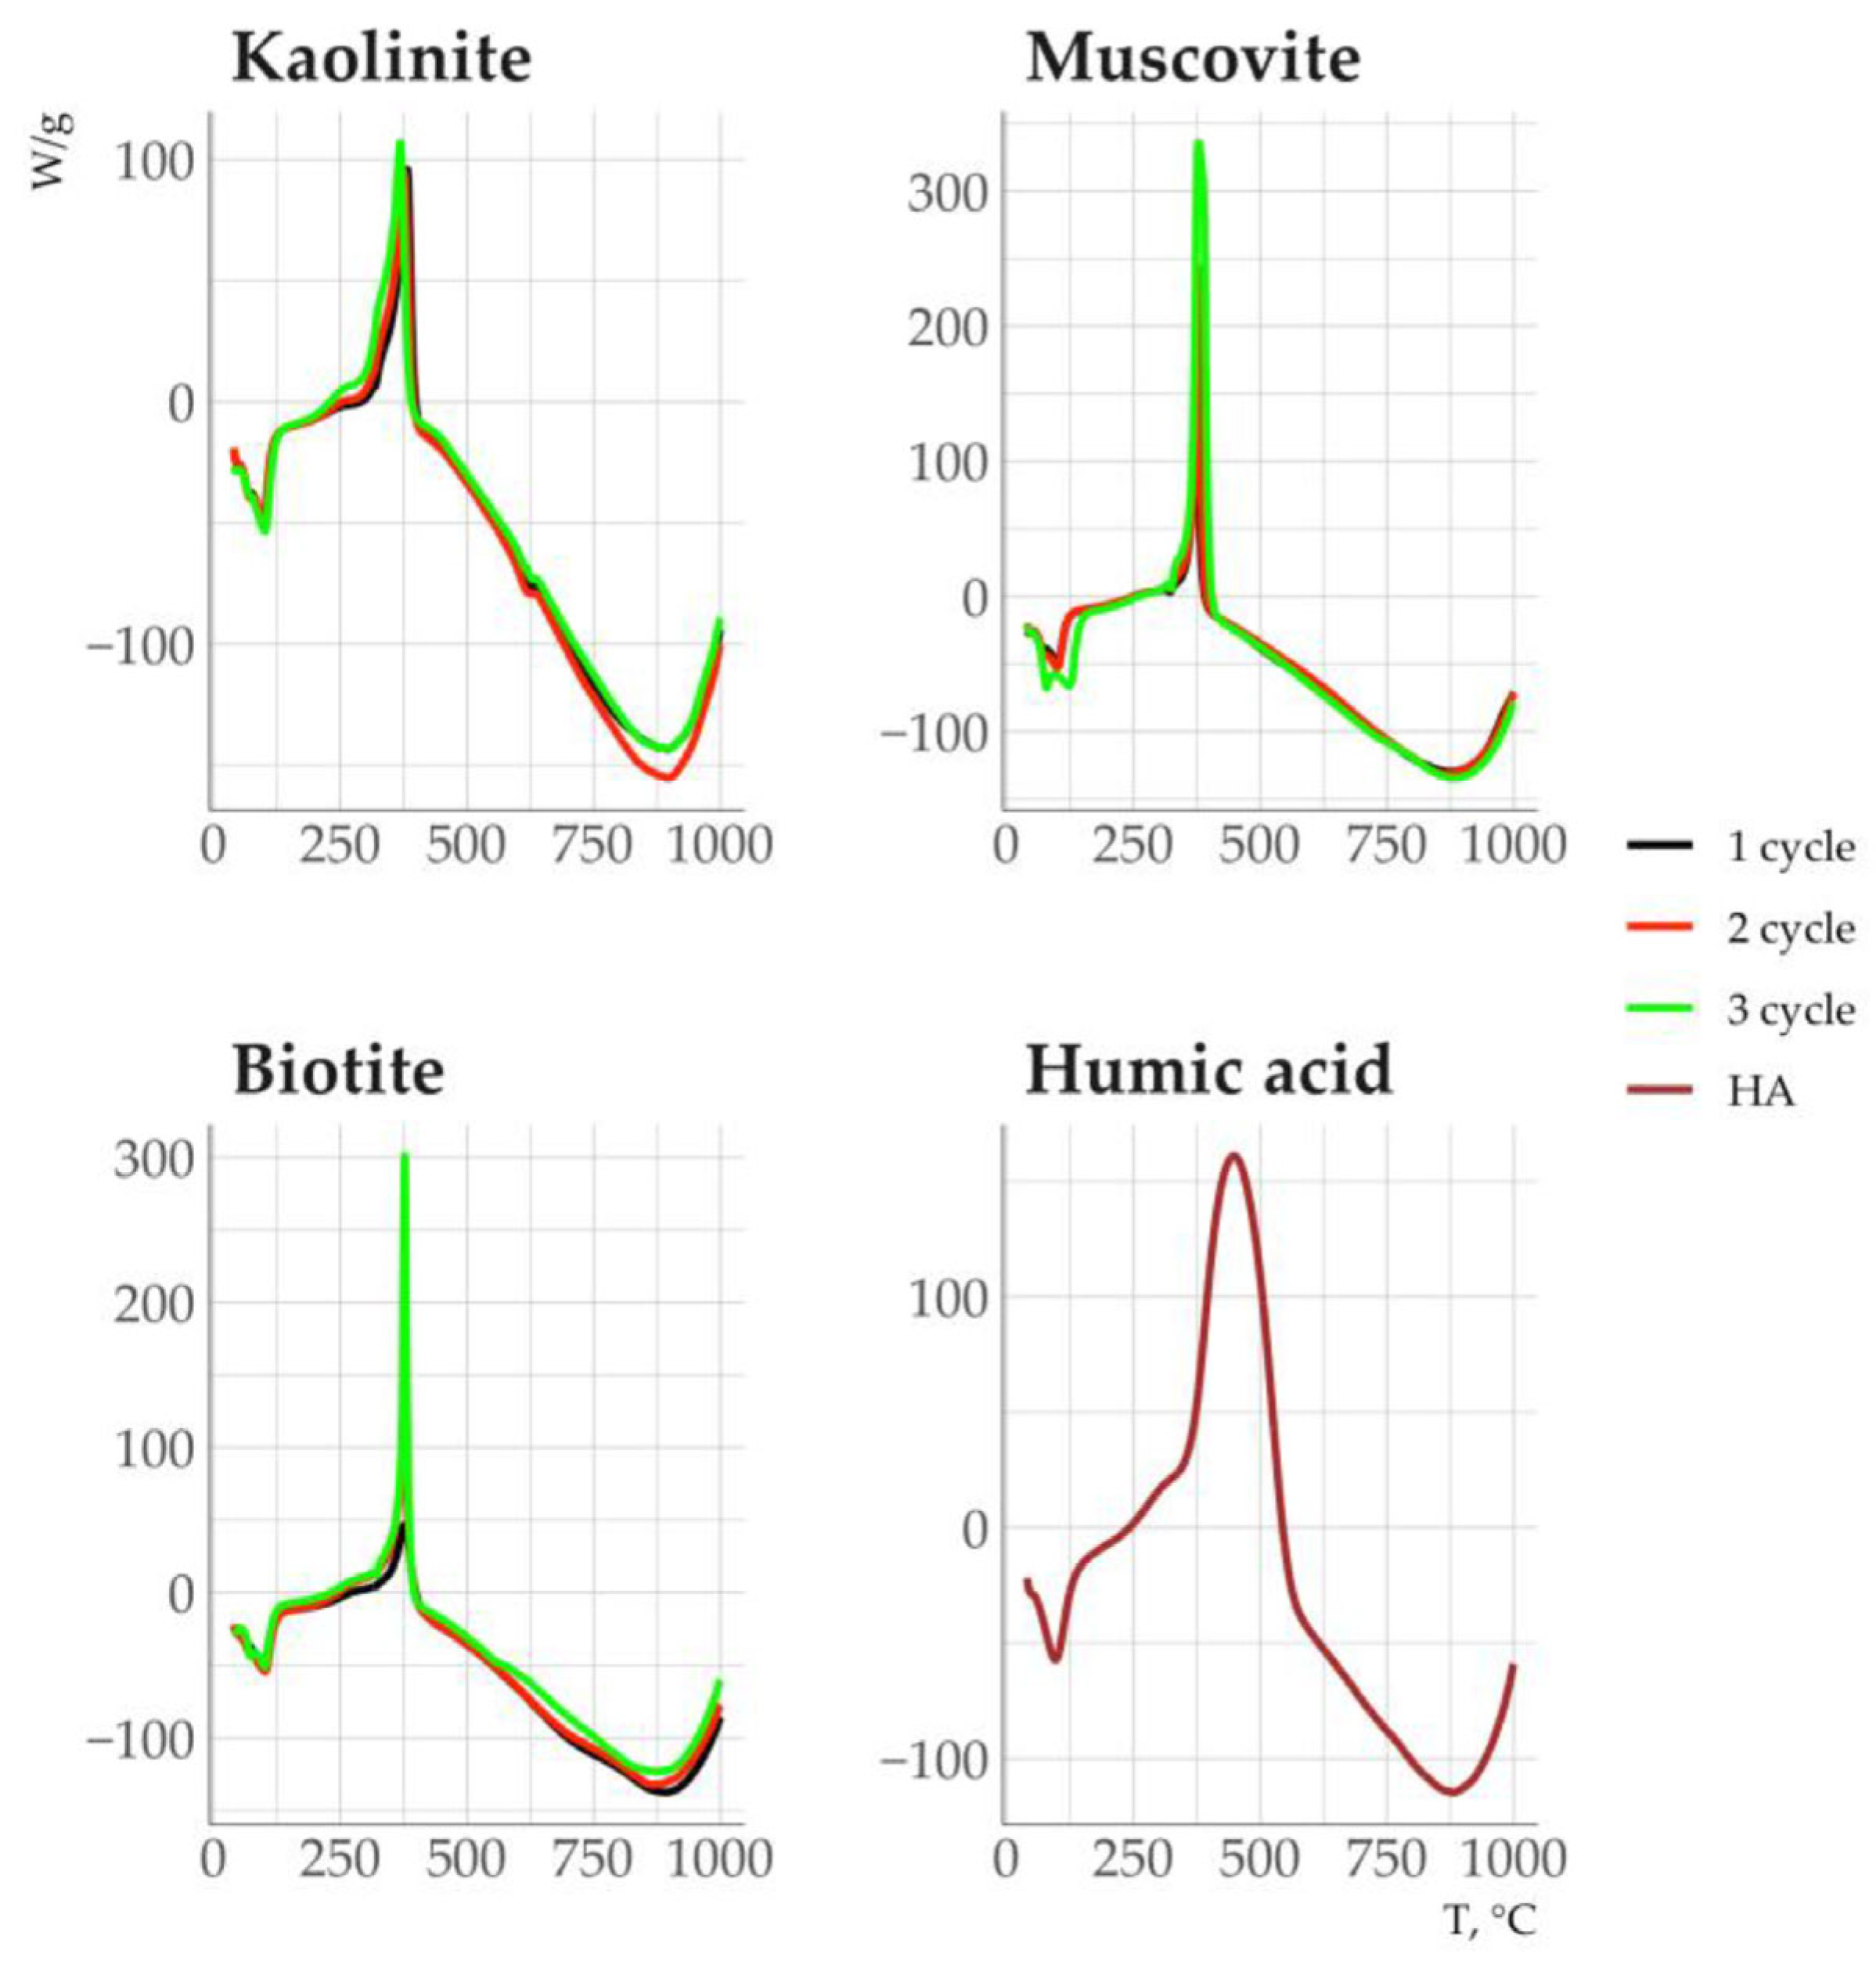
3.5. Properties of Clay Minerals Before and After Humic Acid Treatment

Kaolin clay, which we will henceforth call kaolinite, contained small amounts of mica with d {001} 1.01 nm (Figure 9). The diffraction pattern of muscovite clay showed weak peaks from kaolinite (0.72 nm), quartz (0.426 nm), and feldspars (0.322 nm) (Figure 9).
Treatment of minerals with a humic acid (HA) solution resulted in new absorption bands in the DRIFT spectra of minerals in the 1000–1100 and 1500–1800 cm−1 ranges. These bands were also the most intense absorption bands of the spectrum of the original humic acid (Figure 10). The absorption bands in these ranges corresponded to the carbohydrate (1000–1100 cm−1), aromatic (1500–1600 cm−1), and carboxyl components (1700–1800 cm−1) of HA [39,40].
Clustering in the coordinates of the principal components of the absorption bands in the region of 1200–1900 cm−1, corresponding to the most intense absorption bands of the original HA (Figure 11), allowed us to reveal differences in the composition of the obtained organo-mineral complexes. Muscovite and biotite formed independent clusters: muscovite was discriminated by the intensity of the bands at 1212, 1240 (carboxyl, phenolic groups), and 1778–1897 cm−1 (carboxyl groups); biotite by the intensity of the bands at 1535–1594 cm−1 (aromatic compounds). The composition of HA sorbed on kaolinite was characterized by a decreased proportion of carboxyl groups and an increased proportion of aromatic (1666, 1692 cm−1) and aliphatic (1482 cm−1) components if the number of sorption cycles increased [39,40].
The DSC curve of the HA showed a weak endothermic effect at 100 °C and a broad, intense exothermic effect in the range from 350 to 600 °C with its maximum intensity at 450 °C (Figure 12). The DSC curves of organomineral complexes showed an asymmetric exothermic effect (Figure 12) with peaks at 360 and 380 °C after the first and subsequent cycles of HA sorption in the temperature range of 300–400 °C.
The most effective sorbent in relation to HA was kaolinite. Biotite and muscovite did not differ significantly in HA sorption efficiency in terms of mass (Table 3). Sorption of HA on minerals led to its fractionation by chemical composition. Sorption on biotite had little or no change in the C/N of humic acid. In contrast, the C/N ratio increased significantly after sorption on kaolinite and muscovite, indicating the depletion of sorbed HA in nitrogen compounds (Table 3). Moreover, fewer nitrogen-containing compounds were sorbed on kaolinite than on muscovite. Similar results were obtained in the sorption experiment with leonardite HA [41].

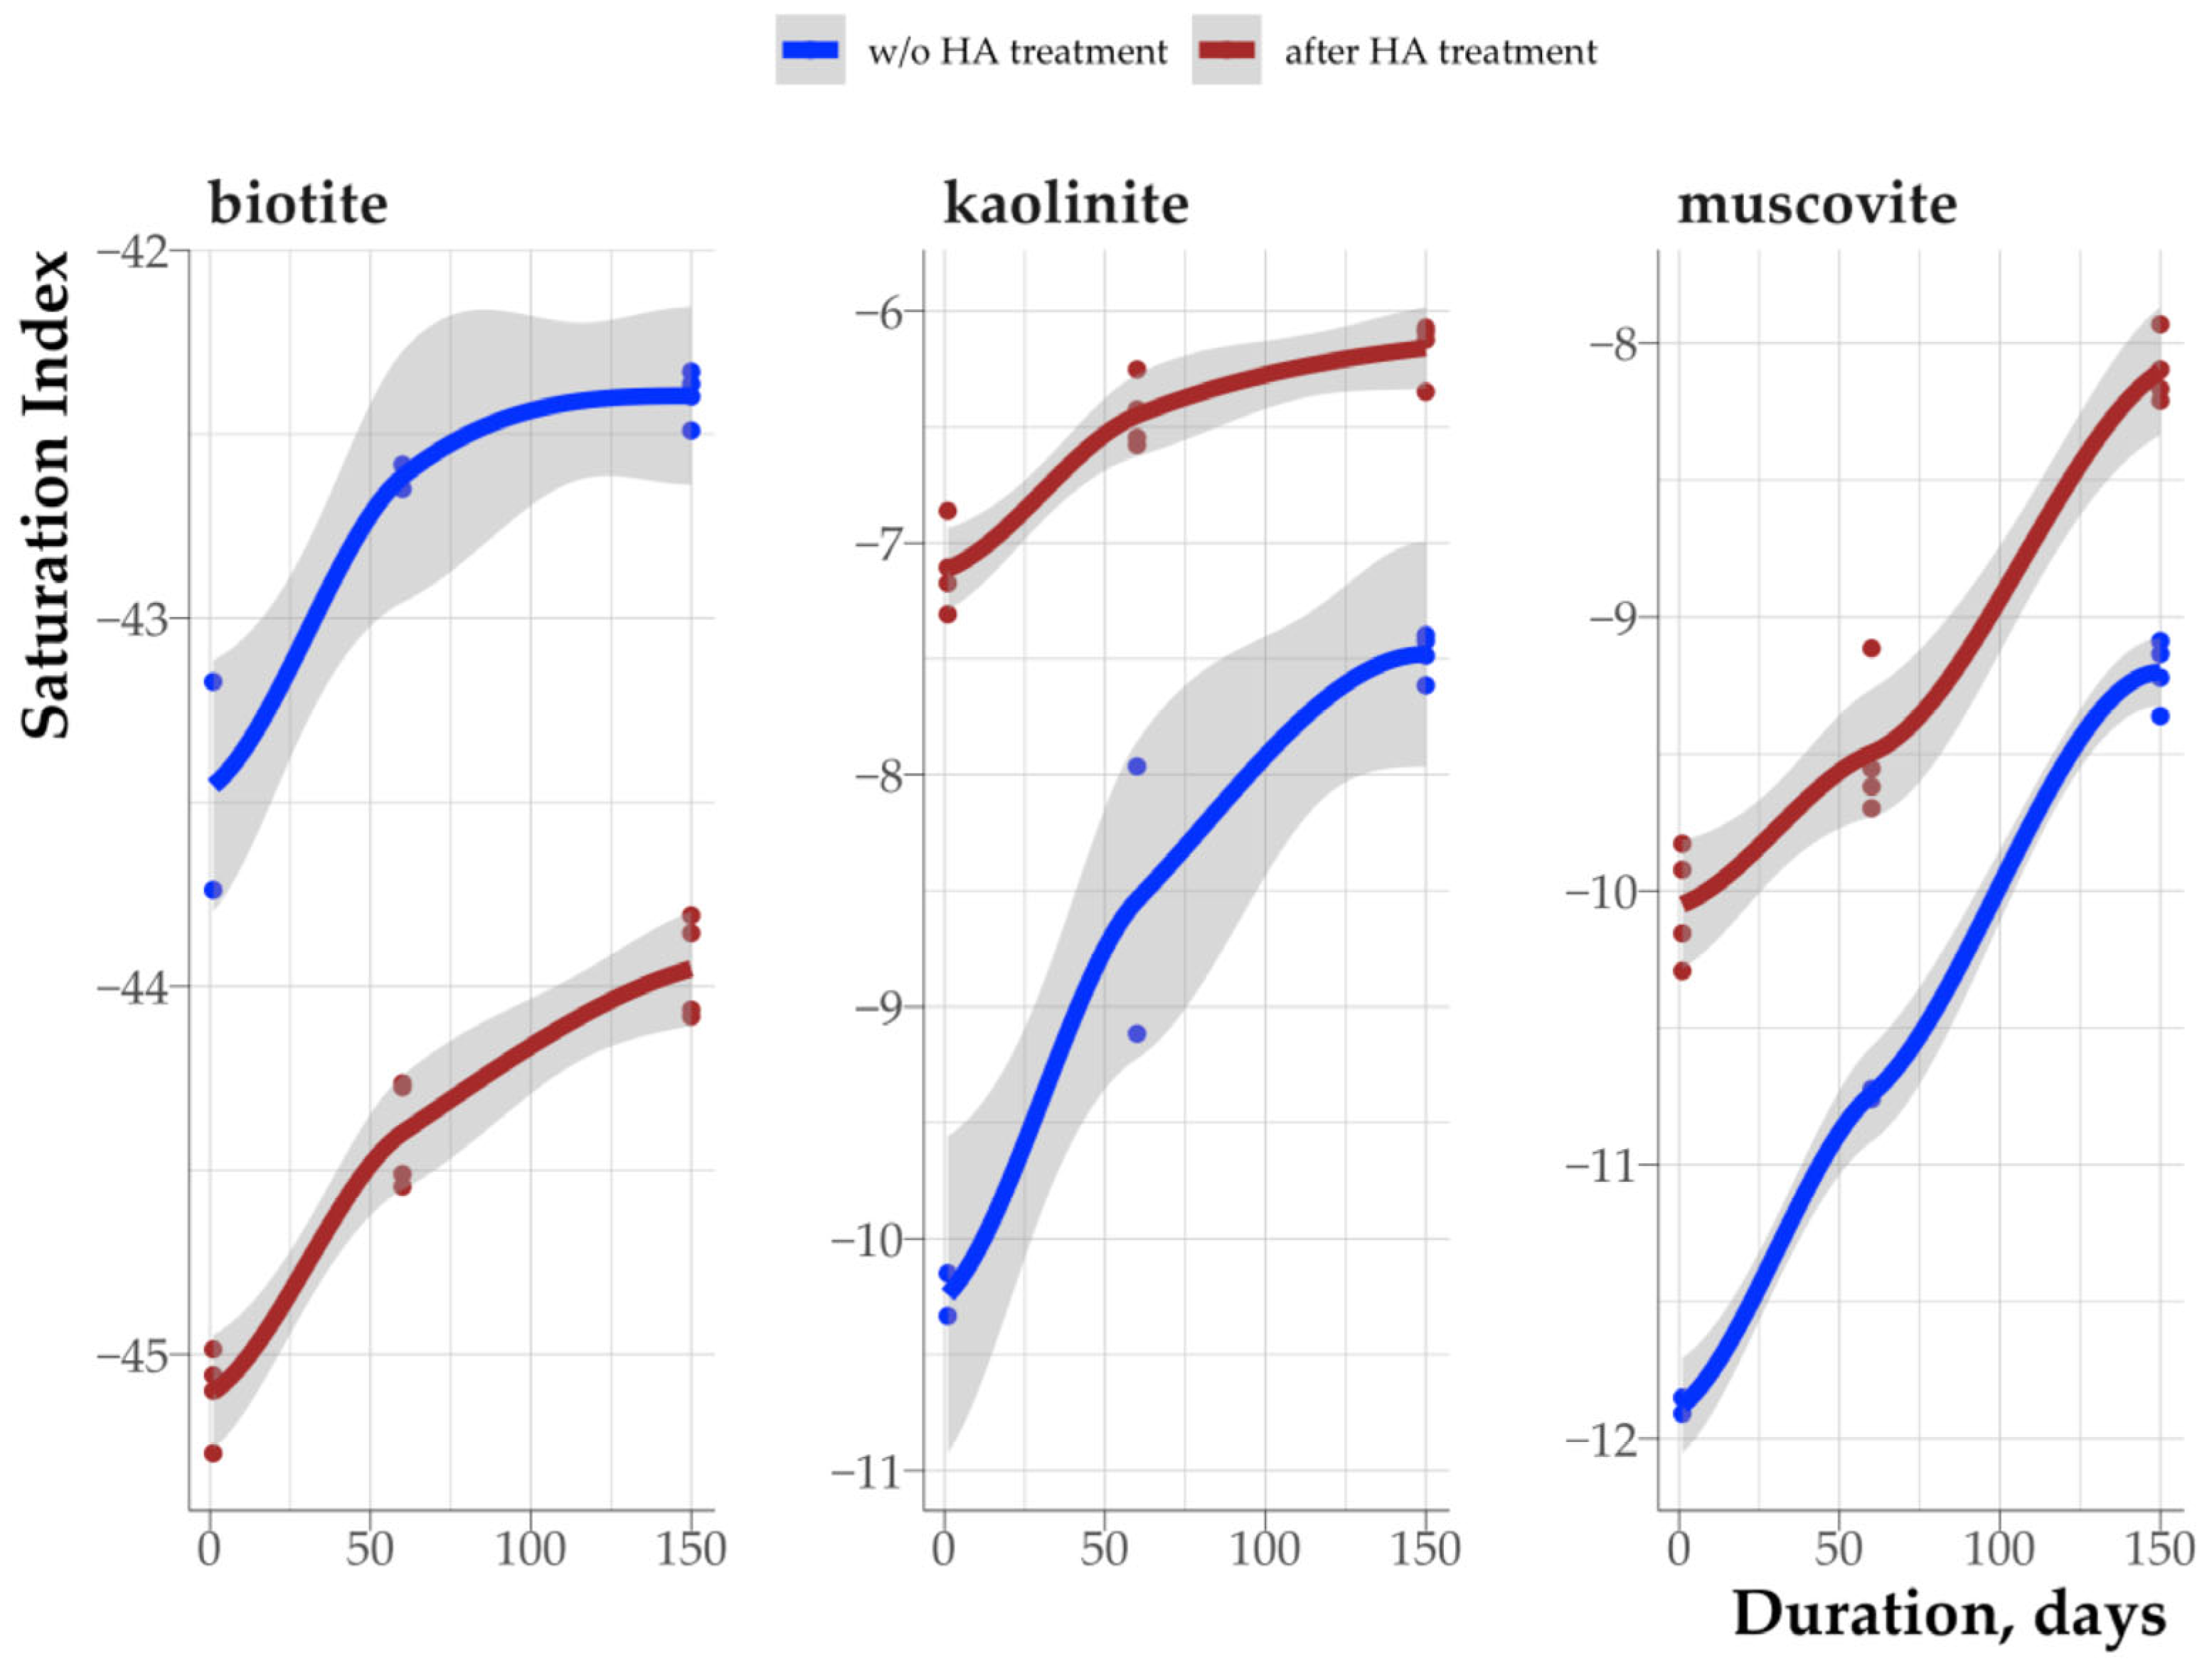
3.6. Effect of Humic Acid on Saturation Indices of Clay Minerals

The sorption of HA led to a significant change in the saturation index of all minerals. This indicates the influence of not only dissolved but also sorbed organic matter on the thermodynamic stability of soil minerals. According to thermodynamic stability under the model soil solution, the minerals were arranged in the series kaolinite > muscovite > biotite (Figure 13).

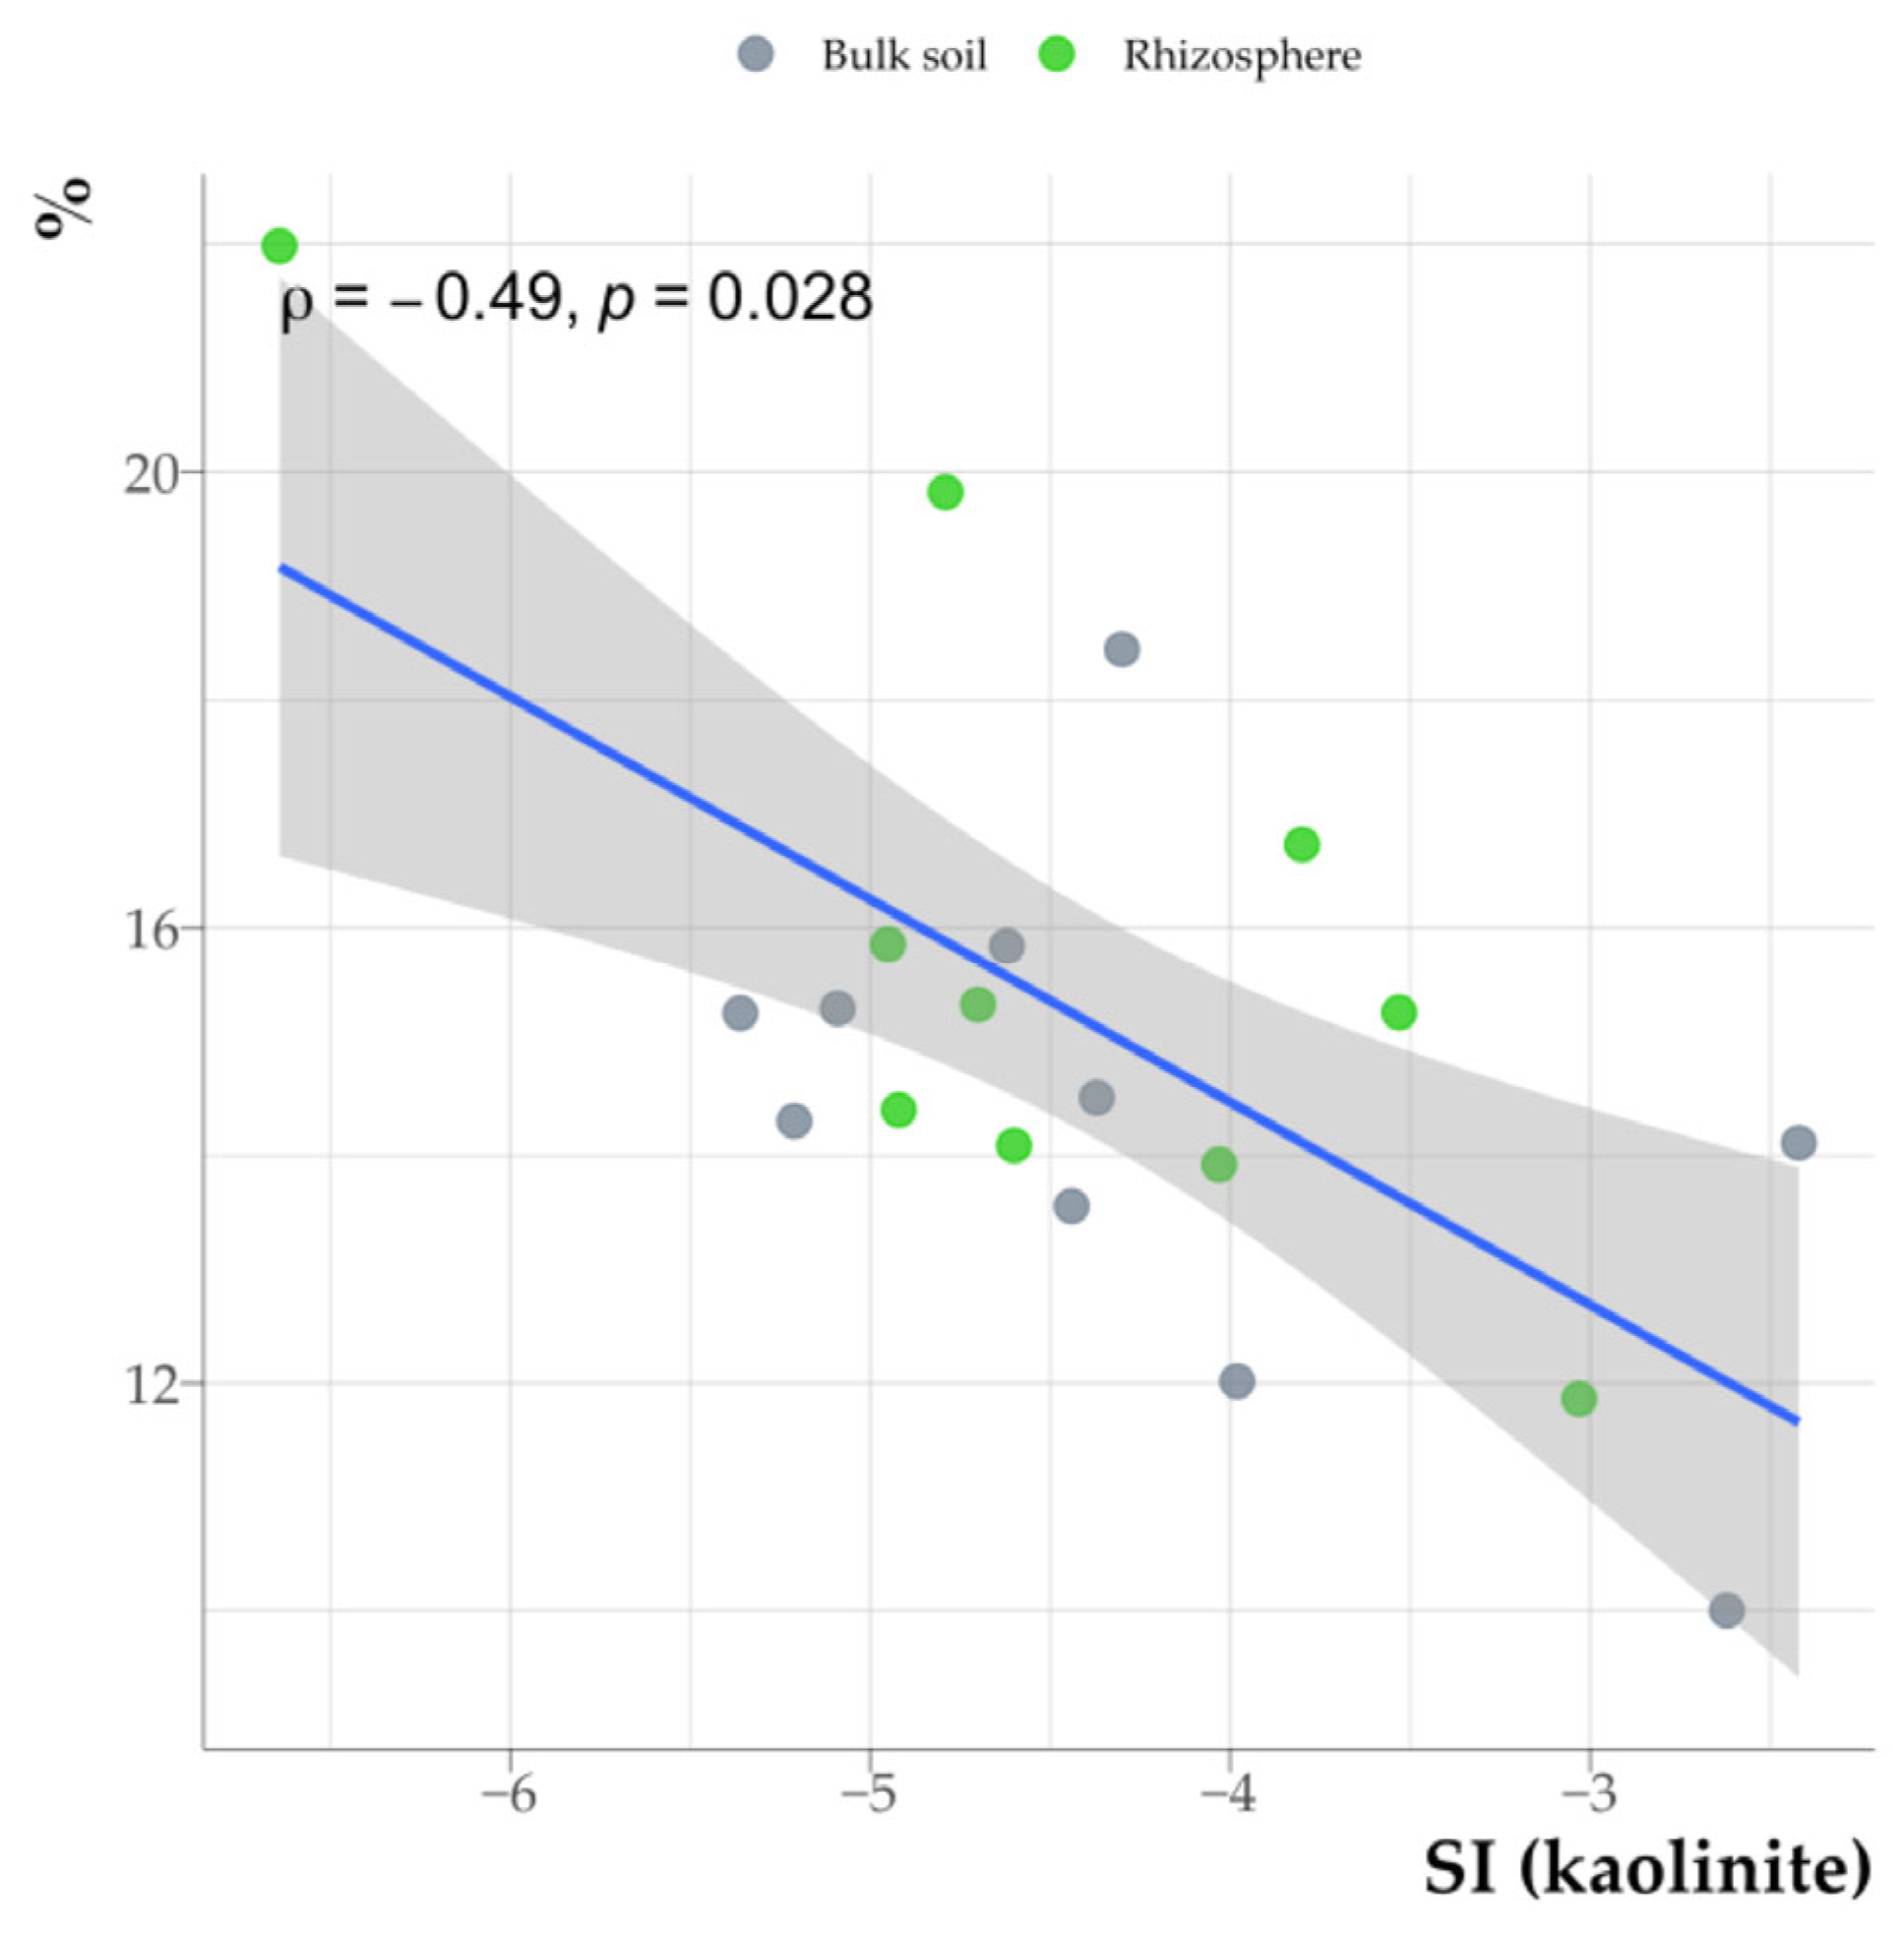
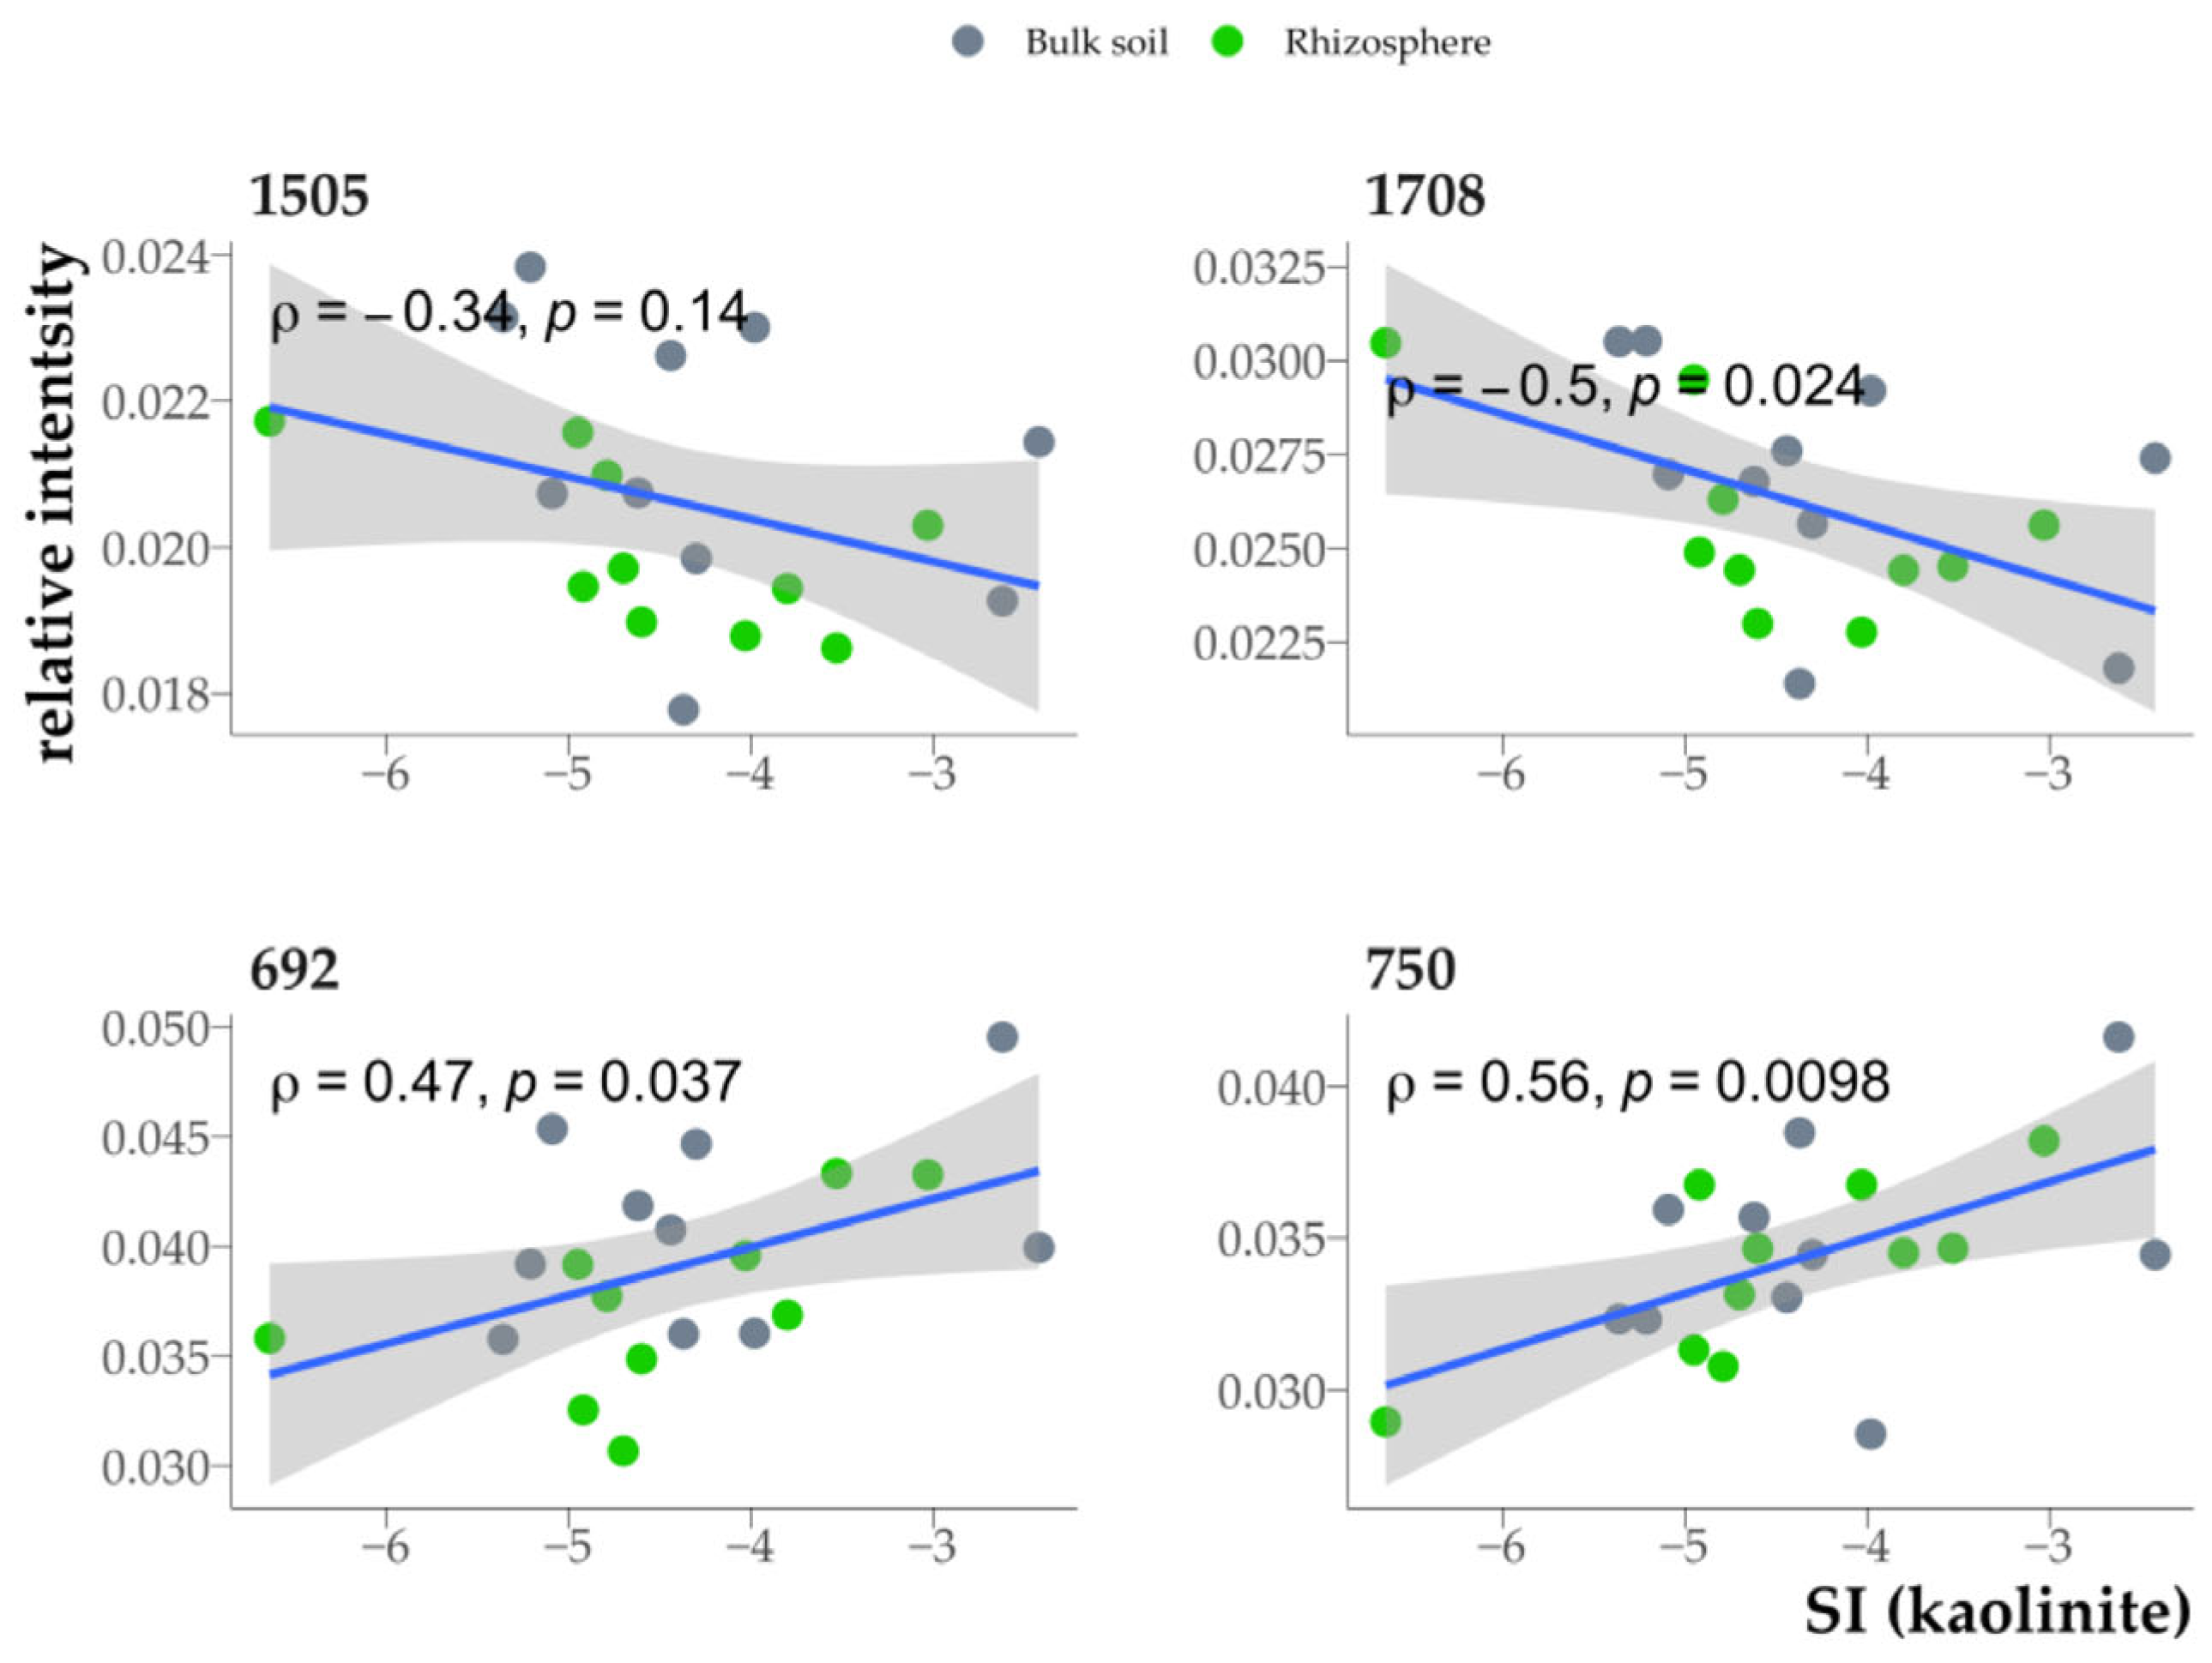
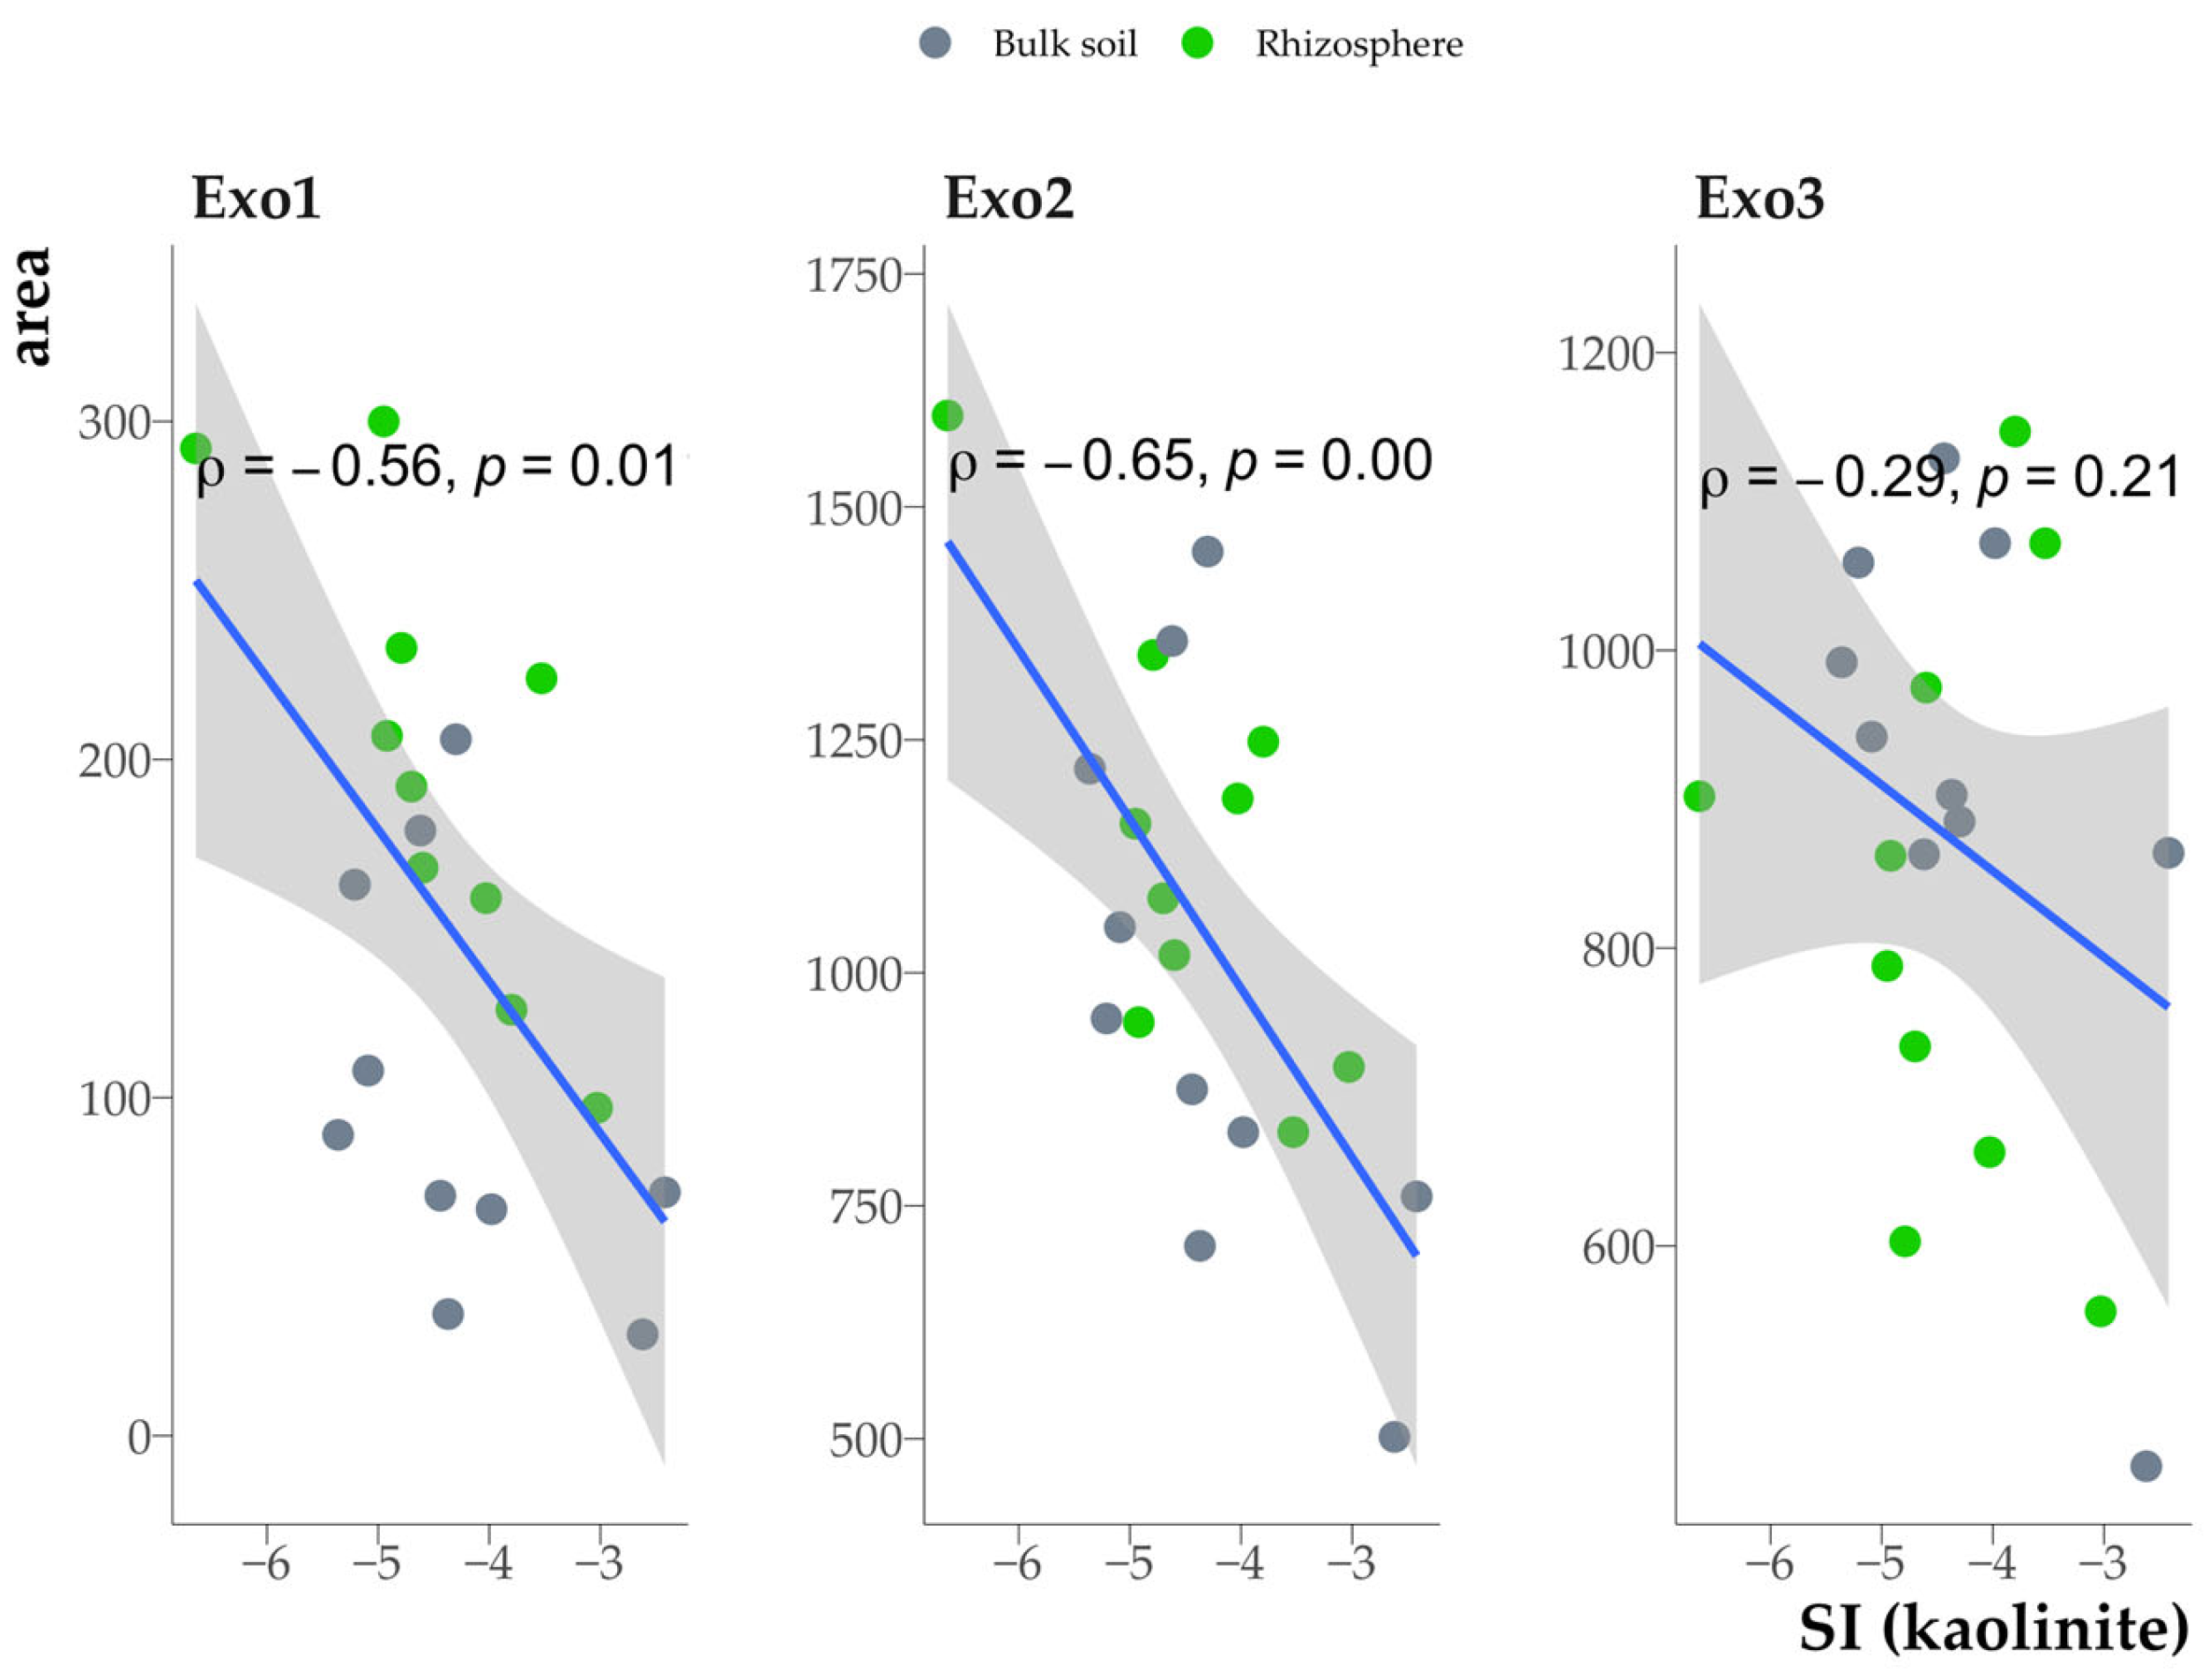
3.7. Relationship Between Organic Matter Properties in the Clay Fraction and Clay Mineral Saturation Indices

A weak negative correlation was found between mineral saturation indices and the organic matter carbon content in the clay fraction (Figure 14).
The chemical composition of SOM also had a significant but relatively weak effect on the saturation indices of clay minerals. A positive correlation between the saturation indices and the absorption bands in the DRIFT spectra was observed for the bands at 692–750 cm−1 and a negative one for the bands at 1505 (C=C of aromatic rings) and 1708 (carboxyl bond) cm−1 (Figure 15).
The mineral saturation indices were negatively correlated with the area of the exothermic effects Exo1 and Exo2 (Figure 16).

4. Discussion

4.1. Transformation of Clay Minerals in the Rhizosphere According to XRD Data

The diffraction patterns of the clay fraction samples from the Acer platanoides rhizosphere (replicates 2–5) and the bulk soil under Acer platanoides (replicates 2–5), calcined at 350 °C, showed diffuse scattering, corresponding to d/n from 1.4 nm to 1.0 nm (sometimes with small maxima in the region of 1.2–1.3 nm). This indicates incomplete compression of the crystal lattices of vermiculite to 1.0 nm (Figure 17a) [42]. Yet samples of soil under Picea abies show incomplete compression of vermiculite as an asymmetry of the 1.0 nm peak. The described changes in the diffraction patterns of the samples after calcination at 350 °C indicate the presence of HIV of higher aluminization [31] in the clay fraction from the soil under Acer platanoides compared with the soil under Picea abies.
The main factors controlling the degree of aluminization of HIV are the acid–base properties of the soils and the concentration of low-molecular-weight organic acids (LMWOAs) [43,44,45,46]. It is known that the rhizosphere of coniferous trees is characterized by higher acidity compared to the rhizosphere of broad-leaved trees due to more intensive release of LMWOAs [47,48,49,50], which makes the polymerization of aluminum aquahydroxocomplexes more difficult. Thus, the rhizosphere of Acer platanoides and the soil under Acer platanoides create more favorable acid–base conditions for aluminization compared to the soil under Picea abies.
The origin of HIV is associated with two possible mechanisms: aggradation (synthesis of fragments of an additional octahedral sheet in the interlayer space of vermiculites and smectites) and degradation (destruction of the additional octahedral sheet of chlorites) [51,52,53]. The calculated ΔG value of the reaction of HIV formation from illite or vermiculite is negative, which confirms the aggradation theory of their formation under the considered conditions.
Deconvolution of the X-ray diffraction region of ethylene glycol-saturated clay fractions in the range from 5°2θ to 9.5°2θ allowed us to identify four regions with peak maxima corresponding approximately to 1.35, 1.24, 1.13, and 1.01 nm (Figure 18). The peak at 1.35 nm corresponds to the reflection of vermiculite group minerals: 1.01 nm corresponds to the reflection {001} of illite and micas, and the rest correspond to mixed-layer illite–vermiculites. Significant differences between the rhizosphere and the bulk soil were found only for Picea abies and the peak area of approx. 1.35 nm (Figure 18), which may indicate a deeper degree of transformation of illite into vermiculite in the Picea abies rhizosphere compared to the Acer platanoides rhizosphere due to a more acidic medium in the Picea’s rhizosphere [7,54,55]. At the same time, a corresponding increase in the sum of the peak areas of 1.24 and 1.13 nm was not observed, and the position of the peaks did not shift (Figure 18).
It is well-known that clay minerals in soil have lithogenic (inherited from parent material) or pedogenic (neoformed during the pedogenesic phase) origin. All clay minerals of interest in our study exhibited the ability to dissolve in the AE horizon of podzolic soil, as all calculated SIs were < 0 (Table 2). Yet this fact alone does not prohibit clay minerals from constituting a soil clay fraction, as the dissolution rate of clay minerals is quite slow [56]. The most abundant component of the clay fraction is kaolinite, which is also the most stable according to SI (Table 2). We believe that the kaolinite of the podzolic soil cannot be crystallized in situ as its SI <0 prevents kaolinite from precipitation. The same is true for illite and chlorite. Yet, the reaction of the illite transformation to kaolinite [57] is thermodynamically possible according to our calculations (ΔG is about −300 kcal/mol). However, this process would lead to the formation of mixed-layered kaolinite–illite, which is absent in the studied soil according to XRD patterns (Figure 1 and Figure 2). There are also reports mentioning kaolinite and illite as constituents of the parent material of Central Russian Upland podzolic soils [58]. It is also known that kaolinite can be formed from almost all primary minerals [59], but its synthesis in the soil requires appropriate conditions, which are created only in Oxysols and Ultisols, while, in Cryalfs and Udalfs, its distribution is generally uniform with depth [60], suggesting inheritance from the parent material. Another confirmation that the kaolinite in the studied soil horizon is inherited from the soil-forming material can be the absence of this mineral in the fraction <0.02 µm [61]. Previously, we found that, in soil solutions isolated from the AE horizon of podzolic soils using vacuum lysimeters, more than 90% of the aluminum is in complexes with humic acids [26], which obviously prevents the synthesis of kaolinite from the soil solution.
Vermiculite can be a product of the pedogenic transformation of trioctahedral micas [62] as the composition of its octaedrical sheet is enriched with Mg. Unfortunately, we can not distinguish di- or trioctaedrical minerals by analyzing {060} their peaks as we can for more gomogenuous mineral compositions that require a soil clay fraction in a complex mix of predominantly mixed-layered minerals.

4.2. The Impact of Rhizosphere Processes on the Saturation Index of Clay Minerals

According to the calculated saturation indices (Table 2), rhizosphere processes can lead to a reduction (of 0.2–0.5 units) in the thermodynamic stability of clay minerals. The main chemical factors affecting mineral weathering in soils are the pH of the liquid phase and the composition of dissolved organic matter [14,49,63,64]. The change in the pH of the equilibrium liquid phase (see Table A1 in the Appendix A) generally corresponds to the change in the SI values: the rhizosphere and the bulk soil of Picea abies are characterized by lower pH values, which is reflected in the reduction in the SI values.
The differences in SI are more pronounced (but not significant possibly due to small sample size) for plant communities (Acer platanoides and Picea abies) than for soil loci (rhizosphere and bulk soil), which may indicate the influence of the plant and its litter on mineral transformation at a relatively large distance from the root surface (20–30 mm), as well as the leading role of the environmental response.
According to the calculated ΔG values of vermiculite and illite (Table 1), the ΔG of the illite vermiculitization is approximately 1650 kcal/mol (calculations were made according to the algorithm described in [65]). Thus, the transformation of illite into vermiculite in podzolic soil requires a significant amount of energy. Soil biota (plants and microorganisms) can overcome this energy barrier by releasing LMWOAs into the soil solution (Canarini et al., 2019) [66]. Yet, it is worth mentioning that, in our study, illite has a lithogenic origin, and vermiculite has at least partially a pedogenic origin, which can lead to misinterpretation of the calculated ΔG. Another possible path for illite to transform due to the loss of potassium induced by soil biota is to transform into HIV [57]. The ΔG of this reaction is approximately 150 kcal/mol according to the thermodynamic characteristics of HIV reported in the literature [33]. The value of 150 kcal/mol is close enough to 0 kcal/mol, considering the approximate nature of our calculations. Therefore, the transformation of illite into HIV can be, in fact, spontaneous if the potassium activity is low enough. On the contrary, during periods of high potassium supply, the biogenic transformation of micas into vermiculite is likely to be significantly suppressed.
Since the dissolution of micas requires high energy expenditure by the plant [66], under conditions of optimal potassium supply for plants, the intensity of illite weathering may decrease due to a lower amount of exudates released. If the weathering of illite and micas in the rhizosphere is slowed under conditions of optimal potassium supply to the soil under Picea abies, it may be comparable to the intensity of weathering of micas in the Acer platanoides rhizosphere.

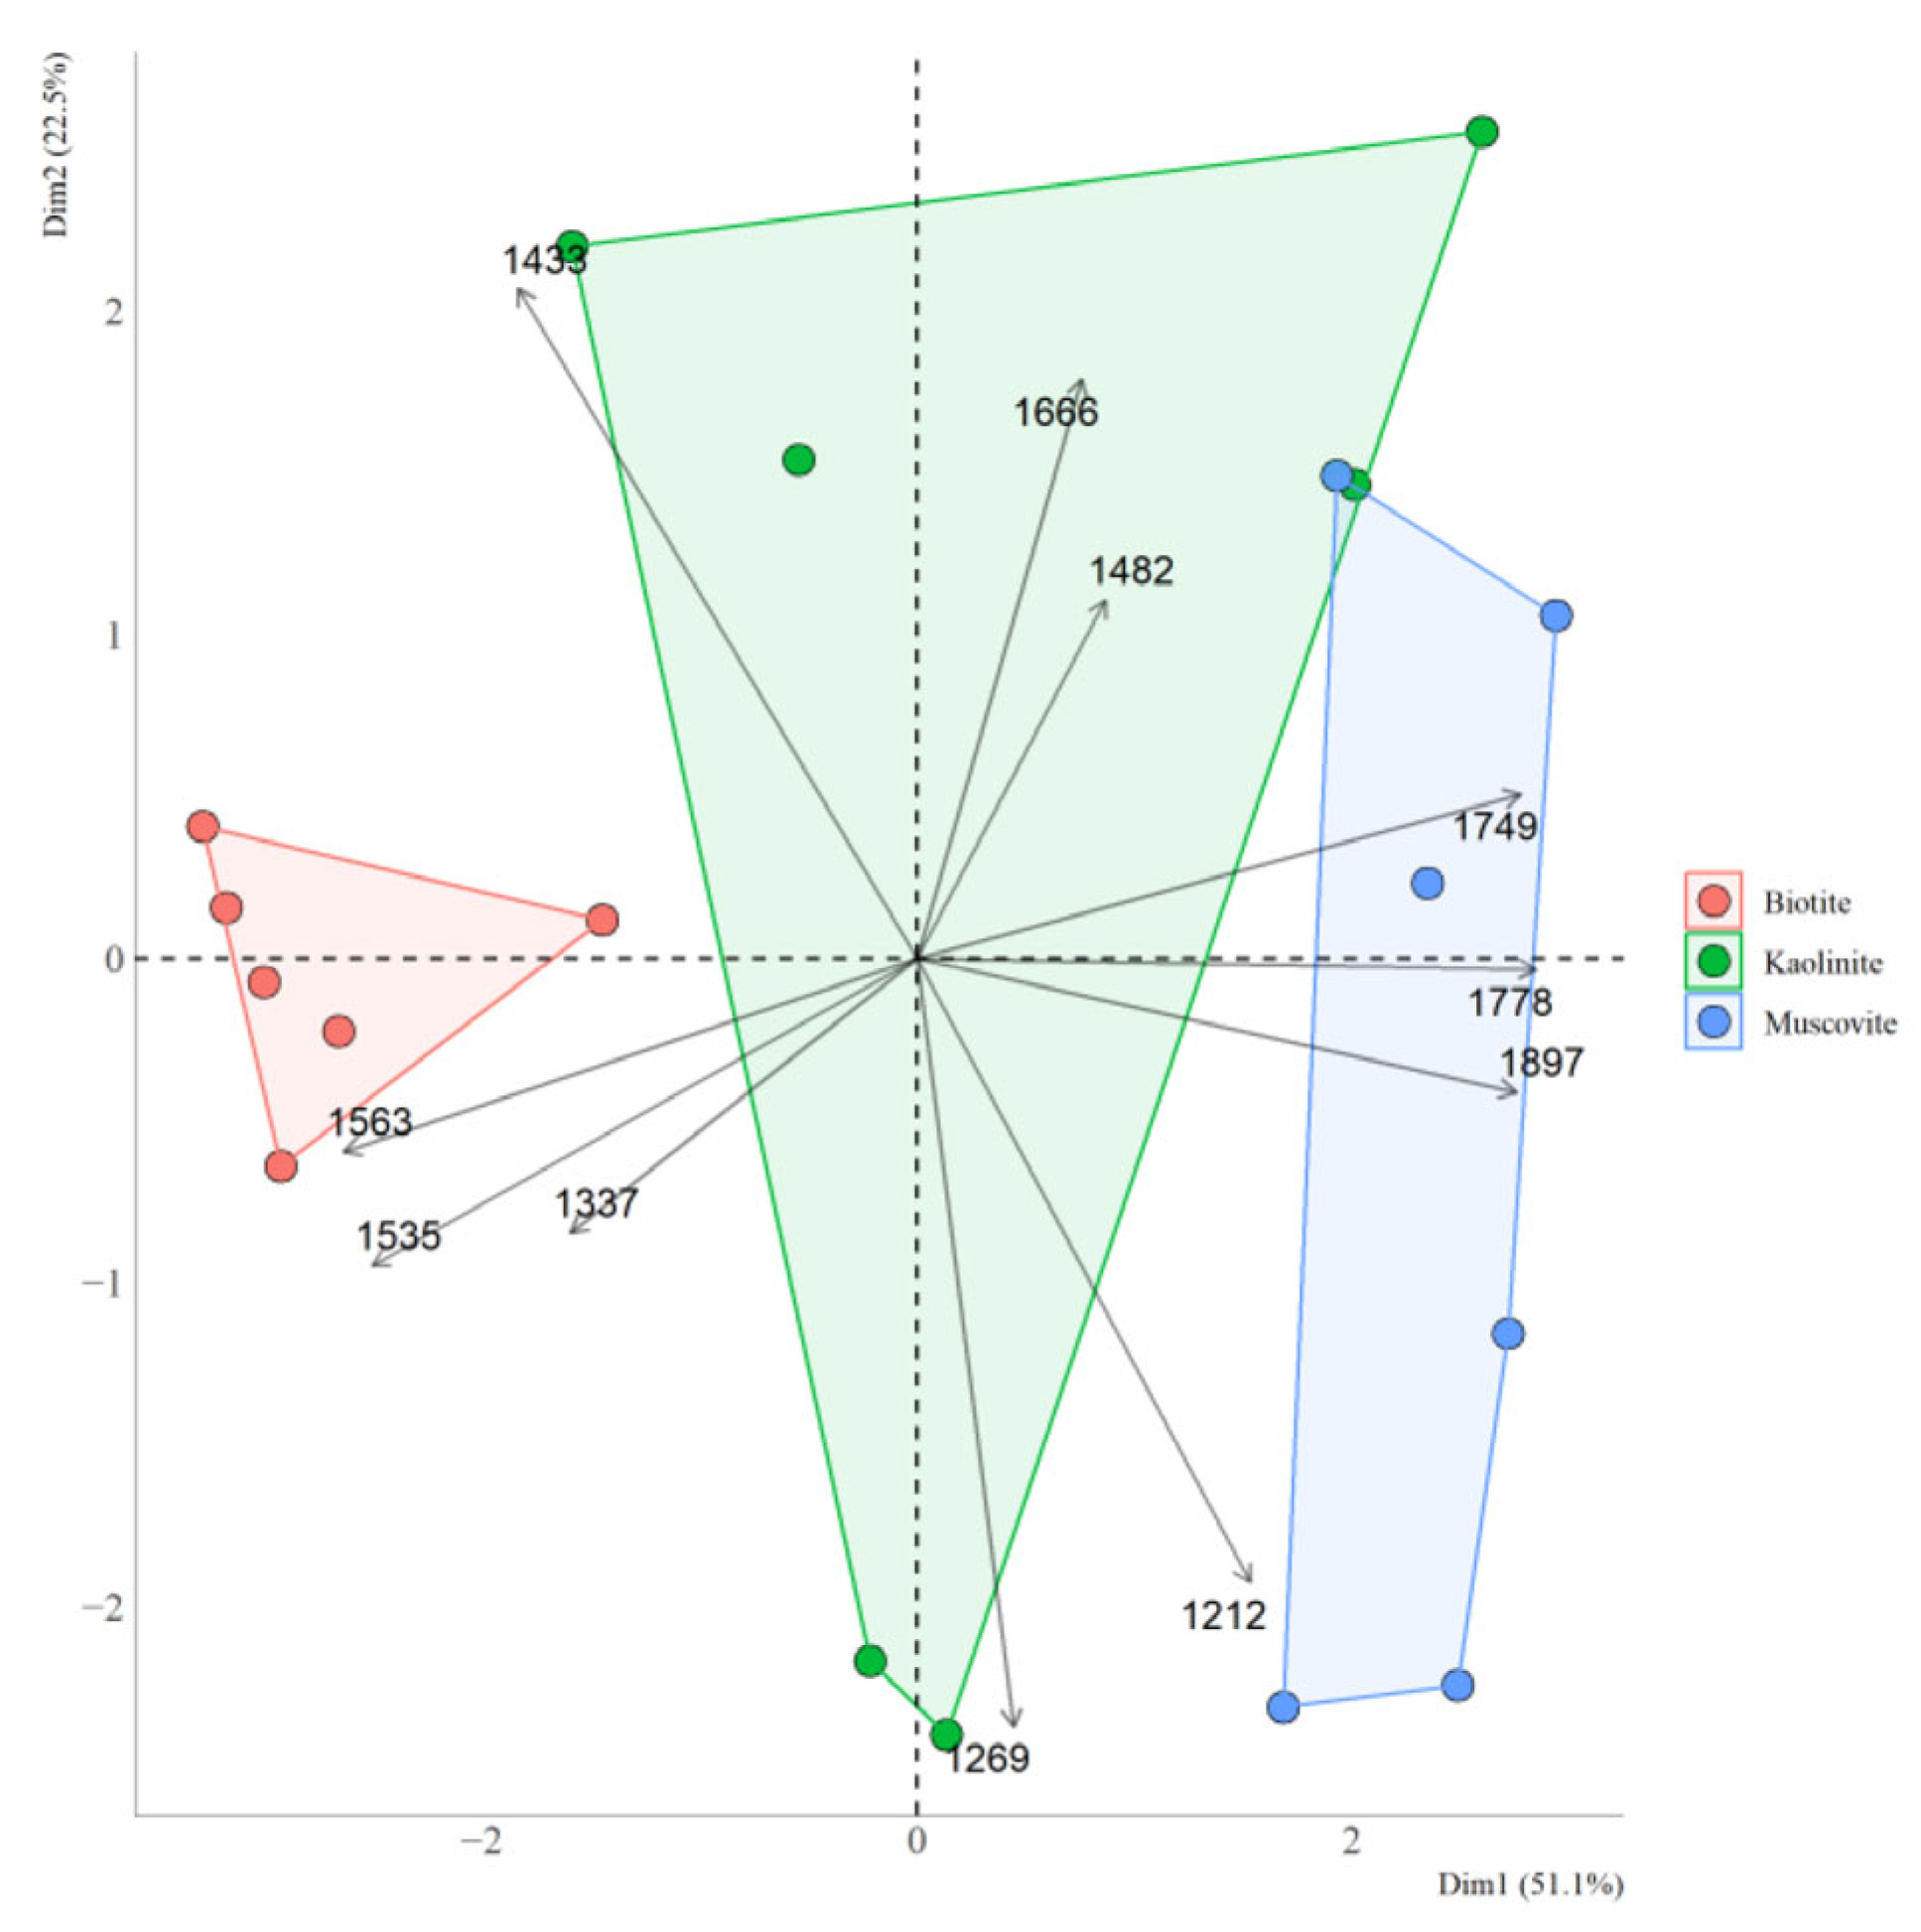
4.3. Dependence of Humic Acid Composition on Sorption in Different Minerals

In the case of muscovite and biotite, the sorption cycles of HA mainly affected the intensity of the DRIFT spectra bands, but the chemical composition of the sorbed HA did not change significantly from the first to the third sorption cycle. This indicates that the sorption of HA on mineral sorption sites is predominant in all sorption cycles, while a change in the composition of sorbed HA could indicate the appearance of new active sorption centers due to multilayer sorption. The chemical composition of HA sorbed on kaolinite varied significantly between sorption cycles (Figure 11), indicating the possible occurrence of multilayer sorption [67,68,69,70].
The reasons for the more effective sorption of HA on kaolinite compared to micas are related to the experimental conditions (pH of the sorbate solution is 4.5), where HA was sorbed mainly due to hydrophobic bonds, while pHpzc of kaolinite is about 5.5 [56,69].
The identified patterns of HA sorption may be related to selective sorption of relatively thermolabile HA components. According to TG50 (the temperature of 50% mass loss) and DSC50 (the temperature of 50% energy release), the thermal stability of HA sorbed on minerals decreased in the series muscovite > biotite > kaolinite (Table 3). This phenomenon is associated with the chemical composition of the sorbed OM [68,69,70] and, possibly, its conformation on the mineral surface [70]. Muscovite and biotite sorb mainly HA components on their surface, which are resistant to thermal destruction and enriched in carboxyl and aromatic groups. In addition, kaolinite actively sorbs aliphatic and, presumably, carbohydrate components of HA, which are characterized by lower thermal stability.

4.4. Impact of Sorbed Organic Matter on the Thermodynamic Stability of Clay Minerals

The impact of sorbed organic matter on the thermodynamic stability of clay minerals can involve two mechanisms with opposite actions. Sorption of organic matter can lead to partial destruction of the mineral crystal lattice, resulting in the increased rate of mineral dissolution [71,72]. Additionally, in the absence of solution outflow, the ionic product of the activities by the cation components of the crystal lattice increases, which, in turn, leads to increased SI. In the case of unsaturated solutions in contact with minerals, an increase in SI signifies an approach to equilibrium, corresponding to a SI value of 0. This pattern was observed in kaolinite and muscovite (Figure 13): treatment with an HA solution resulted in an increase in SI by 1–3 units. The difference between the initial mineral and the organo-mineral complex is at its maximum at the initial stages of incubation and diminishes with increasing incubation time. Furthermore, the sorption of HA on kaolinite can result in a reduction in the dehydroxylation temperature, suggesting partial destruction of the crystal lattice [41].
The second mechanism consists of partial or complete isolation of the mineral surface from the contacting solution by a layer of sorbed organic matter [72]. This layer hinders the transition of ions from the crystal lattice into the solution. As a result, there is a reduction in the ionic product of activities compared to the untreated HA solution of the mineral. Consequently, there is a reduction in the SI. In this scenario, the mineral following organic matter sorption is further from equilibrium compared to the pure mineral. This variant corresponds to the experiment with biotite (Figure 13), where the sorption of HA led to a reduction in the SI by approximately 2 units.
The thermodynamic stability of kaolinite and muscovite increased following the sorption of HA, as the treatment with the HA solution may have led to the partial dissolution of the least stable crystallites. Thus, the enhanced thermodynamic stability of minerals should be expected in both the rhizosphere and the bulk soil following the sorption of humic substances with a weak moisture outflow.
The impact of water-soluble HA in the incubation solution on the saturation indices can be neglected, as the method for obtaining organomineral complexes involved a complete removal of water-extractable HA at a pH = 6.5. Furthermore, the solubility of HA in water at pH = 4.5, corresponding to the incubation experiment conditions, is minimal. This does not guarantee the complete absence of complexation reactions in the liquid phase, but it significantly reduces their possible contribution to the change in ion activity.
The change in the thermodynamic stability of minerals was not affected by HA fractionation in terms of chemical and thermal properties due to sorption. Thus, the thermodynamic stability of minerals can be mostly affected by the conformation of HA on the mineral surface, as evidenced by the model experiment. The single- and multi-layer sorption of HA (in the case of muscovite and kaolinite, respectively) has a similar effect on the SI of the mineral (it increases after sorption of HA) and does not affect the rate of achieving equilibrium compared to the original mineral. A decrease in the thermodynamic stability of biotite may be associated with the formation of an insulating layer of HA on the surface of the mineral, held by bonds with Fe of the crystal lattice. It is known that humic substances form a strong bond with Fe [73,74]. This layer complicates the transition of biotite dissolution products into the solution, leading to a decrease in the SI compared to the original mineral [72]. Therefore, the main difference between biotite and the rest minerals is the strong affinity of sorbed HA to biotite’s structural Fe [75,76].

4.5. Relationship Between the Organic Matter Properties of Clay Fractions from Soil and Rhizosphere and Saturation Indices of Clay Minerals

The findings of the incubation experiment demonstrated that the sorption of HA increased the thermodynamic stability of kaolinite and muscovite (Figure 13), thereby contradicting the previously revealed negative correlation between the mineral saturation indices and the carbon content in the clay fraction. The relatively modest correlation coefficient, ρ = −0.49, suggests the presence of other factors influencing the mineral saturation indices beyond the organic carbon content. The increased saturation index with decreased organic carbon content may be associated with an increase in microbial activity, leading not only to an intensification of mineral weathering but also to the mineralization of organic matter [77,78,79].
The negative correlation between SI and the 1708 cm−1 band is consistent with the results of the incubation experiment, which revealed that sorption involving carboxyl groups in the HA composition led to a decrease in SI due to partial destruction of the mineral crystal lattice. However, the intensity of other bands corresponding to vibrations of the carboxyl bond did not correlate with SI. This finding suggests that the 1708 cm−1 band may be specifically linked to carboxyl groups present within the sorbed organic matter. The negative correlation between SI and the 1505 cm−1 band can be related to the thermodynamic stability of minerals indirectly through microbial activity, as more active humification leads to the partial dissolution of minerals [70,80].
The band at 750 cm−1 is associated with polyaromatic compounds [33]. Positive correlation between SI and this band intensity is consistent with the increase in SI during the sorption of aromatic components of HA on biotite in the incubation experiment (Figure 13). However, the relationship between the band at 692 cm−1 and the composition of soil organic matter has not yet been established and requires further research.
The thermal properties of the clay fraction SOM are associated with the chemical composition of SOM (Figure 8), yet they also offer insights into the strength of the SOM bond to the soil mineral matrix [81,82]. All three thermal effects (Exo1–Exo3) had similar compositions of functional groups (Figure 8). This suggests a potential correlation between the nature of these effects and the strength of the SOM bond to the soil mineral matrix (Exo1 is the least strongly bound fraction, and Exo3 is the most strongly bound SOM fraction). Consequently, the thermodynamic stability of minerals is reduced by the presence of relatively thermolabile SOM fractions. A similar pattern was observed for the total carbon content, which may be related to the accumulation of thermolabile compounds resulting from the increased activity of microorganisms. Furthermore, thermolabile SOM fractions can reduce the thermodynamic stability of minerals by isolating the mineral surface from the soil solution (see Section 3.6).

5. Conclusions

According to the experiment, the thermodynamic stability of clay minerals decreased in the series kaolinite > illite > vermiculite > chlorite. In the Picea abies rhizosphere, kaolinite, vermiculite, and illite had the lowest thermodynamic stabilities, while, in the soil under Acer platanoides, these minerals had the highest thermodynamic stabilities. This phenomenon can be explained by the differences in the properties of SOM (according to DRIFTS data) in the rhizospheres of different tree species. The SOM of the clay fraction from the rhizospheres of both species accumulated aliphatic compounds and carbohydrates characterized by relatively low thermal stability compared with the bulk soil. The sorption of humic acid of soil origin on clay minerals changed the thermodynamic stability of clay minerals: the thermodynamic stability of biotite decreased, while that of kaolinite and muscovite increased compared to minerals not treated with humic acid. Moreover, the thermodynamic stability of clay minerals decreased with an increased presence of thermolabile organic matter, which is presumably related to the transformation products of microbial necromass.
The results obtained in this study support the importance of rhizosphere analysis for understanding plant mineral nutrition and making accurate predictions about it. Further study of the thermodynamic stability of minerals in podzolic soils could lead to the creation of models that predict mineral saturation indices based on climatic factors and soil moisture distribution patterns in pores of different sizes.
The limitations of the obtained results are related to the inability to establish accurate chemical formulas for all mineral phases, as well as the application of the principles of equilibrium thermodynamics to assess the thermodynamic stability of minerals in a nonequilibrium system, such as soil. However, the proposed methodological approaches make it possible to establish differences in the thermodynamic stability of clay minerals between the rhizospheres of different tree species and the bulk soil and to assess the effect of organic matter on the minerals’ stabilities. The principles of equilibrium thermodynamics are also widely used in modern soil chemistry and make it possible to satisfactorily describe the chemical processes occurring in soils.

Author Contributions

Conceptualization, I.V.D. and I.I.T.; methodology, I.V.D., Y.G.I., and R.A.A.; validation, I.V.D. and I.I.T.; formal analysis, I.V.D.; investigation, I.V.D., Y.G.I., and R.A.A.; resources, I.I.T. and Y.G.I.; data curation, I.V.D.; writing—original draft preparation, I.V.D.; writing—review and editing, I.V.D. and I.I.T.; visualization, I.V.D.; supervision, I.I.T. All authors have read and agreed to the published version of the manuscript.

Funding

This research received no external funding.

Data Availability Statement

Data will be made available from the corresponding author upon request due to internal policy.

Acknowledgments

XRD analysis of samples was carried out using the equipment funded by the Development Program of the Lomonosov Moscow State University. The authors would like to thank Philippe Blanc for providing the ClayTherm program.

Conflicts of Interest

The authors declare no conflicts of interest.

Abbreviations

The following abbreviations are used in this manuscript:
XRDX-ray diffraction
HIVHydroxy-interlayered vermiculite
DRIFTSDiffuse reflectance infrared Fourier-transform spectroscopy
DSCDifferential scanning calorimetry
TGAThermogravimetry
HAHumic acid
SOMSoil organic matter
SISaturation index
LMWOALow-molecular weight organic acid

Appendix A

Table A1. Concentrations of metal cations (mg/L), pH, and total organic carbon (TOC) content (mg/L) of the water after different periods of interaction with soil (arithmetic mean, n = 2).
Duration, hpHAl3+Al3+
(pH = 1.0)
Fe2+K+Mg2+Ca2+Na+TOC
243.636.747.090.878.623.6412.192.52117.6
483.717.218.060.959.854.4316.412.60102.9
723.887.728.101.0210.064.9018.213.72107.3
1444.017.798.180.9310.135.0418.453.34264.7
2404.117.848.091.079.974.9318.393.53558.9
Table A2. Activities of metal cations and H4SiO4 (µmol/L) and pH of the equilibrium liquid phase (arithmetic mean ± standard deviation, n = 5).
SamplepHAl3+Ca2+Fe2+K+Mg2+Mn2+Na+H4SiO4
Rhizosphere (Picea)3.71 ± 0.10.15 ± 0.0210.36 ± 1.510.47 ± 0.06284.45 ± 23.757.26 ± 0.762.3 ± 0.74167.18 ± 31.12250.53 ± 86.44
Bulk soil (Picea)3.86 ± 0.10.25 ± 0.0213.35 ± 2.030.09 ± 0.01295.52 ± 99.09.01 ± 1.147.91 ± 1.16133.53 ± 24.63276.7 ± 42.63
Rhizosphere (Acer)3.94 ± 0.10.24 ± 0.0414.37 ± 2.560.03 ± 0.01236.09 ± 43.6311.18 ± 1.763.00 ± 0.29149.06 ± 54.68238.86 ± 65.07
Bulk soil (Acer)3.92 ± 0.20.33 ± 0.0515.3 ± 3.320.58 ± 0.19193.96 ± 49.6910.87 ± 2.46.46 ± 0.71103.6 ± 26.26239.01 ± 20.93

References

  1. Kittrick, J.A. Soil Minerals in the Al2O3-SiO2-H2O System and a Theory of Their Formation. Clays Clay Miner. 1969, 17, 157–167. [Google Scholar] [CrossRef]
  2. Nriagu, J.O. Thermochemical Approximations for Clay Minerals. Am. Mineral. 1975, 60, 834–839. [Google Scholar]
  3. Karathanasis, A.D. Seasonal Variation in Solution Composition and Mineral Stability of Two Kentucky Alfisols. Soil Sci. Soc. Am. J. 1991, 55, 881–890. [Google Scholar] [CrossRef]
  4. Blanc, P.; Vieillard, P.; Gailhanou, H.; Gaboreau, S.; Gaucher, É.; Fialips, C.I.; Madé, B.; Giffaut, E. A Generalized Model for Predicting the Thermodynamic Properties of Clay Minerals. Am. J. Sci. 2015, 315, 734–780. [Google Scholar] [CrossRef]
  5. Gaboreau, S.; Gailhanou, H.; Blanc, P.; Vieillard, P.; Made, B. Clay Mineral Solubility from Aqueous Equilibrium: Assessment of the Measured Thermodynamic Properties. Appl. Geochem. 2020, 113, 104465. [Google Scholar] [CrossRef]
  6. Gailhanou, H.; Blanc, P.; Rogez, J.; Mikaelian, G.; Kawaji, H.; Olives, J.; Amouric, M.; Denoyel, R.; Bourrelly, S.; Montouillout, V.; et al. Thermodynamic Properties of Illite, Smectite and Beidellite by Calorimetric Methods: Enthalpies of Formation, Heat Capacities, Entropies and Gibbs Free Energies of Formation. Geochim. Cosmochim. Acta 2012, 89, 279–301. [Google Scholar] [CrossRef]
  7. Arocena, J.M.; Glowa, K.R. Mineral Weathering in Ectomycorrhizosphere of Subalpine Fir (Abies lasiocarpa (Hook.) Nutt.) as Revealed by Soil Solution Composition. For. Ecol. Manag. 2000, 133, 61–70. [Google Scholar] [CrossRef]
  8. Bakker, M.R.; George, E.; Turpault, M.-P.; Zhang, J.L.; Zeller, B. Impact of Douglas-Fir and Scots Pine Seedlings on Plagioclase Weathering under Acidic Conditions. Plant Soil 2004, 266, 247–259. [Google Scholar] [CrossRef]
  9. Calvaruso, C.; Mareschal, L.; Turpault, M.-P.; Leclerc, E. Rapid Clay Weathering in the Rhizosphere of Norway Spruce and Oak in an Acid Forest Ecosystem. Soil Sci. Soc. Am. J. 2009, 73, 331–338. [Google Scholar] [CrossRef]
  10. Gobran, G.R.; Clegg, S.; Courchesne, F. Rhizospheric Processes Influencing the Biogeochemistry of Forest Ecosystems. Biogeochemistry 1998, 42, 107–120. [Google Scholar] [CrossRef]
  11. Calvaruso, C.; Turpault, M.P.; Leclerc, E.; Ranger, J.; Garbaye, J.; Uroz, S.; Frey-Klett, P. Influence of Forest Trees on the Distribution of Mineral Weathering-Associated Bacterial Communities of the Scleroderma Citrinum Mycorrhizosphere. Appl. Environ. Microbiol. 2010, 76, 4780–4787. [Google Scholar] [CrossRef] [PubMed]
  12. Mouas Bourbia, S.; Barré, P.; Boudiaf Naït Kaci, M.; Derridj, A.; Velde, B. Potassium Status in Bulk and Rhizospheric Soils of Olive Groves in North Algeria. Geoderma 2013, 197–198, 161–168. [Google Scholar] [CrossRef]
  13. Uroz, S.; Calvaruso, C.; Turpault, M.P.; Frey-Klett, P. Mineral Weathering by Bacteria: Ecology, Actors and Mechanisms. Trends Microbiol. 2009, 17, 378–387. [Google Scholar] [CrossRef] [PubMed]
  14. Bormann, B.T.; Wang, D.; Herbert Bormann, F.; Benoit, G.; April, R.; Snyder, M.C. Rapid, Plant-Induced Weathering in an Aggrading Experimental Ecosystem. Biogeochemistry 1998, 43, 129–155. [Google Scholar] [CrossRef]
  15. Kalinowski, B.E.; Schweda, P. Kinetics of Muscovite, Phlogopite, and Biotite Dissolution and Alteration at pH 1-4, Room Temperature. Geochim. Cosmochim. Acta 1996, 60, 367–385. [Google Scholar] [CrossRef]
  16. Raulund-Rasmussen, K.; Borggaard, O.K.; Hansen, H.C.B.; Olsson, M. Effect of Natural Organic Soil Solutes on Weathering Rates of Soil Minerals. Eur. J. Soil Sci. 1998, 49, 397–406. [Google Scholar] [CrossRef]
  17. Bray, A.W.; Oelkers, E.H.; Bonneville, S.; Wolff-Boenisch, D.; Potts, N.J.; Fones, G.; Benning, L.G. The Effect of PH, Grain Size, and Organic Ligands on Biotite Weathering Rates. Geochim. Cosmochim. Acta 2015, 164, 127–145. [Google Scholar] [CrossRef]
  18. Sokolova, T.A. Low-Molecular-Weight Organic Acids in Soils: Sources, Composition, Concentrations, and Functions: A Review. Eurasian Soil Sci. 2020, 53, 580–594. [Google Scholar] [CrossRef]
  19. McGahan, D.G.; Southard, R.J.; Zasoski, R.J. Rhizosphere Effects on Soil Solution Composition and Mineral Stability. Geoderma 2014, 226–227, 340–347. [Google Scholar] [CrossRef]
  20. Fernandez-Marcos, M.L.; Macías, F.; Guitián-Ojea, F. A Contribution to the Study of the Stability of Clay Minerals from the Soil Solution Composition at Different PF Values. Clay Miner 1979, 14, 29–37. [Google Scholar] [CrossRef]
  21. Pedro, G.; Jamagne, M.; Begon, J.C. Two Routes in Genesis of Strongly Differentiated Acid Soils under Humid, Cool-Temperate Conditions. Geoderma 1978, 20, 173–189. [Google Scholar] [CrossRef]
  22. IUSS Working Group WRB World Reference Base for Soil Resources 2014, Update 2015: International Soil Classification System for Naming Soils and Creating Legends for Soil Maps; FAO: Rome, Italy, 2015.
  23. Tolpeshta, I.I.; Leman, M. Spatial Variation and Evaluation of Additivity of Parameters of the Acid-Base State of Pale-Podzolic Soils of the Central Forest Nature Reserve. Vestn. Mosk. Univ. Ser. 17 Pochvoved. 2000, 3, 12–19. [Google Scholar]
  24. Tolpeshta, I.I.; Sokolova, T.A. Extractable Aluminum Compounds in Soils of the Southern Taiga (Soils of the Central Forest Reserve as an Example). Eurasian Soil Sci. 2010, 43, 893–904. [Google Scholar] [CrossRef]
  25. Alekseeva, S.A.; Dronova, T.Y.; Sokolova, T.A. Chemical and Mineralogical Characteristics of Podzolic and Bog-Podzolic Soils Developed from Twolayered Deposits in the Central Forest State Biospheric Reserve. Moscow Univ. Soil Sci. Bull. 2007, 62, 140–148. [Google Scholar] [CrossRef]
  26. Tolpeshta, I.I.; Sokolova, T.A. Aluminum Compounds in Soil Solutions and Their Migration in Podzolic Soils on Two-Layered Deposits. Eurasian Soil Sci. 2009, 42, 24–34. [Google Scholar] [CrossRef]
  27. Bonifacio, E.; Falsone, G.; Simonov, G.; Sokolova, T.; Tolpeshta, I. Pedogenic Processes and Clay Transformations in Bisequal Soils of the Southern Taiga Zone. Geoderma 2003, 149, 66–75. [Google Scholar] [CrossRef]
  28. Menzies, N.; Bell, L. Evaluation of the Influence of Sample Preparation and Extraction Technique on Soil Solution Composition. Soil Res. 1988, 26, 451–464. [Google Scholar] [CrossRef]
  29. Álvarez, E.; Fernández-Sanjurjo, M.J.; Núñez, A.; Seco, N.; Corti, G. Aluminium Fractionation and Speciation in Bulk and Rhizosphere of a Grass Soil Amended with Mussel Shells or Lime. Geoderma 2012, 173–174, 322–329. [Google Scholar] [CrossRef]
  30. Barreto, M.S.C.; Ramlogan, M.; Oliveira, D.M.S.; Verburg, E.E.J.; Elzinga, E.J.; Rouff, A.A.; Jemo, M.; Alleoni, L.R.F. Thermal Stability of Soil Organic Carbon after Long-Term Manure Application across Land Uses and Tillage Systems in an Oxisol. Catena 2021, 200, 105164. [Google Scholar] [CrossRef]
  31. Moore, D.M.; Reynolds, R.C. X-Ray Diffraction and Identification and Analysis of Clay Minerals, 2nd ed.; Oxford University Press: Oxford, UK, 1997. [Google Scholar]
  32. Vieillard, P.; Gailhanou, H.; Lassin, A.; Blanc, P.; Bloch, E.; Gaboreau, S.; Fialips, C.I.; Made, B. A Predictive Model of Thermodynamic Entities of Hydration for Smectites: Application to the Formation Properties of Smectites. Appl. Geochem. 2019, 110, 104423. [Google Scholar] [CrossRef]
  33. Karathanasis, A.D. Compositional and Solubility Relationships Between Aluminum-Hydroxyinterlayered Soil-Smectites and Vermiculites. Soil Sci. Am. J. 1988, 52, 1500–1508. [Google Scholar] [CrossRef]
  34. Kittrick, J.A. Solubility Measurments of Phases in Three Illites. Clays Clay Miner. 1984, 32, 115–124. [Google Scholar] [CrossRef]
  35. Misra, U.K.; Upchurcht, W. Free Energy of Formation of Beidellite from Apparent Solubility Measurments. Clays Alld Clay Miller. 1976, 24, 327–360. [Google Scholar] [CrossRef]
  36. Varadachari, C. Clay Mineral Equilibria: Fuzzy Phase Diagrams. Clay Res. 2017, 36, 1–16. [Google Scholar]
  37. Varadachari, C.; Kudrat, M.; Ghosh, K. Evaluation of Standard Free Energies of Formation of Clay Minerals by an Improved Regression Method. Clays Clay Miner. 1994, 42, 298–307. [Google Scholar] [CrossRef]
  38. Vieillard, P. A New Method for the Prediction of Gibbs Free Energies of Formation of Phyllosilcates (10 A and 14 A) Based on the Electronegativity Scale. Clays Clay Miner. 2002, 50, 352–363. [Google Scholar] [CrossRef]
  39. Volkov, D.S.; Rogova, O.B.; Proskurnin, M.A.; Farkhodov, Y.R.; Markeeva, L.B. Thermal Stability of Organic Matter of Typical Chernozems under Different Land Uses. Soil Tillage Res. 2020, 197, 104500. [Google Scholar] [CrossRef]
  40. Margenot, A.J.; Parikh, S.J.; Calderón, F.J. Fourier-Transform Infrared Spectroscopy for Soil Organic Matter Analysis. Soil Sci. Soc. Am. J. 2023, 87, 1503–1528. [Google Scholar] [CrossRef]
  41. Danilin, I.; Tolpeshta, I.; Izosimova, Y.; Pozdnyakov, L.; Stepanov, A.; Salimgareeva, O. Thermal Stability and Resistance to Biodegradation of Humic Acid Adsorbed on Clay Minerals. Minerals 2023, 13, 101310. [Google Scholar] [CrossRef]
  42. Tolpeshta, I.I.; Sokolova, T.A.; Bonifacio, E.; Falcone, G. Pedogenic Chlorites in Podzolic Soils with Different Intensities of Hydromorphism: Origin, Properties, and Conditions of Their Formation. Eurasian Soil Sci. 2010, 43, 777–787. [Google Scholar] [CrossRef]
  43. Bain, D.C. Chemistry, Mineralogy and Morphology of Spodosols at Two Swedish Sites Used to Assess Methods of Counteracting Acidification. Water Air Soil Pollut. Focus 2003, 3, 29–47. [Google Scholar] [CrossRef]
  44. Goh, T.B.; Huang, P.M. Formation of Hydroxy-Al-Montmorillonite Complexes Influenced by Citric Acid. Can. J. Soil Sci. 1984, 411–421. [Google Scholar] [CrossRef]
  45. Huang, L.; Tan, W.; Liu, F.; Hu, H.; Huang, Q. Composition and Transformation of 1.4 Nm Minerals in Cutan and Matrix of Alfisols in Central China. J. Soils Sediments 2007, 7, 240–246. [Google Scholar] [CrossRef]
  46. Sartori, F.; Riffaldi, R.; Levi-Minzi, R. Occurrence of Chloritic Intergrades in the Recent Sediments of the Arno River (Italy). Clay Miner. 1979, 14, 47–65. [Google Scholar] [CrossRef]
  47. Dijkstra, F.A.; Fitzhugh, R.D. Aluminum Solubility and Mobility in Relation to Organic Carbon in Surface Soils Affected by Six Tree Species of the Northeastern United States. Geoderma 2003, 114, 33–47. [Google Scholar] [CrossRef]
  48. Kluber, L.A.; Tinnesand, K.M.; Caldwell, B.A.; Dunham, S.M.; Yarwood, R.R.; Bottomley, P.J.; Myrold, D.D. Ectomycorrhizal Mats Alter Forest Soil Biogeochemistry. Soil Biol. Biochem. 2010, 42, 1607–1613. [Google Scholar] [CrossRef]
  49. Augusto, L.; Ranger, J.; Turpault, M.-P.; Bonnaud, P. Experimental in Situ Transformation of Vermiculites to Study the Weathering Impact of Tree Species on the Soil. Eur. J. Soil Sci. 2001, 81–92. [Google Scholar] [CrossRef]
  50. Hagen-Thorn, A.; Callesen, I.; Armolaitis, K.; Nihlgård, B. The Impact of Six European Tree Species on the Chemistry of Mineral Topsoil in Forest Plantations on Former Agricultural Land. For. Ecol. Manag. 2004, 195, 373–384. [Google Scholar] [CrossRef]
  51. Ndayiragije, S.; Delvaux, B. Coexistence of Allophane, Gibbsite, Kaolinite and Hydroxy-Al-Interlayered 2:1 Clay Minerals in a Perudic Andosol. Geoderma 2003, 117, 203–214. [Google Scholar] [CrossRef]
  52. Vicente, M.A.; Razzaghe, M.; Robert, M. Formation of Aluminium Hydroxy Vermiculite (Intergrade) and Smectite from Mica under Acidic Conditions. Clay Miner. 1977, 12, 101–112. [Google Scholar] [CrossRef]
  53. Sawhney, B.L. Aluminum Interlayers in Layer Silicates Effect of OH/Al Ratio of Al Solution, Time of Reaction, and Type of Structure. Clays Clay Miner. 1968, 16, 157–163. [Google Scholar] [CrossRef]
  54. Glowa, K.R.; Arocena, J.M.; Massicotte, H.B. Properties of Soils Influenced by Ectomycorrhizal Fungi in Hybrid Spruce [Picea glauca × Engelmannii (Moench.) Voss]. Can. J. Soil Sci. 2004, 84, 91–102. [Google Scholar] [CrossRef]
  55. Leyval, C.; Berthelin, J. Weathering of a Mica by Roots and Rhizospheric Microorganisms of Pine. Soil Sci. Soc. Am. J. 1991, 55, 1009–1016. [Google Scholar] [CrossRef]
  56. Sokolova, T.A. Decomposition of Clay Minerals in Model Experiments and in Soils: Possible Mechanisms, Rates, and Diagnostics (Analysis of Literature). Eurasian Soil Sci. 2013, 46, 182–197. [Google Scholar] [CrossRef]
  57. Wilson, M.J. The Origin and Formation of Clay Minerals in Soils: Past, Present and Future Perspectives. Clay Miner. 1999, 34, 7–25. [Google Scholar] [CrossRef]
  58. Gagarina, E.I.; Sokolova, T.A.; Sukhacheva, E.Y. Clay Minerals in Weakly Podzolised Soils of Abraded Moraine Plains in Northwestern Russia. Mosc. Univ. Soil Sci. Bull. 2014, 69, 147–155. [Google Scholar] [CrossRef]
  59. Wilson, M.J. Weathering of the Primary Rock-Forming Minerals: Processes, Products and Rates. Clay Miner. 2004, 39, 233–266. [Google Scholar] [CrossRef]
  60. Allen, B.L.; Hajek, B.F. Mineral Occurrence in Soil Environments. In Minerals in Soil Environments; Dixon, B., Weed, S.B., Eds.; Soil Science Society of America: Madison, Wisconsin, 1989; Volume 1, pp. 199–278. [Google Scholar]
  61. Danilin, I.V.; Tolpeshta, I.I.; Izosimova, Y.G. The Mineral Composition of Clay Subfractions in the Rhizosphere of Norway Maple (Acer Platanoids L.) and in the Enclosing Soil. Mosc. Univ. Soil Sci. Bull. 2025, 80, 1–7. [Google Scholar] [CrossRef]
  62. Tolpeshta, I.I.; Sokolova, T.A.; Vorob’eva, A.A.; Izosimova, Y.G. Transformation of Trioctahedral Mica in the Upper Mineral Horizon of Podzolic Soil during the Two-Year-Long Field Experiment. Eurasian Soil Sci. 2018, 2018, 843–856. [Google Scholar] [CrossRef]
  63. Drever, J.I.; Vance, F.V. Role of Soil Organic Acids in Mineral Weathering Processes. In Organic Acids in Geological Processes; Pittman, E.D., Lewan, M.D., Eds.; Springer: Berlin/Heidelberg, Germany, 1994; pp. 138–161. [Google Scholar]
  64. Sokolova, T.A. Specificity of Soil Properties in the Rhizosphere: Analysis of Literature Data. Eurasian Soil Sci. 2015, 48, 968–980. [Google Scholar] [CrossRef]
  65. Karathanasis, A.D. Mineral Equilibria in Environmental Soil Systems. In Soil Mineralogy with Environmental Applications; Dixon, J.B., Schulze, D.G., Eds.; Soil Science Society of America Inc.: Madison, WI, USA, 2002; pp. 109–151. [Google Scholar]
  66. Canarini, A.; Kaiser, C.; Merchant, A.; Richter, A.; Wanek, W. Root Exudation of Primary Metabolites: Mechanisms and Their Roles in Plant Responses to Environmental Stimuli. Front. Plant Sci. 2019, 10. [Google Scholar] [CrossRef] [PubMed]
  67. Kaiser, K.; Guggenberger, G. Mineral Surfaces and Soil Organic Matter. Eur. J. Soil Sci. 2003, 54, 219–236. [Google Scholar] [CrossRef]
  68. Lützow, M.V.; Kögel-Knabner, I.; Ekschmitt, K.; Matzner, E.; Guggenberger, G.; Marschner, B.; Flessa, H. Stabilization of Organic Matter in Temperate Soils: Mechanisms and Their Relevance under Different Soil Conditions—A Review. Eur. J. Soil Sci. 2006, 57, 426–445. [Google Scholar] [CrossRef]
  69. Kleber, M.; Sollins, P.; Sutton, R. A Conceptual Model of Organo-Mineral Interactions in Soils: Self-Assembly of Organic Molecular Fragments into Zonal Structures on Mineral Surfaces. Biogeochemistry 2007, 85, 9–24. [Google Scholar] [CrossRef]
  70. Zhu, X.; He, J.; Su, S.; Zhang, X.; Wang, F. Concept Model of the Formation Process of Humic Acid-Kaolin Complexes Deduced by Trichloroethylene Sorption Experiments and Various Characterizations. Chemosphere 2016, 151, 116–123. [Google Scholar] [CrossRef]
  71. Tan, K.H. The Catalytic Decomposition of Clay Mineral by Complex Reaction with Humic and Fulvic Acid. Soil Sci. 1975, 120, 188–194. [Google Scholar] [CrossRef]
  72. Ochs, M. Influence of Humified and Non-Humified Natural Ogranic Compounds on Mineral Dissolution. Chem. Geol. 1996, 132, 119–124. [Google Scholar] [CrossRef]
  73. Kodama, H.; Schnitzer, M.; Jaakkimainen, M. Chlorite and Biotite Weathering by Fulvic Acid Solutions in Clodes and Open Systems. Can. J. Soil Sci. 1983, 63, 619–629. [Google Scholar] [CrossRef]
  74. Das, S.; Ghosh, K.; Varadachari, C. Weathering of Silicate Minerals by Humic Acids: II. Nature of Cation Solubilisation from Hornblende and Biotite and Characteristics of the Residual Products. Clay Res. 2014, 33, 46–63. [Google Scholar]
  75. Zhang, L.; Luo, L.; Zhang, S. Integrated Investigations on the Adsorption Mechanisms of Fulvic and Humic Acids on Three Clay Minerals. Colloids Surf. A Physicochem. Eng. Asp. 2012, 406, 84–90. [Google Scholar] [CrossRef]
  76. Gouré-Doubi, H.; Martias, C.; Smith, A.; Villandier, N.; Sol, V.; Gloaguen, V.; Feuillade, G. Adsorption of Fulvic and Humic like Acids on Surfaces of Clays: Relation with SUVA Index and Acidity. Appl. Clay Sci. 2018, 154, 83–90. [Google Scholar] [CrossRef]
  77. Ehrlich, H.L. How Microbes Influence Mineral Growth and Dissolution. Chem. Geol. 1996, 132, 5–9. [Google Scholar] [CrossRef]
  78. Banfield, J.F.; Barker, W.W.; Welch, S.A.; Taunton, A. Biological Impact on Mineral Dissolution: Application of the Lichen Model to Understanding Mineral Weathering in the Rhizosphere. Proc. Natl. Acad. Sci. USA 1999, 96, 3404–3411. [Google Scholar] [CrossRef] [PubMed]
  79. Bonneville, S.; Morgan, D.J.; Schmalenberger, A.; Bray, A.; Brown, A.; Banwart, S.A.; Benning, L.G. Tree-Mycorrhiza Symbiosis Accelerate Mineral Weathering: Evidences from Nanometer-Scale Elemental Fluxes at the Hypha-Mineral Interface. Geochim. Cosmochim. Acta 2011, 75, 6988–7005. [Google Scholar] [CrossRef]
  80. Finlay, R.D.; Mahmood, S.; Rosenstock, N.; Bolou-Bi, E.B.; Köhler, S.J.; Fahad, Z.; Rosling, A.; Wallander, H.; Belyazid, S.; Bishop, K.; et al. Reviews and Syntheses: Biological Weathering and Its Consequences at Different Spatial Levels—From Nanoscale to Global Scale. Biogeosciences 2020, 17, 1507–1533. [Google Scholar] [CrossRef]
  81. Saidy, A.R.; Smernik, R.J.; Baldock, J.A.; Kaiser, K.; Sanderman, J. Microbial Degradation of Organic Carbon Sorbed to Phyllosilicate Clays with and without Hydrous Iron Oxide Coating. Eur. J. Soil Sci. 2015, 66, 83–94. [Google Scholar] [CrossRef]
  82. Schmidt, M.W.I.; Kögel-Knaber, I. Organic Matter in Particle-Size Fractions from A and B Horizons of a Haplic Alisol. Eur. J. Soil Sci. 2002, 53, 383391. [Google Scholar] [CrossRef]
Figure 1. X-ray diffraction patterns of the clay fraction in the Acer platanoides rhizosphere and the bulk soil under Acer platanoides. 1–5 are replicates.
Minerals 15 00430 g001
Figure 2. X-ray diffraction patterns of the clay fraction in the Picea abies rhizosphere and the bulk soil under Picea abies. 1–5 are replicates.
Minerals 15 00430 g002
Figure 3. Kaolinite solubility diagram (the solid line is the equilibrium line calculated from experimental data; the dotted lines are the thermodynamic stability limits calculated from literature data).
Minerals 15 00430 g003
Figure 4. Solubility diagrams of (a) vermiculite; (b) chlorite; (c) illite. The solid line is the equilibrium line calculated from experimental data; the dotted lines are the thermodynamic stability limits calculated from literature data.
Minerals 15 00430 g004
Figure 5. Solubility diagram of HIV. The dotted lines are the thermodynamic stability limits calculated from literature data.
Minerals 15 00430 g005
Figure 6. Clustering of clay fraction samples by relative intensities of absorption bands in DRIFTS spectra: (a) grouping by locus, (b) grouping by plant species.
Minerals 15 00430 g006
Figure 7. DSC curves of the clay fraction (experimental replicates are shown in different colors).
Minerals 15 00430 g007
Figure 8. Correlations between the area of thermal effects and the intensity of bands in the DRIFTS spectra.
Minerals 15 00430 g008
Figure 9. Diffraction patterns of kaolinite, muscovite, and biotite samples used for sorption experiments.
Minerals 15 00430 g009
Figure 10. DRIFTS spectra of clay minerals, organomineral complexes, and HA.
Minerals 15 00430 g010
Figure 11. Clustering of organomineral complexes in the coordinates of the principal components according to the intensities of the absorption bands in the DRIFTS spectra.
Minerals 15 00430 g011
Figure 12. DSC curves of organomineral complexes and HA.
Minerals 15 00430 g012
Figure 13. Dependence of saturation indices of clay minerals and organomineral complexes on incubation time.
Minerals 15 00430 g013
Figure 14. Relationship between carbon content of organic matter in the clay fraction and saturation index (kaolinite as an example, similar for other minerals).
Minerals 15 00430 g014
Figure 15. Relationship between the intensities of the absorption bands 692, 750: 1505, 1708 cm−1 and the saturation index (kaolinite as an example, similar for other minerals).
Minerals 15 00430 g015
Figure 16. Relationship between the area of exothermic effects of organic matter combustion in the clay fraction and the saturation index (kaolinite as an example, similar for other minerals).
Minerals 15 00430 g016
Figure 17. X-ray diffraction patterns of the clay fraction after calcination: (a) at 350 °C; (b) at 550 °C.
Minerals 15 00430 g017
Figure 18. Results of deconvolution of diffraction patterns of clay fractions from the rhizosphere of Acer platanoides, Picea abies, and bulk soil: (a) peak areas in the range of 1.4–1.0 nm; (b) position of peaks.
Minerals 15 00430 g018
Table 2. Saturation indices of mineral phases of the clay fraction in the rhizosphere of Acer platanoides, Picea abies, and the corresponding bulk soil (arithmetic mean ± standard deviation).
KaoliniteIlliteVermiculiteChlorite
Rhizosphere (Picea)−5.20 ±1.1−12.56 ± 1.6−25.28 ± 4.4−45.09 ± 8.1
Bulk soil (Picea)−4.92 ± 1.3−12.19 ± 1.8−25.07 ± 2.3−44.51 ± 3.9
Rhizosphere (Acer)−3.80 ± 0.9−10.59 ± 1.3−22.52 ± 1.7−40.52 ± 3.1
Bulk soil (Acer)−3.57 ±1.6−10.35 ± 2.2−22.4 ±2.5−40.03 ± 5.0
Table 3. Carbon and nitrogen content in HA and minerals before and after HA treatment (average of two replicates).
SampleС, %N, %C/NTG50DSC50
Kaolinite0.120.09---
Muscovite0.180.05---
Biotite0.120.06---
Kaolinite + HA5.460.2819.7378365
Muscovite + HA4.560.3214.3402410
Biotite + HA4.390.3811.6397395
HA27.632.3012.0--
Disclaimer/Publisher’s Note: The statements, opinions and data contained in all publications are solely those of the individual author(s) and contributor(s) and not of MDPI and/or the editor(s). MDPI and/or the editor(s) disclaim responsibility for any injury to people or property resulting from any ideas, methods, instructions or products referred to in the content.

