Article

SAG Mill Grinding Media Stress Evaluation—A DEM Approach

by
Murray Mulenga Bwalya
1,
Oliver Shwarzkopf Samukute
1 and
Ngonidzashe Chimwani
2,*
1
School of Chemical and Metallurgical Engineering, University of the Witwatersrand, Johannesburg 2000, South Africa
2
Department of Mining, Minerals and Geomatics Engineering, University of South Africa (UNISA), Florida Campus, Johannesburg 1710, South Africa
*
Author to whom correspondence should be addressed.
Minerals 2025, 15(4), 431; https://doi.org/10.3390/min15040431
Submission received: 18 February 2025 / Revised: 10 April 2025 / Accepted: 15 April 2025 / Published: 20 April 2025
(This article belongs to the Special Issue Comminution and Comminution Circuits Optimisation: 3rd Edition)

Abstract

:
The volatility of commodity prices has obligated primary metal producers to continuously seek ways of cutting costs in mineral processing units. Improving the wear characteristics and reducing the probability of grinding media fracture can potentially reduce production costs. Characterisation of the impact-loading environment and stress induced into the grinding media in SAG mills aids manufacturers in developing grinding media with superior mechanical properties. Such grinding media development emanates from a firm understanding of the SAG process supported by computer modelling tools and well-established engineering designs. The discrete element method (DEM) is a numerical technique for evaluating collision behaviour in particulate systems. This paper discusses the application of the DEM to estimate survivability and stress, induced into grinding media in a SAG mill.

1. Introduction

Semi-autogenous (SAG) mills are robustly built heavy-duty machines that can handle run-of-mine (ROM) rocks (ore) to produce product sizes that are fine enough for the separation stage. SAG mills are generally designed with a diameter-to-length ratio of approximately 1.5–3 and are charged with both ore and steel grinding balls of up to 150 mm in diameter. With large diameters typically used in SAG mills, generating high impact and intense shear forces in both cataracting and cascading motion, respectively, the likelihood of mill liner and grinding media damage is enhanced [1].
The versatility of SAG mills in terms of feed size that can be handled and product size that can be produced has propelled these machines to be the technology of choice in many new mineral processing circuits, whilst retrofitting these into existing circuits has also been on the rise. In the wake of that, challenges in terms of control, optimisation and grinding media usage have become prevalent. Among the challenges most operators face with grinding media usage in SAG mills today are premature ball and liner fracture, shape distortion and accelerated wear rates. This is probably because SAG mill environments expose the grinding balls to relatively higher-impact loading, wear and corrosion due to both large mill and ball diameter. To improve the mechanical properties of the grinding media during manufacturing, a firm understanding of the grinding media’s mechanical properties and the SAG process are fundamental prerequisites. Grinding media manufacturers develop their products through practical experience, whilst SAG operations are supported by well-established engineering designs and computer-based modelling tools.
Among the tools available to control, optimise and understand load behaviour in SAG mills is the discrete element method (DEM). The DEM is a numerical technique applicable to modelling particle interaction, especially in systems where many particles are involved. This tool can be used to model ball collision behaviour in SAG mills and estimate the stress involved in such collisions. This information is very useful in understanding the toughness and hardness requirements of SAG mill grinding media, which will enable manufacturers to develop grinding media that can withstand the high-impact loading environments in SAG mills.
During impact loading in these mills, the grinding media and the ore are subjected to a suite of stressful events that are responsible for ore fracture but have a cumulative effect on steel media, which may lead to eventual catastrophic failure. For some steel balls, failure may occur after a few repeated cycles of these events, while others seem to display unlimited endurance. The variations observed could be a result of pre-existing imperfections or cracks that act as points of high-stress concentration from which rupture propagates. SAG mills rely on impact energy provided by the cataracting fraction of the charge for most of the ore breakage. This type of charge motion demands the use of grinding balls that have improved fracture toughness to avoid catastrophic failure of grinding balls during operation and thus premature fracture of the balls. The premature fracture is especially enhanced by incorrect design of critical mill operational parameters such as mill speed and lifter face angle, which can project balls to fall above the toe position, resulting in rapid damage of steel balls and lifters [2].
Over the years, significant research has been conducted on SAG mills. The studies include the particle movement laws of a SAG mill, among other things and their influence on speed, lining board, fill level ratio, and steel ball diameter [3], the effect of the steel ball ratio, mill fill ratio and the mill speed ratio on the energy consumption of SAG mill [4], the effect of lifter height/face angle (i.e., lifter wear state) and fill level on charge shape for a given rotational speed [5] and the abrasive wear behaviour of grinding media and mill liners for tumbling mills [6]. Ball-to-rock ratio and steel ball collisions, among other SAG mill internal events, have also been successfully assessed using other techniques such as emission sensing [7,8]. The discrete element method (DEM), which has been widely used to simulate various particulate systems [1,9,10,11,12], has also been applied in SAG mill simulations. It was combined with industrial data to track particle movement and energy changes in SAG mills [13]. Despite the excellent work conducted so far to optimise SAG mill operation, little attention has been given to the assessment of the stress induced into the grinding media because of load behaviour in SAG mills. Therefore, to bridge this knowledge gap, the DEM was utilised in this work to investigate the effect of the ball-to-ore ratio on the collision behaviour of balls within the SAG mill. This was achieved by predicting the energy transfer and stress induced in the grinding balls during milling.

2. The Discrete Element Method (DEM)

The DEM is a numerical technique for modelling the collision behaviour of particles in many industrial systems. The strength of the DEM lies in its ability to track the interaction history of each individual particle, even in cases where there are many particles involved. The incorporated particle interactions offer detailed descriptions of the breakage dynamics [14]. The DEM consists of a contact model that is implemented to calculate the forces and energy transfer amongst particles at the point of contact, whilst Newtonian Mechanics is implemented to resolve particle motion from the net forces. The general theory of DEM modelling has been well described elsewhere [9,15,16]. In a SAG mill, the technique has been combined with FEM to predict SAG mill liner stresses to quantify interactions between the solid particles and liners and predict the dynamic loading of these collisions [17]. Later, Cleary et al. [18] combined the DEM and smoothed particle hydrodynamics (SPH) to assess incremental damage of particles and slurry rheology and predict the movement and breakage of coarse particles in SAG mills. The extensive use of these models creates a solid foundation for validating the formula used to determine the operation of SAG mills. In this work, the calculation of the conversion of kinetic energy to elastic energy and the dissipation of energy was based on the linear spring-dashpot contact model. The linear spring-dashpot model is described in detail in previous work by Weerasekara et al. [11] and Owen and Cleary [5]. This model allows the modelling of particles in both the normal and tangential directions, with a frictional slider included for the tangential direction. Particles are allowed to overlap during contact to model elastic deformation, and the extent of overlap is used in conjunction with the contact force law to give instantaneous forces from the knowledge of current positions, orientations, velocities and spins of the particles [19]. The normal force, Fn, is determined by both the spring and dashpot combined in Equation (1) [20]:
Fn = −knx + Cn vn
where Δx is the overlap, kn is the normal spring constant, Cn is the damping coefficient, and vn is the normal component of the relative velocity at the contact point. Cn is determined from the specified coefficient of restitution for each combination of colliding materials [21].
C n = 2 l n ( ϵ ) k n m e f f l n ( ϵ ) 2 + π 2
where ϵ is the coefficient of restitution and m e f f = 1 m 1 + 1 m 2 1   is the effective mass of the particles.
The tangential force (Ft) has an incremental spring based on the integrated tangential displacement and a dashpot for inelastic dissipation. The tangential force at the tangential elastic deformation is combined to give [20]:
Ft = min (μFnkt vt ∆t + Ct vt)
where µ is the coefficient of friction and vt is the tangential component of the relative velocity at the contact point [20].
The energy dissipated in collisions is captured in the dashpot, allowing it to be accounted for and recorded for later analysis [11]. An algorithm is used to record the data and store them in arrays that can be extracted for output as required by the user.

3. Materials and Methods

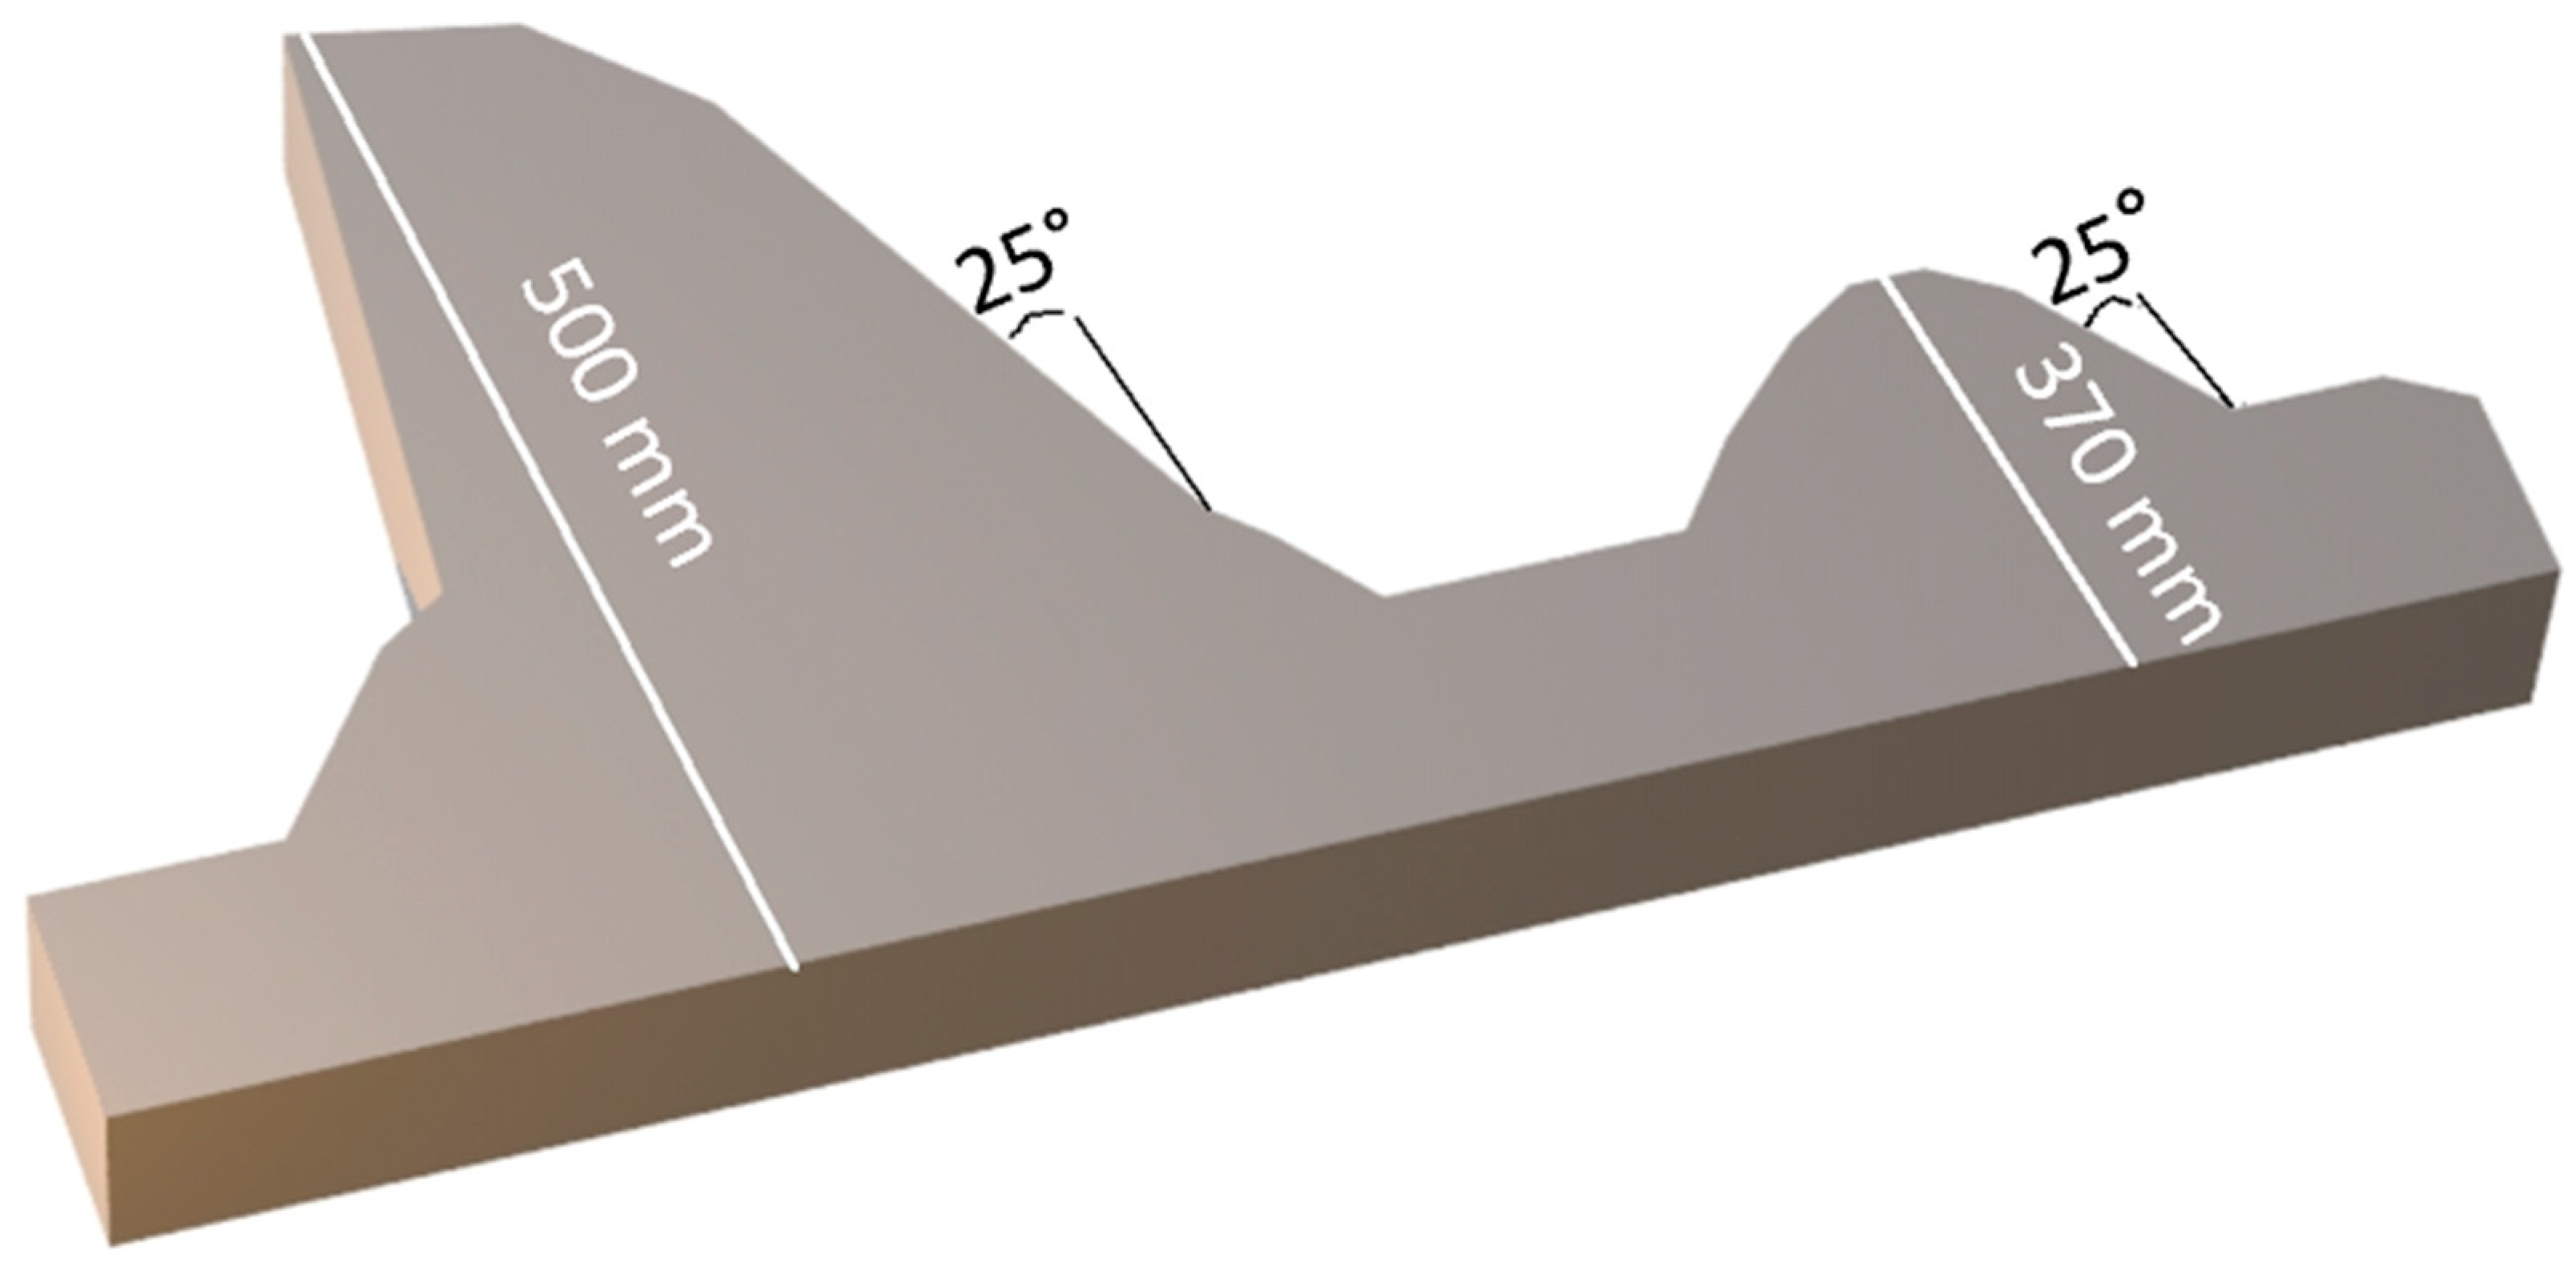
Sag Mill Configuration and Simulation Set-Up

This work shows how the ball-rock composition in the SAG mill affects load behaviour and influences the stress the grinding media is subjected to. The ball sizes investigated were the 100- and 125-mm balls, the data of which were generated from the drop weight experiments designed to match the simulated SAG mill. The SAG mill simulations were based on an industrial SAG mill with specifications presented in Table 1 and the lifter profile shown in Figure 1. The simulations were performed using the Particle Flow Code—Discrete Element Method 3D (PFC-DEM 3D) software, Version 5. The average number of interacting particles in a full-mill simulation was about 160,000. Hence, the amount of computational time required to complete such a simulation would have exceeded 5600 h. To reduce the computational time whilst still retaining important simulation data, a slice of the mill was considered. This significantly reduced the number of interacting particles to an average of 14,500, with the computational time significantly reduced to an average of 504 h. Therefore, for each condition, the simulation was performed once, and any averages were calculated from the two mill revolutions of the simulations. The simulations timed for a mill were approximately 5 days
The SAG mill lifters were constructed using moly-chrome steel and have a high-low profile as shown in Figure 1.
The liner configuration in the mill is shown in Figure 2. Table 2 presents different combinations of the ball, ore and total mill filling and ore particle fractions used to simulate the SAG mill. Only the ball-to-ore ratio (by % mill filling degree) was varied, as presented in Table 2, to provide the basis for comparison. Thus, the first simulation (Sim1) had 100% ball composition, and the ball composition decreased whilst that of the ore filling rose from Sim2 to Sim5. The purpose of varying the ball-to-ore ratio was to understand and quantify the impact energy cushioning provided by the ore particles to the grinding balls. Hence, the different SAG mill simulations were compared based on the energy exposed to the grinding balls as a result of the different ball-to-ore ratios, as shown in Table 2.
The simulation was configured to match an industrial mill in terms of internal geometry and operational parameters, but varying the mill speed and ball-to-ore ratio. The ball-to-ore ratio is a very important parameter in operating SAG mills; operating at lower ball loads reduces the frequency of ball-on-ore collisions; hence, breakage rate of the coarse particles will drop, and mill throughput will suffer.
Higher ball loads are associated with increased mill power draw, overgrinding and an increase in the frequency of steel-on-steel collisions that expose the balls to a high probability of fracture. In this work, the ball-to-ore media ratio was varied to observe the effect of this factor on the stress that the balls are subjected to.
The simulation parameters that were used in this work, presented in Table 3, were adopted from earlier work done by other researchers [15,16,22].
The forces generated in a SAG mill of such geometry are very large and are dependent on the size, mass and tumbling height of the balls.

4. Results and Discussion

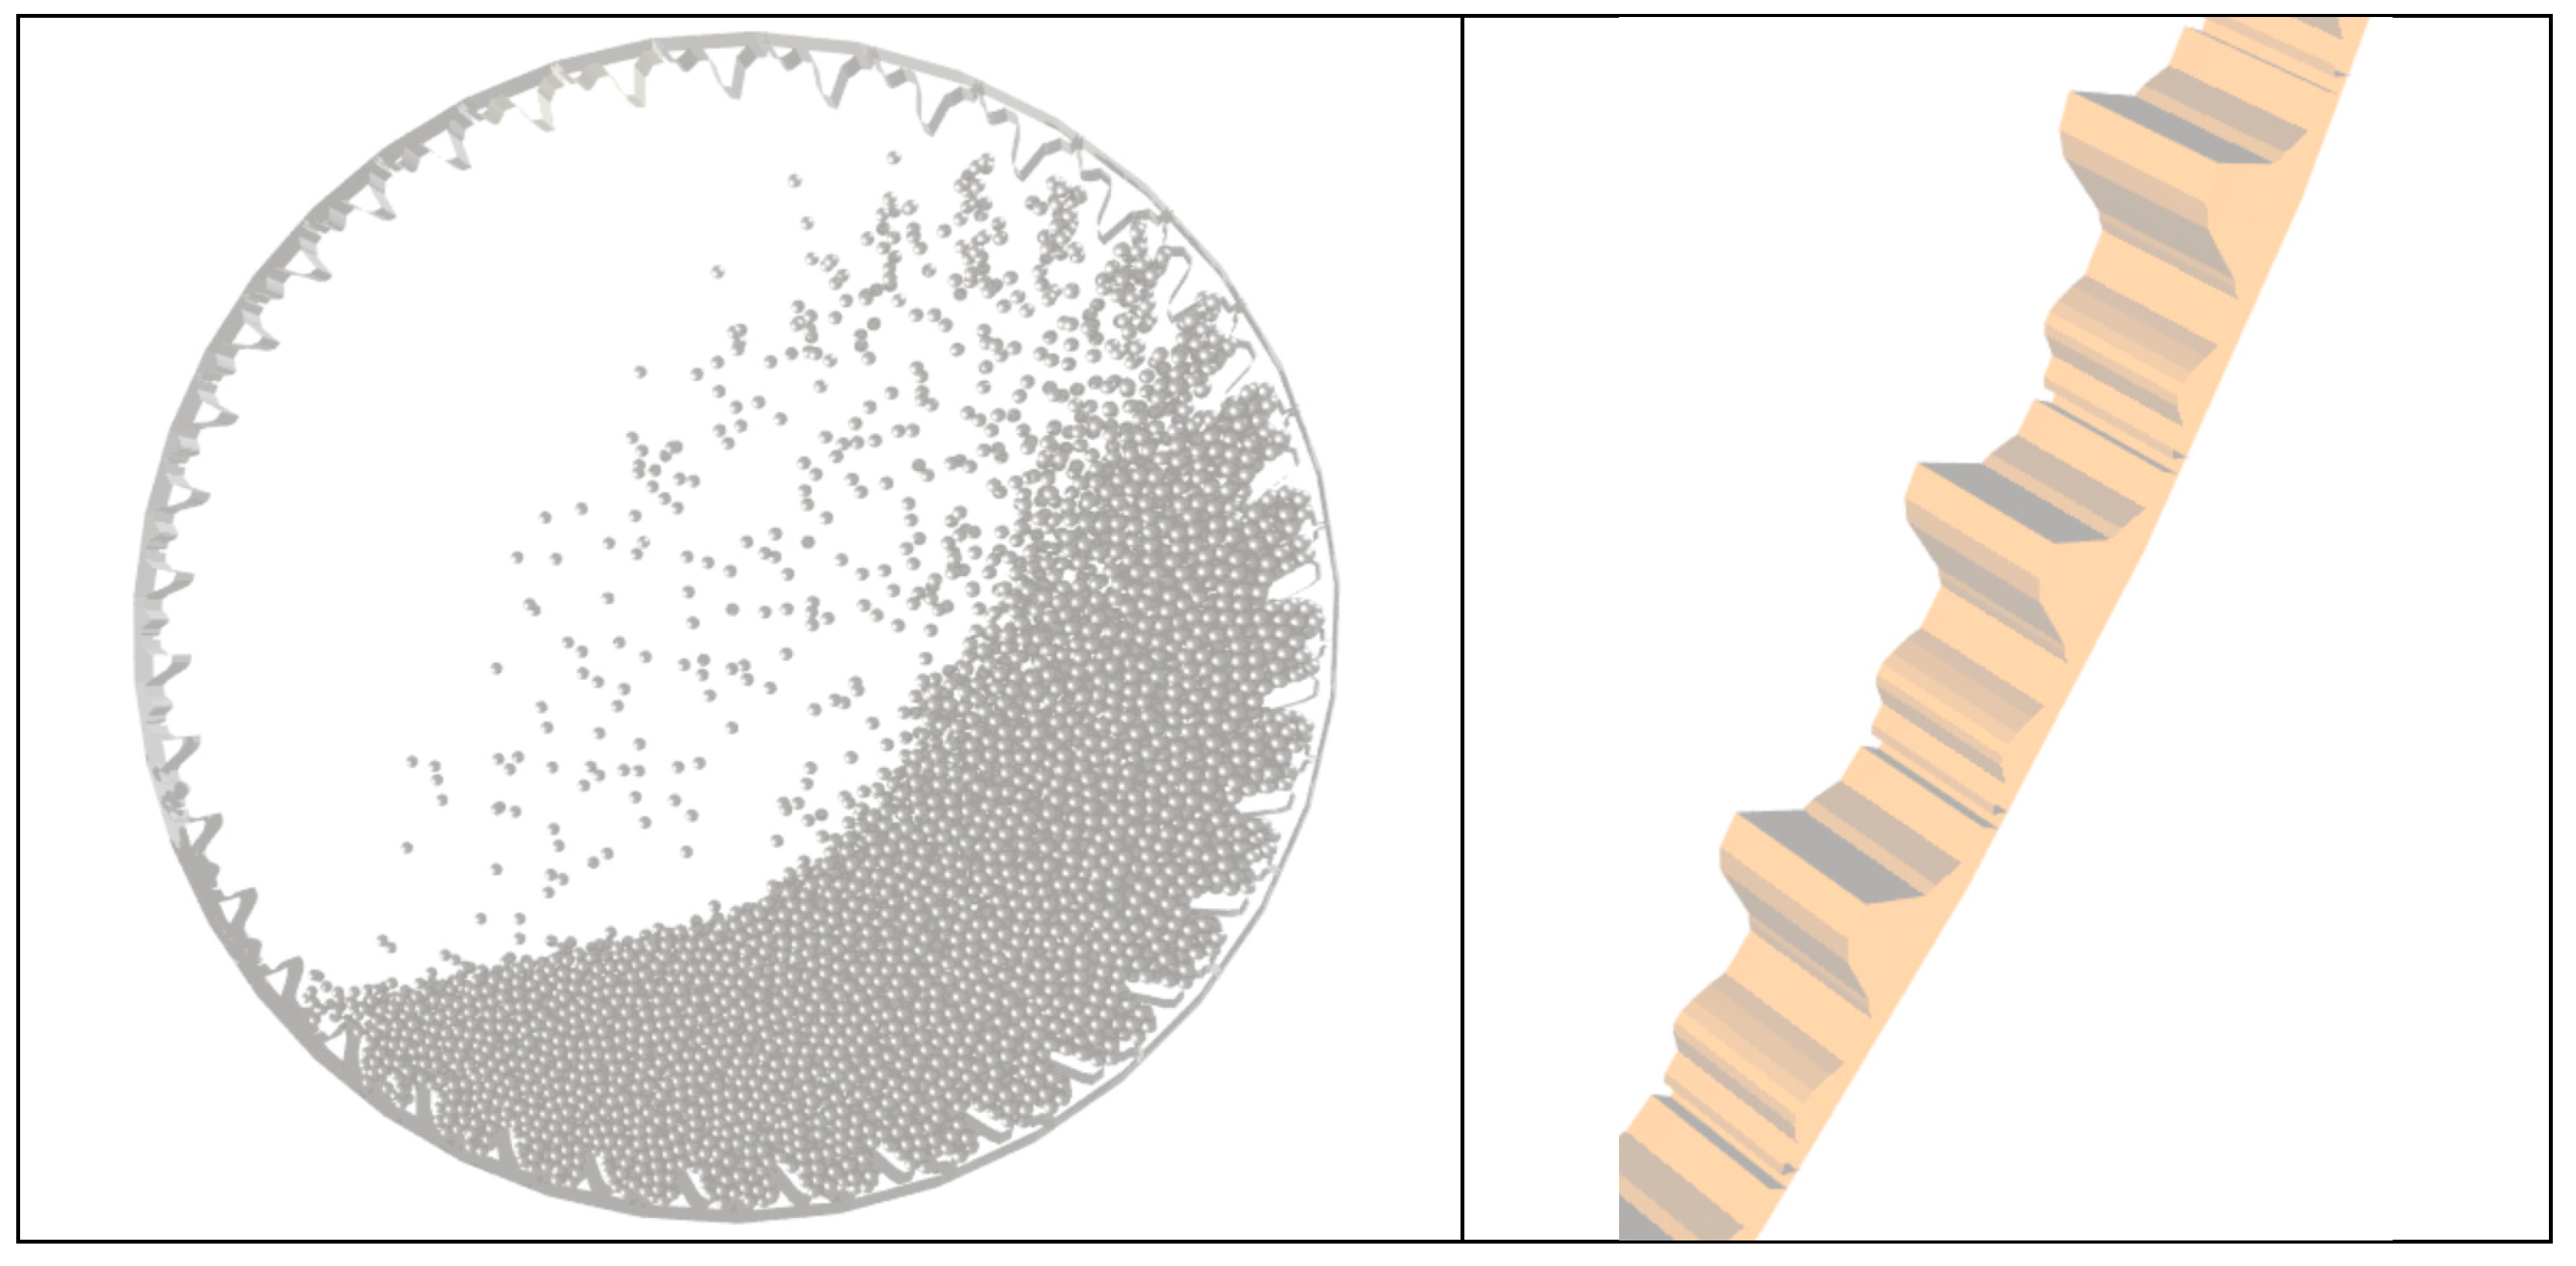
4.1. Charge Motion Inside the SAG Mill

During the simulation, various kinds of data were captured at preset intervals for post-simulation review. The data capture had to be optimised to ensure that adequate information was available without bloating the output files. The load behaviour, particle trajectories, mill toe and shoulder positions can be derived from snapshots of all positions captured during simulations and using in-house developed visualisation software, these aspects are easily analysed. The simulation outputs include mill input and dissipated power, energy spectra of all interactive events that involve all particles and other optional information depending on user requirements
The mill and simulation parameters listed in Table 1 and Table 3 were kept constant in all simulations except for the mill speed and ball-to-ore ratio, which was varied as described in Table 2. Figure 3 shows the snapshots of the cross-sectional view of the simulated SAG mill. The charge is carried by the lifters along the circumference of the mill in a counterclockwise direction to a point of dynamic equilibrium (shoulder position) where it loses contact with the lifter and either slips along the surface of the cascading stream or falls in free flight until it reaches the bottom of the mill (toe position). For this SAG mill simulation, the shoulder position corresponded to 320° positions as measured anticlockwise from the 12 o’clock position, while the toe was at the 120° position.
The end-view snapshots (Figure 3a) show the load behaviour within the mill. Figure 3b is included to accentuate the dynamic behaviour of the load by showing the actual paths followed by the balls.
While the still and particle paths snapshots qualitatively show the load behaviour within the mill, they do not provide information about the type of collisions the particles are involved in (ball-on-ball, ball-on-shell liner or ball-on-ore) and the energy that is associated with such collisions. During the simulation, mill power was recorded as well as the magnitude of each particle contact event, whether a high-energy collision event or a mere touching of the particles. This information was recorded as the energy spectra.

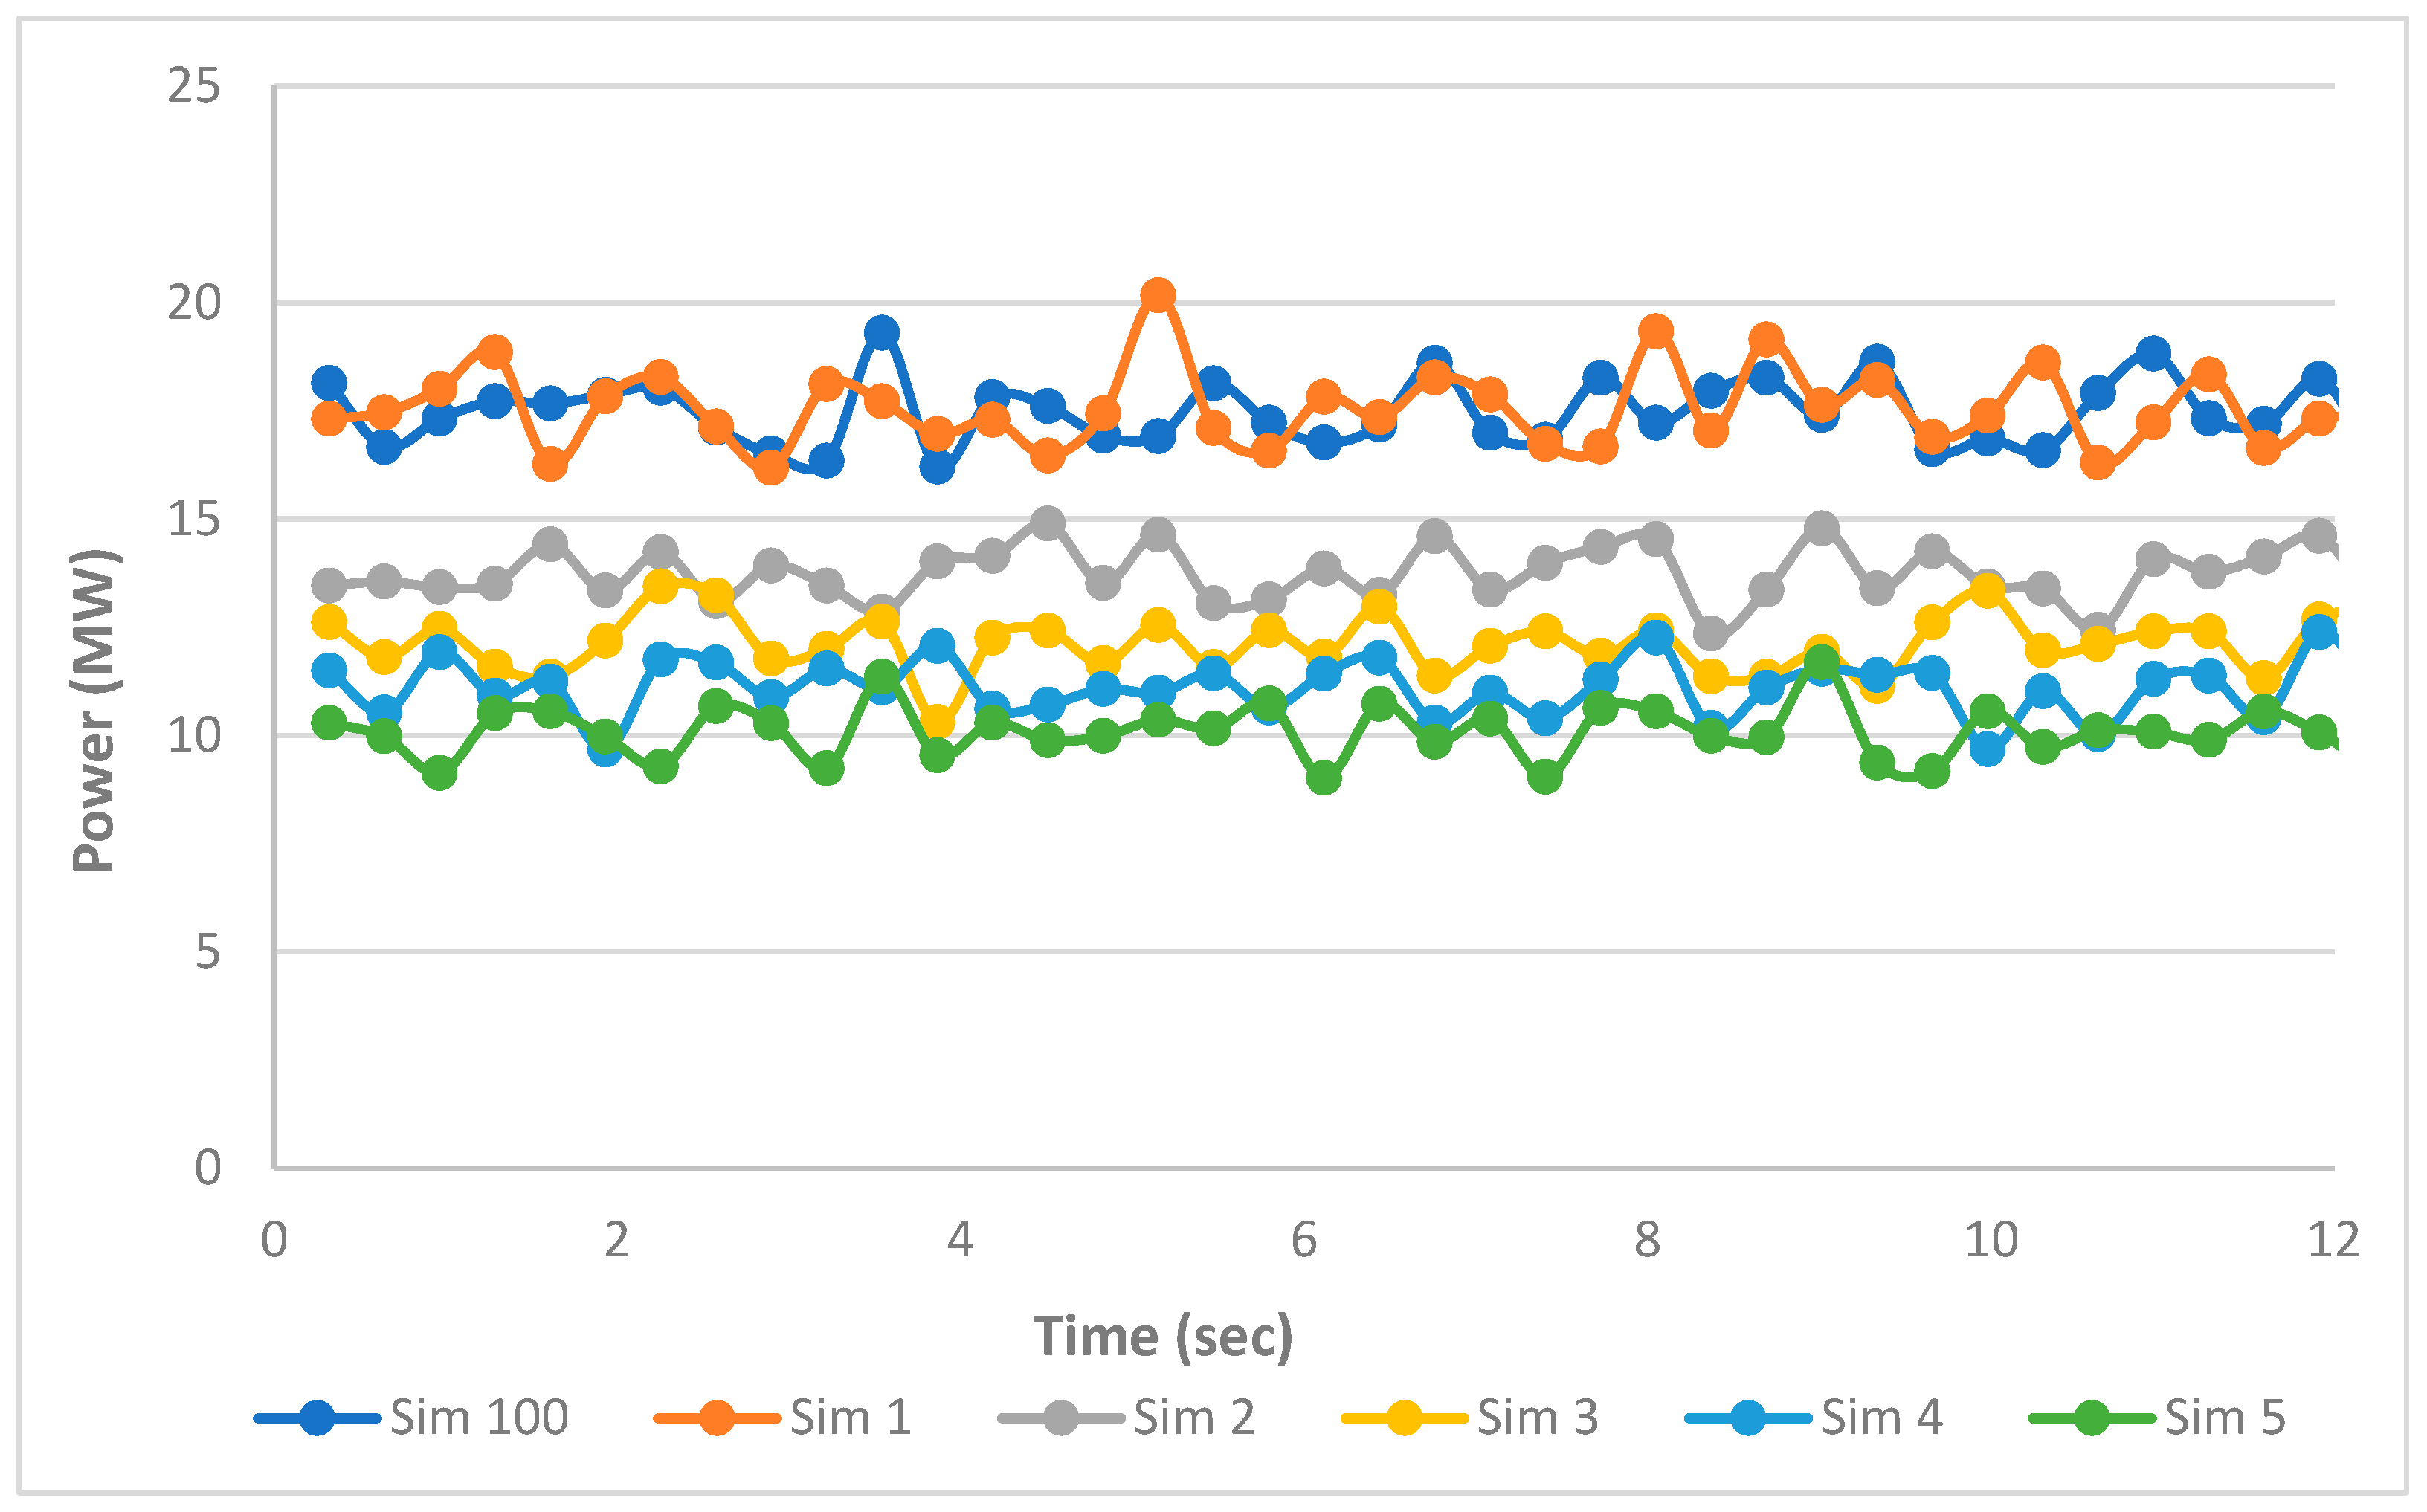
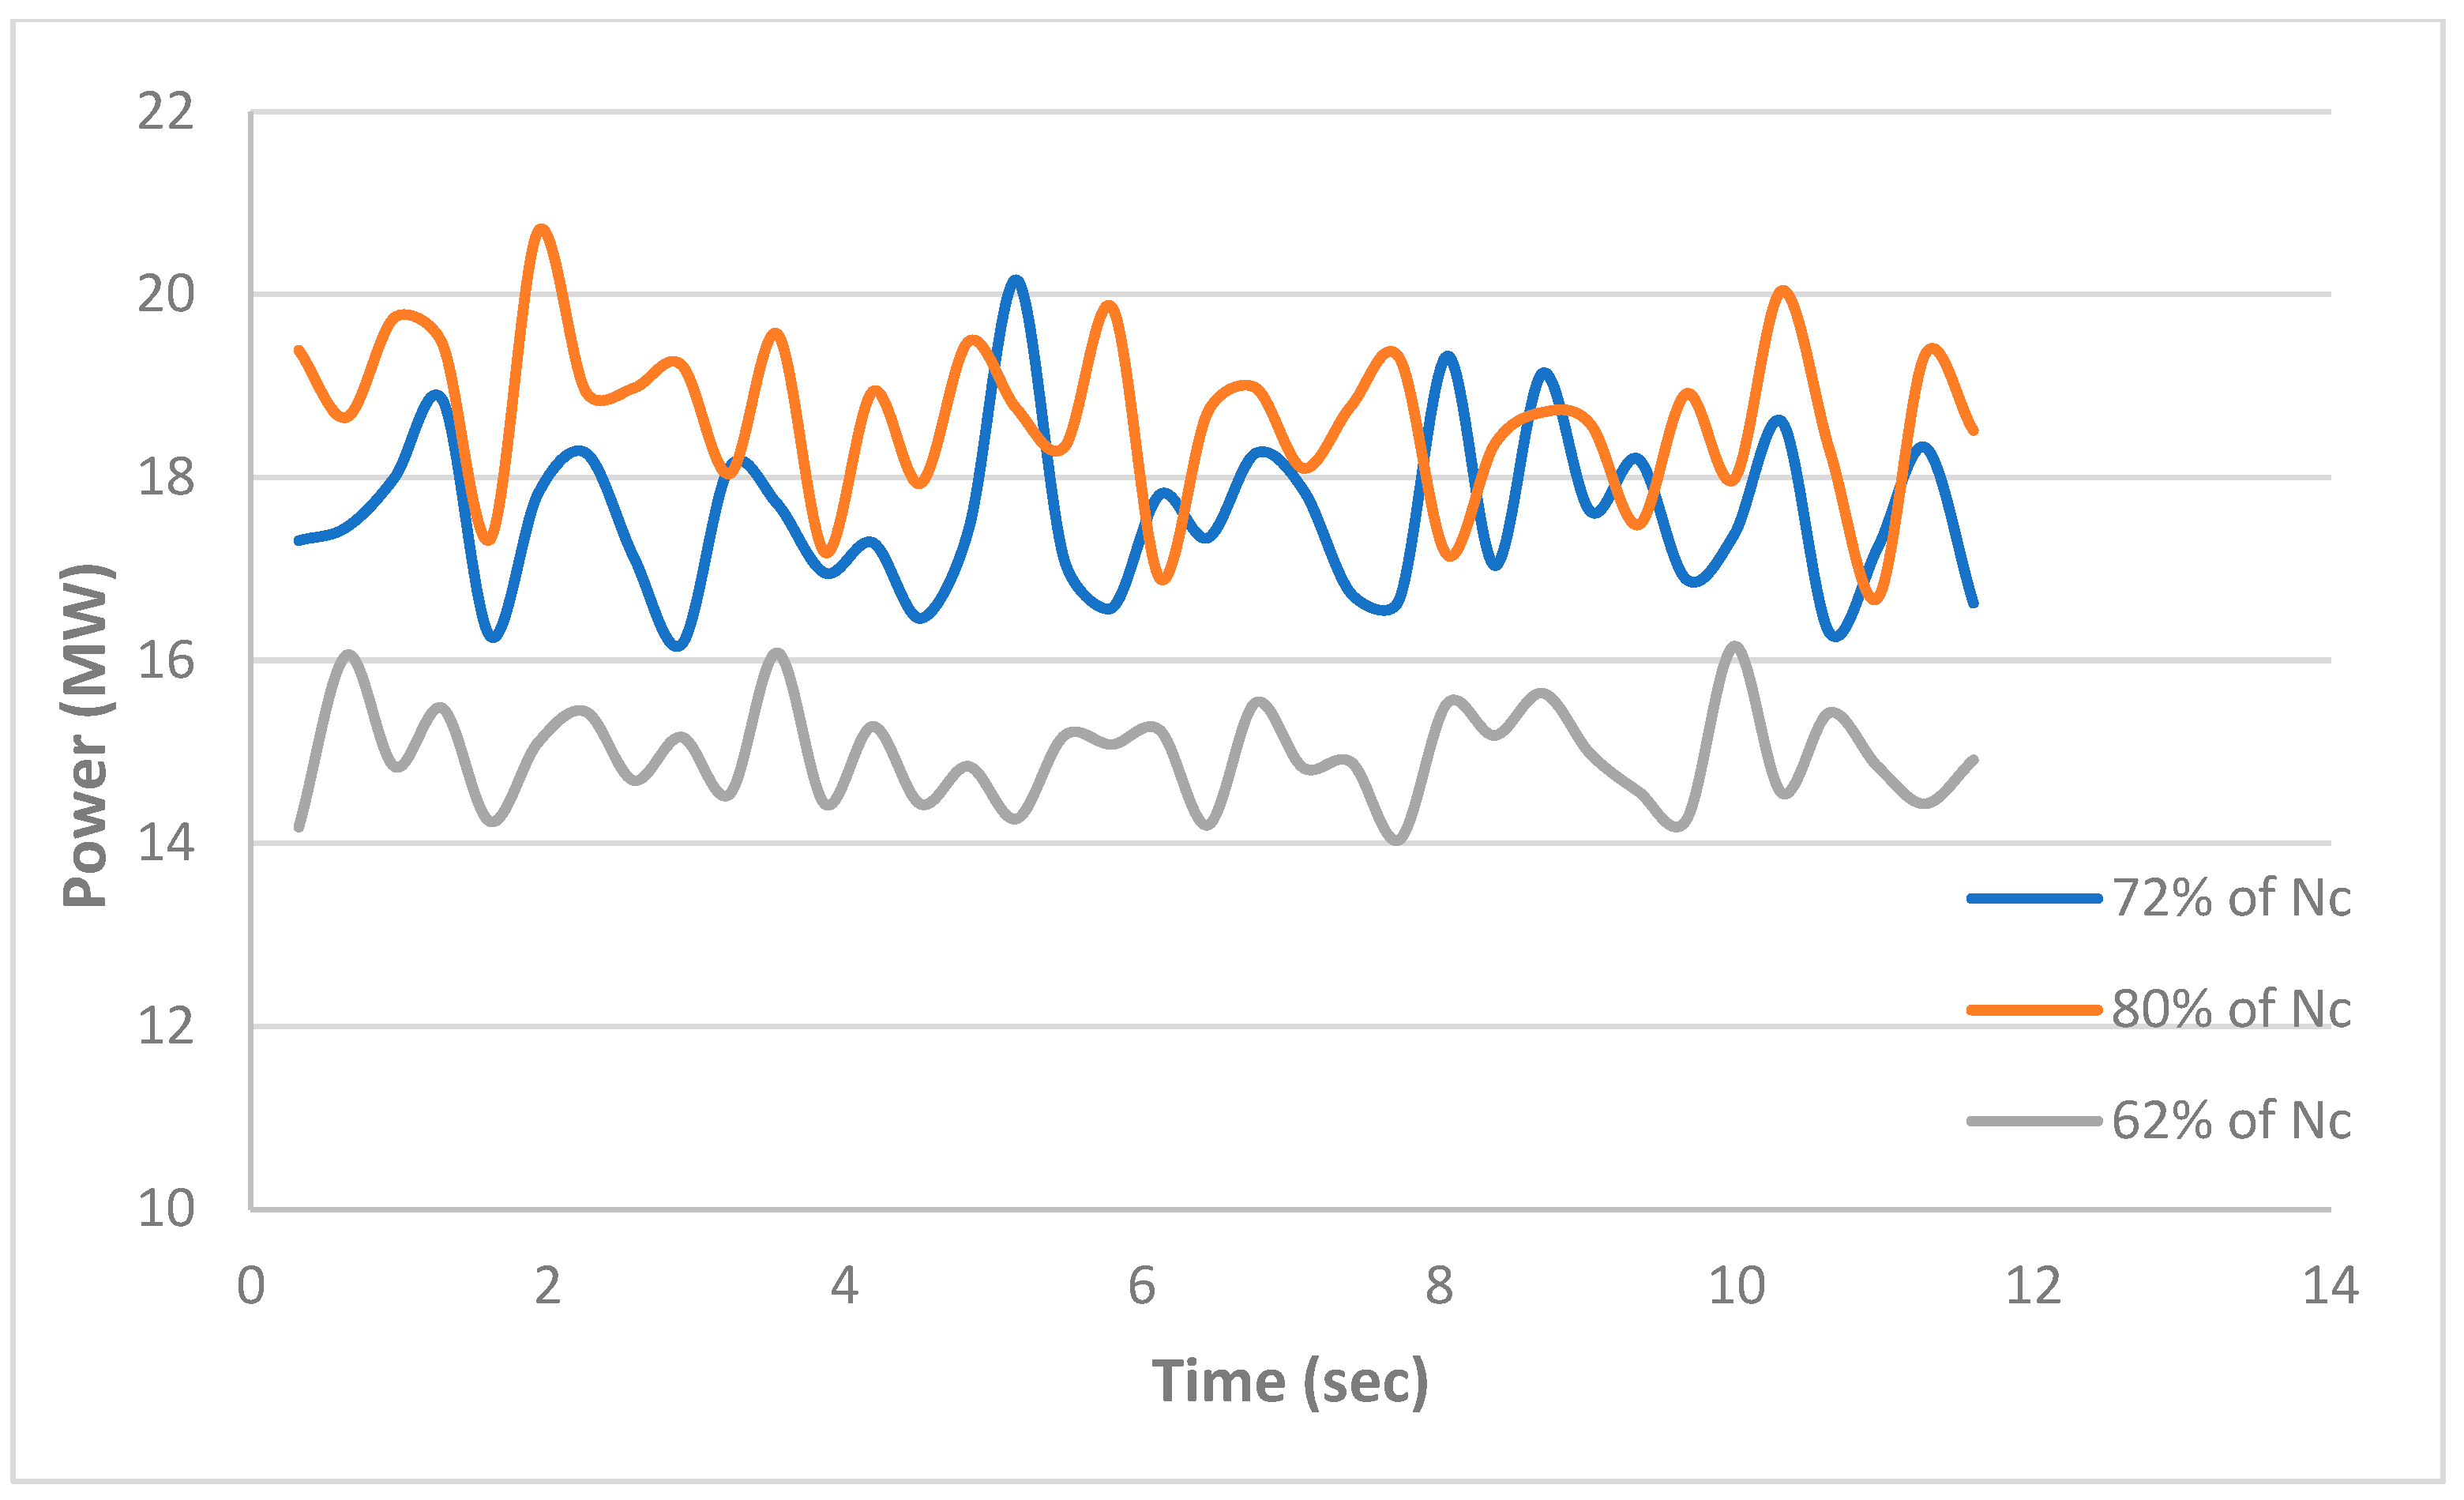
4.2. Mill Power Draw

For mills operating under similar conditions, power variation can be a useful indicator of expected mill performance. It is seen in Figure 4 that the higher the steel ratio, the higher the power draw.
During the simulation, the mill power draw and power dissipation by the balls are recorded. The power is based on the summation of the torque of the balls acting against the mill shell, while dissipated power is based on energy losses by the balls. The dissipated power can be split into damping loss during elastic deformation (represented as overlap in the spring and dashpot model) and frictional loss. Damping loss is the power loss due to both normal and tangential elastic deformation that is modelled by the dashpot in the DEM model. The frictional power loss is due to the rubbing action as sliding occurs between the particle and wall surfaces. The summation of damping and frictional loss gives the total power loss; hence, the load behaviour can be further studied by analysing the split between damping and frictional loss.
Analysis of the power draw split between damping and frictional loss enables the evaluation of the load behaviour within the mill. Power draw dominated by damping loss indicates high-energy trajectories that deliver the much-needed kinetic energy to crush the coarse rocks. This behaviour is mostly associated with SAG mills. Frictional loss domination in the power draw split indicates that the charge behaviour is mostly cascading with low-energy trajectories.
As can be seen in Figure 4, the average power draw is directly proportional to the volume of the mill charge occupied by the steel balls. This is attributed to the difference in density between the rocks (ore) and the steel balls, which makes that of the ore insignificant. In practical mineral processing circuits, the density of steel ranges between 7.75 and 8.00 g/cm3 whilst ore ranges between 2.40 and 2.85 g/cm3; hence, the observed power draw trend.
Power draw has been a subject of key research interest, and models have been proposed for mills [23,24,25] and, more specifically, for SAG mills [26,27,28]. The Austin model [27], presented in Equation (4), which is reasonably accurate, is used here to compare with the DEM simulated power at different ball-to-ore ratios, and the comparison is presented in Figure 5.
P = K D 2.5 L ( 1 A J t o t a l ) 1 ε B ρ s o l i d s w c J t o t a l + 0.6 J b a l l s ρ b a l l s ρ s o l i d s w c ϕ c 1 0.1 2 9 10 ϕ c
where A and K are empirical fitting factors, D is the mill diameter inside the liners (m), Jtotal is the mill filling level, as a fraction of total mill volume (e.g., 0.3 for 30%), Jballs is the ball fill fraction of the total mill volume, L is the mill effective grinding length (m), P is the power evolved at the mill shell (kW), wc is the weight fraction of rock in water and rock in the mill, taken as 0.8, εB is the porosity of the rock and ball bed, as a fraction of total bed volume, ρsolids is the density of the ore component (t/m3) and ϕC is the mill speed, as a fraction of the mill critical speed (e.g., 0.75 for 75%)
The ore particle and slurry density were kept constant throughout all the simulations. Furthermore, as the fraction of the ore increased in the charge, the observed power draw trend occurred because the small ore particles preferentially sit against the mill lifters, whose ability to lift and throw the steel balls is dependent on the extent of contact between the lifters and the steel balls. As observed by Lameck et al. [29], the position of the toe and the shoulder angles is critical for load behaviour. Ore particles that build up on the lifter surface make the ball roll off the lifters more easily, resulting in an overall lower shoulder position and less cataracting. This results in a lower count of high collision impact as the fine particles in the mill increase.

4.3. Energy Dissipation

Figure 6 shows the trends of the damping and frictional power loss. The summation of the two gives the mill power draw, excluding drive motor inefficiencies and other energy losses such as heat and sound. The mill power draw is dominated by impact loss, which indicates more cataracting occurring than cascading. The cataracting behaviour is characterised by a significant fraction of balls being in free flight after departure from the shoulder. The resulting impacts are high-stress events that break particles at the toe but can equally damage the balls, especially if the cushioning particles are limited.
The trend on the frictional energy loss shows an increase in the frictional power loss with an increase of ore (rocks) in the mill. As more rocks are added to the charge, they fracture easily than steel balls, representing a progeny of ore particles varying in size from the largest ore particle fed into the mill to the smallest particle that exits the mill. The small ore particles respond to breakage through abrasion and attrition rather than impact. Hence, the particles fracture and lose weight on account of the rubbing action between ore particles and steel balls, mill liners or other ore particles. This results in more power loss due to friction than damping.
In practical mineral processing grinding mills and engineering systems, an increase in the cataracting fraction of the charge will increase breakage rates of the coarse particles whilst subjecting the grinding balls to significant stress due to the impact loading. On the other hand, if the cascading fraction exceeds the cataracting fraction, the result is more power loss due to friction, finer grinds and increased wear rate of both the grinding balls and mill liners.
While these studies refer to a specific 11.6 diameter industrial mill running at 9 rpm, which is equivalent to 72% of critical speed, the impact of mill speed was explored on the overall mill performance, based on an extreme case of using steel media only. Thus, the effect of speeds 10% lower and 10% higher than the mill under review were assessed. In Figure 7, it is seen that the drive power rises with increasing mill speed. It was also observed that there are fewer power fluctuations for the slower speed of 62% of critical speed. From these results, it is suggested that from a ball preservation perspective, a slower speed would be preferred; however, this would also be dependent on the desirable comminution treatment for the target ore, which is beyond the scope of this work. The impact spectra in Figure 7 also confirm a severe escalation of high-impact energy events with increasing mill speed.
In Figure 8, the particle position density plots show how the load expands with a cataracting increase as the mill speed increases. For both 62% and 72% of critical speed, the charge is falling within the toe position, thus, there is a high probability of cataracting balls impacting the liner directly; hence, it would not be a recommended option.

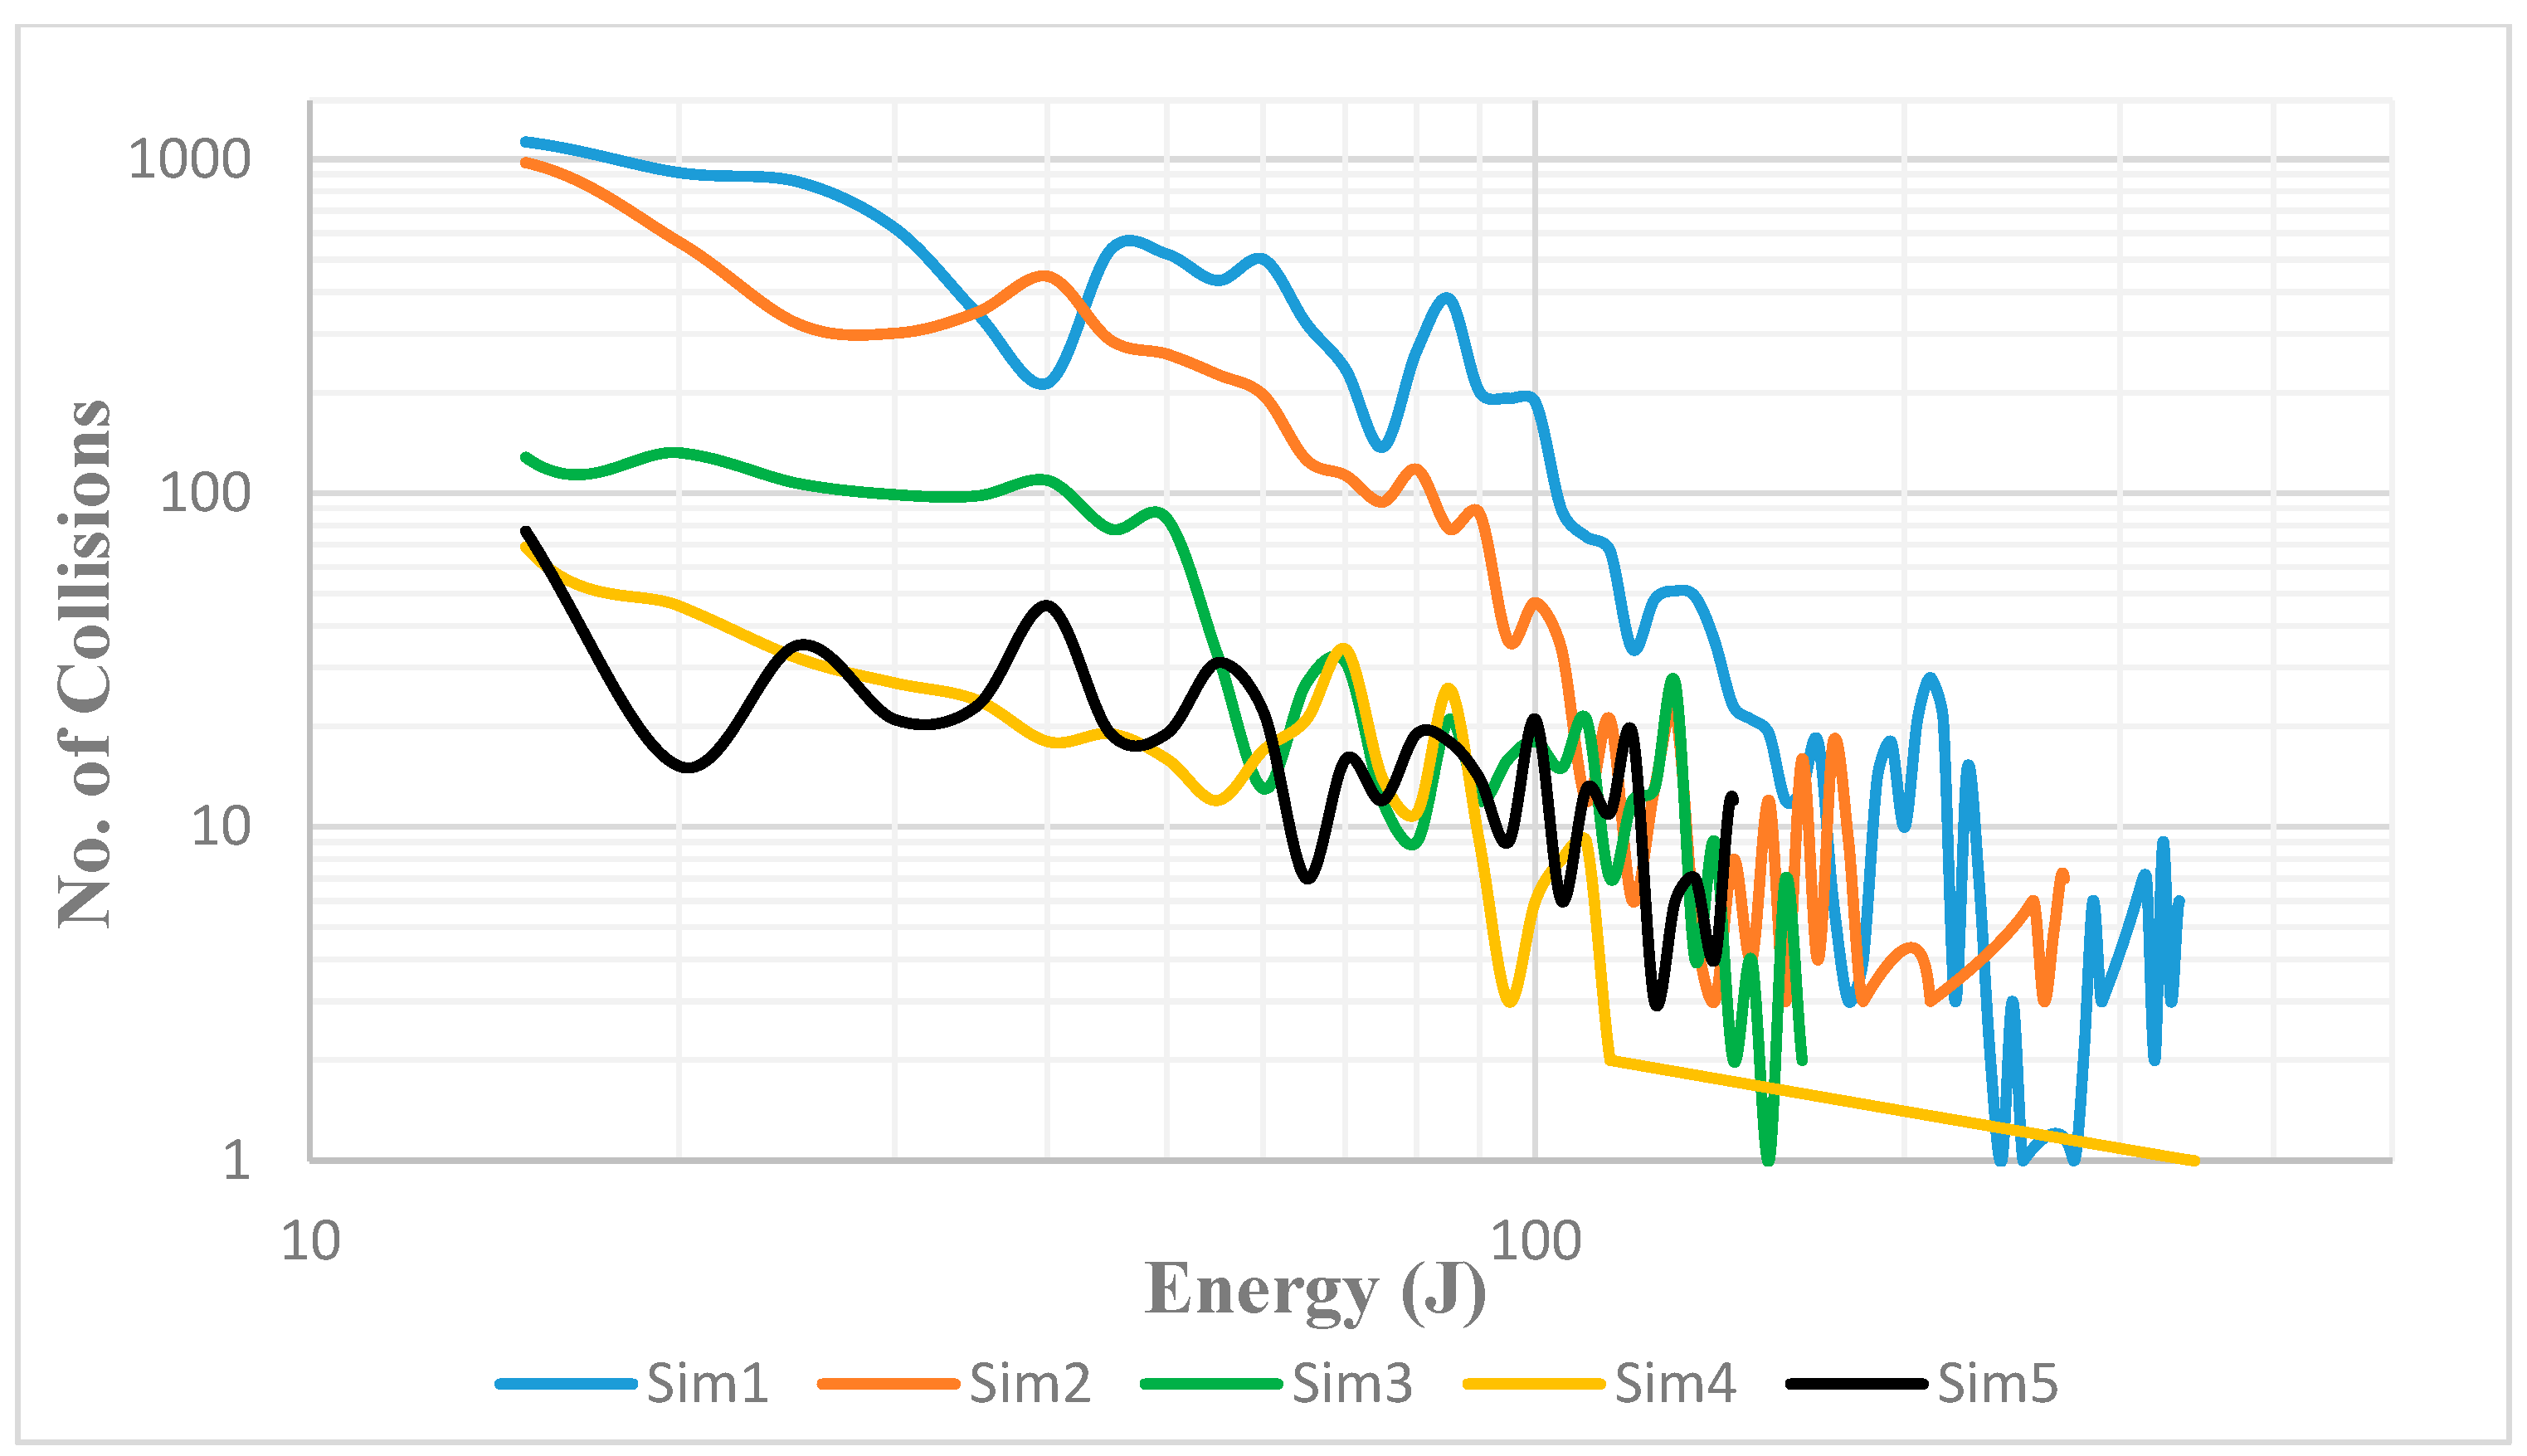
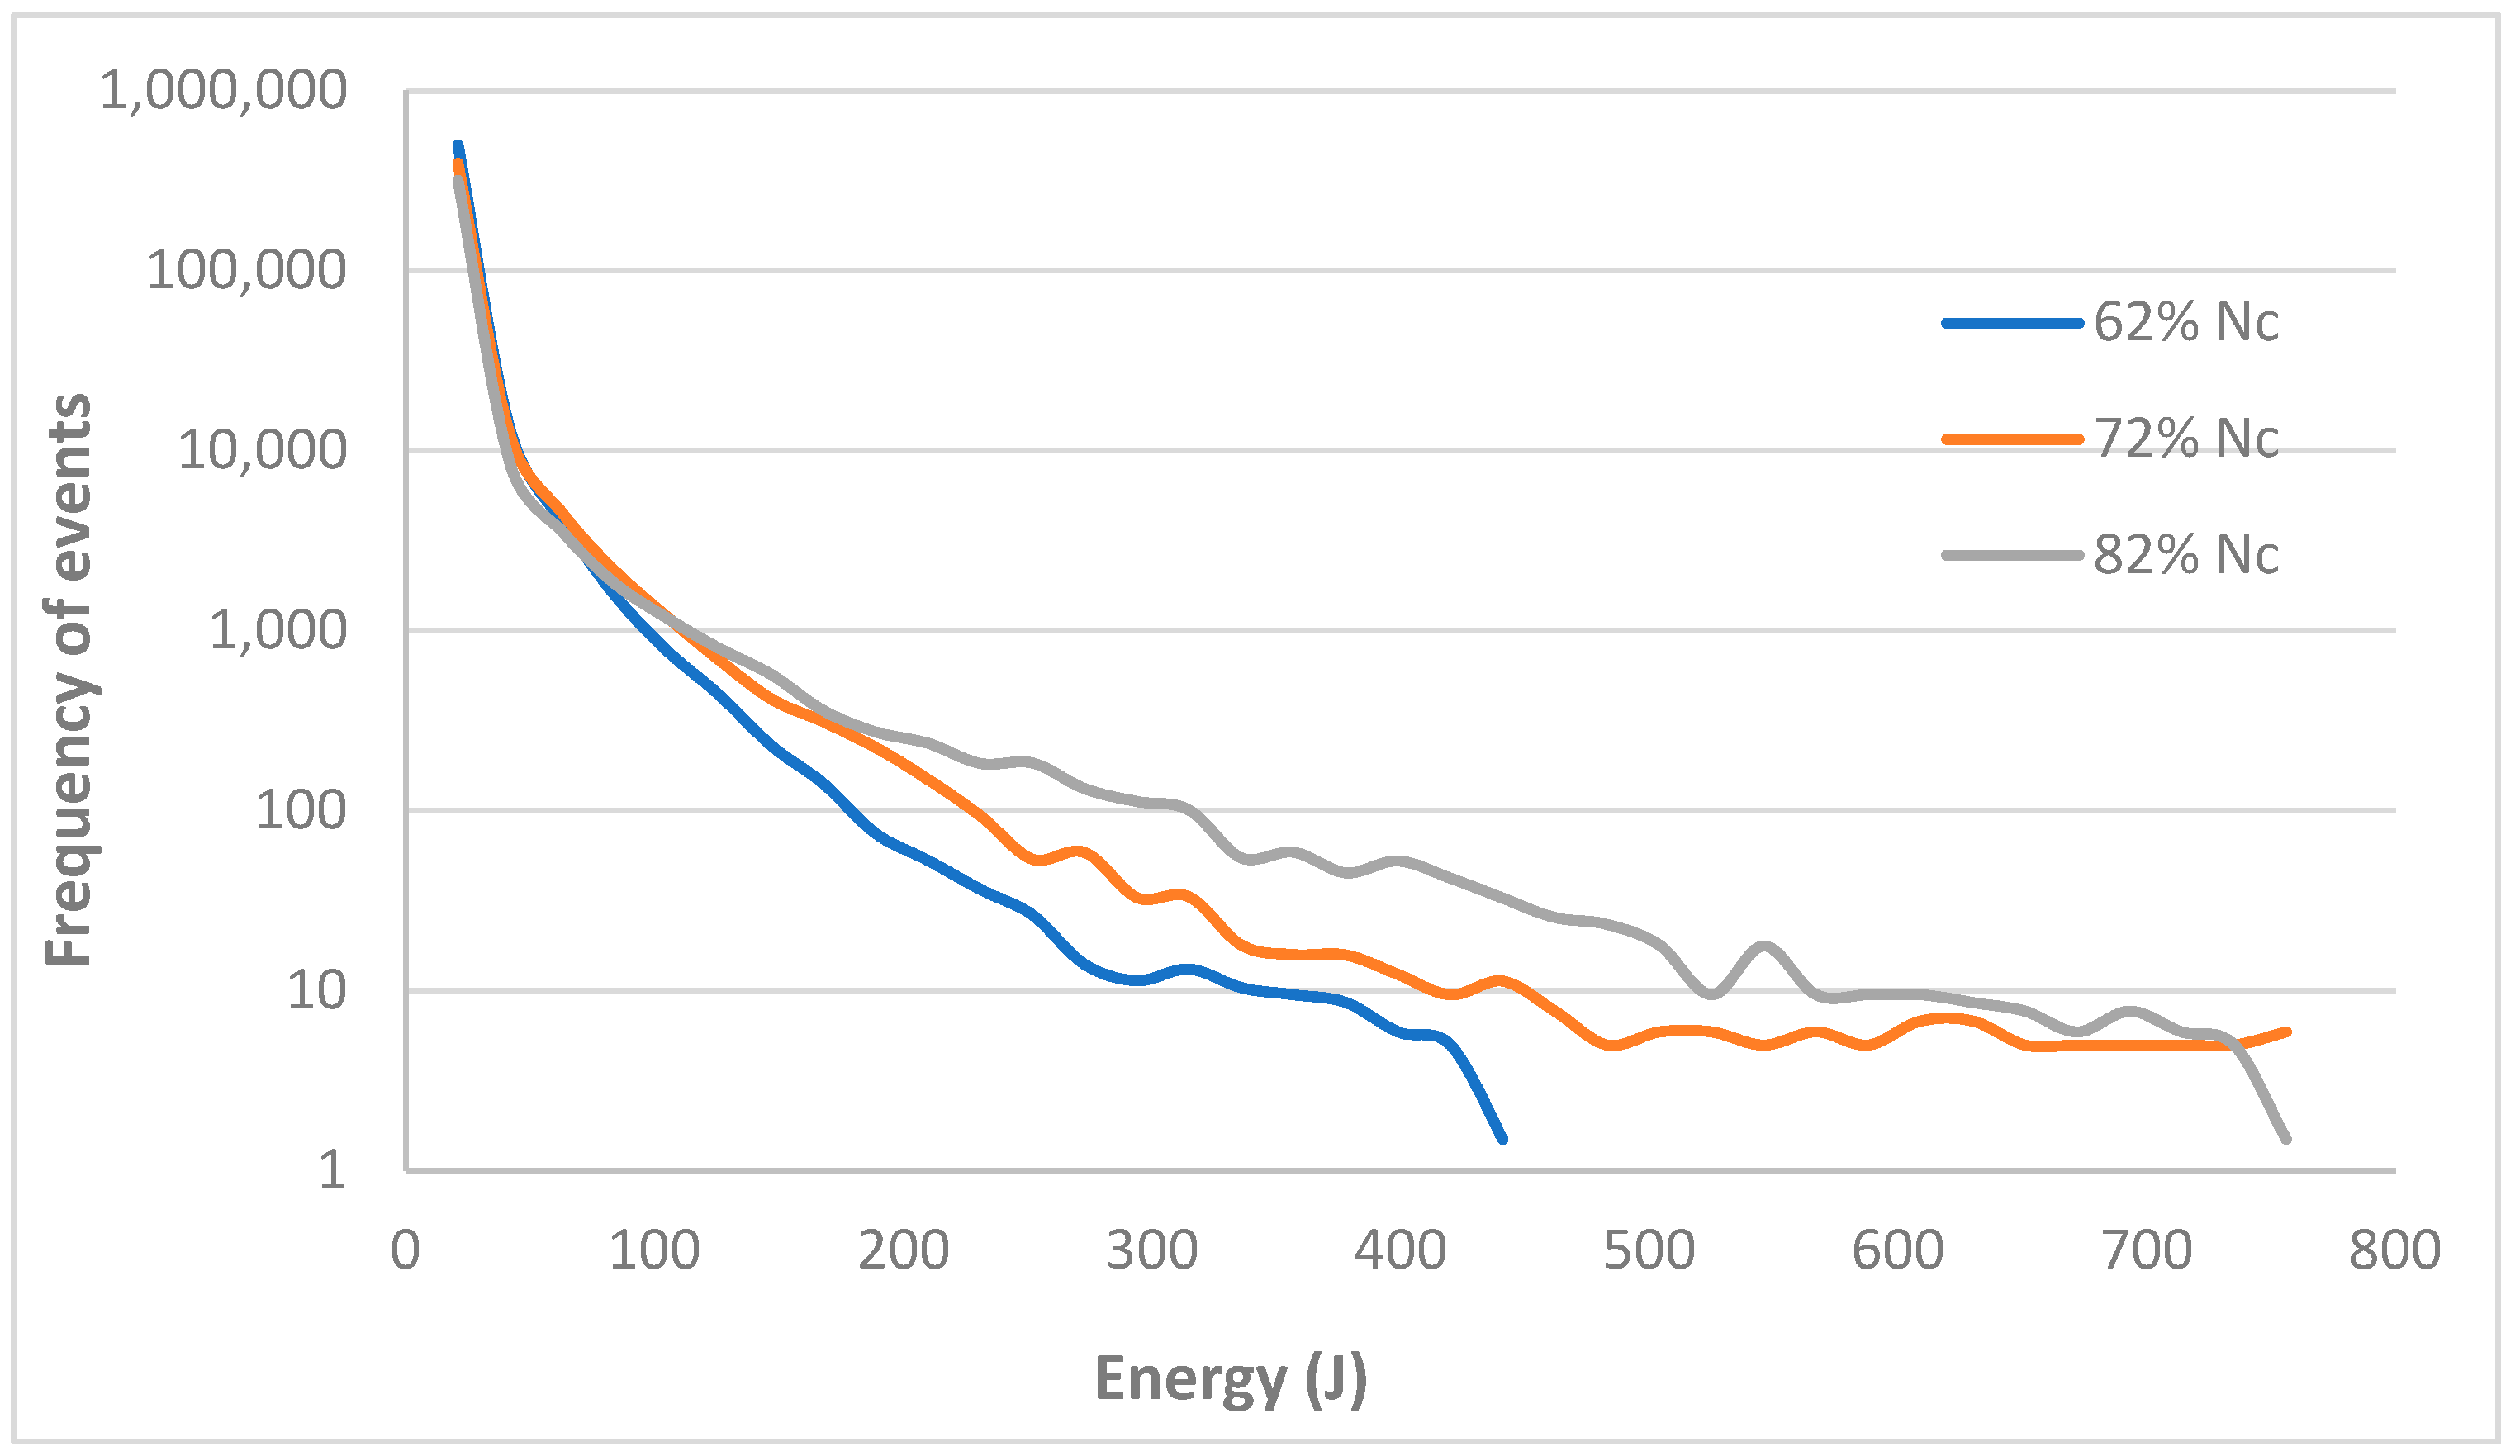
4.4. Impact Energy Spectra (IES)

The IES is a record of the collisions that occurred during the mill simulation period populated into regular energy classes. The size of the energy class is dependent on the geometry of the mill. It should be noted that small energy classes are more definitive than larger classes but at the expense of more computational time. Hence, in this work, a 5 J energy class was selected, which resulted in reasonable computational time whilst the important data, such as the number of collision events and energy involved in collisions, was retained. The technique analyses the prevailing forces within a mill, and its data, combined with the physical ore fracture probability data determined by drop weight tests, can be used to calculate particle breakage within the mill. The use of the IES to determine ore breakage rate has been well described by other researchers [5,30,31,32]. The IES concept can be extended to evaluate the stress induced into the steel balls resulting from the load behaviour and prevailing forces in the mill. Figure 9 shows the IES of the various simulations conducted for different ball-to-ore ratios.
As expected, there are more low-energy than high-energy collision events. The low-energy collisions are mostly common in the cascading region of the mill, whilst the high-energy collisions result from the cataracting fraction of the charge. The maximum collision events occurred in the charge consisting of steel balls only, where the mill shows the highest shoulder position and the trajectories are not cushioned by the ore. This confirms the findings in earlier research [33,34], which showed that the steel ball ratio among the fill level ratio and linear height have a greater influence on the energy distribution in a SAG mill. As the ball-to-ore ratio shifted from mostly steel balls to mostly ore, the number of events in low-energy classes increased while high-energy collision events diminished. This is owing to the difference between the densities of the steel balls and the rocks. Because of the low density of the ore, they tend to cushion some of the impact energy as the balls collide at the toe from free flight. In industrial mineral processing units, the ore cushions the balls from high-energy collisions that can potentially fracture the balls but at the expense of the breakage rate of the large rocks. Furthermore, the build-up of ore particles on the lifter surface results in the earlier media departure from the mill shell. This results in the reduction of both trajectory height and the cataracting fraction of the ore, which thus translates to a high ball wear rate and the inverse proportionality relationship between the impact energy and the ore fraction within the charge.
To further assess the effect of ball diameter on energy, the simulation history of a set of ten (10) 125 mm diameter steel balls was tracked in each of the five simulations described in Table 2. In each simulation, the maximum energy exposed to each 125 mm diameter steel ball was evaluated by averaging the maximum energy that each of the tracked 10 balls was exposed to in that simulation. This was repeated for all the other simulations. Another simulation was performed using only 100 mm diameter steel balls without any ore particles, which replaced the volume of 125 mm balls to determine the effect of ball size on the energy collision spectra. Figure 10 shows the averaged maximum energy that 125 mm diameter and 100 mm diameter steel balls were exposed to in the various simulations.
The first simulation shows the highest collision energy events because it was only 125 mm steel balls involved in the collisions without any rocks. As the ball-to-ore ratio decreases, the energy collision events correspondingly decrease due to the cushioning effect provided by the ore, as mentioned earlier. This implies that the use of 125 massive mm balls will have a higher susceptibility to damage, even if cushioning particles are present. The overall effect is that the large size and mass of 125 mm balls exposes them to severe collisions that involve high energy; hence, increasing their probability of fracture more than smaller ball sizes, such as 100 mm balls.
The severity of ball-on-ball and ball-on-wall collisions decreases from ‘Sim1’ to ‘Sim5’. Thus, the optimisation of the SAG mill in terms of the ball-to-ore ratio should aim to achieve the required ore breakage rates at the least possible ball load because:
-
lower ball load results in more cushioning of the high-energy collisions that have the potential to fracture the balls;
-
a reduction in ball load results in a SAG operation that is more power effective;
-
reducing the ball load of the charge will significantly reduce the cost of grinding since grinding media replenishment can account for up to 45% of grinding costs;
-
using smaller ball sizes reduces ball damage probability.
Even though the ball-on-ball collisions for the 100 mm balls were aggressive, the highest collision energy recorded was only 387 J. This value is 42% less than Sim5, which constitutes 125 mm diameter steel balls and the highest ore fraction. This clearly shows the significance of ball size on the susceptibility to impact damage. Thus, large balls like the 125 mm diameter steel balls are easily exposed to more severe collisions, even when rock particles are present.
Figure 11 shows the IES of the set of 10 tracked 125 mm diameter steel balls in each simulation. As can be seen in the figure, the tracked balls experience relatively higher energy events with decreased ore fraction. However, occasionally, high-energy events have been observed in higher ore fraction environments, thus making ball breakage possible, albeit less frequently. This is in line with what has been observed in industrial SAG mills with ball filling as low as 3%–5%, where chipped and broken balls were found in the discharge scats. Most SAG grinding operations currently use ball sizes between 100 and 150 mm. However, in most cases, the use of these ball sizes has not been justified by a phenomenological analysis of the real effect on the grinding process but rather by trial and error.
As for the mill speed, the impact spectra are presented in Figure 12. This is even more definitive as it indicates quantitatively the distribution of stressful impact events. The impact spectra indicate that even the current mill speed is considerably risky if the steel media content were to rise to 100%.
What is presented in Figure 7, Figure 8 and Figure 12 emphasises that mill speed is an important optimisation criterion for achieving efficient grinding while minimising both ball and liner damage.

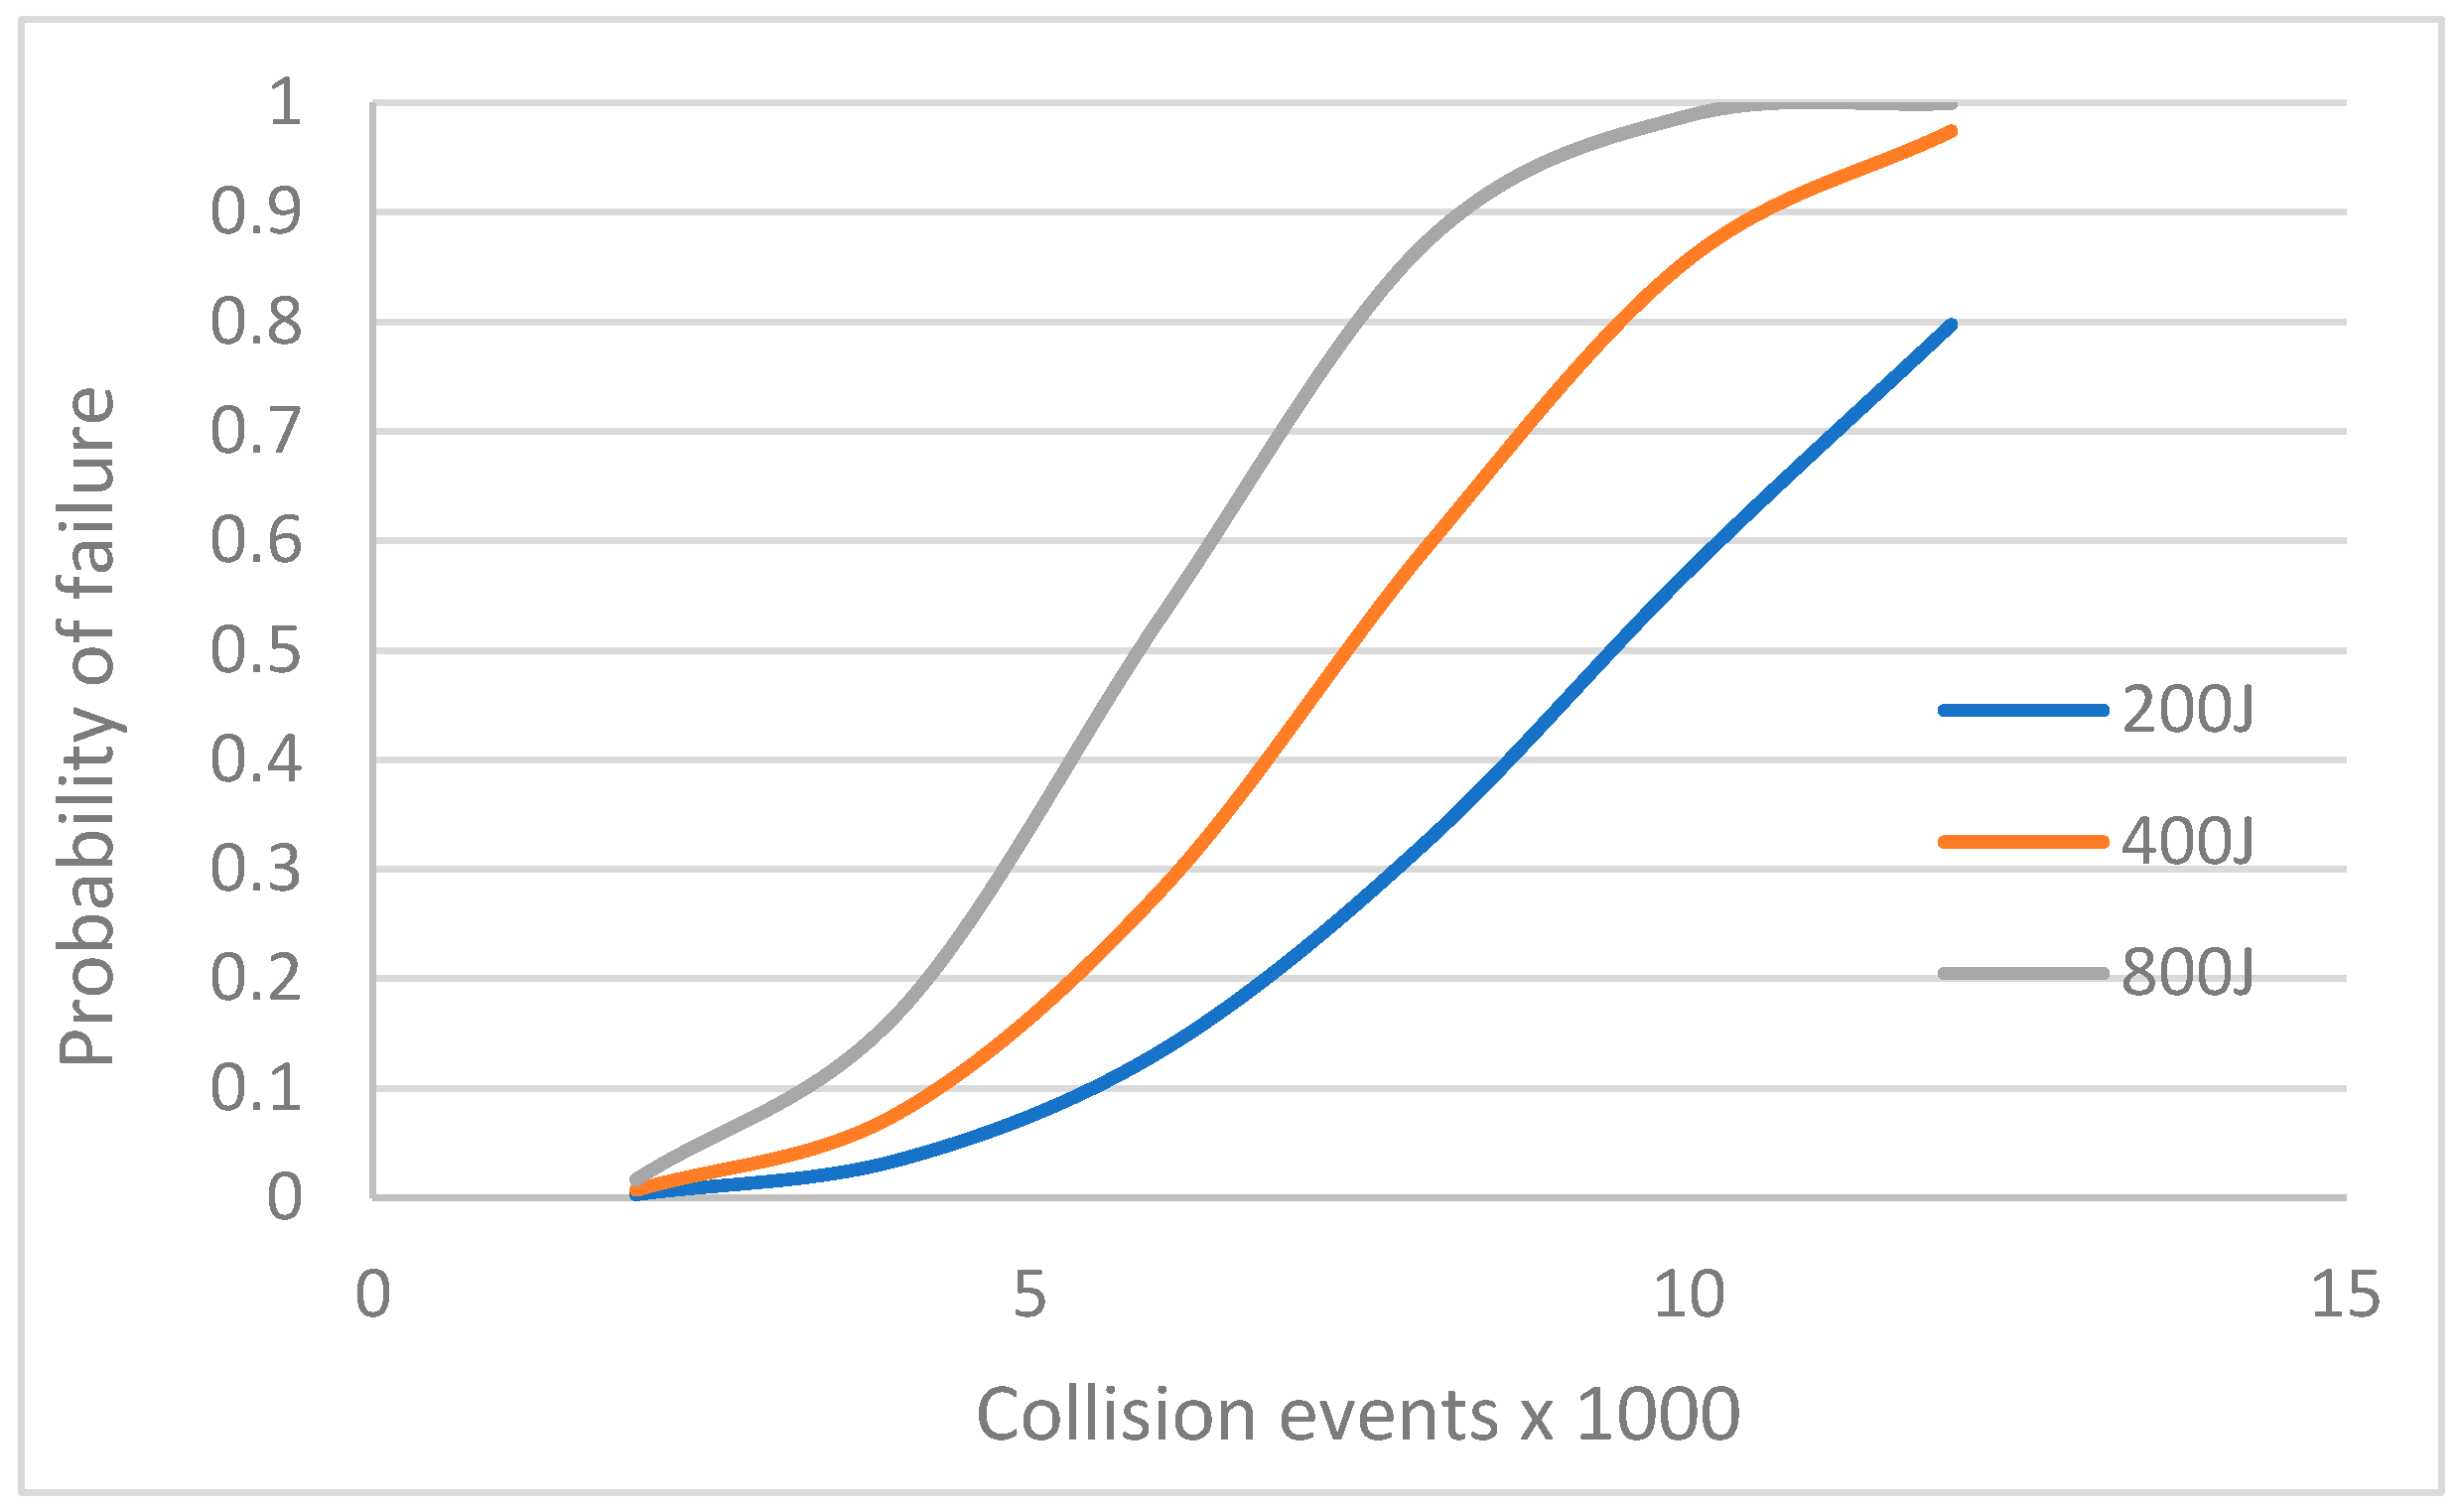
4.5. Predicting Fracture of Steel Balls in SAG Mills

Steel ball fracture is not uncommon in SAG mills. The failure of the steel balls is attributed to both the quality of the balls and the energy that they are exposed to. The factors that affect ball mechanical properties include chemical composition, cleanliness of the steel, as well as the type and effectiveness of the heat treatment procedure applied during manufacturing. Usually, the steel ball manufacturers have a firm grip on these factors and ensure that only good-quality balls finally reach the end consumer. However, the environment in which the balls operate, the type and extent of mechanical loading that the balls are exposed to, also have a significant effect on the fracture characteristics of the balls.
Cataracting behaviour exposes both the ore and the grinding balls to impact loading that causes rock fracture. However, the high energy provided by the cataracting load behaviour also exposes the grinding balls to impact loading that stresses the grinding balls until breakage occurs.
To provide some guidelines on how to quantify the frequency of ball damage and breakage expected in a mill environment, reference is made to Equation (5), developed in a study that evaluated the drop weight test [35].
P b = 1 e x p a n b X c
where X is the particle size, n is the number of energy loading events, and a, b and c are model parameters.
Equation (5) can be expressed in terms of energy rather than particle size since the corresponding energy associated with these particles is known and only the values of the parameters change, while the model fit remains the same.
P b = 1 e x p a n b E c  
Based on this modified Equation (6), it becomes possible to plot the breakage probabilities as in Figure 13.
From Figure 13, it can be seen that the higher the cyclic loading energy, the higher the probability of reaching the failure point. For example, if a ball is subject repeatedly to 5000 collision events, there is a 40% chance of failure if the energy level is 800 J, 20% at 400 J and 10% at 200 J. It can thus be appreciated that managing the energy levels is paramount.
From the DBT analysis [35], it was observed that the frequency of collision events increases the probability of ball’s eventual failure, but it was clear that pre-existing flaws in the balls are an even more significant factor. Additionally, since the chance of the existence of flaws is higher in big balls, it follows that this will have a compounding effect when large balls are used, as they will have both a high likelihood of flaws as well as get more subjected to higher energy collision events.
The quantification of the stress induced into the steel balls because of impact loading requires knowledge of the energy involved in the cataracting trajectories. The DEM impact energy spectra (IES) thus have proved to be reliable in providing useful information needed to predict the stress induced into the grinding balls.

5. Conclusions

Charge dynamics in SAG mills remain a complex topic for study. However, as this work has demonstrated, the quantification of the stress induced in the steel balls during the SAG process aids grinding media manufacturers in further developing the steel balls so that they can improve their performance capabilities within their service environments. The failure of the steel balls is attributed to both the quality of the balls and the energy to which they are exposed. The environment in which the balls operate, along with the type and extent of mechanical loading they endure, also significantly affects the fracture characteristics of the balls. The analysis of the ball-to-ore ratio and mill speed has shown that larger balls, such as 125 mm balls, have a greater susceptibility to damage, even in the presence of cushioning particles. Moreover, their mass and size make them prone to severe collisions involving high energy, thereby increasing their likelihood of fracture compared to smaller ball sizes, such as 100 mm balls. Both the mill speed and a higher ball-to-ore ratio elevate the shoulder position, which, in turn, enhances the cataracting fraction of the charge. Although this causes the breakage rates of coarse particles to rise, which is advantageous, the grinding balls endure significant stress due to impact loading. In contrast, a decrease in the ball-to-ore ratio results in increased power loss due to friction, low-energy collisions, finer grinds, and a heightened wear rate of both the grinding balls and mill liners. Therefore, it is essential to strike a balance, and that necessitates further research to optimise the charge mixture in SAG mills. Likewise, the information discussed enables SAG mill operators to further understand these machines and the factors that affect the performance, survivability and fracture prediction of the steel balls in such high-impact loading environments. It has also been demonstrated that large balls, such as 125 mm, are prone to fracture even when they comprise a small fraction, and using ball diameters not greater than 100 mm would be recommended to reduce the probability of ball damage in SAG mills.

Author Contributions

Conceptualisation, M.M.B., N.C. and O.S.S.; methodology, M.M.B. and O.S.S.; software, M.M.B.; validation, M.M.B., N.C. and O.S.S.; formal analysis, M.M.B., N.C. and O.S.S.; investigation, O.S.S.; resources, M.M.B.; data curation, M.M.B. and O.S.S.; writing—original draft preparation, O.S.S.; writing—review and editing, M.M.B., N.C. and O.S.S.; visualisation, M.M.B.; supervision, M.M.B. and N.C.; project administration, M.M.B.; funding acquisition, M.M.B. All authors have read and agreed to the published version of the manuscript.

Funding

Scaw metals South Africa.

Data Availability Statement

Data will be shared upon request.

Acknowledgments

The technical assistance and funding support of Scaw Metals South Africa is gratefully acknowledged.

Conflicts of Interest

The authors declare no conflicts of interest.

References

  1. Royston, D. Semi-autogenous grinding (SAG) mill liner design and development. Miner. Metall. Process. 2007, 23, 121–132. [Google Scholar] [CrossRef]
  2. Owusu, K.B.; Zanin, M.; Skinner, W.; Asamoah, R.K. AG/SAG mill acoustic emissions characterisation under different operating conditions. Miner. Eng. 2021, 171, 107098. [Google Scholar] [CrossRef]
  3. Yang, F.X. Research on Optimization of Working Parameters of SAG Mill. Master’s Thesis, Central South University, Changsha, China, 2013. [Google Scholar]
  4. Xie, Q.; Zhong, C.; Liu, D.; Fu, Q.; Wang, X.; Shen, Z. Operation Analysis of a SAG Mill under Different Conditions Based on DEM and Breakage Energy Method. Energies 2020, 13, 5247. [Google Scholar] [CrossRef]
  5. Owen, P.; Clearly, P.W. The relationship between charge shape characteristics and fill level and lifter height for a SAG mill. Miner. Eng. 2015, 83, 19–32. [Google Scholar] [CrossRef]
  6. Pourasiabi, H.; Gates, J.D. Ball mill abrasion test (BMAT): Method development and statistical evaluations. MethodsX 2022, 9, 101900. [Google Scholar] [CrossRef]
  7. Pax, R.A.; Cornish, B. Understanding Size Effects of Semi-autogenous Grinding (SAG) Mill Operation as a Pathway to Solving Feed Disturbances—Case Study Using the MMG Century SAG Mill. In Proceedings of the 13th AusIMM Mill Operators’ Conference 2016, Perth, Australia, 10–12 October 2016; The Australasian Institute of Mining and Metallurgy: Perth, WA, Australia, 2016; pp. 321–329. [Google Scholar]
  8. Pax, R.; Thornton, A. Real time measurement and fast control strategies for the optimal operation of grinding circuits. In Proceedings of the MetPlant Conference, Perth, Australia, 10–11 September 2019; pp. 132–147. [Google Scholar]
  9. Sun, Y.I.; Dong, M.; Mao, Y.; Fan, D. Analysis on Grinding media Motion in Ball Mill by Discrete Element Method. In Proceedings of the 1st International Conference on Manufacturing Engineering, Quality and Production Systems, Brasov, Romania, 24–26 September 2009; Volume I, pp. 227–231. [Google Scholar]
  10. Jonsén, P.; Pålsson, B.I. and Häggblad, H.Å.A novel method for full-body modelling of grinding charges in tumbling mills. Miner. Eng. 2012, 33, 2–12. [Google Scholar] [CrossRef]
  11. Weerasekara, N.S.; Powell, M.S.; Cleary, P.W.; Tavares, L.M.; Evertsson, M.; Morrison, R.D.; Quist, J.; Carvalho, R.M. The contribution of DEM to the science of comminution. Powder Technol. 2013, 248, 3–4. [Google Scholar] [CrossRef]
  12. Cleary, P.W. and Sinnott, M.D. Simulation of particle flows and breakage in crushers using DEM: Part 1—Compression crushers. Miner. Eng. 2015, 74, 178–197. [Google Scholar] [CrossRef]
  13. Liu, Y.; Yu, Z.S.; Yang, J.C.; Wassgren, C.; Curtis, J.S.; Guo, Y. Discrete Element Method Investigation of Binary Granular Flows with Different Particle Shapes. Energies 2020, 13, 1841. [Google Scholar] [CrossRef]
  14. Cleary, P.W.; Sinnott, M.D.; Morrison, R.D. Prediction of slurry transport in SAG mills using SPH fluid flow in a dynamic DEM-based porous media. Miner. Eng. 2006, 19, 1517–1527. [Google Scholar] [CrossRef]
  15. Mishra, B.K. and Rajamani, R.K. The discrete element method for the simulation of ball mills. Appl. Math. Model. 1992, 16, 598–604. [Google Scholar] [CrossRef]
  16. Bwalya, M.M. Using the Discrete Element Method to Guide the Modelling of Semi and Fully Autogenous Milling. Ph.D. Thesis, University of the Witwatersrand, Johannesburg, South Africa, 2005. [Google Scholar]
  17. Collinao, E.; Poblete, M.; Tavares, M. Preliminary validation of DEM-FEM coupling to predict mechanical stresses in SAG mill liners. In Proceedings of the International Conference on Semi-Autogenous and High Pressure Grinding Technology, Vancouer, BC, Canada, 20–24 September 2015. [Google Scholar]
  18. Paul, C.; Rob, W.; Morrison, D.; Sinnott, M.D. Prediction of slurry grinding due to media and coarse rock interactions in a 3D pilot SAG mill using a coupled DEM+ SPH model. Miner. Eng. 2020, 159, 106614. [Google Scholar]
  19. Delaney, G.W.; Cleary, P.W.; Morrison, R.D.; Cummins, S.; Loveday, B. Predicting breakage and the evolution of rock size and shape distributions in Ag and SAG mills using DEM. Miner. Eng. 2013, 50–51, 132–139. [Google Scholar] [CrossRef]
  20. Cleary, P.W.; Morrison, R.D. Understanding fine ore breakage in a laboratory scale ball mill using DEM. Miner. Eng. 2011, 24, 352–366. [Google Scholar] [CrossRef]
  21. Govender, N.; Rajamani, R.K.; Kok, S.; Wilke, D.N. Discrete element simulation of mill charge in 3D using the BLAZE-DEM GPU framework. Miner. Eng. 2015, 79, 152–168. [Google Scholar] [CrossRef]
  22. Polycarpou, A.A. Measurement and Modeling of Normal Contact Stiffness and Contact Damping at the Meso Scale. J. Vib. Acoust. 2005, 127, 52–60. [Google Scholar]
  23. Bond, F.C. Grinding Ball Size Selection. Mining Engineering. AIME Trans. 1958, 211, 592. [Google Scholar]
  24. Hogg, R.; Fuerstenau, D.W. Power Relationship for Tumbling Mills. Trans. Soc. Min. Eng.–AIME 1972, 252, 418–432. [Google Scholar]
  25. Moys, M. A model of mill power as affected by mill speed, load volume, and liner design. J. S. Afr. Inst. Min. Met. 1993, 93, 135. [Google Scholar]
  26. Loveday, B.K. Prediction of Autogenous Milling from Pilot Plant Tests. In Proceedings of the 11th Commonwealth Mining and Metallurgical Congress, Hong Kong; The Institution of Mining and Metallurgy: London, UK, 1978. [Google Scholar]
  27. Austin, L.G. A mill power equation for SAG mills. Miner. Metall. Process. Soc. Min. Metall. Explor. 1990, 7, 57–63. [Google Scholar] [CrossRef]
  28. Dunne, R.; Morrell, S.; Lane, G.; Valery, W.; Hart, S. Design of the 40 Foot Diameter SAG Mill Installed at the Cadia Gold Copper Mine. In Proceedings of the International Conference on Autogenous and Semiautogenous Grinding Technology 2001, Vancouver, BC, Canada, 30 September–3 October 2001; pp. I-43–I-58. [Google Scholar]
  29. Lameck, N.; Kiangi, K.; Moys, M. Effects of grinding media shapes on load behaviour and mill power in a dry ball mill. Miner. Eng. 2006, 19, 1357–1361. [Google Scholar] [CrossRef]
  30. Bwalya, M.M.; Moys, M.H.; Hinden, A.L. The use of the discrete element method and fracture mechanics to improve grinding rate prediction. Miner. Eng. 2001, 14, 565–573. [Google Scholar] [CrossRef]
  31. Rajamani, R.; Callahan, S.; Schreiner, J. DEM Simulation of Mill Charge in 3D VIA GPU Computing. Miner. Eng. 2010, 12, 1–12. [Google Scholar]
  32. Dabeet, A.; Wijewickreme, D.; Byrne, P. Application of discrete element modeling for simulation of the cyclic direct simple shear response of granular materials. In Proceedings of the 10th National Conference in Earthquake Engineering, Earthquake Engineering Research Institute, Anchorage, AK, USA, 21–25 July 2014. [Google Scholar]
  33. Cleary, P.W. Effect of rock shape representation in DEM on flow and energy utilisation in a pilot SAG mill. Comput. Part. Mech. 2019, 6, 461–477. [Google Scholar] [CrossRef]
  34. Cleary, P.W.; Owen, P. Effect of operating condition changes on the collisional environment in a SAG mill. Miner. Eng. 2019, 132, 297–315. [Google Scholar] [CrossRef]
  35. Chimwani, N.; Bwalya, M.; Samukute, O. Using Discrete Element Method to Analyse the Drop Ball Test. Minerals 2024, 14, 220. [Google Scholar] [CrossRef]
Figure 1. SAG mill lifter profile.
Minerals 15 00431 g001
Figure 2. SAG mill simulation liner configuration of end view and 3D view of part of the simulated mill slice.
Minerals 15 00431 g002
Figure 3. SAG mill load behaviour (a) stills (b) particle paths.
Minerals 15 00431 g003
Figure 4. Average mill power draw.
Minerals 15 00431 g004
Figure 5. Power trend with increased steel content as predicted by DEM ad Austin SAG power model.
Minerals 15 00431 g005
Figure 6. Power draw split between frictional and damping loss as ball fraction increases, excluding motor inefficiencies and other energy losses.
Minerals 15 00431 g006
Figure 7. Effect of mill speed on mill drive power.
Minerals 15 00431 g007
Figure 8. Particle position density plot for mills running at three different mill speeds.
Minerals 15 00431 g008
Figure 9. Impact energy spectra of ball-to-ore ratio.
Minerals 15 00431 g009
Figure 10. Maximum energy exposed to 125 mm diameter steel balls.
Minerals 15 00431 g010
Figure 11. IES of the tracked 125 mm balls.
Minerals 15 00431 g011
Figure 12. Impact energy spectra of the mill speed.
Minerals 15 00431 g012
Figure 13. Probability of failure based on energy level the steel media is subjected to.
Minerals 15 00431 g013
Table 1. Summary of SAG mill specifications.
ParameterValueUnits
Inside shell diameter11.6m
Length of mill slice0.5m
% critical speed72Nc
Total filling24%
LiftersHi-Lo, 650 lifter face
Number of lifters36
Table 2. Ball:ore ratios and ore feed distribution in the various mill simulations.
Sim ID Total Mill Filling (% v/v) Ball Filling (% v/v) Ore Filling (% v/v) Ore Particle Fractions (% v/v)
150 mm 120 mm 90 mm 60 mm 30 mm
Sim1 24 24 0 0 0 0 0 0
Sim2 24 13 11 2 2 3 2 2
Sim3 24 10 14 2 3 4 3 2
Sim4 24 8 16 2 3.5 5 3.5 2
Sim5 24 6 18 22 4 6 4
Table 3. SAG mill simulation parameters.
PropertyValueUnits
Coefficient of restitution (ϵ)0.6
Coefficient of friction (µ)0.4
Normal stiffness (kn)400kN/m
Shear stiffness (kt)300kN/m
Power sampling time interval0.1s
Energy scale5.0J
Ball size125mm
Disclaimer/Publisher’s Note: The statements, opinions and data contained in all publications are solely those of the individual author(s) and contributor(s) and not of MDPI and/or the editor(s). MDPI and/or the editor(s) disclaim responsibility for any injury to people or property resulting from any ideas, methods, instructions or products referred to in the content.

