Article

Interactions of Mineral Surfaces with Water Vapor: A Method for Analyzing Surface Condensation on Halite Crystals

The Strata Mechanics Research Institute, The Polish Academy of Sciences, Reymonta 27, 30-059 Cracow, Poland
*
Author to whom correspondence should be addressed.
Minerals 2025, 15(5), 435; https://doi.org/10.3390/min15050435
Submission received: 18 March 2025 / Revised: 18 April 2025 / Accepted: 19 April 2025 / Published: 22 April 2025

Abstract

:
Condensation on mineral surfaces plays an important role in both natural and industrial environments, especially in the context of protecting sensitive geological formations. This paper presents the results of a new measurement method based on image analysis for non-invasive detection and classification of surface condensation on halite crystals. The presented method allows continuous monitoring of optical changes on the crystal surface in the visible light spectrum and also under natural (in situ) conditions. Based on the experiments carried out using halite samples from the Crystal Caves in the Wieliczka Salt Mine and literature data, four characteristic states of the crystal surface were distinguished. This classification was based on the values of relative humidity: (1) dry state (<65.0%), (2) quasi-static condensation (65.0%–75.5%), (3) transient unstable state (75.5%–77.0%), and (4) dynamic condensation (>77.0%), leading to intensive formation of brine solution on its surface. For the halite samples studied, the critical relative humidity (CRH) value was determined to be around 77.0%. The proposed measurement technique allows early detection of the presence of condensate and can be used as a qualitative classifier of the state of surface moisture, which allows automatic assessment of the risk of degradation. This method can find application in the protection of non-living nature reserves and cultural heritage sites, especially in the context of climate change and sustainable management of the underground environment.

Graphical Abstract

1. Introduction

Condensation of water vapor is a physicochemical process that typically occurs when the surface on which water condenses reaches or falls below the dew point temperature. When this happens, water vapor in the air reaches a saturated state and transforms into condensate (liquid) on that surface [1]. In some cases, interactions between water molecules and material surfaces can play an important role in the condensation process. These interactions can cause condensation at temperatures higher than the dew point temperature. This phenomenon can be observed in hygroscopic or highly hydrophilic materials [2]. Dynamics of this phenomenon and how the condensate is adhered to the surface vary and depend on the type of surface, which can be classified as hydrophilic, hydrophobic, or neutral. This process has a strong impact on the water balance in many micro- and macro-ecosystems, which actively participates in their functioning. For example, for plants growing in arid regions, the formation of hydrophilic surfaces allows them to collect water from the atmosphere [3]. On the other hand, the combination of hydrophilic and hydrophobic surfaces facilitates the transport of water [3,4]. Thanks to the hydrophilic minerals present in the soil, it is possible for bacteria to survive even in extremely arid conditions, as in the Atacama Desert in Chile [5,6,7].
The significant role of surface condensation can be observed not only in the natural environment. This phenomenon is widely present in industrial, construction, and agricultural applications. The use of hydrophilic and hydrophobic materials can facilitate or hinder the condensation process. Consequently, engineers and scientists around the world can optimize production efficiency and operational fluidity. The use of hydrophilic materials is shown to be particularly beneficial in cooling and heat exchange processes [8] or in drinking water [9]. In agriculture, such materials can help with irrigation of soils and plants [10]. In construction, the appropriate combination of hydrophilic and hydrophobic materials can enhance the durability of concrete structures [11]. Hydrophobic materials can serve as self-cleaning surfaces or protect against frost formation [12]. In fluid transport through pipelines, they can improve liquid flow efficiency [13].
One issue related to water vapor condensation is the protection of objects of cultural heritage. Depending on the properties of the materials that make up these objects, water vapor condensation can pose a direct or secondary threat to the preservation of historic buildings and monuments [14,15,16], as well as items stored in museums and archives [17]. A particular case of such objects includes natural geological formations such as grottoes and caves, whose walls are often covered with minerals and materials susceptible to erosion under the influence of external forces [18,19].
Condensation of water vapor on surfaces has an important role in both natural and industrial environments. One of the natural places where this phenomenon is observed is the Crystal Caves of the Wieliczka Salt Mine. The process of surface condensation leads to the formation of thin water-film layers, which poses a significant conservation challenge, as it leads to crystal dissolution and degradation. These Crystal Caves are the first underground nature reserve for inanimate nature in Poland, covering an area of 1.04 hectares. The caves consist of two adjacent caves (Figure 1) located 80 m underground. The Lower Cave occupies a volume of 706 cubic meters and is covered with salt karst formations. The Upper Cave is larger, having formed from the merging of several voids, with a volume of 1000 cubic meters.
The halite covers are shown in Figure 2. This uniqueness requires the protection of this site. In 1928, the caves were granted legal protection as a nature reserve, and in 1956 an order limiting access to the caves exclusively for scientific and conservation purposes was issued [21,22]. However, this did not provide sufficient protection against further destruction of the crystal structures. In addition to mechanical damage, there was also halite corrosion because of its hygroscopic properties. As a result, the transparency of the halite varies.
In the underground environment, the water vapor content of the air changes in time. It is strictly related to the moisture of the waste rock and the halite crystal. In the case of the detection of waste rock moisture, there were several papers describing different measurement methods [20,23,24,25]. In the case of detecting moisture on halite crystals, only studies describing laboratory experiments that aim to determine condensation thresholds using specialized laboratory equipment are available [26,27,28]. Through processes of water evaporation and water vapor adsorption on the surface of the halite, there is an exchange of moisture mass and heat flux. These processes can lead to the formation of a brine film on the surface of the halite. It is observed mostly at the corners and edges of the salt crystals. It has been found that the direct criterion for assessing the scale of threat to the halite crystals is the level of relative humidity of the air surrounding them. If the water content in the atmosphere is too high, the salt will adsorb moisture from the environment, leading to the dissolution of the crystal surface, resulting in the loss of crystal transparency [29]. The hygroscopic properties of salt become particularly evident when the critical relative humidity (CRH) is exceeded [30].
The key criterion for assessing the threat scale to the halite crystals is the level of relative humidity of the air [29,31]. In the literature on Crystal Caves, the critical value of relative humidity is based on a research program report [32], which indicates that the optimal relative humidity of the air should be between 72% and 75%. This report relates to a project [33] that studied the so-called melting point of Wieliczka salt. A small fragment of the salt sculpture surface from St. Anthony’s Chapel was used for the research. This sample may differ significantly from the halite cover crystals as a result of different geological processes and formation conditions (additional impurities and intrusions). The research showed that impurities in Wieliczka salt samples lower the relative humidity value at which melting occurs.
Steiger et al. [34] indicate that the critical relative humidity value for halite at a temperature of 10 °C is 75.6% and it changes slightly with the temperature of the air. In the range of 0–50 °C, each 10 °C increase in temperature decreases the value of critical relative humidity by 0.2%–0.3%. On the contrary, the authors of [35] emphasize that the CRH is almost independent of temperature and is 75.3%. Above this point, the halite crystals begin to dissolve.
The available data on halite and its critical humidity differ. For example, a value of 76% was given as the critical relative humidity in [30], while another work [36] reported 74%, assuming that it does not change with variations in temperature. Due to the described discrepancies in the literature regarding the critical relative humidity for halite, the lack of such research results for halite crystals, and the current microclimate parameters of the Crystal Caves, it was necessary to complete a state of knowledge in relation to Wieliczka crystal protection.

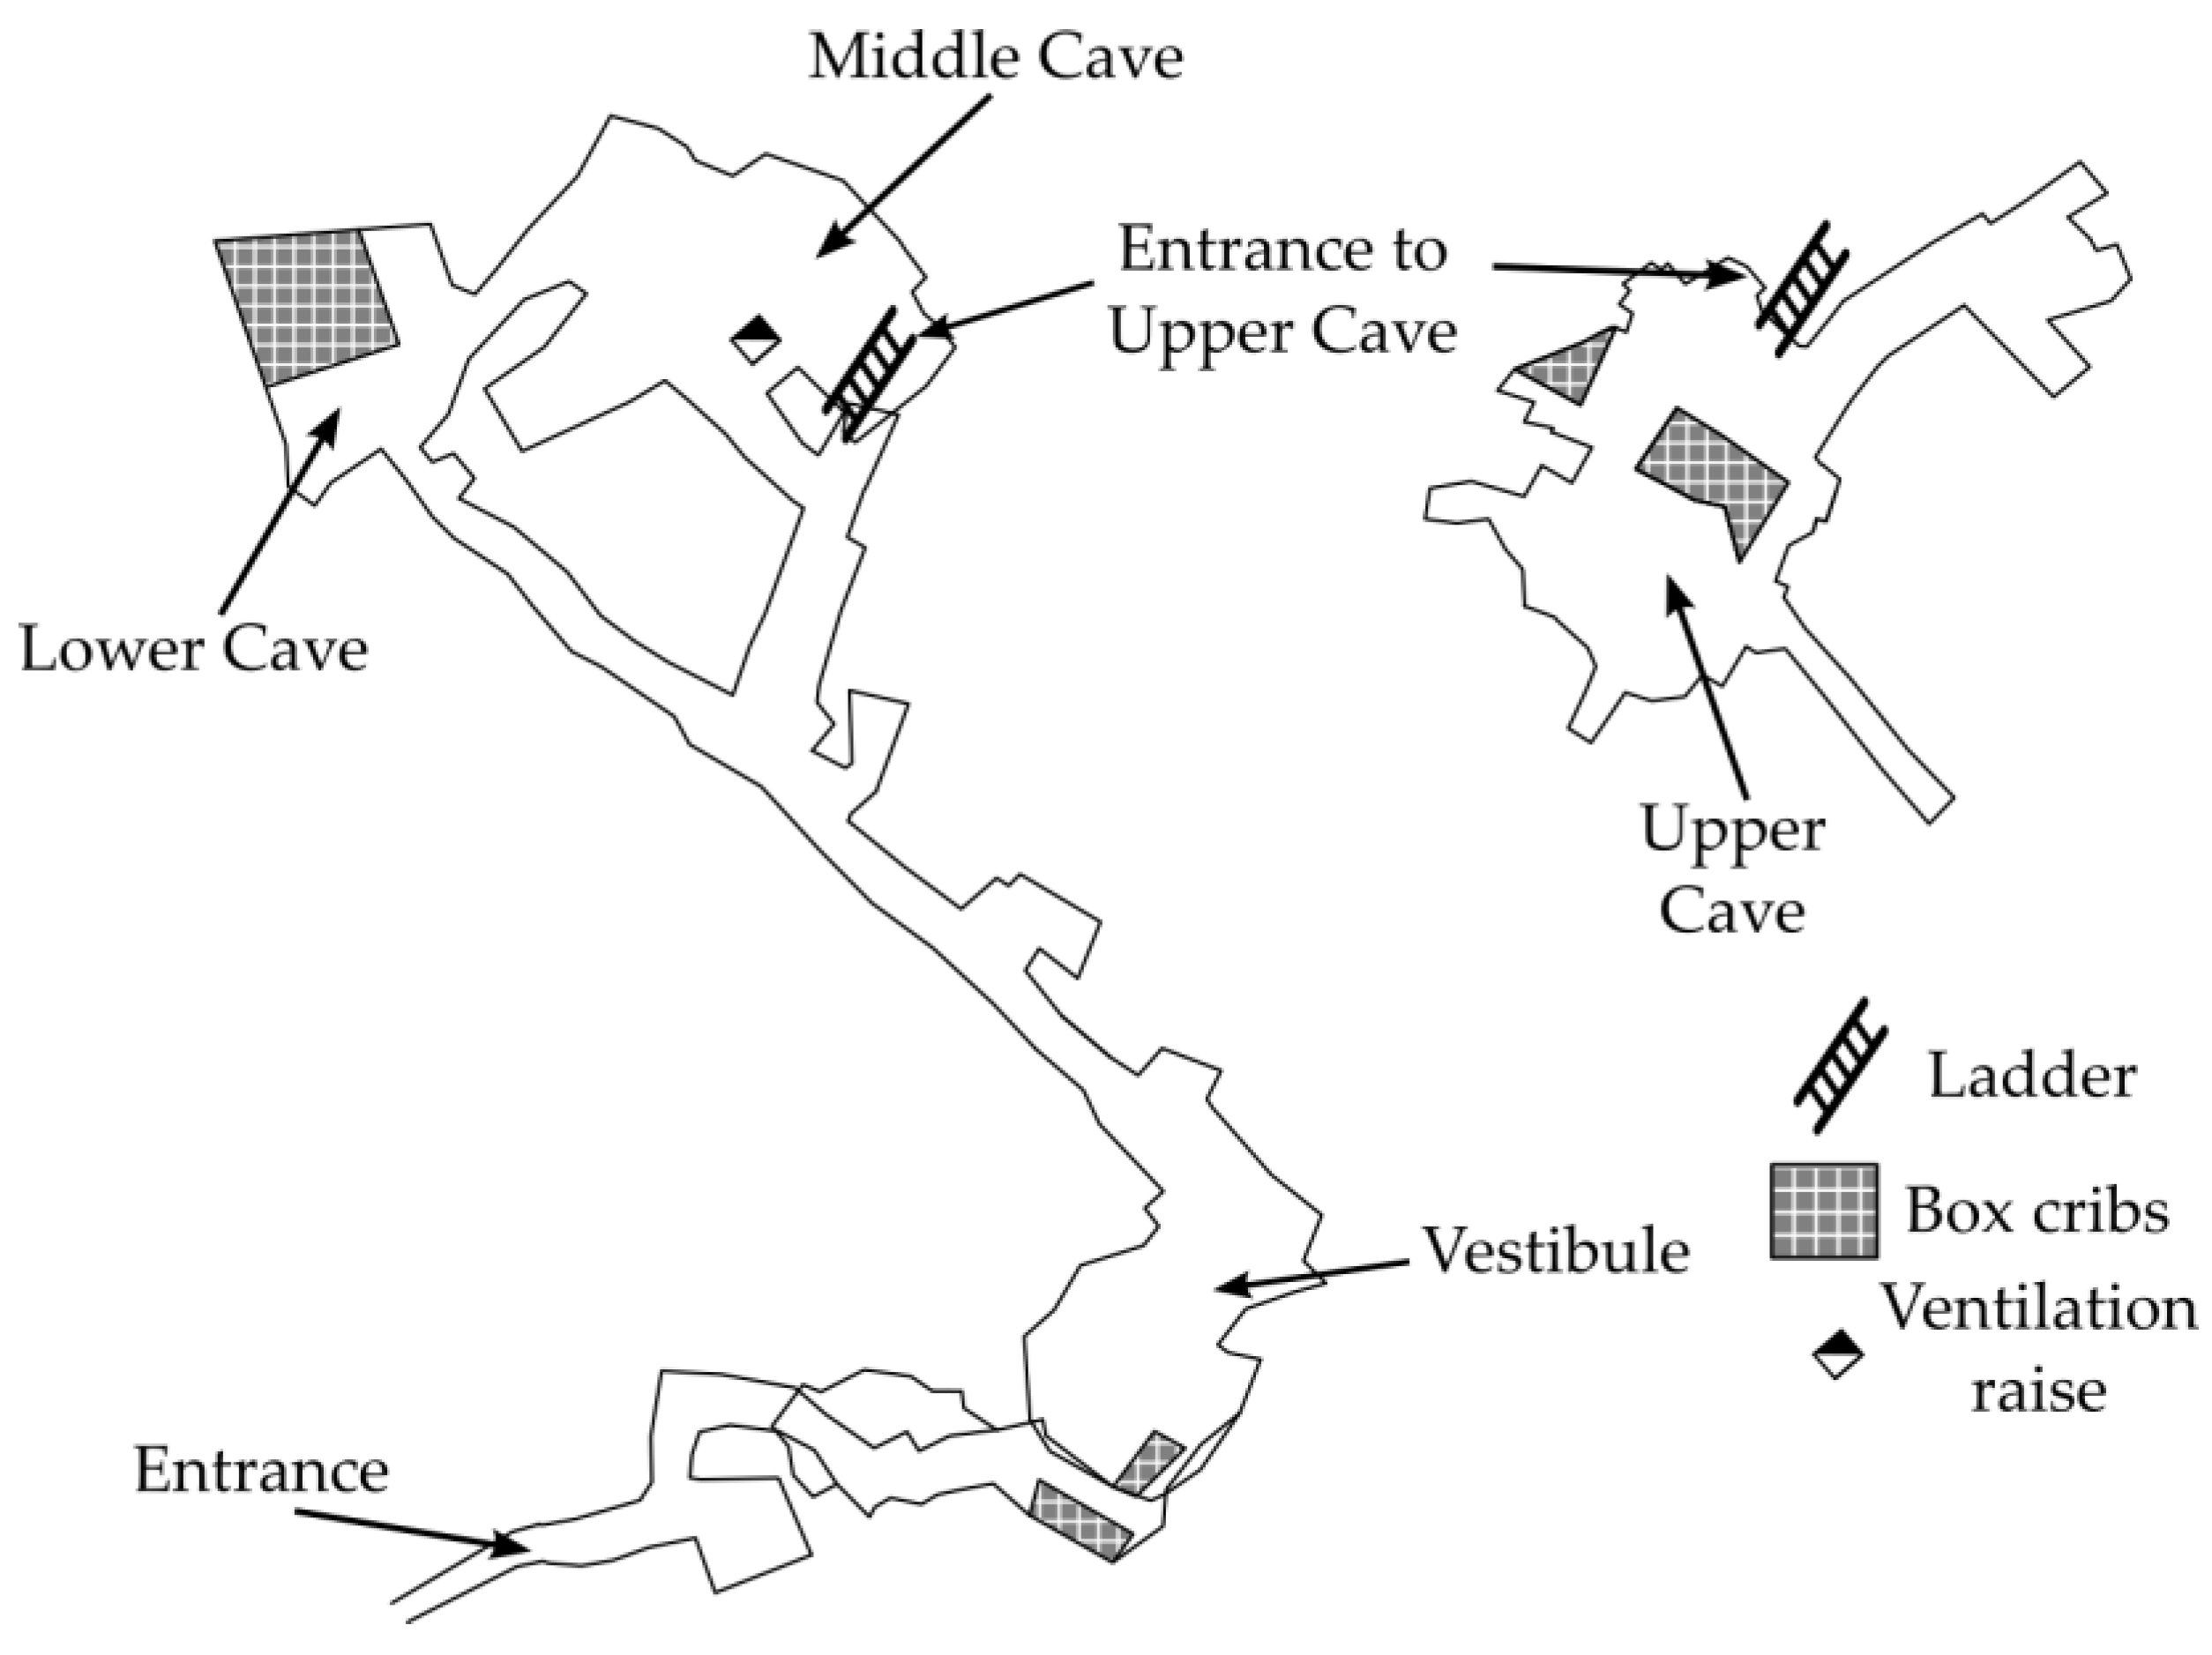
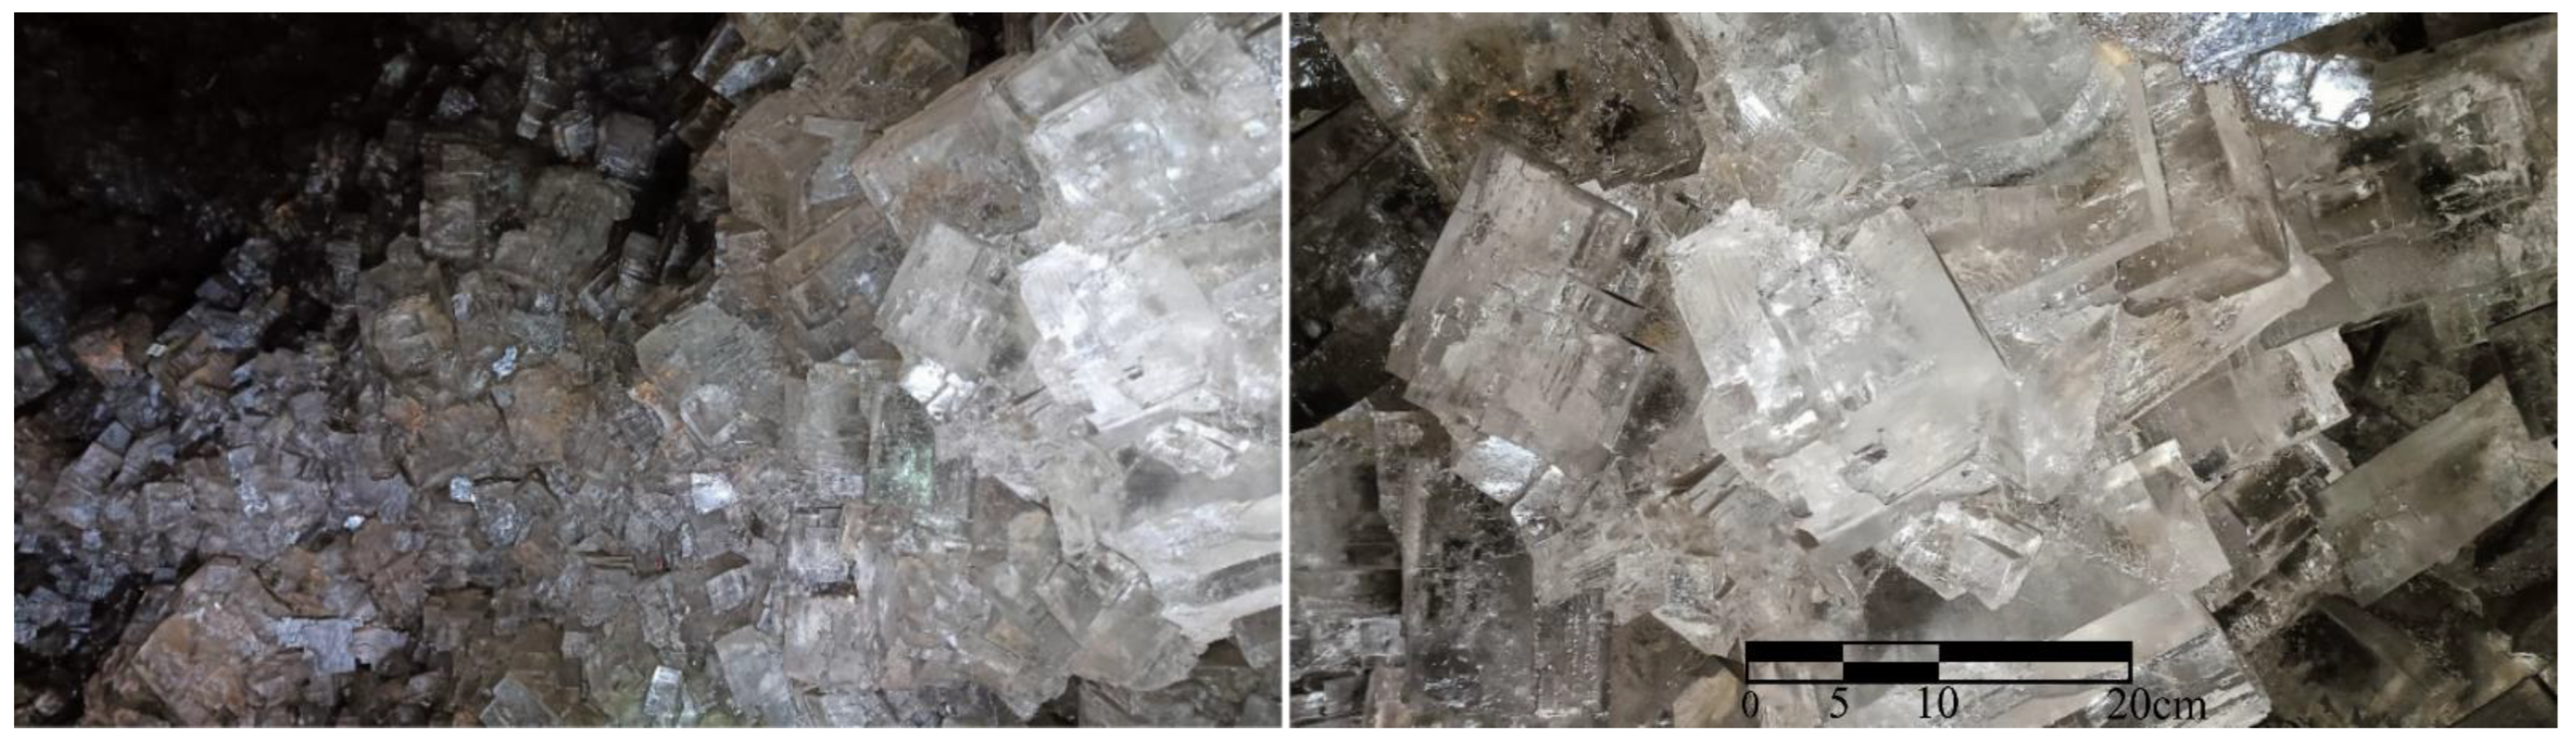
1.1. Microclimatic Conditions in the Crystal Caves

Data logging over the entire analyzed period allowed for the estimation of the boundaries of possible temperature and humidity changes, both short-term and long-term. These changes are related to the impact of all the mentioned factors and the prevention actions, such as conditioned air ventilation, mine door ventilation and drying using absorbents. Despite the activities carried out within the caves, the maintained relative humidity remains within the range of 73% to 75%, with only short-term exceedances of these values. In the long-term perspective, trends are observed that could potentially lead to a continuous moisture risk within the Crystal Caves.

1.2. Halite Crystal Wetting Process

The process of adsorption and condensation of water vapor has been widely studied for several decades. The literature provides extensive information that can be used to protect natural geological formations. Water vapor adsorption is often initiated at surface defects, which preferentially attract water molecules [37]. Defects include cracks [26] and edges, whose size and geometry play an important role in the context of mineral surface dissolution and degradation [38]. The growth of a water layer on the surface can be influenced by the orientation of the crystallographic lattice [39]. The structure and dynamics of water films depend on the properties of atoms in the surface layer, which affect the distribution of water on the surface [40]. The formation of water films is also associated with the surface of the size of particles on the mineral [41]. In the case of materials with a porous structure, the key factors that influence the adsorption and condensation of water vapor are the size and the chemical homogeneity of the surface [42]. There are also studies indicating the importance of pore size in this process [43]. In studying these phenomena at the local scale, spectroscopic and microscopic methods are used [26,37]. With advances in science and technology, numerical simulations are increasingly used to study the phenomenon of condensation. For example, molecular simulations allow for the representation of droplet formation mechanisms and the transition between film-wise and drop-wise condensation, depending on surface properties [38,44]. At the macroscopic level, computational fluid dynamics (CFD) simulations are also used. These enable a detailed analysis of the temperature and humidity distribution, allowing the prediction of condensation locations on mineral surfaces [45]. The formation of a water film on mineral surfaces can, to some extent, act as a protective barrier. This layer may shield the surface from mechanical or chemical damage by increasing its neutrality [46]. Limiting air access can prevent oxidation of the material layer or the deposition of solid contaminants. For materials prone to dissolution, preventing water runoff from their surface is critical [47] to avoid mass loss and surface degradation.
In the current studies, it is crucial from the point of view of protecting the inanimate nature reserve to know the state of moisture in the crystal cover. This information allows taking appropriate actions to prevent the degradation of halite crystals. An increase in the relative humidity of the air surrounding the crystals will result in the systematic condensation of water vapor on their surface. Based on data from the mentioned literature, three distinct states of the crystal surface can be defined depending on the surrounding humidity: dry crystal, moist crystal in equilibrium with the environment, and wet crystal (upon exceeding the critical relative humidity value).
Condensation of water vapor on a chemically pure halite crystal occurs through physical adsorption, where H2O dipole interactions interact with the NaCl crystal lattice. When the halite crystal is contaminated, especially on its surface, the nature of adsorption may change. This can alter the forces responsible for the condensation of water vapor in the crystal, modifying the slope of adsorption isotherms [48]. Crystal surface defects can cause the dissociation of H2O molecules, resulting in changes in surface composition, and in the presence of other compounds, this can cause permanent contamination of the crystal and further alteration of the slopes of the adsorption isotherm [28,48]. Generally, adsorption on the surface of halite crystals in salt caves will occur in a mixed manner, involving both physical and chemical adsorption. The primary analytical model used to describe adsorption on halite crystal surfaces is the multilayer BET model [27,49], which describes the formation of multilayer structures of adsorbing substances on the adsorbent surface. This process occurs quasi-stochastically, potentially leading to uneven water molecule distribution on the crystal during the initial stages. This could be related to the temperature distribution, surface structure, or chemical diversity of the surface composition (presence of organic and inorganic contaminants) [26,50,51]. The dominant factor that influences the formation of water layers on the crystal surface is the relative humidity surrounding the crystal. In a study by [26], the crystal surfaces were examined using an atomic force microscope. The process of gathering water on the crystal surface can be divided into two stages. The first stage involves the adsorption of water molecules on the surface, driven by the interactions between water molecules and the halite crystal lattice elements. The second stage is condensation, where interactions between water molecules dominate [41,48]. The model of these processes is illustrated in Figure 3:
Condensation occurs after a sufficient number of molecular layers are formed, determined by the interaction strength between the layers and the crystal surface, as well as the molecular dimensions. The crystallographic orientation of the crystal lattice is important for the formation of water layers on the crystal [26,27,41]. Areas with increased accumulation of water vapor molecules on the crystal surface include cracks, fissures, and gaps in the crystal lattice [41,50]. The formation of multilayer H2O structures on the crystal surface and their uneven distribution can affect the optical properties of the surface.
As humidity increases, the slow wetting of the crystal surface can be observed. These crystals in their natural environment may be covered with contaminants or dust (microscopic NaCl crystals) resulting from wetting and drying of the halite surface. The condensation of water vapor occurs most rapidly on contaminants. Wetting is visible through a change in the crystal’s surface brightness. When the humidity reaches a high enough level, a water film forms on the halite surface, which can be seen without optical equipment. Subtle changes on the crystal surface can be recorded using a high-resolution camera. With consistent lighting, these changes should be visible in the brightness and contrast of the image, identifiable as wetting, water film formation, or surface degradation. To observe such changes in the visible spectrum, the amount of accumulated water or its effects must reach geometric dimensions close to the wavelengths recorded by the camera sensor. Thus, in the visible spectrum, only condensation of water vapor on the studied surface can be observed. With an appropriate sensor operating in the infrared range, the phenomenon of absorption of electromagnetic radiation by the forming water layer and brine on the crystal surface can also be observed [27,28,52,53,54].
Conventional laboratory methods for detecting and observing condensate formed on the surface of a crystal, such as spectroscopy and gravimetry, while very accurate, require the use of an apparatus sensitive to external conditions. It is difficult or even impossible to use such an apparatus in real measurement conditions. With a large variety of surfaces, local methods (spectroscopy and microscopy), which examine a small portion of the surface, can lead to large errors in the detection of a water film. Methods based on the mass of the water-adsorbing crystal are difficult to implement over long time intervals where drift and constant loading of the balance can affect its characteristics. To overcome the challenges of in situ measurements, this research proposes an optical method for moisture detection and evaluation of the condition of halite cover surfaces under real environmental conditions. The developed method makes it possible to assess the risk of degradation of sensitive geological formations. A couple of objectives of this work can be specified:
  • Development of an optical method to detect significant changes on the surface of halite, caused by the formation of an aqueous film on this surface.
  • Determination of the specific value of CRH for crystals derived directly from Crystal Caves so that the specific properties of the salts due to their unique composition can be taken into account.
  • To evaluate the feasibility of using the proposed method for continuous monitoring in the underground environment. It is hypothesized that the proposed method will make it possible to detect optical changes in the halite surface in the visible spectrum caused by surface condensation and to correlate these changes with the relative humidity around the crystal, which may allow future qualitative classification of the state of the surface moisture and, as a result, an effective assessment of the risk of degradation.
The level of risk establishment was necessary to examine the halite crystals under controlled microclimatic conditions and to determine the critical and threshold values of relative humidity affecting the halite crystals. It was also crucial to identify the time intervals in which the crystal wetting process occurs and the stabilization time of the crystal surface.
Recording of water vapor condensation can help determine the crystal surface states as a function of environmental humidity. Experimental results can contribute to improving the preventive and intervention protection of Crystal Caves. The formation of a brine film, that is, a film layer forming on the crystal surface surface, will result in changes in the optical parameters of this surface. Typical phenomena that occur on the thin layer that mediates between air and the halite crystal include [55,56]:
  • Refraction—The change in the direction of light propagation caused by the presence of a water film on the surface.
  • Scattering—the appearance of water droplets or a heterogeneous water film in certain areas of the sample.
  • Reflection—A wetted, rough surface or the presence of H2O molecules in cracks, fissures, and among salt dust/contaminant particles changes the amount of light reflected and transmitted through the sample.
  • Interference and Polarization—The interaction of the waves at the boundary of media.

2. Concept and Methods

Considering the above-described phenomena behind the process of condensation of water vapor on the surface of crystals, the main idea is to observe this phenomenon in the visible light spectrum using a time-lapse camera placed together with the crystal in a climate chamber that allows controlling the temperature and relative humidity of the air acting on the crystal. The proposed method can be used to study the properties of the halite crystal and the surfaces of other materials/minerals under laboratory conditions. After minor modifications using widely available programmable electronics, it will be possible to apply the described method under in situ conditions to identify and detect the occurrence of degradation states of halite cover or other protected surfaces.

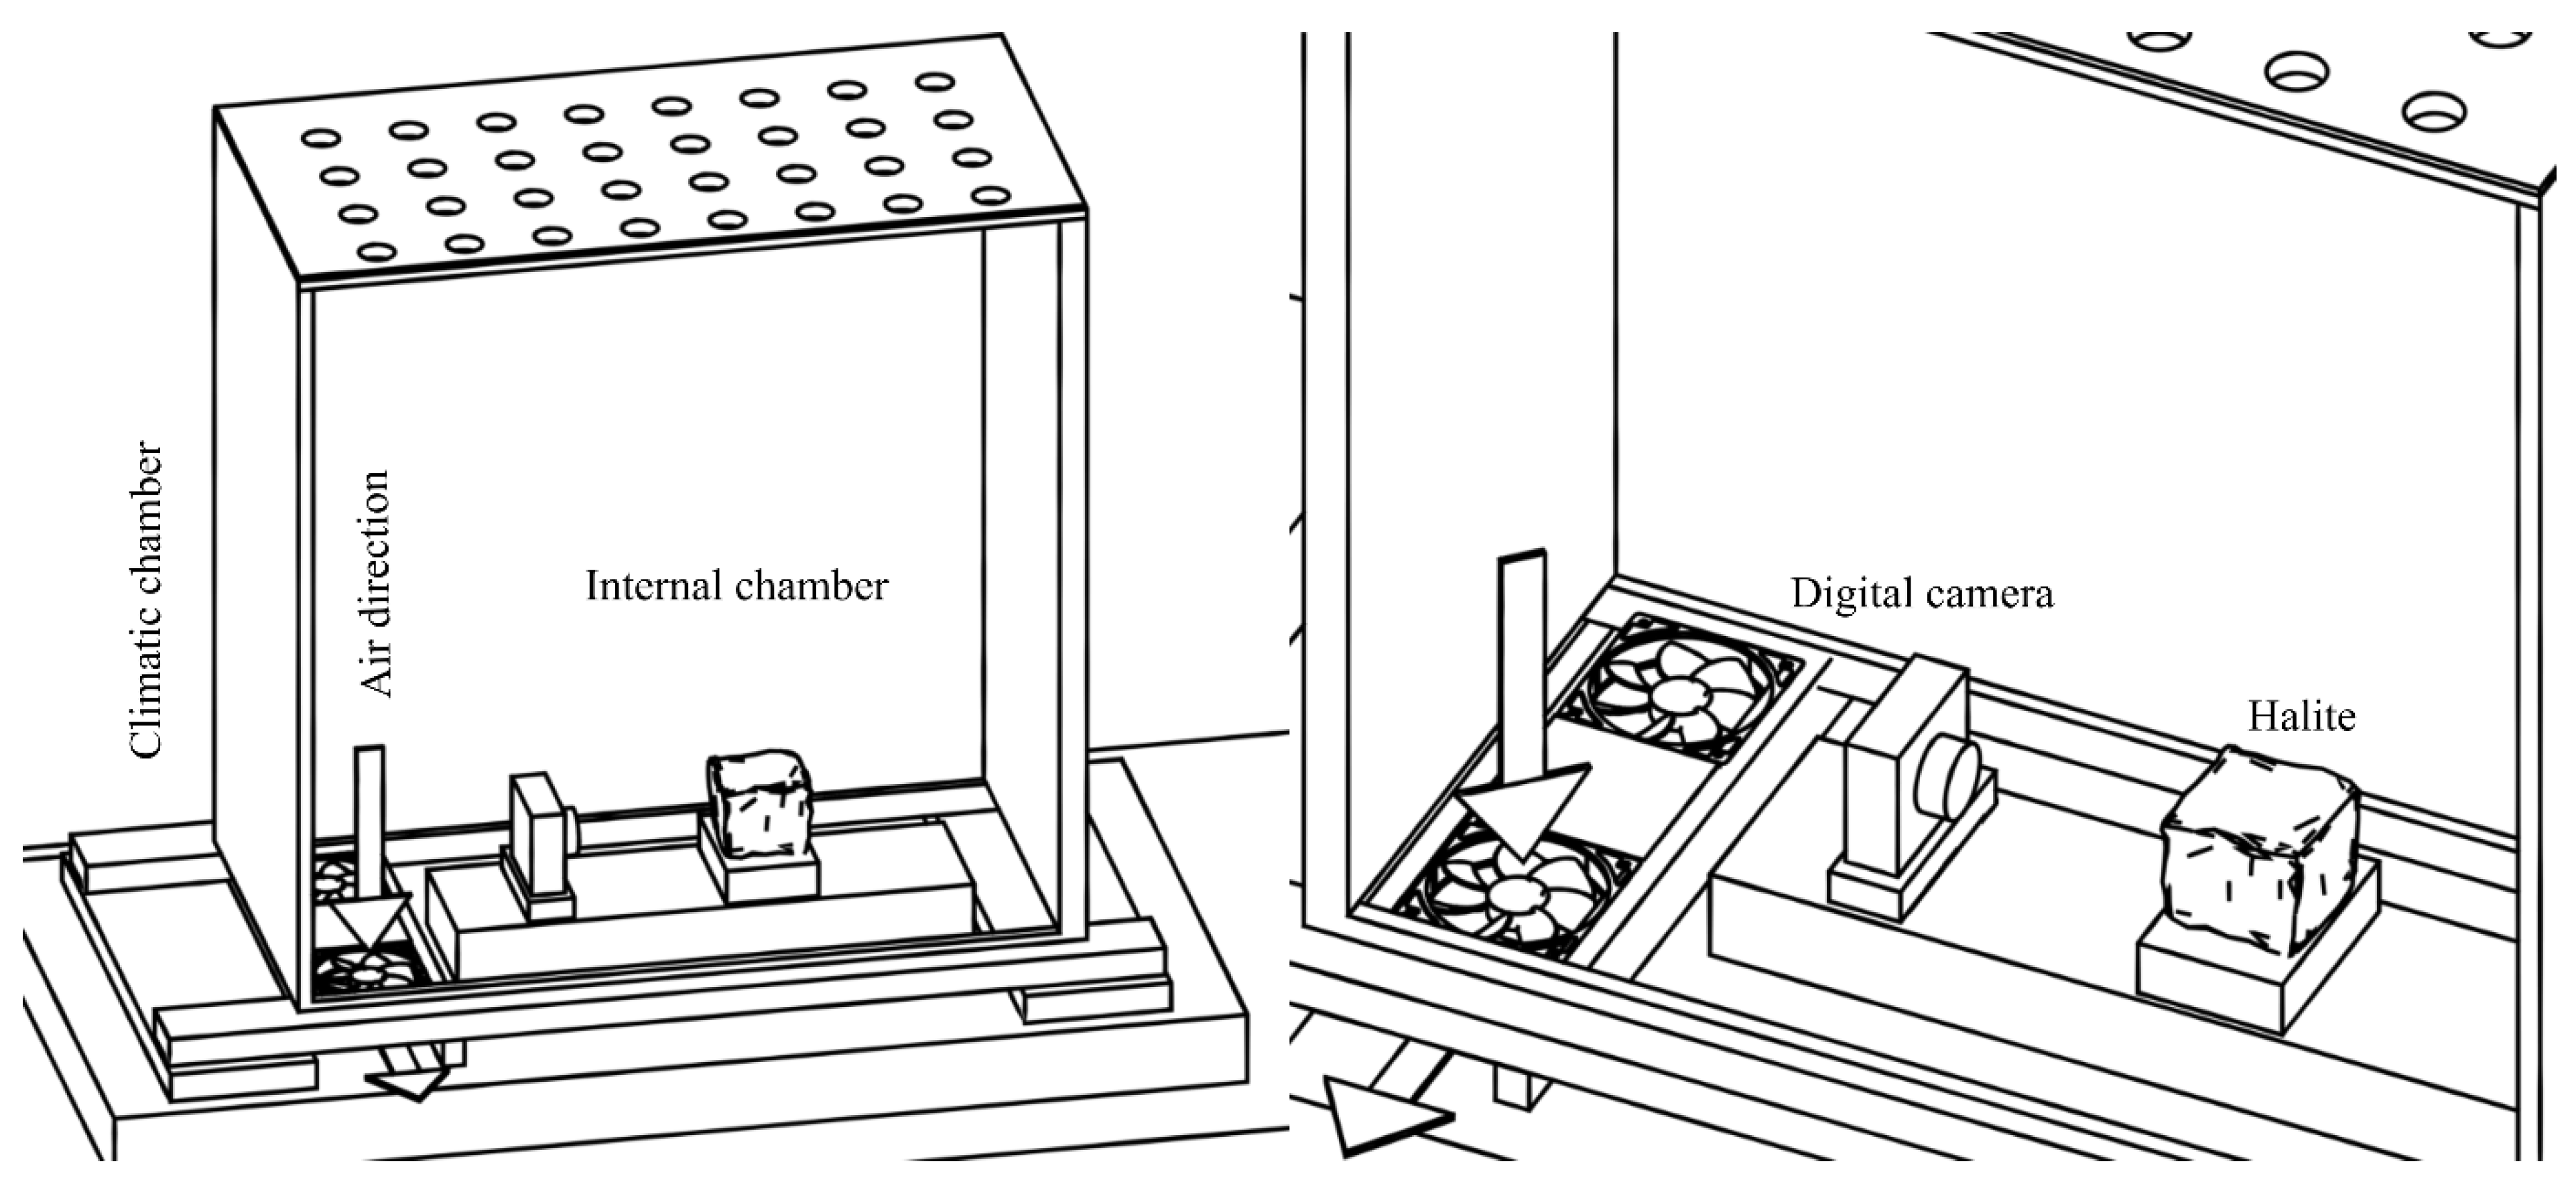
2.1. Measurement Setup

To observe changes on the crystal surface, the measurement setup consisted of:
  • BINDER MKF 720 climate chamber;
  • OptiDew 501 thermohygrometer;
  • OM System TG-7 digital camera with a resolution of 4000 × 3000 px.
Figure 4 shows a schematic diagram of the measurement setup to photograph the crystal surface under various environmental conditions. An internal chamber was placed inside the climate chamber to achieve stable climatic conditions. Internal fans were installed to regulate air exchange between the chambers. The digital camera and halite crystal were placed opposite each other in the internal chamber.
The temperature and humidity inside the chamber (in close proximity to the crystal) were measured using the OptiDew 501 thermohygrometer. Depending on the dynamics of the environmental changes, the time interval for taking photographs ranged from 30 s to 5 min. This allowed for the recording of both fast- and slow-changing phenomena occurring on the examined surface. The crystal surface was illuminated with constant LED light. Changes on the surface are identified in the intensity of light reflected by the crystal surface, and hence the crystal was coated with a black layer (PVC), leaving a 2 × 2 cm inspection window. This allowed the observation of light interaction only with the exposed surface.
The prepared crystal is shown in the photos in Figure 5. Figure 5a shows the crystal with the completely exposed surface, while Figure 5b shows the covered crystal. This caused light to interact only with the designated surface fragment and additionally limited the escape of light outside.
The crystal was thermally stabilized by cooling to the temperature occurring in the Crystal Caves (11.9 °C). Humidity was controlled and kept constant or varied depending on the type of research. This allowed for results in both the time and moisture domains, making it possible to detect changes in surface wetting by analyzing the brightness of pixels in optical images. This method indicates the presence and distribution of condensed water but does not directly measure its total mass or volume.

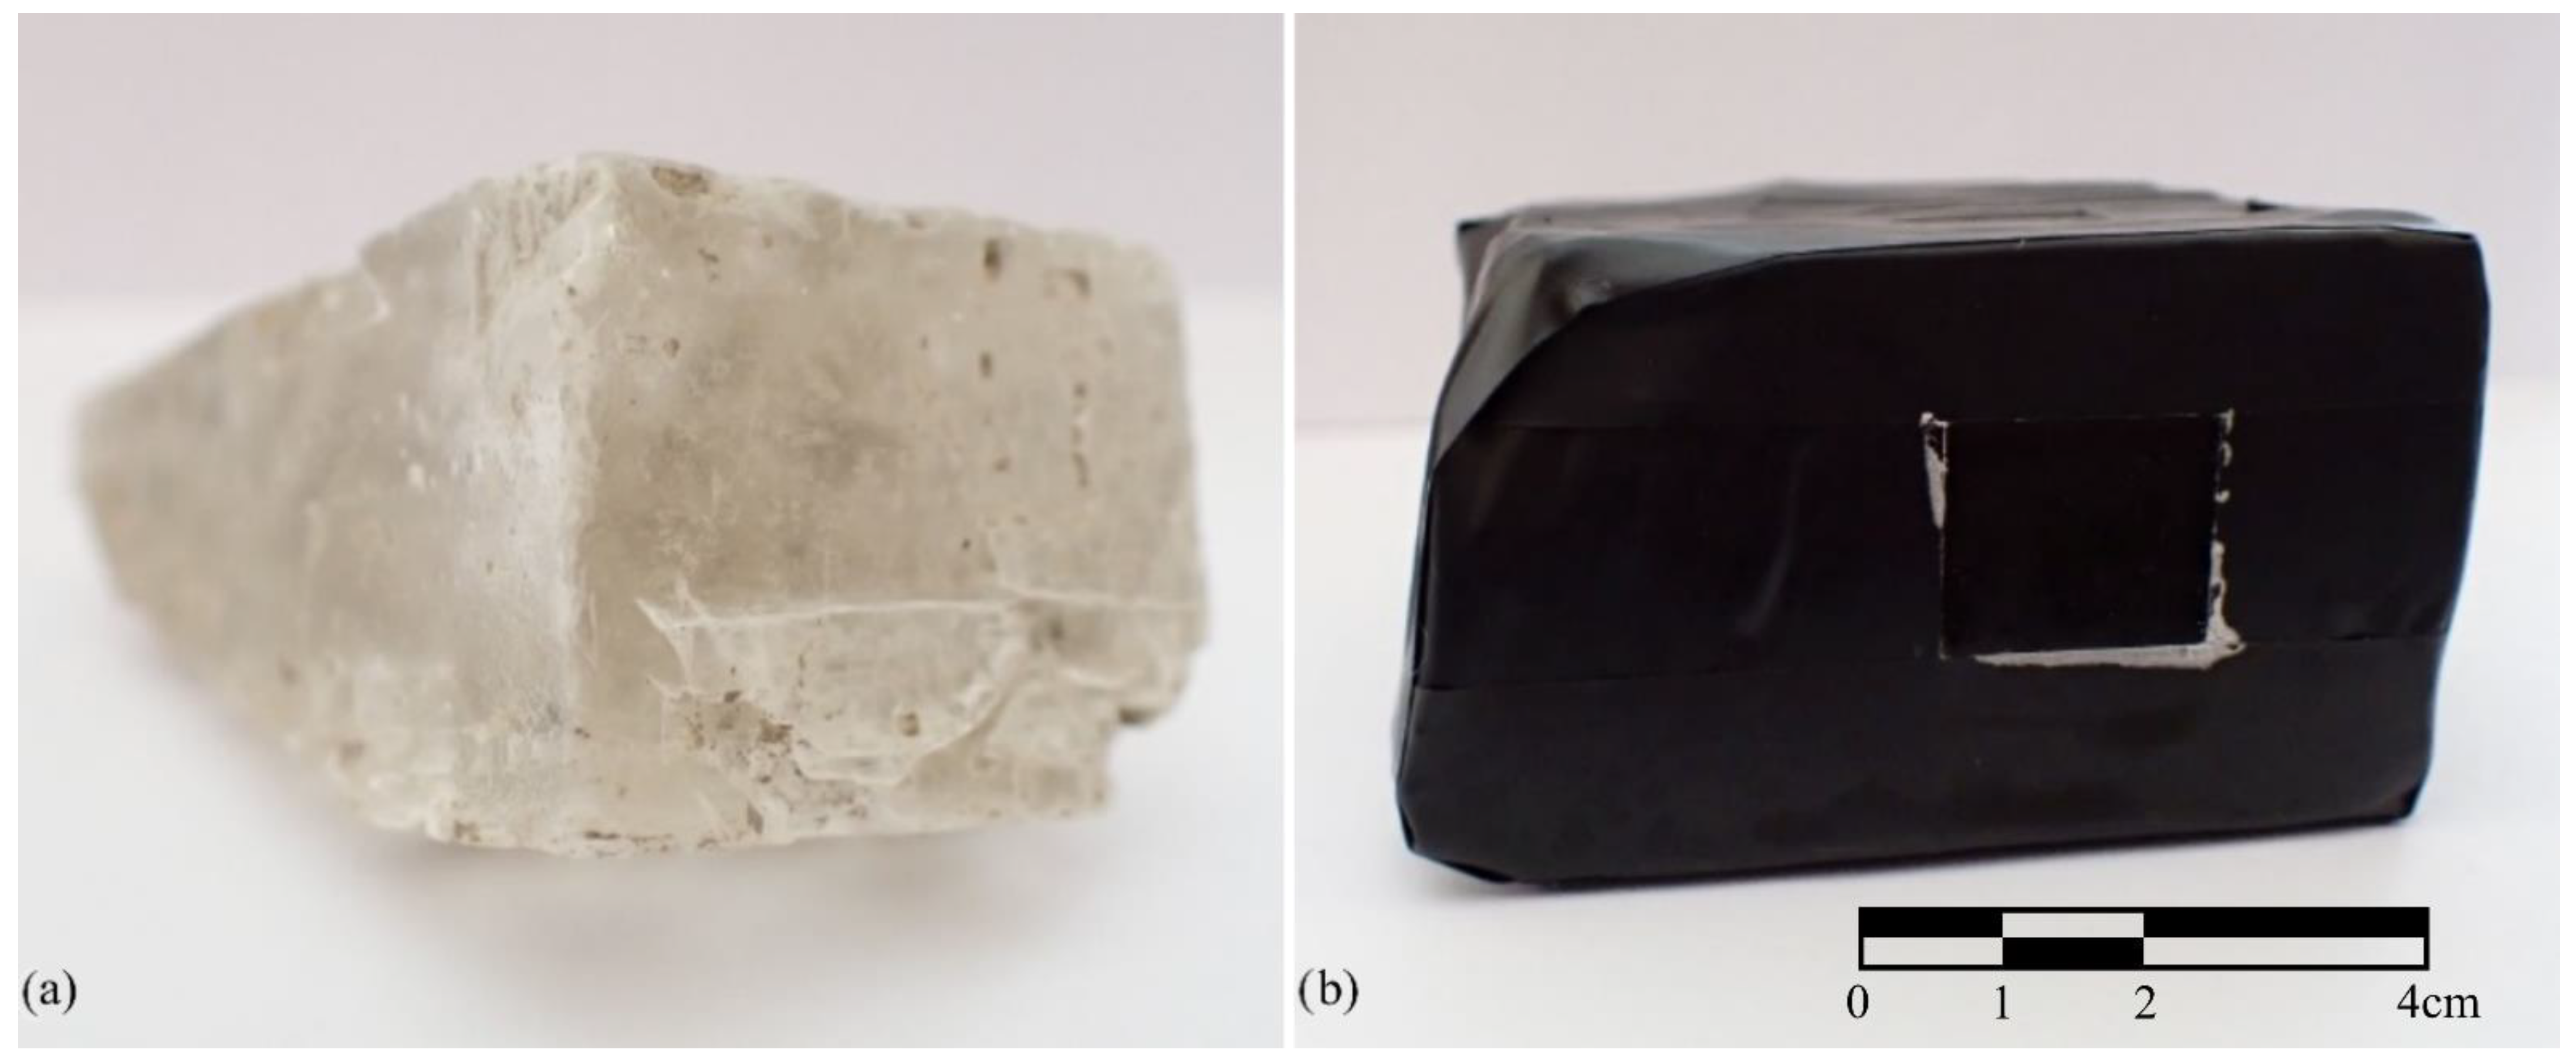
2.2. Measurement Procedure
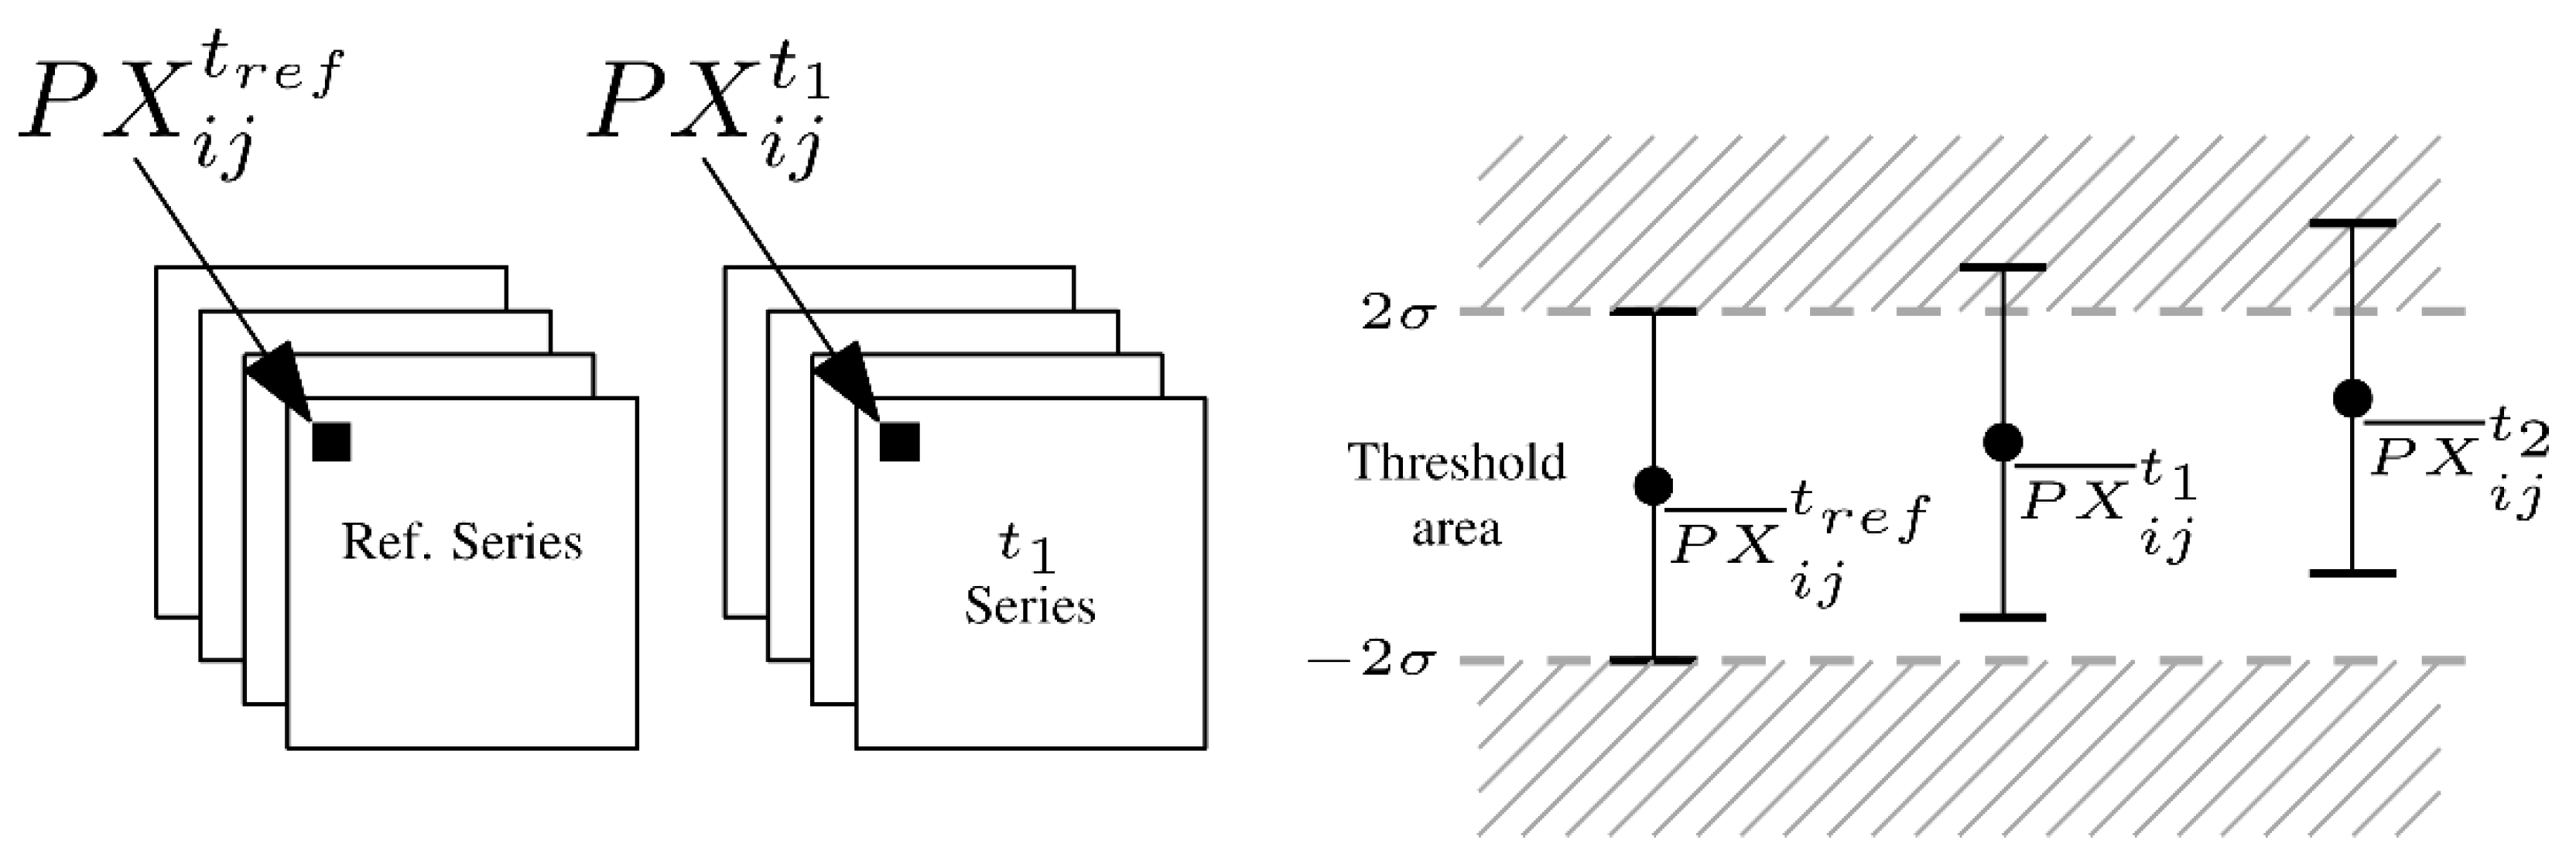
Observation of the changes occurring on the halite surface as a result of water vapor condensation was performed with the apparatus by taking a series of photographs of the crystal surface under certain (dynamic or static) environmental conditions.
Two basic types of experiments can be distinguished: stationary, with constant temperature and humidity values, and dynamic, when humidity or temperature values are variable. Each time, the crystal was acclimatized to the temperature conditions prevailing in the Crystal Caves and dried in air with a relative humidity of 40%. After the crystal was acclimatized, a series of reference images (dry crystal) were collected, and then the climatic conditions in the chamber were changed. In the static case, the chamber was tasked with reaching the set state as quickly as possible. In the dynamic case, experiments with varying humidity were performed, for example, a slow, steady rise in relative humidity. From the reference images of dry crystals, the brightness and the noise level were determined. These values were used to interpret the changes that occurred on the surface of the crystal during the experiments.

2.3. Image Analysis

The photos taken were characterized by sensor noise. Additionally, frame shifts due to vibrations of the working climate chamber were visible in the images. Changes in the crystal surface resulting from its gradual and uneven wetting were represented by changes in the brightness intensity of individual pixels. The signal, which is the pixel brightness, can be given by the sum:
I px = I h + Σ I noise
where:
  • I px —acquired pixel brightness;
  • I h —intensity of light reflected by the crystal surface element;
  • Σ I noise —sum of noise from the sensor and vibrations of the climate chamber.
Movement of the camera and crystal results in frame shifts in successive photos. To minimize this source of error, a specified Gaussian filter with mask dimensions and standard deviation was applied to each measurement series. This allowed for local averaging of pixel brightness values. The resulting images were analyzed in grayscale. Figure 6 shows a schematic diagram of the image processing algorithm for the crystal surface.
Regardless of the measurement type (constant or variable humidity), it was required to obtain a reference series of images, based on which the average pixel values and their standard deviations can be estimated. If the measurement was intended to observe changes in humidity over time, the first 11 images at a given humidity were considered the reference series. When humidity is variable in the experiment, the reference series is taken at the initially set humidity, also for 11 photographs.
Based on this series of images, the average values and standard deviations of individual pixels, which form the threshold area (TA), were calculated. Values in the range T A = P X ¯ i j t r e f ± 2 σ obtained for the reference series were considered as noise corresponding to the measurement cycle. The measurement cycle was defined by performing one study consisting of a reference series and the actual series of images to be processed. Pixels with brightness within the reference TA (Threshold Area) were filtered from the remaining images or image series (at different humidity levels). The TA range contains natural (noisy) pixel brightness changes. The absolute pixel brightness depends on the light source illuminating the sample, so it was assumed that the parameter describing the surface wetting state would be the number of OPs (Outlier Pixels), whose values exceed the noise threshold relative to the total number of pixels in the image, expressed as a percentage.
The proposed algorithm was tested for a cycle with a constant relative humidity of 55.0 ± 0.2%. The first 11 images were collected to calculate the average pixel brightness values and their standard deviations. Then, for the remaining images in the cycle (for the actual series), the filtering algorithm was applied. The number of pixels (OPs) whose value exceeded the TA threshold in this case ranged from 0.5 to 1.5%. The average value OP ¯ P i x was 1%. Oscillations in the OP value at the level of 0.25% relative to its average value were treated as base noise caused by strong changes in pixel brightness that could not be filtered out.

3. Experimental Results

The determination of the relative humidity value at which water begins to condense on the halite surface using the presented apparatus was carried out by photographing the crystal surface under specified environmental conditions. The experiment was divided into two stages:
Stage I—Qualitative changes in the number of bright pixels in a wide relative humidity range from 40% to 77% were determined. This range was selected based on the literature data. This stage was divided into two separate experiments (E1 and E2) to preliminarily identify the interrogation scopes. These experiments differed in the exposure time of the crystal to the specified humidity.
Stage II—Based on the results obtained in Stage I, a narrower relative humidity range (from 74% to 78%) was identified for precise determination of the wetting states of the crystal exposed to prolonged environmental conditions. The temperature during all measurements was 11.5 °C ± 0.5 °C. Finally, as the last experiment, a stress test was performed at 78% humidity to determine how long it takes for the condensate to appear and drain from the surface of the entire crystal.

3.1. Stage I—Crystal Testing in the Relative Humidity Range of 40%–77%

Experiment 1 (E1) was conducted with a short exposure time of the crystal to a humid environment. The measurement lasted 4 h. The first hour was the drying phase at relative humidity 38.7 ± 0.2% during which a reference series was collected. For the next 3 h, the humidity increased to 75%.
Experiment 2 (E2) was carried out stepwise; the humidity range was divided into 13 steps, and the crystal was exposed to each set environmental point for 2 h.
The photographs were taken at 1 and 5 min intervals depending on the measurement cycle. These images were filtered. The results are shown in Figure 7.
These results show how the number of pixels showing differences in brightness changes as a function of the relative humidity level. Experiments E1 and E2 were designed to capture these changes over short time intervals to determine the humidity ranges where initial condensation occurs. Later in the paper, experiments involving longer exposure times will be presented, which will allow analysis of the process in a more complete range that takes into account crystal surface stabilization.

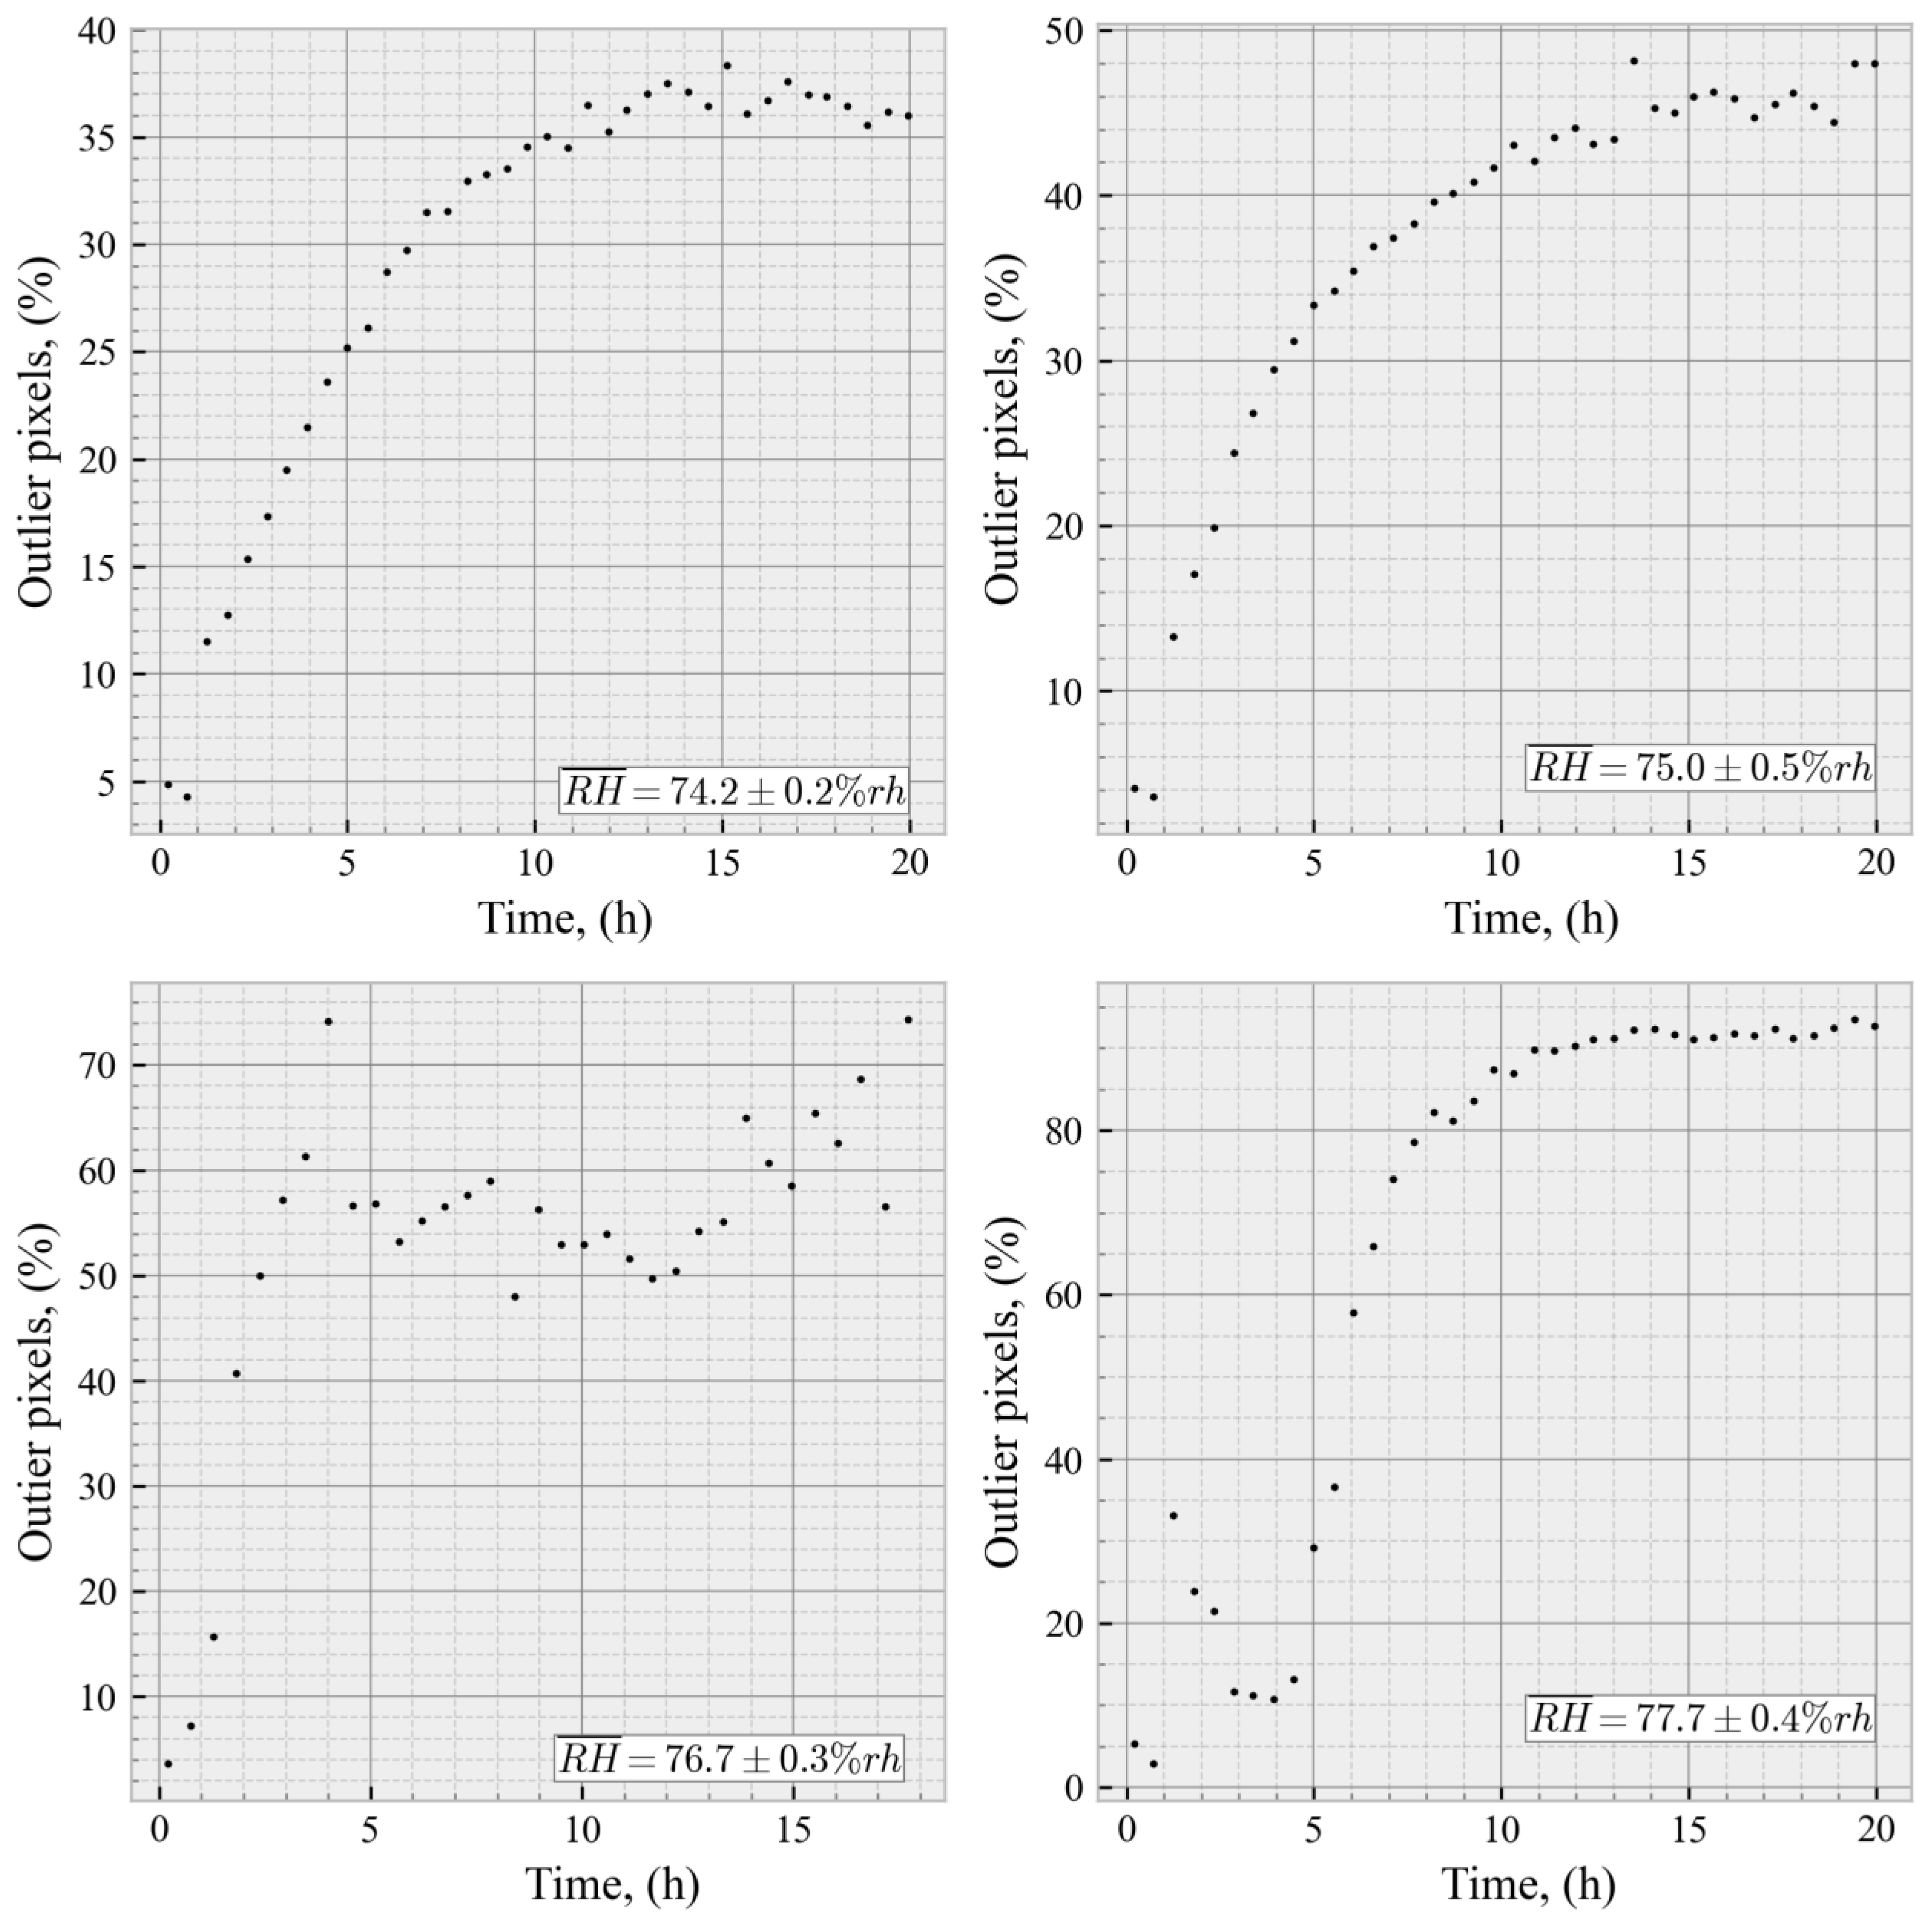
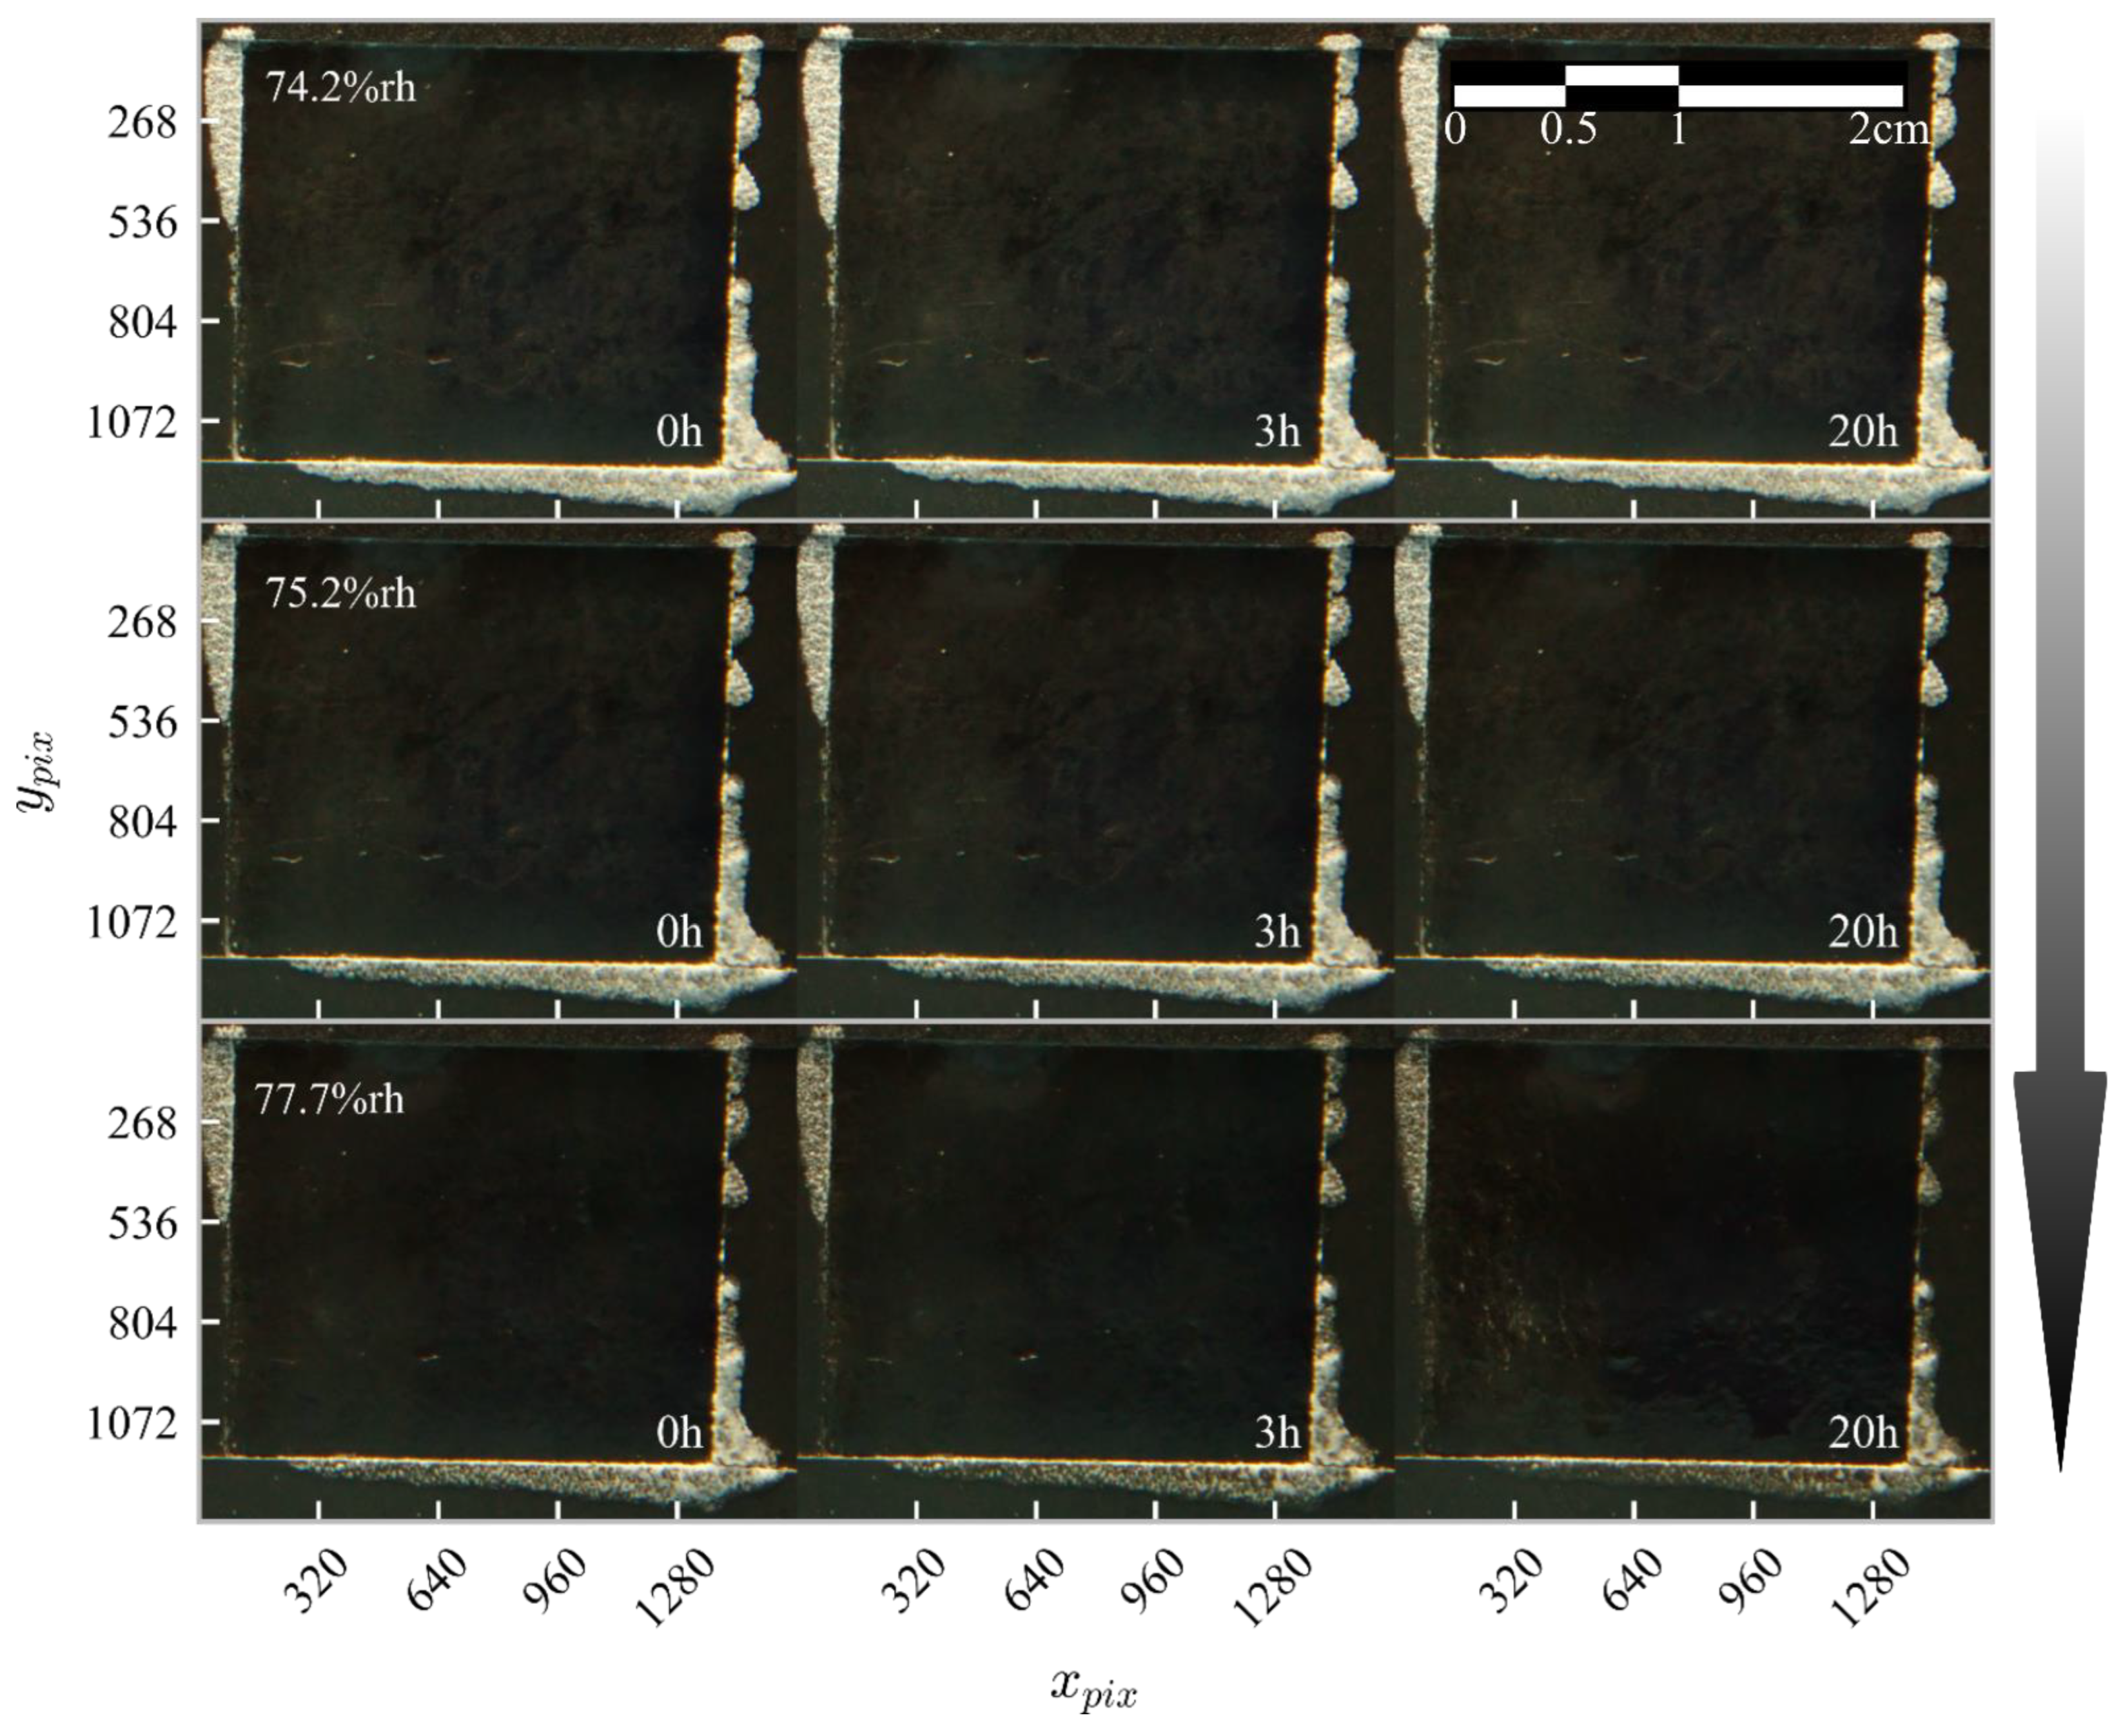
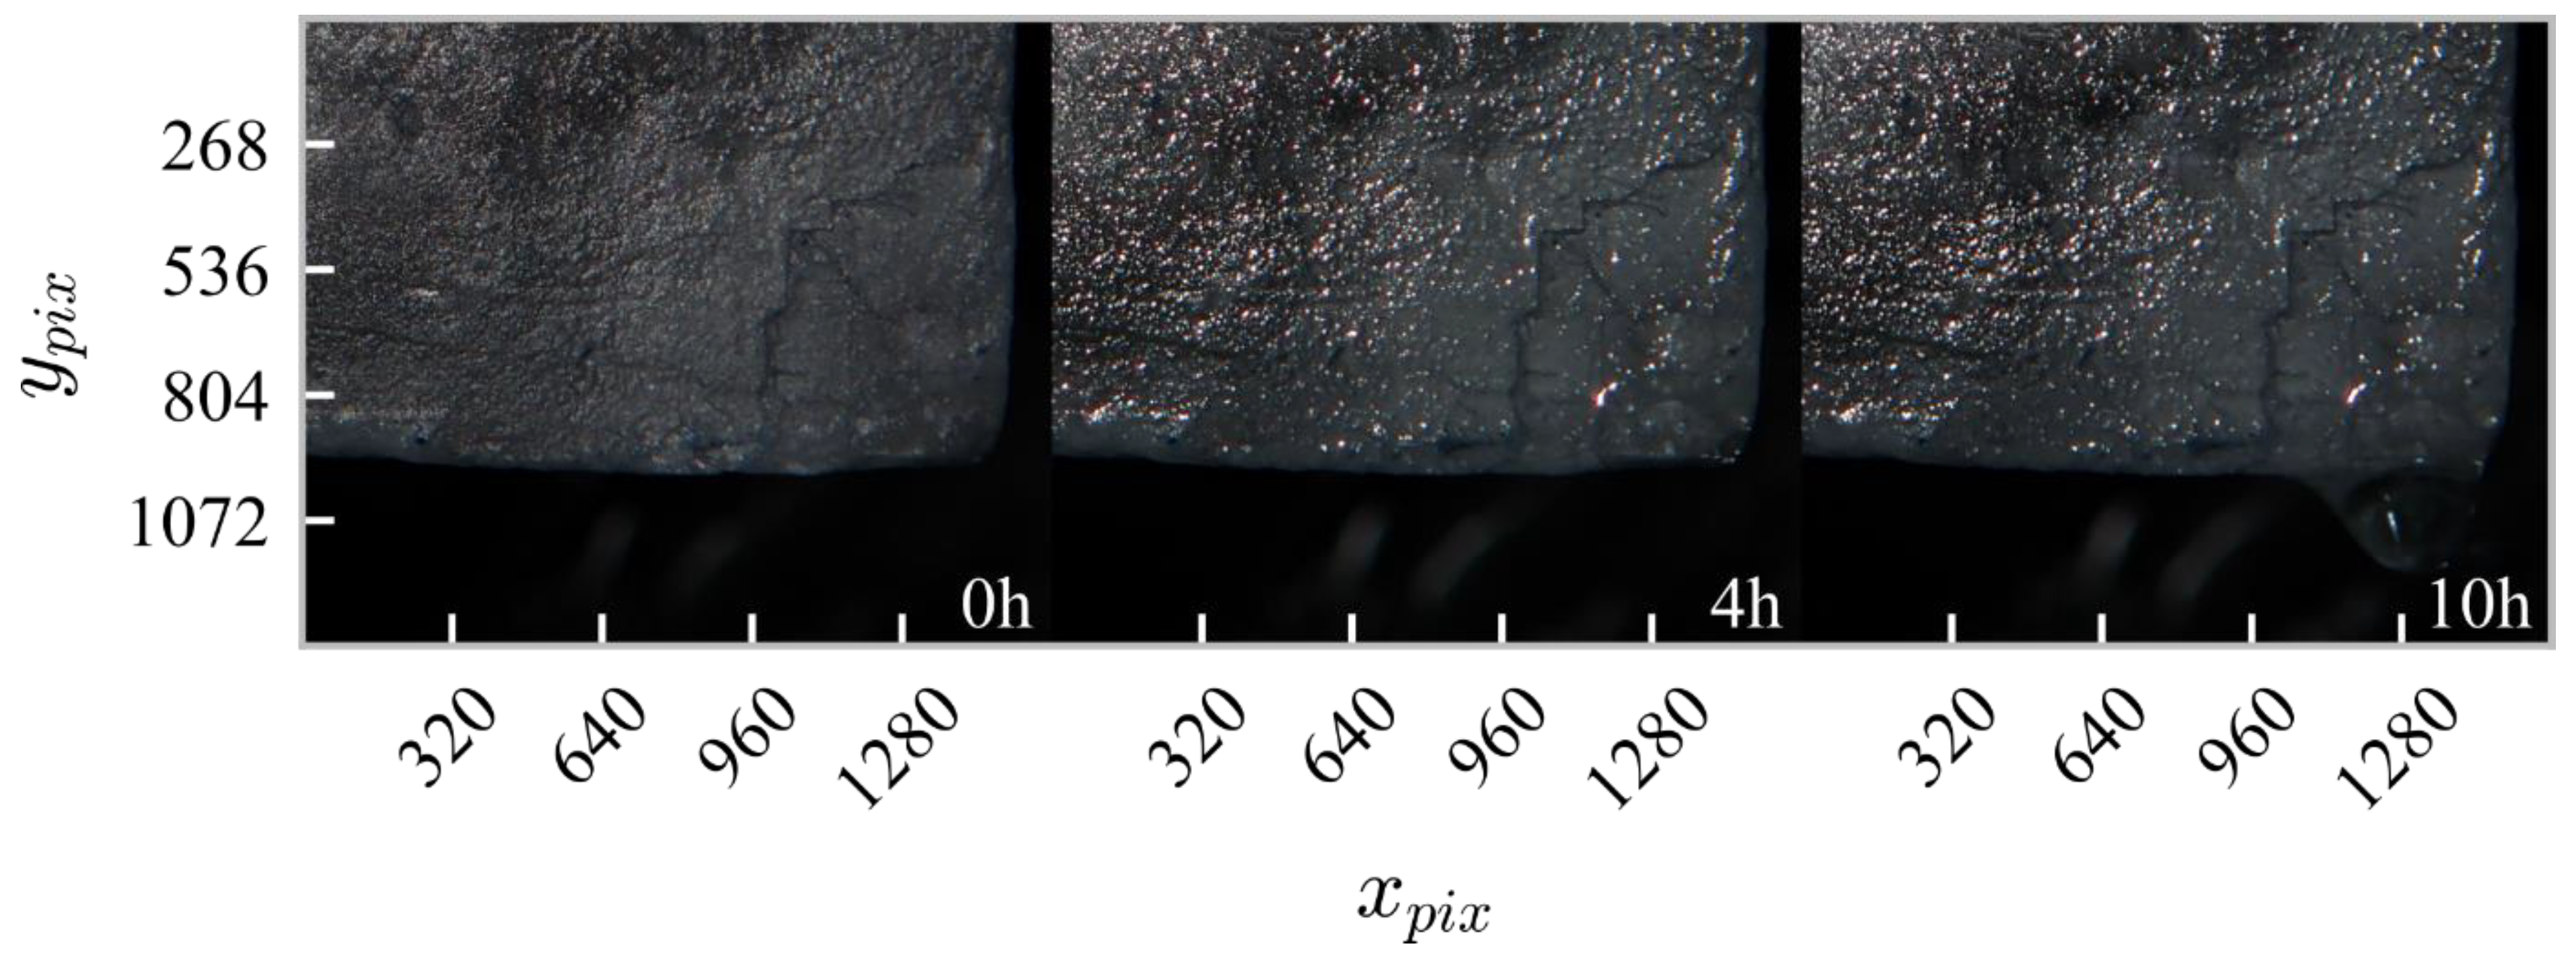
3.2. Stage II—Crystal Testing in the Relative Humidity Range of 74.2%–77.7%

This stage consisted of several series of experiments for different humidity levels within the tested range. For each measurement series, the crystal was exposed to the specified humidity for 20 h. The example results for relative humidities 74.2%, 75.0%, 76.7%, and 77.7% are shown in Figure 8. The given relative humidity values are averages, specified to within two standard deviations. The humidity oscillations are due to the operation of the climate chamber’s control system.
The presented graphs show that, for the extreme values of the tested range, the crystal surface behaves monotonically over time. For the upper range value, a formation of a water film on the crystal surface can be observed after 3–4 h (Figure 8). After 20 h, the crystal was noticeably wet. Droplets were observed to form on its surface. The surface stabilization time of the crystal can be estimated at about 10 h, as seen in the graphs for both 74.2% and 77.7% relative humidity. The second surface state identified for relative humidity in the range of 75.5%–77.0% is a transitional/unstable state characterized by high variability in the results obtained. In this range, no water film formation is visible on the crystal surface. For the boundary values of the tested humidity range and the middle value, photographs illustrating the described evolution of the crystal surfaces are shown. The photos (Figure 9) are presented for three time points: at 0, 3, and 20 h under the specified environmental conditions.
Between the particular measurement series, significant changes in the brightness of the crystal surface can be observed. As the surface becomes increasingly moist, light penetrates it more easily, resulting in less light being reflected from the surface. In the image in the lower right corner, you can see the forming water droplets mentioned earlier (for a humidity of 77.7%). The largest differences can be seen in the vertical line for the 20 h exposure marked with an arrow in Figure 9.
The increase in relative humidity to 78.0 ± 0.2% leads to continuous condensation on the crystal surface. Significant amounts of water, interpreted as the beginning of droplet formation, can be observed after approximately 4 h. After 10 h under the specified conditions, a large drop of saltwater solution was seen dripping off the surface. Photos of the crystal before measurement and at 4 and 10 h under the specified conditions are shown in Figure 10.
The experiment was conducted with the uncovered crystal to best reflect the real conditions in the Crystal Caves. In this case, the total mass of H2O molecules collected on the surface is much larger, which may result in faster water runoff from the surface and consequently lead to faster crystal degradation.
Analysis of all obtained results allows for identifying four basic states in which the crystal surface can be found:
  • Dry and Early Adsorption State < 65.0% [54];
  • Quasi-Static Condensation State >= 65.0% and <75.5%;
  • Unstable State >= 75.5% < 77.0%rh;
  • Dynamic Water Condensation State >= 77.0%—Crystal surface degradation.

4. Discussion

The presented technique allowed for qualitatively capturing changes on the surface resulting from the slow process of water vapor condensation on halite crystals. Although photography in the visible spectrum is not sufficient for a detailed analysis of the molecular adsorption mechanisms governing water layer formation, it enabled an identification of surface-state changes and transitions between different wetting regimes on the crystals. Photography allowed for the determination of the types of states and transitions between them that the surface of the examined material undergoes, eliminating the need for more invasive analytical methods. The main advantage of a cyclic photo-based technique is the ability to precisely track changes over time. It also gave the opportunity to determine the moments when the crystal reaches a quasi-static or stable state. In the case of the halite crystal surface, four significant states were identified. They are presented in Figure 11.
In terms of the adsorption model, water condensation on NaCl crystal surfaces can occur at a relative humidity of 60.0%, where a water film of about 1 nm thickness is observed. The growth of this water layer is exponential [54]. The first changes recorded by the camera sensor were observed at approximately 65.0% relative humidity, indicating the formation of a significant thickness of the water film. This point can be defined as the threshold of visible changes on the crystal surface. That confirmed the correlation between humidity level and the dynamics of water film formation. Quasi-stable condensation of water vapor on the crystal was observed up to a relative humidity of 75.5% (boundary value). A further increase in relative humidity caused the crystal surface to enter a transition state in which it showed a strong dependence on the air humidity acting on it. This state lasted until the relative humidity of 77.0% (critical value) was reached, after which the crystal was in a constant state of wetness—the amount of water on the crystal surface was sufficiently large to allow it to flow off. The formation and dripping of water droplets can lead to significant losses in the halite crystal lattice.
The minimum exposure time of the crystal to the specified environmental conditions should be about 10 h. After this time, a clear stabilization of the crystal surface brightness is observed. This time may depend on the presence of impurities and decreases with increasing humidity. Slightly exceeding the critical humidity, significant amounts of water can be observed after a few hours of crystal exposure. When interpreting condensation times, it is important to keep in mind the flux of flowing gas in the vicinity of the crystal under study. In general, an increase in the flux of moist air can be expected to result in a shortening of the equilibrium drag times. Due to the nature and objectives of the research, the flux in this study is higher than that observable in real conditions prevailing in the Crystal Caves, so in reality the times to reach specific states may be longer. This phenomenon, in the context of the protection of Crystal Caves, is advantageous because the longer reaction time allows for better management of processes aimed at protecting halite crystals.

5. Conclusions

The presented paper describes an optical method for detecting moisture condensation, which was used for non-invasive and continuous monitoring of changes occurring on the halite surface.
The analysis performed allows identification of the states of the halite surface in relation to relative humidity and the determination of CRH values for the studied samples. It was shown that at relative air humidity above 77% leads to the condensation of water vapor on the crystal surface and the formation of brine drops, which can lead to significant losses in the halite crystal lattice through gravitational drainage of condensate from the surface. The hypothesis of the effectiveness of the proposed method as a tool for monitoring and assessing the risk of surface degradation was confirmed.
Based on the conducted research, it will be possible to prevent threats related to the degradation of the halite cover earlier by identifying the condensate covering it. This approach could significantly support preservation strategies for unique objects that are sensitive to micro-climatic fluctuations.

Author Contributions

Conceptualization, T.P.; Methodology, T.P.; Investigation, T.P.; Writing—original draft, T.P.; Writing—review and editing, P.J. and D.B.; Visualization, D.B.; Supervision, P.J.; Funding acquisition, P.J. All authors have read and agreed to the published version of the manuscript.

Funding

This work was carried out under the Own Research Program, project no. 5 (2023–2024), financed by the Strata Mechanics Research Institute of the Polish Academy of Sciences.

Data Availability Statement

The data used in this article are available upon reasonable request from the corresponding author. Due to the large size of the files—they are high-resolution images—the data have not been placed in a public repository.

Acknowledgments

We would like to thank the Wieliczka Salt Mine for providing the samples for our research.

Conflicts of Interest

The authors declare no conflict of interest.

References

  1. Beysens, D. The Physics of Dew, Breath Figures and Dropwise Condensation; Lecture Notes in Physics; Springer International Publishing: Cham, Switzerland, 2022; Volume 994, ISBN 978-3-030-90441-8. [Google Scholar]
  2. Liu, P.; Song, M.; Zhao, T.; Gunthe, S.S.; Ham, S.; He, Y.; Qin, Y.M.; Gong, Z.; Amorim, J.C.; Bertram, A.K.; et al. Resolving the Mechanisms of Hygroscopic Growth and Cloud Condensation Nuclei Activity for Organic Particulate Matter. Nat. Commun. 2018, 9, 4076. [Google Scholar] [CrossRef] [PubMed]
  3. He, G.; Zhang, C.; Dong, Z. Survival in Desert: Extreme Water Adaptations and Bioinspired Structural Designs. iScience 2023, 26, 105819. [Google Scholar] [CrossRef]
  4. Hauber, F.; Konrad, W.; Roth-Nebelsick, A. Aerial Roots of Orchids: The Velamen Radicum as a Porous Material for Efficient Imbibition of Water. Appl. Phys. A 2020, 126, 885. [Google Scholar] [CrossRef]
  5. Wierzchos, J.; Ascaso, C.; McKay, C.P. Endolithic Cyanobacteria in Halite Rocks from the Hyperarid Core of the Atacama Desert. Astrobiology 2006, 6, 415–422. [Google Scholar] [CrossRef]
  6. Robinson, C.K.; Wierzchos, J.; Black, C.; Crits-Christoph, A.; Ma, B.; Ravel, J.; Ascaso, C.; Artieda, O.; Valea, S.; Roldán, M.; et al. Microbial Diversity and the Presence of Algae in Halite Endolithic Communities Are Correlated to Atmospheric Moisture in the Hyper-arid Zone of the A Tacama D Esert. Environ. Microbiol. 2015, 17, 299–315. [Google Scholar] [CrossRef] [PubMed]
  7. Vítek, P.; Edwards, H.G.M.; Jehlička, J.; Ascaso, C.; De Los Ríos, A.; Valea, S.; Jorge-Villar, S.E.; Davila, A.F.; Wierzchos, J. Microbial Colonization of Halite from the Hyper-Arid Atacama Desert Studied by Raman Spectroscopy. Phil. Trans. R. Soc. A 2010, 368, 3205–3221. [Google Scholar] [CrossRef]
  8. Ren, H.; Ma, Z.; Liu, J.; Gong, X.; Li, W. A Review of Heat and Mass Transfer Improvement Techniques for Dehumidifiers and Regenerators of Liquid Desiccant Cooling Systems. Appl. Therm. Eng. 2019, 162, 114271. [Google Scholar] [CrossRef]
  9. Salehi, A.A.; Ghannadi-Maragheh, M.; Torab-Mostaedi, M.; Torkaman, R.; Asadollahzadeh, M. A Review on the Water-Energy Nexus for Drinking Water Production from Humid Air. Renew. Sustain. Energy Rev. 2020, 120, 109627. [Google Scholar] [CrossRef]
  10. Barala, P.; Hooda, V. Hydrophilic Polymers in Agriculture and the Use of Nanoadditives to Improve Their Capabilities. J. Soil Sci. Plant Nutr. 2022, 22, 2992–3011. [Google Scholar] [CrossRef]
  11. Al-Rashed, R.; Al-Jabari, M. Concrete Protection by Combined Hygroscopic and Hydrophilic Crystallization Waterproofing Applied to Fresh Concrete. Case Stud. Constr. Mater. 2021, 15, e00635. [Google Scholar] [CrossRef]
  12. Esfahani, M.B.; Eshaghi, A.; Bakhshi, S.R. Transparent Hydrophobic, Self-Cleaning, Anti-Icing and Anti-Dust Nano-Structured Silica Based Thin Film on Cover Glass Solar Cell. J. Non-Cryst. Solids 2022, 583, 121479. [Google Scholar] [CrossRef]
  13. Muñóz, A.J.; Reca, J.; Martínez, J. Application of a Hydrophobic Coating to a Pressurized Pipe and Its Effect on Energy Losses and Fluid Flow Profile. Sci. Rep. 2024, 14, 8236. [Google Scholar] [CrossRef] [PubMed]
  14. d’Ambrosio Alfano, F.R.; Palella, B.I.; Riccio, G. Moisture in Historical Buildings from Causes to the Application of Specific Diagnostic Methodologies. J. Cult. Herit. 2023, 61, 150–159. [Google Scholar] [CrossRef]
  15. Vazquez, P.; Lux, J. Salt Crystallization on Crazannes Limestone in a Long-Term Storage Environment. Minerals 2023, 13, 1282. [Google Scholar] [CrossRef]
  16. Shi, W.; Liu, P.; Sun, B.; Wang, Q.; Xie, X.; Liang, Y.; Li, C. Water Vapor Condensation Prevention and Risk Rating Evaluation Based on Yang Can’s Tomb. Herit. Sci. 2024, 12, 178. [Google Scholar] [CrossRef]
  17. Li, F.; Yang, H.; Ayyamperumal, R.; Liu, Y. Evaluation of Hydrophilicity and Moisture Adsorption Characteristics of Inorganic Mineral Pigments to Sustain Ancient Paintings. J. King Saud Univ. Sci. 2022, 34, 102204. [Google Scholar] [CrossRef]
  18. Liñán, C.; Benavente, J.; Del Rosal, Y.; Vadillo, I.; Ojeda, L.; Carrasco, F. Condensation Water in Heritage Touristic Caves: Isotopic and Hydrochemical Data and a New Approach for Its Quantification through Image Analysis. Hydrol. Process. 2021, 35, e14083. [Google Scholar] [CrossRef]
  19. Columbu, A.; Audra, P.; Gázquez, F.; D’Angeli, I.M.; Bigot, J.-Y.; Koltai, G.; Chiesa, R.; Yu, T.-L.; Hu, H.-M.; Shen, C.-C.; et al. Hypogenic Speleogenesis, Late Stage Epigenic Overprinting and Condensation-Corrosion in a Complex Cave System in Relation to Landscape Evolution (Toirano, Liguria, Italy). Geomorphology 2021, 376, 107561. [Google Scholar] [CrossRef]
  20. Jamróz, P.; Socha, K. Monitoring of the Rock Mass Moisture in the Crystal Caves Nature Reserve. Arch. Min. Sci. 2023, 67, 729–742. [Google Scholar] [CrossRef]
  21. Alexandrowicz, Z. Groty Kryształowe w Kopalni Soli Wieliczka; Studia Naturae, Instytut Ochrony Przyrody PAN: Kraków, Poland, 2000; Volume 46. [Google Scholar]
  22. Alexandrowicz, Z.; Urban, J.; Andreychouk, V. Crystal Caves in the ‘Wieliczka’ Salt Mine—Unique Cave Site. Z. Für Geomorphol. Suppl. Issues 2021, 62, 235–254. [Google Scholar] [CrossRef]
  23. Walker, J.P.; Willgoose, G.R.; Kalma, J.D. In Situ Measurement of Soil Moisture: A Comparison of Techniques. J. Hydrol. 2004, 293, 85–99. [Google Scholar] [CrossRef]
  24. Kim, M.-I.; Jeong, G.-C.; Chung, I.-M.; Kim, N.-W. Experimental Assessment of the Infiltration Properties of a Coarse Soil Medium in a Dielectric Infiltration Test. Environ. Geol. 2009, 57, 591–600. [Google Scholar] [CrossRef]
  25. Placidi, P.; Gasperini, L.; Grassi, A.; Cecconi, M.; Scorzoni, A. Characterization of Low-Cost Capacitive Soil Moisture Sensors for IoT Networks. Sensors 2020, 20, 3585. [Google Scholar] [CrossRef] [PubMed]
  26. Dai, Q.; Hu, J.; Salmeron, M. Adsorption of Water on NaCl (100) Surfaces: Role of Atomic Steps. J. Phys. Chem. B 1997, 101, 1994–1998. [Google Scholar] [CrossRef]
  27. Foster, M.C.; Ewing, G.E. Adsorption of Water on the NaCl(001) Surface. II. An Infrared Study at Ambient Temperatures. J. Chem. Phys. 2000, 112, 6817–6826. [Google Scholar] [CrossRef]
  28. Dai, D.J.; Peters, S.J.; Ewing, G.E. Water Adsorption and Dissociation on NaCl Surfaces. J. Phys. Chem. 1995, 99, 10299–10304. [Google Scholar] [CrossRef]
  29. Ślązak, N.; Obracaj, D.; Borowski, M. Warunki Mikroklimatu W Podziemnych Obiektach Zabytkowych Kopalni Soli. Górnictwo I Geoinżynieria 2006, 30, 121–130. [Google Scholar]
  30. Adams, J.R.; Merz, A.R. Hygroscopicity of Fertilizer Materials and Mixtures. Ind. Eng. Chem. 1929, 21, 305–307. [Google Scholar] [CrossRef]
  31. Alexandrowicz, Z.; Urban, J. The conservation plan of the “Crystal Caves” Nature Reserve in the “Wieliczka” Salt Mine and its implementation in 2011–2015. Chrońmy Przyr. Ojczystą 2018, 74, 299–307. [Google Scholar]
  32. Kozłowski, R.; Hosker, R. Zabezpieczenie Przed Zniszczeniem Kopalni Soli w Wieliczce. Sprawozdanie z Realizacji Polsko—Amerykańskiego Programu Badawczego Za Okres 1992–1993; Instytut Katalizy i Fizykochemi Powierzchni PAN: Kraków, Poland, 1993. [Google Scholar]
  33. Salmon, L.G.; Cass, G.R.; Kozlowski, R.; Hejda, A.; Spiker, E.C.; Bates, A.L. Air Pollutant Intrusion into the Wieliczka Salt Mine. Environ. Sci. Technol. 1996, 30, 872–880. [Google Scholar] [CrossRef]
  34. Steiger, M.; Charola, A.E.; Sterflinger, K. Weathering and Deterioration. In Stone in Architecture; Siegesmund, S., Snethlage, R., Eds.; Springer: Berlin/Heidelberg, Germany, 2011; pp. 227–316. ISBN 978-3-642-14474-5. [Google Scholar]
  35. Martínez-Martínez, J.; Arizzi, A.; Benavente, D. The Role of Calcite Dissolution and Halite Thermal Expansion as Secondary Salt Weathering Mechanisms of Calcite-Bearing Rocks in Marine Environments. Minerals 2021, 11, 911. [Google Scholar] [CrossRef]
  36. Bryan, C.R.; Knight, A.W.; Katona, R.M.; Sanchez, A.C.; Schindelholz, E.J.; Schaller, R.F. Physical and Chemical Properties of Sea Salt Deliquescent Brines as a Function of Temperature and Relative Humidity. Sci. Total Environ. 2022, 824, 154462. [Google Scholar] [CrossRef]
  37. Yalcin, S.E.; Legg, B.A.; Yeşilbaş, M.; Malvankar, N.S.; Boily, J.-F. Direct Observation of Anisotropic Growth of Water Films on Minerals Driven by Defects and Surface Tension. Sci. Adv. 2020, 6, eaaz9708. [Google Scholar] [CrossRef]
  38. Winardhi, C.W.; Godinho, J.R.D.A.; Gutzmer, J. The Effect of Macroscopic Particle Features on Mineral Dissolution. Minerals 2023, 13, 253. [Google Scholar] [CrossRef]
  39. Boily, J.-F.; Yeşilbaş, M.; Musleh Uddin, M.M.; Baiqing, L.; Trushkina, Y.; Salazar-Alvarez, G. Thin Water Films at Multifaceted Hematite Particle Surfaces. Langmuir 2015, 31, 13127–13137. [Google Scholar] [CrossRef] [PubMed]
  40. Phan, A.; Ho, T.A.; Cole, D.R.; Striolo, A. Molecular Structure and Dynamics in Thin Water Films at Metal Oxide Surfaces: Magnesium, Aluminum, and Silicon Oxide Surfaces. J. Phys. Chem. C 2012, 116, 15962–15973. [Google Scholar] [CrossRef]
  41. Yeşilbaş, M.; Boily, J.-F. Particle Size Controls on Water Adsorption and Condensation Regimes at Mineral Surfaces. Sci. Rep. 2016, 6, 32136. [Google Scholar] [CrossRef] [PubMed]
  42. Wu, B.; Chen, X.; Hou, D. Modeling of Monolayer Water Adsorption on Surface of Cement Minerals by Molecule Simulation and Adsorption Isotherm. Mater. Today Commun. 2023, 36, 106646. [Google Scholar] [CrossRef]
  43. Wu, S.; Yu, Q. Experimental Investigations on Water Condensation in the Nanopores of Shales. Energy Sources Part A Recovery Util. Environ. Eff. 2024, 46, 16378–16396. [Google Scholar] [CrossRef]
  44. Sheng, Q.; Sun, J.; Wang, Q.; Wang, W.; Wang, H.S. On the Onset of Surface Condensation: Formation and Transition Mechanisms of Condensation Mode. Sci. Rep. 2016, 6, 30764. [Google Scholar] [CrossRef]
  45. Liu, J.; Aizawa, H.; Yoshino, H. CFD Prediction of Surface Condensation on Walls and Its Experimental Validation. Build. Environ. 2004, 39, 905–911. [Google Scholar] [CrossRef]
  46. Staszczuk, P.; Biliński, B. Water Film Properties on Mineral Surfaces in Flotation Processes. Colloids Surf. A Physicochem. Eng. Asp. 1993, 79, 97–104. [Google Scholar] [CrossRef]
  47. Künzel, H.; Tanaka, E.; Zirkelbach, D. Tipping Point for Condensation Water Drainage on Surfaces and Interfaces of Insulated Wall Assemblies-Experimental Method to Define Water Content Limits for Hygrothermal Simulation Models. In Proceedings of the Architectural Science Association (ASA International Conference), New Orleans, LA, USA, 1–3 October 2023. [Google Scholar]
  48. Lad, R.A. Adsorption of Water on Sodium Chloride: The Effect of Prior Exposure to Hydrogen Chloride, Carbon Dioxide and Water Vapor. Surf. Sci. 1968, 12, 37–45. [Google Scholar] [CrossRef]
  49. Brunauer, S.; Emmett, P.H.; Teller, E. Adsorption of Gases in Multimolecular Layers. J. Am. Chem. Soc. 1938, 60, 309–319. [Google Scholar] [CrossRef]
  50. Manaf, N.D.A.; Fukuda, K.; Subhi, Z.A.; Mohd Radzi, M.F. Influences of Surface Roughness on the Water Adsorption on Austenitic Stainless Steel. Tribol. Int. 2019, 136, 75–81. [Google Scholar] [CrossRef]
  51. Thi Bao Le, T.; Divine-Ayela, C.; Striolo, A.; Cole, D.R. Effects of Surface Contamination on the Interfacial Properties of CO2/Water/Calcite Systems. Phys. Chem. Chem. Phys. 2021, 23, 18885–18892. [Google Scholar] [CrossRef]
  52. Li, X.; Liu, L.; Zhao, J.; Tan, J. Optical Properties of Sodium Chloride Solution within the Spectral Range from 300 to 2500 Nm at Room Temperature. Appl. Spectrosc. 2015, 69, 635–640. [Google Scholar] [CrossRef]
  53. Zhang, Z.; Ewing, G.E. Attenuated Partial Internal Reflection Infrared Spectroscopy. Anal. Chem. 2002, 74, 2578–2583. [Google Scholar] [CrossRef]
  54. Yang, L.; He, J.; Shen, Y.; Li, X.; Sun, J.; Czajkowsky, D.M.; Shao, Z. Nanoscopic Characterization of the Water Vapor-Salt Interfacial Layer Reveals a Unique Biphasic Adsorption Process. Sci. Rep. 2016, 6, 31688. [Google Scholar] [CrossRef]
  55. Ewing, G.E. Thin Film Water. J. Phys. Chem. B 2004, 108, 15953–15961. [Google Scholar] [CrossRef]
  56. Heavens, O.S. Optical Properties of Thin Films. Rep. Prog. Phys. 1960, 23, 1–65. [Google Scholar] [CrossRef]
Figure 1. Crystal Caves—scheme [20]. The Upper Cave is located directly above the Middle Cave.
Minerals 15 00435 g001
Figure 2. Lower Crystal Cave halite cover.
Minerals 15 00435 g002
Figure 3. The model of the process of water gathering on the surface of a crystal lattice. The green and red dots represent the lattice structure of the surface. The blue dots represent liquid or solution molecules.
Minerals 15 00435 g003
Figure 4. Measurement setup.
Minerals 15 00435 g004
Figure 5. Halite crystal: (a) original state and (b) covered by black layer.
Minerals 15 00435 g005
Figure 6. Graphical representation of the measurement data processing process.
Minerals 15 00435 g006
Figure 7. Graphs showing the relative amount of OPs depending on humidity and exposure time.
Minerals 15 00435 g007
Figure 8. Presentation of measurement results of optical changes occurring on the halite crystal surface depending on time and relative humidity.
Minerals 15 00435 g008
Figure 9. Photos of the crystal surface at 74.2%, 75.7%, 77.7% relative humidity. From left: immediately after reaching the specified humidity and at 3 and 20 h under the given environmental conditions. The largest differences can be seen in the vertical line for the 20 h exposure marked with an arrow.
Minerals 15 00435 g009
Figure 10. Imaging of water droplet formation under conditions: Humidity—78.0%rh. From left: dry crystal, crystal after 4 and 10 h under the specified environmental conditions.
Minerals 15 00435 g010
Figure 11. Diagram showing the states in which the crystal can be found depending on the relative humidity affecting it.
Minerals 15 00435 g011
Disclaimer/Publisher’s Note: The statements, opinions and data contained in all publications are solely those of the individual author(s) and contributor(s) and not of MDPI and/or the editor(s). MDPI and/or the editor(s) disclaim responsibility for any injury to people or property resulting from any ideas, methods, instructions or products referred to in the content.

