Article

Utilizing Lineaments Extracted from Radar Images and Drainage Network to Evaluate the Mineral Potential of Au and Cu in the Bom Jardim Group (Neoproterozoic), Southern Brazil

by
Marco Antonio Fontoura Hansen
1,*,
César Augusto Moreira
2,
Henri Masquelin
3,
José Pedro Rebés Lima
1,
Lenon Melo Ilha
1,
Luiza Lima Alves
2,
Sissa Kumaira
1 and
Ana Flávia da S. Araújo
2
1
Universidade Federal do Pampa, Campus Caçapava do Sul., Pedro Anunciação Avenue, 111, Vila Batista, Caçapava do Sul ZIP 96570-000, Rio Grande do Sul State, Brazil
2
Department of Geology, Universidade Estadual Paulista “Júlio de Mesquita Filho”, 24-A Avenue, 1515, Bela Vista, Rio Claro ZIP 13506-900, São Paulo State, Brazil
3
Instituto de Ciencias Geológicas, Universidad de la Republica, Iguá 4225 Esq. Mataojo, Montevideo 11400, Uruguay
*
Author to whom correspondence should be addressed.
Minerals 2025, 15(5), 436; https://doi.org/10.3390/min15050436
Submission received: 14 January 2025 / Revised: 10 April 2025 / Accepted: 19 April 2025 / Published: 23 April 2025

Abstract

:
The exploration of gold and copper is essential for the sustainable development of mining worldwide and in Brazil, given the dependency on copper imports. This study aims to reassess and identify promising areas for sulfide prospecting in southern Brazil, with technologies, including radar images (ALOS PALSAR) and software (PCI Geomatics CATALYST Professional Complete, version 2023, QGIS 3.38.1 (Grenoble), Spring 5.5.6, and Orient 3.20.0), for the extraction and processing of tectonic lineaments. The comparative analysis between these linear structures and the drainage networks allows for the assessment of alluvial gold minerals and disseminated copper in andesites, as observed in the abandoned Seival mines. The methods employed include the extraction of tectonic lineaments and the evaluation of mineral occurrences in the Hilário (volcanogenic) and Arroio dos Nobres (sedimentary) formations of the Bom Jardim Group (Neoproterozoic) and their drainage networks. As a result, this article concludes that the main tectonic alignment directions for copper and gold occurrences disseminated in andesites are predominantly E–W, N–S, N 5° W, N 58° W, N 62° E, and N 23° E, and for alluvial gold N–S and N 45° W. These results are crucial for reassessing abandoned mining areas and identifying the primary mineral orientations in rocks and the predominant orientation of alluvial deposits, serving as structural controls for discovering new mineral occurrences. It is concluded that geotechnologies have expanded the possibilities for study, enabling a more detailed analysis of tectonic lineaments and drainage systems and providing a valuable prospective guide for gold and copper mineral exploration.

1. Introduction

The accelerated advances in Geographic Information Systems (GISs) have enabled the study of geological structures for mineral exploration and improved the analysis of satellite image lineaments at different scales [1,2,3].
The study area is located at the municipalities of Lavras do Sul, Caçapava do Sul, Bagé, and São Sepé in the Rio Grande do Sul State, Brazil. The Hilário Formation, characterized by its effusive volcanic facies and volcaniclastic and volcano-sedimentary facies, along with the Arroio dos Nobres Formation, both part of the Bom Jardim Group, provide a favorable setting for the occurrence of copper and gold mineralization [1]. These resources are important to modern industry and technology, especially considering Brazil’s significant dependence on copper imports.
Identifying tectonic lineaments is crucial in mineral exploration, as these structures often control mineralization [4]. Bricalli and Mello [5] associated the lineament patterns identified in the basement domain with Precambrian litho-structural controls, highlighting a predominant NE–SW-oriented set of lineaments in southeastern Brazil.
Recent advances in GIS further facilitate the study of geological structures for mineral exploration and enhance lineaments analysis across various scales of satellite images [6]. Hajaj et al. [2] have contributed to the application of hyperspectral imagery and machine learning in mineral exploration, emphasizing their utility in detecting geological features, including mineral deposits.
Base and previous metal mineralizations are often associated with tectonic structures (i.e., faults and deformation zones) as a hydrothermal metallogenetic model [7,8,9,10]. Remote sensing allows for efficient and rapid analysis of large areas for structural, lithological, and mineralogical mapping [11]. This study aims to apply segmentation techniques to drainage networks and SAR image lineaments to automatically extract the orientation of deformation features/structures and integrate them with the Hilário (with its facies) and Arroio dos Nobres formations, which host disseminated copper and gold deposits as well as alluvial gold deposits [12,13].
These techniques have been successfully applied in mineral exploration, as demonstrated in studies on the Mandira granites in the São Paulo State, where lineament analysis combined with field investigations improved the identification of structures for mapping potential mineralized areas [14].
Jellouli et al. [3] conducted studies on lithological and hydrothermal alteration mapping. They aimed to identify ore deposits by comparing Landsat 8 OLI, Terra ASTER, and ALOS PALSAR radar satellites for automatic and manual lineament extraction. Their findings concluded that ALOS PALSAR radar data and PC1 OLI effectively mapped structural lineaments.
Morphostructural lineament extraction from remote sensing data is necessary for geological and mineral exploration studies [15]. Lineament identification assists in planning geophysical surveys in copper and gold prospecting areas, such as the Seival region, particularly around abandoned mines, to assess the tectonic control of mineralization.
The combined use of remote sensing for analyzing tectonic lineaments, drainage networks, and field geology in regions with hydrothermal deposits enables the evaluation of correlations between regional and local structural controls, improving prospecting criteria for sulfide mineral deposits. This approach establishes a connection between indirect prospecting guides (remote sensing) and direct indicators (field-recognized mineralization evidence) for the study area.
The use of radar (SAR) imagery is preferred for penetrating regions with vegetation cover or adverse weather conditions due to its ability to operate in all weather (through clouds and rain) and independent of sunlight. Additionally, radar microwaves, especially in longer wavelengths (such as L and P bands), penetrate vegetation, allowing for soil structure analysis. Radar is also sensitive to surface roughness and moisture, making it ideal for high-precision monitoring of deforestation, agriculture, floods, and ground movement (such as subsidence or earthquakes).

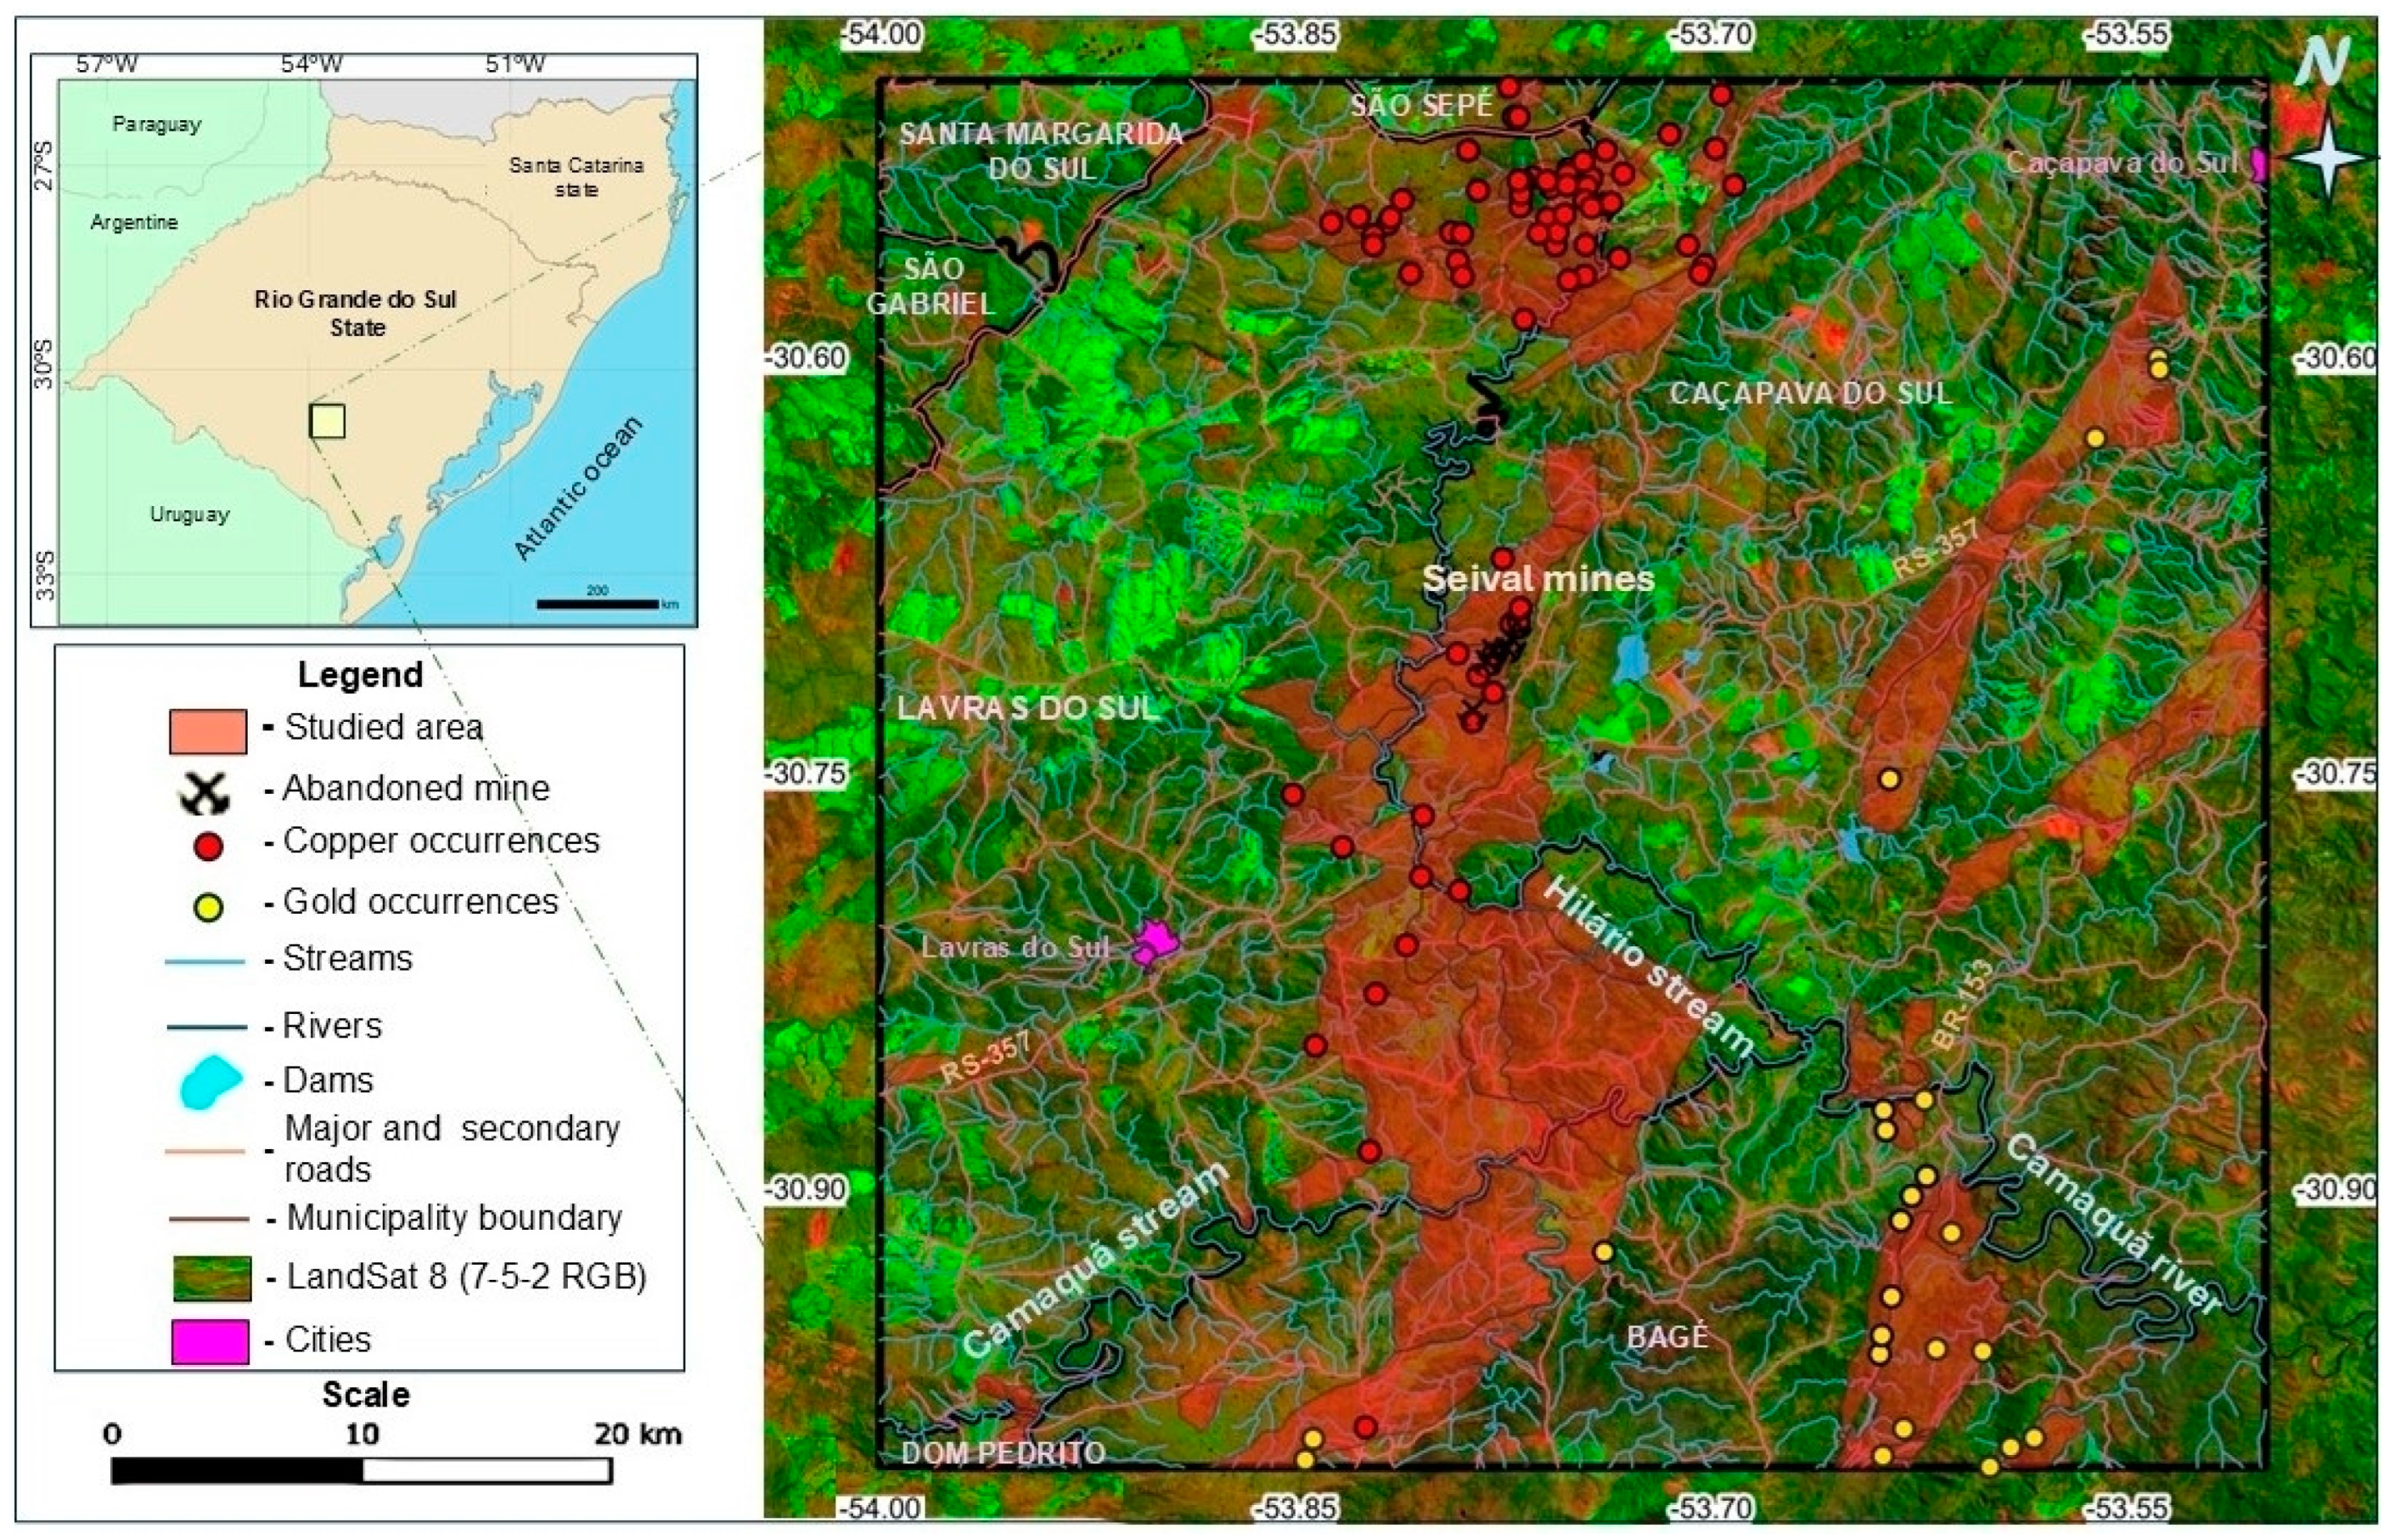
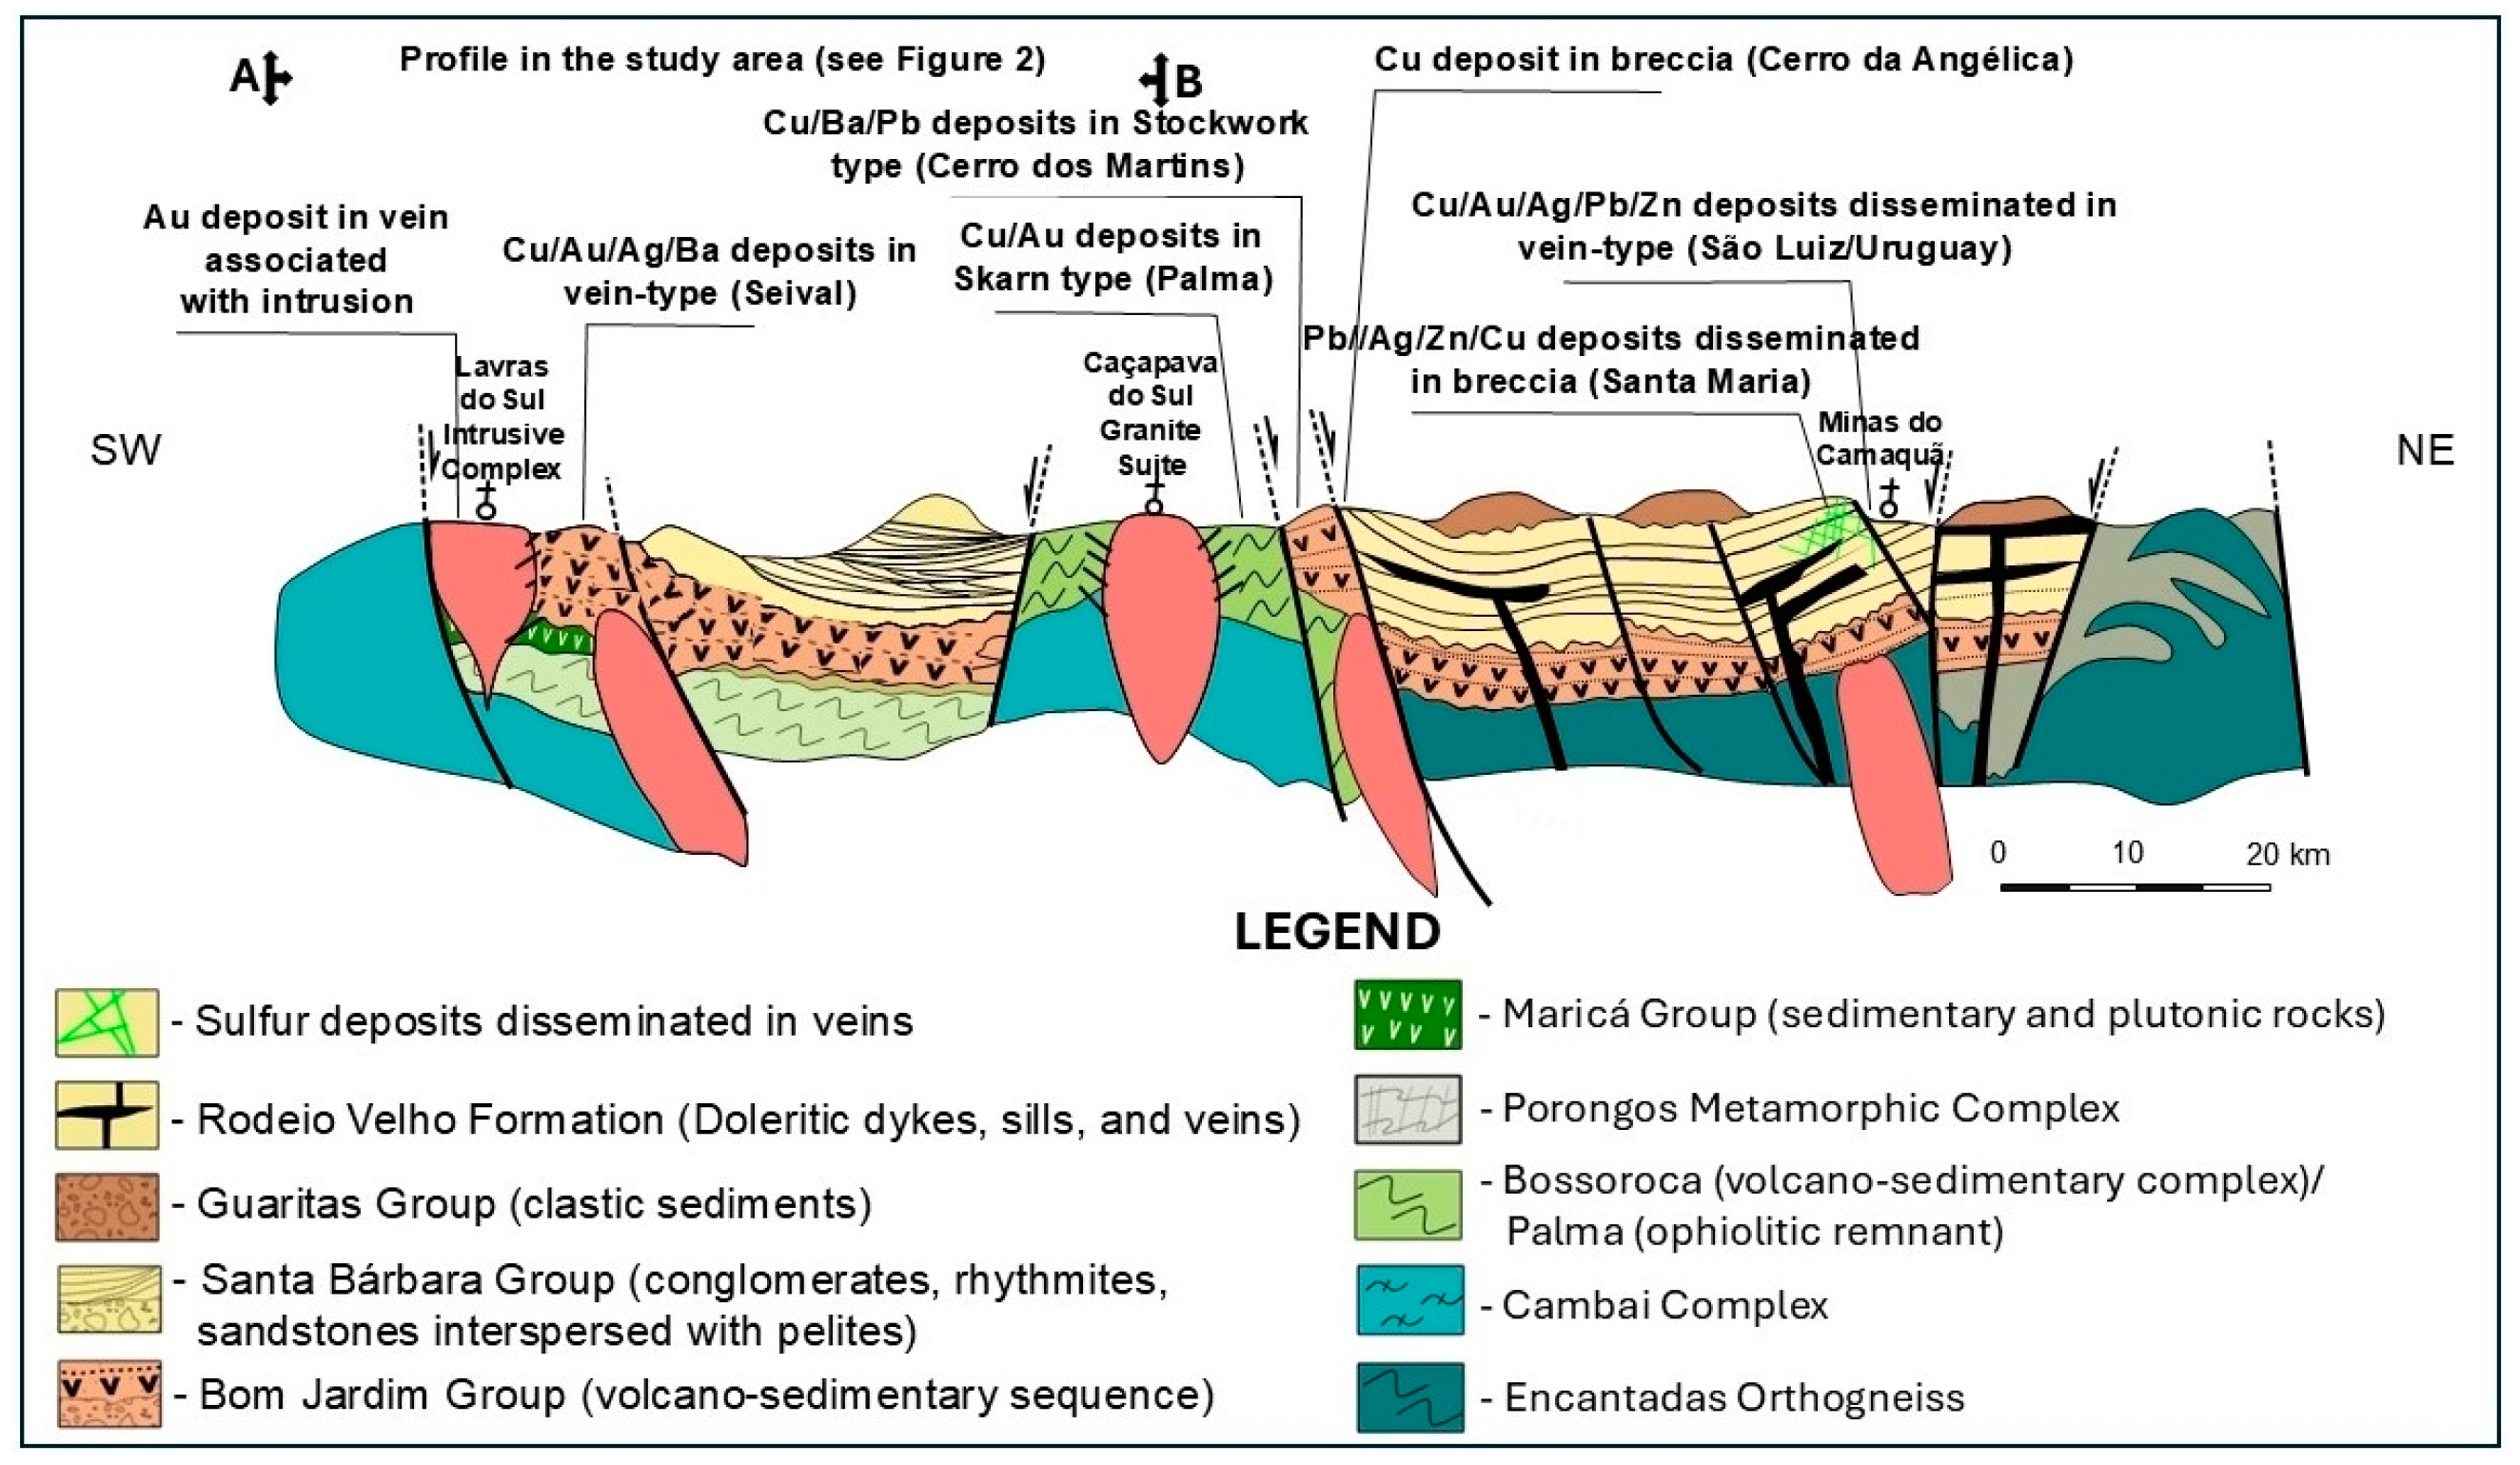
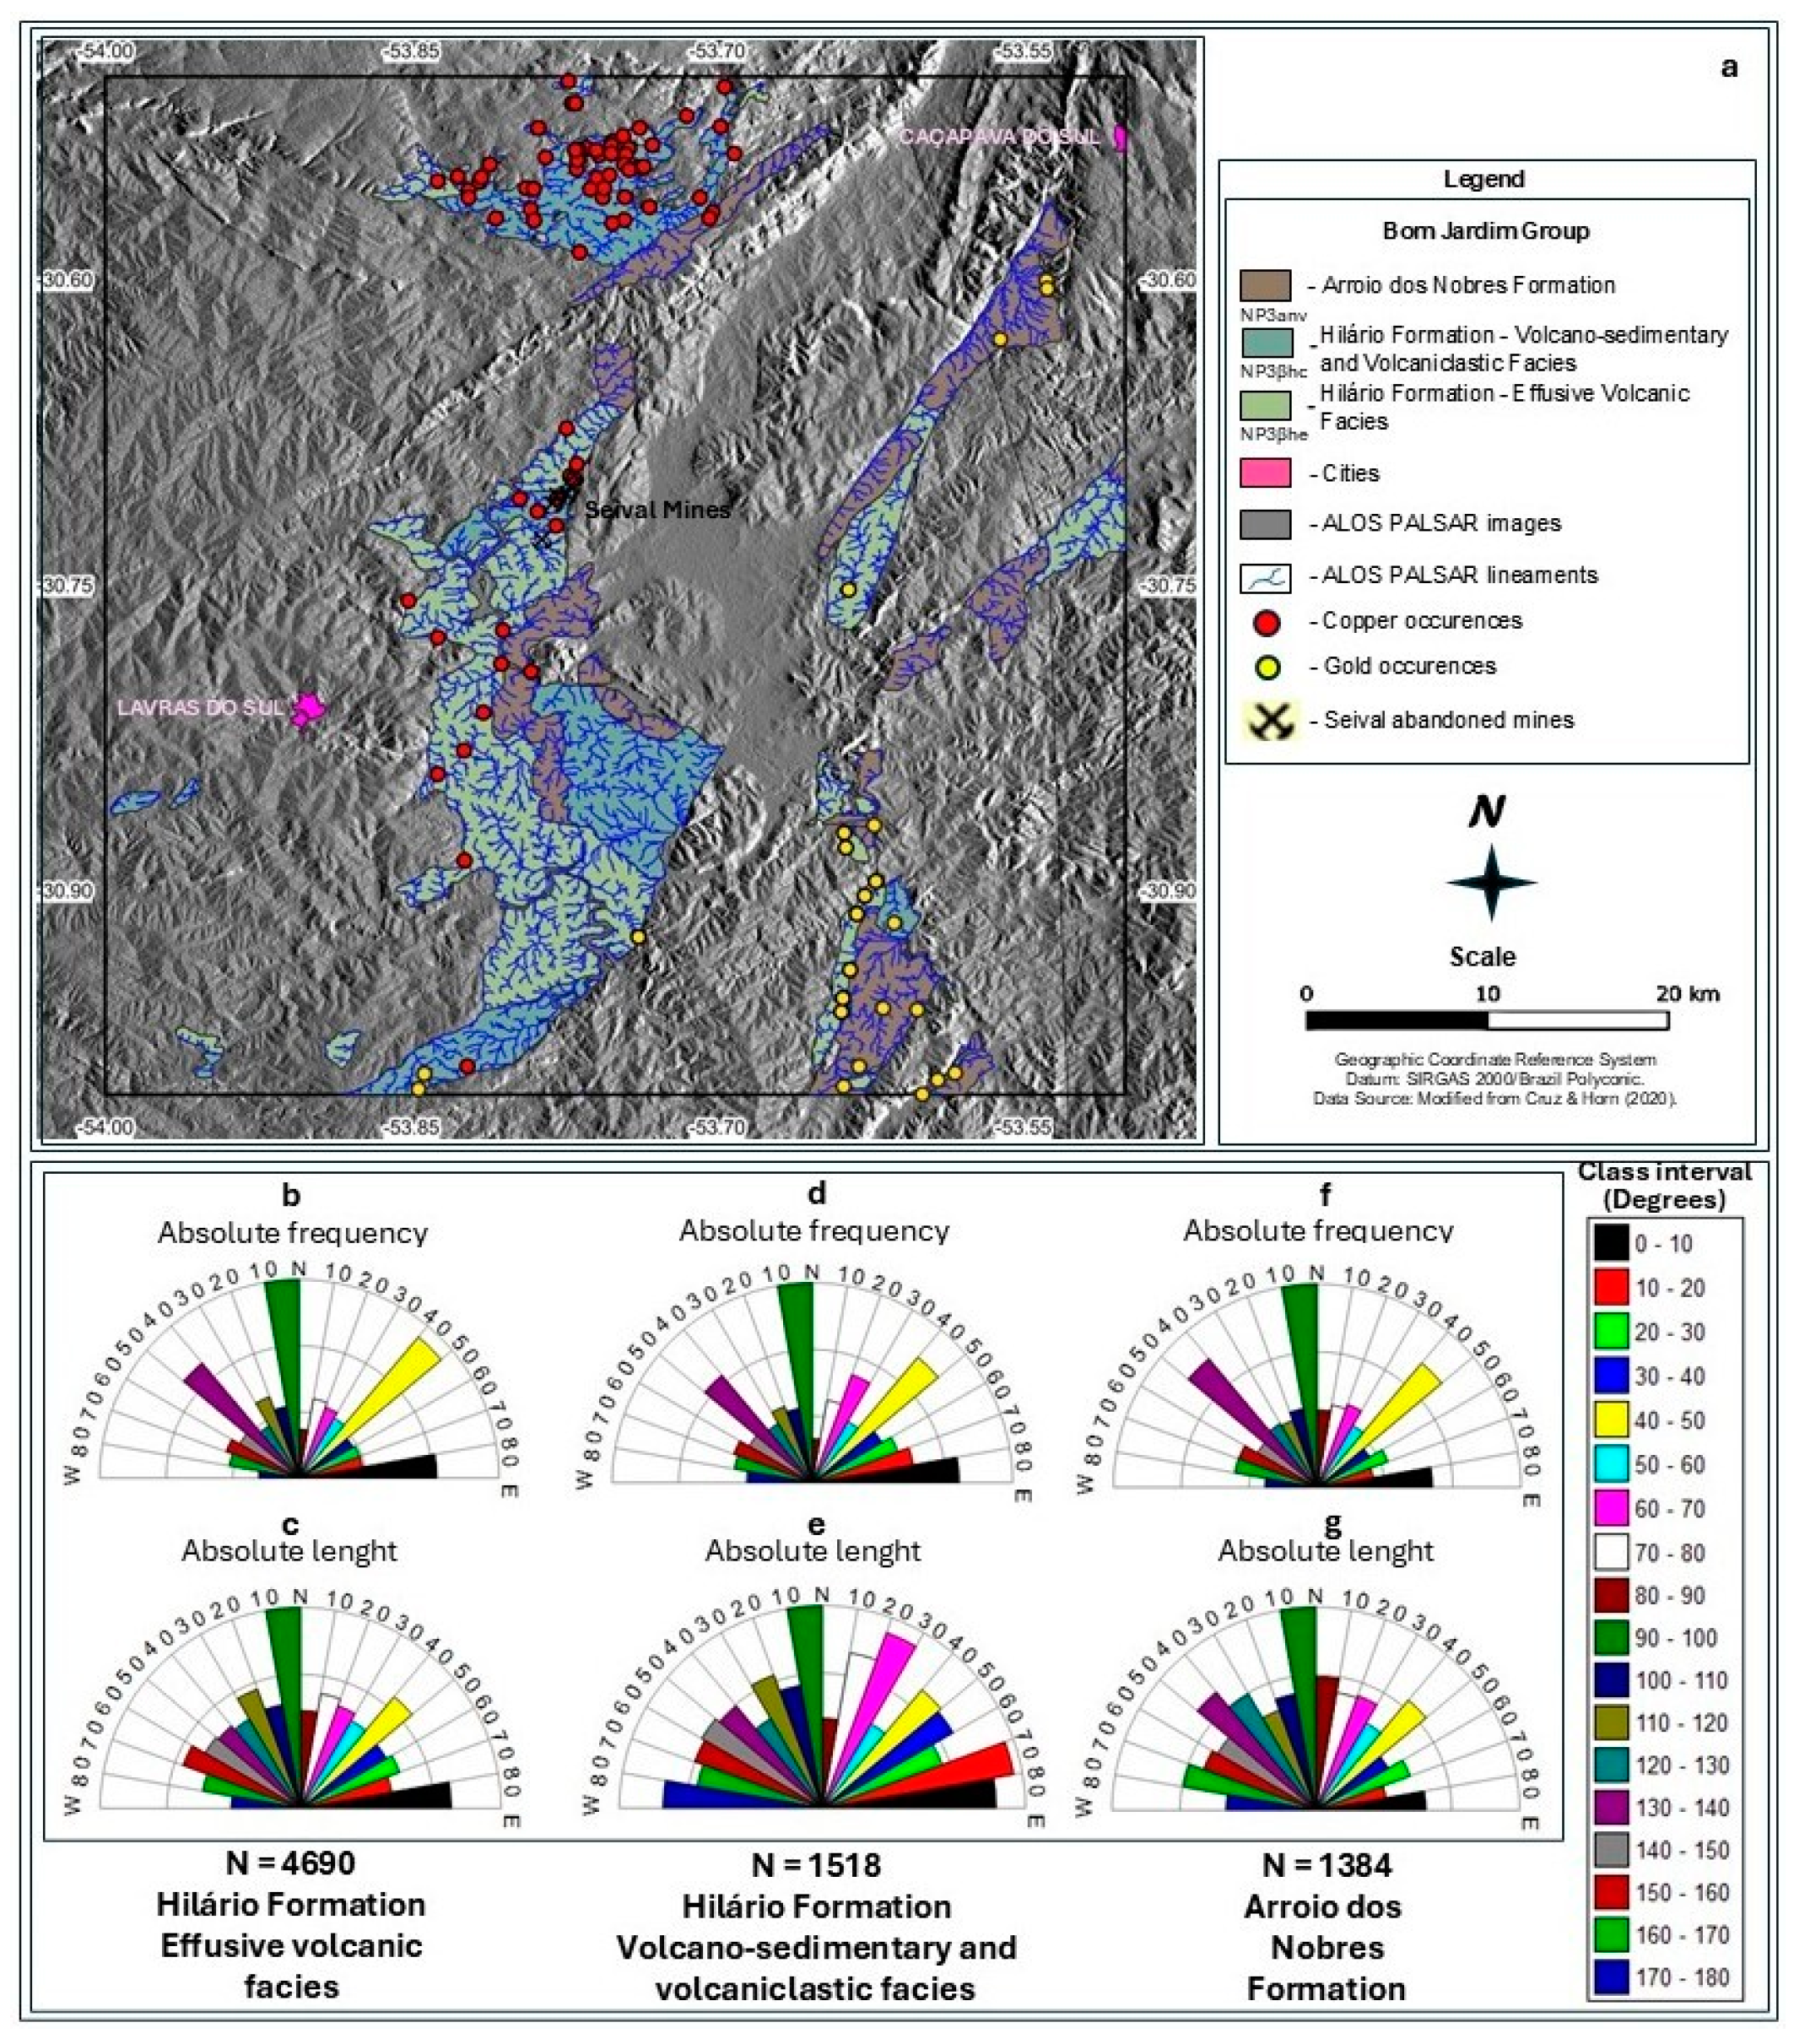
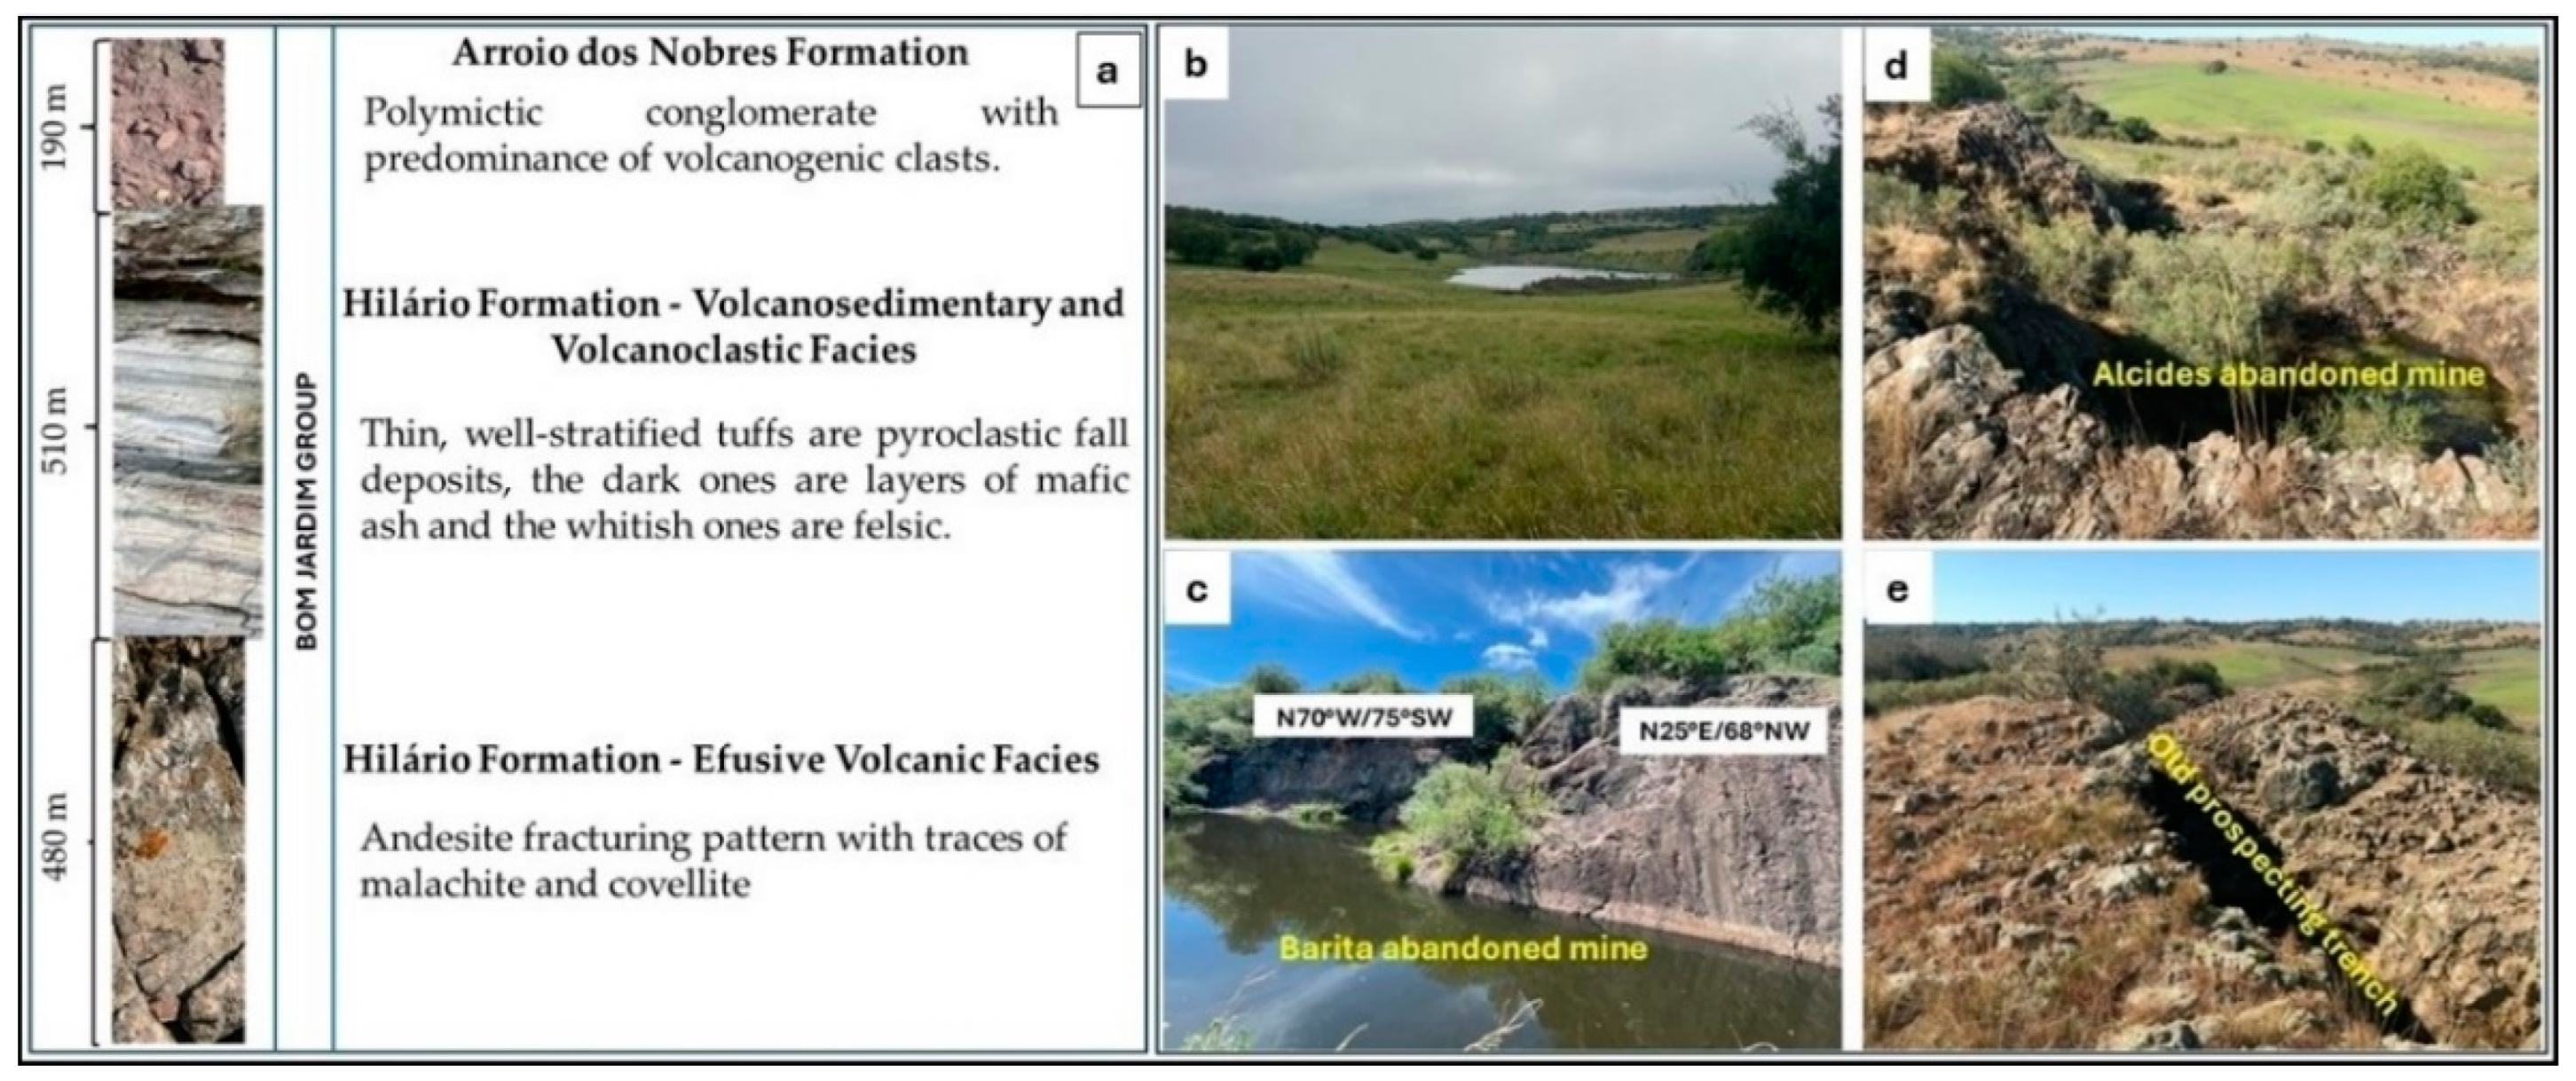
2. Study Area and Geological Context

The study area is in the Seival mines region, encompassing the municipalities of Lavras do Sul, Caçapava do Sul, São Sepé, and Bagé, within the Camaquã Basin in the State of Rio Grande do Sul, Brazil (Figure 1).
The study region was selected based on the presence of former mines with occurrences of Cu-Zn-Au-Ag sulfides and a history of mineral research and exploration, though currently abandoned.
This study focuses on the Hilário Formation, characterized by effusive volcanic facies, volcaniclastic, and volcano-sedimentary facies, as well as the Arroio dos Nobres Formation, both of which belong to the Bom Jardim Group (Neoproterozoic) and are in the central-southwest region of Rio Grande do Sul state.
The geological interest in the study area arises from its dynamic and complex tectonic context, copper and gold mineralization occurrences, its evolutionary history, and the intercalated and interacting processes of volcanogenic activity and sedimentary rock formation over time (Figure 2). The surrounding area exhibits predominant stratigraphy composed of rocks from the Precambrian (Paleoproterozoic to Neoproterozoic), Paleozoic, and Cenozoic eras.
The tectonic evolution of the study area was characterized by alternating periods of intense volcanic activity, low-energy sedimentation, and mineralization, suggesting a tectonically active environment influenced by volcanic island arcs [17]. These interactions resulted in a geologically diverse and complex landscape, reflecting the evolutionary history of the Hilário Formation (with its facies) and the Arroio dos Nobres Formation of the Bom Jardim Group. Hydrothermal fluids carry economically significant minerals through faults, fractures, and shear zones, depositing them within interior structures as veins.
Subsequent pluvial, fluvial, and aeolian erosional processes lowered the topography, eroding previously elevated areas and depositing economically significant minerals along drainage systems.
This combination of volcanic, sedimentary, and erosional processes contributed to forming a geological record that documents both tectonic and volcanic activities and the evolution of the depositional environments in the region [18].
The deposits in the region are structurally associated with shear zones, joints, tensile fracture systems, and step-fault systems characterized by predominantly counterclockwise movements [1].
The initial mining activities in Lavras do Sul date back to the 18th century, specifically in 1796, for gold exploration, while in Caçapava do Sul, they occurred during the 19th century (1870–1887). During this period, English miners from “The Rio Grande do Sul Gold Mining Limited” began developing galleries to extract copper and gold at the Camaquã Mines [19].
Operations continued in areas with high mineralization grades but were abandoned when grades declined or international market prices fell significantly [20]. Mining primarily targeted areas with evident mineral accumulations in outcropping deposits extending to shallow depths.
A key aspect is the structural control of the deposits, which occur as veins or lodes infilling fault and fracture systems with variable thickness and continuity. Although these deposits exhibit high grades, their low tonnage and limited along-strike extension (5–20 m thick and up to ~100 m in continuity) pose significant challenges for mineral exploration.
This complexity stems from the difficulty in accurately targeting these narrow, structurally controlled deposits using conventional exploration techniques, such as reverse circulation (RC) [21,22] or rotary drilling—methods historically employed by companies in the region and still common in analogous projects worldwide [23]. Studies by [21,22,23] demonstrate that mineralized veins in fault zones often exhibit irregular geometries and may be under-sampled by wide-spaced drilling. Cases such as the Witwatersrand Basin (South Africa) and Carlin Trend (USA) illustrate how conventional methods can fail to detect high-grade zones without integrated approaches combining structural modeling, high-resolution geophysics, and oriented core drilling.

2.1. Metallogenesis

For the Camaquã Mines and surrounding regions, seven metallogenetic models have been proposed over time for copper, gold, lead, zinc, silver, and other elements (Table 1).
Laux et al. [17] categorize the principal metallic mineralization of the Sul-Rio-Grandense Shield (SRGS) based on their tectonic context. Most major mines and occurrences appear in three settings: (i) the metavolcano-sedimentary sequences of the São Gabriel Arc (Passinho magmatic arc); (ii) granites and volcanic rocks with a calc-alkaline to shoshonitic geochemical signature; and (iii) the sediments of the Camaquã Basin.
The first environment is associated with building a Tonian plutonic-volcanic arc of an active continental margin (Bossoroca Complex), particularly within intra-arc sequences. The second and third environments rely on: (i) the amalgamation of the Cryogenian to Cambrian São Gabriel Arc, as well as neighboring blocks such as the Taquarembó, Tijucas terrains, and the Torquato Severo Batholith; and (ii) the volcano-sedimentary sequence generated during this amalgamation, the Camaquã Basin, which contains a retro-arc basin sequence ranging from peripheral to intracontinental rift settings [35,36] (Figure 3).
The Seival mines exhibit significant copper and gold mineralization associated with andesitic and trachy-andesitic volcanic rocks of the Hilário Formation (Neoproterozoic), Camaquã Basin [39,40], corresponding to the effusive volcanic facies of the Hilário Formation presented by Cruz and Horn [1].
Copper mineralization is controlled by NE–SW and NW–SE fault systems, primarily of magmatic origin. The dikes show higher Cu, Zn, and Ni concentrations than pyroclastic and effusive rocks [30].
Mineral exploration studies in the Lavras do Sul region focus on N 40° E to E–W lineaments, which host numerous quartz veins associated with alteration halos in the host rocks, whether granitic or volcanic, containing sericite, chlorite, pyrite, chalcopyrite, gold, and copper ores associated with intense cataclasis and brecciation [41,42,43,44].
Deeper fractures, oriented NW–SE and NE–SW, host volcanic dikes and channel the fluids responsible for mineralization [45,46]. These brittle faults resulted from the reactivation of regional shear zones, forming a system of strike-slip faults that generated hydraulic breccias hosting mineralization due to hydrothermal activity concurrent with volcanism. This phenomenon was particularly intense in the Seival mines, producing hydraulic breccias and mineralization associated with these lineaments [46,47].
The principal synthesis of available information on mineralization in the Escudo Sul-Rio-Grandense (ESRG) are by Leinz and Barbosa [48], Goñi [43], Ribeiro [49,50], Teixeira and Gonzalez [33], Badi and Gonzalez [51], Santos et al. [52], Ramgrab et al. [53], Dardenne and Schobbenhaus [54], and Biondi [55].
Analysis of hydrothermal alteration minerals revealed the presence of sericite, kaolinite, chlorite, limonite, and pyrite. Additionally, altered zones extending from the veins into the host rocks, characterized by chlorite, illite, calcite, albite, quartz, and pyrite, were classified as a propylitic zone by Beckel [7], suggesting an epithermal genetic model for the formation of these deposits.
The region underwent intense hydrothermal alteration, leading to the formation of disseminated minerals beyond the quartz veins, such as chlorite, smectite and corrensite, calcite, barite, malachite, azurite, and chrysocolla [39,40].
Alteration minerals include chlorite and albite, which are associated with pyrite and chalcopyrite. In contrast, mixed-layer chlorite/smectite and barite or hematite are linked to bornite, chalcocite, and covellite, or the copper concentration process [40].
According to Reischl [56] and Lopes et al. [40], the relationships between lithology and the distribution of hydrothermal alterations in these fault zones suggest a vertical recharge process.
Philipp et al. [57] highlight the role of NE–SW oriented shear zones crossing the Camaquã Basin, which likely influenced the concentration of mineralization in the area, where NW–SE and NE–SW trending faults served as the main conduits controlling hydrothermal flow, dike intrusion, and mineralization direction [45].
Currently, the most important mineralization in the ESRG is base metal sulfides (Cu, Pb, Zn) associated or not with precious metals (Au and Ag). In the Caçapava granite, copper, lead, and gold sulfide deposits hosted within this granite are controlled by N–S orientation [58].
The study area has recognized mineral and economic potential, with mining operations spanning centuries as a common scenario in mineral provinces of various countries. These areas are frequently re-evaluated using classical mineral exploration techniques (surface indicator-guided drilling) but are often abandoned due to lack of evidence or low grades.
Applying geophysical methods, such as induced polarization, electrical resistivity, and magnetic and electromagnetic surveys, can identify the tectonic-structural control of the study area at depth [59,60,61,62].

Seival Mines Region

The discovery of gold mineralization in southern Brazil also revealed the presence of copper in the region. Since 1901, various companies have described and exploited copper occurrences, with intermittent exploration periods until the 1960s. During this period, approximately 1000 tons of ore were produced monthly, with an average grade of 1.6% total copper (1.0% sulfide copper). The most extensive phase of copper exploitation at the Seival mines occurred in the 1930s, facilitated by easier access than other deposits [56].
The Barita mine, operated between 1942 and 1964, had an estimated production of approximately 64,000 tons, with 1.71% copper and 70 ppm silver [56]. In 1977, the company CBC “Companhia Brasileira do Cobre” conducted new research in the region. Reischl [56] classified the mineralization and identified several mines in the area, such as Barita, João Dahne, Morcego, Meio, Cruzeta, Alcides, Lagoa do Jacaré, and Vila Torrão. On a smaller scale, these mines bring sulfate extraction used in agricultural soil correction. These areas host various sulfide mineralizations characterized by mineral assemblages, such as chlorite and sericite, at the surface and sulfides, along with oxides at depth.
In the Seival mines, the circulation of hydrothermal fluids generated copper anomalies associated with N 40–60° E/70 – 88°NW directions, linked to calcite veins [40,45,46,47,63]. Reischl [56] and Lopes [63] focused on structural geology and geochemistry to characterize the metallogeny of the abandoned Seival mines (Figure 4).
The mineral assemblage of the Seival mines, observed in the field, has been extensively described in the literature [40,45,46,47,56,63]. The parageneses inferred from this assemblage depend on pressure, temperature, fluid chemistry, and oxidation conditions. This mineralogy corresponds to a hydrothermal environment with supergene alteration, where the primary hydrothermal paragenesis consists of high-temperature and pressure minerals formed in a reducing environment. These include pyrite (FeS2) (high temperature), galena (PbS), sphalerite (ZnS) (high to medium temperatures), quartz (SiO2) in veins as one of the gangue minerals co-precipitated with primary sulfides, and calcite (CaCO3), which may be of primary or secondary origin depending on the carbonation conditions [64,65].
Secondary minerals are medium-temperature phases formed in transitional environments from reducing to oxidizing. These include chalcopyrite (CuFeS2), crystallized after pyrite and other primary sulfides and acting as a precursor to secondary minerals, and bornite (Cu5FeS4), a medium-temperature mineral that may originate from the alteration of chalcopyrite or direct precipitation.
Other secondary minerals result from low-temperature supergene alteration in typically oxidizing environments, forming chalcocite (Cu2S) through substitution of bornite or chalcopyrite under low-oxygen enrichment conditions and covellite (CuS), generally associated with residual primary sulfides during supergene processes.
Various deposits feature supergene oxidation minerals with a significant presence of carbon dioxide (CO2) and water (H2O). These include malachite (Cu2CO3(OH)2), formed by oxidation in the presence of carbonates and bicarbonate-rich waters; azurite (Cu3(CO3)2(OH)2); and chrysocolla (Cu2H2Si2O5(OH)4·nH2O), originating under similar conditions to malachite but with variations in pH, CO2, and H2O concentrations [66].
Finally, late-stage gangue minerals are represented by hematite (Fe2O3), formed through pyrite substitution or direct oxidation in late system stages, and barite (BaSO4), precipitated under low-temperature and sulfate-rich conditions [66].
Malachite, azurite, and chrysocolla within the Bom Jardim Group represent the oxidation zone in surface deposits, while calcite and barite precipitate as gangue minerals (Figure 5).
The Seival mines have once again attracted the interest of national and multinational companies, although investments have been limited, and only a few studies have been conducted. Nevertheless, these deposits have significant potential for future exploration [64].

3. Materials and Methods

The methodology applied in this study integrates remote sensing, geographic information systems (GISs) for extracting drainage networks, and tectonic lineaments from radar images. This is coupled with field geology to identify mineralization and structural data from the Bom Jardim Group on the geological map of Lavras do Sul.
This study employs QGIS, SPRING, and ORIENT software for image processing and geospatial analysis. The methodological workflow encompasses five main steps: (i) data preparation, (ii) preprocessing, (iii) tectonic lineament extraction, (iv) orientation analysis, and (v) visualization and documentation of results (Figure 6).
This study combines remote sensing, GIS, and field geology to identify and analyze gold and copper mineral occurrences along the drainage network’s tectonic lineaments and preferential orientations. SAR radar images from the ALOS PALSAR sensor (Table 2) were processed using QGIS 3.38.1 (Grenoble) (QGIS Development Team [67]), SPRING 5.5.6 (Camara et al. [68]), and Orient 3.20.0 (Vollmer [69]). Georeferencing of the data, performed in the SIRGAS 2000 datum, ensured spatial overlay of the layers.
Image preprocessing included geometric and radiometric corrections as well as noise filtering. Lineament and drainage network data were segmented according to the lithostratigraphic units of the Bom Jardim Group, enabling the conversion of the identified lineaments into vector layers.
Lineament extraction was automated using edge-detection algorithms, particularly the Sobel filter. The Catalyst Professional Complete software, version 2023, Ontario, Canada (Line module) was used to extract lineaments from the Hilário Formation (with its facies) and Arroio dos Nobres Formation of the Bom Jardim Group [71].
Orientation analysis involved generating rose diagrams in QGIS, SPRING, and Orient software, showing the directional distribution of lineaments and drainages. Validation was performed by comparing the results with geological field data and drainage network patterns.
The final documentation included creating geological maps with lineaments and rose diagrams, highlighting their relationship to local geology. This methodology effectively identified tectonic patterns, offering a replicable approach for future studies.
Automatic lineament extraction results in many identified features, as it relies on predefined parameters, unlike manual extraction, which depends on interpretation and visual field inspection.
Rose diagrams represent the preferential directions of structural lineaments measured in two geological formations: Hilário (with its two facies) and Arroio dos Nobres. After consistency checks, the dispersion in tectonic data was significantly reduced across all diagrams, suggesting that the consistency process effectively corrected these variations and revealed dominant structural directions.
The efficiency of the extracted lineament analysis lies in its ability to conduct rapid and precise evaluations, store results quantitatively, and generate a GIS-based database. This approach distinguishes drainages embedded in tectonic lineaments from overlying drainages [72].

4. Results and Discussion

4.1. Lineaments and Mineralization

The in situ (rocks) and ex situ (alluvial sediments) mineralization data suggest that the analyzed formations exhibit lineament patterns reflecting the region’s tectonic history. Analysis of lineament lengths and their relative frequencies provides detailed insights into fracture distribution, allowing inferences about the tectonic evolution of the Hilário Formation (with its facies) and the Arroio dos Nobres Formation of the Bom Jardim Group (Neoproterozoic).
Figure 7 shows the extracted and validated lineaments for each Bom Jardim Group lithostratigraphic unit based on ALOS PALSAR sensor imagery.

4.2. ALOS-PALSAR Lineaments Analysis

4.2.1. Hilário Formation—Effusive Volcanic Facies (HFmevF)

The geological map with tectonic lineaments (Figure 7a) and the rose diagrams of the Bom Jardim Group show the absolute frequency and length distributions, highlighting peaks in the most frequent directions and azimuths. These suggest multiple tectonic orientations with up to 70° of spread (Figure 7b), revealing the dispersal of the longest lineaments (Figure 7c).
The findings indicate a complex tectonic history with phases of compression and extension, resulting in varied lineament orientations. Lineament frequency directions align with the most extended linear segments, suggesting coherent tectonics in the region driven by significant geodynamic forces.

4.2.2. Hilário Formation—Volcaniclastic and Volcano-Sedimentary Facies (HFmvvF)

The geological map (Figure 7a) and rose diagrams show absolute frequency and length distributions, revealing peaks in frequent azimuths with a narrower spread of up to 30° (Figure 7d). These diagrams suggest trends in tectonic directions for the longest lineaments (Figure 7e). This unit shows less tectonic dispersion. The primary lineament orientations, N 10°–20° W and N 00°–10° W, match the most extended linear segments.

4.2.3. Arroio dos Nobres Formation (ANFm)

The geological map (Figure 7a) and rose diagrams exhibit the absolute frequency and length distributions, highlighting dominant lineament orientations with up to 40° of spread (Figure 7f). This aligns with predominant tectonic directions (Figure 7g, Table 3).
These results reinforce the structural consistency within the Arroio dos Nobres Formation, reflecting dominant tectonic processes in the Bom Jardim Group. The detailed rose diagrams and their relation to tectonic orientations underline the complexity and coherence of the structural framework in these formations. The geological mapping and lineament analysis significantly contribute to understanding the region’s tectonic evolution.
The results suggest a tectonic history characterized by the reactivation of faults and fractures driven by tectonic stresses. Among the three main orientations, one aligns with the most extended linear segments, indicating significant geodynamic influence.
Table 3 provides tectonic data to understand the geological structure of the Bom Jardim Group. The geological units of HFmevF and HFmvvF exhibit tectonic features with a similar orientation (N 00°–10° W), reinforcing a common genesis with an N–S direction. The ANFm unit presents a distinct tectonic orientation of N 50°–60° E, reflecting an NE–SW tectonic stress direction and ENE–WSW.
The HFmevF has an absolute length ranging from 49.3 km to 51.2 km, a standard deviation of 0.4 to 0.5 km, and a lineament density of 596 km/km2, indicating moderately intense tectonism. The HFmvvF shows an absolute length ranging from 39.4 km to 61.2 km, a standard deviation of 0.3 to 1.0 km, and a lineament density of 382 km/km2, suggesting low to moderate tectonic expression.
In terms of length, the ANFm has an absolute length ranging from 38.8 km to 50.0 km, a standard deviation of 0.4 to 0.5 km, and a lineament density of 9299 km/km2, reflecting a period of major tectonic expression.
This variability may result from the reactivation of ancient shear zones, faults, or fractures, as well as new tectonic orientations in an NE–SW direction. The NE–SW tectonic orientation aligns with shear zones intersecting the Camaquã Basin, which concentrates hydrothermal mineralization [45,57].
From a geological perspective, the predominant orientation in each lithostratigraphic unit suggests specific tectonic stresses that acted in the region. Variations in absolute frequency and length reflect different degrees of tectonic deformation.
As the statistical data suggest, the Bom Jardim Group shows a complex geological structure with similar facies but distinct tectonic characteristics between the Hilário and Arroio dos Nobres formations. The data indicate a tectonic history marked by distinct phases of deformation and tectonic stresses.

4.3. Drainage Network Orientations

The drainage network map of the Bom Jardim Group was segmented by lithostratigraphic units, resulting in 7592 drainages. Among these, 4690 are associated with HFmevF, 1518 with HFmvvF, and 1384 with ANFm (Figure 8).

4.3.1. Hilário Formation—Effusive Volcanic Facies (HFmevF)

The geological map with the drainage network (Figure 8a) and the rose diagrams of the Bom Jardim Group show the distribution of absolute frequency and absolute length, with peaks among the most frequent strikes and azimuths. These suggest a significant dispersion of up to 80° in amplitude (Figure 8b) and indicate multiple tectonic directions with amplitudes of up to 60° (Figure 8c).
These results suggest an evolutionary history of the drainage network, resulting in dispersed orientations. One of the three main orientations of lineament frequency, with an N 00°–10° W direction, coincides with the longest linear lengths, corroborating the lineaments obtained from the SAR image.

4.3.2. Hilário Formation—Volcanoclastic and Volcano-Sedimentary Facies (HFmvvF)

The geological map with the drainage network (Figure 8a) of the Bom Jardim Group and their rose diagrams show the distribution of absolute frequency and absolute length, with peaks among the most frequent strikes and azimuths. These indicate trends in drainage orientations (Figure 8d) and suggest the most prominent drainage orientations of this facies (Figure 8e). The main drainage frequency orientations coincide with the longest linear lengths in the N 00°–10° W direction.

4.3.3. Arroio Dos Nobres Formation (ANFm)

The geological map with the drainage network (Figure 8a) and the rose diagrams of the Bom Jardim Group show the distribution of absolute frequency and absolute length, with peaks among the most frequent strikes and azimuths. These indicate the predominant drainage orientations (Figure 8f) and suggest orthogonal drainage orientations (Figure 8g) (Table 4).
These results suggest a tectonic history of the structuring of the drainage system, embedded in faults and fractures, with main directions of N 00°–10° W, N 40°–50° E, and N 40°–50° W.
The rose diagrams for the drainages reinforce the interpretation that fracturing patterns in this region resulted from regional tectonic events with clear preferential directions, while also highlighting the tectonic complexity of the HFmevF. The detailed analysis of these directions and lengths significantly contributes to understanding the regional tectonic evolution and the lithological and structural differences between the studied units.
The control of the superimposed drainage pattern is related to non-tectonic factors, such as topography and surface lithology. For example, HFmvvF and ANFm, with volcano-sedimentary and sedimentary origins, respectively, are more susceptible to erosive processes than igneous rocks of HFmevF.
The drainage network of the Bom Jardim Group study area exhibits both antecedent (older) and superimposed (younger) drainage patterns, displaying dendritic, subparallel, and rectangular types structurally controlled by lineaments. These patterns develop where fractures and faults directly guide surface water flow, as evidenced by the predominant watercourse orientations aligning with the region’s main fault and fracture directions. This strong correlation between drainage geometry and structural features demonstrates how local tectonics significantly influenced the organization and evolution of the hydrological network.
The drainage analysis revealed a positive correlation with mapped structural lineaments, particularly in the N 00°–10° W and N 40°–50° E directions, which are often embedded and associated with major faults and fracture zones in the study area.
A comparison between the SAR data lineaments and the drainage network shows that each technique uniquely contributes to structural understanding aimed at mineral exploration in this region. SAR image lineaments are more effective in identifying large-scale structures because they penetrate surface cover and reveal linear features even in densely vegetated environments.
These drainage patterns contribute to understanding the area’s geomorphological evolution and provide insights into the distribution of water resources and the potential for erosion and sedimentation in the different lithostratigraphic units.
The comparison of tectonic lineament directions and the orientation of the drainage network, in terms of higher length for the lithostratigraphic units of the Bom Jardim Group, suggest that the HFmevF has main directions at N 00°–10° W and N 80°–90° E, the HFmvvF has main directions at N 00°–10° E and N 70°–80° E, and the ANFm has main directions at N 00°–10° W and N 40°–50° W.
The lineaments in these directions coincide with the local drainage, showing structural embedding. In the rose diagram analysis, the HFmevF shows superimposed drainages in N 50°–90° E and N 50°–90° W directions, the HFmvvF shows superimposed drainages in N 70°–90° E and N 60°–90° W directions, and ANFm shows superimposed drainages in N 60°–90° E and N 50°–90° W directions. Other directions not mentioned are partially controlled by these structural orientations.
The integration and overlay of the digital elevation model with the drainage network from the geological map of Lavras do Sul, SAR image lineaments, and gold and copper mineral occurrences are essential for supporting mineral exploration in the study area.
The study area of the Bom Jardim Group covers a total area of 1.742 km2, distributed across three main geological formations: HFmevF, occupying 0.780 km2; HFmvvF, covering 0.917 km2 out of a total area of 1.697 km2; and ANFm, with 0.045 km2 (Figure 9).
The relief of the entire digital elevation model of the study area has an amplitude of 350 m, ranging from 104 m to 454 m.
The HFmevF has an amplitude of 269 m, with altitudes between 158 m and 427 m, the HFmvvF has an amplitude of 278 m, ranging from 150 m to 428 m, and the ANFm has the largest amplitude in the Bom Jardim Group at 306 m, with altitudes ranging from 148 m to 454 m.
The geomorphology of the study area belongs to the Geomorphological Province of the Crystalline Shield, also known as the Uruguayan-Southern-Rio-Grandense Shield, within the Morphological Province of the Crystalline Rock Shield. It is characterized by the Morpho-Structural Domains of Basins, such as the Camaquã Basin, which overlays the Basement of Complex Styles, part of the Geomorphological Region of the Southern-Rio-Grandense Plateau and the Canguçu-Caçapava Residual Plateau Geomorphological Unit [73].
The study area features faulted and jointed tectonic relief with wavy highland relief energy. The lithologies in the area include andesites, trachyandesites, pyroclastics, volcano-sedimentary, and sedimentary rocks. Morphography features consist of denudational hills characteristic of the Pampas region. The slopes are classified as almost flat to gently sloping, ranging from 2.6% to 14.9%, and gently sloping between 15% and 16.1%, with shallow soils less than 0.5 m thick.
Figure 10 shows the thickness of the lithostratigraphic units of the Bom Jardim Group, approximately 1200 m, the local relief, and the abandoned Barita and Alcides mines.
The most occurrences of alluvial gold in the Bom Jardim Group are in the ANFm, with 11 occurrences, followed by the HFmevF with 10, and the HFmvvF with 3. For copper, the highest occurrence is in the HFmvvF, with 63 locations, followed by the HFmevF and ANFm, each with 10 locations.
In this region, several geological faults have been identified, including the Pedregal Fault in the ENE–WSW direction, the Cabritos Fault and Perau Fault in the NE–SW direction, and the Segredo Fault in the NNE–SSW direction.
All these faults are classified as sinistral transtensional. The Perau Fault forms a lithological contact between the Hilário and Arroio dos Nobres formations. The Segredo Fault is the largest in the study area. At the same time, the Palmas-Jacques Fault, with a WNW–ESE direction, is a sinistral shear fault that cuts through the Hilário and Arroio dos Nobres formations, considered younger than the others.
In the geological map of Lavras do Sul, 14 sinistral shear zones were identified with directions of NE–SW, NW–SE, and N–S. Additionally, the largest geophysical lineaments in the region exhibit a predominant NW–SE direction, contributing to the geological complexity of the Bom Jardim Group.
The structural lineament analysis of the Hilário and Arroio dos Nobres formations reveals a tectonic history marked by multiple deformation phases that influenced the orientation and length of the lineaments. Lineaments in the N 50°–60° E and N 40°–50° E directions suggest the influence of oblique compression regimes, while the presence of long lineaments in less frequent directions indicates possible reactivation of older structures [40,41,42,44,57]. These structures are responsible for cataclasis, tectonic brecciation, and hydrothermal fluid flow.
Faults with a WNW–ESE orientation observed in both formations are associated with the Northwest Fault System, initially described by [74,75]. This system plays a central role in the tectonic compartmentalization of the region, driving important strike-slip events during the Neoproterozoic. Moreover, these faults significantly control volcanic intrusions and the development of the effusive, pyroclastic, and volcano-sedimentary facies of the Hilário Formation [76].
Transcurrent movements with NE–SW, NNE–SSW, and WNW–ESE orientations observed in many mapped lineaments are consistent with sinistral transcurrent kinematics [56,77,78,79]. Faults with NE–SW to NNE–SSW directions and transtensional movement are interpreted as the reactivation of inherited structures from the Dom Feliciano Belt, whose foliations were recurrently influenced by transcurrent tectonics during the evolution of the Camaquã Basin [34,57,80].
Lineaments derived from SAR image data exhibited a broader directional distribution, with prominent orientations of N 30°–40° E, N 50°–60° E, and N 40°–50° E. These presented the longer absolute lengths and frequencies, indicating zones of higher tectonic intensity. Such lineaments are structurally significant, suggesting areas with greater potential for hydrothermal fluid concentration critical for forming gold and copper deposits [4].
The drainage network showed a significant correlation with geological lineaments, particularly in directions N 00°–10° W, N 40°–50° E, and N 50°–60° E. This evidence indicates that zones of tectonic weakness control the region’s drainage, influencing the location of source areas for alluvial mineral deposits, as discussed by Groves et al. [20].
Drainages aligned with structural lineaments may indicate shear zones and faults, often associated with gold and sulfide mineralization, as observed in other gold deposits [81].
Figure 11 shows for the Bom Jardim Group, the density of tectonic lineaments, and drainage density (Figure 11).
These lineament densities suggest intense tectonic deformation in the region, facilitating the ascent and percolation of mineralizing fluids and the formation of gold and copper deposits.
Previous studies, such as Hitzman et al. [82], emphasize the importance of shear zones and faults as primary controllers of gold and copper mineralization, reinforcing the significance of the geological lineaments observed in this research.
Figure 12 presents rose diagrams for alluvial gold, copper, and gold in the Bom Jardim Group.
The preferred orientations of the tectonic lineaments associated with alluvial gold occurrences predominantly follow the N–S, N 27° W, and N 77° W directions. For copper and disseminated gold in the Bom Jardim Group, the predominant directions are E–W, N–S, N 63° W, N 35° E, N 45° E, and N 59° E, indicating priority zones for mineral prospecting, partially corroborating [43].
The rose diagrams of the drainage systems provide a detailed perspective on structural orientations and highlight promising areas for mineral prospecting, particularly for gold in sediments and copper and gold in the lithologies of the Bom Jardim Group.
The rose diagrams reveal a predominance of N 59° E/73° NW directions, which coincide with the orientation of known mines in the region, such as Barita, João Dahne, and Morcego, as well as parallel alignments like do Meio, Cruzeta, and Alcides.
The HFmevF and HFmvvF indicate a more complex and diverse tectonic regime, while the ANFm presents a more concentrated tectonic pattern [83].
The statistical parameters derived from the lineament data of SAR images of the Bom Jardim Group exposed on the geological map of Lavras do Sul, the drainage network, and field data revealed differences in predominant orientations, absolute frequencies, and absolute lengths of the lineaments, providing valuable information for mineral prospecting in the region.

5. Conclusions

The study of the Bom Jardim Group in the Camaquã Basin provided an important understanding into the region’s tectonic complexity by integrating various techniques, including SAR image analysis, drainage network studies, geological field mapping, and geoprocessing techniques.
The consistency of lineaments extracted from SAR images reduced dispersion, indicating that the geological and tectonic data are more robust and reliable. This correction is essential for more accurate geological interpretations.
The rose diagram analysis of the lithostratigraphic units HFmevF, HFmvvF, and ANFm offers valuable contributions to the regional tectonic history. These results emphasize the importance of detailed lineament analyses to understand the geological evolution of a region.
The applied methodology effectively identified tectonic lineaments and integrated these data with gold occurrences in the drainage network and the local geology, providing a valuable tool for mineral prospecting.
The HFmvvF and ANFm lithostratigraphic units exhibit distinct directions for tectonic lineaments and drainage networks. The HFmevF unit shows lineament directions like the drainage network in one of the orientations, N 00°–10° W. This suggests that the HFmevF unit may have been influenced by tectonic processes that affected the drainage network formation. Other drainages are superimposed.
There is a predominance of alluvial gold occurrences in the HFmevF compared to ANFm and HFmvvF, while copper occurrences are most prominent in the HFmvvF, followed by HFmevF and ANFm.
The tectonic lineaments of the Hilário Formation (with its facies) and the Arroio dos Nobres Formation exhibit orientations that interact differently with the drainage network.
The HFmevF and HFmvvF units presented significant lineaments in absolute length at the N 30°–40° E, N 40°–50° E, and N 00°–10° W directions, while ANFm exhibited lineaments in the N 50°–60° E, N 80°–90° E, and N 70°–80° E directions. These principal directions were identified in SAR image data and the drainage network. This technique is an important guide for alluvial gold prospecting in the region.
Indicators of priority zones for alluvial gold prospecting include tectonic alignments in the N–S, N 27° W, and N 77° W directions. For copper and disseminated gold in the Bom Jardim Group, priority directions are E–W, N–S, N 63° W, N 35° E, N 45° E, and N 59° E.
Mineral occurrences of gold in drainages with E–W, N 45° W, and N 58° W directions do not align with tectonic lineaments. They are, therefore, derived from ancient, elevated areas that were eroded and deposited their mineralization in these channels.
The N–S, N 05° W, N 62° E, and N 23° E directions are associated with incised drainages, indicating tectonic control for valleys and watercourses.
Regarding effective measures, the lineaments derived from SAR image data and their correlation with the drainage network proved particularly useful. They offer an integrated view of tectonic structures and surface conditions, critical for locating mineral deposits. Additionally, the overlay of results obtained in the region’s geological formations provides a solid foundation for defining prospecting targets.
The detailed study of lineaments contributes to future exploration activities in the Seival region and surrounding areas of Lavras do Sul and Caçapava do Sul in the state of Rio Grande do Sul, Brazil.
Further studies could benefit from this detailed analysis of structures and from planning geophysical surveys to understand better the tectonic processes that facilitated the ascent of mineralizing hydrothermal fluids.

Author Contributions

Conceptualization, M.A.F.H. and C.A.M.; methodology, M.A.F.H.; software, M.A.F.H.; funding Acquisition, C.A.M.; investigation, M.A.F.H., C.A.M., H.M., J.P.R.L., L.L.A., L.M.I., S.K. and A.F.d.S.A.; writing-original draft preparation, M.A.F.H.; writing-review and editing, M.A.F.H., C.A.M., H.M., J.P.R.L., L.L.A., L.M.I., S.K. and A.F.d.S.A.; supervision, C.A.M. and M.A.F.H.; project administration, M.A.F.H., C.A.M. and H.M. All authors have read and agreed to the published version of the manuscript.

Funding

This research was funded by FAPESP-Fundação de Amparo à Pesquisa do Estado de São Paulo (Process n. 2023/04732-8).

Data Availability Statement

Data are contained within the article.

Acknowledgments

The authors are especially grateful to the Fundação de Amparo à Pesquisa do Estado de São Paulo—FAPESP for funding the field trip of the Project. We also would like to thank the Universidade Federal do Pampa, Campus de Caçapava do Sul—UNIPAMPA.

Conflicts of Interest

The authors declare no conflicts of interest.

References

  1. Cruz, R.F.; Horn, B.L.D. Projeto Escudo Sul-Rio-Grandense, Carta Geológica Lavras do Sul SHI.22-Y-A-IV 2020. Available online: https://rigeo.sgb.gov.br/jspui/handle/doc/18740 (accessed on 15 January 2022).
  2. Hajaj, S.; El Harti, A.; Pour, A.B.; Jellouli, A.; Adiri, Z.; Hashim, M. A Review on Hyperspectral Imagery Application for Lithological Mapping and Mineral Prospecting: Machine Learning Techniques and Future Prospects. Remote Sens. Appl. Soc. Environ. 2024, 35, 101218. [Google Scholar] [CrossRef]
  3. Jellouli, A.; El Harti, A.; Adiri, Z.; Chakouri, M.; El Hachimi, J.; Bachaoui, E.M. Application of Optical and Radar Satellite Images for Mapping Tectonic Lineaments in Kerdous Inlier of the Anti-Atlas Belt, Morocco. Remote Sens. Appl. Soc. Environ. 2021, 22, 100509. [Google Scholar] [CrossRef]
  4. Silva, W.G.; Borges, C.L.A.; Garcia, P.M.P.; Vasconcelos, B.R. Geologia e Mineralização dos Depósitos Auríferos Adão Roduí e Jonas Gimenez no Lineamento Cangas-Poconé, Faixa Paraguai, Centro-Sul do Estado de Mato Grosso/Geology and Mineralization of the Adão Roduí and Jonas Gimenez Gold Deposits at the Cangas-Poconé Lineament, Paraguay Belt, Center-South of the Mato Grosso State. Anuário Inst. Geociências 2020, 43, 97–110. [Google Scholar] [CrossRef]
  5. Bricalli, L.L.; Mello, C.L. Padrões de Lineamentos Relacionados à Litoestrutura e ao Fraturamento Neotectônico (Estado do Espírito Santo, SE do Brasil). Rev. Bras. Geomorfologia 2013, 14, 301–311. [Google Scholar]
  6. Demircioğlua, R.E.; Coskuner, Y.B. The Extraction and Structural Analysis of Lineaments Around Gülsehir (Nevşehir) Using GIS Methods. Geofísica Int. 2024, 63, 1175–1191. [Google Scholar] [CrossRef]
  7. Beckel, J. Metalogenia Del Cu, Pb y Zn Em La Modelos de Depósitos Brasileiros de Cobre Depósito de Cobre das Minas do Camaquã, Rio Grande do Sul Cuenca de Camaquã Durante El Ciclo Orogênico Brasiliano Rio Grande del Sur (Brasil). Ph.D. Thesis, Universidad de Salamanca, Espanha, Spain, 1990. [Google Scholar]
  8. Lima, L. de A Mina Uruguai e Jazida Santa Maria—Distrito de Camaquã (RS): Um Estudo Petrológico, Geoquímico e Geotermométrico. Master’s Thesis, UNISINOS, São Leopoldo, Brazil, 1998. [Google Scholar]
  9. Laux, J.H. Caracterização da Mineralização Cupro-Aurífera de uma Parte da Mina Uruguai, Caçapava Do Sul—RS. Master’s Thesis, UNISINOS, São Leopoldo, Brazil, 1999. [Google Scholar]
  10. Toniolo, J.A.; Gil, C.A.A.; Sander, A. CPRM. In Metalogenia das Bacias Neoproterozoico-Eopaleozóicas do Sul do Brasil: Bacia do Camaquã; Porto Alegre: Rio Grande do Sul, Brazil, 2007. [Google Scholar]
  11. Adiri, Z.; El Harti, A.; Jellouli, A.; Lhissou, R.; Maacha, L.; Azmi, M.; Zouhair, M.; Bachaoui, E.M. Comparison of Landsat-8, ASTER and Sentinel 1 Satellite Remote Sensing Data in Automatic Lineaments Extraction: A Case Study of Sidi Flah-Bouskour Inlier, Moroccan Anti Atlas. Adv. Space Res. 2017, 60, 2355–2367. [Google Scholar] [CrossRef]
  12. Oliveira, J.M.N.T.; Fernandes, L.A.D. Estágios Finais de Deformação do Cinturão Dom Feliciano: Tectônica e Sedimentação da Formação Arroio Dos Nobres. In Simpósio Nacional de Estudos Tectônicos; SBG: Recife, Brazil, 1991; Volume 3, pp. 58–59. [Google Scholar]
  13. Porcher, C.A.; Lopes, R.C. Programa Levantamentos Geológicos Básicos do Brasil. Cachoeira do Sul, Rio Grande do Sul, Brazil, Folha SH22-Y-A 2000. Available online: https://rigeo.sgb.gov.br/handle/doc/8476 (accessed on 22 February 2022).
  14. Riccomini, C.; Crósta, A.P. Análise preliminar de lineamentos em imagens de sensores remotos aplicada à prospecção mineral na area dos granitóides Mandira, SP. Bol. IG-USP. Série Científica 1988, 19, 23–37. [Google Scholar] [CrossRef]
  15. Ghosh, S.; Sivasankar, T.; Anand, G. Performance Evaluation of Multi-Parametric Synthetic Aperture Radar Data for Geological Lineament Extraction. Int. J. Remote Sens. 2021, 42, 2574–2593. [Google Scholar] [CrossRef]
  16. USGS (United State Geological Survey). Landsat 8 (7-5-2 Bands RGB) 2024. Available online: https://landsat.usgs.gov/Landsat8_Using_product.php/ (accessed on 12 January 2025).
  17. Laux, J.H.; Stropper, J.L.; Provenzano, C.A.S.; Horn, B.L.D.; Klein, C. Programa Novas Fronteiras Escudo Sul-Rio-Grandense Recursos Minerais Associação Tectônica Mapeamento Geológico Geologia Regional, Rio Grande do Sul, Brazil, Escala 1:500.000. 2021. Available online: https://rigeo.sgb.gov.br/jspui/handle/doc/20521 (accessed on 26 March 2022).
  18. Cas, R.A.F.; Wright, J.V. Volcanic Successions Modern and Ancient; Allen & Unwin: London, UK, 1987; ISBN 978-0-412-44640-5. [Google Scholar]
  19. Harres, M.M. Minas do Camaquã (Caçapava do Sul, RS): A Exploração do Cobre no Rio Grande do Sul. In Minas do Camaquã, um Estudo Multidisciplinar; Ronchi, L.H., Ed.; e Lobato, A.O.C.: São Leopoldo, Brazil, 2000; pp. 21–53. [Google Scholar]
  20. Groves, D.I.; Goldfarb, R.J.; Robert, F.; Hart, C.J.R. Gold Deposits in Metamorphic Belts: Overview of Current Understanding, Outstanding Problems, Future Research, and Exploration Significance. Econ. Geol. 2003, 98, 1–29. [Google Scholar] [CrossRef]
  21. Moon, C.J.; Whateley, M.K.G.; Evans, A.M. Introduction to Mineral Exploration (2nd Edition)|Request PDF, 2nd ed.; Blackwell Publishing: Oxford, UK, 2006. [Google Scholar]
  22. Marjoribanks, R. Geological Methods in Mineral Exploration and Mining, 2nd ed.; Springer: Berlin/Heidelberg, Germany, 2010. [Google Scholar]
  23. Pohl, W.L. Economic Geology: Principles and Practice; Wiley-Blackwell: Hoboken, NJ, USA, 2011. [Google Scholar]
  24. Leinz, V.; Almeida, S.C. de Gênese da Jazida de Cobre “Camaquam”, Município de Caçapava, Rio Grande Do Sul. Boletim 1941, 88, 58. [Google Scholar]
  25. Ribeiro, M.; Bocchi, P.R.; Figueiredo Filho, P.M.; Tessari, R.I. Geologia da Quadrícula de Caçapava do Sul, Rio Grande do Sul, Brazil. Bull. Natl. Dep. Miner. Prod. (DNPM) 1966, 127, 232. [Google Scholar]
  26. Ribeiro, M. Investigação Preliminar sobre a Gênese de algumas ocorrências Cupríferas da Folha de Bom Jardim. In Congresso Brasileiro de Geologia; SBG: Belo Horizonte, MG, Brazil, 1968. [Google Scholar]
  27. Ribeiro, M.J. Sulfetos Em Sedimentos Detríticos Cambrianos do Rio Grande do Sul, Brasil. Master’s Thesis, Universidade Federal do Rio Grande do Sul, Porto Alegre, Brazil, 1991. [Google Scholar]
  28. Melcher, G.C.; Mau, H. Novas Observações Geológicas na Região de Caçapava do Sul, Rio Grande Do Sul. An. Acad. Bras. Ciências 1960, 32, 43–50. [Google Scholar]
  29. Bettencourt, J.S. A Mina de Cobre de Camaquã, Rio Grande do Sul; IG/USP: São Paulo, Brazil, 1972. [Google Scholar]
  30. Remus, M.V.D. Metalogênese dos Depósitos Hidrotermais de Metais-Base e Au do Ciclo Brasiliano no Bloco São Gabriel, RS. Master’s Thesis, Universidade Federal do Rio Grande do Sul, Porto Alegre, Brazil, 1999. [Google Scholar]
  31. Susczcynski, E. Os Recursos Minerais Reais e Potenciais do Brasil e sua Metalogenia; Interciência: Rio de Janeiro, Brazil, 1975. [Google Scholar]
  32. Teixeira, G.; Gonzales, A.P.; Gonzales, M.A.; Licht, O.A.B. Contribuição ao Estudo de Mineralizações Cupríferas Disseminadas no distrito Minas do Camaquã. In Congresso Brasileiro de Geologia; SBG: Recife, Brazil, 1978; Volume 4, pp. 1644–1654. [Google Scholar]
  33. Gonzales, M.; Teixeira, G. Considerações sobre a Estratigrafia e Ambientes de Sedimentação da Região das Minas do Camaquã. In XXXI Congresso Brasileiro de Geologia; SBG: Camboriú, Brazil, 1980; Volume 3, pp. 1513–1524. [Google Scholar]
  34. Veigel, R. Evolução Diagenética e Mineralização Cu-Pb-Zn Dos Red Beds do Distrito de Camaquã, RS. Master’s Thesis, Universidade de Brasília, Brasília, Brazil, 1989. [Google Scholar]
  35. Basei, M.A.S.; Siga Júnior, O.; Masquelin, H.; Harara, O.M.M.; Reis Neto, J.M.d.; Preciozzi, F. The Dom Feliciano Belt of Brazil and Uruguay and Its Foreland Domain, the Rio de La Plata Craton: Framework, Tectonic Evolution and Correlation with Similar Provinces of Southewestern Africa. In Tectonic Evolution of South America; Instituto de Geociências, Universidade de São Paulo: Rio de Janeiro, Brazil, 2000; pp. 311–334. [Google Scholar]
  36. Hueck, M.; Basei, M.A.S.; Castro, N.A. de Origin and Evolution of the Granitic Intrusions in the Brusque Group of the Dom Feliciano Belt, South Brazil: Petrostructural Analysis and Whole-Rock/Isotope Geochemistry. J. South Am. Earth Sci. 2016, 69, 131–151. [Google Scholar] [CrossRef]
  37. Lago, S. Síntese Geológica do Depósito de Zn-Pb de Santa Maria-RS: Votorantim Metais. In Simpósio Brasileiro de Metalogenia; UFRGS: Gramado, Brazil, 2013; Volume 3. [Google Scholar]
  38. Binotto, R.B.; Saldanha, D.L.; Dias, A.R.A.; Perrota, M.M. Identificação dos padrões espectrais da alteração hidrotermal da Mina Uruguai, Caçapava do Sul (RS), utilizando espectros de reflectância experimental. Pesqui. Geociências 2015, 42, 89–101. [Google Scholar] [CrossRef]
  39. Lopes, R.W. Alteração Hidrotermal e Mineralizações de Cobre na Mina do Seival, Bacia do Camaquã, RS. In Monografia de Conclusão de Curso; Universidade Federal do Rio Grande do Sul: Porto Alegre, Brazil, 2011. [Google Scholar]
  40. Lopes, R.W.; Fontana, E.; Mexias, A.S.; Gomes, M.E.B.; Nardi, L.V.S.; Renac, C. Caracterização petrográfica e geoquímica da sequência magmática da Mina do Seival, Formação Hilário (Bacia do Camaquã—Neoproterozoico), Rio Grande do Sul, Brasil. Pesqui. Geociências 2014, 41, 51–64. [Google Scholar] [CrossRef]
  41. De Carvalho, P.F. Reconhecimento Geológico no Estado do Rio Grande do Sul.; Diretoria de Estatística da Produção, Seccão de publicidade: Rio de Janeiro, Brazil, 1932; pp. 1–72. [Google Scholar]
  42. Teixeira, E.A.; Leinz, V. Ouro no Bloco Butiá (Rio Grande do Sul). In Boletim da Divisão de Fomento da Produção Mineral; DNPM Publisher: Porto Alegre, Brazil, 1942; Volume 50, 64p. [Google Scholar]
  43. Goñi, J.C. O Rapakivi Lavras—Jazidas Metalíferas Associadas—Lavras do Sul—Rio Grande Do Sul. Boletim 1961, 7, 1–107. [Google Scholar]
  44. Kaul, P.F.T.; Rheinheimer, D. Projeto Ouro no Rio Grande Sul e Santa Catarina: Relatório Final; DNPM/CPRM: Porto Alegre, Brazil, 1974. [Google Scholar]
  45. Lopes, R.W.; Mexias, A.S.; Philipp, R.P.; Bongiolo, E.M.; Renac, C.; Bicca, M.M.; Fontana, E. AuCuAg Mineralization Controlled by Brittle Structures in Lavras do Sul Mining District and Seival Mine Deposits, Camaquã Basin, Southern Brazil. J. South Am. Earth Sci. 2018, 88, 197–215. [Google Scholar] [CrossRef]
  46. Fontana, E.; Mexias, A.S.; Renac, C.; Nardi, L.V.S.; Lopes, R.W.; Barats, A.; Gomes, M.E.B. Hydrothermal Alteration of Volcanic Rocks in Seival Mine Cu–Mineralization—Camaquã Basin—Brazil (Part I): Chloritization Process and Geochemical Dispersion in Alteration Halos. J. Geochem. Explor. 2017, 177, 45–60. [Google Scholar] [CrossRef]
  47. Fontana, E.; Renac, C.; Mexias, A.S.; Barats, A.; Gerbe, M.C.; Lopes, R.W.; Nardi, L.V.S. Mass Balance and Origin of Fluids Associated to Smectite and Chlorite/Smectite Alteration in Seival Mine Cu–Mineralization—Camaquã Basin—Brazil (Part II). J. Geochem. Explor. 2019, 196, 20–32. [Google Scholar] [CrossRef]
  48. Leinz, V.; Barbosa, A.F. Mapa Geológico Caçapava-Lavras. Boletim 1941, 90, 1–40. [Google Scholar]
  49. Ribeiro, M.J. Mapa Previsional do Cobre no Escudo Sul-Rio-Grandense: Nota Explicativa; Ministério das Minas e Energia, Departamento Nacional da Produção Mineral, Bol. Geológico: Brasília, DF, Brazil, 1978; Volume 3, 104p. [Google Scholar]
  50. Ribeiro, M.J. Problemas Ligados a Presença do Cobre Sedimentar no Rio Grande do Sul. In Congresso Brasileiro de Geologia; SBG: Recife, Brazil, 1978; Volume 6, pp. 5520–5533. [Google Scholar]
  51. Badi, W.S.; Gonzalez, A.P. Jazida de Metais Básicos de Santa Maria, Caçapava do Sul, Rio Grande do Sul. In Principais Depósitos Minerais do Brasil: Metais Básicos não Ferrosos, Ouro e Alumínio; C. Schobbenhaus e C. E. S. Coelho: Brasília, Brazil, 1988; Volume 3, pp. 158–170. [Google Scholar]
  52. Santos, E.L.; Maciel, L.A.C.; Zir Filho, J.A. Distritos Mineiros do Estado do Rio Grande do Sul.; DNPM Publisher: Porto Alegre, Rio Grande do Sul, Brazil, 1998. [Google Scholar]
  53. Ramgrab, G.E.; Wildner, W. Pedro Osório, Folha SH.22-Y-C 1999. Available online: https://rigeo.sgb.gov.br/handle/doc/8497 (accessed on 15 July 2022).
  54. Dardenne, M.A.; Schobbenhaus, C. Depósitos Minerais no Tempo Geológico e Épocas Metalogenéticas. In Geologia Tectônica e Recursos Minerais do Brasil; Bizzi, L.A., Schobbenhaus, C., Vidotti, R.M., Gonçalves, J.H., Eds.; Universidade de Brasília Publisher: Brasília, Brazil, 2000; pp. 365–448. [Google Scholar]
  55. Biondi, J.C. Processos Metalogenéticos e os Depósitos Minerais Brasileiros; Oficina de Texto Publicher: São Paulo, SP, Brazil, 2003; 552p, ISBN 978-85-7975-168-4. [Google Scholar]
  56. Reischl, J.L. Mineralizações Cupríferas Associadas a Vulcânicas da Mina Seival—RS. In Congresso Brasileiro de Geologia; SBG: Recife, Brazil, 1978; Volume 4, pp. 568–582. [Google Scholar]
  57. Philipp, R.P.; Pimentel, M.M.; Chemale, F., Jr. Tectonic Evolution of the Dom Feliciano Belt in Southern Brazil: Geological Relationships and U-Pb Geochronology. Braz. J. Geol. 2016, 46, 83–104. [Google Scholar] [CrossRef]
  58. Remus, M.V.D.; Hartmann, L.A.; McNaughton, N.J.; Groves, D.I.; Fletcher, I.R. The Link between Hydrothermal Epigenetic Copper Mineralization and the Caçapava Granite of the Brasiliano Cycle in Southern Brazil. J. South Am. Earth Sci. 2000, 13, 191–216. [Google Scholar] [CrossRef]
  59. Pereira, H.G.; Ferreira, F.J.F.; Moreira, C.A. Integration of Aerogammaspectrometric and Ground Electromagnetic Data in a Copper Occurrences Region in the Extreme Northwest of the Camaquã Basin, Southern Brazil. Geociências 2021, 40, 623–640. [Google Scholar] [CrossRef]
  60. Pereira, H.G.; Ferreira, F.J.F.; Moreira, C.A.; Silva, V.A.F. Geophysical-Structural Framework in a Mineralized Region of Northwesternmost Camaquã Basin, Southern Brazil. Geofísica Int. 2021, 60, 101–123. [Google Scholar] [CrossRef]
  61. Moreira, C.A.; Casagrande, M.F.S.; Borssatto, K. Analysis of the Potential Application of Geophysical Survey (Induced Polarization and DC Resistivity) to a Long-Term Mine Planning in a Sulfide Deposit. Arab J Geosci. 2020, 13, 1083. [Google Scholar] [CrossRef]
  62. Moreira, C.A.; Carneiro, H.P.; Casagrande, M.F.S.; Hartwig, M.E.; Hansen, M.A.F. Geophysical and Structural Survey in Copper Occurrence Located in the Northern Region of the Camaquã Basin (RS). REM Int. Eng. J. 2021, 74, 209–217. [Google Scholar] [CrossRef]
  63. Lopes, R.W.; Renac, C.; Mexias, A.S.; Nardi, L.V.S.; Fontana, E.; Gomes, M.E.B.; Barats, A. Mineral Assemblages and Temperature Associated with Cu Enrichment in the Seival Area (Neoproterozoic Camaquã Basin of Southern Brazil). J. Geochem. Explor. 2019, 201, 56–70. [Google Scholar] [CrossRef]
  64. Lopes, F.R. Caracterização Geológica e Geofísica das Mineralizações da Região das Minas do Seival, RS. Ph.D. Thesis, Universidade Federal do Rio Grande do Sul, Porto Alegre, Rio Grande do Sul, Brazil, 2018. [Google Scholar]
  65. Evans, A.M. Ore Geology and Industrial Minerals: An Introduction; Wiley-Blackwell: Hoboken, NJ, USA, 1993; ISBN 978-0-632-02953-2. [Google Scholar]
  66. Pirajno, F. Hydrothermal Processes and Mineral Systems|SpringerLink; Springer: Dordrecht, The Netherlands, 2010; ISBN 978-1-4020-8612-0. [Google Scholar]
  67. QGIS Development Team. QGIS Geographic Information System (Versão 3.82.1—Grenoble) [Software]. Open Source Geospatial Foundation. 2022. Available online: https://www.qgis.org/ (accessed on 12 January 2025).
  68. Câmara, G.; Souza, R.C.M.; Freitas, U.M.; Garrido, J. Spring: Integrating Remote Sensing and Gis by Object-Oriented Data Modelling. Comput. Graph. 1996, 20, 395–403. [Google Scholar] [CrossRef]
  69. Vollmer, F. ORIENT (Versão 3.20.0) [Software]. 2023. Available online: https://www.frederickvollmer.com/orient/index.html (accessed on 12 January 2025).
  70. JAXA ALOS PALSAR—Radar de Abertura Sintética de Banda L. 2024. Available online: https://asf.alaska.edu/datasets/daac/alos-palsar/ (accessed on 17 September 2023).
  71. PCI Geomatics. Catalyst Professional Complete (Version 2023) [Software]. Markham, Canadá: PCI Geomatics. 2023. Available online: https://www.pcigeomatics.com/ (accessed on 12 January 2025).
  72. Rajesh, H.M. Application of Remote Sensing and GIS in Mineral Resource Mapping—An Overview. J. Mineral. Petrol. Sci. 2004, 99, 83–103. [Google Scholar] [CrossRef]
  73. Justus, J.O.; Machado, M.L.A.; Franco, M.S.M. Geomorfologia. In Projeto RADAMBRASIL, Folha SH.22 Porto Alegre e Parte das Folhas SH.21 Uruguaiana e SI.22 Lagoa Mirim: Geologia, Geomorfologia, Pedologia, Vegetação, Uso Potencial da Terra; IBGE: Rio de Janeiro, Brazil, 1986; pp. 313–404. [Google Scholar]
  74. Picada, F. Sistema de Falhas e sua importância na Geologia Estrutural do Rio Grande do Sul; DNPM Publisher: Porto Alegre, Rio Grande do Sul, Brazil, 1968; 97p. [Google Scholar]
  75. Picada, F. Sistema de Falhas e sua importância na Geologia Estrutural do Rio Grande do Sul. In Congresso Brasileiro de Geologia; SBG: São Paulo, Brazil, 1971; pp. 167–191. [Google Scholar]
  76. Chemale, F., Jr. Evolução geológica do Escudo Sul-rio-grandense. In Geologia do RS; Holz, M., De Ros, L.F., Eds.; CIGO/UFRGS Publisher: Porto Alegre, Rio Grande do Sul, Brazil, 2000; pp. 13–52. [Google Scholar]
  77. Fernandes, L.A.D.; Tommasi, A.; Porcher, C.C. Deformation Patterns in the Southern Brazilian Branch of the Dom Feliciano Belt: A Reappraisal. J. South Am. Earth Sci. 1992, 5, 77–96. [Google Scholar] [CrossRef]
  78. Fernandes, L.A.D.; Tomassi, A.; Vauchez, A.; Porcher, C.C.; Menegat, R.; Koester, E. Zona de Cisalhamento Transcorrente Dorsal de Canguçu: Caracterização e Importância na Compartimentação Tectônica do Cinturão Dom Feliciano. Rev. Bras. Geociências 1993, 23, 224–233. [Google Scholar] [CrossRef]
  79. Fernandes, L.A.D.; Menegat, R.; Costa, A.F.U.; Koester, E.; Porcher, C.C.; Tommasi, A.; Kraemer, G.; Ramgrab, G.E.; Camozzato, E. Evolução Tectônica do Cinturão Dom Feliciano no Escudo Sul-Rio-Grandense, Parte I—Uma Contribuição a partir do Registro Geológico. Rev. Bras. Geociências 1995, 25, 351–374. [Google Scholar] [CrossRef]
  80. Bitencourt, M.d.F.; Nardi, L.V.S. Tectonic Setting and Sources of Magmatism Related to the Southern Brazilian Shear Belt. ResearchGate 2000, 30, 186–189. [Google Scholar] [CrossRef]
  81. Ridley, J.R.; Diamond, L.W. Fluid Chemistry of Orogenic Lode Gold Deposits and Implications for Genetic Models. In Gold in 2000; Hagemann, S.G., Brown, P.E., Eds.; Society of Economic Geologists: Littleton, CO, USA, 2000; Volume 13, ISBN 978-1-62949-020-5. [Google Scholar]
  82. Hitzman, M.W.; Broughton, D.; Selley, D.; Woodhead, J.; Wood, D.; Bull, S. The Central African Copperbelt: Diverse Stratigraphic, Structural, and Temporal Settings in the World’s Largest Sedimentary Copper District. In Geology and Genesis of Major Copper Deposits and Districts of the World: A Tribute to Richard H. Sillitoe; Hedenquist, J.W., Harris, M., Camus, F., Eds.; Society of Economic Geologists: Littleton, CO, USA, 2012; Volume 16, ISBN 978-1-62949-041-0. [Google Scholar]
  83. Sommer, C.A.; Lima, E.F.D.; Nardi, L.V.S.; Liz, J.D.D.; Pierosan, R. Depósitos de Fluxo Piroclástico Primários: Caracterização e Estudo de um Caso no Vulcanismo Ácido Neoproterozóico do Escudo Sul-rio-grandense. Pesqui. Geociências 2003, 30, 3–26. [Google Scholar] [CrossRef]
Figure 1. Location map of the study area with disseminated and alluvial copper and gold occurrences over LandSat 8 FCC images with 7-5-2 bands in RGB from USGS [16]. Geographic Coordinate Reference System Datum: SIRGAS 2000. Data Source: Modified from Cruz and Horn [1].
Minerals 15 00436 g001
Figure 2. Lithostratigraphic units of the geological map of Lavras do Sul and A-B profile location. Data Source: Modified from Cruz and Horn [1].
Minerals 15 00436 g002
Figure 3. Schematic SW-NE geological profile of the Camaquã Basin and its mineral deposits cross-cut the study area. Data Source: Modified from Lago, [37]; Binotto, [38].
Minerals 15 00436 g003
Figure 4. Location of abandoned mines in the Seival region, showing gold and copper occurrences, and part of the lithostratigraphic units of the Bom Jardim Group. Data Source: [1].
Minerals 15 00436 g004
Figure 5. Localization of mineralization resulting from supergene enrichment (Seival mines): (a) malachite (João Dahne abandoned mine); (b) malachite with azurite (black arrow) and calcite (gangue) precipitated during a secondary stage (Alcides abandoned mine); (c) Andesite displaying a polished, striated, and shouldered oblique fault plane surface (slickensides) (Barita abandoned mine); and (d) chrysocolla in fractures, representing the late oxidation stage (Alcides abandoned mine).
Minerals 15 00436 g005
Figure 6. Flowchart of tectonic lineament extraction and analysis process.
Minerals 15 00436 g006
Figure 7. (a) Geological map; and (bg) rose diagrams of absolute frequency and absolute length of tectonic lineaments derived from SAR images for the Hilário Formation (with its facies) and for Arroio dos Nobres Formation, part of the Bom Jardim Group. In the rose diagram class interval, lineament directions correspond to 0° = 90° (E) and 180° = 270° (W).
Minerals 15 00436 g007
Figure 8. (a) Drainage network map; and (bg) rose diagrams of absolute frequency and length of the extracted drainages for the Hilário Formation (with its facies) and Arroio dos Nobres Formation of the Bom Jardim Group. In the rose diagram class interval, lineament directions satisfy 0° = 90° (E) and 180° = 270° (W).
Minerals 15 00436 g008
Figure 9. Digital Elevation Model with drainages, main tectonic structures with their kinematics, and tectonic lineaments extracted from SAR images of the Hilário Formation (with its facies) and Arroio dos Nobres Formation of the Bom Jardim Group. Data Source: [1].
Minerals 15 00436 g009
Figure 10. Represented by (a) thickness of the lithostratigraphic units of the Bom Jardim Group; (b) geomorphology represented by smooth and undulating hills; (c) abandoned Barita mine with vertical and oblique striated surfaces and their respective attitudes; (d) current aspects of the abandoned Alcides mine; and (e) old trench for prospecting copper and gold.
Minerals 15 00436 g010
Figure 11. Lineament density of SAR images and drainages (km/km2) across lithostratigraphic units. HFmevF = Hilário Formation, effusive volcanic facies, HFmvvF = Hilário Formation, volcano-sedimentary and volcaniclastic facies, and ANFm = Arroio dos Nobres Formation.
Minerals 15 00436 g011
Figure 12. Rose diagrams showing the directions of mineral occurrences of alluvial gold in drainages and copper and gold in the lithologies of the Bom Jardim Group. Source: Authors, 2024. Created using Orient software [68].
Minerals 15 00436 g012
Table 1. Metallogenetic models and authors.
Metallogenetic ModelsAuthors
Volcanogenic[24,25,26,27]
Plutogenic[28,29,30]
Volcano-sedimentary[31]
Sedimentary exhalative[32,33]
Sedimentary diagenetic[34]
Sedimentary syngenetic[27]
Hydrothermal[7,8,9,10]
Table 2. Characteristics of the ALOS PALSAR data [70].
Fine ResolutionScanSARPolarimetric
Beam ModeFBS, DSNFBDWB1, WB2PLR
Center FrequencyL-Band (1.27 GHz)
PolarizationHH or VVHH + HV or VV + VHHH or VVHH + HV or VV + VH
Spatial Resolution10 m20 m100 m30 m
Swath Width70 km70 km250–350 km30 km
Off-Nadir Angle34.3° (default)27.1° (default)21.5° (default)
Abbreviation: FBS = Fine Resolution Mode, Single Polarization, DSN Direct Downlink, FBD = Fine Resolution Mode, Dual Polarization, WB = Wide beam, PLR = Polarimetric Mode, HH, VV, HV, VH = Polarization Types (V = Vertical and H = Horizontal).
Table 3. Strike, number of lineaments, absolute length, and lineament density data derived from SAR image for each geological unit of the Bom Jardim Group.
Geological
Units
StrikeNumber of Lineaments (N)Absolute
Length
(km)
Standard
Deviation
(km)
Density of
Lineaments (km/km2)
ANFmN 50°–60° E8443.50.59299
N 80°–90° E7650.00.4
N 70°–80° E7238.80.4
HFmvvFN 30°–40° E6456.20.9382
N 00°–10° W6339.40.3
N 40°–50° E5961.21.0
HFmevFN 00°–10° W9350.60.4596
N 80°–90° E8649.30.4
N 10°–20° W7851.20.5
HFmevF = Hilário Formation, effusive volcanic facies; HFmvvF = Hilário Formation, volcano-sedimentary and volcaniclastic facies; and ANFm = Arroio dos Nobres Formation.
Table 4. Strike, number of lineaments, absolute length, and lineament density data derived from drainages for each geological unit of the Bom Jardim Group.
Geological
Units
StrikeNumber of Lineaments (N)Absolute
Length
(km)
Standard
Deviation
(km)
Density of
Lineaments (km/km2)
ANFmN 00°–10° W16835.10.208249
N 40°–50° W13926.90.23
N 40°–50° E13424.80.25
HFmvvFN 00°–10° W17230.60.17427
N 40°–50° E14123.30.19
N 80°–90° E12626.10.19
HFmevFN 00°–10° W578116.40.21477
N 40°–50° E53684.50.19
N 40°–50° W43862.50.16
HFmevF = Hilário Formation, effusive volcanic facies; HFmvvF = Hilário Formation, volcano-sedimentary and volcaniclastic facies; and ANFm = Arroio dos Nobres Formation.
Disclaimer/Publisher’s Note: The statements, opinions and data contained in all publications are solely those of the individual author(s) and contributor(s) and not of MDPI and/or the editor(s). MDPI and/or the editor(s) disclaim responsibility for any injury to people or property resulting from any ideas, methods, instructions or products referred to in the content.

