Article

High-Temperature Evolution of Point Defect Equilibria in Hydrous Forsterite Synthesized at 1100 °C and up to 4 GPa

by
Alessandro Del Vecchio
1,*,
Brent T. Poe
1,
Valeria Misiti
2 and
Mariangela Cestelli Guidi
3
1
Dipartimento INGEO Ingegneria e Geologia, Università degli Studi G. D’Annunzio Chieti-Pescara, Via dei Vestini 31, 66100 Chieti, Italy
2
INGV Istituto Nazionale Geofisica e Vulcanologia, Via di Vigna Murata 605, 00143 Rome, Italy
3
INFN Laboratori Nazionali di Frascati, Via Enrico Fermi 40, 00044 Frascati (Rome), Italy
*
Author to whom correspondence should be addressed.
Minerals 2019, 9(10), 574; https://doi.org/10.3390/min9100574
Submission received: 31 July 2019 / Revised: 13 September 2019 / Accepted: 18 September 2019 / Published: 20 September 2019

Abstract

:
Water distribution in the deep Earth represents one of the most important topics in the field of geodynamics due to its large impact on the physical and chemical properties of the Earth’s mantle, such as electrical conductivity, seismic anisotropy, diffusion, and rheology. In this study, we synthesized hydrous forsterite at 1100 °C and up to 4 GPa with either a piston-cylinder or multianvil apparatus. As a starting material, we used synthetic forsterite, unbuffered by SiO2, obtained by thermo-mechanical activation of talc and magnesium carbonate hydroxide. Hydration was carried out using liquid H2O as hydrogen source. Samples were polycrystalline in an effort to distribute H2O throughout the sample both rapidly and homogeneously. Using the Paterson calibration, we observed total water content concentrations ranging between 100 and 500 ppm wt H2O. Multiple absorption bands are found in the frequency range between 3400 and 3650 cm−1, identifying at least seven peaks in all samples. Vibrational bands were centered at 3476, 3535, 3550, 3566, 3578, 3605, and 3612 cm−1, in good agreement with experimental studies conducted on both hydrous forsterite and single crystals of olivine. The stronger OH stretching peaks can be attributed to vibrational modes associated with the hydrogarnet defect 4 H Si x in which four protons occupy a vacant tetrahedral site. None of the OH bands observed are found at frequencies associated with hydrogen occupying vacant octahedral sites. High-temperature FTIR spectroscopy was used to evaluate the evolution of IR spectra as a function of temperature, up to 500 °C. The complete reversibility of peak absorption vs. temperature in the OH stretching region confirms that no water loss occurred during heating. We observe an overall a decrease in total absorption with increasing temperature, and a prominent decrease in the relative intensities of the higher frequency bands (>3600 cm−1) with respect to lower frequency bands. We have assigned a series of equilibrium expressions based on the variation of relative peak areas with temperature and find that enthalpies of these processes range between 0.047–0.068 eV (4.5–6.5 kJ/mol), very low in comparison to activation energies observed for electrical conduction in hydrous olivine. Major changes in the vibrational spectrum are expected to be related to configurational changes of the same fully protonated hydrogarnet defect species. However, the complexity of the FTIR spectra may also be related to partially protonated defects, such as the associate defect 3 H Si + H i generated by a dissociation reaction of the hydrogarnet species.

1. Introduction

The interest in hydrogen as an important chemical component of Earth’s mantle escalated when hydroxyl groups were observed in nominally anhydrous minerals (NAMs) such as (Mg,Fe)2SiO4 olivine using Fourier Transform Infrared Spectroscopy, [1,2,3,4,5,6,7,8,9], leading to the idea that H2O may not only be present but have a profound influence on the dynamics of the Earth even at great depths. More recently, Pearson et al. [10] observed significant H2O concentrations in natural crystals of HP and HT polymorphs of olivine preserved within diamond inclusions, giving further confirmation that water is present at great depths in the innermost regions of the Earth. Hydrogen in the mantle represents one of the most important topics in the field of experimental mineralogy and petrology, because its presence in the crystalline lattice of nominally anhydrous minerals such as olivine can have a strong impact on its physical and chemical properties. It may enhance its deformation and rheological properties [11,12,13,14,15] such that a weakening of H2O-bearing olivine facilitates mantle convection. Additionally, it may favor the formation of fluids/melts at lower temperatures, also affecting mantle rheology [16,17,18,19]. Furthermore, hydrogen incorporation may influence seismic velocities [20], and given the faster diffusivity of hydrogen compared to oxygen or other cations, also electrical conductivity may be influenced by small concentrations of water in nominally anhydrous minerals [21,22,23,24,25,26,27,28,29].
Among Nominally Anhydrous Minerals, olivine (orthorhombic Pbnm) is the most common mineral of mafic and ultramafics rocks, and it is generally regarded as the major constituent of the Earth’s upper mantle. Olivine is an isomorphic solid solution between the two end-member orthosilicates Forsterite Mg2SiO4 and Fayalite Fe2SiO4, typically with a chemical composition near Mg0.9Fe0.1SiO4., such that forsterite has often been studied in its place [5,7,8,24,27]. Its structure consists of isolated tetrahedra linked by divalent cations (M1 and M2 sites, mainly occupied by bivalent cations such as Mg and Fe, but also by Mn, Ca, and Ni).
There are two main approaches to obtain information about the water content in the upper mantle. First, it is important to observe natural mantle xenoliths [30,31,32]. This approach, however, is limited both by the difficulty of finding natural samples, and also because they may not be fully representative of the Earth’s mantle, as only their cores might still preserve the true chemical characteristics of the original mantle [33,34,35]. Secondly, it is possible to carry out laboratory experiments under controlled physical conditions [6,27,28,33,36,37,38,39,40], providing a large amount of data, because it has aimed to parameterize the intensive variables of processes (pressure, temperature, chemical composition, fO2, fH2O) mainly using equilibrium thermodynamics, which allows us to evaluate the energy balances that regulate the stability of the system considered.
The water content of the mantle may be regulated by the stability of DHMS (Dense Hydrous Magnesium Silicates) [41,42]. All mantle minerals are capable of hosting significant amounts of hydrogen in their crystal structure, but regarding water storage capacity, the mantle shows a strong heterogeneity. The upper and lower mantle have the possibility of very low storage (<0.2 wt% or 2000 ppm), while the transition zone has a storage capacity of about 0.5–1 wt%, values mainly due to the very high water solubilities of about 1–3 wt% of wadsleyite and ringwoodite, the high-pressure and high-temperature polymorphs of olivine. Olivine, which has a relatively low to moderate H2O solubility [43] is however considered a large reservoir for water in the upper mantle [9,30,44,45] simply because of its massive abundance. To constrain the deep-water cycle, the knowledge of the storage capacity of water in nominally anhydrous minerals (NAMs) in the mantle is a key issue [44,46,47].
FTIR spectroscopy is one of the most powerful tools used to help understand NAMs, and in the case of olivine, four principal substitution mechanisms by which hydrogen may be incorporated into its structure have been regarded. The first, and most common, mechanism involves Si vacancies (in Kröger-Vink notation, (Si) =   ( 4 H ) Si x ), where four protons completely fill a tetrahedral vacancy, each bonded to one of the apical oxygens of the tetrahedron. This mechanism leads to a final stoichiometry of Mg2H4O4 and is commonly called a “hydrogarnet defect” [4,5,48,49,50]. The major FTIR absorption peaks associated with this defect usually occur in the higher frequency region where OH stretching vibrations are observed, between 3400 and 3700 cm−1. The second mechanism involves the substitution of divalent cations (Mg) = ( 2 H ) Mg x ) by two protons, resulting in a stoichiometry of MgH2SiO4 [49,51,52]. This process results in the observation of vibrational bands at lower frequencies (3100–3300 cm−1) than those for the (Si) mechanism. The other substitutional processes are called “titanoclinohumite defect” and “trivalent cation” defect (Ti) = ( Ti 4 + ) Mg ( 2 H ) Si and (Triv) = ( Me 3 + ) Mg ( H ) Mg ). In the (Ti) mechanism, Ti4+ is in an octahedral site, the charge balanced by substitution of a Si4+ by two protons in a neighboring tetrahedral site. The (M3+) mechanism is linked to a coupled replacement of a metallic trivalent cation M3+ and H+ for two metallic cations M2+, leading to a final stoichiometry of M3+HSiO4 [6,39,49,50].
Parallel to experimental studies on natural and synthetic samples, computer modeling studies have also been taken into great consideration with regard to the study of defects in olivine and forsterite. Density Function Theory (DFT) is an ab-initio based method for the calculation of total ground state energy and structural optimization for any given configuration of atoms confined by periodic boundary conditions, which has allowed the determination of the most energetically favorable structural positions of protons in crystalline defect sites [52,53,54,55,56,57,58]. DFT can also be used for the calculation of vibrational frequencies for comparison with experimental FTIR data in order to distinguish various types of defects and determine their possible coexistence.
Here, in this work, we performed a series of experiments at 1100 °C and up to 4 GPa to obtain hydrous synthetic forsterite, in order to isolate our attention on a minimal number of different H-bearing defect species. A slight excess of Mg with respect to forsterite stoichiometry favored formation of the hydrogarnet defect. Our results were then compared with other experimental data, primarily to validate our syntheses, but also to more quantitatively investigate potential equilibria that might occur between the H-bearing defects present. The specific contribution of each type of defect was identified by considering their evolution in temperature, up to 500 °C. From these observations, we hypothesize the behavior of various types of H-bearing defects related to the presence of hydrogen in the crystalline lattice of forsterite under Earth’s upper mantle conditions.

2. Experimental Methods

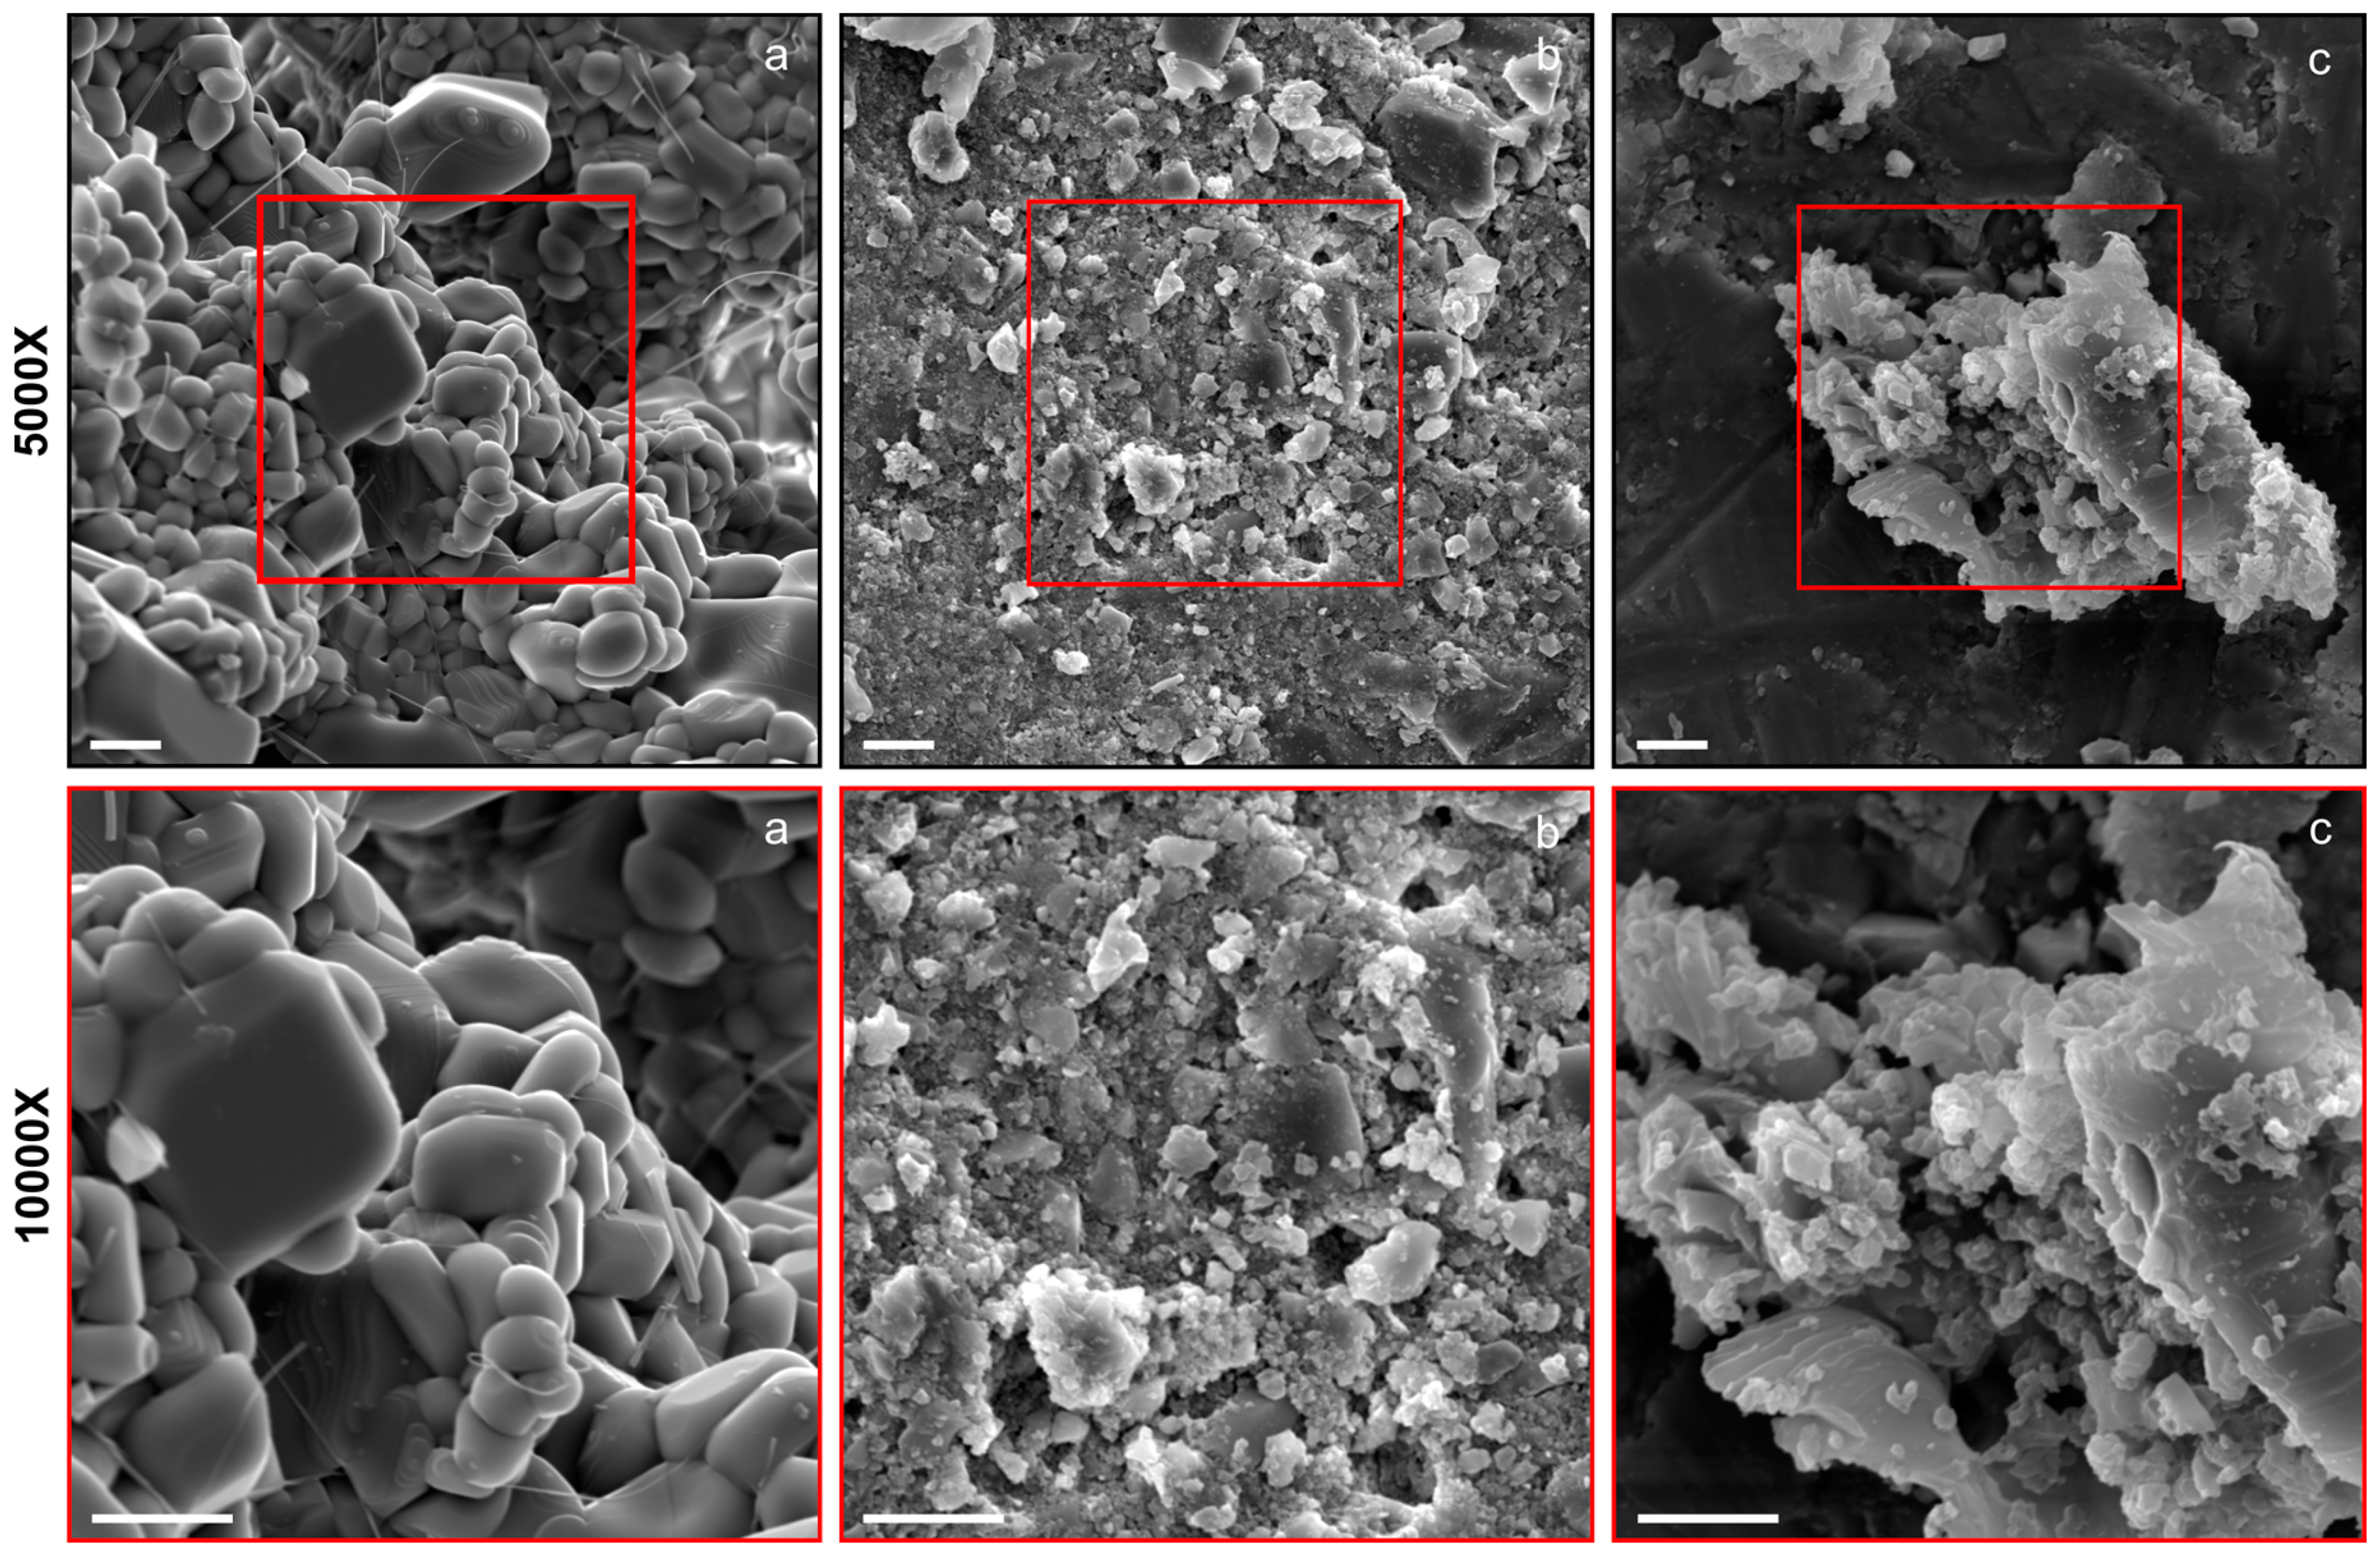
2.1. Synthesis and Characterization of Synthetic Forsterite

According to previous studies [59,60], we synthesized Fe-free forsterite by a thermo-mechanical method, derived from a combination of mechanical activation and heat treatment, starting from talc Mg3Si4O10(OH)2 and hydroxyl magnesium carbonate MgCO3*Mg(OH)2*H2O as chemical composition reagents. The mechanical treatment was carried out by mixing materials for 30 min under 20 mL of CH3COOH3 (99.5% purity). The mixture was calcinated at 100 °C for about 2 h, in order to eliminate residual CH3COOH and H2O. The heat treatment was performed in a Nabertherm LHT 04/18 chamber furnace at high-temperature equipped at the National Institute of Geophysics and Volcanology in Rome. The starting mixture was placed in a platinum-iridium crucible (Pt95Ir5) and the synthesis process was performed by a series of heating and locking phases with different temperature-time gradients up to 1200 °C. The first heating phase occurred between 40–700 °C over 60 min (11 °C/min), then the system was locked for 60 min at 700 °C. The second heating phase occurred between 700–1200 °C over 60 min (~8 °C/min), with a second locking phase at 1200 °C for 120 min. Starting materials and the synthesis product were analyzed by Powder X-Ray Diffraction (XRPD) using a Siemens D5000 (Dept. INGEO Univ. Chieti-Pescara, Chieti, Italy) operating with a Bragg-Brentano geometry (CuKα = 1.518 Å, 40 kV, 40 mA, 2–90° theta scanning interval, step size 0.020° 2 theta). In Figure 1 the diffraction patterns of both the starting materials (talc and hydroxide magnesium carbonate) and the final product are shown.
Our powder diffraction pattern was then compared with bibliographic data of XRPD analysis of synthetic forsterite. No traces of talc or hydroxide magnesium carbonate are detected and, furthermore, there is no evidence of any interaction with the platinum crucible. Low traces of periclase are detected. Our synthetic forsterite was also analyzed by Raman spectroscopy using a Horiba Raman Labram HR (Horiba Scientific, Dept. Sciences Univ. Roma Tre, Rome, Italy), equipped with green laser radiation (532 nm, 50 mW), 1800 groves/mm−1 monochromator (1 cm−1 resolution), 30s acquisition time and 10 accumulations per sample. Raman spectra of synthesized forsterite were acquired in a frequency range between 200–1000 cm−1. We identified bands at 965, 919, 881, 856, 823, 709, and 607 cm−1 (Figure 2). The positions and relative intensities of all bands agree very well with those of the internal vibrational modes of forsterite, involving symmetric and asymmetric stretching of Si-O groups [40,61,62,63,64].

2.2. High-Pressure and High-Temperature Experiments

The main purpose of HP high-pressure and HT high-temperature experiments is to parameterize the intensive variables of processes (pressure, temperatures, chemical composition), mainly using thermodynamics, which allows us to evaluate the energy balances that regulate the stability in the systems considered. All experiments reported here were performed at the High-Pressure and High-Temperature Laboratory of the INGV National Institute of Geophysics and Volcanology in Rome. Polycrystalline synthetic forsterite (about 0.15 g) was placed inside Pt0,95Rh0,05 capsules (10 mm length, 3.5 mm inner diameter). Hydrogenation of the sample is made possible by the insertion of bidistillated water via microsyringe immediately before welding the capsule. Given the low solubility of water in olivine [43], varying amounts not exceeding 20 µL H2O were added in order to maintain the integrity of the run product without an overly excessive fluid phase. The capsules were then immediately welded for the HP and HT experiments. Using an end-loaded Piston Cylinder apparatus, four runs at 1.5 GPa were annealed at 1100 °C for durations of 90- and 180-min. Piston and assembly diameter was ¾″ (1.91 cm). Using a Walker type 6/8 Multi-Anvil apparatus 2 runs at 4 GPa were annealed at 1100 °C for a duration of 300 min. The runs were performed using a 25/17 octahedron/truncation edge-length assembly configuration, with a Cr2O3-doped MgO octahedral pressure medium and 32 mm cubic tungsten carbide (WC) anvils. In both devices, temperature was monitored by a B type thermocouple. Following an isobaric quench (quench rate ca. 100–200 °C per second) and decompression, samples were recovered for FTIR analyses. To verify the success of the synthesis runs, weight and size measurements were made in both pre-and post-synthesis stages. The recovered capsules were punctured and then placed in an oven at 70 °C for about 30 min in order to remove excess fluid not absorbed by the starting material, which could also be monitored by visual inspection under a binocular. Each capsule was sectioned via a diamond saw and embedded in an epoxy resin. Sections were then thinned and doubly polished to a thickness that ranged from 300–500 microns. Experimental conditions are listed in Table 1. We also acquired a series of SEM images (Figure 3) of our synthetic forsterite and recovered samples at 1.5 and 4 GPa, in order to examine the microtexture of the polycrystalline aggregates. The instrument used was a Phenom XL Scanning Electron Microscope (15kV-point, CeB6 as source, Secondary Electron Detector, 2048 × 2048 image resolution, magnification at 5000× and 10,000×) (Univ. Chieti-Pescara, Chieti, Italy).

2.3. Room Temperature FTIR Analysis

FTIR measurements were carried out at the National Institute of Nuclear Physics INFN in Frascati (Rome, Italy), using a Bruker Hyperion 3000 microscope equipped with a Globar IR source, a KBr beam splitter and a liquid nitrogen cooled mercury-cadmium-telluride (MCT) detector. We acquired a series of single-point spectra at ambient temperature over the frequency range 1000–4000 cm−1, along both linear traverses and randomly within the sample area, with a spectral resolution of 4 cm−1 and 128 scans accumulation. Each image covers an area of 100 × 100 microns. We identified vibrational bands in a frequency range between 3400 and 3700 cm−1, due to stretching vibrational modes of OH groups. Subsequently, we improved FTIR analyses using an FPA focal-plane array detector (Figure 4), which provides information about the identification and concentration of specific vibrational groups as well as their distribution throughout the sample area. We integrated the entire area over the frequency range 3400–3800 cm−1 in order to observe the effective distribution of H2O throughout the sample, with a spectral resolution of 8 cm−1, 64 scans accumulation and a spatial resolution close to 5 µm.
High-temperature measurements were carried out with a LINKAM FTIR600 horizontal device coupled with the Bruker Hyperion 3000 microscope, using a water circulator pump to keep the stage body cool. The temperature ranged from room temperature up to 500 °C.

3. Results

3.1. Deconvolution of Spectra and Peaks Identification

After polishing, thin sections remained free of cracks and therefore suitable for infrared analyses. Deviation from cylindrical symmetry was observed however for samples H0203 and D1409, possibly due to inefficient packing of the starting material in the capsule, which likely resulted in its final shape during the pressurization and heating process.
Due to the complexity of the FTIR spectra, a deconvolution process was carried out in the specific IR region of OH group stretching in the frequency range between 3400–3800 cm−1, in order to more accurately characterize each of the overlapping bands observed. Each spectrum first required a baseline correction to remove a very broad non-linear feature unlikely to be related to the presence of hydrogen in the forsterite lattice but more likely to be associated with adsorbed water on the sample surface and at grain boundaries. A total of nine absorption bands were observed within the frequency range 3450–3700 cm−1 (Figure 5).
The deconvolution process was carried out using a combination of Gaussian and Lorentzian lineshapes. Each fit was constrained with upper and lower limits placed on FWHM and all peak positions fixed for a total of 18 adjustable parameters, with correlation coefficient R2 always greater than 0.99. The three strongest bands are located at 3566, 3578, and 3612 cm−1. In addition, there are two smaller bands at 3536 and 3550 cm−1 and a well-resolved band at 3476 cm−1. Furthermore, the band near 3612 cm−1 is moderately asymmetric, requiring the addition of another fitted peak at 3605 cm−1. Peaks occurring around 3693 and 3699 cm−1 are probably related to the presence of brucite Mg(OH)2, as similar features have been observed in previous studies [65,66,67]. The presence of brucite may be related to the interaction between excess starting Mg in the form of MgO periclase (observed by XRPD) and molecular water.
Peaks identified at 3476, 3536, 3550, 3566, 3578, 3605, and 3612 cm−1 are related to a specific mechanism of hydrogen incorporation in forsterite called the “hydrogarnet substitution” [4,5,48,50]. This mechanism involves Si vacancies, where four protons completely fill a tetrahedral vacancy, each bonded to one of the apical oxygens of the tetrahedron, leading to a final stoichiometry of Mg2H4O4. The major FTIR absorption peaks associated with this mechanism usually occur in the higher frequency region where OH stretching vibrations occur, between 3400 and 3650 cm−1. In the absence of Fe2+ or any extrinsic impurity cations, an alternative mechanism of hydrogen incorporation involves the substitution of octahedral Mg2+ cations by two protons, resulting in a stoichiometry of MgH2SiO4 [49,51,52]. This process usually results in the observation of vibrational bands at lower frequency (3100–3400 cm−1). In this study, no bands were observed in the lower frequency region, so all absorption bands identified in our spectra are related only to hydrogarnet defect in forsterite.

3.2. Calculation of Total Water Concentration

Water concentrations for unpolarized single crystals or polycrystalline samples are often determined by the FTIR-based calibration of Paterson [68], established on an empirical correlation between the OH stretching frequency and the extinction coefficient according to the expression:
C OH = Xi 150   ξ   K ( v ) ( 3780 v )
where COH is the hydroxyl concentration (in mol H/L), ξ is an orientation factor (equal to 1/3 for unpolarized IR light or randomly oriented grains, or equal to 1/2 for unpolarized IR light on oriented grains, or 1 for polarized light on oriented grains, see [12,43,68,69]). K(ν) is the absorption coefficient in cm−1 for a given wavenumber v (equal to H(v)/t, where H is the absorbance at wavelength v and t is the thickness in cm). Xi is a density factor, equal to 2ρ*106/18 where ρ is the density of the mineral. Units of total H2O concentration are often expressed either as wt ppm H2O or H/106 Si. Here, we used values for Xi equal to 4366*104 H/106Si or 2793 wt ppm for Mg2SiO4 forsterite, previously determined by Bolfan-Casanova et al. [70].
Although it has been claimed that the Paterson calibration can lead to an underestimation of the water content [71,72], it is still used for several reasons. It allows the quantification of hydrogen in the absence of specific mineral-dependent molar absorption coefficients or with unoriented samples. It is also independent of H2O speciation, and, therefore, appropriate over a wide range of chemical component activities. Finally, it facilitates comparison with results of other studies that have used the Paterson calibration for the study of the rheological and electrical properties of minerals [12,26,73].
The total water content was determined by analyzing the frequency range between 3400 and 3670 cm−1, resulting in total H2O concentrations from about 100 to 500 wt ppm H2O. Due to our assignment of the peak near 3700 cm−1 to the presence of brucite Mg(OH)2, we excluded the frequency range 3670–3700 cm−1 from the determination of the total water content. Experimental conditions and total water contents are summarized in Table 1.

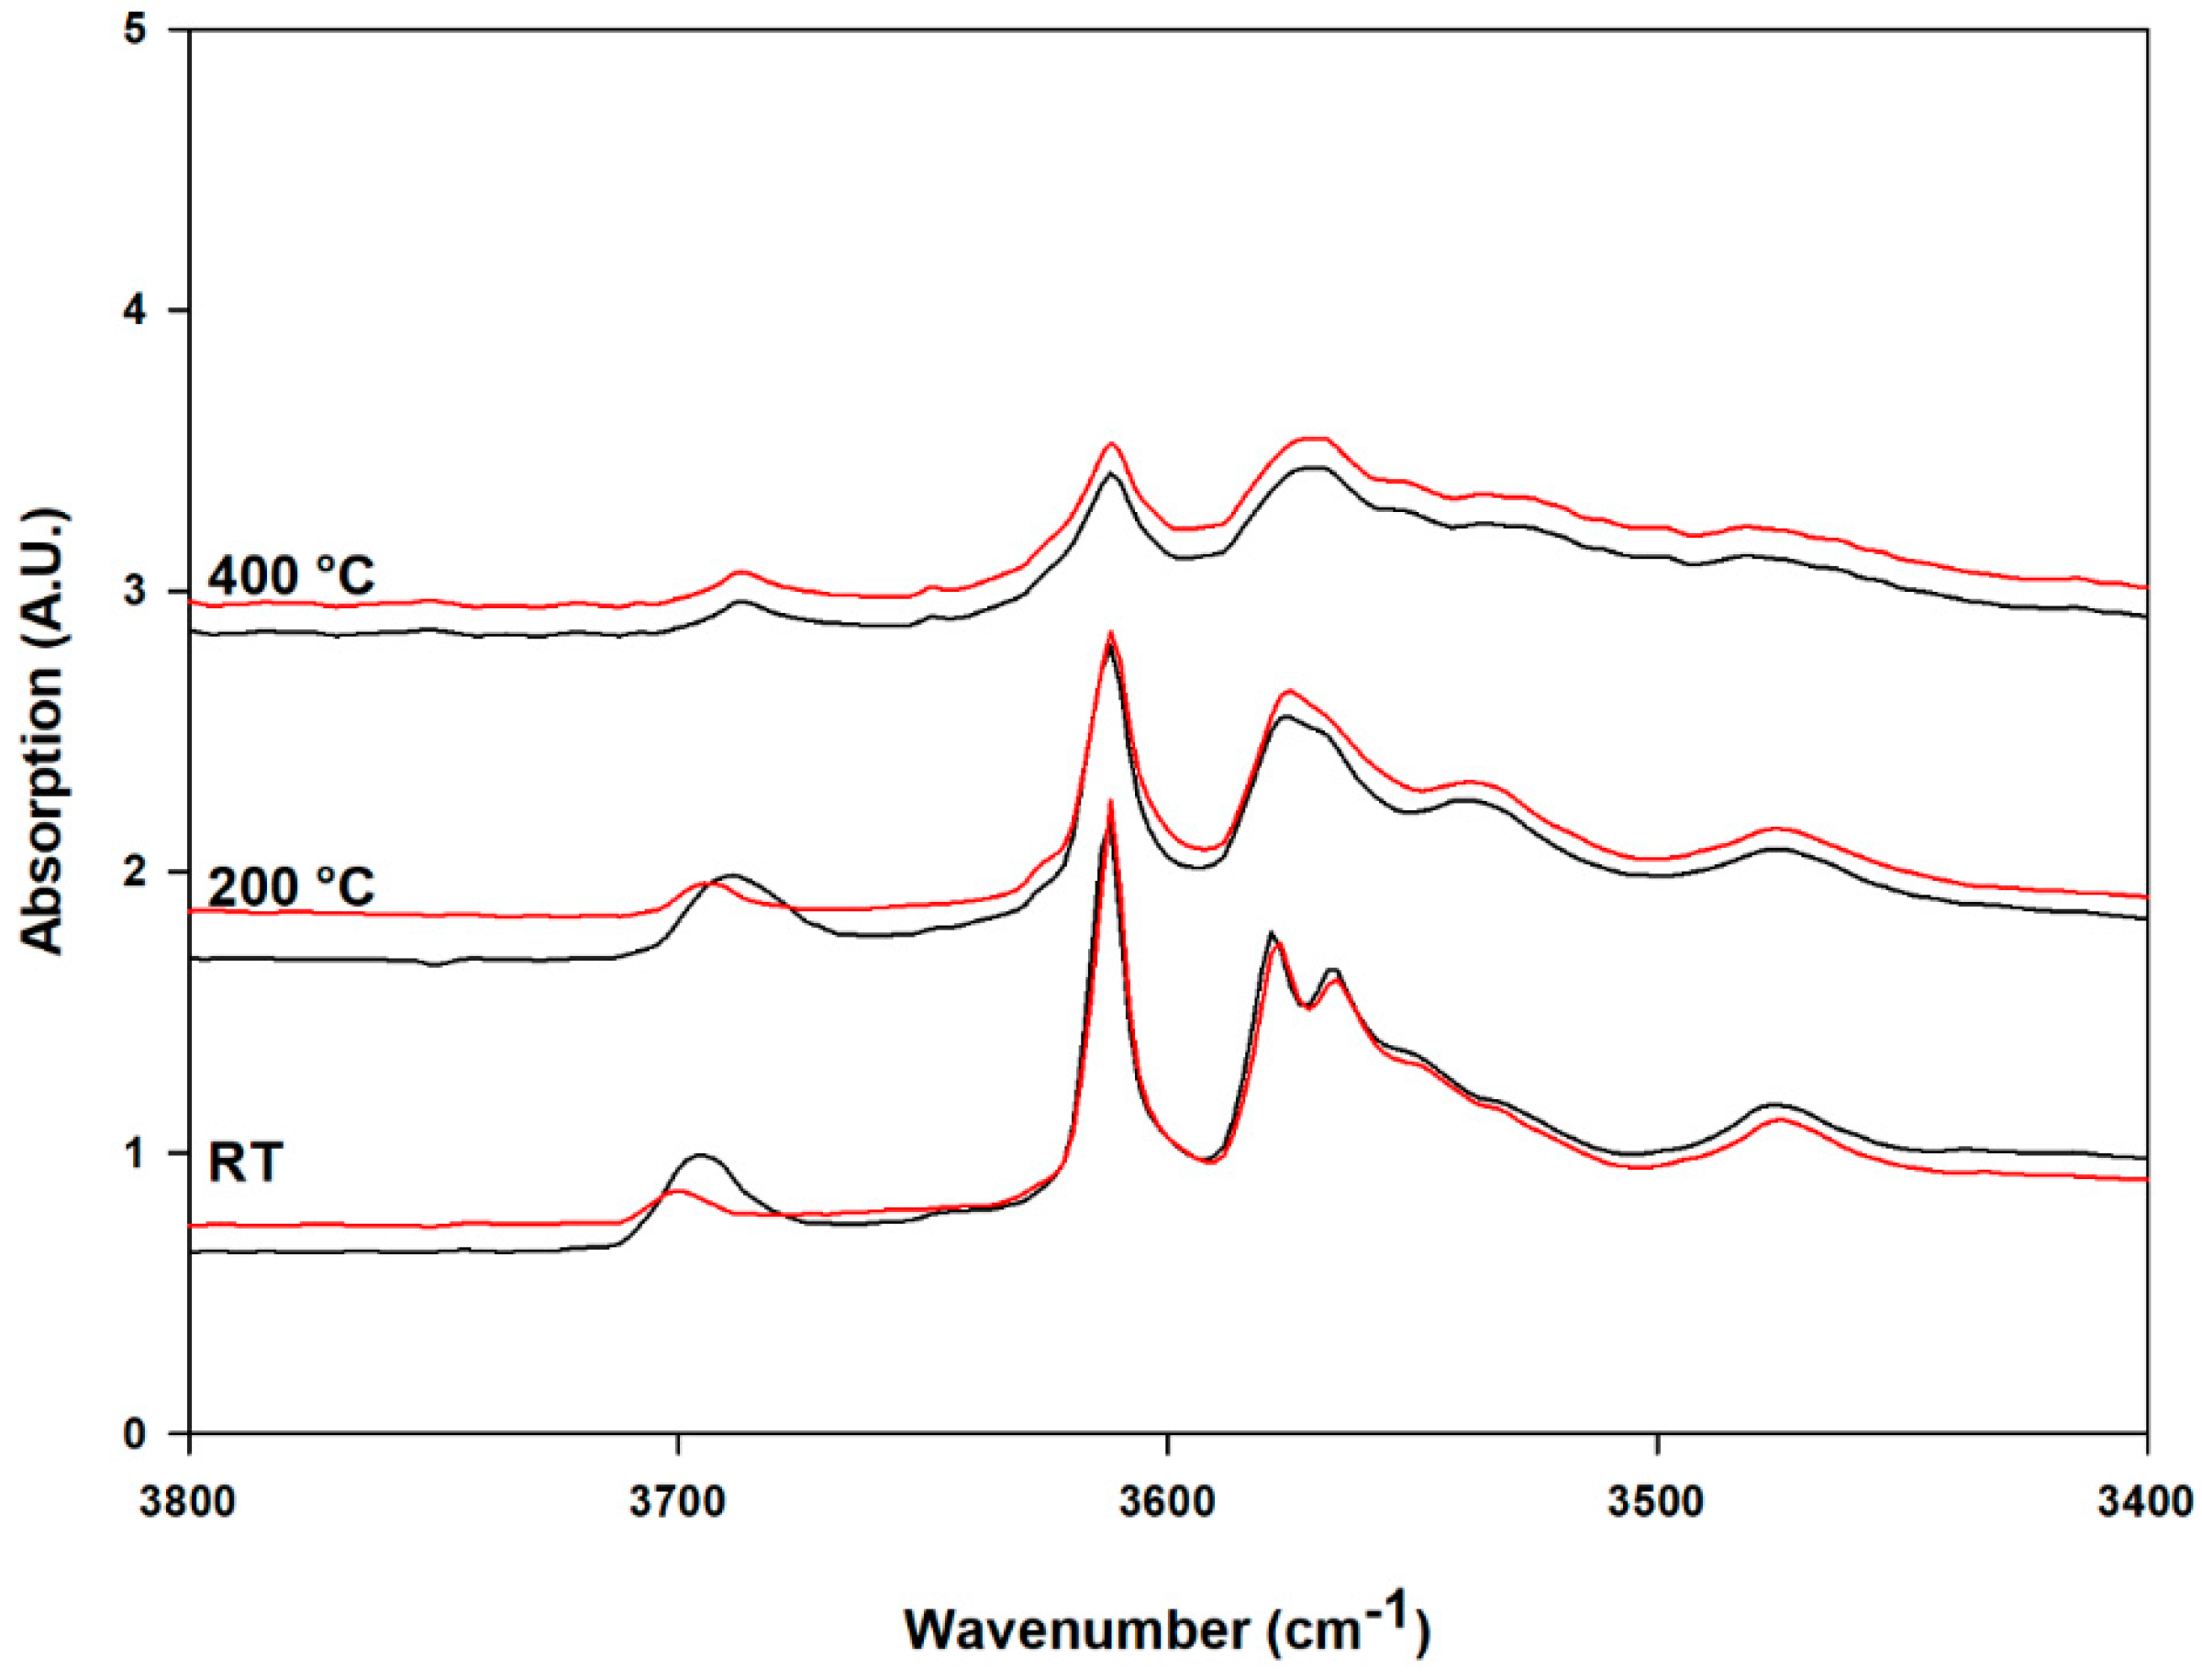
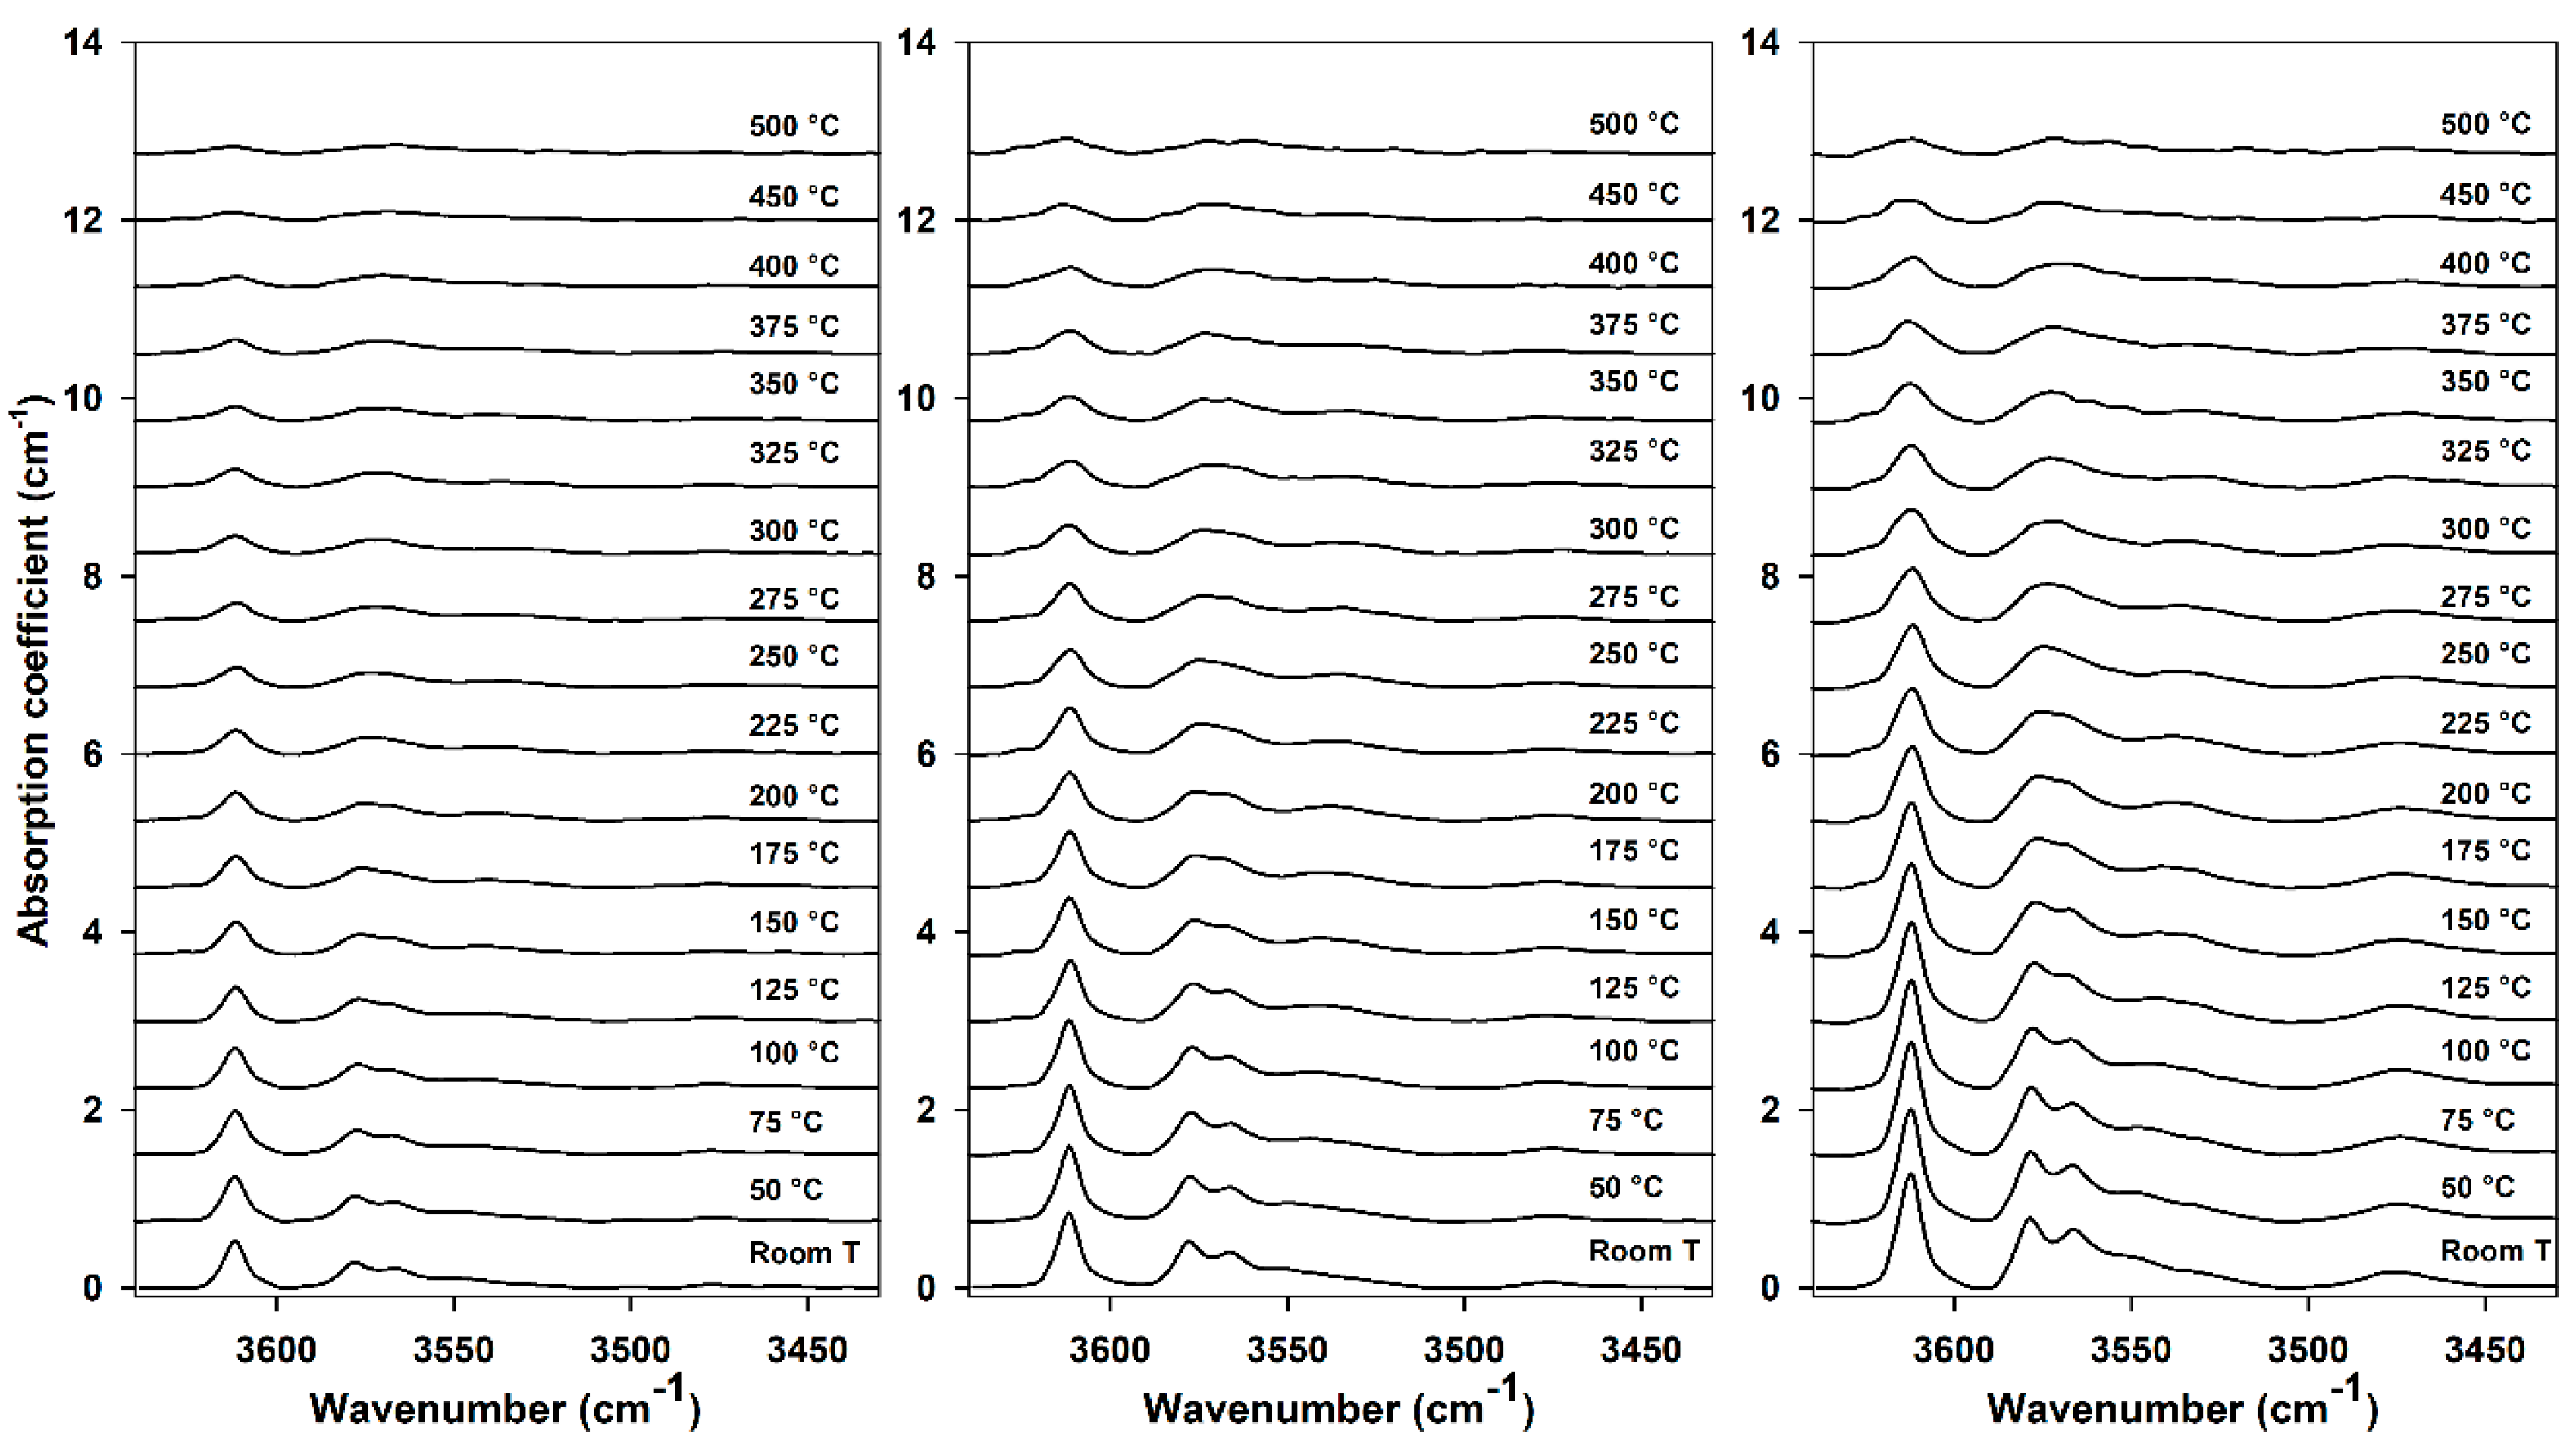
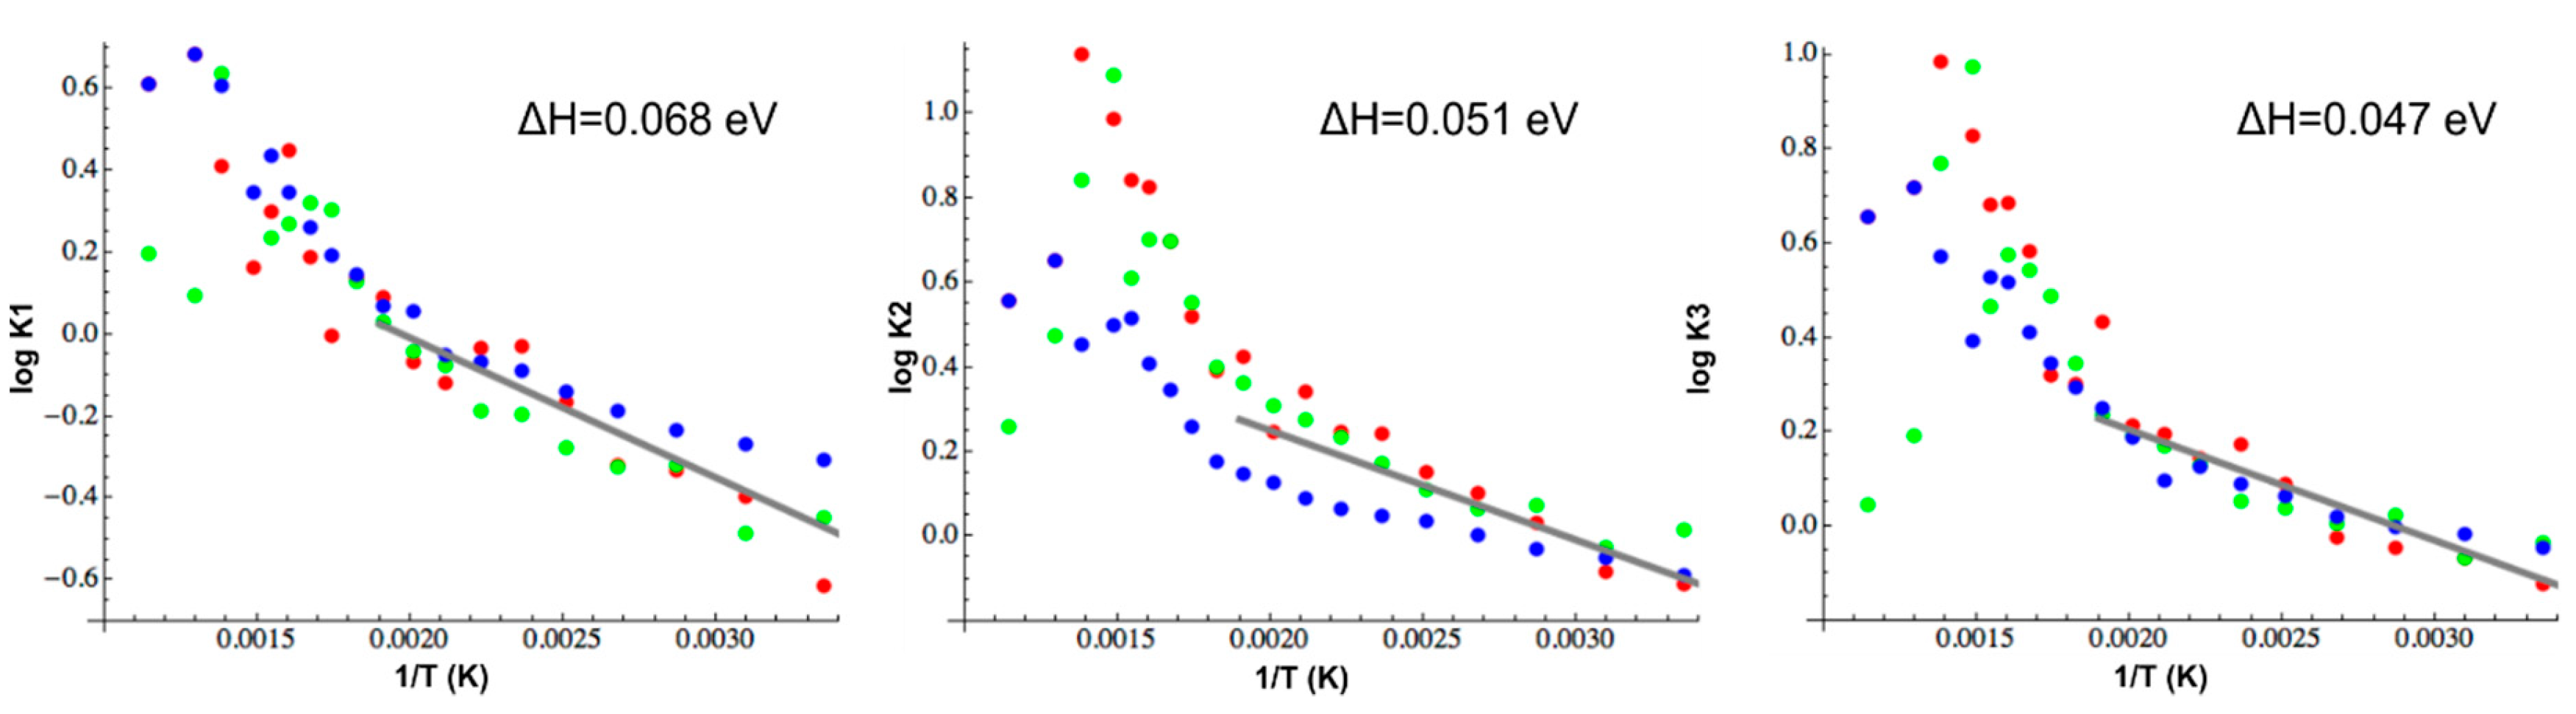
3.3. High-Temperature FTIR Analysis

Three samples were analyzed by FTIR spectroscopy at high temperature up to 500 °C. The main objective of these analyses was to observe the evolution of the OH stretching region of the FTIR spectra as a function of temperature. We acquired a series of FTIR spectra every 25 °C, with a heating rate of 20 °C/min, of samples H0203 (131 ppm), D1409 (194 ppm) and H2002 (508 ppm). Measurements were performed with 4 cm−1 resolution and 128 scans accumulated for each acquisition. The observed changes in the spectra as a function of temperature were observed to be completely reversible. A series of spectra were also acquired after reaching the maximum temperature of 500 °C during cooling at 400, 200, and 25 °C using the same acquisition conditions as the heating phase. Aside from the apparent dehydration reaction of brucite, where absorbance is significantly reduced for the peak near 3700 cm−1, the spectra at each temperature both during heating and cooling are nearly identical (Figure 6).
The deconvolution process started from the seven vibrational bands previously observed in the FTIR spectra acquired at room temperature in the frequency range 3400–3650 cm−1. They are centered at 3476 (peak 1), 3526 (peak 2), 3558 (peak 3), 3566 (peak 4), 3578 (peak 5), 3610 (peak 6), and 3612 cm−1 (peak 7). In order to analyze and evaluate the effect of temperature on each of the bands, each spectrum was decomposed using a fitting routine written with the Mathematica software, which includes a 3rd-order spline fitted baseline subtraction before curve fitting (example of baseline correction and deconvolution process is shown in Figure 7). Gaussian functions were used for all seven bands, with frequency, width, and amplitude as adjustable parameters. The fit quality was monitored through the Χ2 parameter measured for each spectrum.
The OH stretching region is characterized by several bands, probably due to the multiple types of H-bearing defect species present in our samples. It is important to observe the relative intensities of these bands and their evolution with temperature because relative variations of absorbance between different peaks could indicate potential equilibria between different chemical species or between different configurations of the same chemical species. Figure 8 shows the evolution of FTIR spectra of the samples H0203, D1409, and H2002 as a function of temperature, after baseline correction.
It is possible to subdivide the FTIR spectra into three regions, each of which is characterized by certain vibrational bands. A single band below 3500 cm−1, four vibrational bands in the frequency range 3500–3600 cm−1, and two vibrational bands between 3600–3650 cm−1. First, it is possible to observe a strong dependence of absolute intensities as a function of total water contents previously determined for each sample at room temperature. Secondly, we observe a continuous decrease in the total absorption of the entire OH stretching region as a function of temperature. Lastly, as confirmed by the results of our fitting, we observe a decrease in the relative intensity of the highest frequency bands (above 3600 cm−1) respect to those in the frequency range of 3500–3580 cm−1.
Figure 9 shows the evolution of frequency, FWHM and integrated absorption of the seven vibrational bands as a function of temperature for each of the samples examined.
In general, peak positions tend to shift toward lower frequencies, demonstrating typical anharmonic behavior. More specifically, at lower frequencies, peak 1 at 3476 cm−1 shows a slight shift towards higher frequencies, with a maximum displacement in the order of 8 cm−1. All bandwidths tend to increase, while the integrated intensity of each band demonstrates smooth variations as a function of temperature. Vibrational bands in the frequency range 3500–3600 cm−1 show a rather similar behavior in all the analyzed samples, generally moving towards higher frequencies. Peak 2 and peak 3 show major shifts, up to a maximum of 29 cm−1, whereas peak 4 and peak 5 show minor shifts, up to a maximum of 11 cm−1. The bandwidths of these peaks also appear to be more sensitive to temperature with respect to the other peaks. Above 3600 cm−1, peak 6 and peak 7 show the same trend, with maximum shifts up to a maximum of 7 cm−1. It is important to note that these two peaks tend to overlap, showing a decrease in the asymmetric shape of this feature with increasing temperature.

4. Discussion

The complexity of the OH stretching region in our infrared absorption spectra of hydrous forsterite can be rationalized by several factors: (1) hydrogen can be incorporated into the structure as different chemical species, such as 4HSi and 2HMg, (2) individual chemical species can have multiple topological configurations, (3) individual chemical species containing multiple H atoms can exhibit multiple bands in the OH stretching region, and (4) they are unpolarized spectra of a polycrystalline sample of orthorhombic symmetry.
The assignment of absorption peaks at frequencies greater than 3450 cm−1 has been the subject of some debate over recent years. Several studies [8,74,75,76] have argued that octahedral magnesium vacancies are mainly responsible for water incorporation in olivine and consequently generate the high wavenumber bands observed in the IR spectra of hydrous olivine. On the other hand, several studies [3,5,6,39,49,50] concluded that the higher wavenumber bands are associated with hydrogen in tetrahedral Si vacancies, based on experimental studies conducted over a range of silica activity. Computational studies [54,55,77] have also provided new insights regarding the stretching frequencies of OH groups in hydrous forsterite and olivine. More recently, using solid-state NMR spectroscopy and ab initio calculations, Xue et al. [58] found for hydrous forsterite synthesized at 12 GPa that hydrogen substitutes for silicon in its tetrahedral site and also observed a weak NMR feature interpreted to be associated with a hydrogen atom pointing away from the tetrahedron in a neighboring interstitial site, similar to a 4 H Si x configuration originally proposed by Umemoto et al. [55]. While our efforts to minimize the possible number of H-bearing defects using synthetic forsterite do not simplify the FTIR spectrum, the presence of multiple types of vacancies does not necessarily imply that they will all be filled to various degrees during the hydrogenation process. H-bearing defects in our samples are likely to be associated with Si vacancies rather than Mg vacancies based on the relatively high frequencies of peaks observed in our spectra. We also note that a slight excess of MgO present in our anhydrous forsterite starting material detected by powder diffraction also favors this interpretation as Si vacancies are likely to be significantly more abundant. Finally, previous studies by first-principles calculations have concluded that H incorporation into the tetrahedral vacancy is energetically more favorable with respect to filling an octahedral vacancy [52,53,78]. Eliminating the possibility of any H-bearing species at a Mg site facilitates any subsequent interpretation of the OH stretching region in our FTIR spectra.
Peaks at 3566, 3578 and 3612 cm−1 have been already observed in several previous studies of hydrogen incorporation in olivine single crystals [5,9,50,79,80], showing pleochroic behavior with the strongest absorption parallel to the a-axis. In this study, the integrated absorption measured allows us to assign them to one or more ( 4 H ) Si x species. The variations of relative intensities, especially in the high-frequency region, may be explained either by the increased stability of one or more other configurations of the same chemical species, but also to the increased stability of other chemical species. A recent study [81] of the evolution of OH bands as a function of temperature also assigned vibrational bands to specific OH groups in the olivine lattice. Peaks at low frequencies mostly involved the coupled motion of O3-H groups, while bands at higher frequencies mostly involved a weakly coupled motion of O1-H and O2-H groups.
Because we do not observe any new peaks appearing in the FTIR spectrum with increasing temperature it is likely that the same H-bearing defect species present at room temperature are also present at the highest temperatures of our experiments but in different proportions. For several peaks, their widths increase by about a factor of 2 between 25 and 500 °C owing to greater thermal disorder, but similar to integrated peak areas, these changes are continuous as a function of temperature (Figure 9). We can, therefore, envision a variety of different configurations of the same chemical species such as ( 4 H ) Si x in equilibrium, for which some configurations are stabilized and others destabilized as a function of temperature. In their DFT study, Umemoto et al. [55] proposed four possible hydrogarnet configurations, in which three hydrogen atoms are located along tetrahedral edges, and one-pointed outward towards octahedral or empty site, all having total energies within approximately 0.1 eV or less.
We can consider any peak observed in the FTIR spectrum to be representative of a particular defect configuration and its integrated area a relative measure of its concentration. It is clear that with increasing temperature the molar absorption coefficient of any individual peak is also likely to increase significantly as we observe a strong decrease in the total integrated absorbance of the spectrum, whereas the observed reversibility with temperature assures us that total H2O concentration remains constant. However, if we make the general assumption that the effect of temperature on molar absorptivity is equal at any frequency between 3400 and 3700 cm−1, we are then allowed to propose possible equilibrium expressions among defect configurations having the same chemical composition. For example, we observe an increase in the area ratio pk2:pk1 as a function of temperature, suggesting that Configuration R and Configuration P are in thermal equilibrium:
Conf .   R   Conf .   P
The equilibrium constant for this expression can be defined by the ratio of their activities
K eq = a P a R
which can be approximated by the ratio of their concentrations
K eq [ P ] [ R ]
which, according to the Beer-Lambert Law, can be determined by measured FTIR absorbances
K eq ε P A P ε R A R
Assuming that εPR is temperature independent, the slope of log K as a function of 1/T would be equal to the slope of log (AP/AR) vs. 1/T, which allows us to estimate its reaction enthalpy according to van’t Hoff’s equation. We carry out this exercise for several cases taken from the data obtained from the fitted FTIR spectra from all analyzed samples as illustrated in Figure 10.
In the low T regime (25–250 °C), the enthalpies of these reactions range between 0.047–0.068 eV (4.5–6.5 kJ/mol), lower in comparison to the activation enthalpy for electrical conductivity in hydrous olivine, which has been observed to range between 0.7–1.2 eV [25,27,82]. We do not expect that enthalpies of this magnitude are sufficient to break chemical bonds and allow diffusive transport, but instead are more indicative of configurational changes of existing defect species. We cannot rule out the possibility that the variations of relative intensities especially in the high-frequency region are not the result of shifting equilibria among different configurations of the fully protonated 4 H Si x defect, but also to the presence of other H-bearing defects with variable chemical composition. For example, in the higher T regime of the plots shown in Figure 10, we observe an increase in slope, which could suggest that some configurations are capable of undergoing chemical rather than configurational changes. Crépisson et al. [57] have investigated the minimum energy geometries of partially protonated silicon vacancies and suggested five possible geometries, each a product of 4 H Si x dissociation. In their most favorable 3 H Si configuration resulting from breaking the O1-H bond, OH stretching frequencies decreased with respect to those of the hydrogarnet species. Starting from a fully protonated silicon vacancy, such as any of the four hydrogarnet configurations proposed by Umemoto et al. [55], we hypothesize that this type of defect could be an important launching pad necessary for the release of a free proton to form the associate defect 3 H Si + H i , in which the interstitial proton may distance itself further from its host hydrogarnet site, leading to a partially protonated vacancy (Figure 11).
It is important to clarify the concept of an interstitial hydrogen. Since a proton has a negligible ionic radius, it is plausible that Hi does not occupy the same type of interstitial site that Si 4 + or Mg 2 + would in the same lattice. Instead, H i can be more simply described as a proton bonded to an oxygen that is not associated with a cation vacancy, such as that which bounds an occupied tetrahedral or octahedral site. Recent studies [56,81] have identified the most likely absorption bands in the OH stretching region related to hydrogen occupying an interstitial site. Based on the anharmonic behavior of weak features observed in their FTIR spectra of hydrous forsterite, Ingrin et al. [81] assigned bands near 3566 and 3617 cm−1 to H atoms located in interstitial sites.
Each of these aspects must be taken into consideration in order to fully understand the evolution of the FTIR OH stretching region in NAMs as a function of temperature. The changes in the spectra and above all the ascertained reversibility of the process have allowed us to establish how the various types of defects can be in balance with each other, a dynamic equilibrium that involves continuous readjustments due to the thermal motion of particles, all of which are strongly temperature-dependent.

5. Conclusions

This study presents the results of high-pressure and high-temperature experiments carried out at 1100 °C and up to 4 GPa of polycrystalline samples of synthetic Mg2SiO4. FTIR analyses at room temperature and up to 500 °C allow us to evaluate the evolution of FTIR spectra as a function of temperature, which can reveal potential equilibria among different hydrogen-bearing defect species. The total reversibility of the process after heating to 500 °C confirms that no water loss in our hydrous forsterite occurred during the high-temperature FTIR experiments. The seven vibrational bands identified in our study at high frequencies (>3450 cm−1) were assigned to OH stretching vibrations where hydrogen is incorporated into silicon tetrahedral vacancies. The absence of peaks below 3450 cm−1 allows us to conclude the absence of hydrogen residing in vacant Mg sites. The complexity of FTIR spectra and the evolution of their characteristics as a function of temperature and water content are most likely indicative of a hydrogarnet type 4 H Si x defect in different topological configurations. Absorption peaks at 3566, 3578, and 3612 cm−1 are strongest and, thus most likely to associated with the fully protonated 4 H Si x defect species. Changes in the relative intensities of OH stretching bands observed may be explained either by (1) the increased stability of one or more other configurations of the same 4 H Si x chemical species or (2) the dissociation process of the 4 H Si x species into other chemically distinct defect species. We propose that the majority 4 H Si x defect may indeed dissociate at elevated temperature to form a 3 H Si species and a proton occupying an adjacent interstitial site, bonded to an oxygen associated with an occupied cationic site. However, the evolution of FTIR spectra as a function of temperature up to 500 °C mainly involves the continuous shifting of low enthalpy equilibria unlikely to liberate many protons from the highly stable hydrogarnet species. If partially protonated defects are present at these temperatures, they are not likely to be abundant compared to the 4 H Si x species that dominate the OH stretching region of the vibrational spectrum. Unfortunately, above 500 °C FTIR absorbances are too weak to provide any quantitative information regarding equilibria among H-bearing defects in forsterite. A careful study of the electrical conductivity of hydrous forsterite or olivine over the same temperature interval may provide some additional insights. It is important to note that the chemical environment in experimental studies plays a key role in defect chemistry at high-pressure and high-temperature, particularly for nominally anhydrous minerals such as forsterite and olivine. A more complete understanding of H2O incorporation can be achieved by the high-precision, accuracy, and attention required in experimental studies and development of increasingly more sophisticated techniques that benefit the study of the physical–chemical characteristics of mantle minerals at depth, with attention to the roles of H2O and other volatile components.

Author Contributions

Conceptualization, A.D.V. and B.T.P.; Formal analysis, A.D.V. and B.T.P.; Investigation A.D.V., B.T.P., V.M., M.C.G.; Methodology A.D.V., B.T.P., V.M., M.C.G.; Visualization, A.D.V. and B.T.P.; Writing—original draft A.D.V.; Writing—review and editing A.D.V and B.T.P.

Funding

This research received no external funding.

Acknowledgments

We are grateful to Claudia Romano of the EVPLab—Department of Sciences—University Roma 3 (Rome, Italy) for the use of the Raman spectrometer and to Giancarlo Della Ventura of the University Roma Tre (Rome, Italy) for the use of Linkam FTIR600 device.

Conflicts of Interest

The authors declare no conflict of interest.

References

  1. Bai, Q.; Kohlstedt, D. Effects of chemical environment on the solubility and incorporation mechanism for hydrogen in olivine. Phys. Chem. Miner. 1993, 19, 460–471. [Google Scholar] [CrossRef]
  2. Libowitzky, E.; Beran, A. OH defects in forsterite. Phys. Chem. Miner. 1995, 22, 387–392. [Google Scholar] [CrossRef]
  3. O’Neill, H.S.C.; Matveev, S.; Ballhaus, C.; Taylor, W.R.; Green, D.H. Effect of Silica Activity on OH- IR Spectra of Olivine: Implications for Low-aSiO2 Mantle Metasomatism. J. Pet. 2001, 42, 721–729. [Google Scholar]
  4. Matveev, S.; Portnyagin, M.; Ballhaus, C.; Brooker, R.; Geiger, C.A. FTIR Spectrum of Phenocryst Olivine as an Indicator of Silica Saturation in Magmas. J. Petrol. 2005, 46, 603–614. [Google Scholar] [CrossRef]
  5. Lemaire, C.; Kohn, S.C.; Brooker, R.A. The effect of silica activity on the incorporation mechanisms of water in synthetic forsterite: A polarized infrared spectroscopic study. Contr. Mineral. Petrol. 2004, 147, 48–57. [Google Scholar]
  6. Berry, A.J.; Hermann, J.; O’Neill, H.S.; Foran, G.J.; Hermann, J. Fingerprinting the water site in mantle olivine. Geology 2005, 33, 869. [Google Scholar] [CrossRef]
  7. Kudoh, Y.; Kuribayashi, T.; Kagi, H.; Inoue, T. Cation vacancy and possible hydrogen positions in hydrous forsterite, Mg1.985Si0.993H0.06O4, synthesized at 13.5 GPa and 1300 °C. J. Miner. Pet. Sci. 2006, 101, 265–269. [Google Scholar] [CrossRef]
  8. Deligne, N.I.; Mosenfelder, J.L.; Asimow, P.D.; Rossman, G.R. Hydrogen incorporation in olivine from 2–12 GPa. Am. Miner. 2006, 91, 285–294. [Google Scholar]
  9. Koch-Müller, M.; Matsyuk, S.S.; Rhede, D.; Wirth, R.; Khisina, N. Hydroxyl in mantle olivine xenocrysts from the Udachnaya kimberlite pipe. Phys. Chem. Miner. 2006, 33, 276–287. [Google Scholar] [CrossRef]
  10. Pearson, D.G.; Brenker, F.E.; Nestola, F.; McNeill, J.; Nasdala, L.; Hutchison, M.T.; Matveev, S.; Mather, K.; Silversmit, G.; Schmitz, S.; et al. Hydrous mantle transition zone indicated by ringwoodite included within diamond. Nature 2014, 507, 221–224. [Google Scholar] [CrossRef]
  11. Chopra, P.N.; Paterson, M.S. The role of water in the deformation of dunite. J. Geophys. Res. Space Phys. 1984, 89, 7861–7876. [Google Scholar] [CrossRef]
  12. Mackwell, S.J.; Kohlstedt, D.L.; Paterson, M.S. The role of water in the deformation of olivine single crystals. J. Geophys. Res. Space Phys. 1985, 90, 11319. [Google Scholar] [CrossRef]
  13. Mackwell, S.J.; Dimos, D.; Kohlstedt, D.L.; Mackwell, S. Transient creep of olivine: Point-defect relaxation times. Philos. Mag. A 1988, 57, 779–789. [Google Scholar] [CrossRef]
  14. Mackwell, S.J.; Kohlstedt, D.L. Diffusion of hydrogen in olivine: Implications for water in the mantle. J. Geophys. Res. Space Phys. 1990, 95, 5079. [Google Scholar] [CrossRef]
  15. Karato, S.-I.; Paterson, M.S.; Fitzgerald, J.D. Rheology of synthetic olivine aggregates: Influence of grain size and water. J. Geophys. Res. Space Phys. 1986, 91, 8151. [Google Scholar] [CrossRef]
  16. Arndt, N.; Ginibre, C.; Chauvel, C.; Albarède, F.; Cheadle, M.; Herzberg, C.; Jenner, G.; Lahaye, Y. Were komatiites wet? Geology 1998, 26, 739–742. [Google Scholar] [CrossRef]
  17. Gaetani, G.A.; Grove, T.L. The influence of water on melting of mantle peridotite. Contrib. Miner. Pet. 1998, 131, 323–346. [Google Scholar] [CrossRef]
  18. Inoue, T. Effect of water on melting phase relations and melt composition in the system Mg2SiO4 MgSiO3 H2O up to 15 GPa. Phys. Earth Planet. Inter. 1994, 85, 237–263. [Google Scholar] [CrossRef]
  19. Hirth, G.; Kohlstedt, D.L. Water in the oceanic upper mantle: Implications for rheology, melt extraction and the evolution of the lithosphere. Earth Planet. Sci. Lett. 1996, 144, 93–108. [Google Scholar] [CrossRef]
  20. Karato, S.-I.; Jung, H. Water, partial melting and the origin of the seismic low velocity and high attenuation zone in the upper mantle. Earth Planet. Sci. Lett. 1998, 157, 193–207. [Google Scholar] [CrossRef]
  21. Karato, S. The role of hydrogen in the electrical conductivity of the upper mantle. Nature 1990, 347, 272–273. [Google Scholar] [CrossRef]
  22. Hirsch, L.M.; Shankland, T.J.; Duba, A.G. Electrical Conduction and Polaron Mobility In Fe-Bearing Olivine. Geophys. J. Int. 1993, 114, 36–44. [Google Scholar] [CrossRef] [Green Version]
  23. Xu, Y.; Poe, B.T.; Shankland, T.J.; Rubie, D.C. Electrical Conductivity of Olivine, Wadsleyite, and Ringwoodite Under Upper-Mantle Conditions. Science 1998, 280, 1415–1418. [Google Scholar] [CrossRef]
  24. Du Frane, W.L.; Roberts, J.J.; Toffelmier, D.A.; Tyburczy, J.A. Anisotropy of electrical conductivity in dry olivine. Geophys. Res. Lett. 2005, 32, 32. [Google Scholar] [CrossRef]
  25. Wang, D.; Mookherjee, M.; Xu, Y.; Karato, S.-I. The effect of water on the electrical conductivity of olivine. Nature 2006, 443, 977–980. [Google Scholar] [CrossRef]
  26. Yoshino, T.; Matsuzaki, T.; Yamashita, S.; Katsura, T. Hydrous olivine unable to account for conductivity anomaly at the top of the astenosphere. Lett. Nat. 2006, 443, 973. [Google Scholar] [CrossRef]
  27. Poe, B.T.; Romano, C.; Nestola, F.; Smyth, J.R. Electrical conductivity anisotropy of dry and hydrous olivine at 8GPa. Phys. Earth Planet. Inter. 2010, 181, 103–111. [Google Scholar] [CrossRef] [Green Version]
  28. Du Frane, W.L.; Tyburczy, J.A. Deuterium-hydrogen exchange in olivine: Implications for point defects and electrical conductivity. Geochem. Geophys. Geosystems 2012, 13, 3. [Google Scholar] [CrossRef]
  29. Novella, D.; Dolejš, D.; Myhill, R.; Pamato, M.G.; Manthilake, G.; Frost, D.J. Melting phase relations in the systems Mg2SiO4–H2O and MgSiO3–H2O and the formation of hydrous melts in the upper mantle. Geochim. et Cosmochim. Acta 2017, 204, 68–82. [Google Scholar] [CrossRef]
  30. Bell, D.R.; Rossman, G.R. Water in the earth’s mantle: The role of nominally anhydrous minerals. Science 1992, 255, 1391–1397. [Google Scholar] [CrossRef]
  31. Thompson, A.B. Water in the Earth’s upper mantle. Nature 1992, 358, 295–302. [Google Scholar] [CrossRef]
  32. Grant, K.; Ingrin, J.; Lorand, J.P.; Dumas, P. Water partitioning between mantle minerals from peridotite xenoliths. Contrib. Miner. Pet. 2007, 154, 15–34. [Google Scholar] [CrossRef]
  33. Demouchy, S.; Mackwell, S. Mechanisms of hydrogen incorporation and diffusion in iron-bearing olivine. Phys. Chem. Miner. 2006, 33, 347–355. [Google Scholar] [CrossRef]
  34. Peslier, A.H.; Woodland, A.B.; Wolff, J.A. Fast kimberlite ascent rates estimated from hydrogen diffusion profiles in xenolithic mantle olivines from southern Africa. Geochim. et Cosmochim. Acta 2008, 72, 2711–2722. [Google Scholar] [CrossRef]
  35. Demouchy, S.; Bolfan-Casanova, N. Distribution and transport of hydrogen in the lithospheric mantle: A review. Lithos 2016, 240–243, 402–425. [Google Scholar] [CrossRef]
  36. Stalder, R.; Skogby, H. Hydrogen diffusion in natural and synthetic orthopyroxene. Phys. Chem. Miner. 2003, 30, 12–19. [Google Scholar] [CrossRef]
  37. Huang, X.; Xu, Y.; Karato, S.-I. Water content in the transition zone from electrical conductivity of wadsleyite and ringwoodite. Nature 2005, 434, 746–749. [Google Scholar] [CrossRef]
  38. Hae, R.; Ohtani, E.; Kubo, T.; Koyama, T.; Utada, H. Hydrogen diffusivity in wadsleyite and water distribution in the mantle transition zone. Earth Planet. Sci. Lett. 2006, 243, 141–148. [Google Scholar] [CrossRef]
  39. Berry, A.J.; O’Neill, H.S.; Hermann, J.; Scott, D.R.; Hermann, J. The infrared signature of water associated with trivalent cations in olivine. Earth Planet. Sci. Lett. 2007, 261, 134–142. [Google Scholar] [CrossRef]
  40. Hushur, A.; Manghnani, M.H.; Smyth, J.R.; Nestola, F.; Frost, D.J. Crystal chemistry of hydrous forsterite and its vibrational properties up to 41 GPa. Am. Miner. 2009, 94, 751–760. [Google Scholar] [CrossRef]
  41. Ringwood, A.E.; Major, A. High-pressure reconnaissance investigations in the system Mg2SiO4–MgO–H2O. Earth Planet. Sci. Lett. 1967, 2, 130–133. [Google Scholar]
  42. Ohtani, E.; Toma, M.; Litasov, K.; Kubo, T.; Suzuki, A. Stability of dense hydrous magnesium silicate phases and water storage capacity in the transition zone and lower mantle. Phys. Earth Planet. Inter. 2001, 124, 105–117. [Google Scholar] [CrossRef]
  43. Kohlstedt, D.L.; Keppler, H.; Rubie, D.C. Solubility of water in the α, β and γ phases of (Mg,Fe)2SiO4. Contrib. Miner. Pet. 1996, 123, 345–357. [Google Scholar] [CrossRef]
  44. Bolfan-Casanova, N. Water in the Earth’s mantle. Mineral. Mag. 2005, 69, 229–257. [Google Scholar] [CrossRef]
  45. Beran, A.; Libowitzky, E. Water in natural mantle minerals II: Olivine, garnet and accessory minerals. Rev. Mineral. Geochem. 2005, 62, 169–191. [Google Scholar] [CrossRef]
  46. Tenner, T.J.; Hirschmann, M.M.; Withers, A.C.; Hervig, R.L. Hydrogen partitioning between nominally anhydrous upper mantle minerals and melt between 3 and 5 GPa and applications to hydrous peridotite partial melting. Chem. Geol. 2009, 262, 42–56. [Google Scholar] [CrossRef]
  47. Ferot, A.; Bolfan-Casanova, N. Water storage capacity in olivine and pyroxene to 14 GPa: Implications for the water content of the Earth’s upper mantle and nature of seismic discontinuities. Earth Planet. Sci. Lett. 2012, 349–350, 218–230. [Google Scholar] [CrossRef]
  48. Matsyuk, S.S.; Langer, K. Hydroxyl in olivines from mantle xenoliths in kimberlites of the Siberian platform. Contrib. Miner. Pet. 2004, 147, 413–437. [Google Scholar] [CrossRef]
  49. Walker, A.M.; Hermann, J.; Berry, A.J.; O’Neill, H.S.C.; Walker, A.; Berry, A. Three water sites in upper mantle olivine and the role of titanium in the water weakening mechanism. J. Geophys. Res. Space Phys. 2007, 112, 112. [Google Scholar] [CrossRef]
  50. O’Neill, H.S.; Hermann, J.; Hauri, E.H.; Kovács, I.; O’Neill, H.S. Site-specific infrared O-H absorption coefficients for water substitution into olivine. Am. Miner. 2010, 95, 292–299. [Google Scholar]
  51. Brodholt, J.P.; Refson, K. An ab initio study of hydrogen in forsterite and a possible mechanism for hydrolytic weakening. J. Geophys. Res. Space Phys. 2000, 105, 18977–18982. [Google Scholar] [CrossRef]
  52. Braithwaite, J.S.; Wright, K.; Catlow, C.R.A. A theoretical study of the energetics and IR frequencies of hydroxyl defects in forsterite. J. Geophys. Res. Space Phys. 2003, 108, 2284. [Google Scholar] [CrossRef]
  53. Verma, A.K.; Karki, B.B. Ab initio investigations of native and protonic point defects in Mg2SiO4 polymorphs under high pressure. Earth Planet. Sci. Lett. 2009, 285, 140–149. [Google Scholar] [CrossRef]
  54. Balan, E.; Ingrin, J.; Delattre, S.; Kovács, I.; Blanchard, M. Theoretical infrared spectrum of OH-defects in forsterite. Eur. J. Miner. 2011, 23, 285–292. [Google Scholar] [CrossRef]
  55. Umemoto, K.; Wentzcovitch, R.M.; Hirschmann, M.M.; Kohlstedt, D.L.; Withers, A.C. A first-principles investigation of hydrous defects and IR frequencies in forsterite: The case for Si vacancies. Am. Miner. 2011, 96, 1475–1479. [Google Scholar] [CrossRef]
  56. Balan, E.; Blanchard, M.; Lazzeri, M.; Ingrin, J. Contribution of interstitial OH groups to the incorporation of water in forsterite. Phys. Chem. Miner. 2014, 41, 105–114. [Google Scholar] [CrossRef]
  57. Crépisson, C.; Bureau, H.; Blanchard, M.; Ingrin, J.; Balan, E. Theoretical infrared spectrum of partially protonated cationic vacancies in forsterite. Eur. J. Miner. 2014, 26, 203–210. [Google Scholar] [CrossRef]
  58. Xue, X.; Turner, D.; Loroch, D.; Kanzaki, M. Hydrogen incorporation mechanisms in forsterite: New insights from 1 H and 29 Si NMR spectroscopy and first-principles calculation. Am. Miner. 2017, 102, 519–536. [Google Scholar] [CrossRef]
  59. Tavangarian, F.; Emadi, R. Synthesis of pure nanocrystalline magnesium silicate powder. Ceramics 2010, 54, 122–127. [Google Scholar]
  60. Tavangarian, F.; Emadi, R. Mechanochemical synthesis of single phase nanocrystalline forsterite powder. Int. J. Mod. Phys. B 2010, 24, 343–350. [Google Scholar] [CrossRef]
  61. Chopelas, A. Single crystal Raman spectra of forsterite, fayalite and monticellite. Am. Mineral. 1991, 76, 1101–1109. [Google Scholar]
  62. Kolesov, B.A.; Geiger, C.A. A Raman spectroscopic study of Fe-Mg olivines. Phys. Chem. Miner. 2004, 31, 142–154. [Google Scholar] [CrossRef]
  63. McKeown, D.A.; Bell, M.I.; Caracas, R. Theoretical determination of the Raman spectra of single-crystal forsterite (Mg2SiO4). Am. Mineral. 2010, 95, 980–986. [Google Scholar] [CrossRef]
  64. Bolfan-Casanova, N.; Montagnac, G.; Reynard, B. Measurement of water contents in olivine using Raman spectroscopy. Am. Miner. 2014, 99, 149–156. [Google Scholar] [CrossRef]
  65. Joachim, B.; Wohlers, A.; Norberg, N.; Gardes, E.; Petrishcheva, E.; Abart, R. Diffusion and solubility of hydrogen and water in periclase. Phys. Chem. Miner. 2013, 40, 19–27. [Google Scholar] [CrossRef]
  66. Shinoda, K.; Yamakata, M.; Nanba, T.; Kimura, H.; Moriwaki, T.; Kondo, Y.; Kawamoto, T.; Niimi, N.; Miyoshi, N.; Aikawa, N. High-pressure phase transition and behavior of protons in brucite Mg(OH)2: A high-pressure-temperature study using IR synchrotron radiation. Phys. Chem. Miner. 2002, 29, 396–402. [Google Scholar] [CrossRef]
  67. Frost, R.L.; Kloprogge, J. Infrared emission spectroscopic study of brucite. Spectrochim. Acta Part A: Mol. Biomol. Spectrosc. 1999, 55, 2195–2205. [Google Scholar] [CrossRef]
  68. Paterson, M.S. The determination of hydroxyl by infrared absorption in quartz, silicate glasses and similar materials. Bull. Minéral 1982, 105, 20–29. [Google Scholar]
  69. Withers, A.C.; Bureau, H.; Raepsaet, C.; Hirschmann, M.M. Calibration of infrared spectroscopy by elastic recoil detection analysis of H in synthetic olivine. Chem. Geol. 2012, 334, 92–98. [Google Scholar] [CrossRef]
  70. Bolfan-Casanova, N.; Keppler, H.; Rubie, D.C. Water partitioning between nominally anhydrous minerals in the MgO-SiO2-H2O system up to 24 GPa: Implications for the distribution of water in the Earth’s mantle. Earth Planet. Sci. Lett. 2000, 182, 209–221. [Google Scholar]
  71. Libowitzky, E.; Rossman, G. Principles of quantitative absorbance measurements in anisotropic crystals. Phys. Chem. Miner. 1996, 23, 319–327. [Google Scholar] [CrossRef]
  72. Bell, D.R. Hydroxide in olivine: A quantitative determination of the absolute amount and calibration of the IR spectrum. J. Geophys. Res. Space Phys. 2003, 108, 2105–2113. [Google Scholar] [CrossRef]
  73. Mei, S.; Kohlstedt, D.L. Influence of water on plastic deformation of olivine aggregates: 1. Diffusion creep regime. J. Geophys. Res. Space Phys. 2000, 105, 21457–21469. [Google Scholar] [CrossRef]
  74. Zhao, Y.-H.; Ginsberg, S.B.; Kohlstedt, D.L. Solubility of hydrogen in olivine: Dependence on temperature and iron content. Contrib. Miner. Pet. 2004, 147, 155–161. [Google Scholar] [CrossRef]
  75. Bali, E.; Bolfan-Casanova, N.; Koga, K.T. Pressure and temperature dependence of H solubility in forsterite: An implication to water activity in the Earth interior. Earth Planet. Sci. Lett. 2008, 268, 354–363. [Google Scholar] [CrossRef]
  76. Otsuka, K.; Karato, S.-I. Control of the water fugacity at high pressures and temperatures: Applications to the incorporation mechanisms of water in olivine. Phys. Earth Planet. Inter. 2011, 189, 27–33. [Google Scholar] [CrossRef]
  77. Withers, A.C.; Blanchard, M.; Ingrin, J.; Balan, E.; Kovács, I. Effect of iron and trivalent cations on OH defects in olivine. Am. Miner. 2017, 102, 302–311. [Google Scholar]
  78. Walker, A.M.; Demouchy, S.; Wright, K. Computer modelling of the energies and vibrational properties of hydroxyl groups in a and b-Mg2SiO4. Eur. J. Mineral. 2006, 18, 529–543. [Google Scholar] [CrossRef]
  79. Smyth, J.R.; Frost, D.J.; Nestola, F.; Holl, C.M.; Bromiley, G.; Frost, D. Olivine hydration in the deep upper mantle: Effects of temperature and silica activity. Geophys. Res. Lett. 2006, 33, 33. [Google Scholar] [CrossRef]
  80. Tollan, P.M.E.; Smith, R.; O’Neill, H.S.; Hermann, J. The responses of the four main substitution mechanisms of H in olivine to H2O activity at 1050 °C and 3 GPa. Prog. Earth Planet. Sci. 2017, 4, 200. [Google Scholar] [CrossRef]
  81. Ingrin, J.; Liu, J.; Depecker, C.; Kohn, S.C.; Balan, E.; Grant, K.J. Low-temperature evolution of OH bands in synthetic forsterite, implication for the nature of H defects at high pressure. Phys. Chem. Miner. 2013, 40, 499–510. [Google Scholar] [CrossRef]
  82. Yoshino, T.; Matsuzaki, T.; Shatskiy, A.; Katsura, T. The effect of water on the electrical conductivity of olivine aggregates and its implications for the electrical structure of the upper mantle. Earth Planet. Sci. Lett. 2009, 288, 291–300. [Google Scholar] [CrossRef]
Figure 1. XRPD spectra of (a) synthetic forsterite in this study, (b) synthetic forsterite (from Hideki Kanazawa, University of Tokyo, Japan, RRUFF ID #R040052), (c) talc, and (d) hydromagnesite. Dotted red circle in sample (a) indicates peak position of periclase.
Minerals 09 00574 g001
Figure 2. Raman spectrum of synthetic forsterite with bands centered at 824, 856, 882, 919, and 965 cm−1.
Minerals 09 00574 g002
Figure 3. SEM images of (a) synthetic forsterite powder before high-pressure and high-temperature synthesis, (b) sample H0203 synthesized at 1.5 GPa and 1100 °C, and (c) sample H2002 synthesized at 4 GPa and 1100 °C. White scale bar is 5 µm.
Minerals 09 00574 g003
Figure 4. FPA image of the sample. Color scale indicates the amount of the total integrated area in the OH stretching region, showing an equal distribution throughout the sample area.
Minerals 09 00574 g004
Figure 5. FTIR spectra of samples of hydrous forsterite. Nine peaks are centered at 3478, 3535, 3550, 3565, 3578, 3605, 3612, 3693, and 3699 cm−1.
Minerals 09 00574 g005
Figure 6. Raw spectra of sample H2002 at Room Temperature, 200 °C and 400 °C during heating (black) and cooling (red) process.
Minerals 09 00574 g006
Figure 7. Example of background correction and deconvolution process for spectrum H2002 at 25 °C. Blue dotted lines are experimental data, red continuous line represents the accumulation fit and green continuous lines are the identified peaks.
Minerals 09 00574 g007
Figure 8. Evolution of FTIR spectra of sample H0203 (left), D1409 (center), and H2002 (right) as a function of temperature up to 500 °C.
Minerals 09 00574 g008
Figure 9. Evolution of frequency, FWHM and integrated absorption with temperature: (a) H0203 sample with 131 ppm wt, (b) D1409 with 194 ppm wt, and (c) H2002 sample with 508 ppm wt water content.
Minerals 09 00574 g009
Figure 10. Equilibrium expression of different equilibria configurations based on the relative integrated intensity variations of peaks as a function of reciprocal temperature in sample H0203 (red points), D1409 (green points) and H2002 (blue points). For the K1 case, we considered pk7 vs. pk1, for K2 pk7 vs. pk5 and for K3 pk7 vs. pk 6.
Minerals 09 00574 g010
Figure 11. Possible configuration of coexistence of 4 H Si x (Conf 1 Umemoto) and 3 H Si + H i (this study) in forsterite lattice. Hydrogen atom in interstitial position (indicated by black arrow) is located above the octahedral site along the crystallographic axis (Red, blue, orange and grey spheres identify, respectively, oxygen, silicon, magnesium and hydrogen atoms. Dotted blue circles indicate Si vacancy, while the dotted gray circle indicates the position of hydrogen in Umemoto’s most stable 4 H Si x configuration.
Minerals 09 00574 g011
Table 1. Experimental conditions and total water concentrations in this study (1 Device/temperature (°C)/pressure (GPa)/equilibrium time (min) with PC = piston-cylinder MA = multianvil, 2 average value between several spectra acquired from the same sample. Standard deviation in brackets).
SampleStarting MaterialExperimental Conditions 1Water Content (ppm wt H2O) 2
H0203forst + ~10 µL H2OPC/1100/1.5/90131 (5)
D1707forst + ~10 µL H2OPC/1100/1.5/120188 (7)
D1409forst + ~20 µL H2OPC/1100/1.5/180194 (10)
H0303forst + ~20 µL H2OPC/1100/1.5/180239 (6)
H1902forst + ~10 µL H2OMA/1100/4.0/300465 (40)
H2002forst + ~10 µL H2OMA/1100/4.0/300508 (10)

