Article

Microstructure and Minerals Evolution of Iron Ore Sinter: Influence of SiO2 and Al2O3

School of Minerals Processing and Bioengineering, Central South University, No.932, South Lushan Road, Changsha 410083, China
*
Author to whom correspondence should be addressed.
Minerals 2019, 9(7), 449; https://doi.org/10.3390/min9070449
Submission received: 17 June 2019 / Revised: 16 July 2019 / Accepted: 17 July 2019 / Published: 19 July 2019
(This article belongs to the Special Issue Mineralogy of Iron Ore Sinters)

Abstract

:
SiO2 and Al2O3 are two important minerals that can affect the mechanical and metallurgical properties of sinter. This investigation systematically studied the influences of these minerals and revealed their functional mechanisms on sinter quality. Results showed that with an increasing Al2O3 content in sinter, the sintering indexes presented an improvement before the content exceeded 1.80%, while the quality decreased obviously after the content exceeded 1.80%. With an increasing SiO2 content, the sinter quality presented a decreasing tendency, especially when the content exceeded 4.80%. Consequently, the optimal content of Al2O3 was ≤1.80% and that of SiO2 was ≤4.80%. The evolution of the microstructure and minerals in sinter showed that enhancing the Al2O3 content increased the proportion of SFCA generated, which improved the sinter’s mechanical strength, while excessive Al2O3 led to the formation of sheet-like SFCA with weak mechanical strength. Increasing the content of SiO2 strained the formation of SFCA and promoted the formation of calcium silicate, the mechanical strength of which is lower than that of SFCA. The research findings will be useful in guiding practical sintering processes.

1. Introduction

China has been the largest crude steel producers in the world since 1996; it has reached a production level of 0.83 billion tons in 2017 [1]. The huge steel output has made it impossible for the domestic iron ore deposits to meet the demand for iron ores. In fact, a major part of the iron ores consumed rely on imports. Australia, Brazil, Canada, South Africa, etc. are the main iron ore exporters, and the long-term data show that the iron ores imported by China have even exceeded 90% of the iron ores consumed [2].
However, the high utilization of imported iron ores has also given rise to some problems. Iron ores containing a high content of Al2O3 make up relatively higher proportions of those imported, though these have been verified to have adverse effects on the quality and metallurgical properties of sinter [3,4]. Moreover, the SiO2 content in imported iron ores is relatively lower than that of the domestic iron ore concentrates, which helps to produce sinter with lower impurity levels. However, an excessively low SiO2 content would lead to insufficient generation of SFCA (Quaternary compound of calcium ferrite containing silicate and alumina) under the same basicity (mass ratio of CaO to SiO2 in sinter). In short, SiO2 serves as an important mineral to guarantee the mechanical strength of sinter [5,6]. To address the drawbacks of imported irons ore used for sintering and the subsequent smelting process, much work has been conducted to investigate how the content levels of Al2O3 and SiO2 affect sintering performance. Still, their influence has not been clearly revealed, and some points were even found to be contradictory. It has been widely regarded that a content of Al2O3 exceeding 2.5% will deteriorate the sinter quality, while the influence of an Al2O3 content ≤2.5% on sinter quality has not been clearly elucidated [7,8,9,10]. The research regarding the influence of SiO2 content on sinter quality has mainly been conducted by changing the content of CaO in sinter as well, so it is difficult to reveal how only the content of SiO2 affects the sintering performance [11,12,13,14].
In this investigation, the influence of Al2O3 and SiO2 contents on sintering performance was systematically researched, with typical imported iron ores used to alter the contents of these minerals in the sinter. Moreover, the potential function mechanisms of Al2O3 and SiO2 were elucidated by revealing the microstructure and mineral evolution, with the help of optical microstructure, SEM-EDS, and mineral hardness testing devices. The research findings will provide theoretical guidance for the production of desirable sinter products under the current situation of limited resources.

2. Materials and Methods

2.1. Materials

Typical iron ores, including Brazilian iron ores, Australian iron ores, Indian iron ores, South Africa iron ores, Canadian iron ores, and domestic (Chinese) iron ores, were used in this investigation. They were provided by integrated steelworks, and their chemical compositions are given in Table 1. It was found that the Australian and Indian iron ores were characterized by relatively higher Al2O3 contents, while the domestic iron ores were characterized by higher SiO2 contents. These iron ores were used in varying proportions to prepare ore blends with different compositions, so that the Fe, SiO2, and Al2O3 contents of the sinter could be adjusted over a relatively wide range. Table 2 gives the chemical compositions of other necessary raw materials used to produce the sinter, including limestone, dolomite, quicklime, coke breeze, and return fines.

2.2. Methods

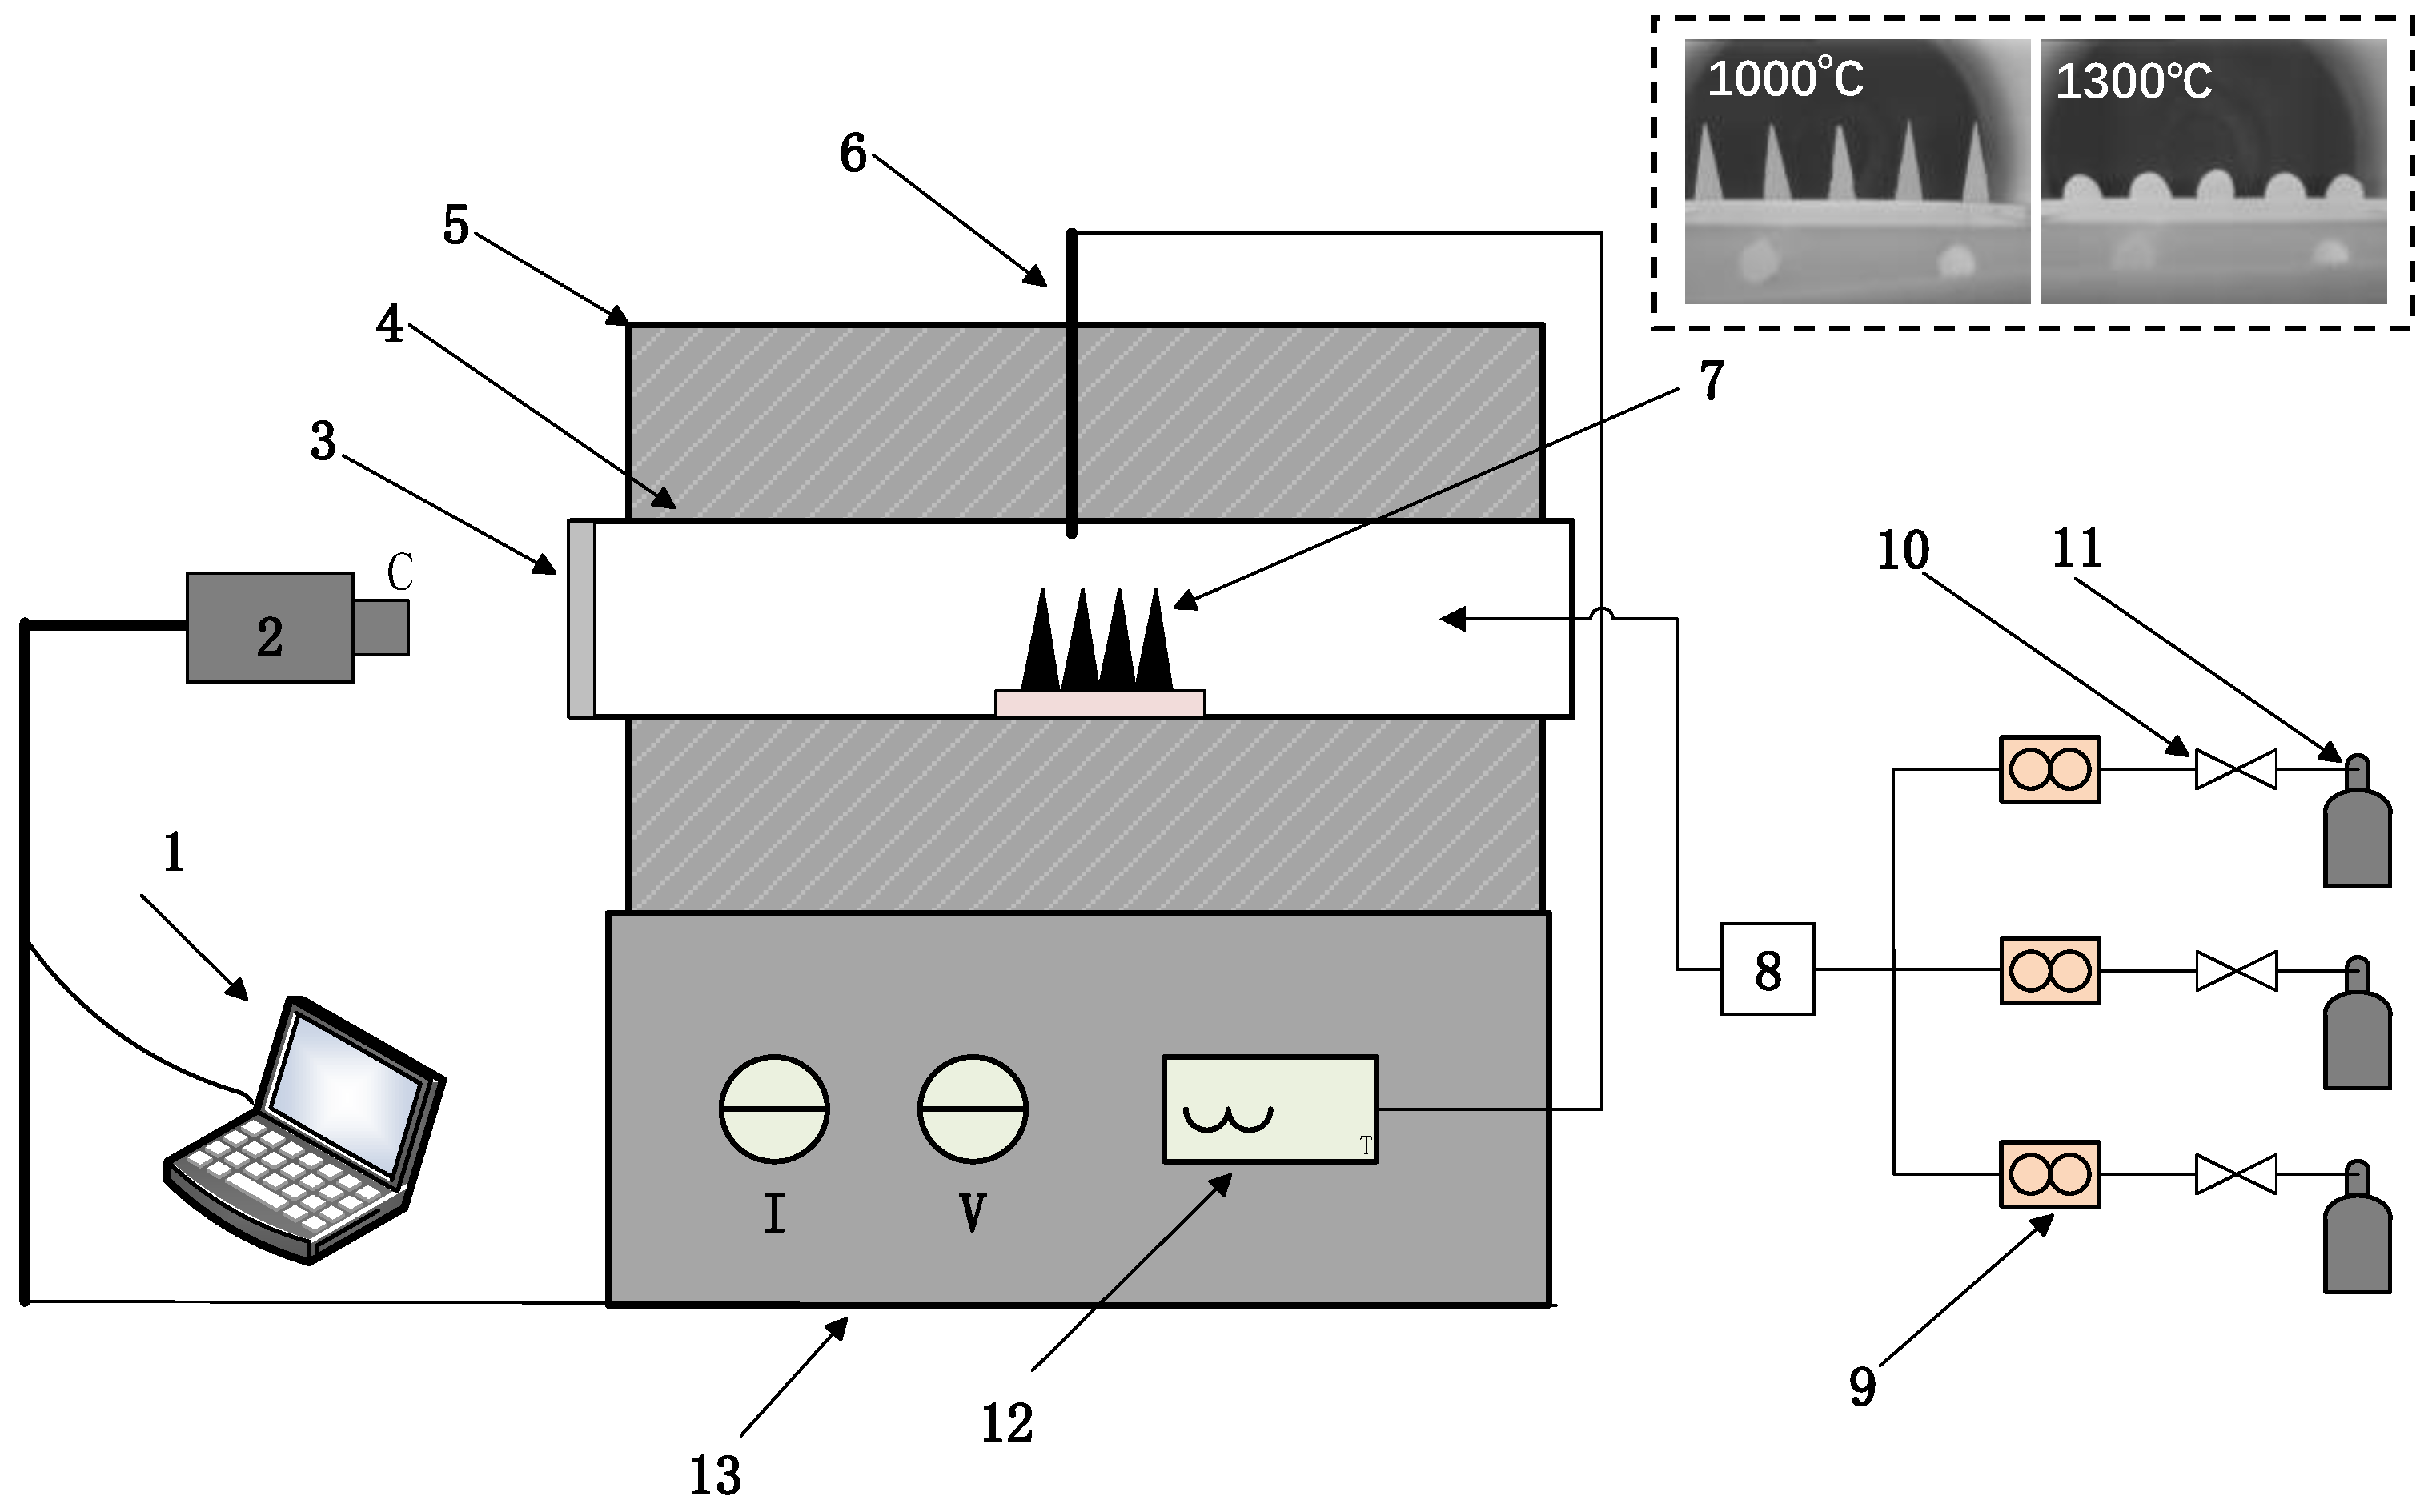
2.2.1. Sinter Pot Trials

A cylindrical laboratory-scale sinter pot (700 mm in height and 180 mm in diameter) was used to conduct the sinter pot trials. The raw materials, including iron ores, fluxes, solid fuels, and return fines, first underwent a mixing process. Water was added at the same time to wet the mixtures; the targeted moisture was 7.5–8.0%. After that, a granulator (1400 mm in length and 600 mm in diameter) was used to granulate the iron ores into bigger granules, with a size range of 3–8 mm, during which the revolving speed was 15 rpm and the duration time was 4 min. One kilogram of sinter with a size range of 10–16 mm was used to form a hearth layer in advance, and then the granulated mixture was used to fill the whole sinter pot. After that, the coke breeze distributed in the surface layer was ignited using a natural gas fueled igniter, with the ignition temperature of 1050 ± 50 °C, ignition time of 1 min, and pressure drop of 5 kPa. The combustion front could then move downward, sustained by an induced draft fan.
The return fines balance (RFB), which is the ratio of the mass of produced return fines to the mass of afforded return fines, was taken as an important indicator to validate the tests of typical sintering indexes, including sintering speed. Productivity is the sinter output per unit area and unit time, t·m−2·h−1. The tumbler index is an important factor to determine the mechanical strength of the sinter based on the methodology outlined in ISO3271 (2007), measured in mass %. However, 15 kg sinter within 10–40 mm is difficult to obtain in laboratory-scale sintering trials. To achieve an effective tumbler index, the width of the tumbler is typically reduced to half or one-fifth. In our investigation, the width of the tumbler was reduced by half, and the standard weight was reduced to 7.5 kg for tumbler index testing. More detailed information about these factors can be found elsewhere [15].

2.2.2. Minerals Analysis and Mechanical Strength Examination

A mini-sintering test was used to research the liquid generation properties of minerals under a high temperature. A horizontal heating furnace whose temperature and atmosphere could be controlled by a program was adopted to perform the mini-sintering experiment, which is schematically shown in Figure 1.
The mini-sintering method includes ore blending, briquetting, sintering, and cooling. Specifically, fine-grained iron ores within a size range of −5 mm were mixed with fluxes (limestone, quicklime, and dolomite), and then ground to a size under 0.074 mm and compressed into a standard pyrometric cone (20 mm in height and a side length of 5 mm). The MgO content for each sample was kept at 2.0%. The samples in pyrometric cones were settled on a pallet and the pallet was sent into the heating furnace for roasting. During the roasting process, the heat rate was 10 °C/min and the atmosphere was adjusted with the temperature (Figure 2) according to the reactions in the practical sintering process. While being roasted, a group of triangular pyramid shape pictures were taken by a camera every 10 s, and the property of liquid generation could be obtained through image processing software. The liquid phase formation properties included the initial formation temperature, complete formation temperature, average formation velocity of the liquid phase, and the amount of generated phase. Among them, the initial formation temperature (Ts) refers to the point at which the sharp corner of the pyrometric cone begins to round, while the complete formation temperature (Te) refers to the point at which the pyrometric cone becomes completely rounded. The average formation velocity of liquid phase was calculated using Equation (1). The amount of liquid phase (η) was reflected by the deformation of the pyrometric cone, which was defined as the variance of projection area between 1000 and 1300 °C. The liquid phase content was calculated according to Equation (2). Detailed information can be found elsewhere [16,17].
V = 1000/(Te − Ts),
η = (S1000 − S1300)/S1000 × 100%,
where η is the amount of liquid phase, S1300 is the area of the pyrometric cone at 1300 °C, and S1000 is the area of the pyrometric cone at 1000 °C.
First, 3.5 g iron ore mixture was briquetted into a cylindrical agglomerate under a pressure of 300 kg/cm2. After drying, the agglomerate was heated to 1200 °C for 1 h in a high-temperature furnace, and the whole heating process was conducted in an air atmosphere. The vertical compressive strength of the agglomerate was examined. Subsequently, four parallel tests were conducted, the average value of which was regarded as its compressive strength, N/P (Newton per pellets). An optical microscope, model Leica DMRXE, was used to analyze the microstructure and mineral distribution of the heated agglomerate. Leica Qwin V3 software was used to analyze the compositions of typical minerals according to their special color.
Two important micromechanical factors—fracture toughness and Vickers hardness—were employed to evaluate the mechanical strength-related properties of the sinter. A micro-hardness tester FM-700 (F-T Corporation, Japan) was used to examine the Vickers hardness of typical minerals in the sinter.

3. Results and Discussion

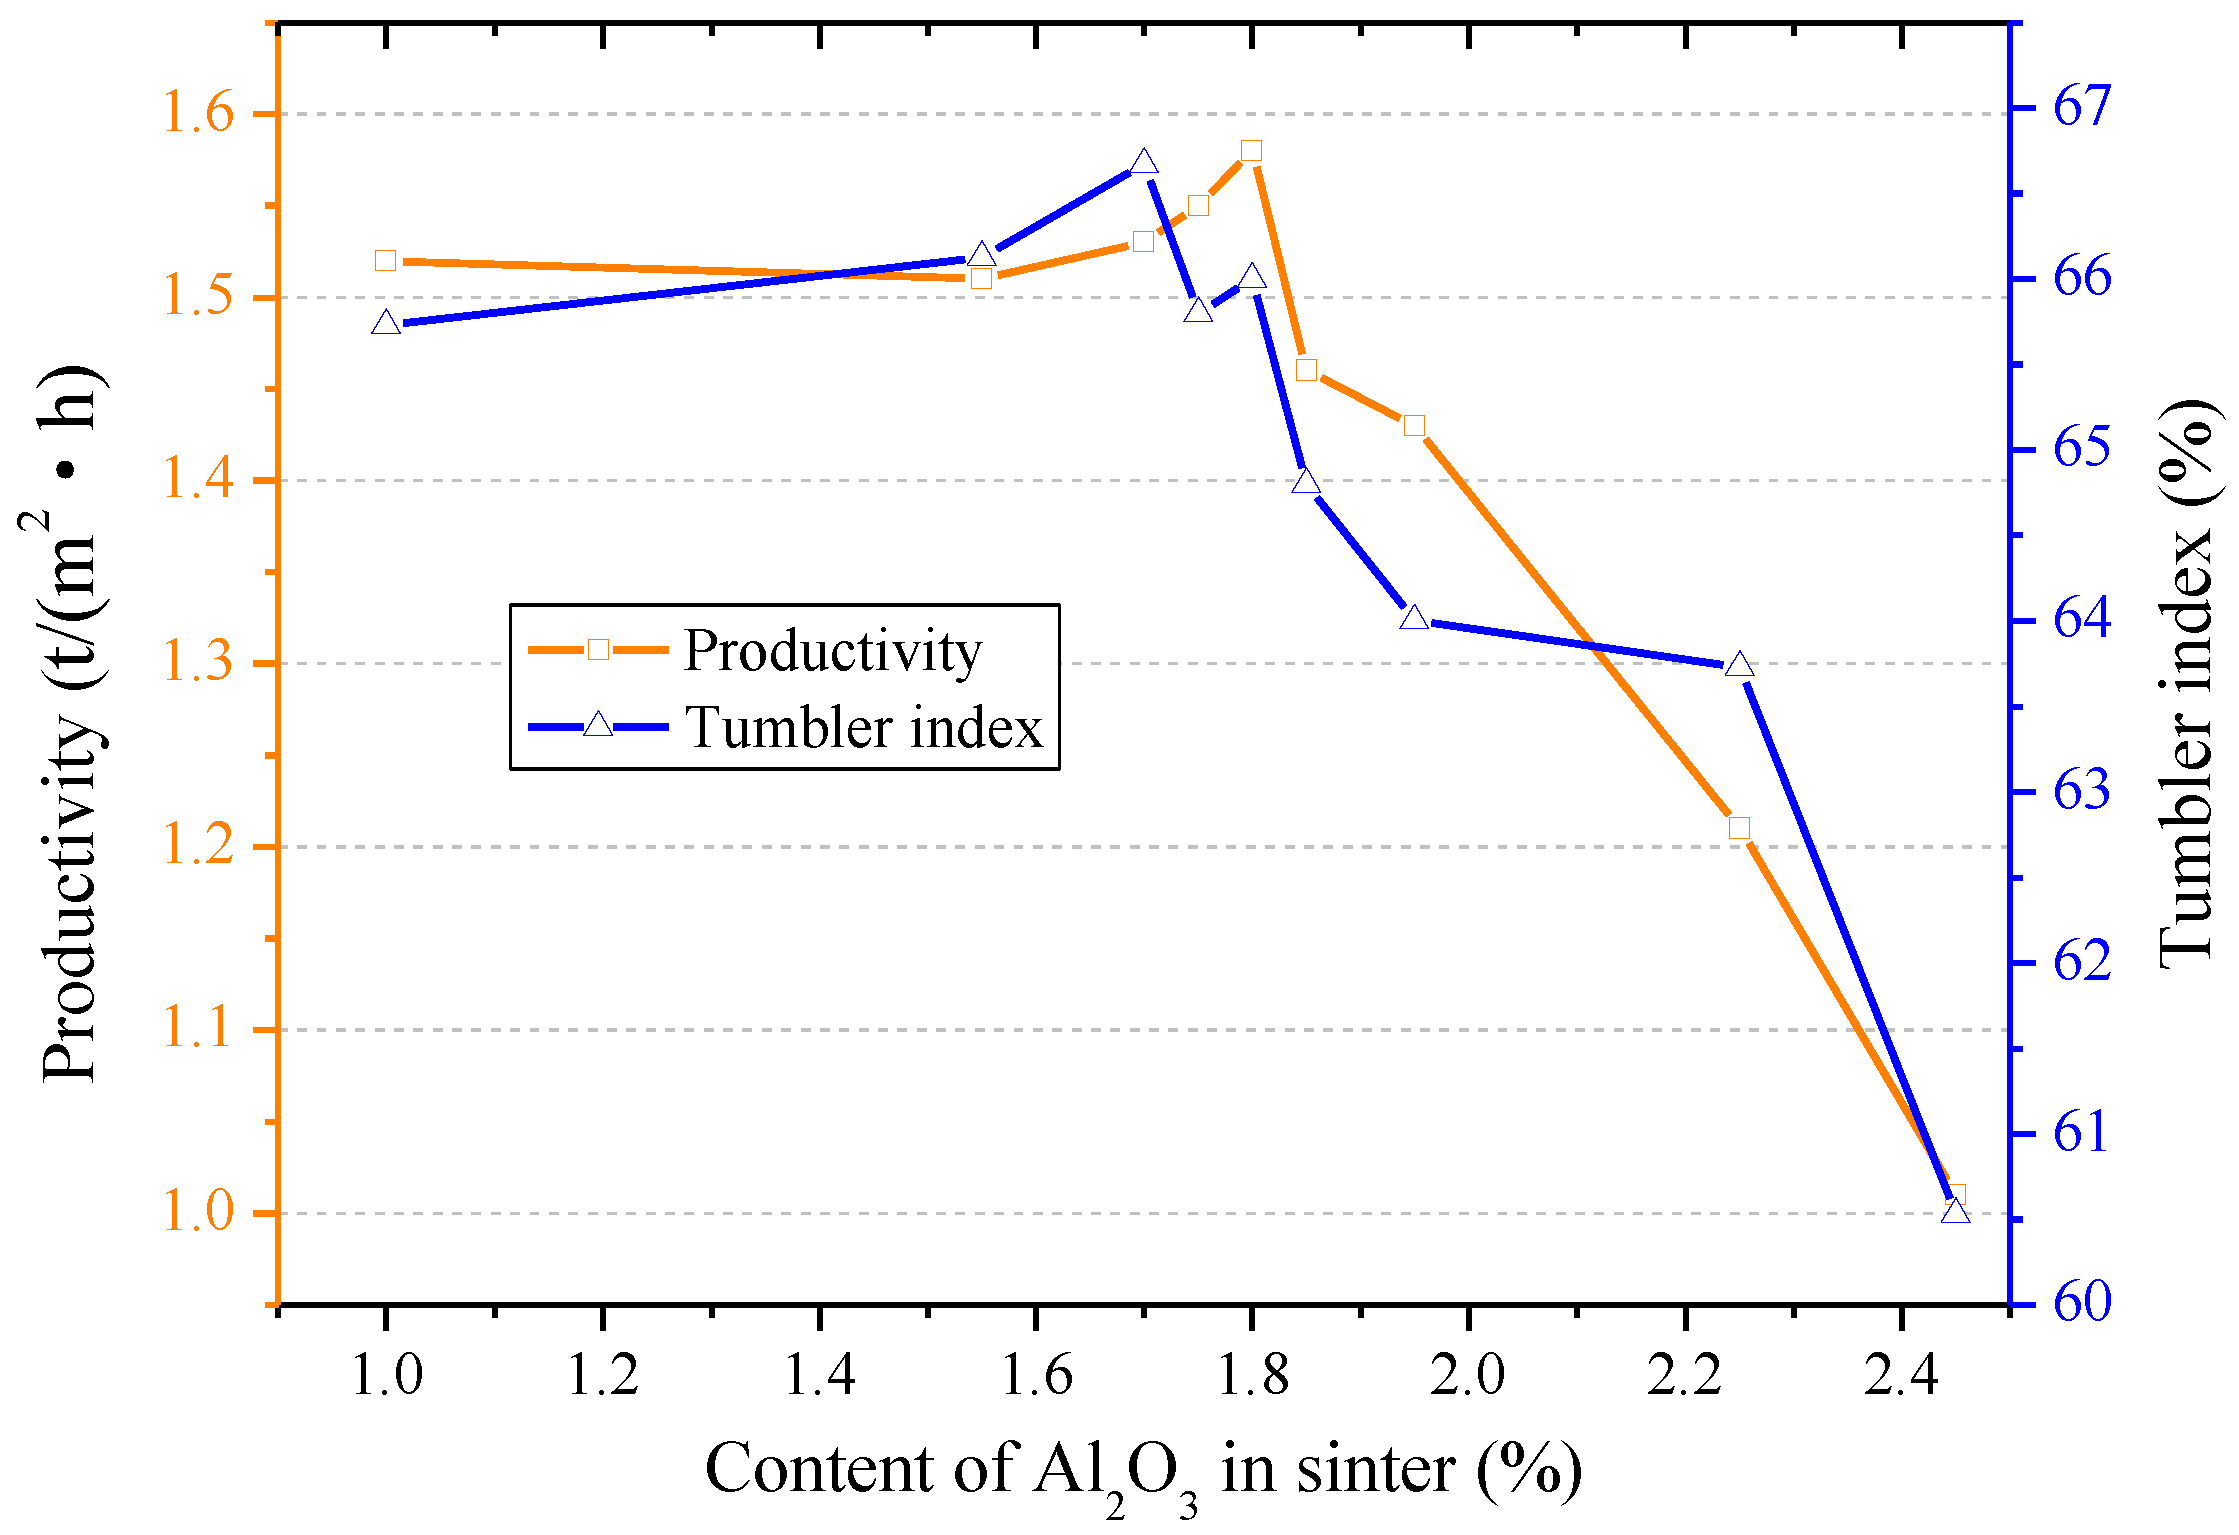
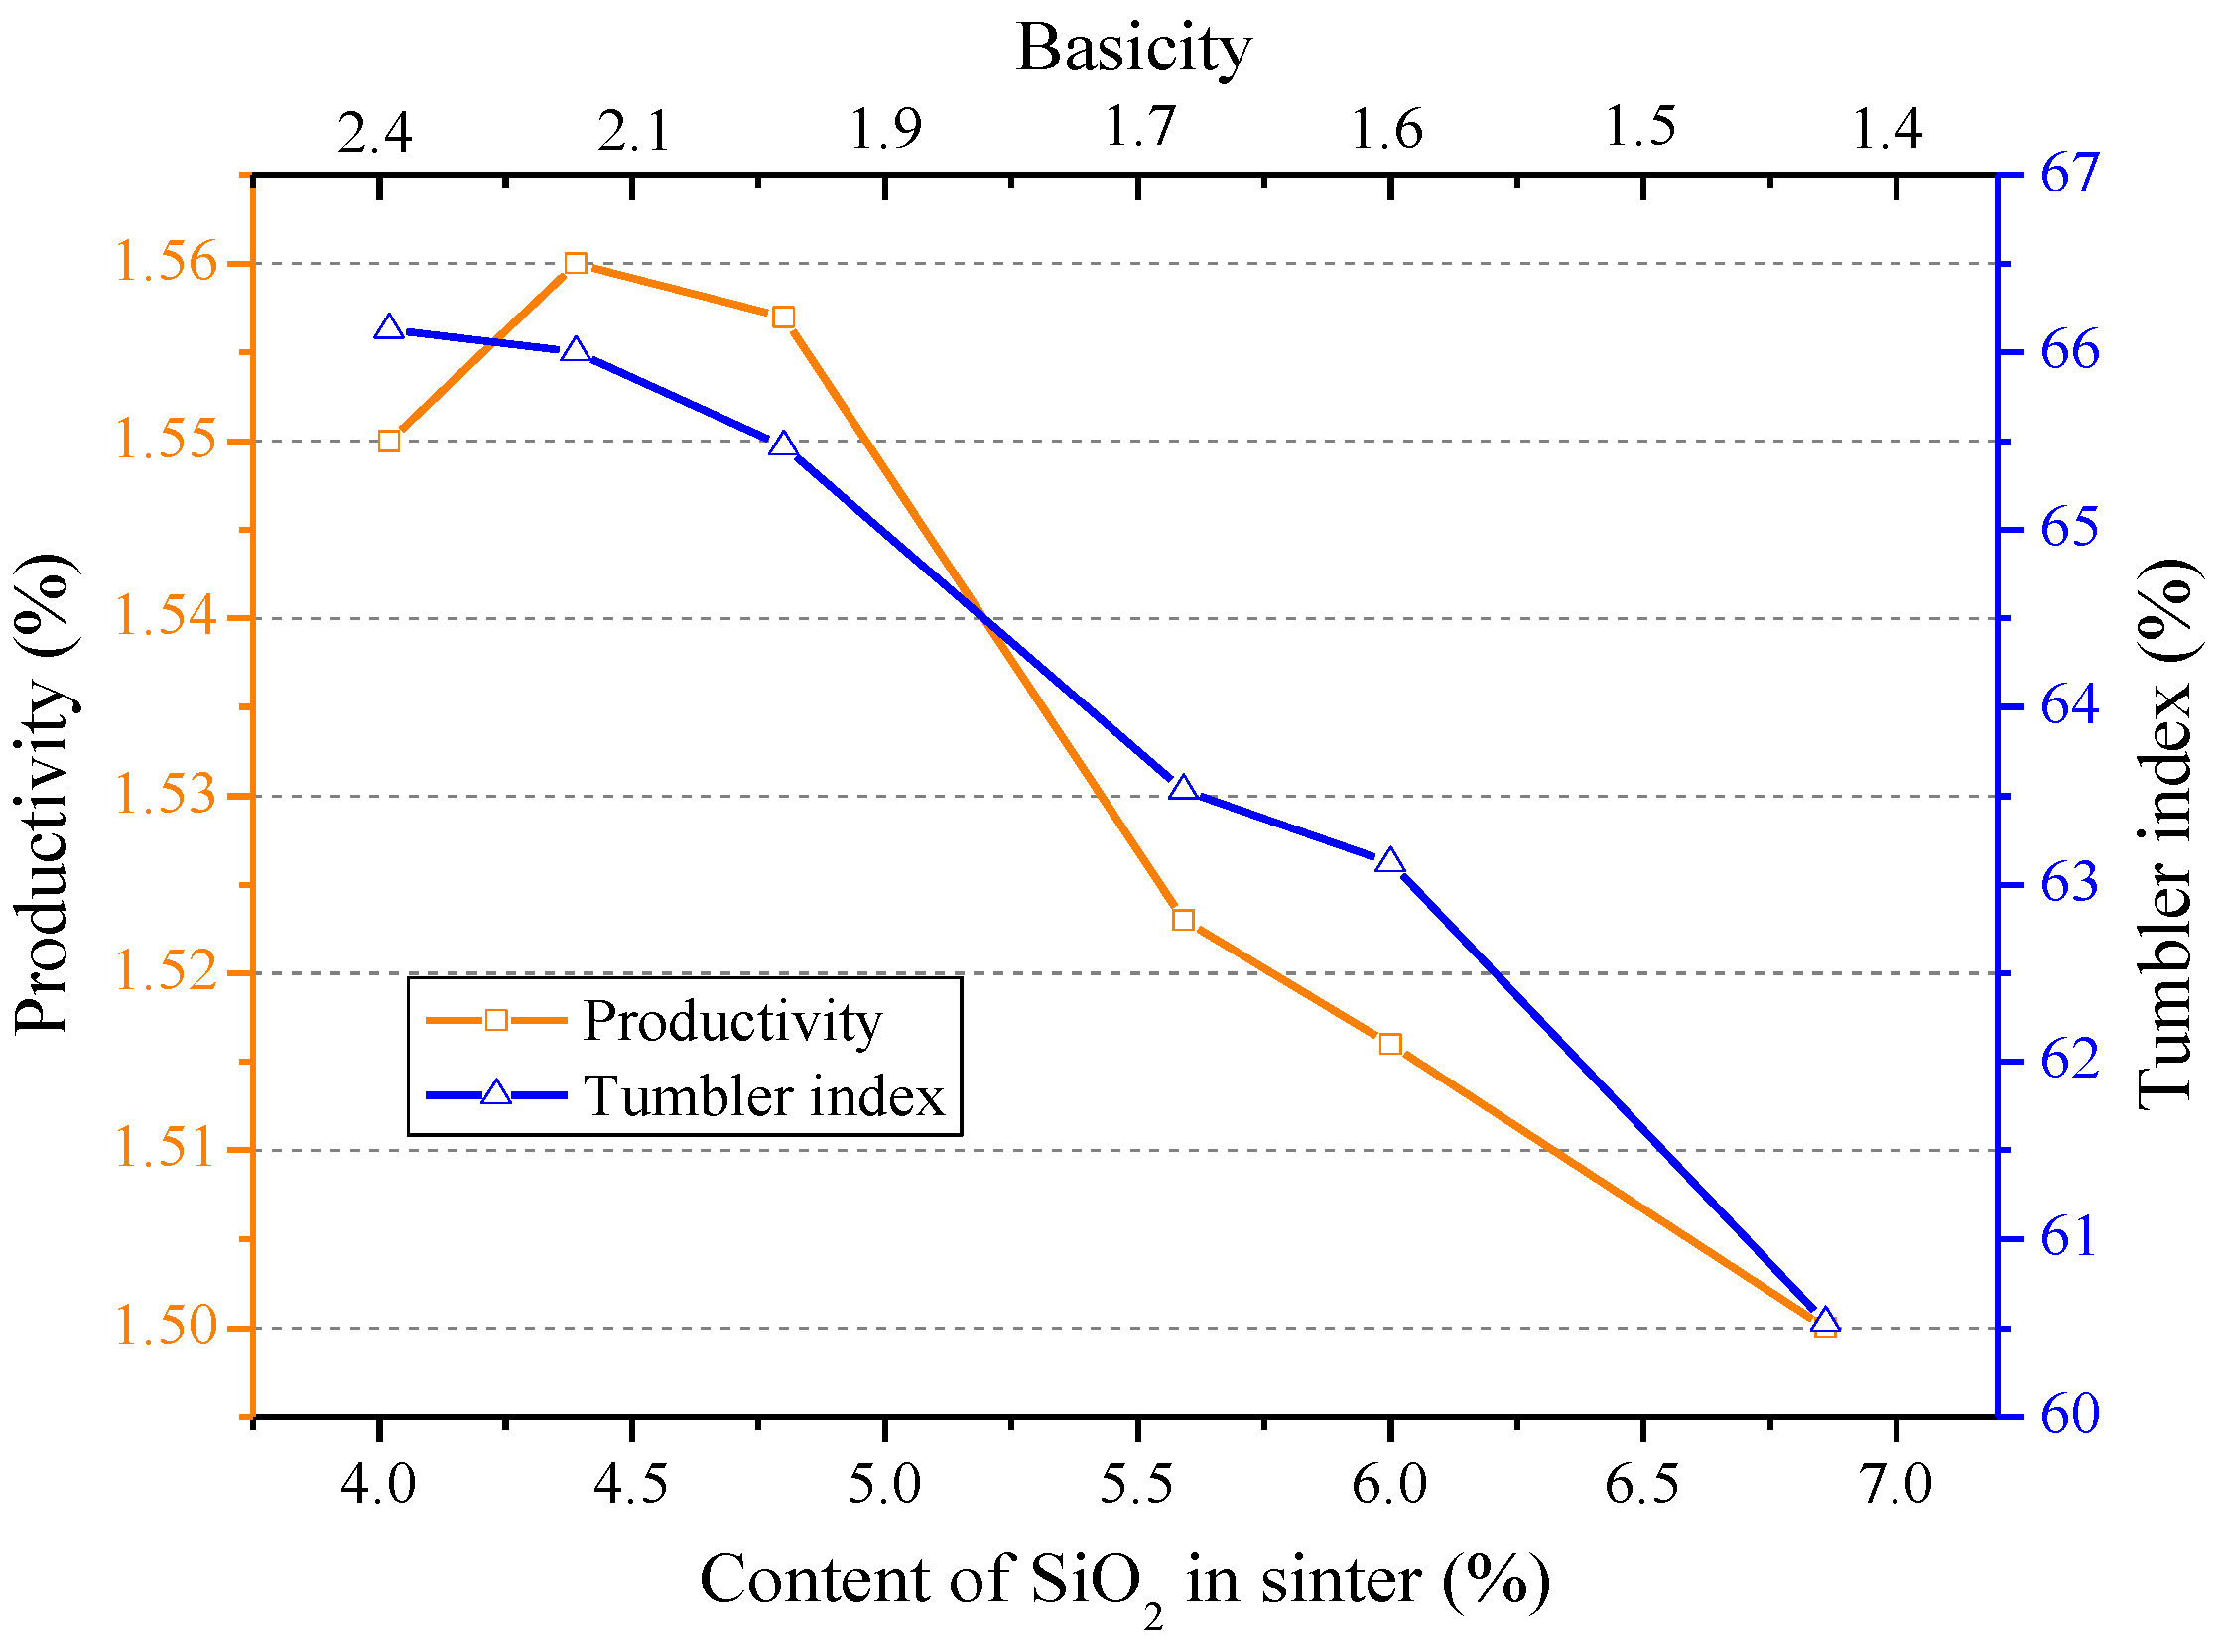
3.1. Influences of Al2O3 and SiO2 on Sintering Performance

Figure 3 shows the influence of Al2O3 content on sinter quality, where the content of SiO2 was around 4.80%, the basicity (CaO/SiO2, mass ratio) was 2.0, and the content of MgO was 2.00%. The permeability of each sintering bed was kept at a similar level with the optimization of the granulation process to avoid the influence of permeability affecting sinter quality. It was found that when the content of Al2O3 increased from 1.0 to 1.80%, the tumbler index and productivity changed marginally. However, when the content exceeded 1.80%, both the tumbler index and productivity appeared to drop obviously, which implied a weakened sinter quality. This phenomenon indicates that the optimal content of Al2O3 in sinter should be within 1.80%.
Figure 4 shows the influence of SiO2 content on sinter quality, where the content CaO was around 9.60%, the content of MgO was 2.00%, and the content of Al2O3 was around 1.60%. It was found that when the content of SiO2 increased from 4.0 to 5.5%, the tumbler index exhibited a continuous drop. In particular, when the content exceeded 4.80%, the tumbler indexed exhibited a considerable drop from 66.13 to 63.53%. However, when increasing the content further, the tumbler index continued to drop. The productivity remained constant at around 1.56 t·m−2·h−1 as the content of SiO2 increased from 4.00 to 4.80%, but dropped significantly as the content enhanced further. Therefore, the optiaml content of SiO2 should be controlled within 4.80% when the content of CaO is 9.60%.

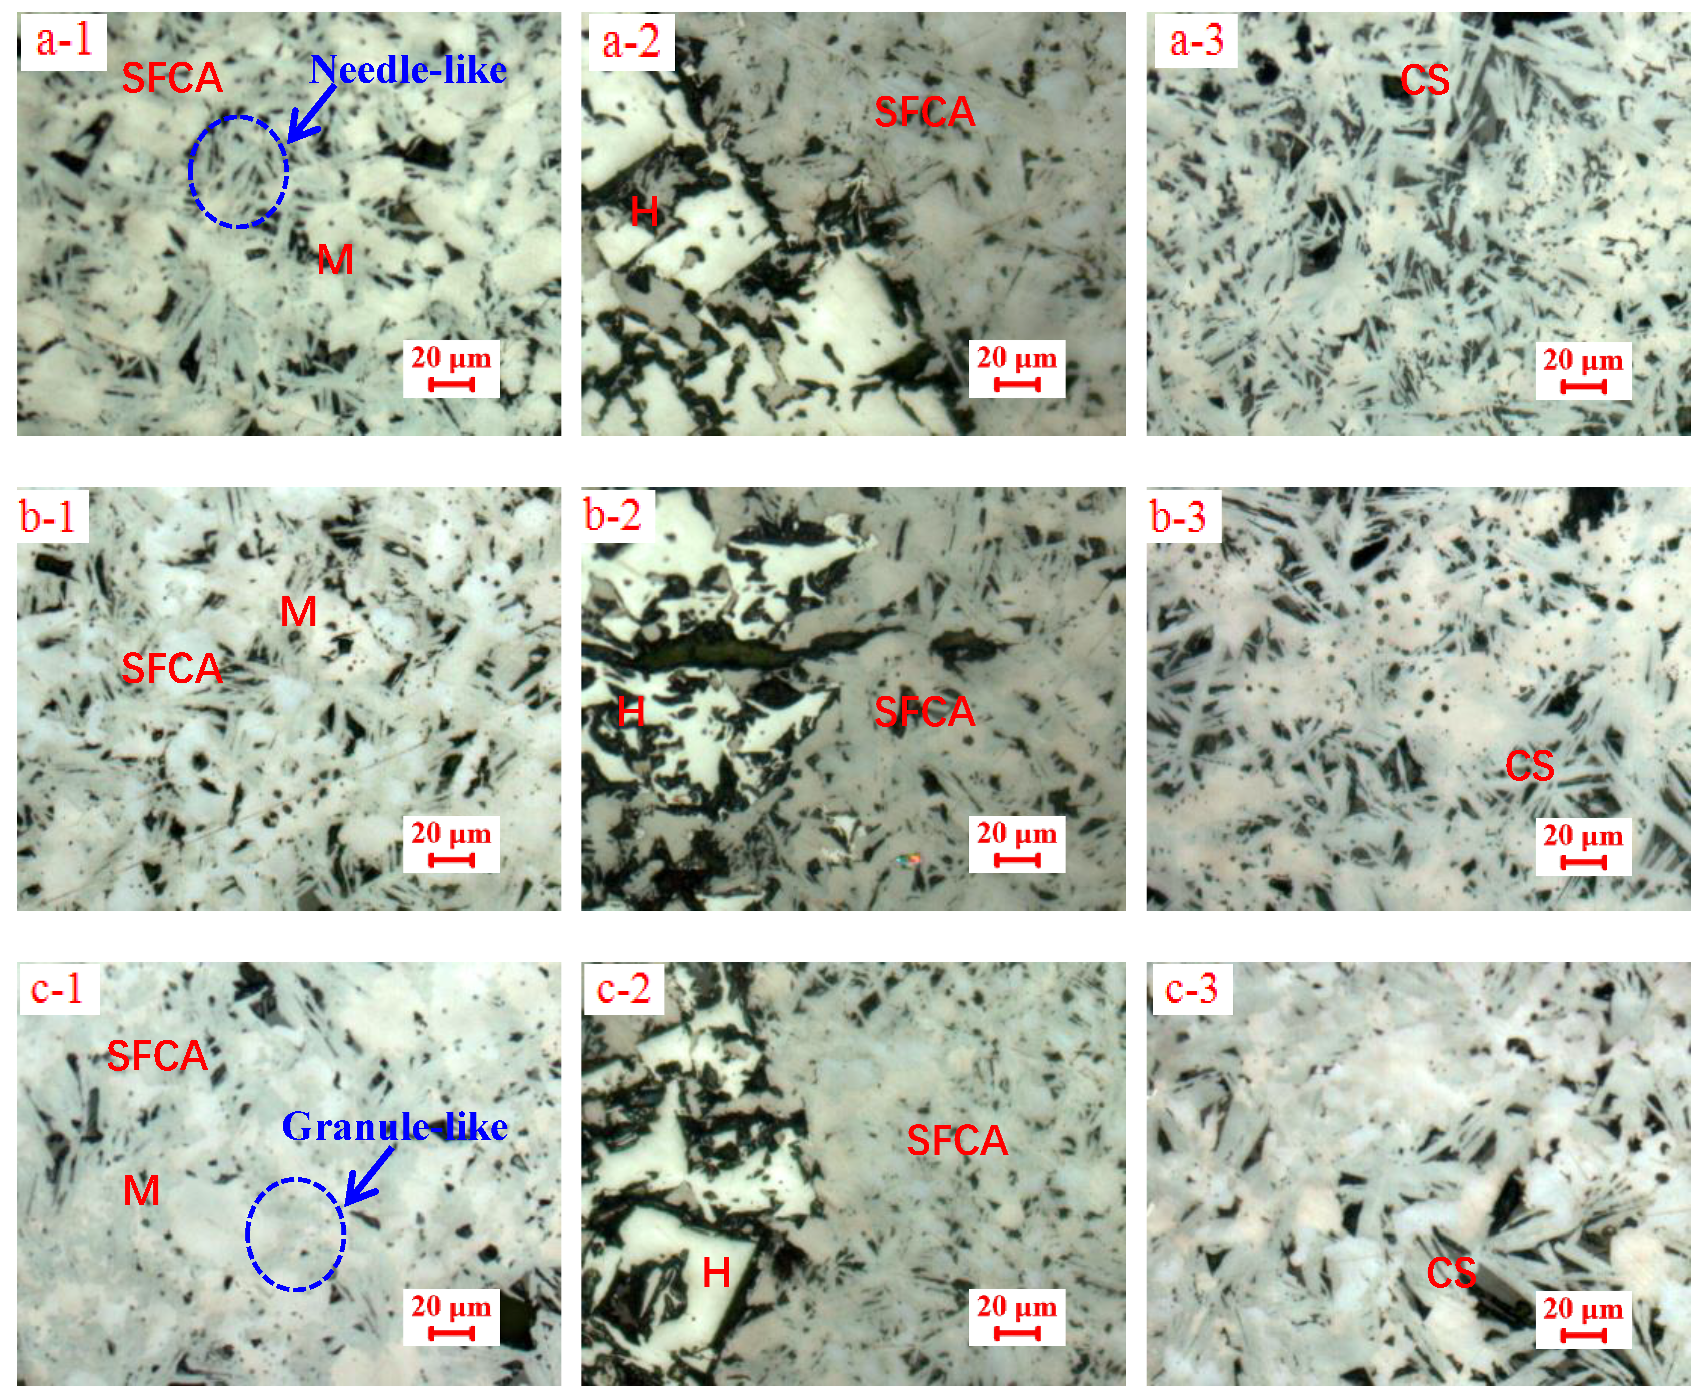
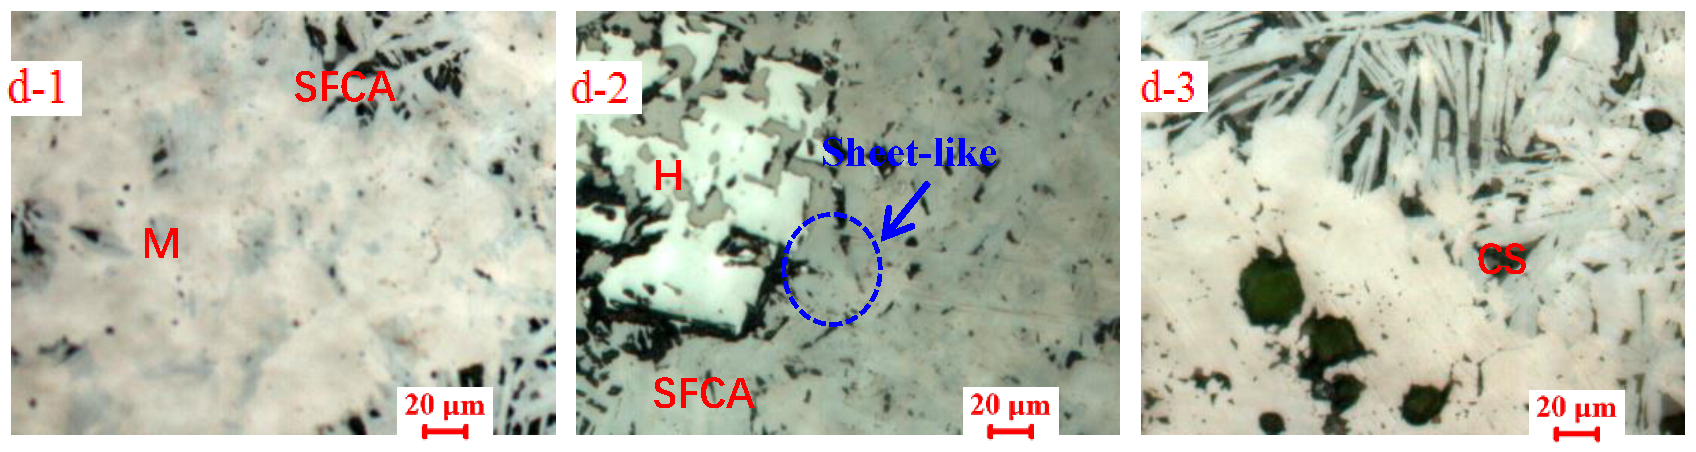
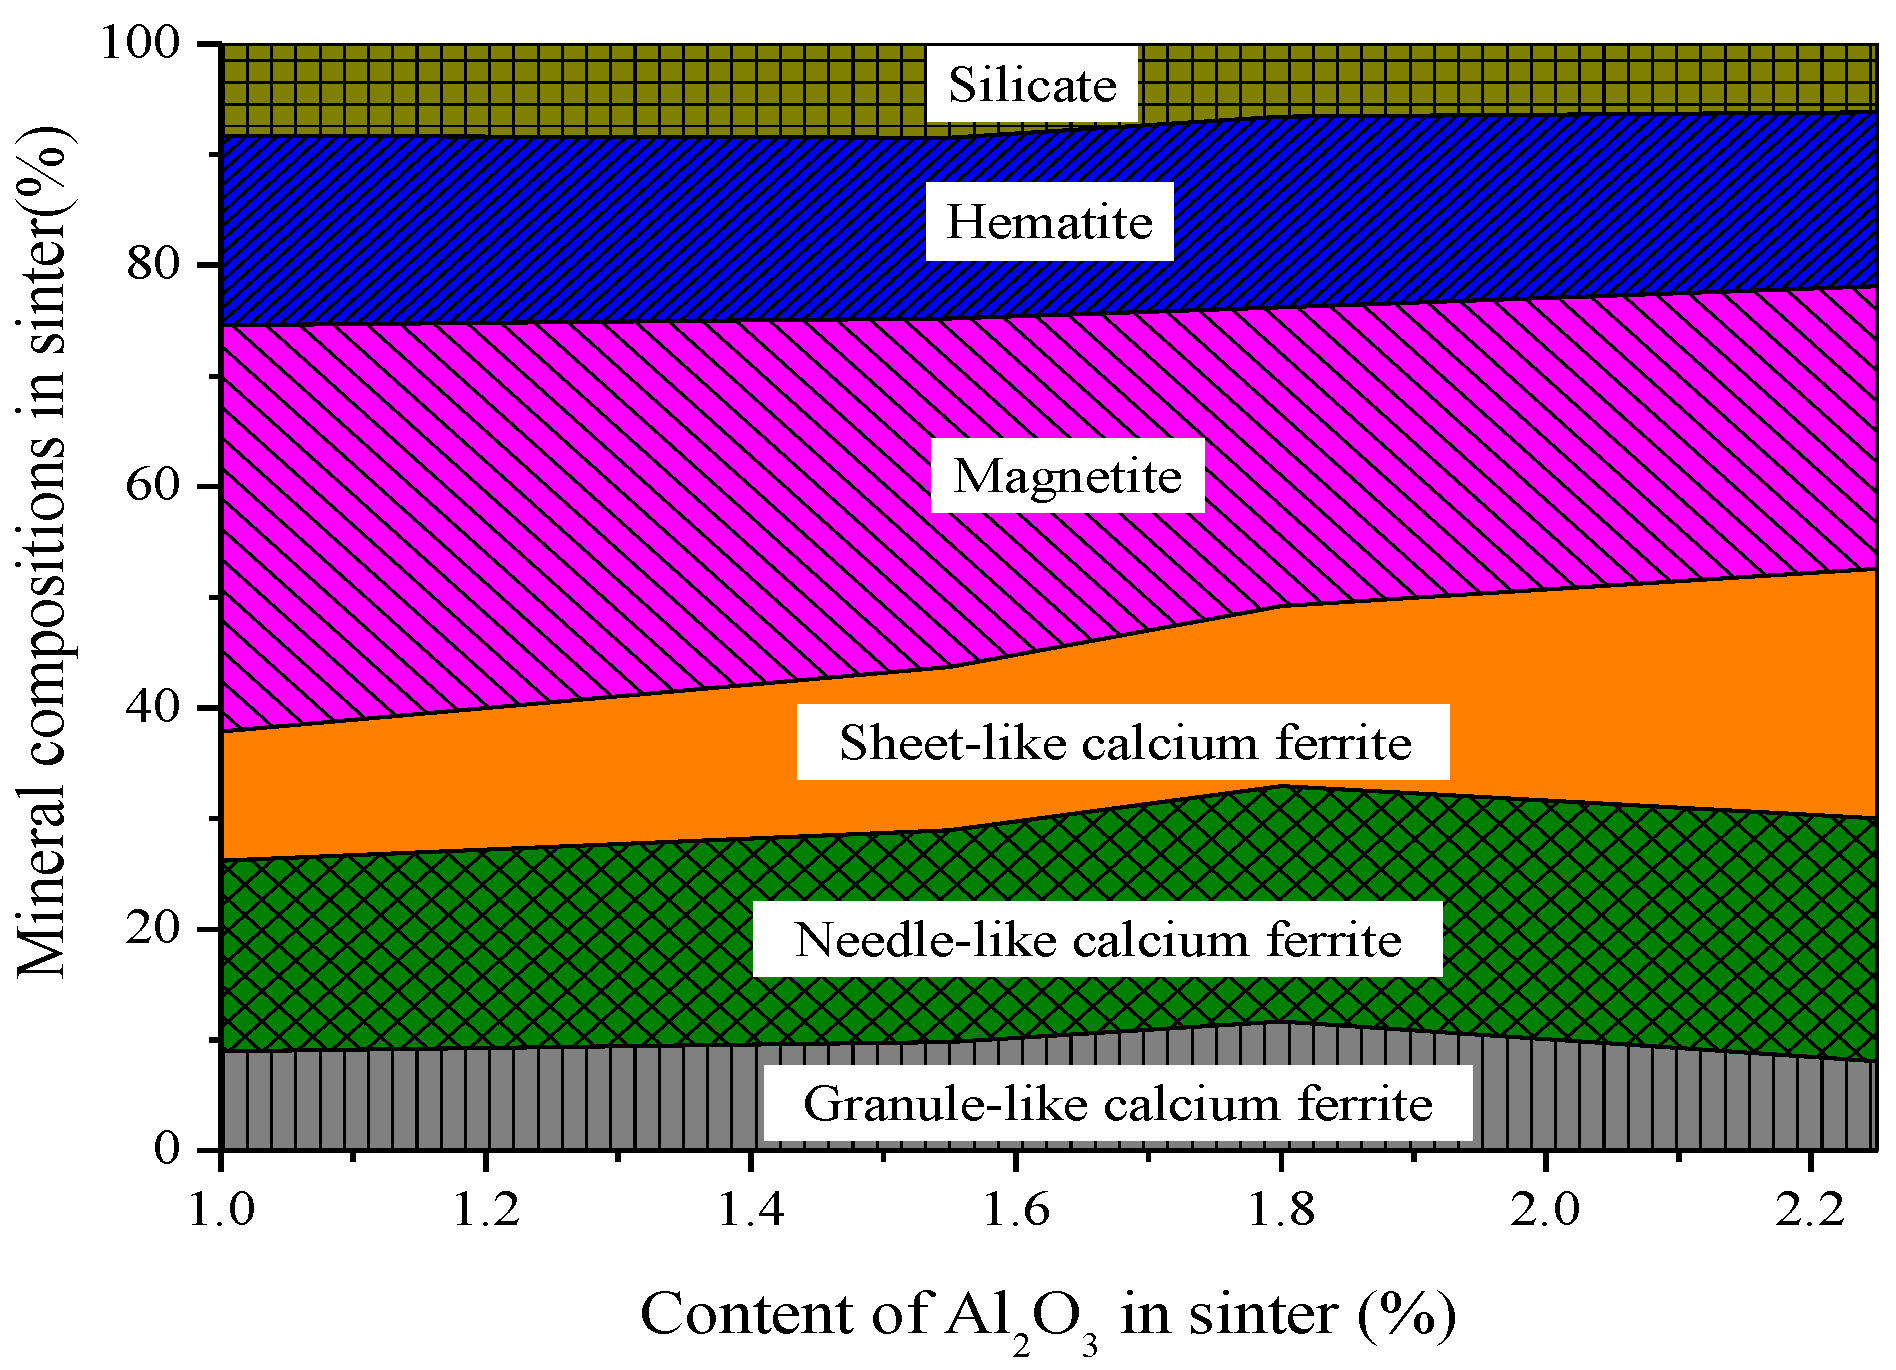
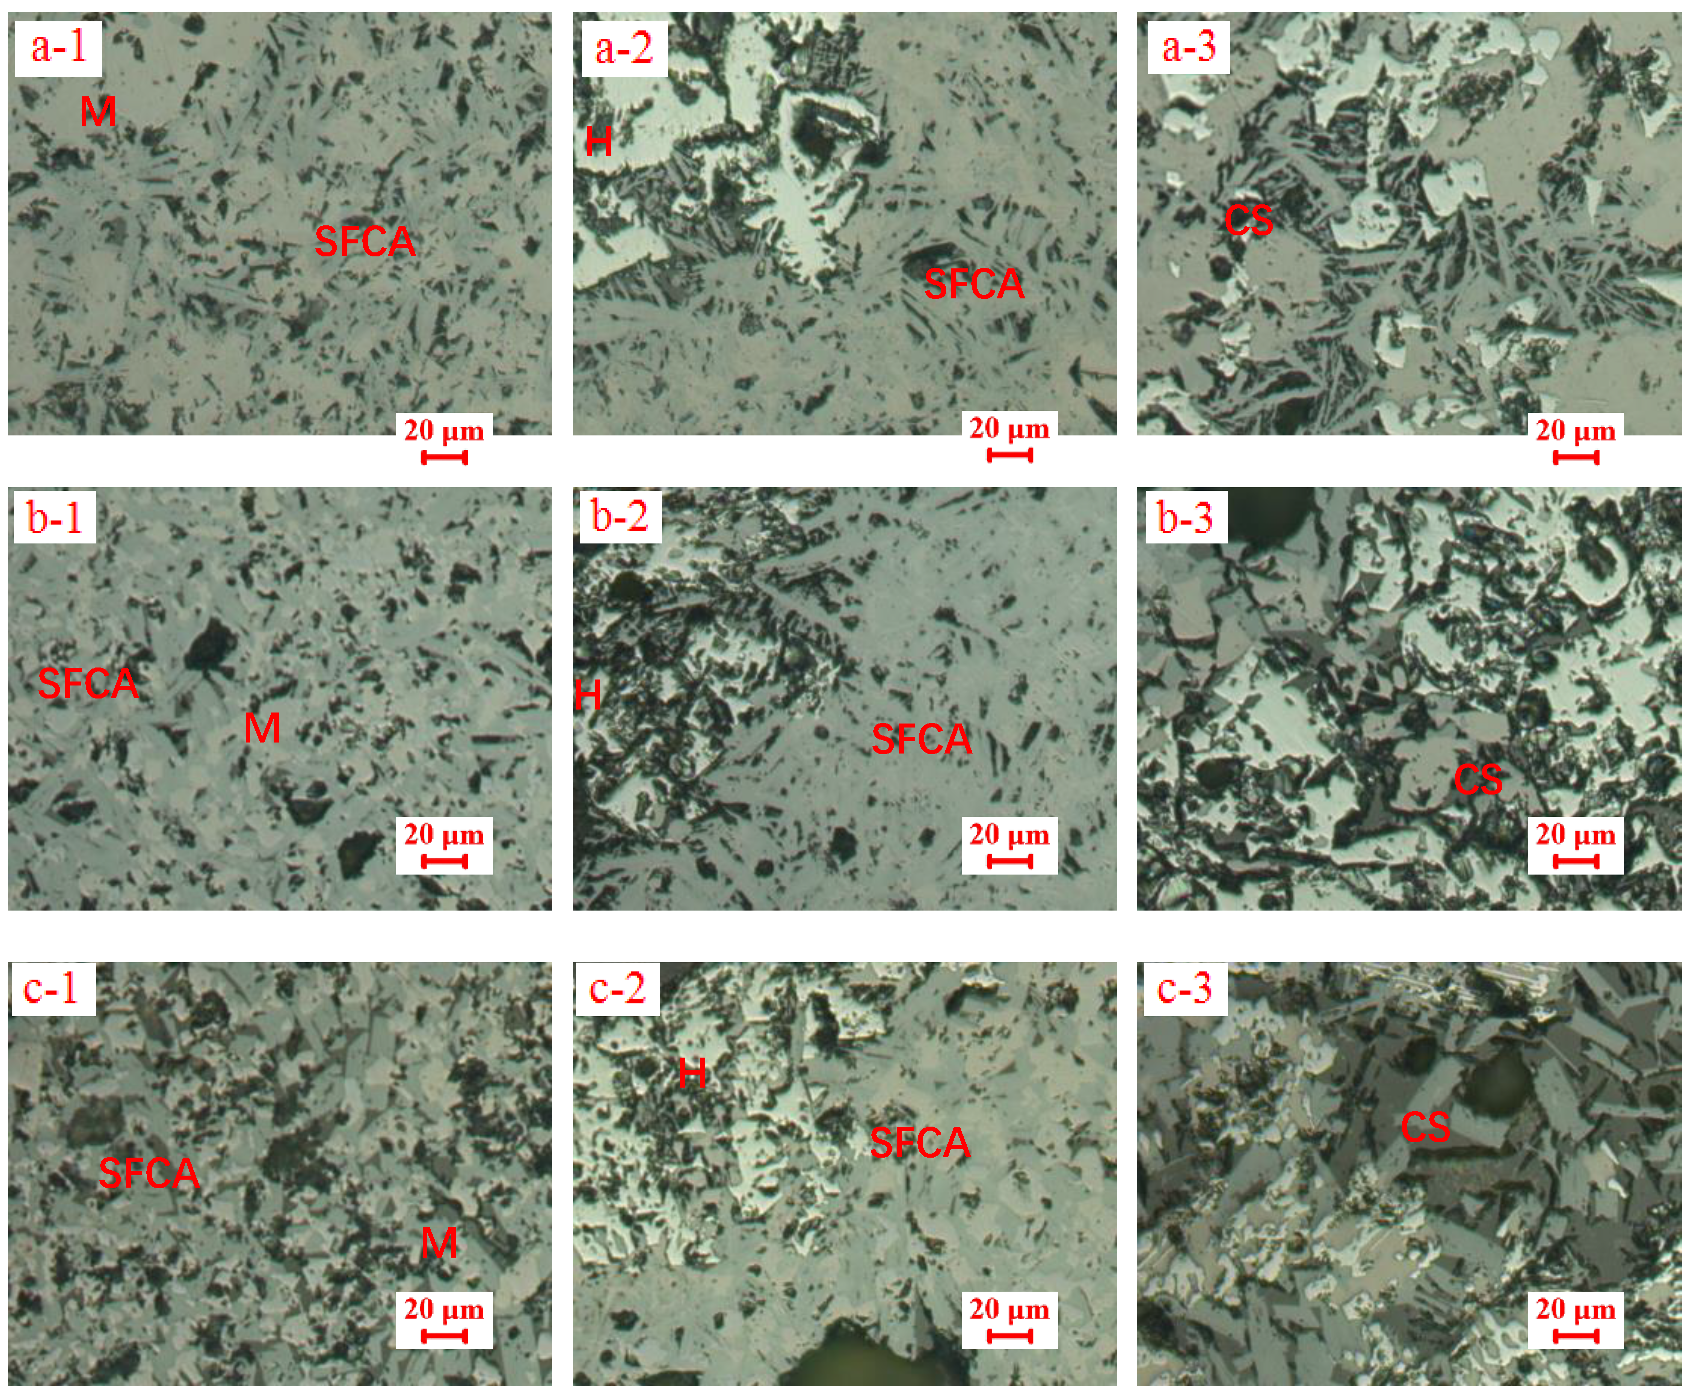
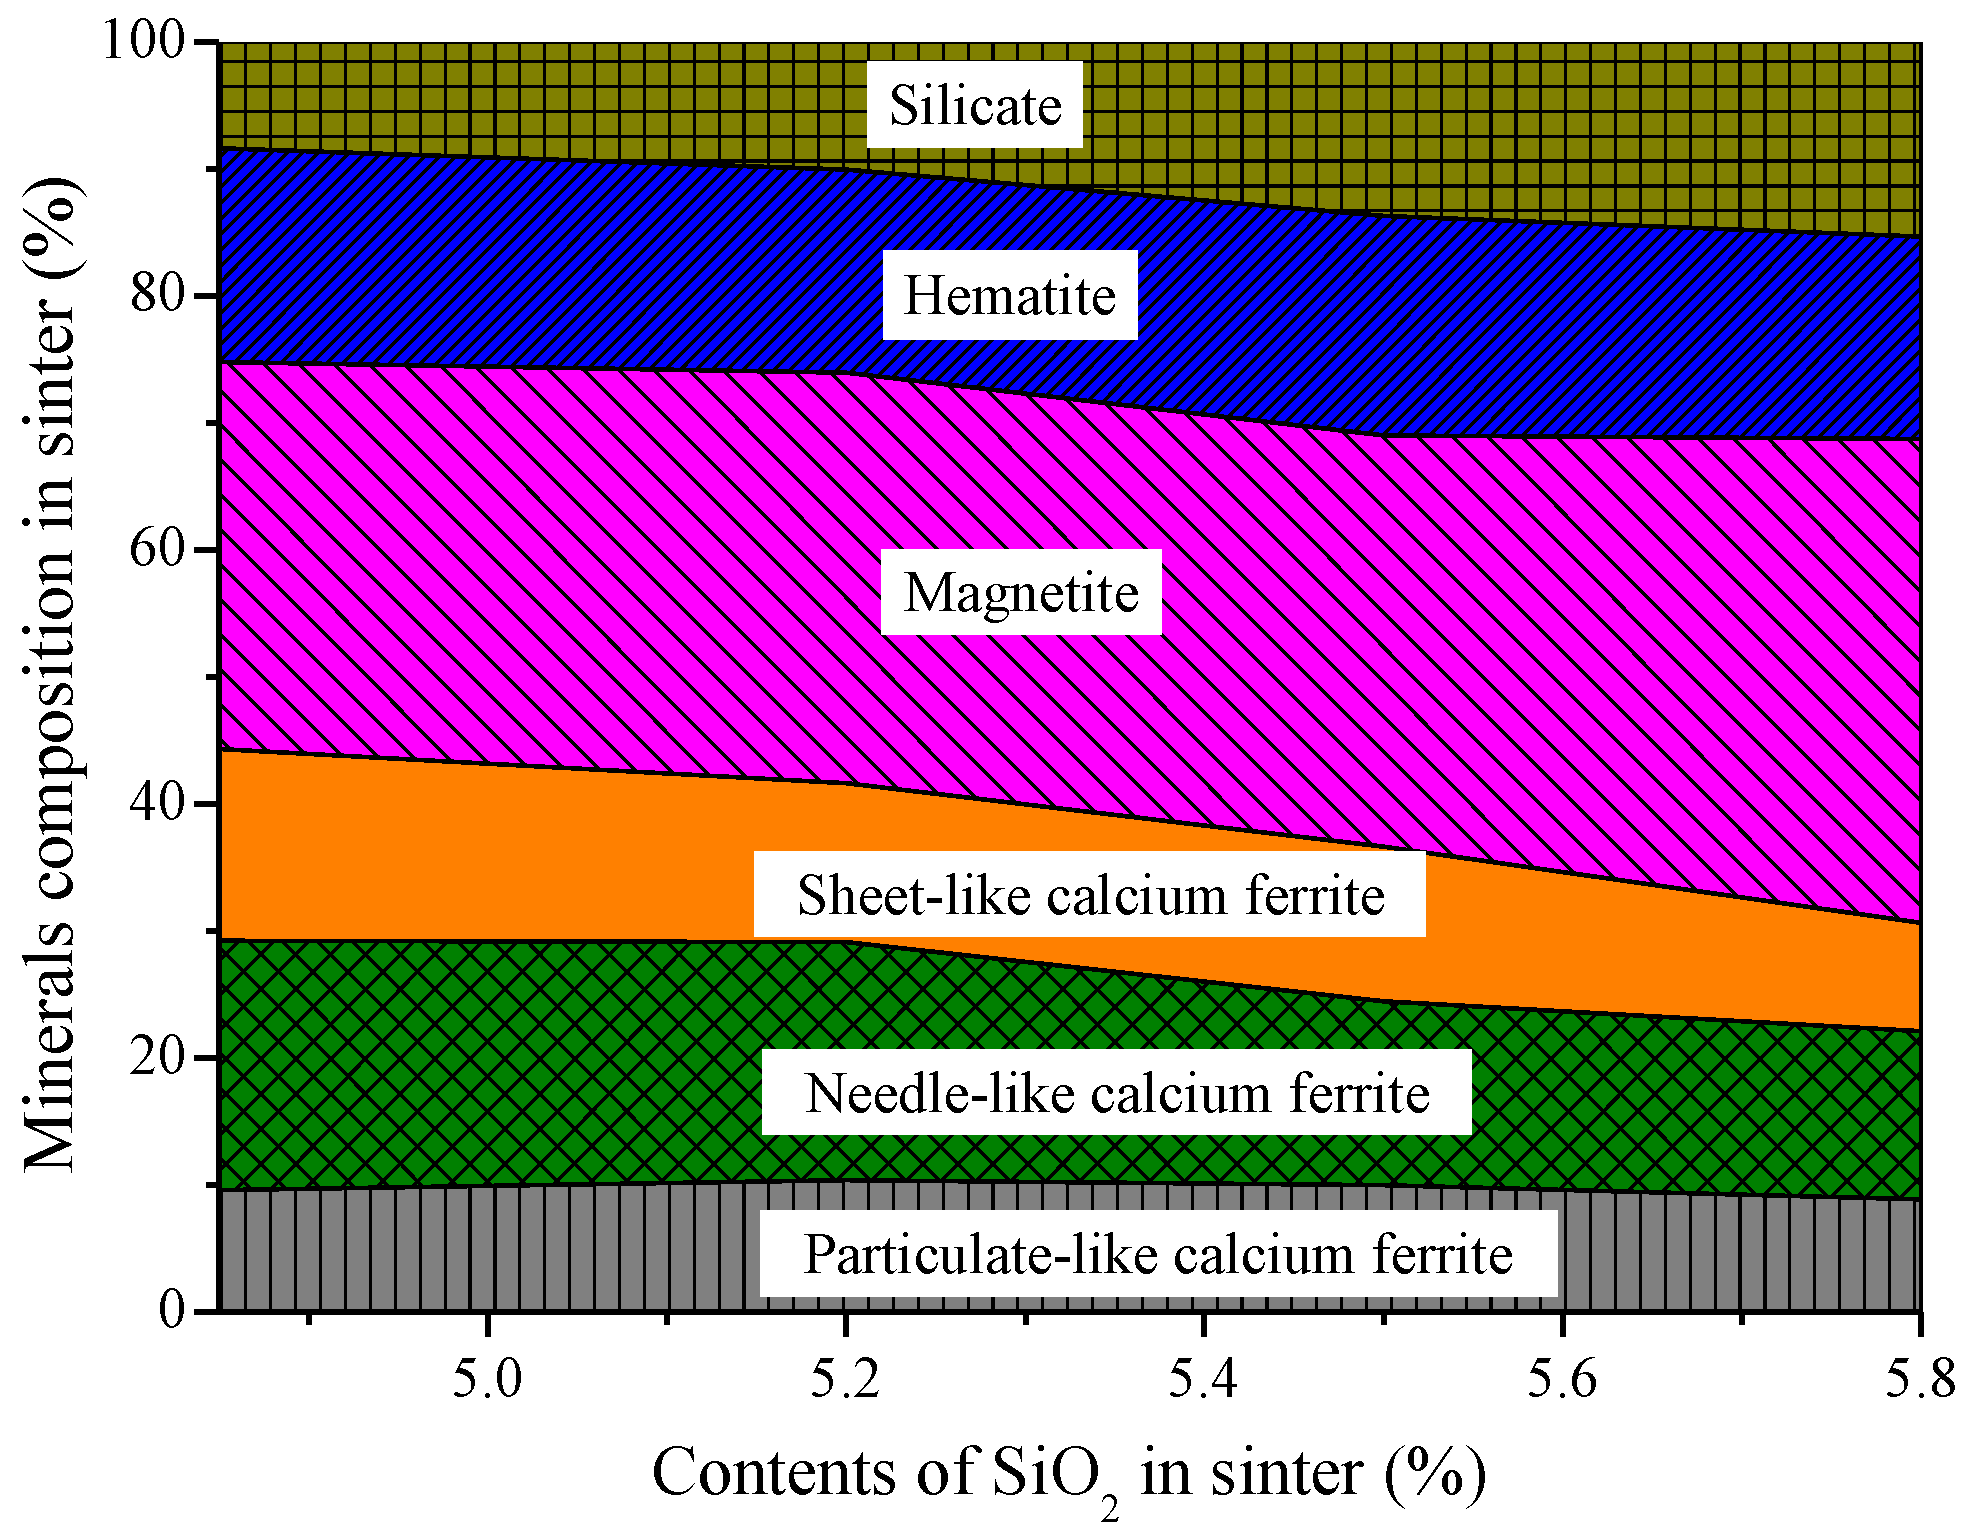
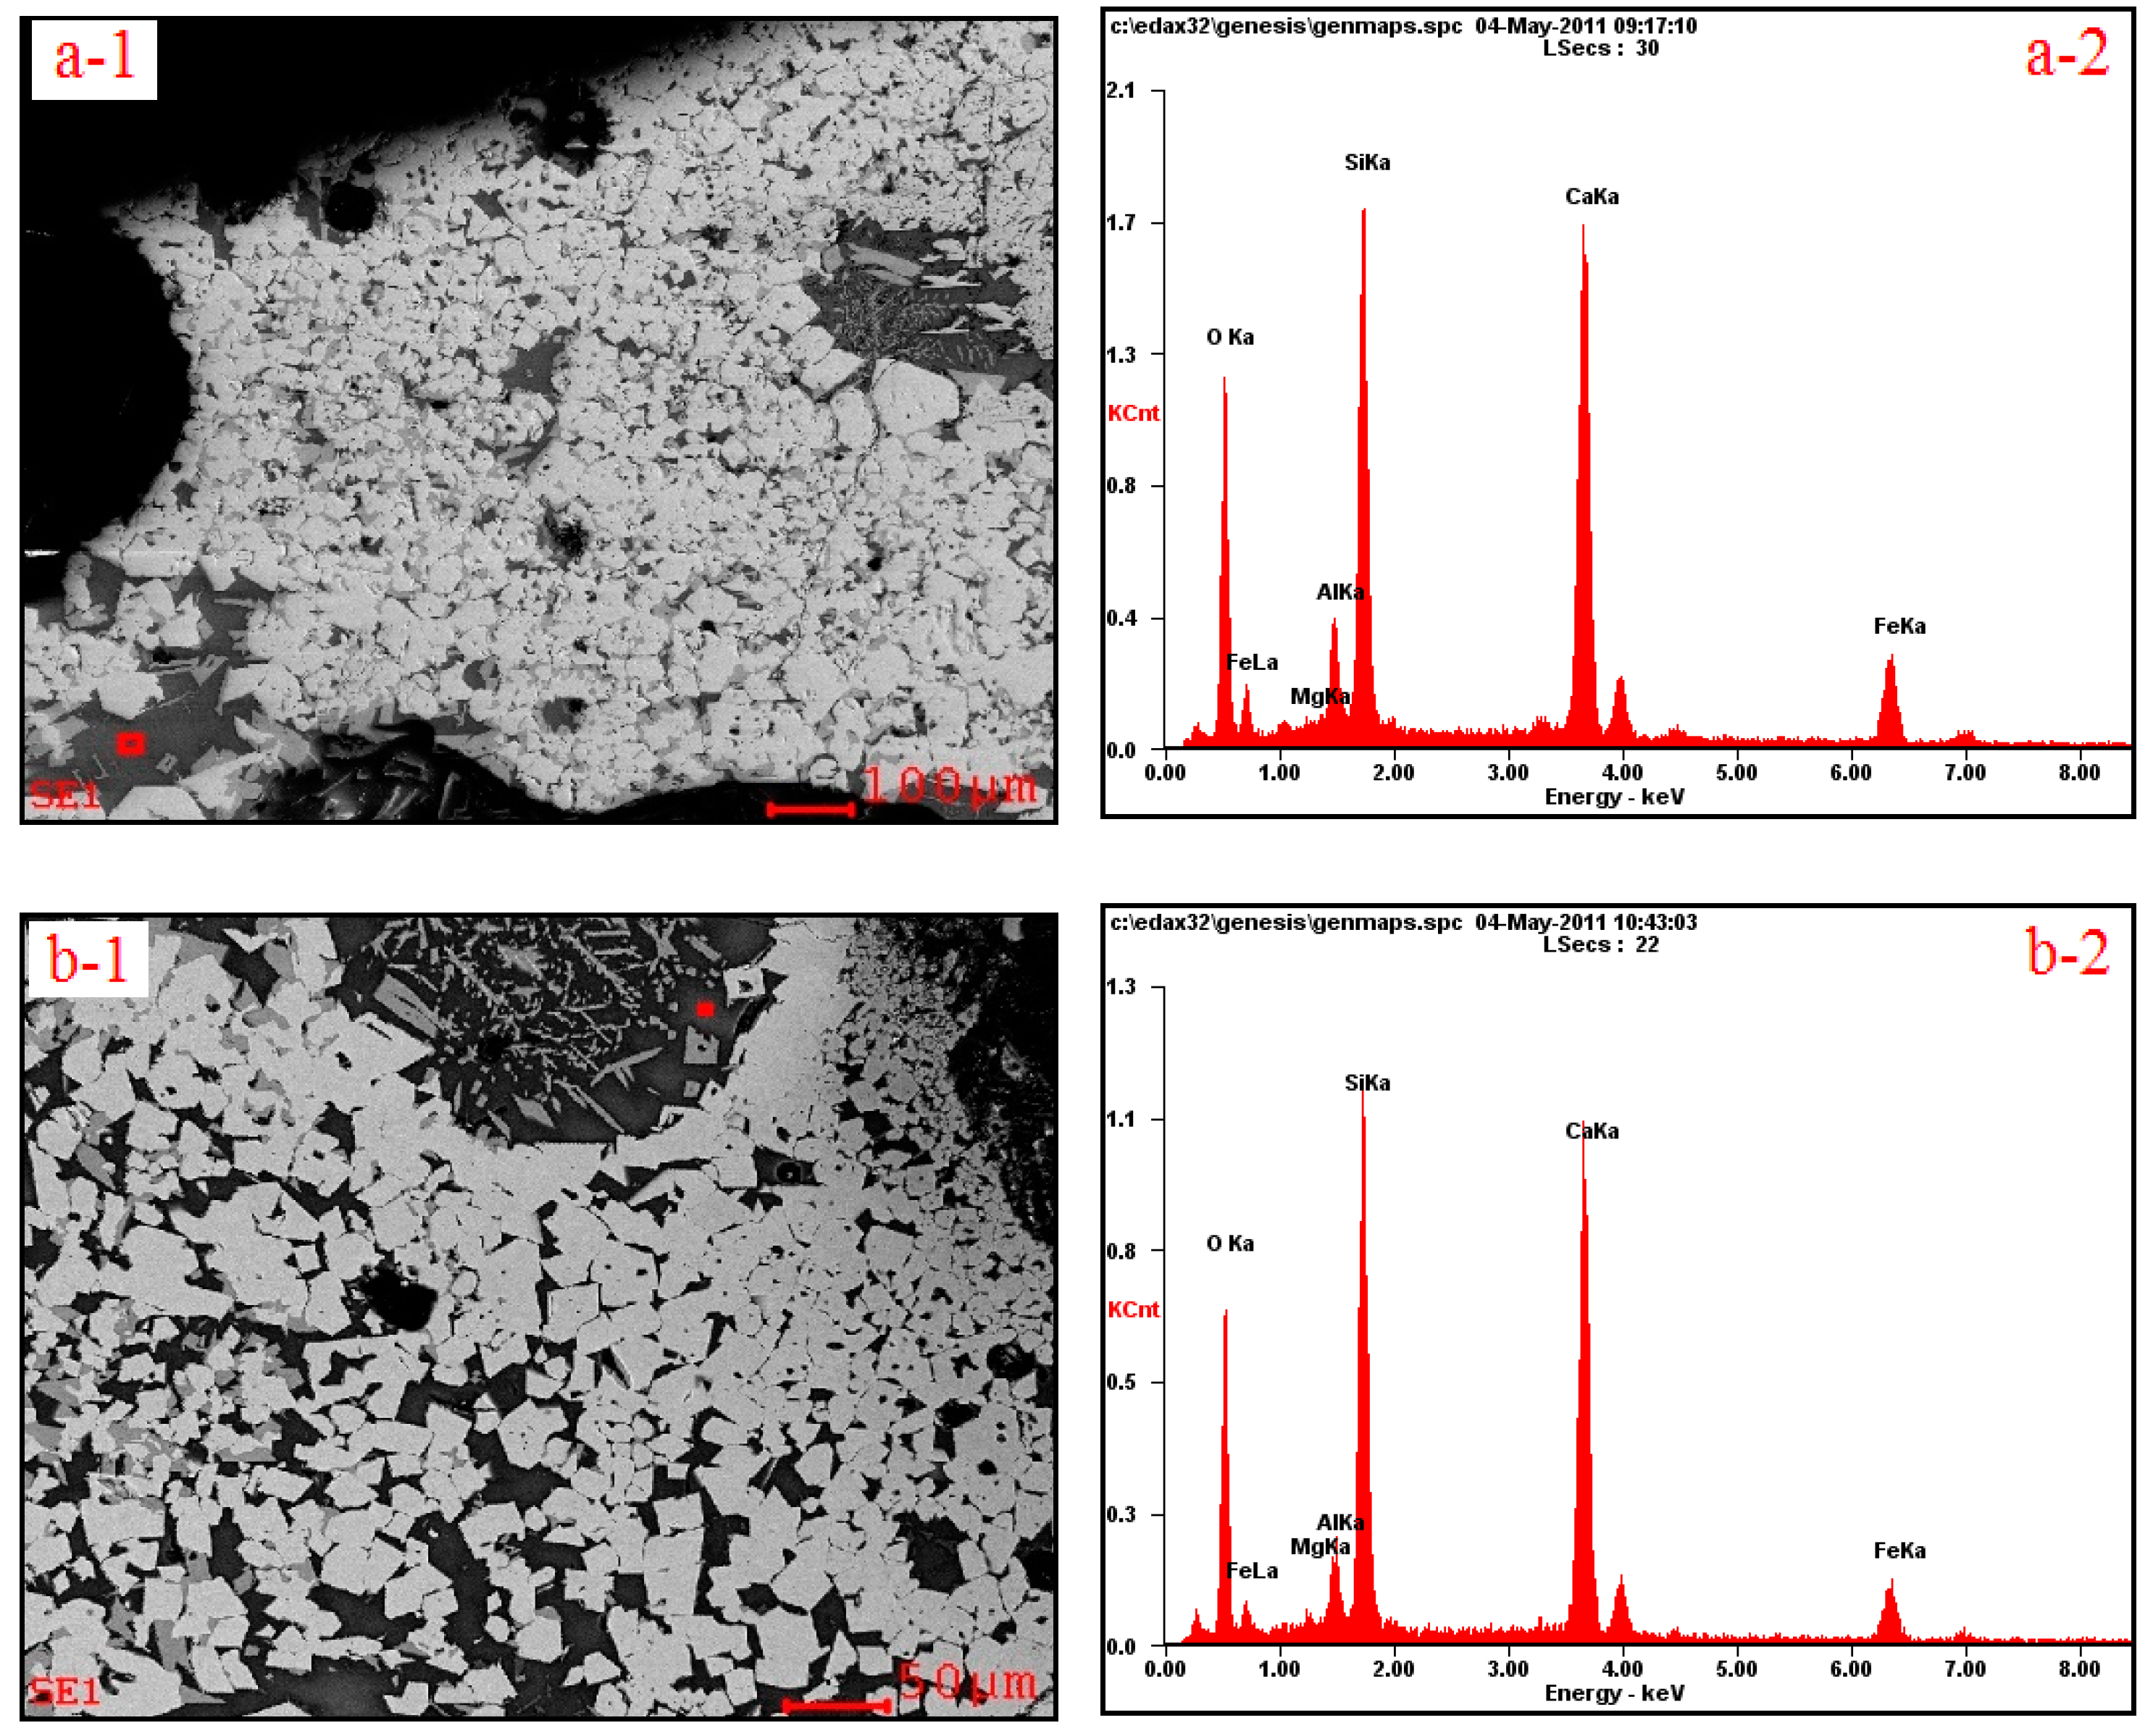
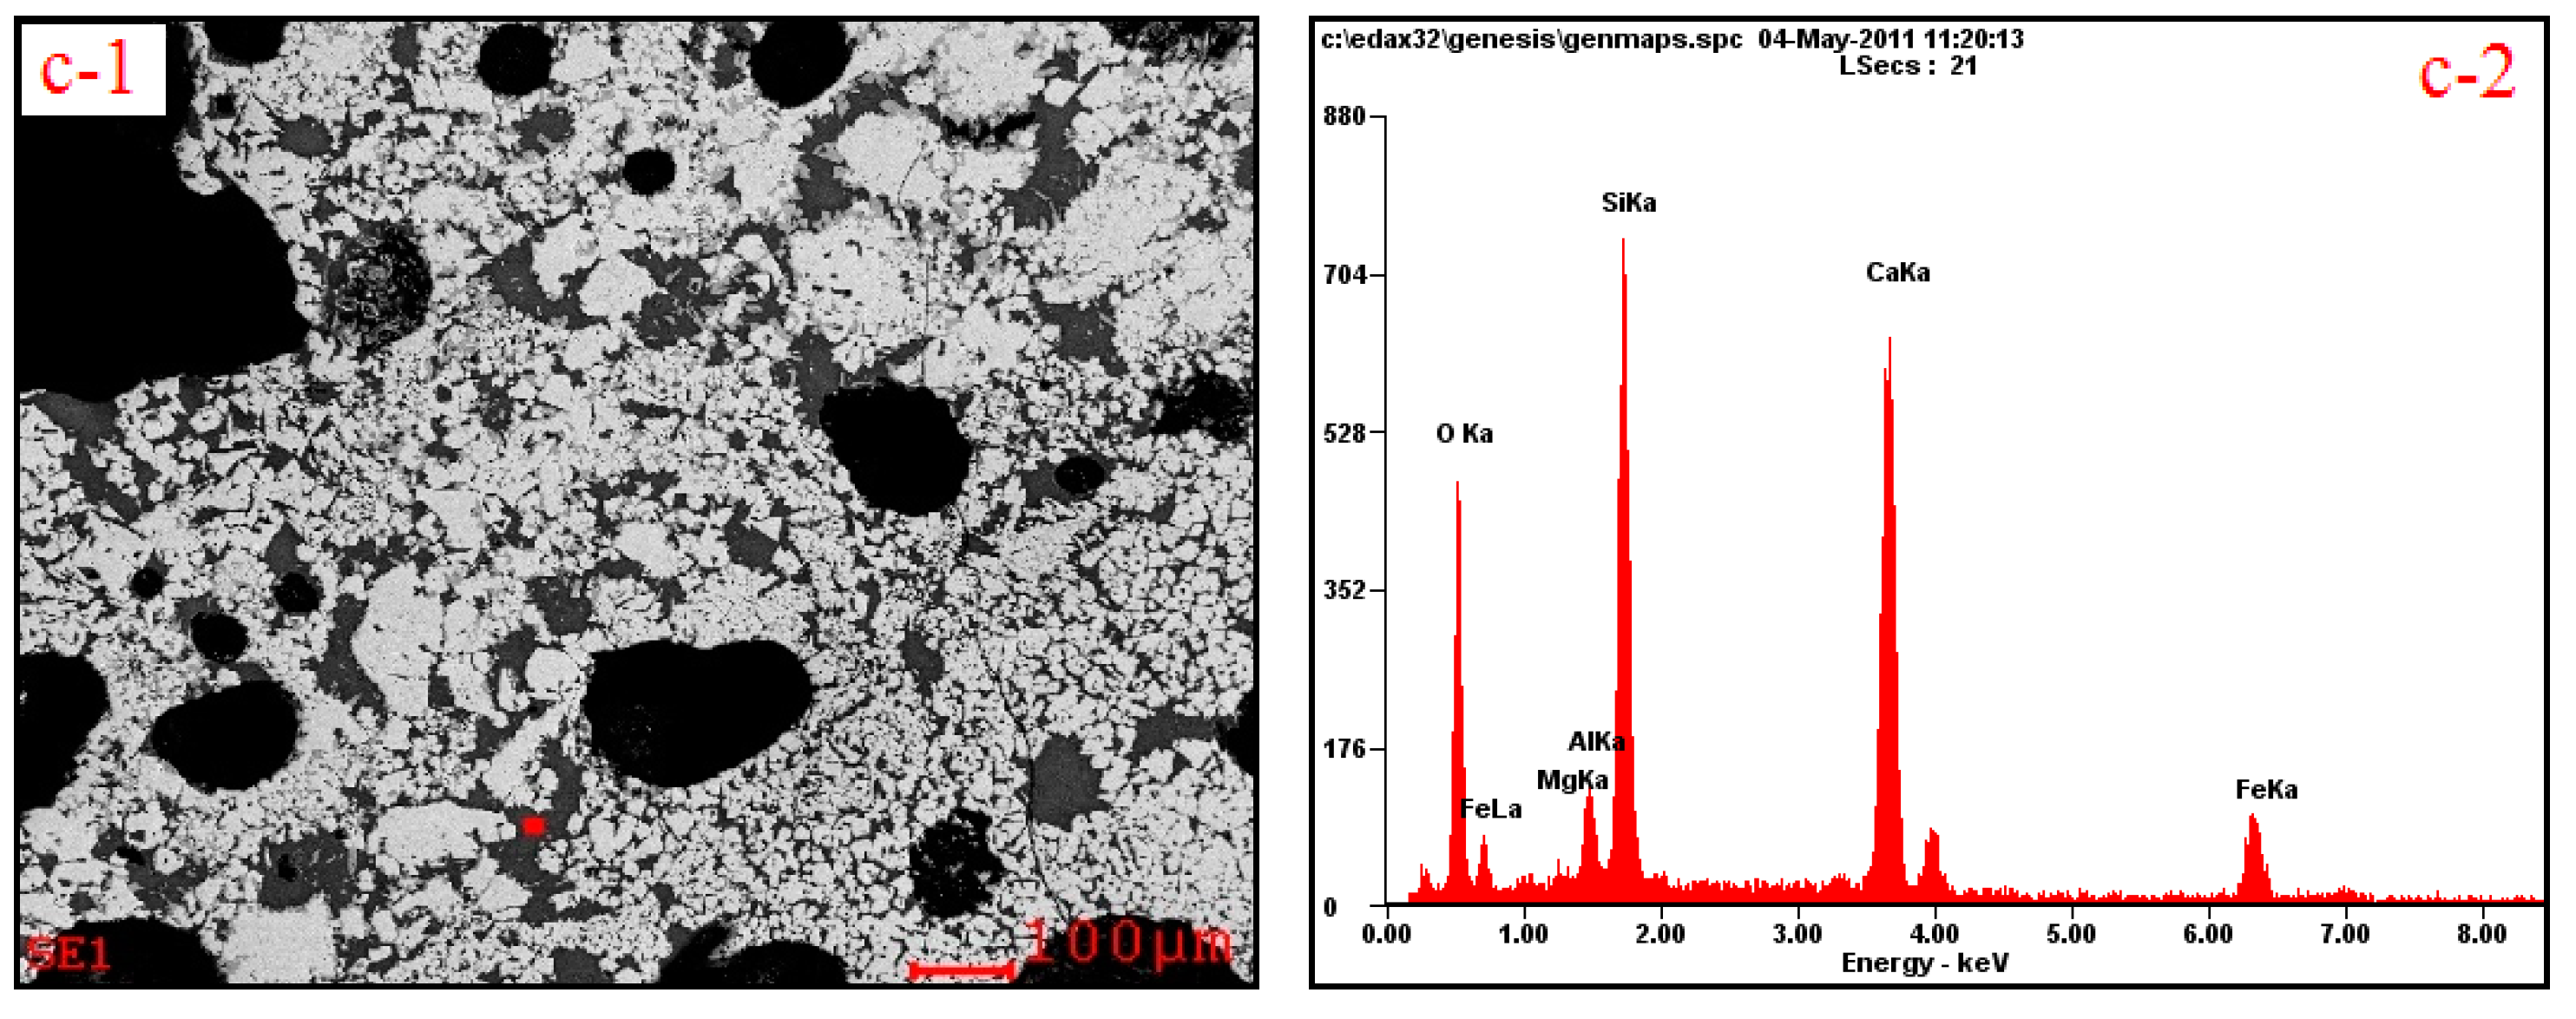
3.2. Influences of Al2O3 and SiO2 on Microcharacteristics of Sinter

Figure 5 shows the influence of the Al2O3 content on the microstructure of sinter, revealing that when the content of Al2O3 ranged from 1.00% to 2.25%, the distribution area of SFCA showed an increasing tendency. The statistical data given in Figure 6 shows that the total content of SFCA increased from 37.9 to 52.6% with the content of Al2O3 ranged from 1.00 to 2.25%. Moreover, the content of needle-like SFCA increased from 17.2 to 22.3% with the content of Al2O3 increasing to 1.80%, and again increased slightly to 22.0% with the content of Al2O3 increased to 2.25%. The content of sheet-like SFCA exhibited an obvious enhancement from 11.7 to 22.6%. Additionally, the content of granule-like SFCA changed slightly, within 8.0–11.7%.
Figure 7 shows the influence of the SiO2 content on the microstructure of sinter, indicating that with an increasing content of SiO2, the distribution area of SFCA showed a decreasing tendency. From Figure 8 it can be seen that the total content of SFCA dropped from 44.3 to 30.6%. Among the different SFCA varieties, the content of needle-like calcium dropped from 19.7 to 13.2%, the content of sheet-like SFCA dropped from 15.1 to 8.5%. However, the content of silicate increased from 8.4 to 15.3%. Moreover, a large amount of glass phase with low mechanical strength could be observed with an increasing content of SiO2. The SEM-EDS analysis showed that with an increasing content of SiO2 (Figure 9 and Table 3), the content of Ca in silicate was increased, which indicated that more Ca was combined with Si. Consequently, this phenomenon resulted in the decrease of Ca to combine with Fe, which served as the reason for the decreased content of SFCA.

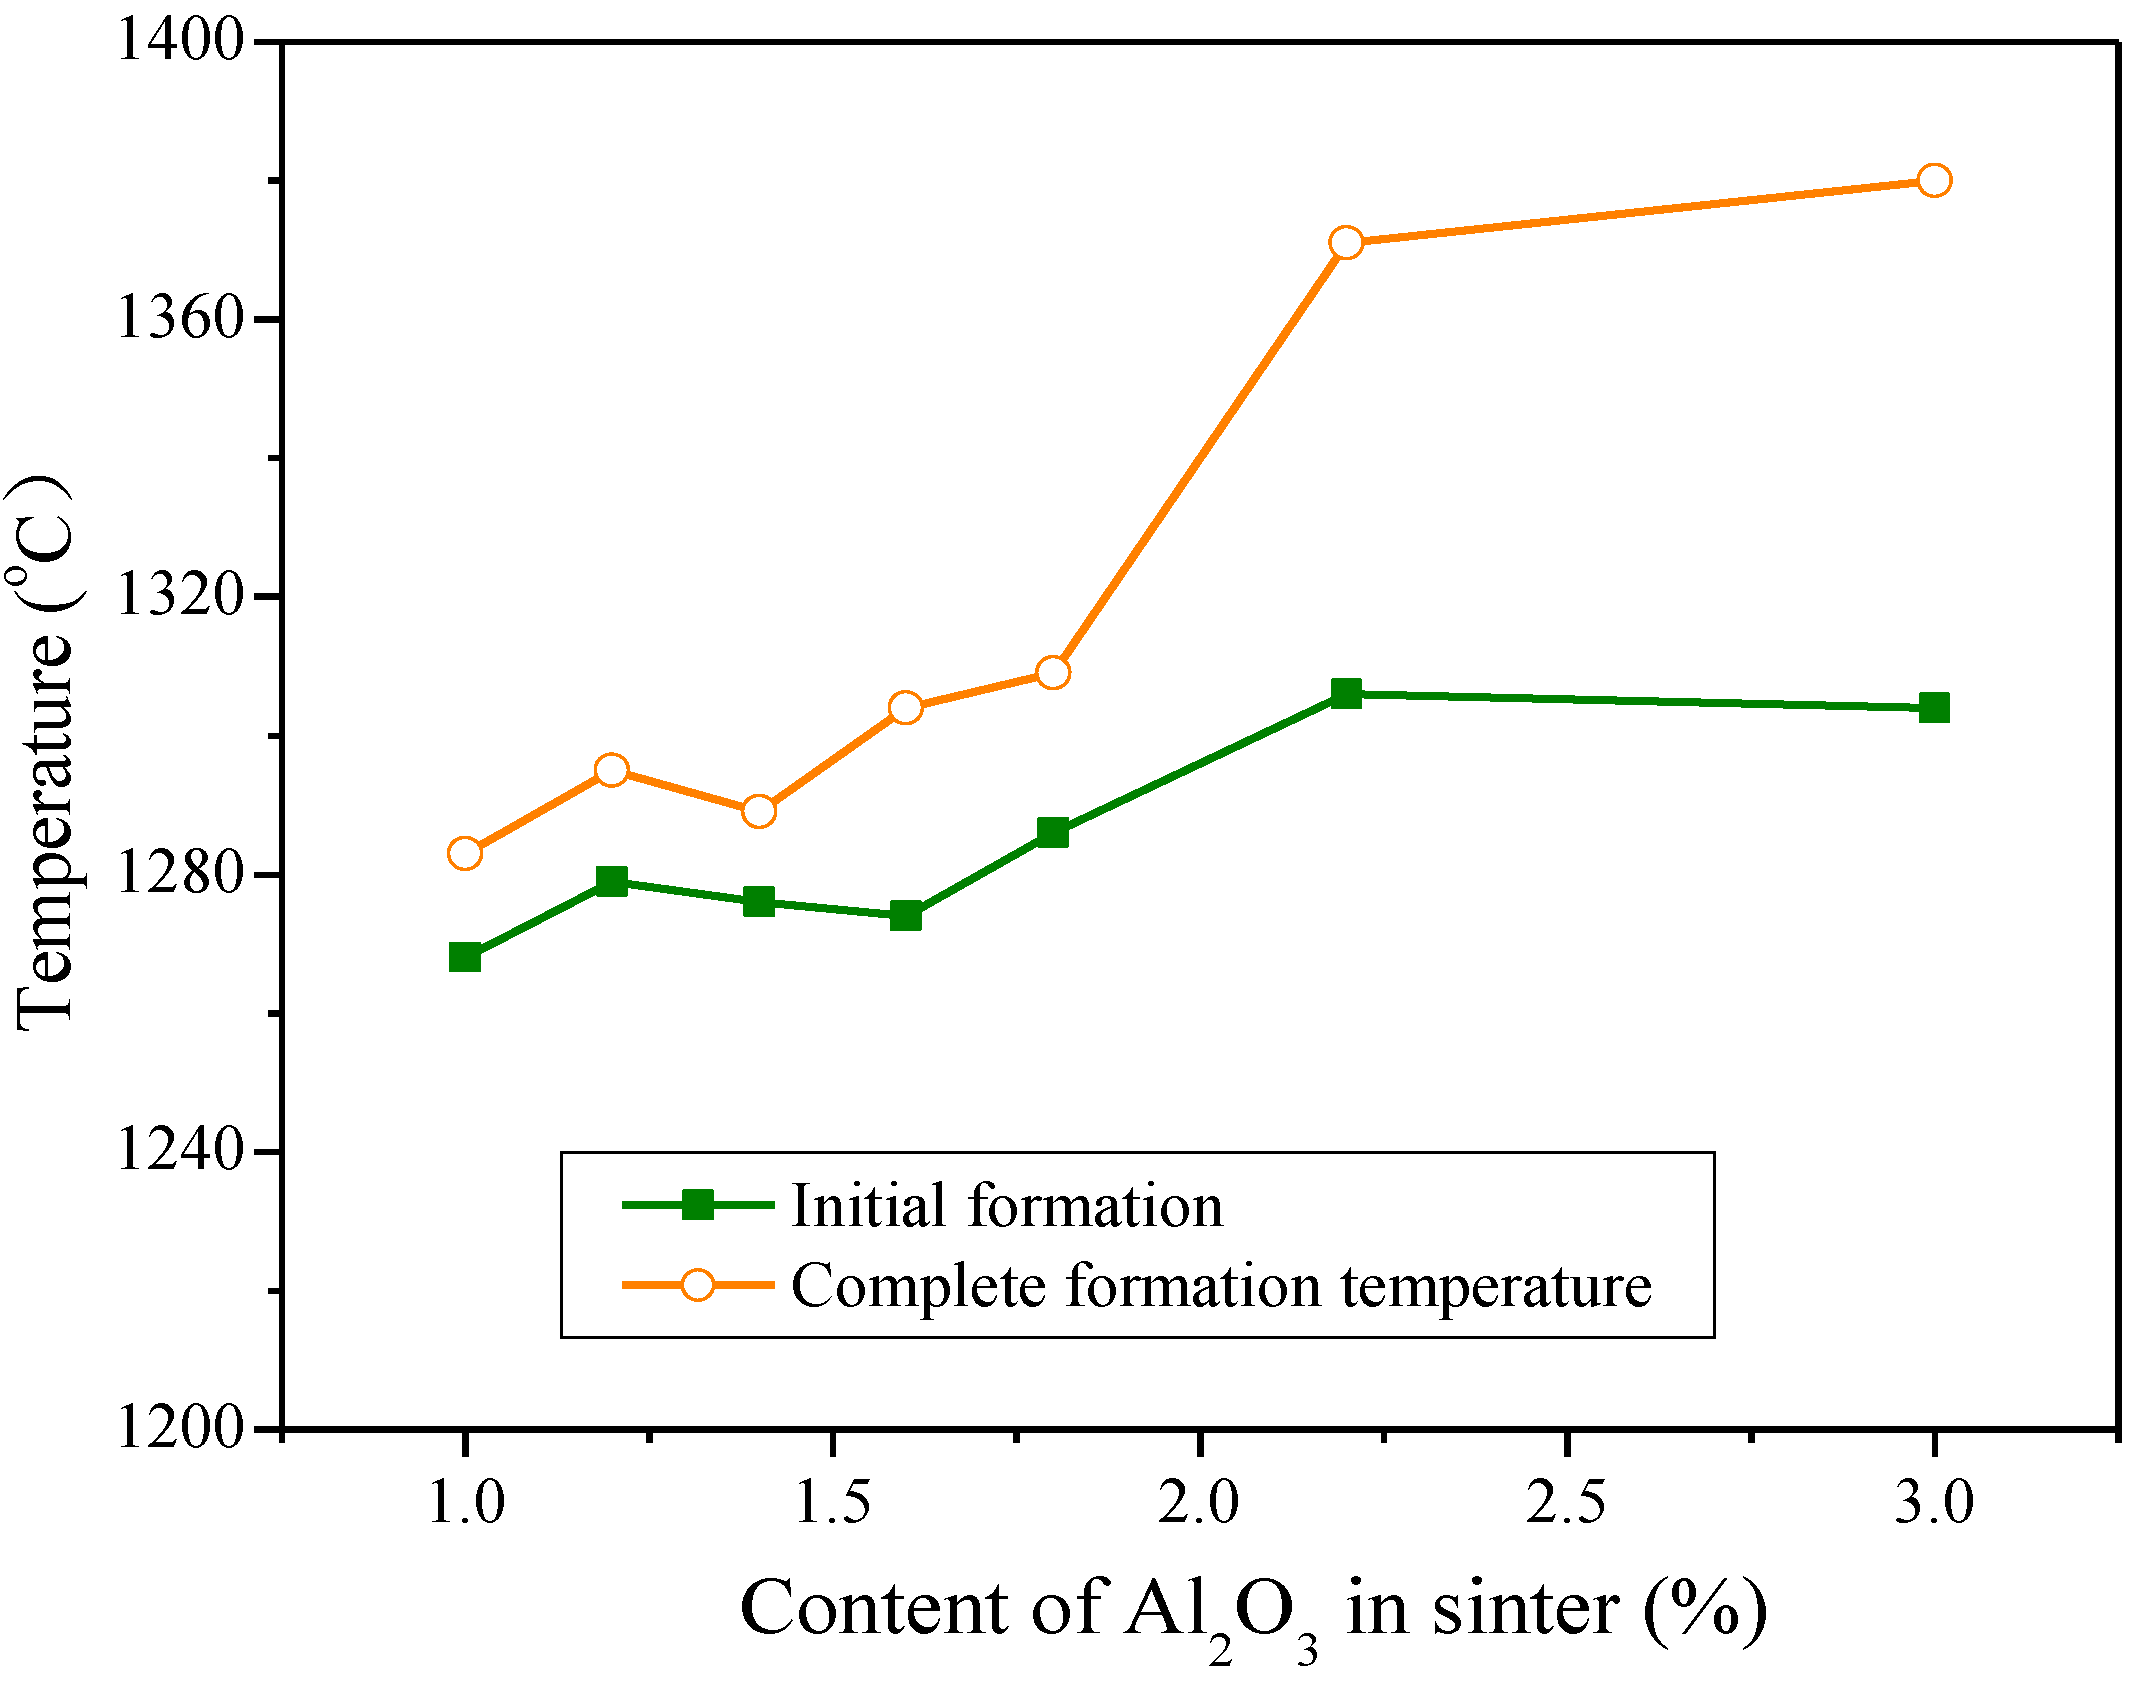
3.3. Function Mechanisms of Al2O3 and SiO2 on Sinter Quality

Figure 10 shows the effect of the Al2O3 content on the formation temperature of the liquid phase, illustrating that with an increasing content of Al2O3, the initial generating temperature of the liquid phase and the completely generated temperature exhibited an increasing tendency. Especially when the Al2O3 content exceeded 1.8%, the temperatures presented an obvious rise. From Figure 11 it can be seen that with an increasing content of Al2O3, the amount of formed liquid phase deceased and the average formation speed showed a continuous drop. An obvious drop could also be observed when the content exceeded 1.80%. Therefore, increasing the content of Al2O3 weakens the liquid phase generation ability.
Figure 12 depicts the influence of the SiO2 content on the initial liquid phase and complete formation temperatures, showing that with an increasing content of SiO2, the temperatures showed an increasing tendency. Moreover, after the content of SiO2 exceeded 4.80%, the complete formation temperature exhibited an obviously rise. Figure 13 shows the influence of the SiO2 content on the generation amount and generation speed of the liquid phase. It was found that increasing the content of SiO2 led to a decrease in these factors. Especially when the content of SiO2 exceeded 4.80%, an obvious drop was observed.
Figure 14 shows the relationship between different species of SFCA and the initial and complete formation temperatures of the liquid phase. It was found that the formation of sheet-like SFCA required higher temperatures—the initial and complete formation temperatures were 1291 °C and 1284 °C, respectively. However, the two typical temperatures of needle-like SFCA were 1279 °C and 1248 °C, respectively. This phenomenon indicates that needle-like SFCA corresponds to lower initial and complete formation temperatures. Figure 15 shows the amount of formed liquid phase and the formation speed. It can be seen that the formation of needle-like SFCA corresponded to the rapid formation of the liquid phase.
As stated above, increasing the content of Al2O3 in sinter promoted the formation of SFCA, with the content of sheet-like SFCA being enhanced to a much extent compared to needle-like SFCA. This could be attributed to the increased formation temperature of the liquid phase and the decreased generation velocity of the liquid phase, which favored the liquid formation properties of sheet-like SFCA, especially when the content of Al2O3 exceeded the recommended value of 1.80%. Moreover, with an increasing content of SiO2, the amount of SFCA decreased. This also be attributed to its influence on the formation properties of the liquid phase, with the exception of that fact that more Ca was transformed into silicate. A higher content of SiO2 in sinter led to a higher formation temperature of SFCA, and the generation velocity of SiO2 also presented an obvious drop when the content of SiO2 exceeded 4.80%.
To further reveal the effects of SiO2 and Al2O3 on sinter quality, the mechanical strengths of different species of SFCA were examined. As shown in Figure 16, needle-like SFCA showed the highest compression strength of 1809 N, which was considerably higher than that of sheet-like SFCA, which reached 1186 N, and that of the calcium silicate, which showed the lowest compression strength of 1035 N. These results agree well with those of Loo et al. and Ying et al. [18,19]. Moreover, the fracture toughness and Vickers hardness of different kinds of minerals were also measured, and the results are shown in Figure 17. It can be seen that the silicate presented the lowest hardness of 404.38 Gg/m2 and fracture toughness of 0.524 MN/m3/2. Therefore, increasing the content of SiO2 in sinter would lead to the decrease of the tumbler index as more silicate is formed. Moreover, among the different SFCA types, needle-like SFCA showed the highest hardness of 683.31 Gg/m2 and fracture toughness of 1.30 MN/m3/2. Sheet-like SFCA showed a much lower hardness of 489.34 Gg/m2 and a fracture toughness of 0.65 MN/m3/2. As a consequence, it is not hard to understand that increasing the content of Al2O3 would decrease the tumbler index of sinter, as more sheet-like SFCA with lower mechanical strength is formed.

4. Conclusions

(1) The influence of the Al2O3 content on sinter quality was revealed—increasing the content to 1.80% improved the tumbler index and productivity, while an obvious drop occurred when the content. exceeded 1.80%. This suggests that the optimal Al2O3 content in sinter should be controlled to be within 1.80%. A potential reason for this result is that the generation amount of bonding phase SFCA increases as the Al2O3 content rises, while sheet-like SFCA with a lower mechanical strength predominates when the content exceeds 1.80%.
(2) The influence of the SiO2 content on sinter quality was revealed—enhancing the content led to the decrease of the tumbler index, especially when the content exceeded 4.80%, while the average amount of silica in sinter in practical sintering plants ranges between 5 and 5.5%. This result can be attributed to the formation of calcium silicate with lower mechanical strength, which reduces the effective amount of CaO to react with Fe2O3 to form SFCA with a lower mechanical strength.
(3) Our research findings elucidated the effects of changing Al2O3 and SiO2 contents on sintering performance, which is useful for guiding efficient sinter production processes using large amounts of imported iron ores.

Author Contributions

The whole work was done by the authors listed in this paper, specifically, conceptualization, M.G.; methodology, L.H.; software, L.H.; validation, Z.J., M.G., and X.F.; formal analysis, Z.J., X.C., and Y.Z.; investigation, L.H.; resources, X.F.; data curation, L.H.; writing—original draft preparation, Z.J.; writing—review and editing, X.F.; visualization, X.F.; supervision, X.F.; project administration, X.F.; funding acquisition, X.F. and Z.J.

Funding

This work was financially supported by the National Natural Science Foundation of China (Grant No. U1660206 and Grant No. 51804347) and the Foundation supported by Central South University for Young Teachers.

Conflicts of Interest

The authors declare no conflict of interest.

References

  1. Zhang, Q.; Zhang, W.; Wang, Y.J.; Xu, J.; Cao, X.C. Potential of energy saving and emission reduction and energy efficiency improvement of China’s steel industry. Iron Steel 2019, 54, 7–14. [Google Scholar]
  2. Li, X.C. Road map to high-quality development of iron and steel industry in new age. Iron Steel 2019, 54, 1–7. [Google Scholar]
  3. Hessien, M.M.; Kashiwaya, Y.; Ishii, K.; Nasr, M.I.; El-Geassy, A.A. Sintering and heating reduction processes of alumina containing iron ore samples. Ironmak. Steelmak. 2008, 35, 191–204. [Google Scholar] [CrossRef]
  4. Umadevi, T.; Prakash, S.; Bandopadhyay, U.K. Influence of alumina on iron ore sinter quality and productivity. World Iron Steel 2010, 4, 12–18. [Google Scholar]
  5. Clout, J.; Manuel, J. Fundamental investigations of differences in bonding mechanisms in iron ore sinter formed from magnetite concentrates and hematite ores. Powder Technol. 2003, 130, 393–399. [Google Scholar] [CrossRef]
  6. Chen, C.L.; Lu, L.M.; Jiao, K.X. Thermodynamic modelling of iron ore sintering reactions. Minerals 2019, 9, 361. [Google Scholar] [CrossRef]
  7. Park, J.H.; Cho, Y.J.; Yoon, S.S. Effect of Al2O3, SiO2 and MgO on the formation of SFCAs in sinter using X-ray diffraction method. J. Korean Inst. Met. Mater. 2002, 40, 811–817. [Google Scholar]
  8. Liu, J.B.; Li, L.S. Influence of Al2O3 on sinter for its phase compositions and properties in equilibrium. J. Anhui Univ. Technol. 2009, 26, 333–337. [Google Scholar]
  9. Lu, L.; Holmes, R.J.; Manuel, J.R. Effect of alumina on sinter performance of hematite iron ores. ISIJ Int. 2007, 47, 349–358. [Google Scholar] [CrossRef]
  10. Webster, N.A.S.; Odea, D.P.; Ellis, B.G.; Pownceby, M.I. Effects of gibbsite, kaolinite and Al-rich goethite as alumina sources on silico-ferrite of calcium and aluminum (SFCA) and SFCA-I iron ore sinter bonding phase formation. ISIJ Int. 2017, 57, 41–47. [Google Scholar] [CrossRef]
  11. Webster, N.A.S.; Pownceby, M.I.; Madsen, I.C.; Studer, A.J.; Manuel, J.R.; Kimpton, J.A. Fundamentals of silico-ferrite of calcium and aluminum (SFCA) and SFCA-I iron ore sinter bonding phase formation: Effects of CaO:SiO2 ratio. Metall. Mater. Trans. B 2014, 45, 2097–2105. [Google Scholar] [CrossRef]
  12. Feng, X.P.; Zhang, Y.Z. Influence of basicity on the low silicon sinter strength. Sinter. Pelletizing 2004, 29, 41–47. [Google Scholar]
  13. Zhang, Y.Z.; Feng, X.P.; Li, Z.G.; Yin, H.S. Study and practice of improving the metallurgical property of low silicon sinter. Sinter. Pelletizing 2004, 29, 4–7. [Google Scholar]
  14. Wang, R.C.; Fu, J.Y. Study on production of high Fe and Low SiO2 Sinter. Iron Steel 2007, 42, 18–23. [Google Scholar]
  15. Fan, X.H.; Ji, Z.Y.; Gan, M.; Chen, X.L.; Jiang, T. Integrated assessment on the characteristics of straw-based fuels and their effects on iron ore sintering performance. Fuel Process. Technol. 2016, 150, 1–9. [Google Scholar] [CrossRef]
  16. Fan, X.H.; Jiang, T.; Gan, M. A Method for Detecting the Liquid Phase Formation Characteristics of Sintered Iron Ore. Chinese Patent ZL200910307772.9, 22 June 2011. [Google Scholar]
  17. Gan, M.; Fan, X.H.; Chen, X.L.; Ji, Z.Y. High temperature mineralization behavior of mixtures during iron ore sintering and optimizing methods. ISIJ Int. 2015, 55, 742–750. [Google Scholar] [CrossRef]
  18. Loo, C.E.; Wan, K.T.; Howes, V.R. Mechanical properties of natural and synthetic mineral phases in sinters having varying reduction degradation indices. Ironmak. Steelmak. 1998, 15, 279–285. [Google Scholar]
  19. Ying, Z.W.; Jiang, M.F.; Xu, L.X. Effects of Mineral Composition and Microstructure on Crack Resistance of Sintered Ore. J. Iron Steel Res. Int. 2006, 13, 9–12. [Google Scholar] [CrossRef]
Figure 1. The device used for the mini-sintering test. 1—Computer; 2—Camera; 3—Transparent glass; 4—Silicon tube; 5—Heating furnace; 6—Thermocouple; 7—Standard pyrometric cone; 8—Gas mixer; 9—Flowmeter; 10—Reducing valve; 11—Gas bottle; 12—Temperature display panel; 13—Controller.
Minerals 09 00449 g001
Figure 2. Temperature and atmosphere profile during the heating process.
Minerals 09 00449 g002
Figure 3. Influence of Al2O3 content on productivity and tumbler index.
Minerals 09 00449 g003
Figure 4. Influence of SiO2 content on productivity and tumbler index.
Minerals 09 00449 g004
Figure 5. Effects of Al2O3 content on microstructure. (a-1,a-2,a-3) Al2O3 = 1.00%; (b-1,b-2,b-3) Al2O3 = 1.55%; (c-1,c-2,c-3) Al2O3 = 1.80%; (d-1,d-2,d-3) Al2O3 = 2.25%; M—magnetite; H—hematite; CS—silicate.
Minerals 09 00449 g005aMinerals 09 00449 g005b
Figure 6. Effects of Al2O3 content on mineral composition.
Minerals 09 00449 g006
Figure 7. Effects of SiO2 content on microstructure. (a-1,a-2,a-3) SiO2 = 4.80%; (b-1,b-2,b-3) SiO2 = 5.32%; (c-1,c-2,c-3) SiO2 = 5.59%; (d-1,d-2,d-3) SiO2 = 6.60%; M—magnetite; H—hematite; CS—silicate.
Minerals 09 00449 g007aMinerals 09 00449 g007b
Figure 8. Effects of SiO2 content on mineral composition.
Minerals 09 00449 g008
Figure 9. SEM-EDS of silicate. (a-1) SiO2 = 4.00% SEM; (b-1) SiO2 = 5.32% SEM; (c-1) SiO2 = 6.00% SEM; (a-2) SiO2 = 4.00% EDS; (b-2) SiO2 = 5.32% EDS; (c-2) SiO2 = 6.00% EDS.
Minerals 09 00449 g009aMinerals 09 00449 g009b
Figure 10. Effects of Al2O3 content on the formation temperature of the liquid phase.
Minerals 09 00449 g010
Figure 11. Effects of Al2O3 content on the production and formation rate of the liquid phase.
Minerals 09 00449 g011
Figure 12. Influence of SiO2 content on the formation temperature of the liquid phase.
Minerals 09 00449 g012
Figure 13. Influence of SiO2 content on the amount and generation velocity of the liquid phase.
Minerals 09 00449 g013
Figure 14. Relationship between the structures of SFCA and the liquid formation temperatures of SFCA.
Minerals 09 00449 g014
Figure 15. Relationship between the structures of SFCA and the liquid formation properties and SFCA.
Minerals 09 00449 g015
Figure 16. Average compressive strength of typical kinds of minerals.
Minerals 09 00449 g016
Figure 17. Fracture toughness and Vickers hardness of typical kinds of minerals.
Minerals 09 00449 g017
Table 1. Chemical compositions of iron ores.
Iron Ore TypesNumberChemical Compositions/%bLOI/%
aTFeFeOCaOMgOSiO2Al2O3
Typical Brazilian iron ores1#63.865.020.100.114.591.142.79
2#65.691.010.000.113.910.691.72
3#67.220.140.070.271.041.001.78
4#68.090.220.020.261.380.391.07
5#66.080.330.160.161.751.211.25
6#60.850.510.120.078.421.822.08
Typical Australian iron ores7#62.132.590.330.263.801.934.81
8#61.791.150.080.264.221.984.88
9#61.930.860.040.182.931.776.32
10#61.200.410.080.093.222.516.30
11#60.190.290.480.202.671.149.08
12#57.211.290.000.105.621.3711.21
Typical Indian iron ores13#63.321.720.050.162.842.323.71
14#58.210.270.090.095.513.495.93
15#62.801.540.290.344.792.642.19
Typical South Africa iron ores16#64.330.290.190.244.841.600.90
17#63.060.240.100.046.022.041.38
18#65.170.290.150.044.261.150.63
Typical Canadian iron ores19#66.812.540.530.804.020.100.34
Typical domestic iron ores20#54.842.450.470.3113.641.681.05
21#63.4622.421.190.825.970.891.61
22#60.0718.111.330.937.002.163.02
23#62.8921.270.090.389.680.841.40
a TFe = total iron contents; b LOI = loss on ignition in air at 950 °C.
Table 2. Chemical composition of flux, fuel, and return fines.
Material TypesChemical CompositionLOI/%
TFeFeOCaOMgOSiO2Al2O3S
Limestone--50.662.281.49--40.72
Dolomite--32.6419.830.71--46.47
Quicklime--75.333.603.58-0.1717.03
Coke breeze4.11-1.540.282.631.88-89.16
Return fines55.4610.219.422.025.034.300.580.21
Table 3. Effects of SiO2 content on composition of silicate.
SiO2/%Ca/%Si/%Al/%Fe/%
4.0023.4416.642.8911.39
5.3226.7118.153.249.46
6.0027.0618.802.5211.70

