Article

Application of Polling Scheduling in Mobile Edge Computing

1
School of Information Science and Engineering, Yunnan University, Kunming 650000, China
2
Educational Instruments and Facilities Service Center, Educational Department of Yunnan Province, Kunming 650000, China
3
Key Laboratory of Education Informatization for Nationalities of Ministry of Education, Yunnan Normal University, Kunming 650000, China
*
Author to whom correspondence should be addressed.
Axioms 2023, 12(7), 709; https://doi.org/10.3390/axioms12070709
Submission received: 15 June 2023 / Revised: 12 July 2023 / Accepted: 19 July 2023 / Published: 21 July 2023

Abstract

:
With the Internet of Things (IoT) development, there is an increasing demand for multi-service scheduling for Mobile Edge Computing (MEC). We propose using polling for scheduling in edge computing to accommodate multi-service scheduling methods better. Given the complexity of asymmetric polling systems, we have used an information-theoretic approach to analyse the model. Firstly, we propose an asymmetric two-level scheduling approach with priority based on a polling scheduling approach. Secondly, the mathematical model of the system in the continuous time state is established by using the embedded Markov chain theory and the probability-generating function. By solving for the probability-generating function’s first-order partial and second-order partial derivatives, we calculate the exact expressions of the average queue length, the average polling period, and the average delay with an approximate analysis of periodic query way. Finally, we design a simulation experiment to verify that our derived parameters are correct. Our proposed model can better differentiate priorities in MEC scheduling and meet the needs of IoT multi-service scheduling.

1. Introduction

The rapid rise of the mobile Internet in recent years, coupled with the accelerating pace of communication technology iterations and updates, has made the Internet of Everything a hot topic [1]. The experience of the Internet of Things (IoT) is directly related to the speed of transmission [2]. Although the Central Processing Unit (CPU) computing power of wireless devices is becoming increasingly powerful, it is still impossible to complete the data processing of these complex applications in a short time [3,4]. In addition, data processing locally also faces the problem of high energy consumption [5,6]. To overcome these problems, some scholars have tried to establish Mobile Edge Computing (MEC) techniques, and they have received much attention [7,8].
The Medium Access Control (MAC) layer protocol is responsible for time and channel access in the network. It is essential in allocating network resources and affects performance [9]. Currently, MEC is mainly focused on server deployment and compute offload, with less research on MAC protocols for MEC. It is crucial to design an efficient MAC protocol in MEC. Su, H. et al. [10] apply the MEC network architecture to an e-healthcare system and design a wireless body area network multi-channel MAC protocol based on a Markov decision process, which reduces MEC system conflicts and improves efficiency. L. Hu et al. [11] introduce AI alerting traffic to improve the scheduling of MEC, reducing server scheduling conflict and improving system efficiency. B. Li et al. [12] use NVF technology to propose a random scheduling method that reduces communication costs and improves communication efficiency. J. Tian and Hou. P. et al. [13,14,15,16,17] all use reinforcement learning to improve the scheduling algorithm to enhance the scheduling efficiency of MEC and reduce delay.
However, when edge servers are deployed, there is the problem of maximizing the efficiency of their utilization. As shown in Figure 1, an edge server is deployed for the hospital in an edge zone for the doctors to get the patient’s status as soon as possible. The capacity of the hospital information center to process the data (X-rays, Computed Tomography, blood tests) needs to be enhanced. The edge server provides services to the hospital information center. When the hospital information center does not need the services, the edge server will be idle—wasting computing resources. In order to maximize the utilization of the edge servers, the idle edge server can be made to provide services to other users within the service area. While the edge service is serving other users, the hospital information center will generate new data that needs to be served by the edge server. If we wait for the edge server to finish serving all the users in the service range and then provide service to the hospital information center, it will generate high latency for the hospital. The patient’s condition will not be treated in time, causing further deterioration. So we need to update the way MEC of scheduling. A MEC with priority cases was proposed by Z. Qin et al. [18]. Task Scheduling: Scheduling reconnaissance tasks’ execution sequence. Task selection and scheduling in UAV-enabled MEC for reconnaissance are exceptionally challenging due to many factors. A user may have a group of tasks to be processed in parallel, with different tasks having different delay limits and computation-workload requirements. D. Lin and P. Shukla et al. [19,20,21,22,23,24] mentioned the need for MEC in prioritizing. None of the proposed MAC scheduling methods with priority in these papers calculate an accurate expression for the parameter metrics and cannot be evaluated for reasonableness. Therefore, we must propose a suitable scheduling method and calculate an accurate expression for the parameter metrics.
Polling is a typical scheduling method. The main metrics of a polling system are average queue length, average polling period, and average delay. Two-level priority asymmetric polling system is a complex network system. How to model the system? How to solve the system parameters? How to optimize the scheduling method? These issues have been a challenge in the study of polling systems.
We know that the transmission of information packets is a Poisson process, and the probability-generating function can solve the first-order moments and the second-order moments of the distribution function when only the distribution function is known. How to establish the probability-production function for asymmetric polling systems? How to solve for the first-order and second-order moments of an asymmetric polling system? These problems have been the difficulties and hotspots in studying asymmetric polling systems using probability-production functions.
To meet the need to differentiate MEC multi-services, we propose a two-level polling Medium Access Control (MAC) protocol with differentiated priority for MEC and different unloading times and calculation processing times for User Equipment (UE). The differences between this paper and other literature are shown in Table 1.
Compared to other works of literature, our contribution is to propose a two-level priority model for asymmetric polling systems. Moreover, we accurately calculate the system’s average queue length, average polling period, and average delay. The asymmetric polling system with two-level priority is more relevant than the symmetric polling system, and our proposed model can derive user-specific parameter metrics, which reduces the edge computing scheduling task latency and improves the rate at which users can transmit data.
The innovations of this paper are as follows:
  • We propose a two-level priority exhaustive service model, and the parameters of normal nodes are asymmetrical, corresponding to the 3rd section of this paper.
  • We computed specific expressions for the model’s average queue length and polling period. We calculated the average delay with an approximate analysis of periodic query way, corresponding to this paper’s fourth and fifth sections.
  • We designed a Monte Carlo experiment with a small error between the theoretical and experimental values for many repetitions, corresponding to the 7th section of this paper.
The paper is organized as follows. The first section focuses on some of the hotspots and difficulties of current research in MEC clarifies why it is essential to improve the MAC protocol for MEC, and introduces polling techniques to mobile edge computing. The second part is a review of the literature. We present the polling technique’s features and the current research’s difficulties, and compare them with the relevant literature. In the thrid section, a model of a polling system with priority is proposed, and random variables for the system state are defined. The 4th section pushes the specific equations for the average queueing length, polling period, and system delay. In Section 5, a Monte Carlo experiment was designed to verify the error rate between the theoretical and simulated values when the experiment was repeated 300,000 times. In Section 6, we summarise the advantages of polling techniques applied to MEC and reveal the direction of future work.

2. Literature Review

Polling originates in the so-called polling data link control scheme, in which the server asks each terminal on the communication line to determine if it has any information to transmit. The addressed terminal transmits the information, and the computer then switches to the next terminal to check whether that terminal has any information to transmit. From a broader perspective, the polling model is suitable for several users competing to access a shared resource only available to one user at a time. The prevalence of polling systems can be observed in many applications, for example, in computer communications, production, transport, and maintenance systems. This paper discusses the main application areas of polling systems and an extensive list of references, examines how these different applications can be represented and analyzed using a polling model, and outlines several topics for future research both within and outside the mentioned area [25].
In the past, various survey papers dedicated to voting systems have appeared in the open literature. Detailed and comprehensive descriptions of the mathematical analysis of voting systems are given in [25,26,27,28]. While these papers have many mathematical models to derive parameter metrics for polling systems, they all have limitations. Furthermore, since the publication of the survey papers 10–15 years ago, many papers on voting models have been published. This survey is aimed at academics and practitioners. The list of references is relatively recent but has yet to be totaled. Readers interested in delving into the specific mathematical details of the polling system can do so from the references in the survey papers mentioned above.
Polling is an effective transmission technique, and it is widely used in various industries, such as computers, communications, and industrial control. D. Miculescu and Li, S. et al. [29,30] use a polling mechanism in autonomous driving, reducing delays and improving system stability. Mohamed S. and Zakir, R. et al. [31,32] apply a polling mechanism to robots, enabling low-latency robot swarm control to cooperate in completing tasks. The swarm of robots can perform more complex tasks than a single robot. In order to increase the computational efficiency of UAVs and to perform more complex tasks, Nidal Nasser and Sudesh Kumar et al. [33,34,35] used polling techniques. Polling techniques are now widely used in information technology.
According to the service method, polling service systems are classified as gated, exhausted, and limited-k [36]. The exhaustive service rule is that the server continues working until the queue becomes empty; the gated service rule, under which precisely those clients that appear in the queue at the start of the access are served; and the global gated service, which states that only those clients that appear in the epoch when the server reaches some predetermined "parent queue" are served. With the limited-k service policy, the server works in a queue until a predefined client is served or the queue becomes empty. Average queue length and average delay are key metrics of how good a polling system is, and few methods are solving for polling system metrics. Some scholars have used machine learning methods to make predictions [37,38]. However, machine learning is subject to errors between predicted and actual values. In order to meet practical business needs, a two-level priority polling is proposed based on three basic polling service models [39]. The concept of cycle delay and the exact Laplace-Stieltjes transform (LST) formula and representation of the average delay is given by Chu Y Q et al. [40]. A two-level priority polling system based on a gated multi-level threshold service is proposed by WH.M. et al. [41]. This polling system meets the development needs of service diversity and resilient services while allocating service resources in a cyclical system. A new two-level priority polling system is proposed by Z.G. et al. [42], ensuring queue priority requirements, avoiding time delays caused by idle queries, improving system utilization, and reducing latency effects. ZJ. Y. et al. [43] proposes a two-level priority exhaustive service polling system model, but symmetrically. In this paper, we propose a two-level priority exhaustive service model, and the parameters of normal nodes are asymmetrical.

3. System Model

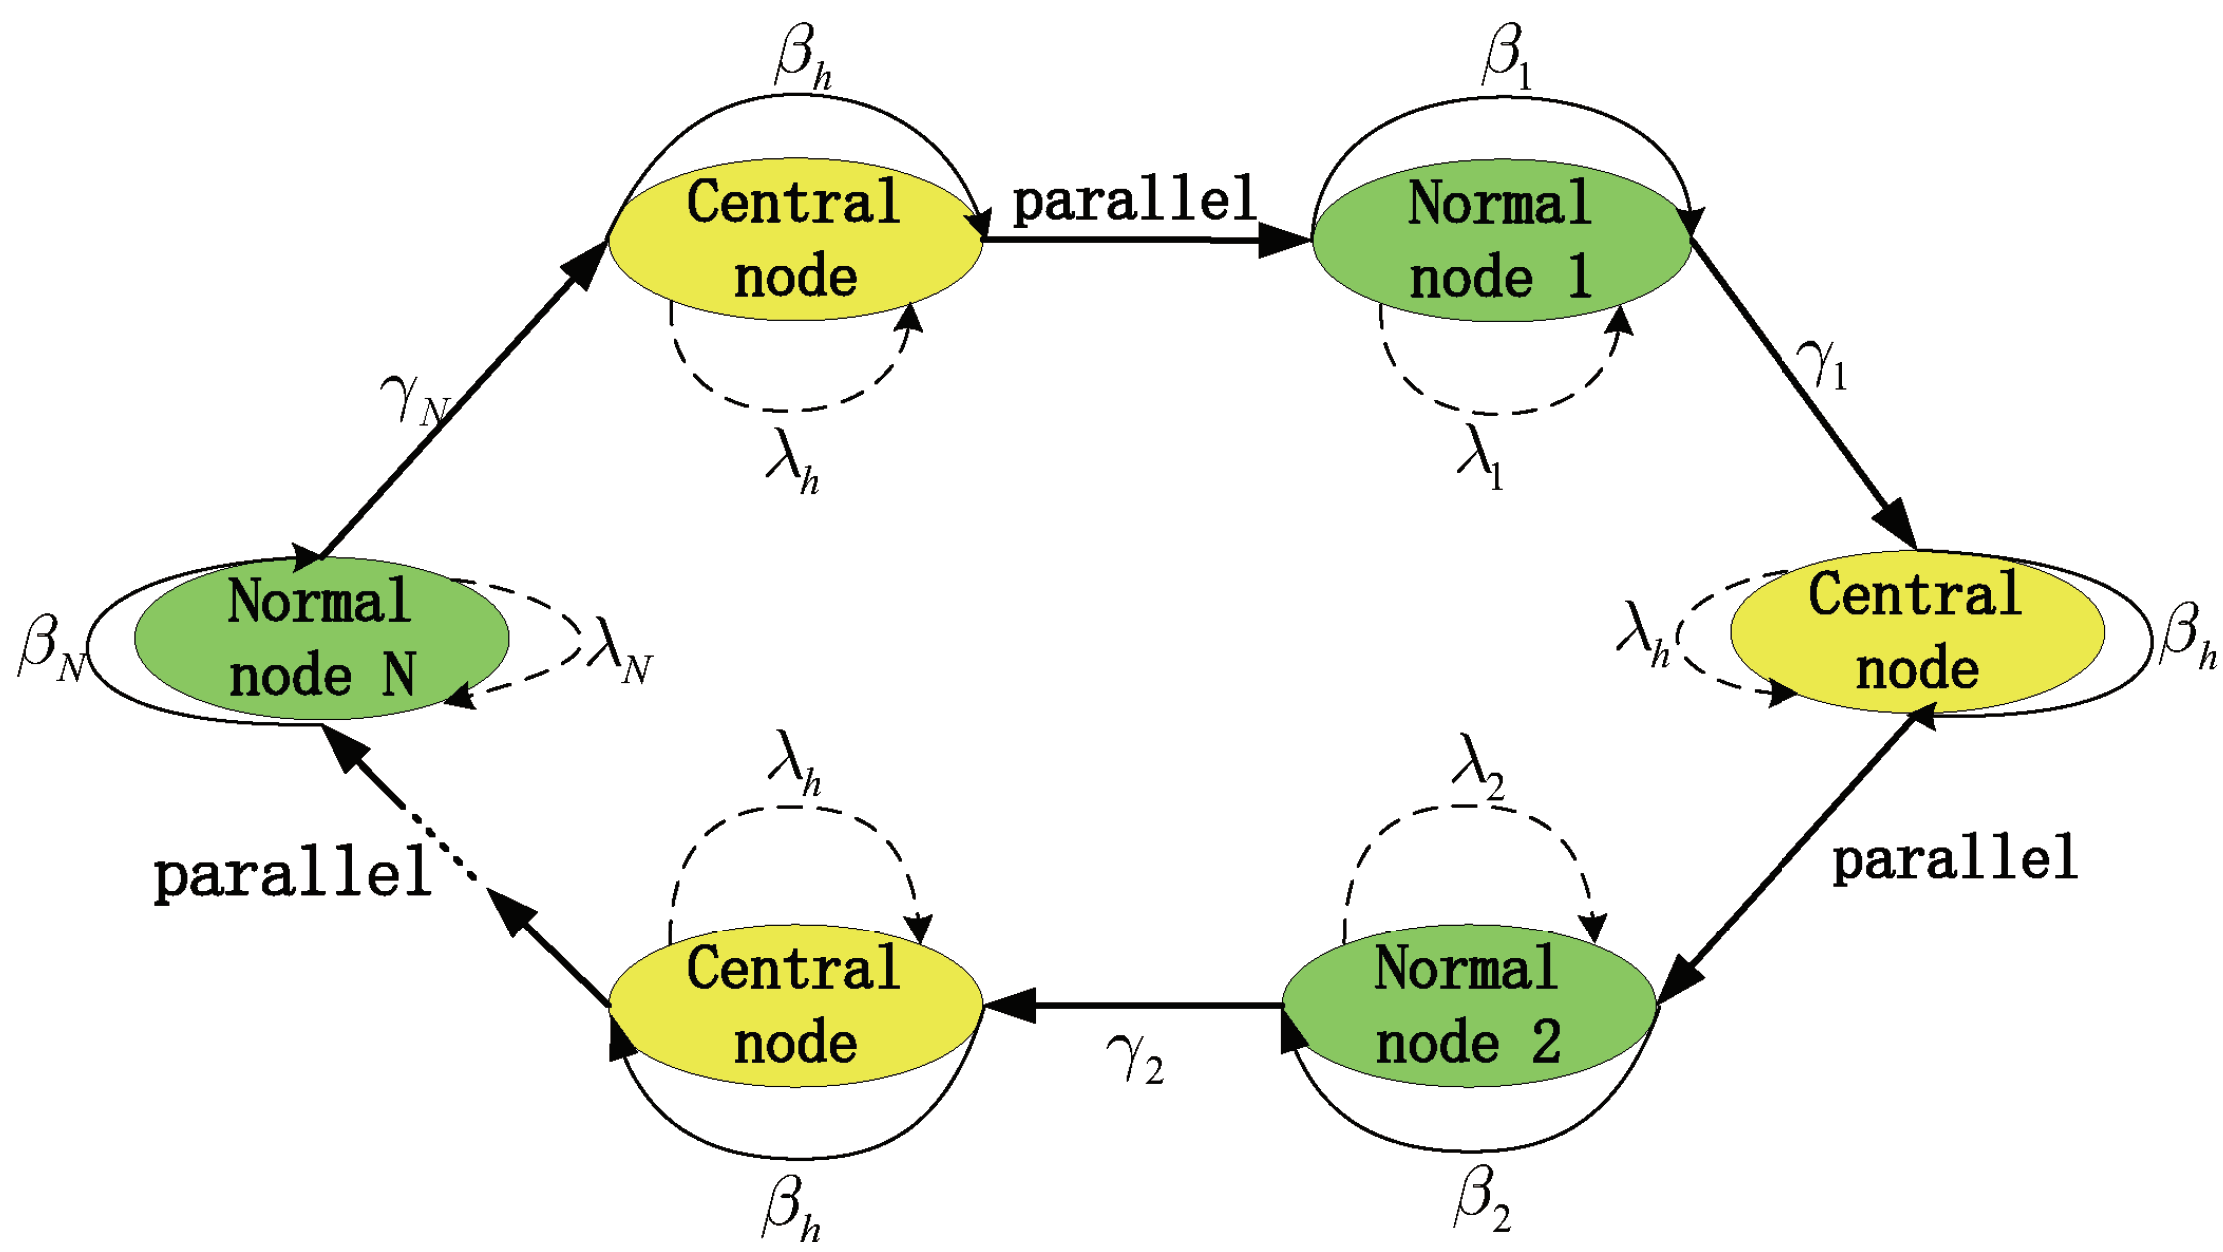
As shown in Figure 2, the MEC network consists of UE i ( i = 1 , 2 , , N ) nodes and a central node (Hospital). The process of information packets arriving at each node obeys independent Poisson distribution. λ i ( i = 1 , 2 , , N ) is the arrival rate of normal nodes. λ h is the arrival rate of the central node. Normal nodes are asymmetric and use exhaustive services to transmit data. Central nodes use exhaustive services to transmit data. β i ( i = 1 , 2 , , N , h ) is the service time of each node. γ i ( i = 1 , 2 , N ) is the time to switch from i to i + 1 .
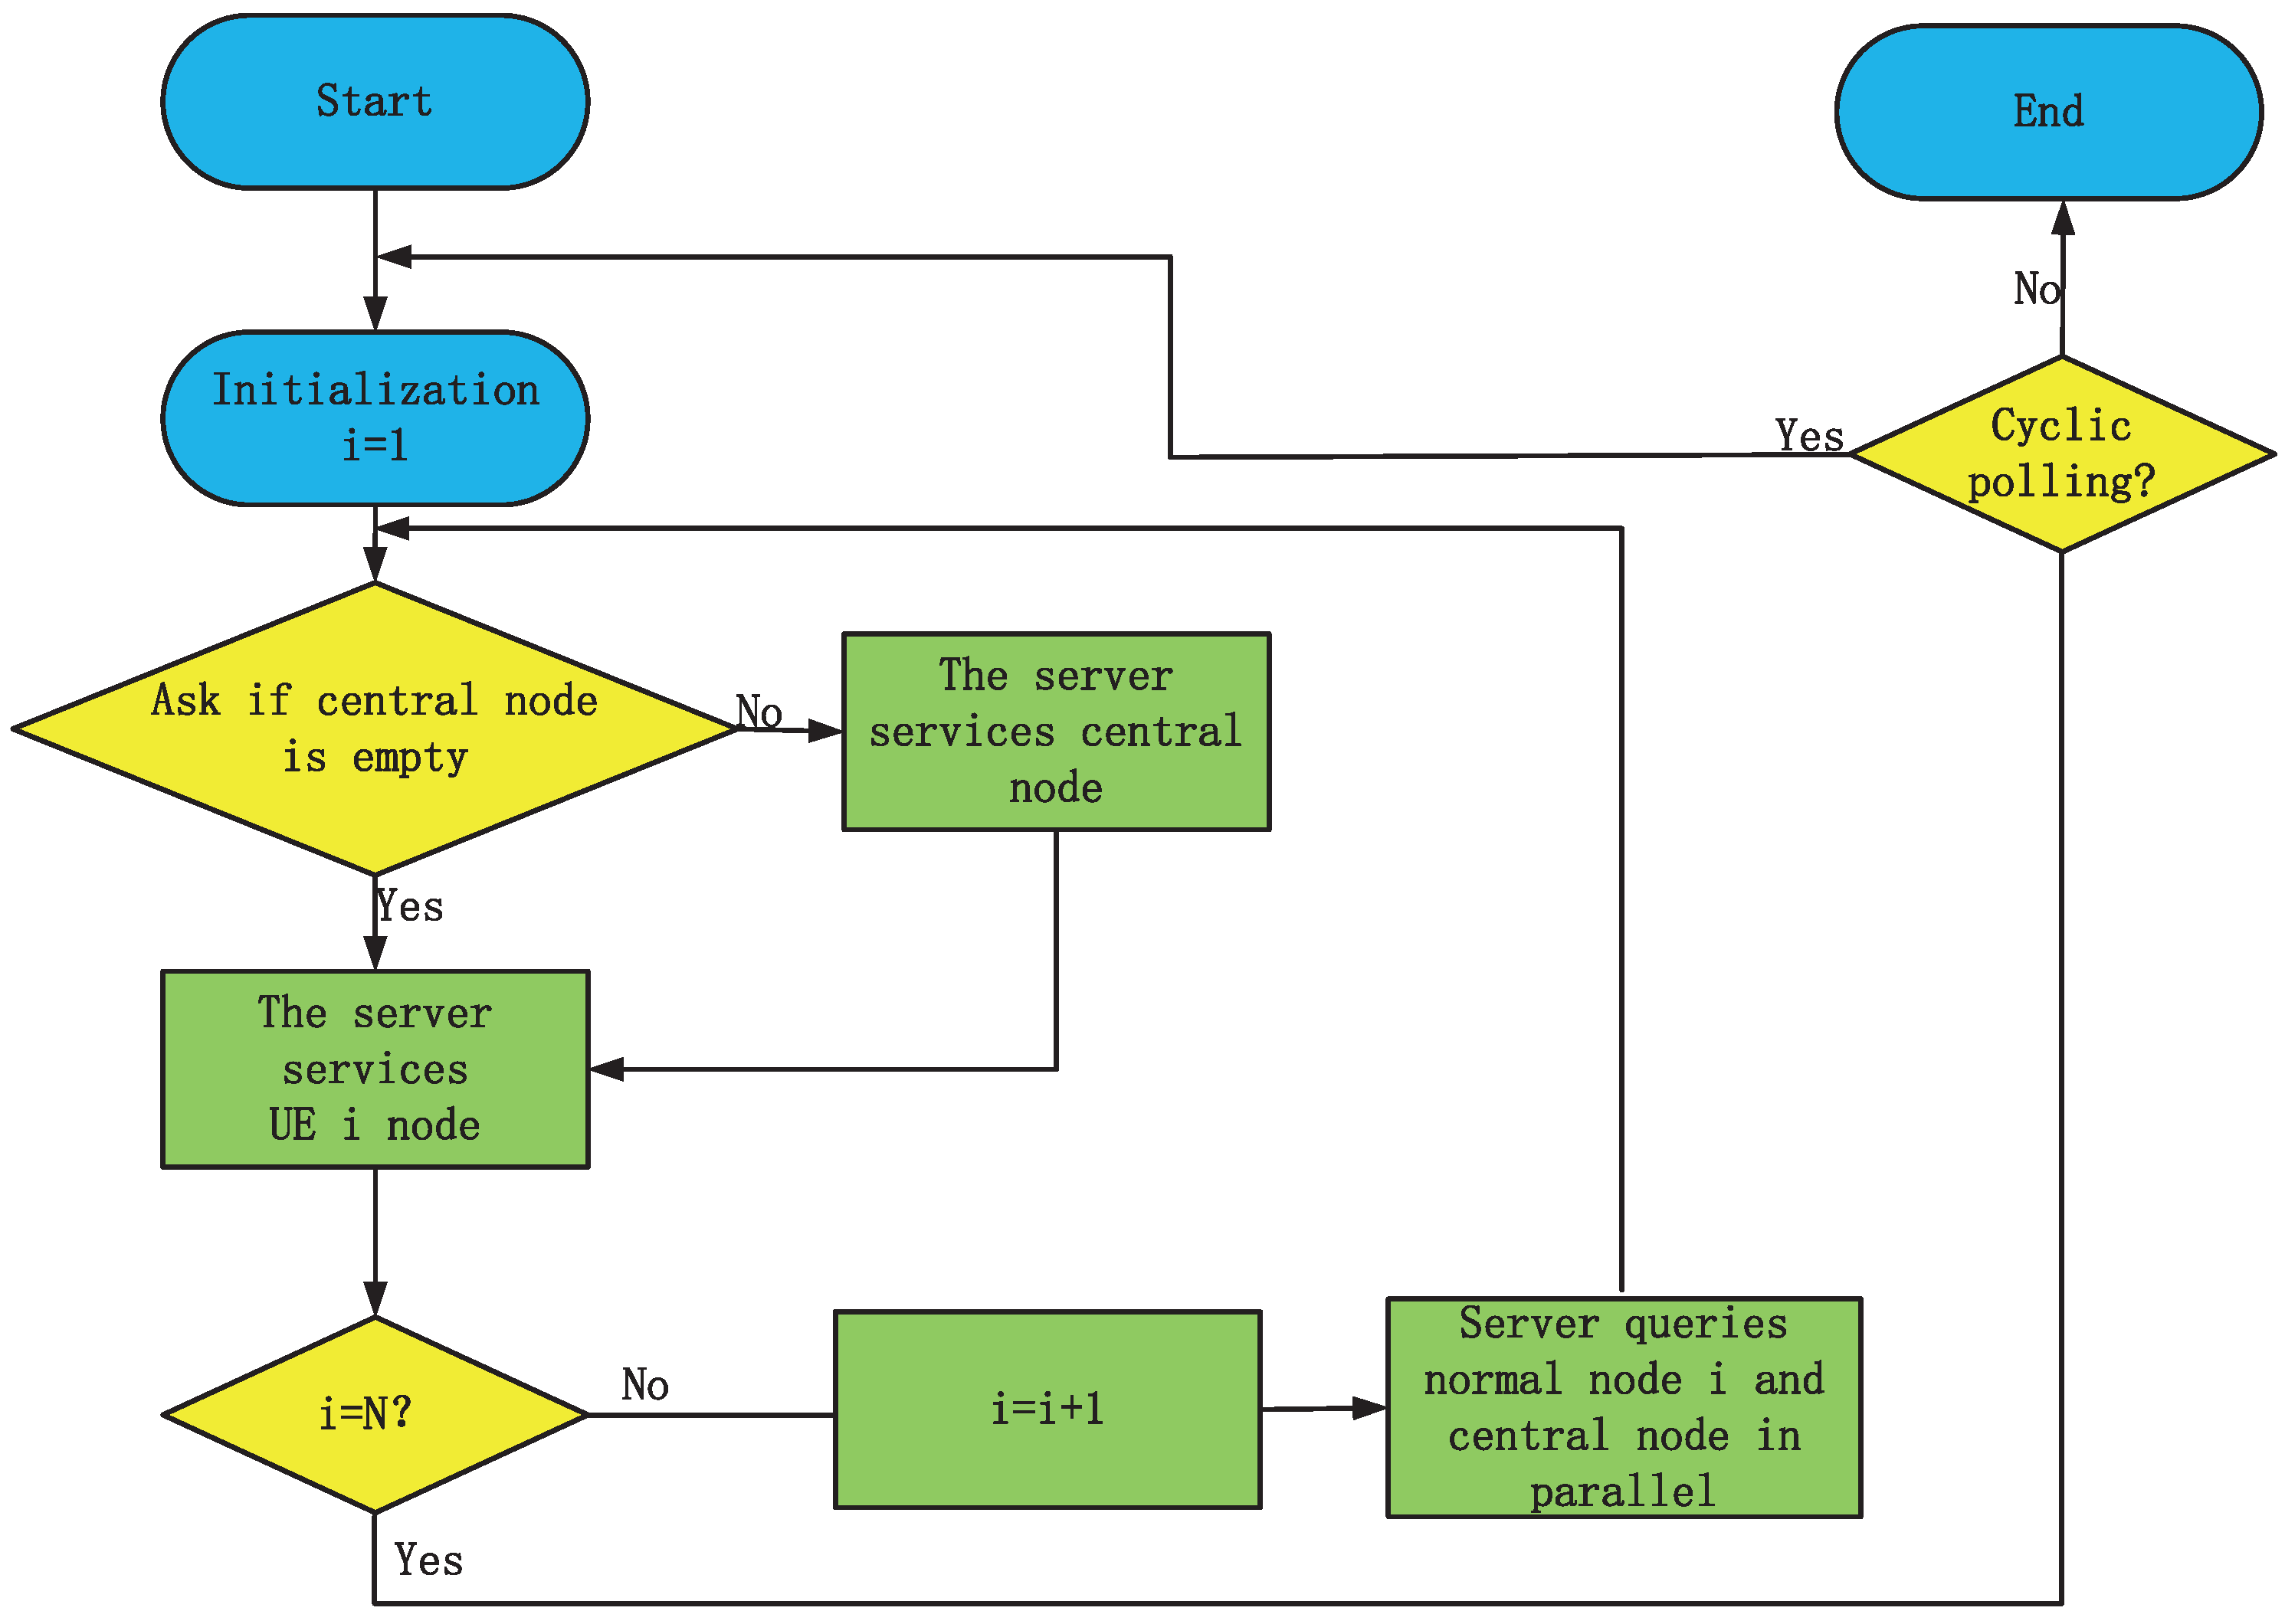
As shown in Figure 3, the polling system process [44] is:
  • Server initialization
  • Edge servers use parallel scheduling to query the central node and node i
  • Edge server service center node if the central node needs to process data
  • Server servicing of node i
  • Let i = i + 1 , and return to step (2) if i N , else step (1)

4. System Model Analysis

4.1. Variable Definitions

We list the defined variables in tabular form. List the variables in the form of Table 2.

4.2. System Conditions

There are three moments of system working status. One: the node i ( i = 1 , 2 , , N ) receiving server services within time t n until the node i is empty. The servers use parallel scheduling to query the central node and node i + 1 within time γ i . Two: the central node receiving server services within time t n * if the central node needs to process data. Three: the node i + 1 ( i = 1 , 2 , , N 1 ) receiving server services within time t n + 1 until the node i + 1 is empty. This state process is shown in Figure 4.
The time sequence is t n < t n * < t n + 1 . Moreover, the random variable ξ i ( n ) represents the amount of data stored in the buffer of node i at time t n , and the random variable ξ h ( n * ) represents the amount of data stored in the buffer of central node at time t n * . At time t n and t n * , and t n + 1 , the system conditions variables are { ξ 1 ( n ) , ξ 2 ( n ) , ξ i ( n ) , ξ N ( n ) , ξ h ( n ) } and { ξ 1 ( n * ) , ξ 2 ( n * ) , ξ i ( n * ) , ξ N ( n * ) , ξ h ( n * ) } , and { ξ 1 ( n + 1 ) , ξ 2 ( n + 1 ) , ξ i ( n + 1 ) , ξ N ( n + 1 ) , ξ h ( n + 1 ) } . The system’s state variables are described by Markov chains, which are acyclic and ephemeral in each state.
At time t n t n * , we get:
ξ h ( n * ) = ξ h ( n ) + μ h ( μ i ) + η h ( ν i ) ξ i ( n * ) = μ i ( μ i ) ξ j ( n * ) = ξ j ( n ) + μ j ( μ i ) + η j ( ν i ) , j = 1 , 2 , , N , j i
And at time t n * t n + 1 :
ξ k ( n + 1 ) = ξ k ( n * ) + η k ( ν h ) , k = 1 , 2 , , N η h ( n + 1 ) = 0

4.3. Mathematical Models

According to the working mechanism of the polling system, the arrival process, and the transmission characteristics of data in the communication process, the following working conditions are defined:
  • Each information packet arrives at the nodes independently and Poisson distribution. The probability-generating function of normal node is A ( z ) , and the mean and variances are λ i ( i = 1 , 2 , , N ) = λ = A ( 1 ) and σ λ 2 = A ( 1 ) + λ λ 2 . And the central node, the probability-generating function is A h ( z ) , and the mean and variances are λ h = A h ( 1 ) and σ λ h 2 = A h ( 1 ) + λ h λ h 2
  • The time for the server to serve any normal nodes is independent and Poisson distribution, and its probability-generating function is B ( z ) , the mean is β = B ( 1 ) , and the variance is σ β 2 = B ( 1 ) + β β 2 . And the central node, the probability-generating function is B h ( z ) , the mean is β h = B h ( 1 ) , and the variance is σ β h 2 = B h ( 1 ) + β h β h 2
  • The switch times of the server from node i to another node are independent and Poisson distribution. The probability-generating function is R ( z ) , the mean is γ = R ( 1 ) , and its variance is σ γ 2 = R ( 1 ) + γ γ 2
  • Each data is First Input First Output (FIFO)
  • Sufficient node capacity, no data overflow [45]
The system remains stable under the condition of i = 1 N λ i β i + λ h β h = i = 1 N ρ i + ρ h < 1 . In steady state [46], the probability distribution function of the system state variables is:
lim n P [ ξ i ( n ) = x i ; i = 1 , 2 , , N , h ] = π i ( x 1 , x 2 , , x i , , x N , x h )
According to the definition of the probability-generating function, the generating function is:
π i ( x 1 , x 2 , , x i , , x N , x h ) = G i ( z 1 , z 2 , , z i , , z N , z h ) = x 1 = 1 x 2 = 2 x i = i x N = N x h = h z 1 x 1 z 2 x 2 z i x i z N x N z h x h
At the time t n * , the server starts to transmit the data of h, and the probability-generating function of the system state variable is:
G i h ( z 1 , z 2 , , z i , , z N , z h ) = lim t E [ j = 1 N z j ξ j ( n * ) · z h ξ i h ( n * ) ] = lim t E [ j = 1 i N z j ξ j ( n ) + μ j ( u i ) + η j ( v i ) · z i μ i ( u i ) · z h ξ i h ( n * ) · z h ξ h ( n ) + μ h ( u i ) + η h ( v i ) ] = lim t E [ j = 1 i N z j ξ j ( n ) · z h ξ h ( n ) ] · E [ j = 1 i N z j η j ( v i ) · z h η h ( v i ) ] · E [ j = 1 N z j μ i ( u i ) · z h μ h ( u i ) ] = R i [ j = 1 N A j ( z j ) A h ( z h ) ] · G i ( z 1 , z 2 , , z i 1 , B i ( j = 1 N A j ( z j ) A h ( z h ) ) , z i + 1 , , z N , z h )
At the time t n + 1 , the server starts to transmit the data of i + 1 node, and the probability-generating function of the system state variable is:
G i + 1 ( z 1 , z 2 , , z i , , z N , z h ) = lim t E [ j = 1 N z j ξ j ( n + 1 ) · z h ξ i h ( n + 1 ) ] = lim t E [ j = 1 N z j ξ j ( n * ) + η j ( v h ) ] = lim t E [ j = 1 N z j ξ j ( n ) + μ j ( u i ) + η j ( v i ) + η j ( v h ) ] = G i h [ z 1 , z 2 , , z i , , z N , B h ( j = 1 N A j ( z j ) F i ( j = 1 N A j ( z j ) ) ) ]
In the Equation (6), F i ( z i ) = A i ( B i ( z i F i ( z i ) ) ) is the probability-generating function of the data of entering in node i [47].

5. Analysis of System Variables

5.1. The Average Queue Length

The average queue length measures how fast packet information is transmitted. To get a more intuitive view of the polling system, we need to find the average queue length of the polling system. Definition: The average queue length g i ( j ) of the system is the average information packet stored in the node j when the node i starts to transmit data at time t n . We get:
g i ( j ) = G i ( z 1 , z 2 , , z i , , z N , z h ) z j
According to Equations (3)–(6), we get:
g i ( i ) = λ i ( 1 ρ i ) j = 1 N γ j 1 ρ h j = 1 N ρ j
Similarly, we get the h average queue length as
g i h ( i ) = λ h γ i ( 1 ρ h ) 1 ρ h j = 1 N ρ j

5.2. The Average Cycle

The average cycle time is an essential indicator of a polling system. Smaller average cycles mean more system throughput and more information is processed in the same amount of time. Definition: The average cycle of the system is the time interval for the server to query the same site twice. The specific expression is the time it takes for the server to complete one service for N nodes in the system according to the service rules [48]. We get:
E ( θ ) = i = 1 N γ i 1 ρ h i = 1 N ρ i

5.3. The Average Delay

The average delay is a measure of information being sent from the server to the end. When the average delay is lower, the node receives information from the server faster, and the system is smoother. In order to calculate the average delay of the polling system, we need to calculate the second-order partial derivatives of the probability-generating function. Definition: second-order partial derivative variables:
g i ( j , k ) = lim z 1 , z 2 , , z j , z k , , z N , z h 1 2 G i ( z 1 , z 2 , , z N , z h ) z j z k
And i = 1 , 2 , N , h ; j = 1 , 2 , , N , h ; k = 1 , 2 , , N , h .
According to Equations (3)–(5), we get:
g i + 1 ( k , l ) = g i h ( k , l ) + β h g i h ( k , h ) [ λ l + F h ( 1 ) λ l ] + g i h ( h , l ) β h [ λ k + F h ( 1 ) λ k ] + g i h ( h , h ) β h [ λ l + F h ( 1 ) λ l ] + g i h ( h ) B h ( 1 ) [ λ l + F h ( 1 ) λ l ] · [ λ k + F h ( 1 ) λ k ] + g i h ( h ) β h [ λ l λ k + F h ( 1 ) λ l λ k + λ l F h ( 1 ) λ k + F h ( 1 ) λ l λ k + F h ( 1 ) λ l λ k ]
g i + 1 ( k , i ) = λ i λ k R i ( 1 ) + λ i λ k γ i + λ i λ k g i ( k ) + [ 2 λ i λ k β i γ i + λ i λ k B i ( 1 ) + λ i λ k β i ] g i ( i ) + λ i β i g i ( k , i ) + λ i λ k β i 2 g i ( i , i ) + λ i β h [ 1 + F h ( 1 ) ] g i h ( k , h ) + λ k β h [ 1 + F h ( 1 ) ] g i h ( h , i ) + λ i λ k β h 2 [ 1 + F h ( 1 ) ] 2 g i h ( h , h ) + λ i λ k B h ( 1 ) [ 1 + F h ( 1 ) ] 2 g i h ( h ) + λ i λ k β h [ 1 + 3 F h ( 1 ) + F h ( 1 ) ] g i h ( h )
g i + 1 ( i , l ) = λ i λ l R i ( 1 ) + λ i λ k γ i + λ i λ i g i ( l ) + [ 2 λ i λ l β i γ i + λ i λ l B i ( 1 ) + λ i λ l β i ] g i ( i ) + λ i β i g i ( l , i ) + λ i λ l β i 2 g i ( i , i ) + λ l β h [ 1 + F h ( 1 ) ] g i h ( i , h ) + λ i β h [ 1 + F h ( 1 ) ] g i h ( h , l ) + λ i λ l β h 2 [ 1 + F h ( 1 ) ] 2 g i h ( h , h ) + λ i λ l B h ( 1 ) [ 1 + F h ( 1 ) ] 2 g i h ( h ) + λ i λ l β h [ 1 + 3 F h ( 1 ) + F h ( 1 ) ] g i h ( h )
g i h ( k , h ) = λ k λ h R i ( 1 ) + λ k λ h γ i + λ k γ i [ g i ( h ) + λ h β i g i ( i ) ] + λ h γ i [ g i ( k ) + λ k β i g i ( i ) ] + g i ( k , h ) + λ h β i g i ( k , i ) + λ k β i g i ( i , h ) + λ k λ h B i ( 1 ) g i ( i ) + λ k λ h β i g i ( i )
g i h ( h , l ) = λ l λ h R i ( 1 ) + λ l λ h γ i + λ h γ i g i ( l ) + λ l γ i g i ( h ) + [ 2 λ l λ h β i γ i + λ l λ h B i ( 1 ) + λ l λ h β i ] g i ( i ) g i ( h , l ) + λ l β i g i ( h , i ) + λ h β i g i ( i , l ) + λ l λ h β i 2 g i ( i , i )
g i h ( h , h ) = λ h 2 R i ( 1 ) + γ i A h ( 1 ) + [ 2 λ h 2 β i γ i + λ h 2 B h ( 1 ) + β i A h ( 1 ) ] g i ( i ) + λ h 2 β i 2 g i ( i , i )
Summing Equation (15) gets:
i = 1 N g i h ( k , h ) = λ k λ h i = 1 N R i ( 1 ) + λ k λ h i = 1 N γ i + λ h i = 1 k N γ i g i ( k ) + λ k λ h i = 1 N [ 2 β i γ i + B i ( 1 ) + β i ] g i ( i ) + λ h i = 1 N β i g i ( k , i ) + λ k λ h i = 1 N β i 2 g i ( i , i )
Summing Equation (16) gets:
i = 1 N g i h ( h , l ) = λ l λ h i = 1 N R i ( 1 ) + λ l λ h i = 1 N γ i + λ h i = 1 k N γ i g i ( k ) + λ l λ h i = 1 N [ 2 β i γ i + B i ( 1 ) + β i ] g i ( i ) + λ h i = 1 N β i g i ( i , l ) + λ l λ h i = 1 N β i 2 g i ( i , i )
According to Equations (11)–(13), i = 1 N g i h ( h , l ) and i = 1 N g i h ( k , h ) , and g i h ( h , h ) , we get:
i = 1 N g i + 1 ( k , l )
According to Equation (18) we get:
i = 1 N g i h ( h , k ) = λ h λ k i = 1 N R i ( 1 ) + λ h λ k i = 1 N γ i + λ h i = 1 N γ i g i ( k ) + i = 1 N [ 2 λ h λ k β i γ i + λ h λ k B i ( 1 ) + λ h λ k β i ] g i ( i ) + λ h i = 1 N β i g i ( i , k ) + λ h λ k i = 1 N β i 2 g i ( i , i )
According to Equation (20) and use Equation i = 1 N g i + 1 ( k , l ) we get:
g k ( k , k ) = λ k 2 i = 1 N R i ( 1 ) + A k ( 1 ) i = 1 N γ i + i = 1 N [ 2 λ k 2 β i γ i + λ k 2 B i ( 1 ) + γ i A k ( 1 ) ] g i ( i ) + 2 λ k i = 1 k N γ i g i ( k ) + λ k i = 1 k N β i g i ( k , i ) + λ k i = 1 k N β i g i ( i , k ) + λ k 2 i = 1 k N β i 2 g i ( i , i ) + λ k β h [ 1 + F h ( 1 ) ] i = 1 N g i h ( h ) + λ k β h [ 1 + F h ( 1 ) ] i = 1 N g i h ( h , k ) + λ k 2 β h 2 [ 1 + F h ( 1 ) ] 2 i = 1 N g i h ( h ) + β h [ A k ( 1 ) + 2 λ k F h ( 1 ) + λ k 2 F h ( 1 ) + A k ( 1 ) F h ( 1 ) ] i = 1 N g i h ( h )
Based on the approximate analysis of the cyclic query cycle, the probability-generating function of the cyclic cycle is defined as:
θ i ( A i ( z i ) ) = G i ( 1 , , z i , , 1 ) , i = 1 , , N , h
We sum up Equations (17) and (18), and according to second order partial derivative Equation (21), we get:
λ i 2 θ i ( 1 ) + θ A i ( 1 ) = g i ( i , i )
According to second order partial derivative of the cyclic cycle, we get:
θ i ( 1 ) θ j ( 1 )
According to Equations (21)–(23), we get:
g i ( i , i ) = λ i 2 k = 1 N ρ k ( 1 + ρ k ) [ k = 1 N β k λ k ( 1 + ρ k ) g k ( k , k ) θ k = 1 N β k λ k ( 1 + ρ k ) A k ( 1 ) ]
According to Equations (16) and (24), we get:
g i h ( h , h ) = λ h 2 R i ( 1 ) + γ i A h ( 1 ) + [ 2 λ h 2 β i γ i + λ h 2 B h ( 1 ) + β i A h ( 1 ) ] g i ( i ) + λ h 2 β i 2 { λ i 2 k = 1 N ρ k ( 1 + ρ k ) [ k = 1 N β k λ k ( 1 + ρ k ) g k ( k , k ) θ k = 1 N β k λ k ( 1 + ρ k ) A k ( 1 ) ] }
Definition 1.
The average delay of the system is the time interval between the information packet arriving at the node and the information packet being sent out. The average delay of entering node is E ( w i ) , and the average delay of h is E ( w i h ) [49], we get:
E ( w i ) = g i ( i , i ) 2 λ i g i ( i ) λ i 2 2 λ i 2 ( 1 + ρ i ) + λ i β i 2 2 ( 1 ρ i )
Similarly, we get:
E ( w i h ) = g i h ( h , h ) 2 λ h g i h ( i ) λ h 2 2 λ h 2 ( 1 + ρ h ) + λ h β h 2 2 ( 1 ρ h )

6. Simulation

We have simulated the experimental and theoretical values of the system using MATLAB R2022a, and the entire simulation was carried out under Windows 11 operating system. The simulation conditions are as follows.
  • Each information packet of the nodes is asymmetric
  • Each information packet arrives at the nodes independently and Poisson process
  • The experiment was repeated 300,000 times, and the mean was taken as the statistic.
  • The system remains stable under the condition of i = 1 N λ i β i + λ h β h = i = 1 N ρ i + ρ h < 1
Based on the initial parameters set in Table 3, the variation of the performance characteristics of the service model is obtained in the following.
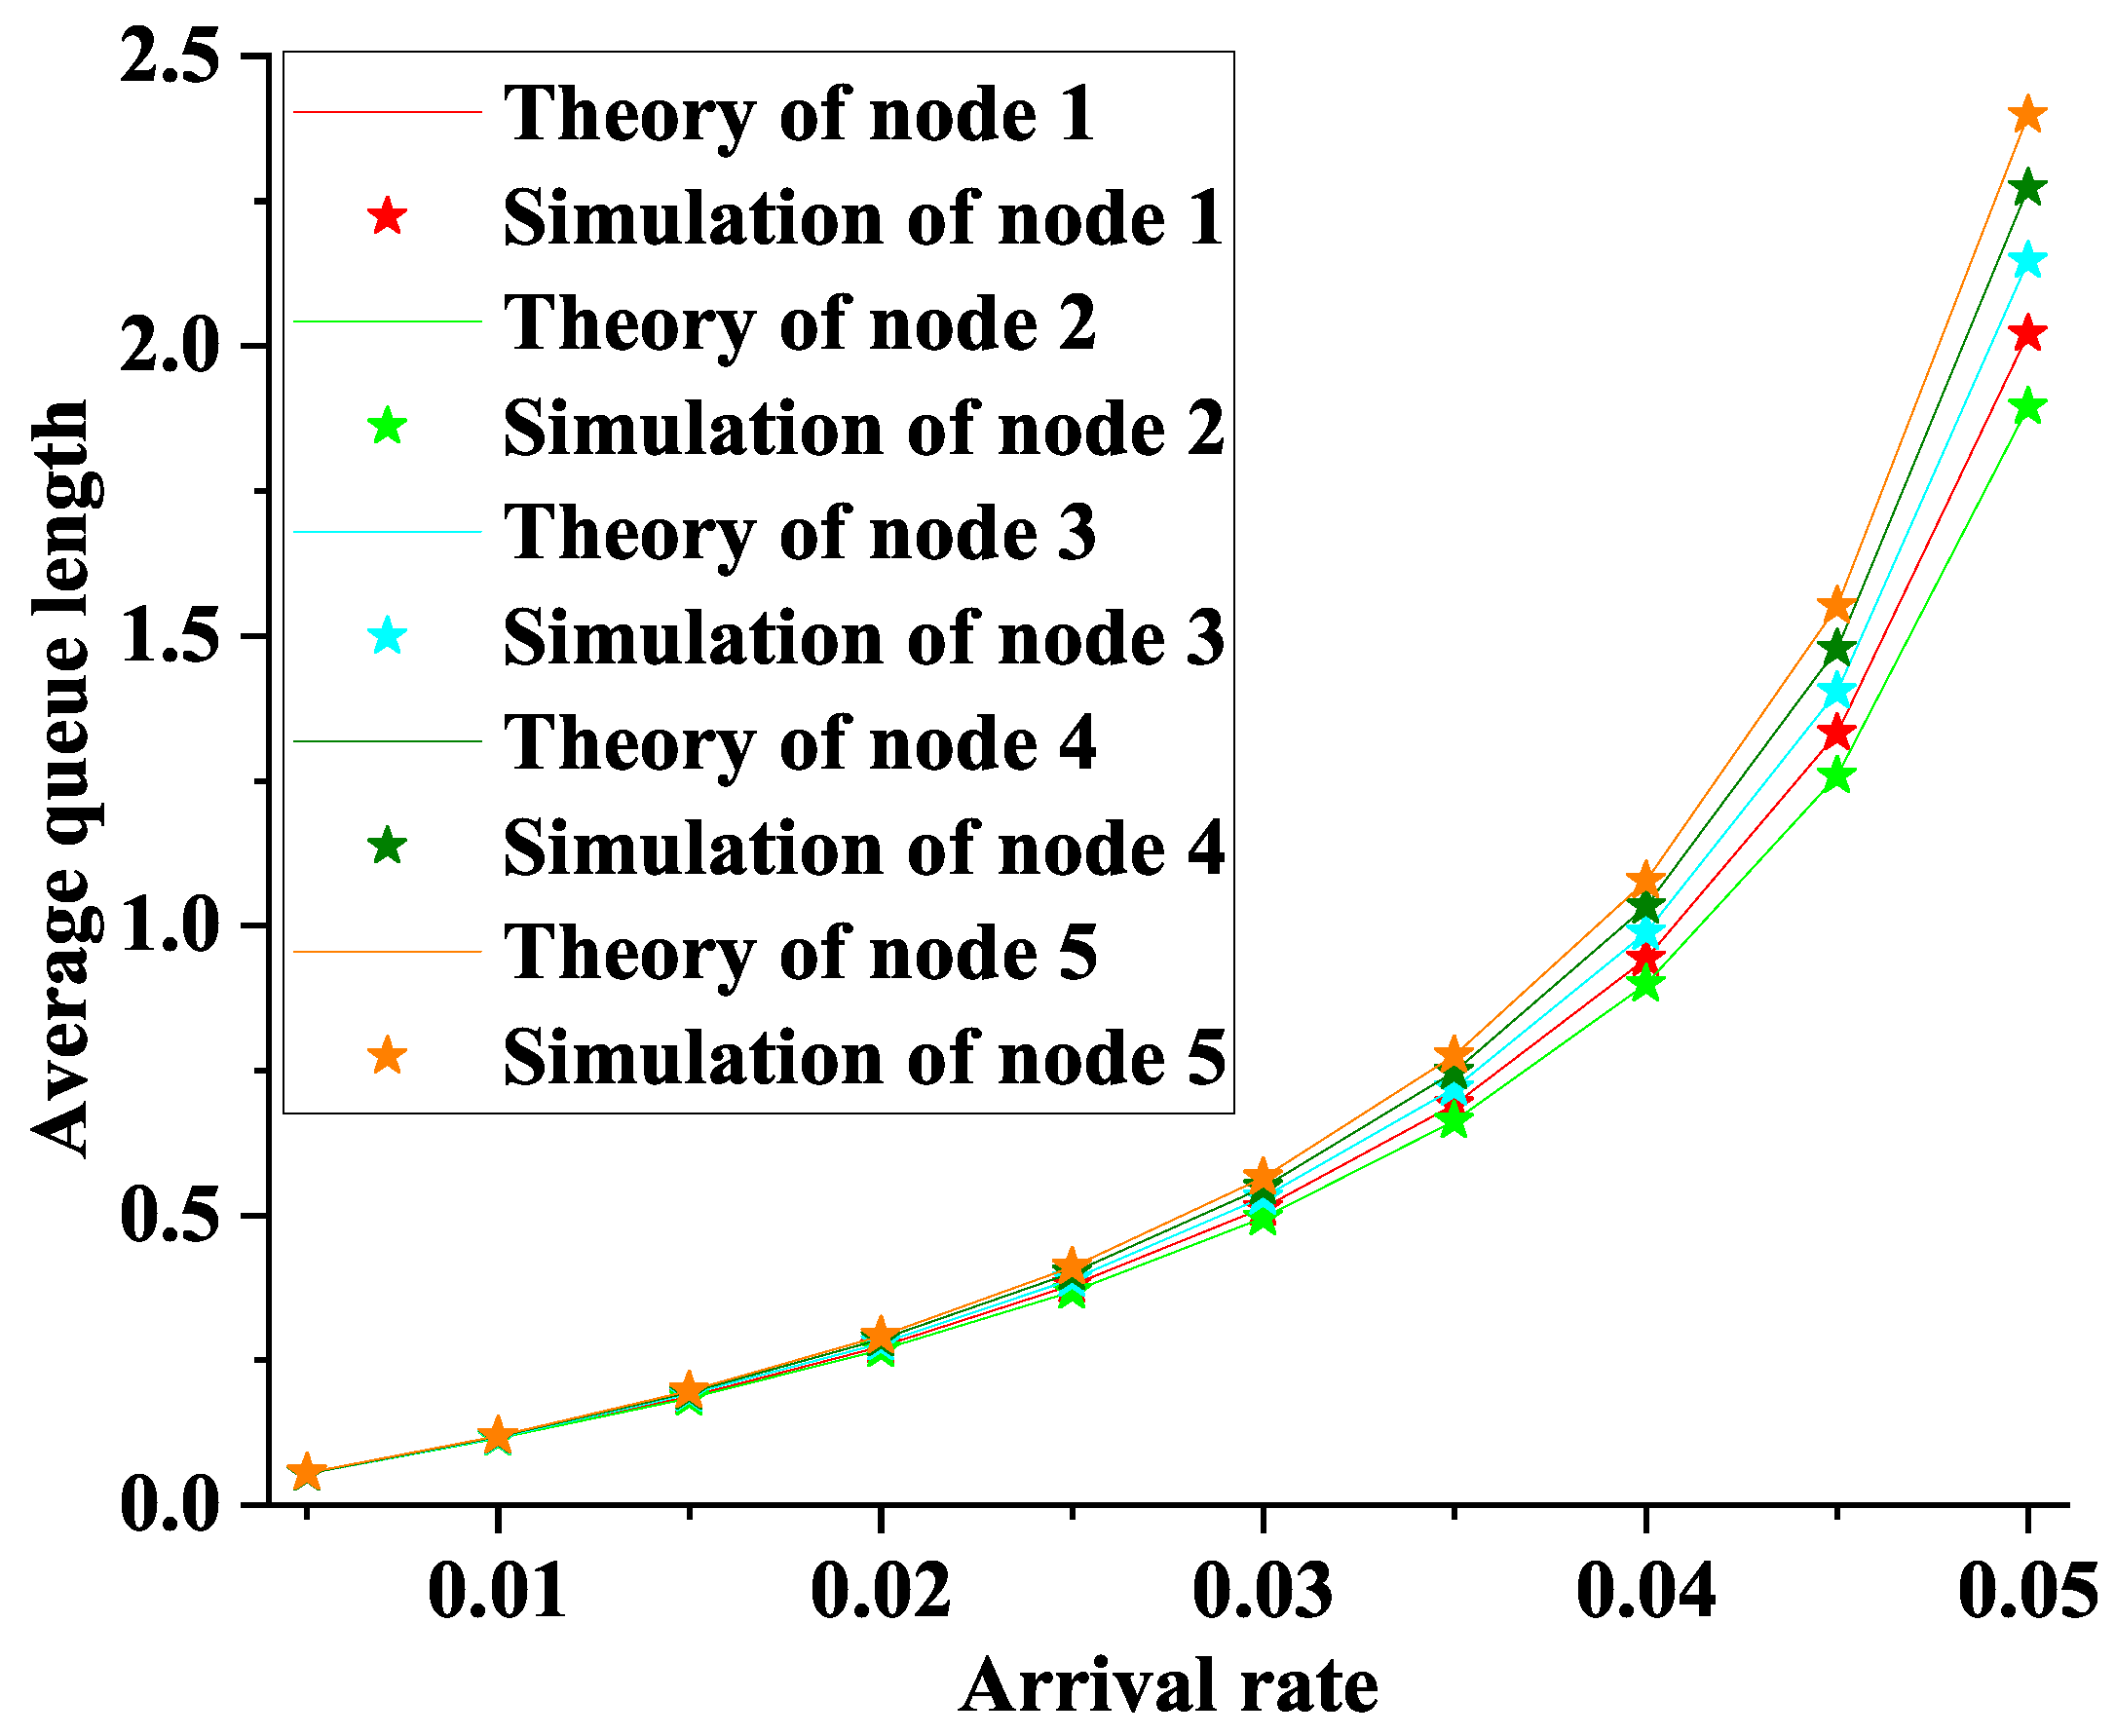
Figure 5 and Figure 6 are the average queue length of nodes i, and h varies with the arrival rate. The theoretical and experimental values are consistent, indicating the rationality of the theoretical analysis. According to Figure 5, we can conclude that: The higher the arrival rate, the larger the average queue length. As the arrival rate increases, the average queue length for all normal nodes increases. According to Figure 6, we know the average queue length of i to h proportional to the switch time of node i. The primary variable that affects the average queue length is the service time of the node. Moreover, we get: The average queue length of h is lower than i. Better meet the multiple service priority requirements of the MEC network.
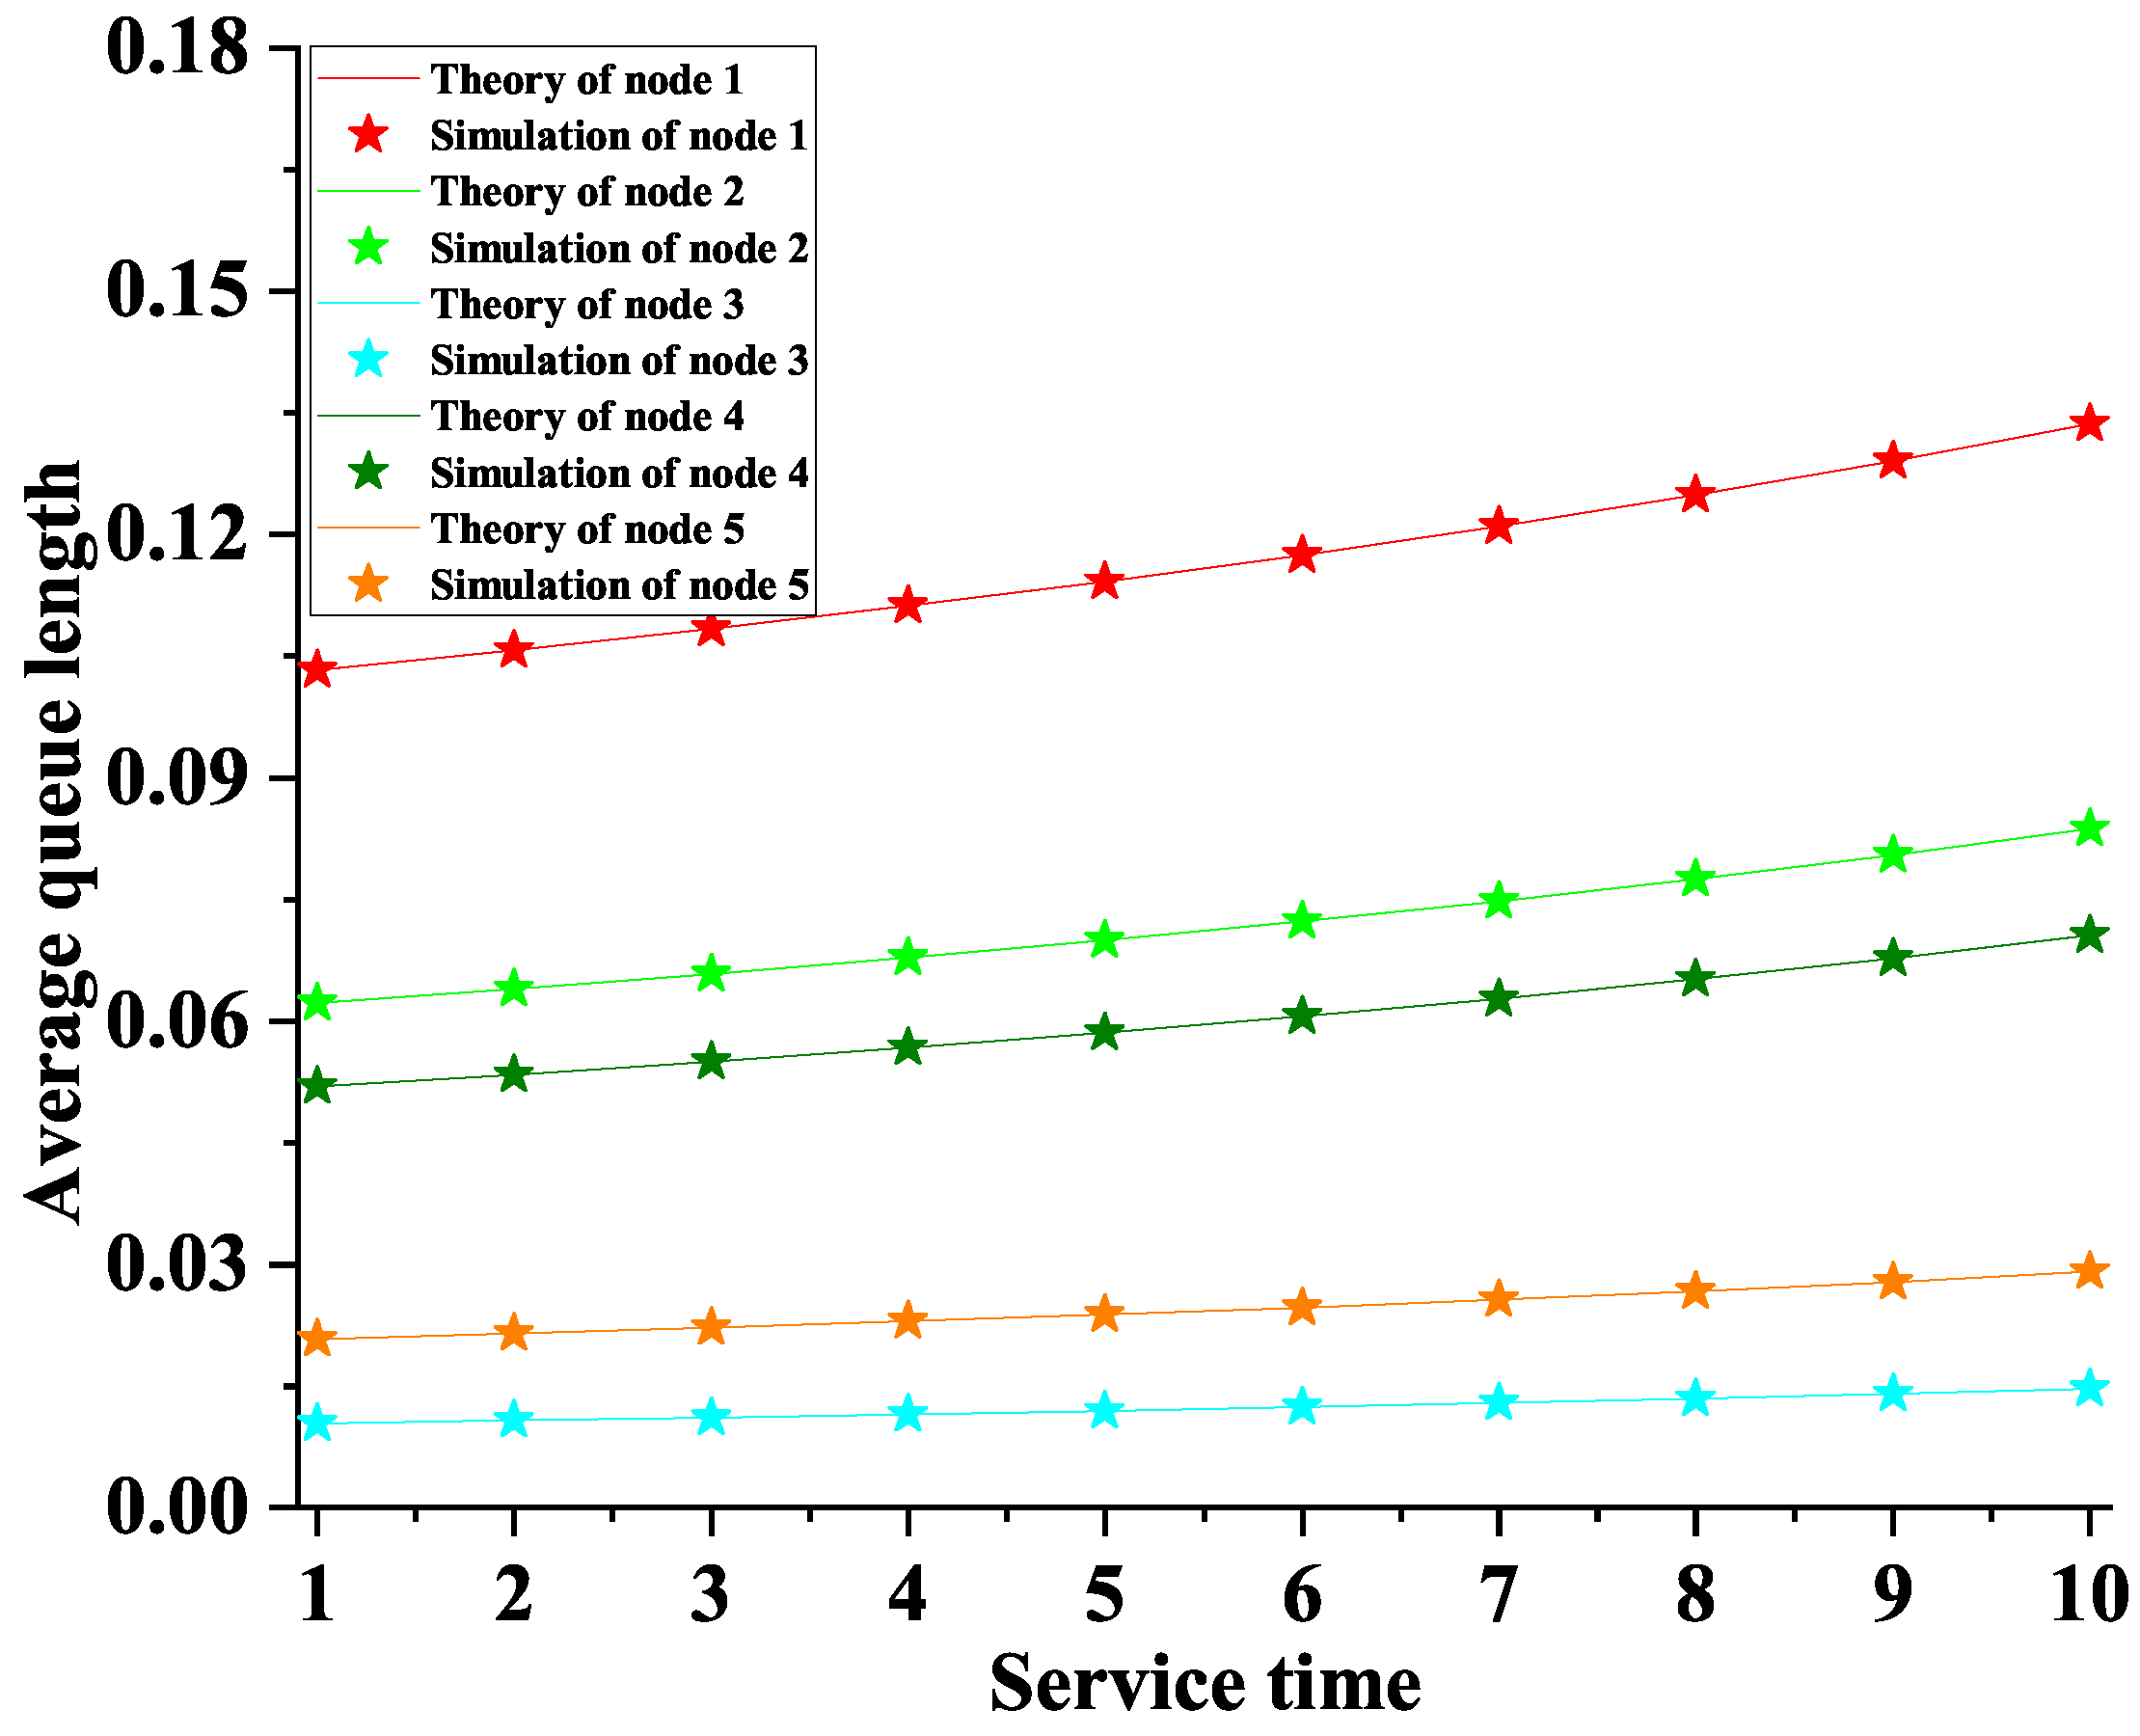
Figure 7 and Figure 8 are the average queue length of nodes i, and h varies with service time. The experimental values fit the theoretical values. According to Figure 7, we can conclude that: The higher the service time, the larger the average queue length. Moreover, the service time of normal nodes has a more significant impact on the average queue length of nodes than the arrival rate of information packets from normal nodes. According to Figure 8, we know the average queue length of h is proportional to the switch time of node i. This conclusion is consistent with the above because the polling system throughput is T = i = 1 N λ i β i + λ h β h = i = 1 N ρ i + ρ h . Moreover, when the service time and switch time of normal nodes are short, the smaller the average queue length of the central node, the faster the transmission rate.
Comparing Figure 5, Figure 6, Figure 7 and Figure 8, we can see that the impact of the system arrival rate on the average queue length is more significant than the service time of a single user, provided that other parameter characteristics remain constant, indicating that the system has a finite throughput and cannot transmit an unlimited number of packets of information. In addition, we conclude that the average queue length of the central node is much lower than the normal node, satisfying our need for priority.
We compare Figure 5, Figure 6, Figure 7 and Figure 8 to know that the average queue length in both Figure 5 and Figure 7 increases with increasing system parameters (Figure 5 is arrival rate, Figure 7 is service time). Furthermore, both Figure 6 and Figure 8 decreases with increasing system parameters (Figure 6 is arrival rate, Figure 8 is service time), indicating that when both central and normal nodes use exhausted services, the increase in system throughput is instead beneficial to the priority requirement (central node transmits faster).
Figure 9 shows the image of the average queue length as a function of the arrival rate for two-level priority and symmetric polling system. Comparing Figure 5 and Figure 6 with Figure 9, we know that although the average queue length of the central node is lower than that of the average node, the symmetric system can only derive the parameters of one node. The average queue length derived by each node is the same, and the system cannot cope with multi-task scheduling requirements. The initial parameters of Figure 9 are taken as the average of Figure 5 and Figure 6.
Figure 10 shows that the average cyclic period varies with the arrival rate. It can be seen that the simulated curve and the theoretical value curve show the same trend. Figure 10 shows the average cyclic period proportional to the arrival rate (or polling system throughput). The load is the total load of the normal nodes and does not include the load of the central node. The purpose of this is to facilitate the construction of the simulation graph and to contrast it with other asymmetric models, in addition to the fact that changes in the load of the center node will also affect the system’s characteristics.
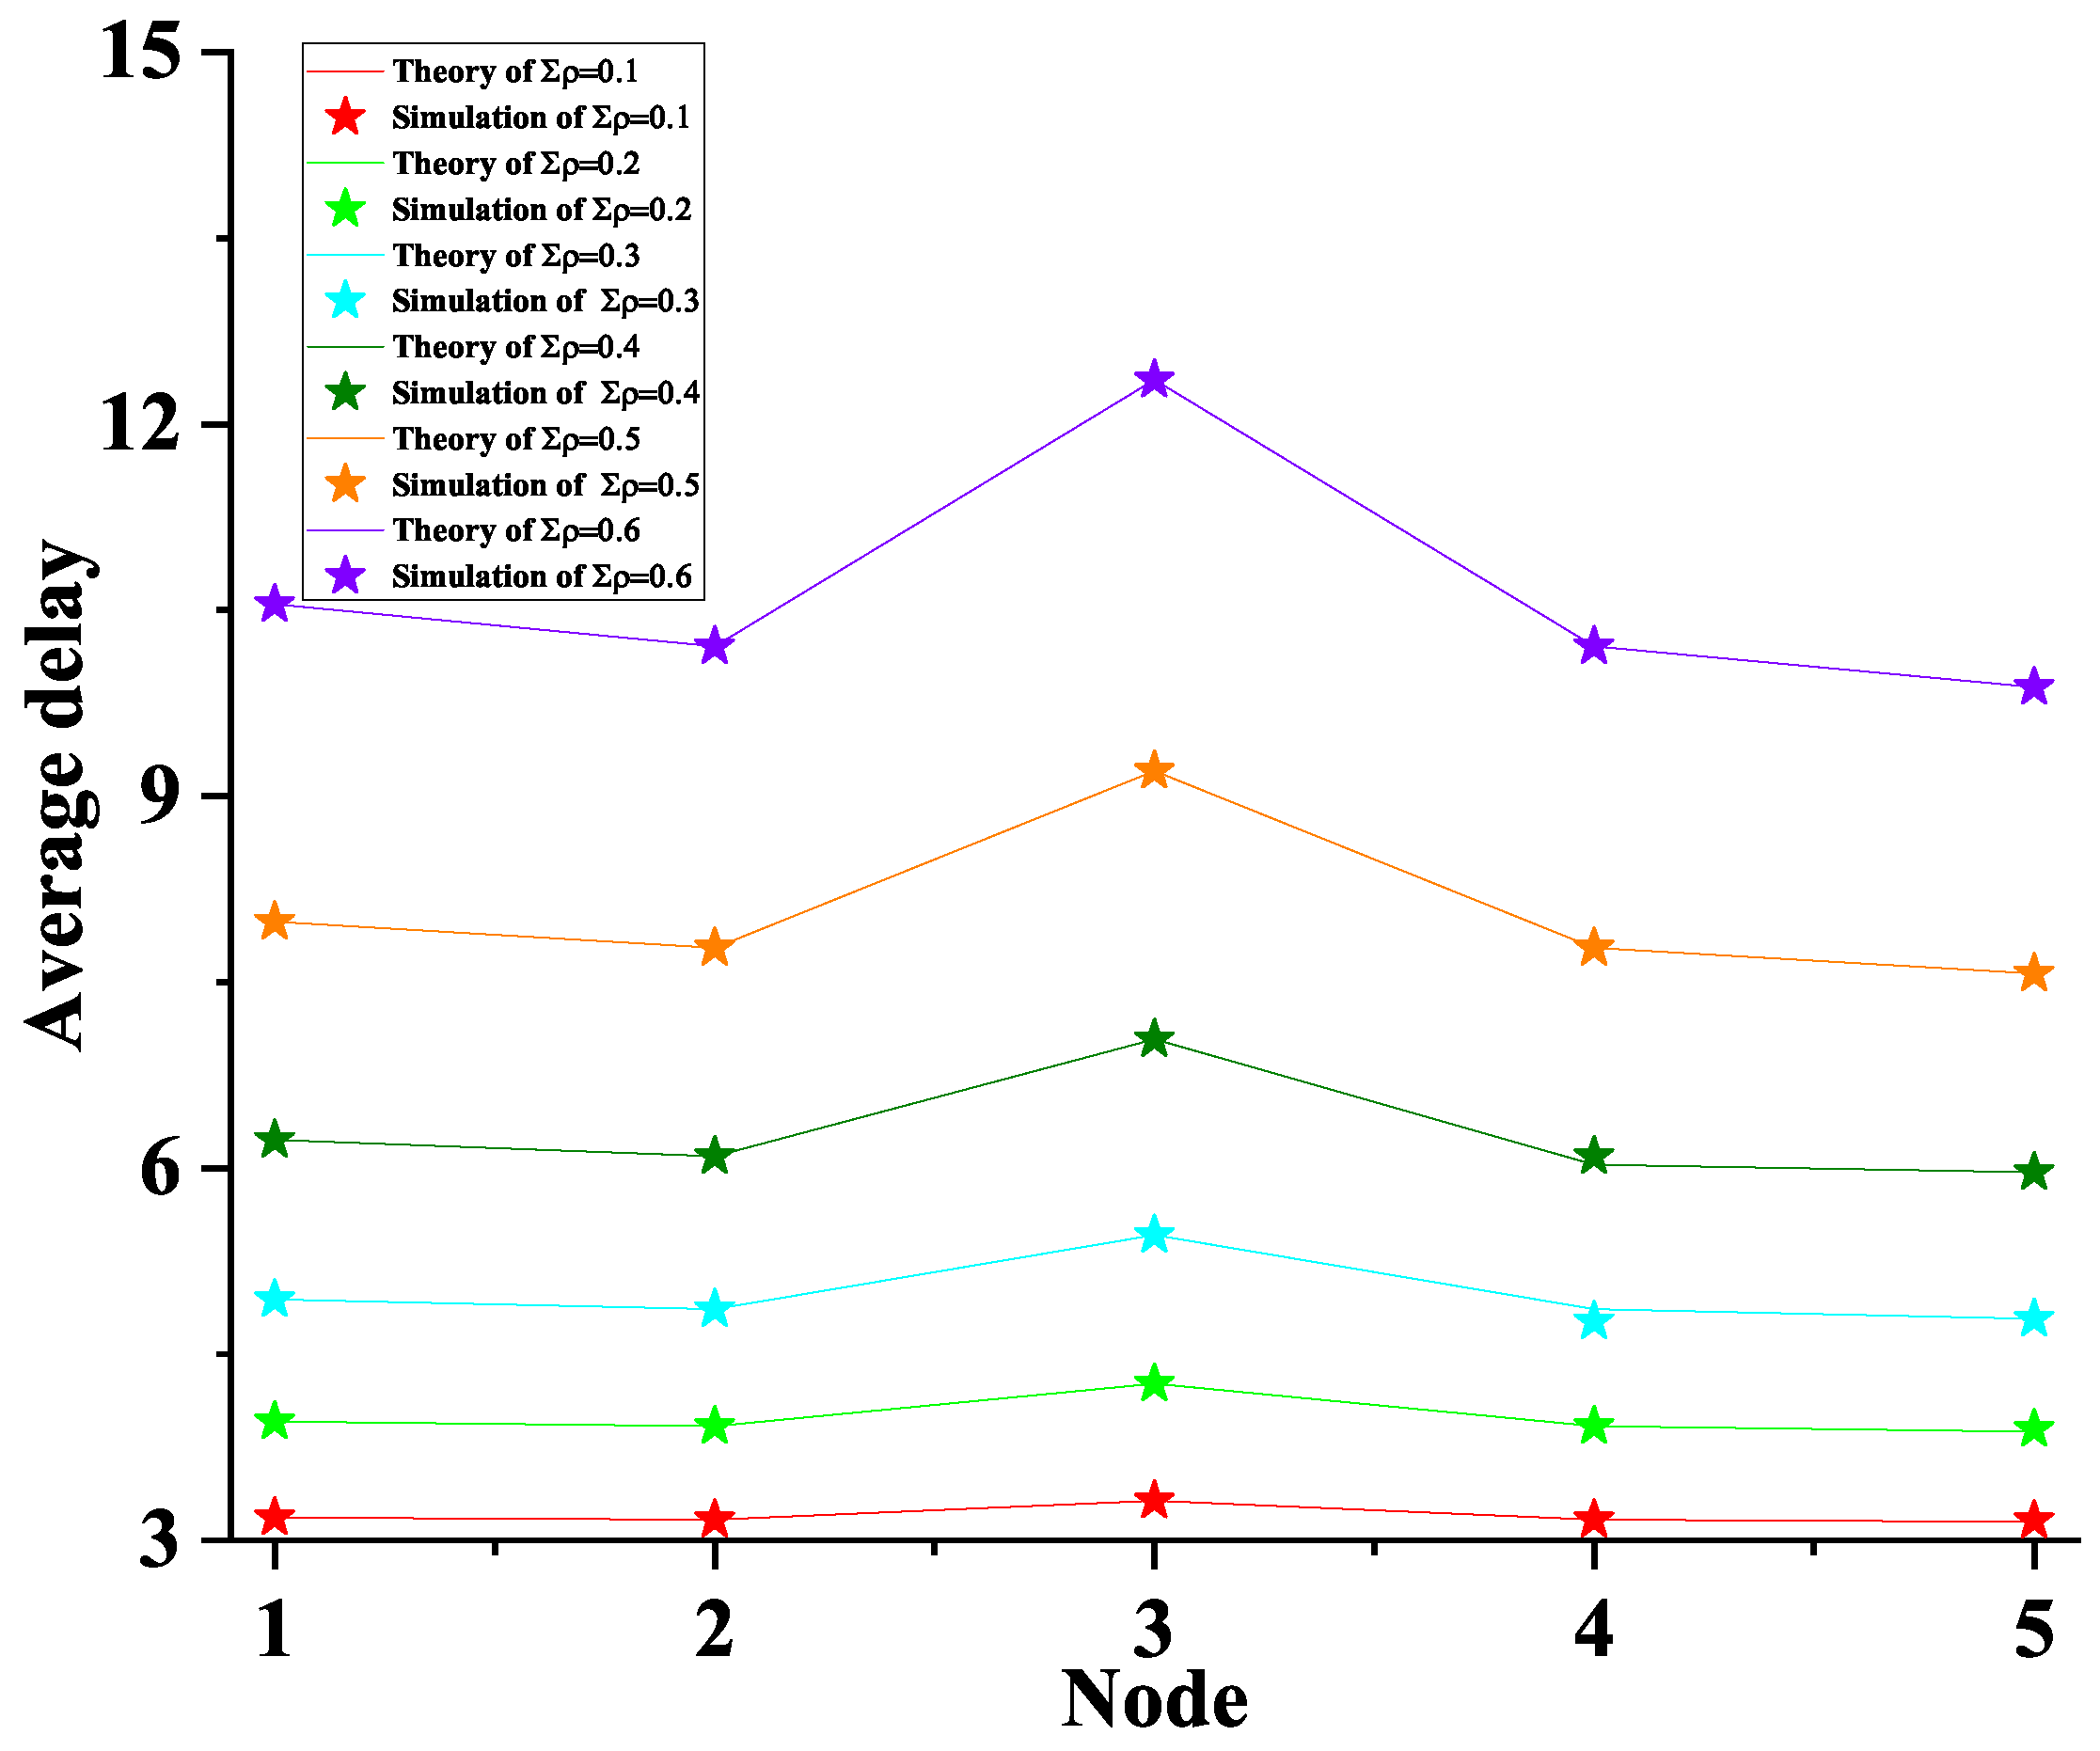
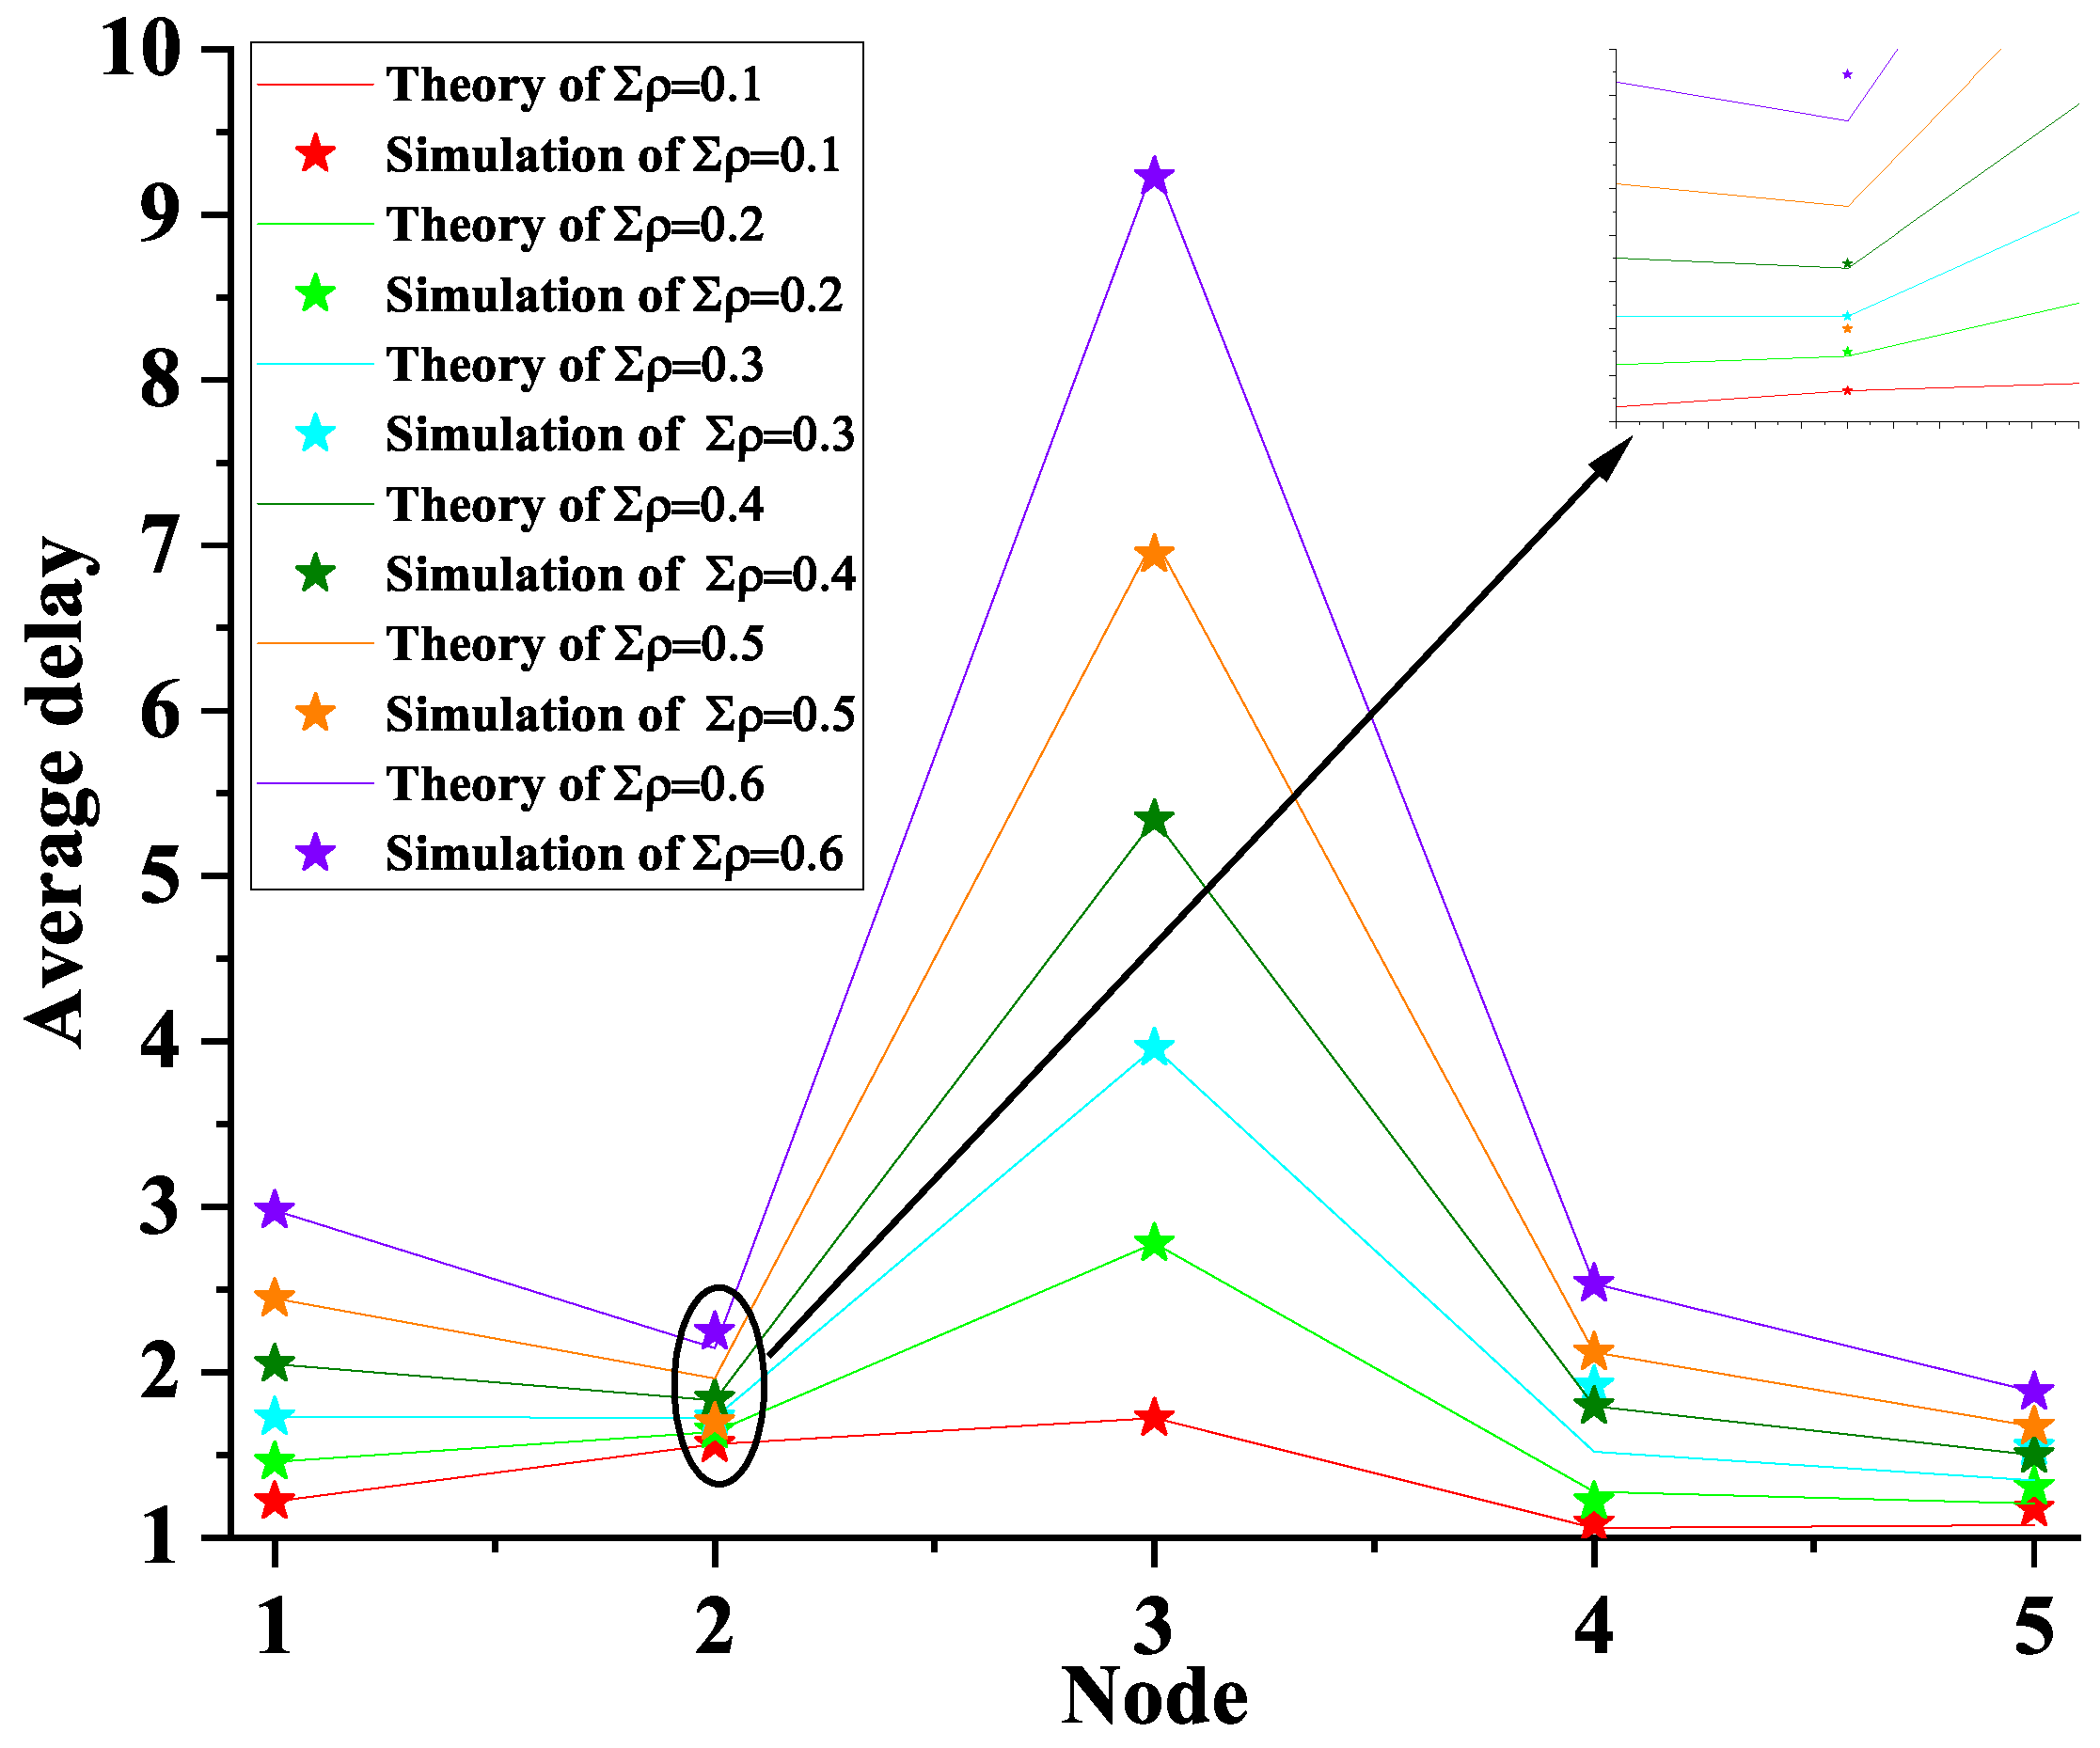
Figure 11 and Figure 12 are nodes of average delay affected by load changes. The theoretical value of the average delay is consistent with the experimental value, and the error is negligible if the number of cycles is large enough. Comparing node 3 with the other nodes shows that the average delay of the node is longer when both the service time and the switching time of the node are more significant. When only one parameter is larger, the average delay of the node is insignificant. For the same system, as the load on the system increases, the average delay also increases, and this relationship continues as the number of nodes in the system increases. The average delay of the central node is smaller than the average delay of the normal nodes for the same load, which is a good indication of the effectiveness of using a mixed polling service for prioritization.
The above analysis shows that the system’s throughput is limited. Comparing Figure 11 and Figure 12, we can see that when the system throughput increases, the average delay of the system increases rapidly. When the throughput increases to the threshold value, the system will not work correctly (the delay is much higher than the actual requirement). However, the impact of increasing system throughput on the central node’s average latency is less than the average latency of the normal nodes, indicating that the system meets the priority requirements.
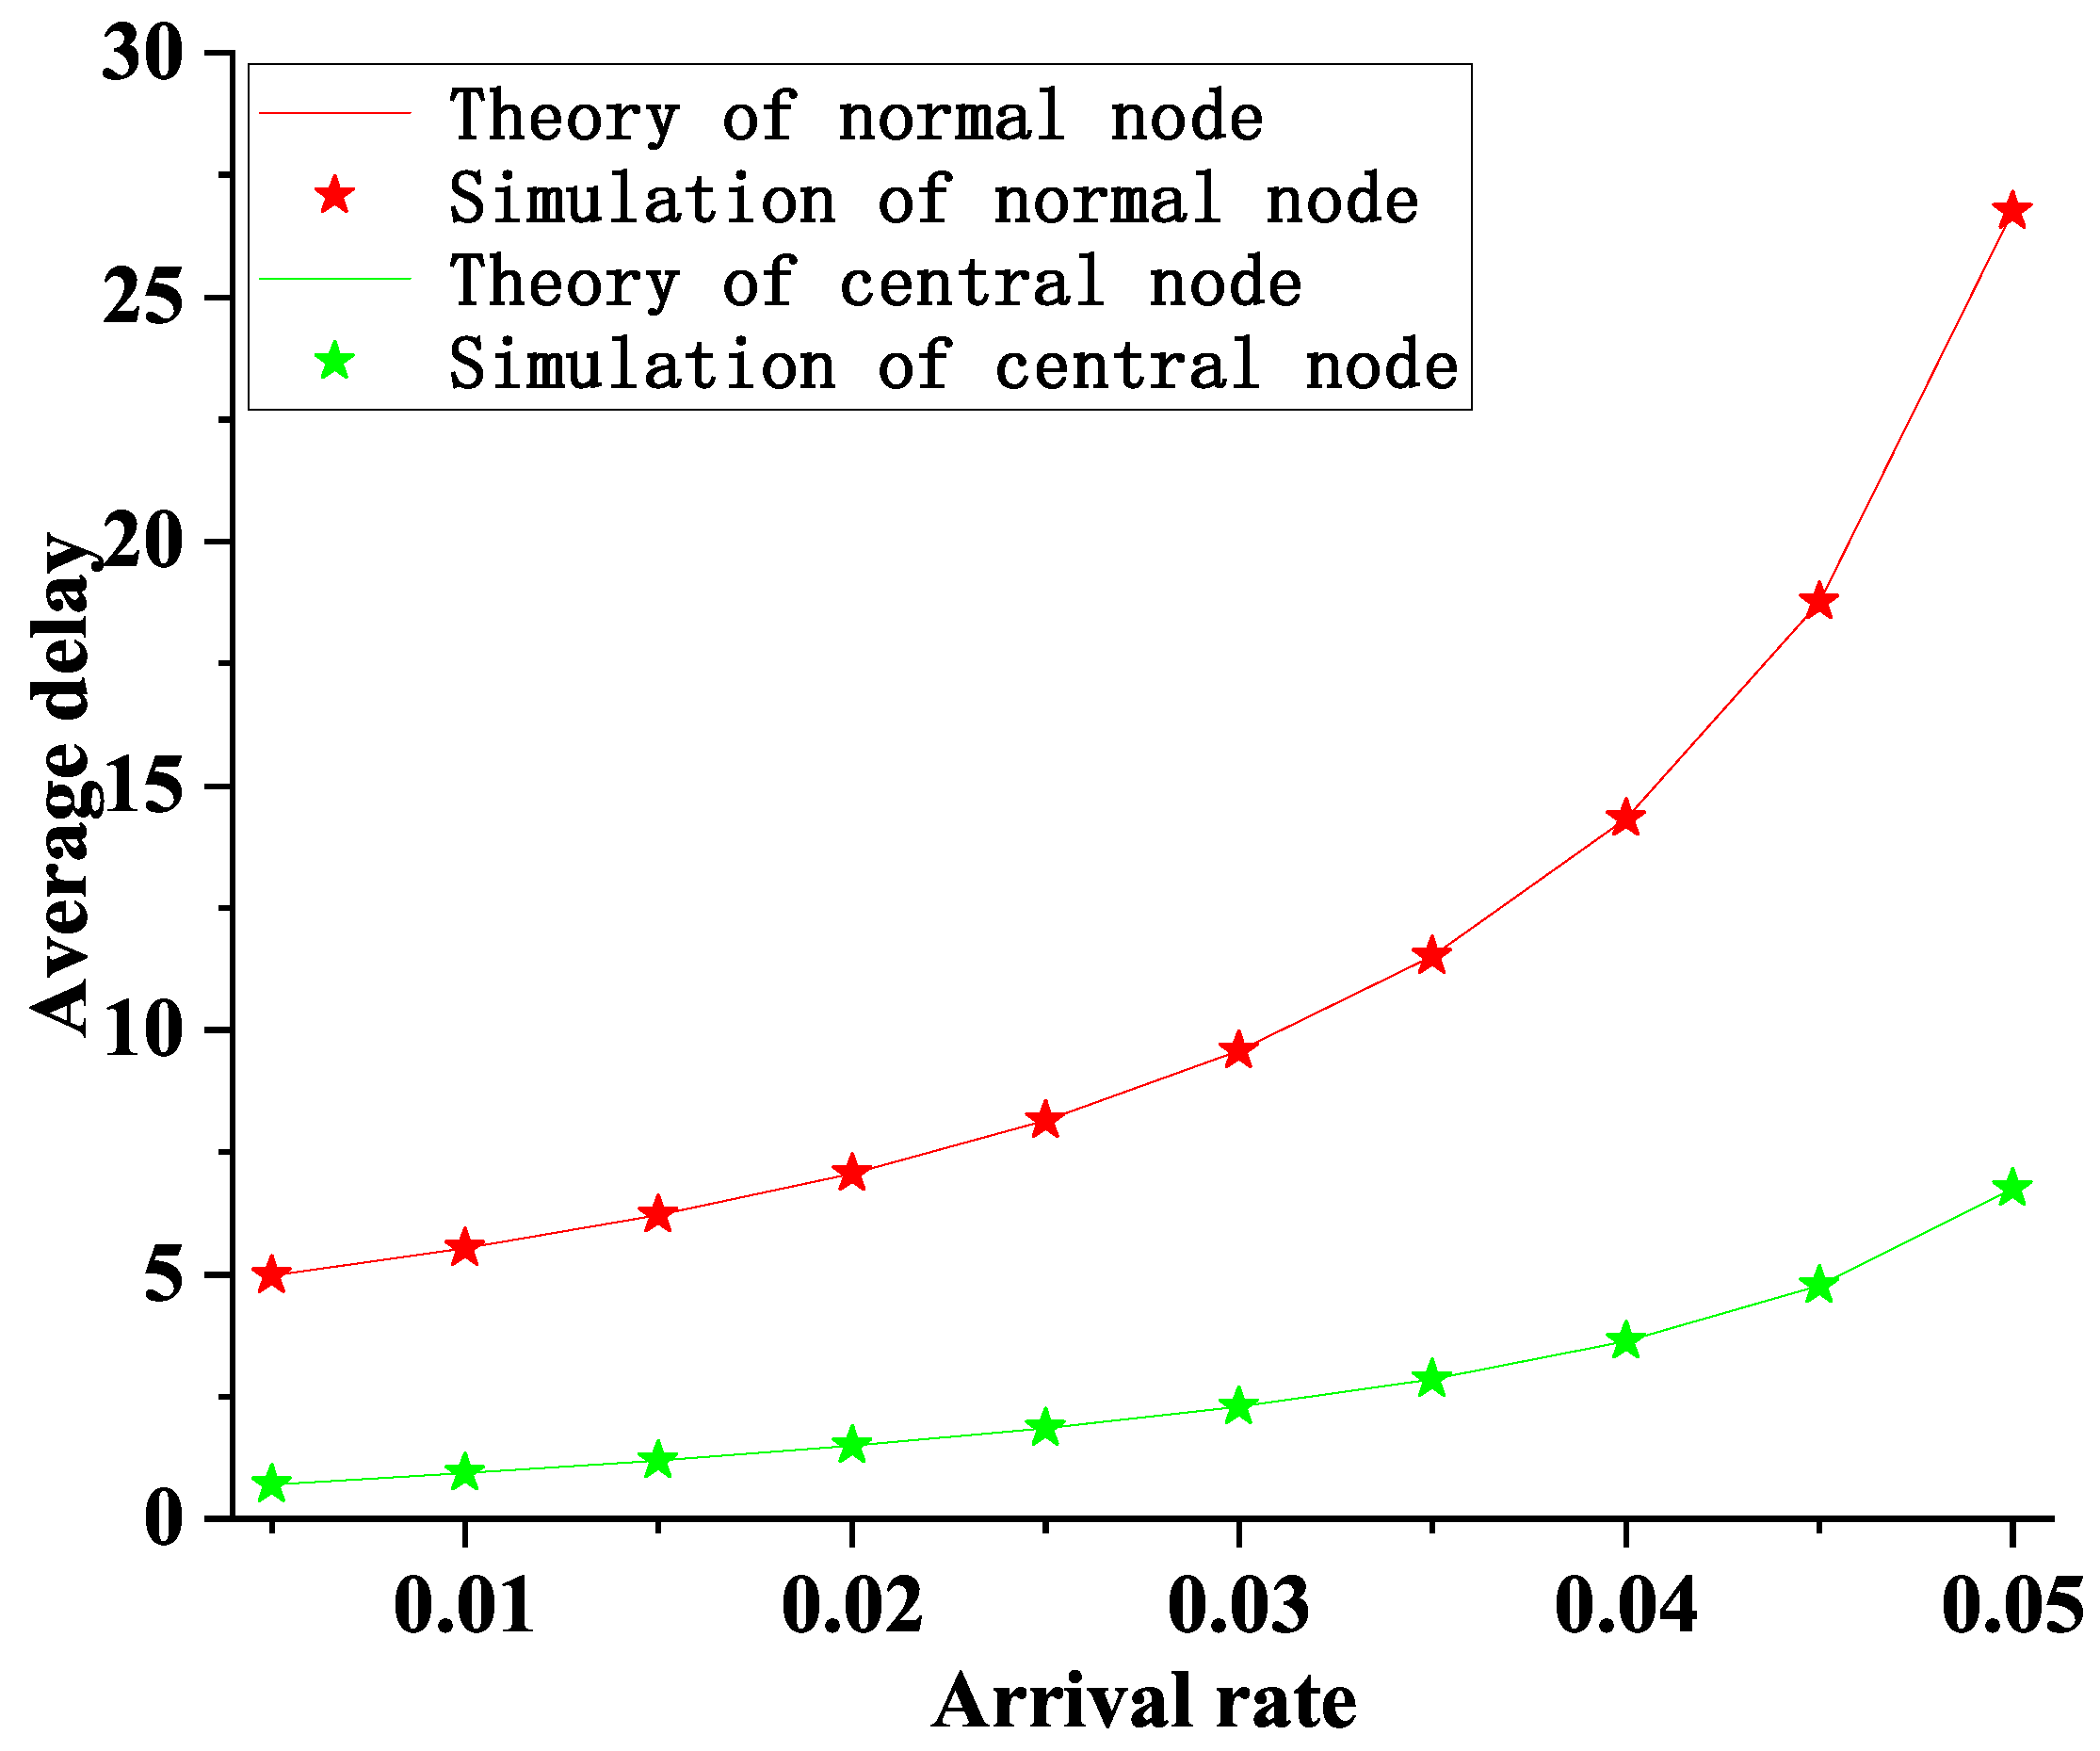
Figure 13 shows a plot of the average delay as a function of the arrival rate for the two-level priority and symmetric polling system. Although the average delay of the central node is much lower than that of the average node, the delay derived by any node is the same, which cannot be adapted to multi-task scheduling, and the system could be more resilient.

7. Conclusions

With the entry into the B5G/6G era, IoT services have diversified. Taking the MEC network service as an example, to reduce edge server energy consumption and improve utilization, we propose a two-level polling MAC protocol with a differentiated priority that accurately calculates the average length and average period using the probability-generating functions and the average delay using the period cycle approximation. Moreover, we used MATLAB R2022a to simulate the experimental and theoretical values and conformity with reality. Two-level priority and asymmetric polling systems are more relevant than symmetric polling systems. Experiments have shown that our proposed two-level priority asymmetric polling system yields node-specific latency, which increases the system’s availability, reduces the latency of the central node, and improves the total system throughput. Asymmetric polling systems with multiple assignments are closer to practical applications, computers, communications, the Internet of Things, industrial control, etc. This paper investigates a polling system with priority for a central node exhaustive service and an exhaustive asymmetric service for normal nodes. Moreover, the second-order partial derivative of the Probability-generating function is solved using a periodic query approximation. In future work, finding a more accurate method for solving the second-order partial derivatives of the Probability-generating function is the focus of the work.

Author Contributions

Conceptualization, Z.Y. and H.D.; methodology, H.D.; software, X.W.; validation, X.W., Z.Y. and H.D.; formal analysis, X.W.; investigation, Z.Y.; resources, H.D.; data curation, X.W.; writing—original draft preparation, X.W.; writing—review and editing, Z.Y.; visualization, Z.Y.; supervision, X.W.; project administration, X.W.; funding acquisition, Z.Y. All authors have read and agreed to the published version of the manuscript.

Funding

This paper was supported by the Yunnan Provincial Talent Support Program for Industrial Innovation Talents and the Expert Workstation Project of Wu Zhonghai, Yunnan Province (Project No. 202305AF150045), and the National Natural Science Foundation of China (NSFC) 61461054 and NSFC 61461053.

Institutional Review Board Statement

Not applicable.

Informed Consent Statement

Not applicable.

Data Availability Statement

The dataset and code is available from the corresponding author on reasonable request.

Acknowledgments

The authors would like to thank the editor and the anonymous reviewers for their helpful and constructive comments, which have helped us to improve the manuscript significantly.

Conflicts of Interest

The authors declare no conflict of interest.

References

  1. Al-Fuqaha, A.; Guizani, M.; Mohammadi, M.; Aledhari, M.; Ayyash, M. Internet of Things: A survey on enabling technologies, protocols, and applications. IEEE Commun. Surv. Tutor. 2015, 17, 2347–2376. [Google Scholar] [CrossRef]
  2. Zhang, J.; Letaief, K.B. Mobile edge intelligence and computingfor the internet of vehicles. Proc. IEEE 2020, 108, 246–261. [Google Scholar] [CrossRef] [Green Version]
  3. Chen, Y.; Zhao, F.; Chen, X.; Wu, Y. Efficient Multi-Vehicle Task Offloading for Mobile Edge Computing in 6G Networks. IEEE Trans. Veh. Technol. 2022, 71, 4584–4595. [Google Scholar] [CrossRef]
  4. Zhao, H.; Deng, S.; Liu, Z.; Yin, J.; Dustdar, S. Distributed Redundant Placement for Microservice-based Applications at the Edge. IEEE Trans. Serv. Comput. 2022, 15, 1732–1745. [Google Scholar] [CrossRef]
  5. Mao, S.; Wu, J.; Liu, L.; Lan, D.; Taherkordi, A. Energy-Efficient Cooperative Communication and Computation for Wireless Powered Mobile-Edge Computing. IEEE Syst. J. 2022, 16, 287–298. [Google Scholar] [CrossRef]
  6. Chen, X.; Zhang, J.; Lin, B.; Chen, Z.; Wolter, K.; Min, G. Energy-Efficient Offloading for DNN-Based Smart IoT Systems in Cloud-Edge Environments. IEEE Trans. Parallel Distrib. Syst. 2022, 33, 683–697. [Google Scholar] [CrossRef]
  7. Wang, X.; Li, J.; Ning, Z.; Song, Q.; Guo, L.; Guo, S.; Obaidat, M.S. Wireless powered mobile edge computing networks: A survey. Acm Comput. Surv. 2023, 55, 263. [Google Scholar] [CrossRef]
  8. Hou, P.; Li, B.; Wang, Z.; Ding, H. Joint hierarchical placement and configuration of edge servers in C-V2X. Hoc Netw. 2022, 131, 102842. [Google Scholar]
  9. Ghafoor, S.; Boujnah, N.; Rehmani, M.H.; Davy, A. MAC Protocols for Terahertz Communication: A Comprehensive Survey. IEEE Commun. Surv. Tutor. 2020, 22, 2236–2282. [Google Scholar] [CrossRef]
  10. Su, H.; Pan, M.-S.; Chen, H.; Liu, X. MDP-Based MAC Protocol for WBANs in Edge-Enabled eHealth Systems. Electronics 2023, 12, 947. [Google Scholar] [CrossRef]
  11. Hu, L.; Wang, W.; Zhong, S.; Guo, H.; Li, J.; Pan, Y. APP-Aware MAC Scheduling for MEC-Backed TDM-PON Mobile Fronthaul. IEEE Commun. Lett. 2023, 27, 1175–1179. [Google Scholar] [CrossRef]
  12. Li, B.; Hou, F.; Yang, G.; Zhao, H.; Chen, S. Data Analysis-Oriented Stochastic Scheduling for Cost Efficient Resource Allocation in NFV Based MEC Network. IEEE Trans. Veh. Technol. 2023, 72, 6695–6708. [Google Scholar] [CrossRef]
  13. Tian, J.; Wang, D.; Zhang, H.; Wu, D. Service Satisfaction-Oriented Task Offloading and UAV Scheduling in UAV-Enabled MEC Networks. IEEE Trans. Wirel. Commun. 2023. [Google Scholar] [CrossRef]
  14. Jiang, X.; Hou, P.; Zhu, H.; Li, B.; Wang, Z.; Ding, H. Dynamic and intelligent edge server placement based on deep reinforcement learning in mobile edge computing. Hoc Netw. 2023, 145, 103172. [Google Scholar] [CrossRef]
  15. Lin, L.; Zhou, W.A.; Yang, Z.; Liu, J. Deep reinforcement learning-based task scheduling and resource allocation for NOMA-MEC in Industrial Internet of Things. Peer-Peer Netw. Appl. 2023, 16, 170–188. [Google Scholar] [CrossRef]
  16. Niu, L.; Chen, X.; Zhang, N.; Zhu, Y.; Yin, R.; Wu, C.; Cao, Y. Multi-Agent Meta-Reinforcement Learning for Optimized Task Scheduling in Heterogeneous Edge Computing Systems. IEEE Internet Things J. 2023, 10, 10519–10531. [Google Scholar] [CrossRef]
  17. Al-Hammadi, I.; Li, M.; Islam, S.M.N. Independent tasks scheduling of collaborative computation offloading for SDN-powered MEC on 6G networks. Soft Comput. 2023, 27, 9593–9617. [Google Scholar] [CrossRef]
  18. Qin, Z.; Wang, H.; Wei, Z.; Qu, Y.; Xiong, F.; Dai, H.; Wu, T. Task Selection and Scheduling in UAV-Enabled MEC for Reconnaissance With Time-Varying Priorities. IEEE Internet Things J. 2021, 8, 17290–17307. [Google Scholar] [CrossRef]
  19. Lin, D.; Hu, S.; Gao, Y.; Tang, Y. Optimizing MEC Networks for Healthcare Applications in 5G Communications With the Authenticity of Users’ Priorities. IEEE Access 2019, 7, 88592–88600. [Google Scholar] [CrossRef]
  20. Jiang, L.; Chang, X.; Mišić, J.; Mišić, V.B.; Bai, J. Understanding MEC empowered vehicle task offloading performance in 6G networks. Peer-to-Peer Netw. Appl. 2022, 15, 1090–1104. [Google Scholar] [CrossRef]
  21. Zhou, W.; Fan, L.; Zhou, F.; Li, F.; Lei, X.; Xu, W.; Nallanathan, A. Priority-Aware Resource Scheduling for UAV-Mounted Mobile Edge Computing Networks. IEEE Trans. Veh. Technol. 2023, 72, 9682–9687. [Google Scholar] [CrossRef]
  22. Paymard, P.; Mokari, N. Resource allocation in PD-NOMA–based mobile edge computing system: Multiuser and multitask priority. Trans. Emerg. Telecommun. Technol. 2022, 33, e3631. [Google Scholar] [CrossRef]
  23. Shukla, P.; Pandey, S.; Agarwal, D. An Efficient Offloading Technique using DQN for MEC-IoT Networks. In Proceedings of the 2023 6th International Conference on Information Systems and Computer Networks (ISCON), Mathura, India, 3–4 March 2023; pp. 1–7. [Google Scholar] [CrossRef]
  24. Sharif, Z.; Jung, L.T.; Ayaz, M.; Yahya, M.; Pitafi, S. Priority-based task scheduling and resource allocation in edge computing for health monitoring system. J. King Saud Univ.-Comput. Inf. Sci. 2023, 35, 544–559. [Google Scholar] [CrossRef]
  25. Boon, M.A.A.; van der Mei, R.D.; Winands, E.M.M. Applications of polling systems. Appl. Poll. Syst. 2011, 16, 67–82. [Google Scholar] [CrossRef] [Green Version]
  26. Suman, R.; Krishnamurthy, A. Analysis of tandem polling queues with finite buffers. Ann. Oper. Res. 2020, 293, 343–369. [Google Scholar] [CrossRef]
  27. Suman, R. Krishnamurthy, A. Analysis of two-station polling queues with setups using continuous time markov chain. arXiv 2022, arXiv:2202.10045. [Google Scholar] [CrossRef]
  28. Lê, A.T. A Tandem Queueing Model to Optimize the Efficiency of Public Administrative Services. Master’s Thesis, Vietnam National University, Hanoi, Vietnam, 2021. [Google Scholar]
  29. Miculescu, D.; Karaman, S. Polling-Systems-Based Autonomous Vehicle Coordination in Traffic Intersections With No Traffic Signals. IEEE Trans. Autom. Control 2020, 65, 680–694. [Google Scholar] [CrossRef]
  30. Li, S.; Shu, K.; Chen, C. Planning and Decision-making for Connected Autonomous Vehicles at Road Intersections: A Review. Chin. J. Mech. Eng. 2021, 34, 133. [Google Scholar] [CrossRef]
  31. Talamali, M.S.; Saha, A.; Marshall, J.A.; Reina, A. When less is more: Robot swarms adapt better to changes with constrained communication. Sci. Robot. 2021, 6, eabf1416. [Google Scholar] [CrossRef]
  32. Zakir, R.; Dorigo, M.; Reina, A. Robot Swarms Break Decision Deadlocks in Collective Perception Through Cross-Inhibition. In Swarm Intelligence; ANTS 2022; Lecture Notes in Computer Science; Springer: Cham, Switzerland, 2022; Volume 13491. [Google Scholar]
  33. Nasser, N.; Fadlullah, Z.M.; Fouda, M.M.; Ali, A.; Imran, M. A lightweight federated learning based privacy preserving B5G pandemic response network using unmanned aerial vehicles: A proof-of-concept. Comput. Netw. 2022, 205, 108672. [Google Scholar] [CrossRef]
  34. Chour, K.; Reddinger, J.P.; Dotterweich, J.; Childers, M.; Humann, J.; Rathinam, S.; Darbha, S. An agent-based modeling framework for the multi-UAV rendezvous recharging problem. Robot. Auton. Syst. 2023, 166, 104442. [Google Scholar] [CrossRef]
  35. Kumar, S.; Raw, R.S.; Bansal, A. LoCaL: Link-optimized cone-assisted location routing in flying ad hoc networks. Int. J. Commun. Syst. 2023, 36, e5375. [Google Scholar] [CrossRef]
  36. Yang, Z.; Zheng, H.; Ding, H. Research on polling MAC protocol for multi-robot system in WLAN. Appl. Res. Comput. 2022, 39, 1178–1182. [Google Scholar] [CrossRef]
  37. Wang, Z.; Ding, H.; Li, B.; Bao, L.; Yang, Z. An energy efficient routing protocol based on improved artificial bee colony algorithm for wireless sensor networks. IEEE Access 2020, 8, 133577–133596. [Google Scholar] [CrossRef]
  38. Zhou, W.; Xia, J.; Zhou, F.; Fan, L.; Lei, X.; Nallanathan, A.; Karagiannidis, G.K. Profit maximization for cache-enabled vehicular mobile edge computing networks. IEEE Trans. Veh. Technol. 2023. [Google Scholar] [CrossRef]
  39. Boxma, O.J.; Kella, O.; Kosinski, K.M. Queue lengths and workloads in polling systems. Oper. Res. Lett. 2011, 39, 401–405. [Google Scholar] [CrossRef] [Green Version]
  40. Chu, Y.Q.; Liu, Z.M. The impact of priority policy in a two queue markovian polling system with multi-class priorities. In Proceedings of the 12th International Conference on Queueing Theory and Network Applications, Qinhuangdao, China, 21–23 August 2017; Springer: China, Switzerland, 2017; pp. 282–296. [Google Scholar]
  41. Mu, W.-H.; Bao, L.-Y.; Ding, H.-W.; Zhao, Y.-F. An exact analysis of discrete time two-level priority polling system based on multi-times gated service policy. Acta Electron. Sin. 2018, 46, 276–280. [Google Scholar]
  42. Guan, Z.; Yang, Z.-J.; He, M.; Qian, W.-H. Study on the delay performance of station dependent two-level polling systems. Acta Autom. Sin. 2016, 42, 1207–1214. [Google Scholar]
  43. Yang, Z.; Mao, L.; Yan, B.; Wang, J.; Gao, W. Performance analysis and prediction of asymmetric two-level priority polling system based on BP neural network. Appl. Soft Comput. 2021, 99, 106880. [Google Scholar] [CrossRef]
  44. Yang, Z.J.; Zhao, D.F.; Ding, H.W.; Zhao, Y.F. Research on two-class priority based polling system. Acta Electron. Sin. 2009, 37, 1452–1456. [Google Scholar]
  45. Siddiqui, S.; Ghani, S. Towards dynamic polling: Survey and analysis of channel polling mechanisms for wireless sensor networks. In Proceedings of the 2016 International Conference on Intelligent Systems Engineering, Islamabad, Pakistan, 15–17 January 2016; IEEE: Piscataway Township, NJ, USA, 2016; pp. 356–363. [Google Scholar]
  46. Rehman, M.U.; Drieberg, M.; Badruddin, N. Probabilistic polling MAC protocol with unslotted CSMA for wireless sensor networks (WSNs). In Proceedings of the 2014 5th International Conference on Intelligent and Advanced Systems, Kuala Lumpur, Malaysia, 3–5 June 2014; IEEE: Piscataway Township, NJ, USA, 2014; pp. 1–5. [Google Scholar]
  47. Siddiqui, S.; Ghani, S.; Khan, A.A. ADP-MAC: An adaptive and dynamic polling based mac protocol for wireless sensor networks. IEEE Sens. J. 2018, 18, 860–874. [Google Scholar] [CrossRef]
  48. Zhao, D.; Zheng, S. Analysis of a polling model with exhaustive service. Acta Electron. Sin. 1994, 22, 102–107. [Google Scholar]
  49. He, M.; Guan, Z.; Bao, L.; Ge, J. Mean cyclic period analysis of polling access control for wireless sensor networks. Chin. J. Sci. Instrum. 2016, 37, 2637–2644. [Google Scholar]
Figure 1. The multiple services for edge servers.
Axioms 12 00709 g001
Figure 2. System model.
Axioms 12 00709 g002
Figure 3. The flow chart of the MEC networks.
Axioms 12 00709 g003
Figure 4. State transition diagram.
Axioms 12 00709 g004
Figure 5. The average queue length of node i varies with the arrival rate (N = 5).
Axioms 12 00709 g005
Figure 6. The average queue length of h varies with the arrival rate (N = 5).
Axioms 12 00709 g006
Figure 7. The average queue length of node i with the service time (N = 5).
Axioms 12 00709 g007
Figure 8. The average queue length of h varies with the service time (N = 5).
Axioms 12 00709 g008
Figure 9. The average queue length of normal node varies with the arrival rate (N = 5).
Axioms 12 00709 g009
Figure 10. The average cyclic period varies with the arrival rate (N = 5).
Axioms 12 00709 g010
Figure 11. The average waiting time of node i queues is affected by load changes (N = 5).
Axioms 12 00709 g011
Figure 12. The average waiting time of h varies is affected by load changes (N = 5).
Axioms 12 00709 g012
Figure 13. The average delay of normal node varies with the arrival rate (N = 5).
Axioms 12 00709 g013
Table 1. Comparison of relevant literature.
LiteratureAsymmetricalMachine LearningPriorityIndicators of MeasurementAccurate Calculation
[10]NoNoNochannel utilization, the system throughputNo
[11]NoYesNoPacket blockage rate and average delayNo
[12]NoNoNoLyapunov function of queue backlog of operation functions and overall cost of communication and computing in the MECNo
[13]NoYesYesServer utilization and number of usersNo
[14]NoYesNoServer utilizationNo
[15]NoYesNoAverage delay andNo
[16]NoYesNoAverage task queuing delay per time slotNo
[17]NoYesNoTotal execution time and Average task failureNo
Our workYesNoYesAverage queue length and average polling period, and average delayYes
Table 2. Definition of system variables.
VariablesDefinition
i or j or kNormal nodes
hCentral node
μ i ( n ) The server switching time from node i to other nodes
ν i ( n ) The time of service provided by server to node i
ν i ( n * ) The time of service provided by the server to the central node
μ j ( μ i ) The amount of data entering the node j within time μ i ( n )
μ h ( μ i ) The amount of data entering the central node within time μ i ( n )
η j ( ν i ) The amount of data entering the node j within time ν i ( n )
η h ( ν i ) The amount of data entering the node within time ν i ( n )
η j ( ν h ) The amount of data entering the node j within time ν i ( n * )
η h ( ν h ) The amount of data entering the central node within time ν i ( n * )
Table 3. Initial parameters.
i λ i β i γ i
NodeArrival RateService TimeSwitch Time
10.0142
20.00653
30.00131.5
40.00521.7
50.00211.9
h0.00810
Disclaimer/Publisher’s Note: The statements, opinions and data contained in all publications are solely those of the individual author(s) and contributor(s) and not of MDPI and/or the editor(s). MDPI and/or the editor(s) disclaim responsibility for any injury to people or property resulting from any ideas, methods, instructions or products referred to in the content.