Abstract
Rough Set (RS) theory is used for data analysis and decision making where decision-making rules can be derived through attribute reduction and feature selection. Energy shortage is an issue for governments, and solar energy systems have become an important source of renewable energy. Rough sets may be used to summarize and compare rule sets for different periods. In this study, the analysis of rules is an element of decision support that allows organizations to make better informed decisions. However, changes to decision rules require adjustment and analysis, and analysis is inhibited by changes in rules. With this consideration, a solution approach is proposed. The results show that not only can decision costs be reduced, but policymakers can also make it easier for the public to understand the incentives of green energy programs and the use of solar panels. The application process is simplified for the implementation of sustainable energy policies.
1. Introduction
Energy shortages are an urgent issue for governments worldwide, and sustainable development is a common global goal. Governments attach great importance to the development of renewable energy to create better global energy policies. Energy conservation and carbon reduction are also indispensable elements of energy policies, so the Green Energy Roofs Project encourages households to install solar panels and actively participate in the sustainable development of renewable energy by promoting energy conservation and carbon reduction. Roof solar systems are a pollution-free and renewable energy source and represent a sustainable and green source of energy.
Climate change has exacerbated energy shortages since environmental sustainability has become more difficult due to economic and social development. In recent years, the Russian–Ukrainian war, the COVID-19 pandemic and extreme droughts in the Northern Hemisphere have been the principal climate change factors and have created a reduction in global economic growth. Governments use subsidies to address this problem, but their effectiveness is often limited, and the expected results are often not achieved [1]. Decision support systems must be used to assist decision makers in designing measures more quickly and accurately.
Rapid developments in information technology have allowed companies and government agencies to collect vast amounts of data, but these data must be extracted, processed and organized to be transformed into useful information that supports decision making. This transformation involves formulation, analysis, improvement and prediction.
Rough set knowledge is the most important pertinent element of decision making [2]. Rough set technology is used for complex decision-making problems that feature uncertainty to induce decision rules and to support decision-making formulation. Therefore, decision support systems must transform data into knowledge to increase the efficiency and accuracy of decision making.
The motivation of this study is as follows: decision rule sets may require adjustment over time and the relationship between rule sets can change, so analysis is difficult. Differences between rule sets may require flexible strategic modifications in response to business trends. Previous studies quickly established applicable algorithms and verified those models to create disposable solutions, but this process did not involve a comprehensive analysis of rules. Yen, Huang, Wen and Wang [3] showed that advanced rule sets are not accurately or thoroughly analyzed, although rule analysis is an indispensable element of decision support that responds to the challenges of changes in rule sets to allow institutions to make better-informed decisions.
Previous studies have determined methods to generate rule sets [4,5,6], but these studies do not pertain to correlation-based rule evolution and renewable energy exploration. Previous studies also did not induce decision rules or consider changes in energy usage for different time periods or the effect of environmental factors on energy use. This study compares rule sets to provide more relevant information and to support decision making in terms of sustainable energy. The results of this study are more useful than those for simple data analysis and address the need for rapid decision making with regard to sustainable energy.
Due to the shortage of energy resources, renewable energy has become a development trend in the future, and solar panels are one of the renewable energy sources that has attracted people’s attention. This study uses the “Green Energy Roofs Project” that was proposed by the Taiwanese government as a case study of a nationwide participation policy. It monitors the encouragement of public participation and the sharing of benefits from the project to provide more useful information for decision making with regard to sustainable energy. This study compares rule sets for different periods for case studies and for empirical research. Rough sets are used to induce rule sets and to determine the differences and changes in the public’s willingness to participate in energy incentives, with respect to rule evolution and feed-in tariffs.
This study is an in-depth case study of the analysis of participation in renewable energy programs before and after the COVID-19 pandemic. It provides specific policy recommendations for decision makers that allow governments to develop more effective sustainable energy policies. The contribution of this study is that not only will this study reduce the cost of decision-making, but policymakers can also make it easier for the public to understand green energy programs and incentives for solar panel use.
This study determines the evolution and application of decision-making rules for sustainable renewable energy in order to provide decision makers with relevant information to formulate more effective policy strategies. This study features five sections. Section 1 details the collection of information that is related to decision making and sustainable renewable energy. A literature review that shows the evolution and application of decision rules is presented in Section 2. Nine types of decision rules are compared in Section 3. The condition attributes and the results for the nine types of decision-making rules are summarized in Section 4. Section 5 draws conclusions and presents recommendations for attribute weight measurement and with regard to the evaluation criteria that are required to allow decision makers to make wiser decisions.
2. Literature Review
2.1. Rough Sets
Rough Set (RS) theory is a mathematical method and decision classification rule theory that was proposed by Pawlak in 1982. It is used for data that feature uncertainty, incompleteness, and fuzziness. Decision rules are presented in IF-THEN form to represent knowledge that is used for reasoning and classification. Rough sets are combined with decision rules to solve decision problems that involve uncertainty.
This theory divides a database into condition attributes and decision attributes. The information about objects is allocated to subsets based on its attributes. The approximate relationship between subsets of condition attributes and decision attributes is then determined, in order to generate decision rules. These decision rules provide the most direct result and are used to mine contextual rules in the database. These scenarios are used to demonstrate the effect of changes in conditional patterns and outcome attributes on decision rules to better understand the relationships between rule sets.
The results of this study show that rough set theory can be used to mine contextual rules in a database to better predict various phenomena and behaviors. The following details some basic concepts of rough set theory.
Rough set theory is a method of classifying knowledge that is used for decision making by determining the effect of changes in the condition type and the outcome attributes on decision rules. A finite set of objects that is described by a finite set of attributes is used to mine knowledge rules in the database, in order to categorize the information system to allow decision making using all available information about the set of objects in the information table [7]. An information system S is defined as
where
- U: the set of objects
- A: the set of attributes,
- V = , Va, the set of values of attributes a A,
- p: U × A ⟶ V, an information function, ,
- the information about x in S,
where
for every and .
It is assumed that the empty set is fundamental in every S. The pair S = (U, A) is called an approximation space. If U is the set , which is called the full domain, and attribute set A is an equivalence relation on U, then C is the condition attribute subset and D is the decision attribute subset.
An equivalence relationship features indiscernibility. If the set of attributes is a subset of the indiscernible relationship on the universe U, which is expressed as
where x objects are defined by the equivalence class , or [x], then is called the approximation space.
For an information system , for a subset X ⊆ U. The upper and lower approximation sets are defined as
where [x] is the equivalence class for x.
Therefore, (U, X) forms an approximation space. The universe is divided into three disjointed regions, as shown in Figure 1, which shows the upper and lower approximation sets i.e., the positive, boundary and negative regions. X is bounded by the red circle line. The boundary region is defined as the difference between the upper and lower approximation sets [8]. As the area of the boundary increases, the degree of uncertainty increases. The approximate values and the three regions are expressed as,
and
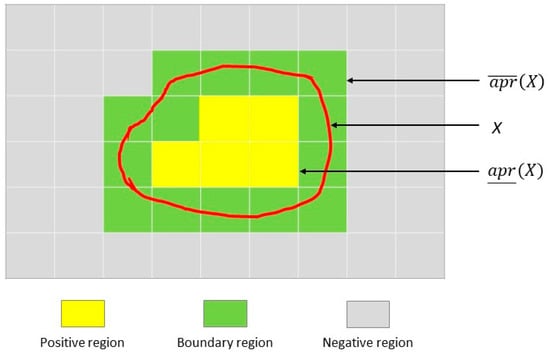
Figure 1.
An approximation space.
If object x ∈ POS (X), then it must belong to the target set X;
If object x ∈ BND (X), then x definitely does not belong to the target set X;
If object x ∈ NEG (X), it may or may not belong to the target set X, and therefore it is not possible to determine whether object x belongs to the target set X.
For any target subset X ⊆ U and attribute subset B ⊆ A, X is called a rough set with respect to B if and only if . The roughness of set X with respect to B is defined as
where , then ), and denotes the base of a finite set.
If there is a large amount of information and many uncertainties, it is very difficult to make scientific and rational decisions. The condition attribute and the decision attribute in rough set theory are used to determine the similarities and differences in the approximation space, in order to classify the data messages into different equivalence categories and conduct a meaningful structural analysis. Decision support systems allow decision making using IF THEN rules. Decision support systems that use rough sets allow better decisions than common decision-making methods. Rough set theory determines these rules by analyzing a large amount of historical empirical data. Oblique and less complete attribute factors in the decision object are used to achieve essentially positive conclusions.
Pawlak [7] proposed that approximation spaces give rise to topological spaces. For each , and for each approximation space, S = .
The notions of and can be understood as the interior and closure of the set in the associated topological space, respectively. Within the rough set theory of topological spaces, a considerable body of literature exists, encompassing various aspects such as fundamental concepts [9]; the study of generalized rough neighborhood systems involving rough approximations (lower and upper) and topological operators (interior and closed) [10]; the exploration of approximation spaces inspired by subset rough neighborhoods and their practical applications [11,12]; and the proposal of a novel rough approximation operator in the form of an abstract structure known as a “supra-topology” [13].
Al-shami [11] proposed neighborhood space of lower and upper approximations. Let be a j-NS such that is an equivalence relation and . The pair ( represents the lower and upper approximations of a set X based on -neighborhoods, respectively. The is refer to -neighborhoods (as containment neighborhoods), j-NS refers to j-neighborhood space and j ∈ .
The -neighborhoods defined as follows:
The three regions and accuracy measure are expressed as:
where for any j and each nonempty subset X of U. The best accuracy measures obtained with .
Decision-making problems often involve multiple conditions, goals or subjects. By integrating the use of topological space and rough set theory, the structure within the data can be understood in greater depth, thus reducing the boundary regions. This enables decision makers to make accurate decisions and obtain solutions quickly.
For two finite, non-empty sets U and A, where U is the universe of objects and cases and A is a set of attributes and features [14], the pair IS = (U, A) is called an information table. For each attribute, is a set Va of its values, which is referred to as the domain of a. The object x and attributes are defined as a(x) with a data pattern .
The IS information table (U, A) divides A into two types of attributes: . These are, respectively, called conditional and decision (action) attributes. Each decision table describes decisions (actions, results, etc.) that are determined when some conditions are satisfied, so each row of the decision table specifies a decision rule that determines the decisions for a specific set of conditions. is called a decision table, in which and are represented by means of a data sequence (also called a data set) of data patterns , where , and , , for . A data sequence also defines a decision table. The equivalence classes of I(D) are the decision classes.
Using the attribute selection method for rough sets, the attribute subsets are subdivided into positive domains, boundaries and negative regions to identify significant and non-significant features and increase accuracy and efficiency. Classification, categorization, analysis and evaluation are used to determine the decision rules between data. After analysis of the data of different attributes and corresponding decisions, if the attributes and decisions are the same, a positive, certain, and non-conflicting rule is generated, which is called a consistent decision rule. If the attributes and decisions are different, a non-deterministic and conflicting rule is generated, which is an inconsistent decision rule.
Conflict analysis is a mathematical formal model that uses rough set theory to determine the relationship between the degree of conflict between subjects. In the context of conflict analysis, rough set theory is used to analyze and classify data that are related to a conflict. This process can be used to solve governmental, political, and business strategy formulation models [7]. There is no universal theory of conflict analysis using mathematical models. The domain has the greatest effect.
For a finite, non-empty set U that is called the universe, the elements of U are called agents. A function v:U →{−1, 0, 1}, or {−, 0, +} assigns a value −1, 0 or 1 to every agent, representing an opinion, view or voting result for an issue that, respectively, corresponds to against, neutral and favorable.
The pair S = (U, v) is denoted as a conflict situation.
Three basic binary relationships are defined in the universe to express the relationship between subjects: conflict, neutrality and alliance. The auxiliary function is defined as
Therefore, if , agents x and y share the same view on issue v (allied on v); if , at least one agent, x or y, is neutral with regard to a (neutral on a); and if , both agents differ on issue v (in conflict on v).
The three basic relationships , and on , respectively, refer to alliance, neutrality and conflict relationships and are defined as
Conflict analysis is used to resolve conflicts of interest and value in a complex decision-making environment. Rough sets are used to compare options in terms of benefit and cost, in order to determine the option that minimizes conflict and contradiction. Conflict analysis identifies conflicts and their root causes, and rough set theory is used to analyze complex and uncertain data that are related to conflicts and to extract useful knowledge to inform a conflict resolution process.
Pawlak [15] proposed a method of data analysis for a specific type of data table: a decision table. Zhang and Yao [16] and Zhang and Miao [17] proposed a three-level granularity structure for decision tables, which provides a framework for granularity calculations, data processing and attribute simplification. The decision table is represented by
where OB is a universe with finite objects; AT is the finite set of attributes, which includes the set of condition attributes C and the set of decision attributes D; is the value domain for a ∈ AT; : OB → is an information function; x ∈ OB has a value (x) on attribute a; and DT = (OB, C ∪ D) represents a simplified decision table.
Three-way decisions are used in RSs to reduce the cost of a decision. Positive certainty rules that are derived from the positive domain indicate acceptance of a concept, negative certainty rules that are derived from the negative domain indicate rejection of a concept and uncertainty rules that are derived from the boundary domain are used to delay decision making (deferment).
Solutions that quickly support decision making are necessary in an organization that is changing from traditional management to a more flexible and adaptable form [18]. This faster, more flexible change is beneficial to global organizations, but data change dynamically over time, so it is complex and time-consuming to obtain relevant and consistent up-to-date information across large organizations [19]. These organizations must use decision support to allow decision makers to make faster and more accurate judgments in response to changing environments. The process of extracting and transforming rules (in IF-THEN form) using expert knowledge is a knowledge management process, technique and methodology [2]. These rules are used for the reasoning process for decision support. Extracting useful information by analyzing rules and identifying the evolution of rules by comparing rule sets to make decisions increases efficiency and innovation in decision support.
In terms of rough sets, many studies propose effective multi-criteria decision-making methods. Wang and Zhang [20] used rough sets and fuzzy measures to propose a multi-criteria decision-making method that allows decision makers to deal with complex multi-criteria decision-making problems. Ayub et al. [21] proposed the linear Diophantine fuzzy rough set model, which is used for multi-stage decision analysis. Many studies also show that rough sets and rule evolution are practical in a real-world context [22,23,24]. These methods allow decision makers to make better decisions in a complex decision-making context.
2.2. Renewable Energy
There is an energy shortage crisis, so renewable energy sources must be identified for contemporary society. Sharma et al. [6] showed that solar energy is a renewable energy management system that is efficient and reduces energy wastage. Jafari and Malekjamshidi [25] proposed the use of rule control and rule optimization methods to manage sustainable energy sources.
In terms of renewable energy, Gung et al. [5] proposed a hybrid analytical approach that uses quantitative and qualitative analysis to determine the factors that affect household energy consumption. Alzahrany et al. [4] used rough set theory to determine the barriers and drivers in the use of solar energy in Saudi Arabia and showed that technical, financial and policy factors are the main barriers. However, Saudi Arabia has abundant solar resources, and there is an impetus for energy transition. These studies show that effective energy management strategies that promote sustainable development are possible.
In terms of environmental protection and sustainable development, rooftop solar systems offer many advantages [26,27]. To promote the use of renewable energy, the Taiwanese government launched the “Green Energy Roofs Project” in 2019. This was modeled on Germany’s Renewable Energy Act of 2000, which used a feed-in tariff policy for solar power generation. Li, Wang, Dai, and Wu [28] showed that the Chinese government’s support for the solar energy industry has given a strong impetus to the development of solar power generation.
The US government supports the development of the solar energy industry by implementing policy measures such as tax credits and by simplifying the application process for solar projects [29]. This incentive has greatly increased the number of solar panels installed. Incentives encourage individuals to install solar panels on their roofs to provide clean renewable energy for households and to generate additional income [26].
Costa, Ng, and Su [30] showed that if there are no incentives to stimulate consumers, few solar systems are installed. Barnes, Krishen, and Chan [31] showed that residents who had already installed solar panels in their communities had a positive impact on those who did not, and the use of solar panels increased. However, the adoption of solar panels is influenced by factors such as roof size, climate and equipment costs, so in promoting green roof programs, it is necessary to account for the needs and resources of different households and to develop suitable solar panel installation plans in order to establish effective rules for renewable energy use decisions.
Energy consumers are an essential part of the energy system and are the target audience for governments promoting renewable energy policies. As renewable energy production and markets expand globally, consumers have become involved in small-scale energy production, with policymakers playing a critical role [32]. In the past, consumers were passive buyers of energy and used traditional sources to meet their needs, but increasing numbers of consumers are becoming small energy producers by installing solar systems and actively participating in energy production [25]. This transition allows consumers to use renewable energy more effectively and reduces their dependence on traditional sources, which contributes to the goal of energy transformation.
Increasing energy demands from households have led to a continuous increase in energy consumption, which has increased environmental damage. To achieve sustainable development goals, interventions and guidance are required at multiple levels. The decision environment to increase participation in energy-saving programs is changed by macro- and micro-interventions, such as cash incentives and legal or energy-saving factors [33,34]. The Taiwan Power Company offers cash incentives to households to encourage participation in energy-saving plans with fixed electricity prices.
It is also possible to change individual behavior. Solar panels on household roofs conserve energy and reduce carbon dioxide emissions, and previous studies determined the factors that affect household energy consumption. Rausch and Kopplin [35] studied the effect of environmental awareness, values, beliefs and perceived knowledge on the willingness of consumers to purchase sustainable products. Namazkhan et al. [33] determined the effect of factors such as building characteristics, social demographics and psychological factors on natural gas consumption from the perspective of household natural gas consumption using a decision tree. This method offers a more comprehensive analysis and better guides policy development and energy management.
Studies show that environmental, economic, technological and policy factors have a significant effect on household energy consumption [34,36]. Voluntary behavior can be changed through behavioral intervention measures and individual factors, such as perception, preferences and abilities. Sustainable development goals can only be achieved by promoting energy conservation and establishing policies at various levels to meet the energy needs of households.
Few studies have determined the evolution of rules through comparative correlations, or the effect of rule changes on renewable energy incentives. In terms of the renewable energy industry as a future development trend, the effect of rule evolution on energy incentive issues and trends in the willingness of households to accept renewable energy incentives is important. Target households, as users and producers, are playing an increasingly important role in government policy. The goal is to provide valuable information to decision makers to allow the formulation of more effective policies. This study makes a substantive contribution to the formulation and implementation of renewable energy incentive policies.
3. Methodology and Conceptual Framework
3.1. Conceptual Framework
This study determines the factors that affect households in terms of installing solar panels on rooftops and determines the public’s needs and expectations for solar panel systems. Using rough set theory, rules are induced for each object through attribute reduction, and these rules are saved in a rule set. Rule induction is used to generate a rule set, and then object classification and prediction are performed.
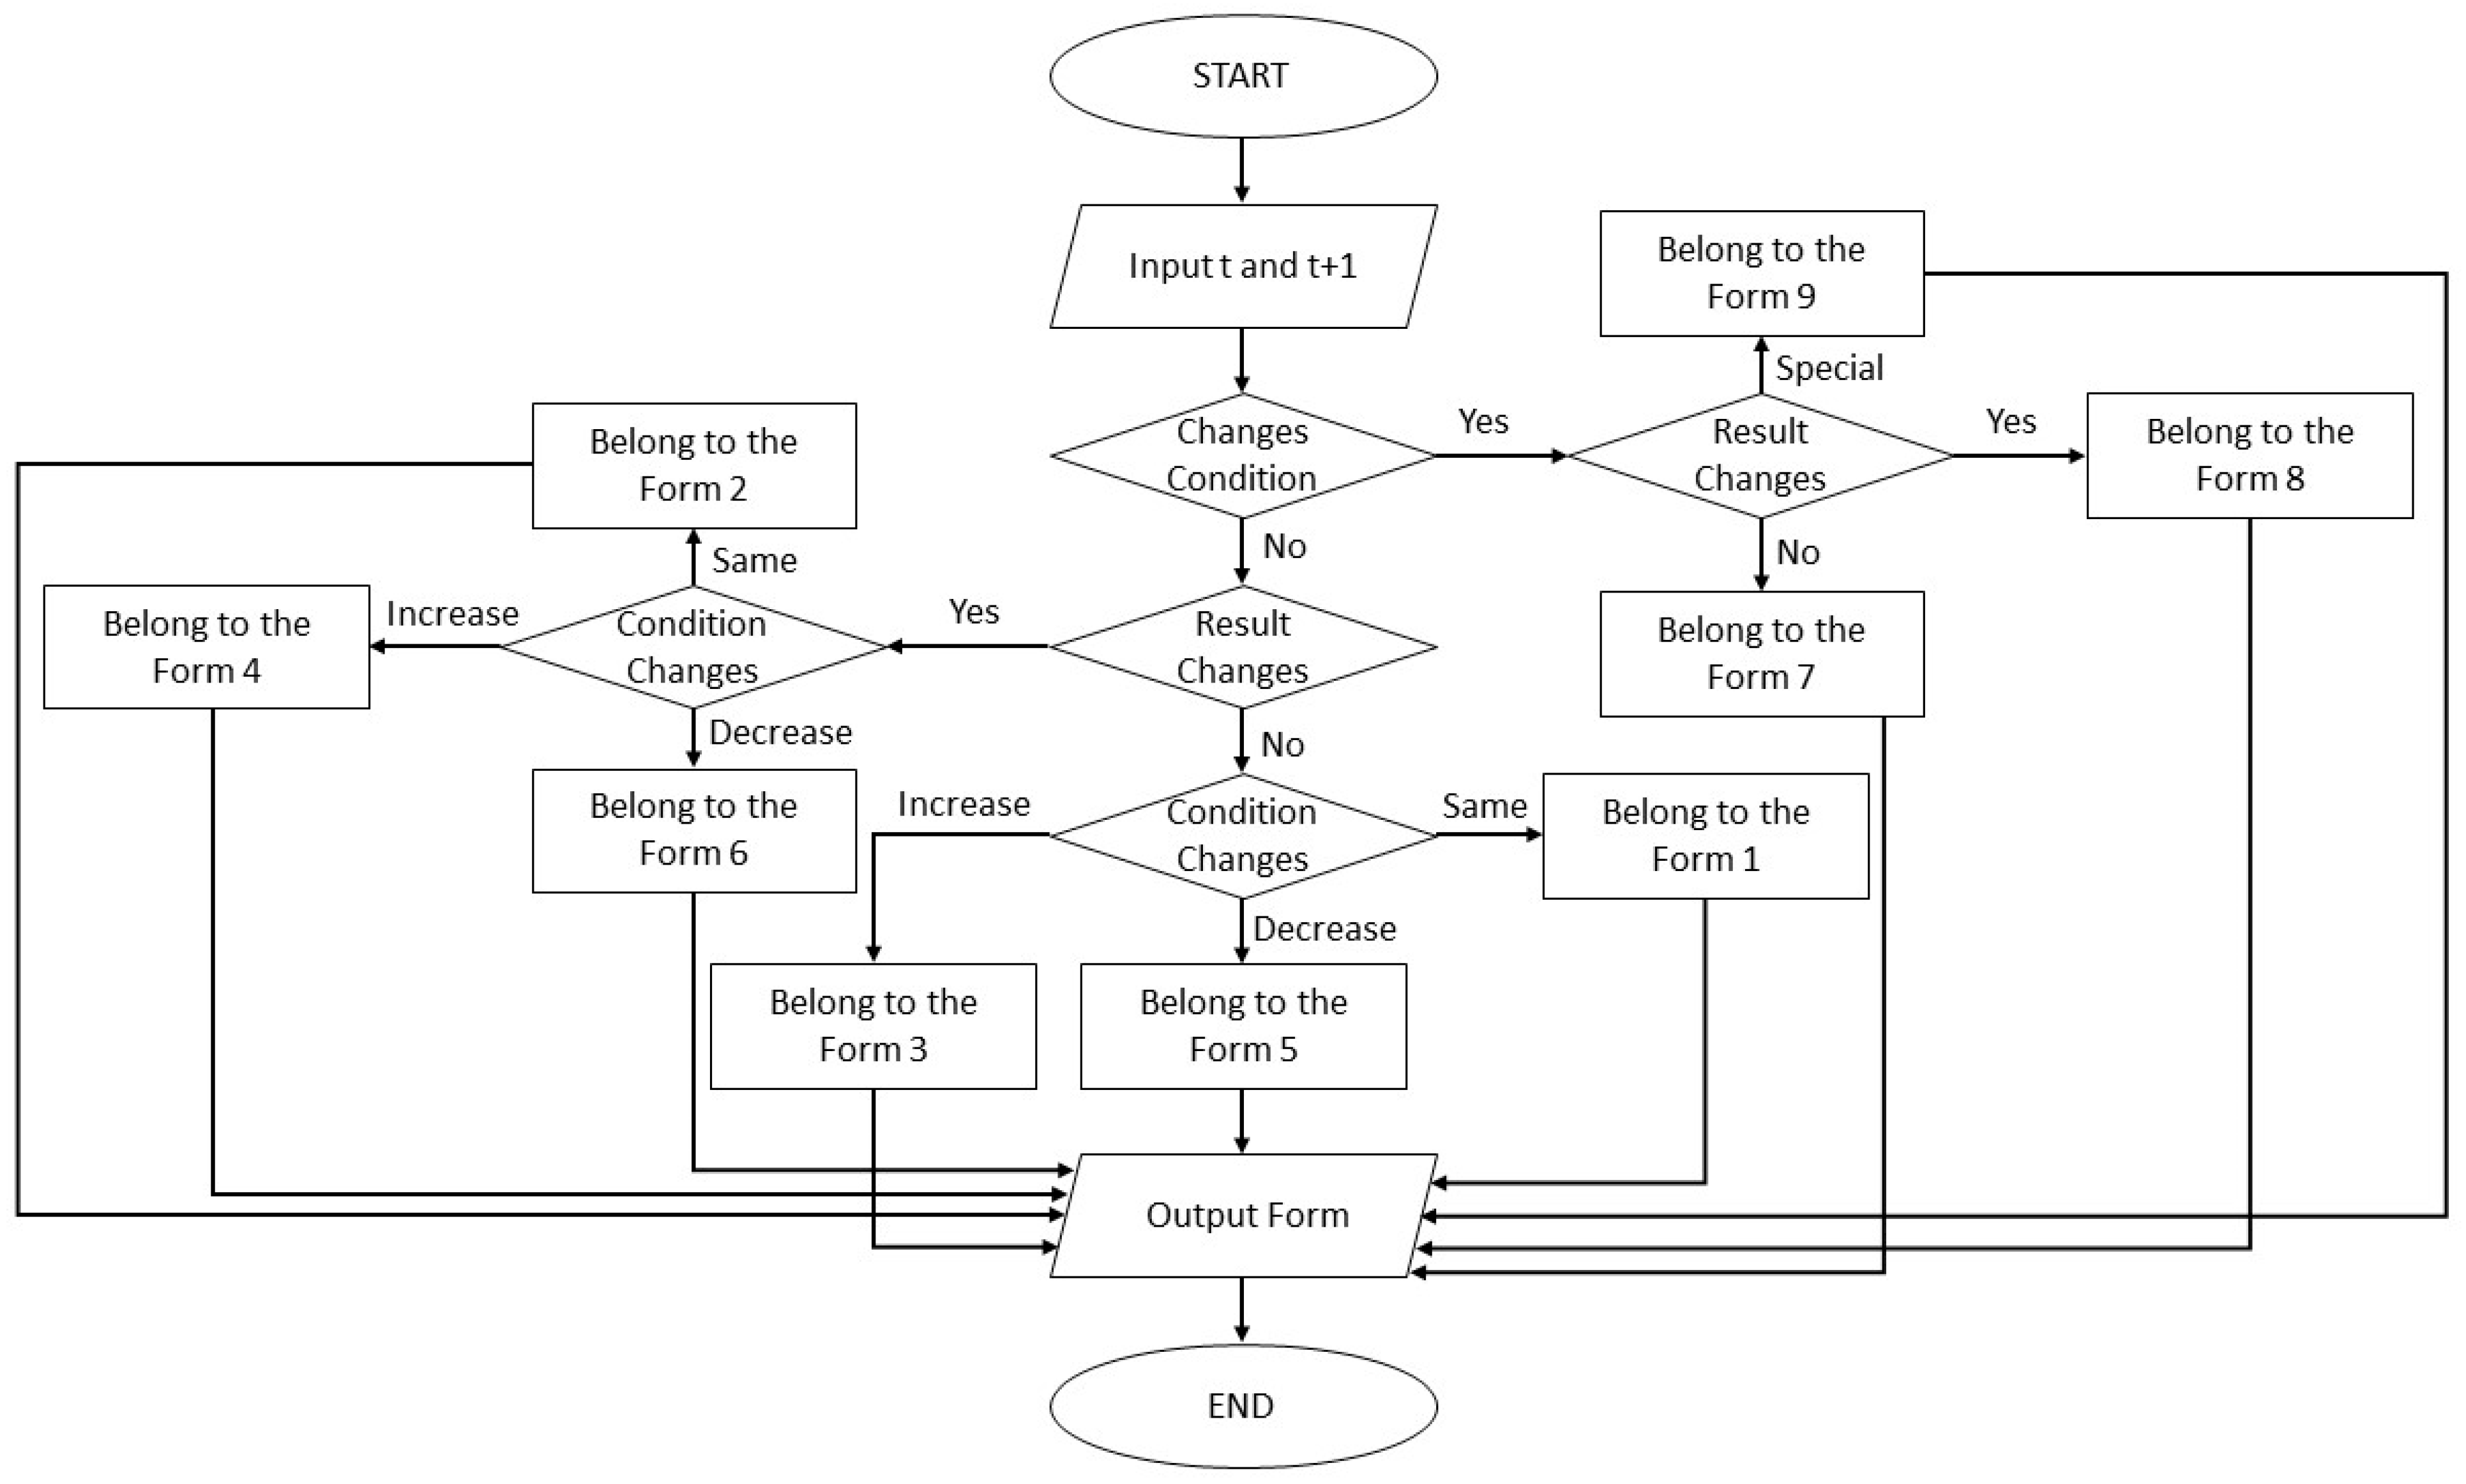
The recognition process for each type of rule set involves inputting two different rule sets for time t and t + 1. The process then evolves into nine output forms, based on changes in a condition attribute addition, deletion or modification or changes in result attributes. For each rule set, if there are changes in the condition attribute values, the rule set is of the seventh, eighth or ninth type. The remainder are assigned to the first through sixth types.
The evaluation process depends on whether the result attribute changes. In terms of the seventh, eighth and ninth types, if a condition attribute does not change, the rule set is assigned to the seventh type; if the result changes, the rule set is assigned to the eighth type; and if the result changes significantly, the rule set is assigned to the ninth type. If there are changes in the result attribute, the rule set is assigned to the second, fourth or sixth type.
The rule set is then classified based on the direction of changes in the condition attribute. If there is no change, it is assigned to the second type; if there is an increase, it is assigned to the fourth type; and if there is a decrease, it is assigned to the sixth type. If there are no changes in the result attribute, the rule set is of the first, third or fifth type. This is further classified based on the direction of changes in the condition attribute. If there is no change, it is assigned to the first type; if there is an increase, it is assigned to the third type; and if there is a decrease, it is assigned to the fifth type. The process is shown in Figure 2.

Figure 2.
Flowchart for the pattern recognition process.
The classification rules are expressed in terms of pseudocode judgments, whose algorithm is expressed as follows: Algorithm 1.
| Algorithm 1. |
| 1. Input t and t + 1 2. if condition changed 3. if result changed 4. if result change is significant 5. output “form 9” 6. else 7. output “form 8” 8. else 9. output “form 7” 10. else 11. if result changed 12. if condition increased 13. output “form 4” 14. elif condition decreased 15. output “form 6” 16. else 17. output “form 2” 18. else 19. if condition increased 20. output “form 3” 21. elif condition decreased 22. output “form 5” 23. else 24. output “form 1” 25. end |
This study uses RS decision categorization to create a summary. In terms of the differences in installation figures before and after the COVID-19 pandemic, changes in household energy use are determined to collect data on public willingness and the factors that affect the installation of solar panels. This allows decision-making recommendations to be derived that promote green energy plans for nationwide participation. Taiwan’s “Green Energy Roofs Project” is used as a case study.
3.2. Methodology
Rough set decision classification rules are used to compare intervals that feature different conditions for various periods and to determine the relationship between two rule sets and . Three different types of conditions, including addition, deletion and modification, are considered, and these are categorized into nine different forms, based on whether the outcome attribute changes (see Table 1). Attributes are either condition attributes or decision attributes, and all object information is classified into subsets according to the feature selection. The approximate relationship between the subset of condition attributes and the decision attributes is then determined, and decision rules are generated.

Table 1.
Classification of rule set forms.
Notations:
- t: time interval.
- rij: rule set.
- A: condition attribute.
- O: result (decision attribute).
- v: variable of condition attribute.
- w: variable of result attribute.
- i: rule index, .
- j: rule index, .
- n: number of condition attributes
- m: number of result attributes.
The nine forms of condition changes are described in the following.
Form 1: Maintaining Equality
For rule sets and , the condition and result attributes are consistent.
If , i.e., , where , , then and pertain to maintaining equality.
Form 2: Result Change
Two rule sets have the same condition attributes in and , but the results are different.
If , i.e., , where , , then and pertain to a change in the result.
Form 3: Condition Attribute Addition (Increased Restriction)
Two rule sets are different in terms of one condition attribute for and , where t + 1 has an additional attribute, but the results are the same.
If , i.e., , where , , then and pertain to an additional condition attribute.
This represents the addition of an attribute between time t and t + 1 that produces no change in the results.
Form 4: Increase in Condition Attributes and Change in Results
There is a difference in the condition attributes for rule sets in and , where t + 1 is later than t, and the results are different.
If , i.e., , where , , then and pertain to this form.
There is a change in the results when a condition attribute is added between times t and t + 1.
Form 5: Reduction in Condition Attributes (Reduced Condition)
There is a difference in the condition attributes for rule sets and , where t + 1 is less than t, but the results are the same.
If , i.e., , , , then and
A condition attribute is removed between time t and t + 1, and there is no change in the results.
Form 6: Reduction in Condition Attributes and Change in Results (Reduced Condition and Change in Results)
There is a difference in the condition attributes for rule sets and , where t + 1 is less than t, and the results are different.
If , i.e., , where , , then and belong to this form.
The result changes because the target audience has one condition attribute removed at t + 1.
Form 7: Change in Condition Attribute Values (Adjusted Condition)
The majority of the condition attributes in the two rule sets are the same, but there is a change in the value of one condition attribute between and .
If , i.e., , where , , then and pertain to a change in the condition attribute values, where k means the condition of adjustment.
There is a change in the condition attribute values from time t to t + 1, but the results remain the same.
Form 8: Change in Result Values (Adjusted Condition and Change in Results)
The majority of the condition attributes in the two rule sets are the same, but there is no change in the condition attribute values between and , and the result values change.
If , i.e., , where , , but , then and pertain to a change in the result value.
This is similar to Form 7, but the result value changes.
Form 9: Special Case
There are significant changes in both the condition attributes and the results between time t and t + 1.
If , i.e., , where , , but , then and pertain to this type.
In practical applications, it is difficult to perform analysis or support a decision because there are significant changes in the premise and in the conclusion.
These decision rules allow for a direct interpretation of the results and show contextual rules in the database. The effects of changes in the condition type and outcome attributes on decision rules are determined. The results of this study show the relationships between rule sets. Rough set theory is used to mine contextual rules in the database, in order to predict phenomena and behaviors.
3.3. Case Study
The global economy was significantly affected by the COVID-19 pandemic, which was the greatest economic shock since the Second World War, and governments around the world faced enormous challenges. Individuals who were forced to work and study from home due to social distancing measures spent almost 24 h a day at home, so there was a significant increase in household electricity consumption. Therefore, green and energy-efficient practices must be promoted to households, and policymakers must establish decision-making rules for household energy use. This study determines the changes in attitudes to rooftop solar panel installations before (PBe) and after (PAf) the COVID-19 pandemic to establish effective policies.
This study determines the willingness of households to accept incentives for renewable energy. This study uses the “Green Energy Roofs Project” of the Taiwanese government between 2019 and 2022 as a case study and focuses on the two different rule sets before and after the outbreak of the COVID-19 pandemic. Two decision rules are used to determine the changes in public willingness to accept feed-in tariffs for installing solar panels on rooftops before and after the COVID-19 pandemic. Rule analysis is used to categorize the influencing factors as either basic data factors, public background factors or energy incentive factors.
To encourage the public to install solar panels, the government implemented an energy incentive that includes an additional percentage (1 + %) on top of the feed-in tariff. The basic data factor is based on the area where the equipment is installed, such as the northern region, offshore islands or other remote areas, and can be changed through policies such as incentives or subsidies. The public background factors include family living conditions, building environmental data, household income and self-perceived value. These can be changed by interventions such as media advocacy, legal restrictions and social expectations. This study determines the characteristics and contours of households.
There is an additional bonus solar green billing rate (see Table 2) to the 15% bonus for installations in Taipei, New Taipei, Taoyuan, Hsinchu, Miaoli, Yilan and Hualien (northern region). Starting in 2020, participants in indigenous or remote areas received a 1% bonus. In terms of the capacity tier, there is a distinction between those who pay a grid connection fee (GF) and those who do not pay a grid connection fee (NGF). Those who participated in the Green Energy Roofs Project received a 3% bonus, with the initial 15% bonus remaining if no submarine cable is connected to the island (expressed as OT1), being reduced to 4% if one is connected to the island (expressed as OT2).
Table 2.
Feed-in tariff for solar photovoltaic power generation equipment.
Table 3 shows the types of variables that are used for the case study and whether they are subject to interference. Household income is defined as the net amount of comprehensive income after deducting any tax exemption and other relevant deductions. The maximum useful life of a building is defined as 50 years in the fixed asset depreciation table of the Ministry of Finance, but this study defines the age of a house as the number of years since completion. Common classification categories include new houses (completed less than 5 years ago), second-hand houses (completed between 6 and 20 years ago) and old houses (completed more than 20 years ago).
Table 3.
Definitions of variables.
The effect of the basic data factor on the target household in terms of the decision rule sheet is changed by changing the incentive method and the percentage bonus. The effect of the background factor on decision making is determined by changing the feature selection, and determining whether the outcome attribute changes. Three different condition types are proposed—add, delete, and modify—in order to allow more accurate decision making. The decision table for the various attributes is shown in Table 4.
Table 4.
Decision table for condition attributes.
This study changes a variety of interventions, such as cash incentives and legal and energy conservation factors, to change the decision-making environment. Taiwanese power companies offer cash incentives for household electricity consumption at a fixed tariff to encourage greater participation in the program. This study determines the relationship between the household sector, green energy and government regulatory interventions to develop recommendations for decisions on energy consumption and feed-in tariff rates that promote sustainable development and carbon reduction.
4. Results and Discussion
For Case 3.3, the results are as follows.
4.1. Result
Form 1: Maintenance
PBe: if A1 = 2, A2 = 0, B1 = 1, B2 = 0, B3 = 2, B4 = 0, B5 = 0 and B6 = 1, then O1 = 2 and O2 = 1.
PAf: if A1 = 2, A2 = 0, B1 = 1, B2 = 0, B3 = 2, B4 = 0, B5 = 0 and B6 = 1, then O1 = 2 and O2 = 1.
The COVID-19 outbreak has changed the global political and economic environment, and there are new challenges to green energy development and policy making for sustainable energy. In the post-pandemic period, government policymakers must determine how to continue to promote existing green energy programs and initiatives in a new environment. The government must work closely with the public to ensure that targeted households continue to support these programs.
The government must also conduct regular, rolling tracking and evaluation to ensure the sustainability and effectiveness of policy implementation. The pandemic provides an opportunity for the government to strengthen its support for green energy development and to promote sustainable socio-economic development. Encouraging the installation of renewable energy facilities, such as solar panels on the roofs of homes, will reduce carbon emissions and reliance on traditional energy sources, which will help to achieve the goal of sustainable energy development.
Form 2: Result Change
PBe: if A1 = 2, A2 = 0, B1 = 0, B2 = 0, B3 = 2, B4 = 0, B5 = 0 and B6 = 1, then O1 = 1 and O2 = 1.
PAf: if A1 = 2, A2 = 0, B1 = 0, B2 = 0, B3 = 2, B4 = 0, B5 = 0 and B6 = 1, then O1 = 1 and O2 = 0.
To avoid the risk of cluster infections of COVID-19, governments encouraged people to restrict travel and to work or study at home. This change in lifestyle due to the pandemic has forced governments to reduce economic activity, so there has been a significant increase in the demand for electricity from the household sector [37], but electricity consumption by the commercial and industrial sectors has decreased.
The pandemic has changed lifestyles. Citizens work from home for extended periods and are more concerned about their home environment, energy consumption and increased household expenses. Therefore, target households no longer feel as incentivized and do not expect rewards or subsidies from government policies that are as high as those that were previously offered. The pandemic has changed the environment, but the government must ensure the continuity of existing plans and programs and sustain support for target households in terms of these initiatives. The government must conduct regular, rolling tracking and evaluation to ensure the continuity and effectiveness of policy implementation and outcomes. If there is no sense of urgency, target households will prioritize maintaining their existing standard of living over considering additional policy plans, so the government must develop policies to meet the various demands of target households by ensuring that policies are feasible and effective.
Form 3: Adding Restrictions
PBe: if A1 = 2, A2 = 0, B2 = 0, B3 = 2, B4 = 1 and B5 = 0, then O1 = 1 and O2 = 1.
PAf: if A1 = 2, A2 = 0, B1 = 2, B2 = 0, B3 = 2, B4 = 1 and B5 = 0, then O1 = 1 and O2 = 1.
In recent years, reducing the carbon footprint has become an important environmental policy goal for many governments. Wiedenhofer, Smetschka, Akenji, Jalas and Haberl [38] showed that household population is a crucial factor in reducing the carbon footprint since household appliances are shared in larger households, meaning the individual carbon footprint is reduced. Reducing the carbon footprint and increasing the supply of green electricity are important elements of a renewable energy policy.
During the COVID-19 pandemic, the government encouraged working from home, so there was an increase in daytime electricity consumption. Therefore, adding the restriction of “household population size” may not have a significant effect on the target households. Decision makers must reconsider the appropriateness and importance of the “household population size” attribute to ensure policy effectiveness. Target households underwent changes during the pandemic, and the government must re-evaluate existing policies to account for new lifestyles and environments.
Form 4: Adding Restrictions with Result Change
PBe: if A1 = 2, A2 = 0, B1 = 1, B2 = 0, B3 = 2 and B5 = 0, then O1 = 1 and O2 = 1.
PAf: if A1 = 2, A2 = 0, B1 = 1, B2 = 0, B3 = 2, B4 = 3 and B5 = 0, then O1 = 1 and O2 = 0.
Alrwashdeh [39] compared the energy output from two different heights of solar towers and showed that energy output is proportional to tower height. In the same year, the Energy Bureau of the Ministry of Economic Affairs proposed a solar photovoltaic strategy of “rooftops first, ground later”. The government aims to ensure a stable energy supply, improve energy storage efficiency for rooftop solar panels and enhance lighting conditions. During the COVID-19 pandemic, the “number of floors” was added as an incentive condition to encourage households to participate in the program. However, the addition of this attribute is directly related to the existing building, so some households are less willing to participate since they do not meet these conditions.
Policymakers must consider the relevance of the number of floors in target households. Attributes are a significant consideration for target households, so the green energy plan must be evaluated to determine whether it meets their needs. If the plan is unable to achieve the original objectives, it requires review and adjustment.
Form 5: Reduction in Conditionality
PBe: if A1 = 2, A2 = 0, B1 = 1, B2 = 0, B3 = 2, B4 = 0 and B5 = 0, then O1 = 1 and O2 = 1.
PAf: if A1 = 2, A2 = 0, B1 = 1, B2 = 0, B4 = 0 and B5 = 0, then O1 = 1 and O2 = 1.
Aksoezen et al. [1] found a correlation between building age and energy consumption. The report by the Bureau of Energy, MOEA, in 2019 showed that current solar energy projects require a contract of at least 20 years and evaluation by professional installers and public agencies to determine the suitability of solar equipment installation. Therefore, building age has little impact on the installation of solar equipment: the structure and safety of the house are more important. During the COVID-19 pandemic, the age of a house had a less significant impact on the power generation efficiency for rooftop solar panels, and the transitional period during the pandemic was shorter than the average age of houses. Therefore, deleting the “age of the house” attribute has no significant impact on the policy, so the policy has little effect on target households, and this is an unnecessary attribute.
Form 6: Reduction in Conditionality and Result Changes
PBe: if A1 = 2, A2 = 0, B1 = 1, B2 = 0, B3 = 4, B4 = 0 and B5 = 0, then O1 = 1 and O2 = 1.
PAf: if A1 = 2, B1 = 1, B2 = 0, B3 = 4, B4 = 0 and B5 = 0, then O1 = 1 and O2 = 0.
Residents in remote areas have a lower willingness than urban dwellers to participate in the Green Energy Roofs Project. They tend to lead a more natural lifestyle with less reliance on modern technology, so their electricity demand is lower. In terms of the economy, there are fewer job opportunities and lower salaries. However, during the COVID-19 pandemic, economic activities significantly decreased, so more difficulties were experienced in remote areas, where individuals are less willing to participate in such projects.
If the “remote area” attribute is deleted, there may be significant changes in the results since a lack of incentives may lead to a significant reduction in rural residents’ willingness to participate. This attribute has a significant impact on target households, and policymakers must account for this attribute. Remote areas have fewer high-rise buildings and longer sunshine hours, and they are well suited to the Green Energy Roofs Project. Therefore, it is necessary to listen more to the needs of residents in remote areas and to formulate appropriate policy adjustments.
Form 7: Adjustment Conditions
PBe: if A1 = 1, A2 = 0, B1 = 1, B2 = 0, B3 = 2, B4 = 0 and B5 = 0, then O1 = 3 and O2 = 1.
PAf: if A1 = 1, A2 = 0, B1 = 1, B2 = 0, B3 = 2, B4 = 0 and B5 = 2, then O1 = 3 and O2 = 1.
The concept of capacity may be unfamiliar to the public since the installation of capacity equipment must comply with the local electricity demand and building restrictions. The capacity for households is closely related to the rooftop space. The variability of capacity in households is much less significant than that for large buildings, and its impact on energy consumption is relatively small. Funkhouser et al. [29] showed that residential solar energy accounts for an increasing proportion of installed capacity, surpassing large-scale capacities in public utilities. Therefore, adjusting the attribute value for “nameplate capacity” may result in very similar before-and-after scenarios, with a smaller impact on the judgment of the target households.
Form 8: Adjustment Conditions and Result Changes
PBe: if A1 = 2, A2 = 0, B1 = 1, B2 = 0, B3 = 6, B4 = 0 and B5 = 1, then O1 = 1 and O2 = 0.
PAf: if A1 = 2, A2 = 0, B1 = 1, B2 = 1, B3 = 6, B4 = 0 and B5 = 1, then O1 = 1 and O2 = 1.
The income of households with solar panels installed is usually greater than that of those that do not have solar panels [40]. The government actively intervened in the housing market policy by adjusting the Central Bank’s Regulations on Financial Institutions’ Real Estate Mortgage Loan Business at the end of 2020 [41], with the intention of discouraging fewer investment buyers from purchasing homes. However, this did not affect the willingness of the investing public to buy houses, and the phenomenon of “you do your thing, I’ll do mine” appeared, possibly due to the excessive amount of capital in the market and the shortage of labor and materials due to the pandemic, so the economy became stagnant, and real estate remains a popular investment. The government also adjusted the tax base and rate for property holding tax in 2014, which directly reduced income and willingness to purchase homes. Two different examples of housing market policies show that the government’s policy adjustments have a direct impact on people’s income attributes and are of concern to them.
The COVID-19 pandemic had a significant impact on the global power sector and a direct effect on oil and natural gas prices [33]. In this environment, households have experienced a decrease in disposable income, so policymakers must increase the willingness of target households to participate by adjusting the “income” attribute value to provide more achievable subsidy conditions. Adjustment of the “income” attribute is crucial since it has a direct and significant impact on the outcome. Policymakers must determine whether the adjustment of this attribute aligns with the original planning goals.
Form 9: Special Circumstances
PBe: if A1 = 2, A2 = 0, B1 = 1, B2 = 0, B3 = 2, B4 = 0 and B5 = 0, then O1 = 1 and O2 = 1.
PAf: if A1 = 1, A2 = 0, B1 = 3, B2 = 0, B3 = 0, B4 = 3 and B5 = 3, then O1 = 0 and O2 = 0.
In special circumstances, analysis is challenging and prone to errors, so new decision rules must be formulated. Comparing rule sets within a short period of time from t to t + 1 is not feasible.
Table 5 summarizes the nine types of evolutionary implications of case studies using different time differences and RSs for decision rule analysis. The results show the changes in the evolutionary process.
Table 5.
Integration of evolutionary implications.
4.2. Case Study Summary
This study shows that the majority of the public support the Green Energy Roofs Project, particularly since the outbreak of the COVID-19 pandemic, which has led to a decrease in income. This program provides a passive income and serves as a channel for household revenue. However, some members of the public have concerns about the safety of the installation process and the ongoing maintenance that is required. It is important that the incentives for the Green Energy Roofs Project and knowledge related to solar panels are made more easily comprehensible to the public. The results of these studies allow the government to make decisions on the development of green energy programs to increase the installation of solar panels on household roofs.
However, due to the changing policies and the differences in the installation of solar energy equipment due to environmental conditions, the amount of electricity that is generated and the reduction in the service life, current rates may not be suitable for all users. This study shows that different rates or incentives are required to meet the needs of different households. This study recommends that the feed-in tariff be adjusted to meet the needs of different households, so as to avoid any burden on users, policy changes or cost issues that may prevent the long-term stability of renewable energy generation. There is a current shortage of resources, so the use of solar power reduces the dependence on traditional energy sources, and carbon emissions. Solar power is a widely used green energy source that is renewable and features low maintenance costs, so the government must formulate policies that feature more comprehensive considerations in order to implement green energy policies.
From a decision-making perspective, the RS rule set evolves over two different periods. During the pandemic, public concern about energy increased, so the government had an opportunity to increase the implementation of green energy policies. Before and after the COVID-19 outbreak, the factors that influence the decision to install solar panels may have changed. The negative impact of the pandemic on income and expenses may make economic cost more important. The pandemic may also have an impact on energy markets and policies, so policymakers must promote green energy and environmental conservation and adopt a more holistic attitude to issues related to energy policy. Policies must be flexible to mitigate the impact of the pandemic on household energy costs. Governments and businesses are reducing carbon emissions, achieving carbon neutrality and increasing the use of green energy.
5. Conclusions
This study compares two rule sets to determine the weighting and assessment criteria for each attribute in different temporal and spatial contexts. Past experience can provide strategies for decision making if there are variations between conditions and outcomes and can be applied to decision making in different industries. This approach selects different features and generates more favorable decisions. There is a global energy shortage, so in terms of energy saving and achieving the carbon reduction goals, solar panels are an ideal green energy source. This study determines the willingness of the public to participate in the Green Energy Roofs Project and the effectiveness of adjustment strategies developed by the government in its implementation.
Individuals assess their suitability to participate in the program based on their own conditions, such as renting unused roofs to install solar panels or joining the program under appropriate conditions. The government adjusts to the response from target families and achieves its policy goals through intervention and other means. Appropriate policy support must also be provided to the public in terms of systems and infrastructure. Governments are promoting rooftop solar projects to improve energy efficiency and reduce environmental impact. During the pandemic, increased working and studying from home increased household energy use.
This study determines the changes in willingness to install solar panels on roofs and the considerations before and after the outbreak. The results show that after the pandemic, people’s interest in green energy and energy reduction increased, which increased their willingness to install solar panels on roofs. Despite the positive attitude to installing solar panels on rooftops, the negative impact of the pandemic on income and expenses also had an impact on the financial cost of this decision. The government and industry must increase their efforts in terms of policy advocacy and marketing.
Rooftop solar power systems are simpler to implement than ground-based systems. They do not require a large area of land and people can easily participate in the program by providing their roofs. It is important to ensure that households have access to information and to streamline the application process. A level of awareness and confidence in solar panels will naturally lead to increased participation. The government and the industry must also continue to promote the implementation of sustainable energy policies through advocacy and effective funding to provide the public with information about the Green Energy Roofs Project incentives and information on solar panels.
This study determined the impact of rule evolution and feed-in tariff rates on households’ willingness to participate in energy incentive programs, using Taiwan’s Green Energy Roofs Project as a case study. The research scope was limited to the energy incentive for the household sector and excluded other sectors, such as energy development and industrial rooftop solar installations. Therefore, the generalizability of the research results was limited. The decision-making model for this study must also be improved by accounting for more decision factors to increase the accuracy and reliability of the decision that is made.
The proposed approach is based on the rough set theory. The limitation of classical rough sets requires large amounts of labeled data. Computation is time-consuming when dealing with large amounts of labeled datasets based on rough sets. In addition, when faced with real-valued continuous data, the rough set theory has difficulties in dealing with it, since it is more suitable for discrete data information systems [42].
To better achieve the goal of sustainable development, the following steps will be take: (1) a future study will expand the research scope to other sectors to determine different sectors’ views and willingness toward energy subsidies and incentives; (2) future research will determine the innovation and development trends of solar panel technology that further reduce the cost of solar panels, improve their competitiveness and increase the scope of application; (3) the research results will also be extended to other fields to improve the study’s usability and strengthen communication with other research areas; (4) a future study will propose more extensive and detailed levels to promote the application of renewable energy and achieve sustainable development; and (5) to improve computation efficiency, discretization methods and different types of neighborhoods such as containment neighborhoods may be considered in a future study to reduce the boundary region and improve the accuracy measure [12].
Author Contributions
Conceptualization, C.H. and C.-C.H.; Methodology, D.-N.C.; Software, D.-N.C.; Validation, C.H.; Formal analysis, C.H. and D.-N.C.; Investigation, C.H.; Resources, C.H.; Data curation, D.-N.C.; Writing—original draft, C.-C.H.; Writing—review & editing, Y.W.; Visualization, Y.W.; Supervision, C.-C.H. All authors have read and agreed to the published version of the manuscript.
Funding
This research was funded by the National Science Foundation—Ministry of Science and Technology of Taiwan, grant number MOST 110-2410-H-260 -016 -MY2, 110-2813-C-260-015-H, and NSTC 112-2410-H-260-010-MY3.
Data Availability Statement
Not applicable.
Conflicts of Interest
The authors declare no conflict of interest.
References
- Aksoezen, M.; Daniel, M.; Hassler, U.; Kohler, N. Building age as an indicator for energy consumption. Energy Build. 2015, 87, 74–86. [Google Scholar] [CrossRef]
- Satyadas, A.; Harigopal, U.; Cassaigne, N.P. Knowledge management tutorial: An editorial overview. IEEE Trans. Syst. Man Cybern. Part C-Appl. Rev. 2001, 31, 429–437. [Google Scholar] [CrossRef]
- Yen, C.E.; Huang, C.C.; Wen, D.W.; Wang, Y.P. Decision support to customer decrement detection at the early stage for theme parks. Decis. Support Syst. 2017, 102, 82–90. [Google Scholar] [CrossRef]
- Alzahrany, A.; Kabir, G.; Al Zohbi, G. Evaluation of the barriers to and drivers of the implementation of solar energy in Saudi Arabia. Int. J. Sustain. Dev. World Ecol. 2022, 29, 543–558. [Google Scholar] [CrossRef]
- Gung, R.R.; Huang, C.C.; Hung, W.I.; Fang, Y.J. The use of hybrid analytics to establish effective strategies for household energy conservation. Renew. Sustain. Energy Rev. 2020, 133, 10. [Google Scholar] [CrossRef]
- Sharma, S.; Dua, A.; Singh, M.; Kumar, N.; Prakash, S. Fuzzy rough set based energy management system for self-sustainable smart city. Renew. Sustain. Energy Rev. 2018, 82, 3633–3644. [Google Scholar] [CrossRef]
- Pawlak, Z. Rough sets. Int. J. Comput. Inf. Sci. 1982, 11, 341–356. [Google Scholar] [CrossRef]
- Yao, Y.; Greco, S.; Słowiński, R. Probabilistic rough sets. In Springer Handbook of Computational Intelligence; Springer: Berlin/Heidelberg, Germany, 2015; pp. 387–411. [Google Scholar] [CrossRef]
- Lashin, E.F.; Kozae, A.M.; Khadra, A.A.A.; Medhat, T. Rough set theory for topological spaces. Int. J. Approx. Reason. 2005, 40, 35–43. [Google Scholar] [CrossRef]
- Azzam, A.; Al-shami, T.M. Five Generalized Rough Approximation Spaces Produced by Maximal Rough Neighborhoods. Symmetry 2023, 15, 751. [Google Scholar] [CrossRef]
- Al-shami, T.M. An improvement of rough sets’ accuracy measure using containment neighborhoods with a medical application. Inf. Sci. 2021, 569, 110–124. [Google Scholar] [CrossRef]
- Al-shami, T.M.; Mhemdi, A. Approximation spaces inspired by subset rough neighborhoods with applications. Demonstr. Math. 2023, 56, 24. [Google Scholar] [CrossRef]
- Al-shami, T.M.; Alshammari, I. Rough sets models inspired by supra-topology structures. Artif. Intell. Rev. 2023, 56, 6855–6883. [Google Scholar] [CrossRef] [PubMed]
- Swiniarski, R.W.; Skowron, A. Rough set methods in feature selection and recognition. Pattern Recognit. Lett. 2003, 24, 833–849. [Google Scholar] [CrossRef]
- Pawlak, Z. Rough Sets: Theoretical Aspects of Reasoning about Data; Springer Science & Business Media: Berlin/Heidelberg, Germany, 1991; Volume 9. [Google Scholar]
- Zhang, X.; Yao, Y. Tri-level attribute reduction in rough set theory. Expert Syst. Appl. 2022, 190, 116187. [Google Scholar] [CrossRef]
- Zhang, X.; Miao, D. Three-layer granular structures and three-way informational measures of a decision table. Inf. Sci. 2017, 412, 67–86. [Google Scholar] [CrossRef]
- Murray, L.W. Agile manufacturing: Forging new frontiers—Kidd, PT. J. Prod. Innov. Manag. 1996, 13, 181–182. [Google Scholar] [CrossRef]
- Tseng, T.L.; Huang, C.C. Sustainable service and energy provision based on agile rule induction. Int. J. Prod. Econ. 2016, 181, 273–288. [Google Scholar] [CrossRef]
- Wang, J.Q.; Zhang, X.H. A Novel Multi-Criteria Decision-Making Method Based on Rough Sets and Fuzzy Measures. Axioms 2022, 11, 15. [Google Scholar] [CrossRef]
- Ayub, S.; Shabir, M.; Riaz, M.; Karaaslan, F.; Marinkovic, D.; Vranjes, D. Linear Diophantine Fuzzy Rough Sets on Paired Universes with Multi Stage Decision Analysis. Axioms 2022, 11, 18. [Google Scholar] [CrossRef]
- Jia, Q.S.; Ho, Y.C.; Zhao, Q.C. Comparison of selection rules for ordinal optimization. Math. Comput. Model. 2006, 43, 1150–1171. [Google Scholar] [CrossRef]
- Li, R.; Xu, M.; Chen, Z.; Gao, B.; Cai, J.; Shen, F.; He, X.; Zhuang, Y.; Chen, D. Phenology-based classification of crop species and rotation types using fused MODIS and Landsat data: The comparison of a random-forest-based model and a decision-rule-based model. Soil Tillage Res. 2021, 206, 12. [Google Scholar] [CrossRef]
- Lim, G.G.; Kang, J.Y.; Lee, J.K.; Lee, D.C. Rule-based personalized comparison shopping including delivery cost. Electron. Commer. Res. Appl. 2011, 10, 637–649. [Google Scholar] [CrossRef]
- Jafari, M.; Malekjamshidi, Z. Optimal energy management of a residential-based hybrid renewable energy system using rule-based real-time control and 2D dynamic programming optimization method. Renew. Energy 2020, 146, 254–266. [Google Scholar] [CrossRef]
- Crago, C.L.; Grazier, E.; Breger, D. Income and racial disparities in financial returns from solar PV deployment. Energy Econ. 2023, 117, 12. [Google Scholar] [CrossRef]
- Lau, L.S.; Senadjki, A.; Ching, S.L.; Choong, C.K.; Seow, A.; Choong, Y.O.; Wei, C.Y. Solar photovoltaic as a means to sustainable energy consumption in Malaysia: The role of knowledge and price value. Energy Sources Part B-Econ. Plan. Policy 2021, 16, 303–323. [Google Scholar] [CrossRef]
- Li, Y.H.; Wang, S.Y.; Dai, W.; Wu, L.S. Prediction of the Share of Solar Power in China Based on FGM (1,1) Model. Axioms 2022, 11, 10. [Google Scholar] [CrossRef]
- Funkhouser, E.; Blackburn, G.; Magee, C.; Rai, V. Business model innovations for deploying distributed generation: The emerging landscape of community solar in the U.S. Energy Res. Soc. Sci. 2015, 10, 90–101. [Google Scholar] [CrossRef]
- Costa, A.; Ng, T.S.; Su, B. Long-term solar PV planning: An economic-driven robust optimization approach. Appl. Energy 2023, 335, 16. [Google Scholar] [CrossRef]
- Barnes, J.L.; Krishen, A.S.; Chan, A. Passive and active peer effects in the spatial diffusion of residential solar panels: A case study of the Las Vegas Valley. J. Clean. Prod. 2022, 363, 11. [Google Scholar] [CrossRef]
- Varho, V.; Rikkonen, P.; Rasi, S. Futures of distributed small-scale renewable energy in Finland—A Delphi study of the opportunities and obstacles up to 2025. Technol. Forecast. Soc. Chang. 2016, 104, 30–37. [Google Scholar] [CrossRef]
- Namazkhan, M.; Albers, C.; Steg, L. A decision tree method for explaining household gas consumption: The role of building characteristics, socio-demographic variables, psychological factors and household behaviour. Renew. Sustain. Energy Rev. 2020, 119, 11. [Google Scholar] [CrossRef]
- Vlek, C.; Skolnik, M.; Gatersleben, B. Sustainable development and quality of life: Expected effects of prospective changes in economic and environmental conditions. Z. Fur Exp. Psychol. 1998, 45, 319–333. [Google Scholar]
- Rausch, T.M.; Kopplin, C.S. Bridge the gap: Consumers’ purchase intention and behavior regarding sustainable clothing. J. Clean. Prod. 2021, 278, 15. [Google Scholar] [CrossRef]
- Gatersleben, B.; Vlek, C. Household consumption, quality of life, and environmental impacts: A psychological perspective and empirical study. In Green Households; Routledge: London, UK, 2014; pp. 141–183. [Google Scholar]
- Liu, S.-J. COVID-19 Impact Analysis and Recommendations for the Power Industry. 2020. Available online: https://km.twenergy.org.tw/Knowledge/knowledge_more?id=8407 (accessed on 1 October 2020).
- Wiedenhofer, D.; Smetschka, B.; Akenji, L.; Jalas, M.; Haberl, H. Household time use, carbon footprints, and urban form: A review of the potential contributions of everyday living to the 1.5 degrees C climate target. Curr. Opin. Environ. Sustain. 2018, 30, 7–17. [Google Scholar] [CrossRef]
- Alrwashdeh, S.S. The effect of solar tower height on its energy output at Ma’an-Jordan. AIMS Energy 2018, 6, 959–966. [Google Scholar] [CrossRef]
- Rai, V.; McAndrews, K. Decision-making and behavior change in residential adopters of solar PV. In Proceedings of the World Renewable Energy Forum, Denver, CO, USA, 13–17 May 2012. [Google Scholar]
- Central Bank of the Republic of China (Taiwan). Press Release on the Resolution of the Joint Conference of the Central Bank Supervisors. 2021. Available online: https://www.cbc.gov.tw/tw/cp-302-141562-49221-1.html (accessed on 23 September 2020).
- Fan, Y.N.; Tseng, T.L.; Chern, C.C.; Huang, C.C. Rule induction based on an incremental rough set. Expert Syst. Appl. 2009, 36, 11439–11450. [Google Scholar] [CrossRef]

Disclaimer/Publisher’s Note: The statements, opinions and data contained in all publications are solely those of the individual author(s) and contributor(s) and not of MDPI and/or the editor(s). MDPI and/or the editor(s) disclaim responsibility for any injury to people or property resulting from any ideas, methods, instructions or products referred to in the content. |
© 2023 by the authors. Licensee MDPI, Basel, Switzerland. This article is an open access article distributed under the terms and conditions of the Creative Commons Attribution (CC BY) license (https://creativecommons.org/licenses/by/4.0/).