Abstract
A variety of process capability indices are applied to the quantitative measurement of the potential and performance of processes in manufacturing. As it is easy to understand the formulae of these indices, this method is easy to apply. Furthermore, a process capability index is frequently utilized by a manufacturer to gauge the quality of a process. This index can be utilized by not only an internal process engineer to assess the quality of the process but also as a communication tool for an external sales department. When the manufacturing process deviates from the target value T, the process capability index CPMK can be quickly detected, which is conducive to the promotion of smart manufacturing. Therefore, this study applied the index CPMK as an evaluation tool for process quality. As noted by some studies, process capability indices have unknown parameters and therefore must be estimated from sample data. Additionally, numerous studies have addressed that it is essential for companies to establish a rapid response mechanism, as they wish to make decisions quickly when using a small sample size. Considering the small sample size, this study proposed a 100 (1 − α)% confidence interval for the process capability index CPMK based on suggestions from previous studies. Subsequently, this study built a fuzzy testing model on the 100 (1 − α)% confidence interval for the process capability index CPMK. This fuzzy testing model can help enterprises make decisions rapidly with a small sample size, meeting their expectation of having a rapid response mechanism.
Keywords:
process capability indices; unknown parameters; confidence interval; fuzzy testing model; mathematical programming method MSC:
62C05; 62C86
1. Introduction
A number of process capability indices are unitless, measuring items produced in processes to determine whether they can achieve the quality level required by the product designer [1,2,3]. Indeed, process capability indices are common tools utilized by companies to gauge process quality. They can be offered to internal process engineers to assess process quality as well as viewed as communication tools for sales departments in external companies [4,5,6,7]. The two most widely used capability indices, and , as Kane [8] suggested, are displayed below:
and
In the above equations, USL denotes the Upper Specification Limit, LSL denotes the Lower Specification Limit, μ refers to the process mean, σ refers to the process standard deviation, and M = (LSL + USL)/2 refers to the midpoint of the specification interval (LSL, USL). Boyles [9] noted that indices and are based on yields and independent of the target T. Accordingly, they may fail to explain process centering, which refers to the capability of gathering data around the target. To tackle this problem, Chan, Cheng, and Spiring [10] came up with the Taguchi capability index , as presented below:
where T represents the target value. refers to the expected loss function of Taguchi. Considering the Taguchi capability index , Pearn, Kotz, and Johnson [11] took the following example with T = {3(USL) + (LSL)}/4 and σ = d/3. Process A, with μA = T − d/2 = m, and process B, with μB = T + d/2 = USL, both yielded the same result − = 0.555. Nonetheless, the expected non-conforming proportions were approximately 0.27% and 50%, respectively. We can tell, in this case, that the Taguchi capability index measures process capability inconsistently. To overcome the problem, the process capability index proposed by Choi and Owen [12] is employed to handle the processes with asymmetric tolerances. For symmetrical tolerances, the index is expressed as follows:
As noted by Vännman [13], the rankings of indices , , , and are in the following order: (1) , (2) , (3) , and (4) , based on their sensitivity to the departure of the process mean μ from the target value T. These four process capability indices are favorable for processes with quality characteristics of the nominal-the-better (NTB) type. Among them, integrates the numerator of index with the denominator of index . The deviation can thus be detected quickly as the manufacturing process deviates from the target value T, which helps promote smart manufacturing. Therefore, this paper utilizes the process capability index as an evaluation tool for process quality. As noted by some studies, process capability indices have unknown parameters and therefore must be estimated from sample data [14]. In addition, as highlighted by many studies, companies typically seek a rapid response mechanism, enabling them to make decisions quickly while utilizing a small sample size [15,16]. If decisions, however, are made based on a small number of samples, there will be a risk of misjudgment due to sampling error. Given the case of small sample size, this paper follows some suggestions from previous studies and derives a 100 (1 − α)% confidence interval for the process capability index . Next, building upon the 100 (1 − α)% confidence interval for the process capability index , this paper develops a fuzzy testing model. This model, on the basis of the confidence interval, helps enterprises make quick decisions with a small sample size, fulfilling their need for a rapid response mechanism.
As noted by various studies, machine tools made in Taiwan won first place worldwide in terms of output value and sales volume. They are mainly sold to emerging markets in Southeast Asia and Eastern Europe. The central region of Taiwan is an industrial center for precision machinery and machine tools. It combines machine tool parts factories, aerospace, and medical industries, and connects parts processing and maintenance industries, forming a large cluster of machine tools and machinery industries [17,18]. Additionally, several studies have indicated that the high clustering effect of the machine tool industry in Taiwan has enabled central Taiwan to develop a robust industry chain for machine tools; therefore, Taiwan plays a vital role in the world machine tool industry [19]. In view of this, we demonstrate how to implement the proposed fuzzy evaluation model using an axis produced by a machining factory in the central region of Taiwan.
In this paper, we organize the remaining sections as follows. In the Section 2, we demonstrate how to derive the Maximum Likelihood Estimator (MLE) as well as 100 (1 − α)% confidence regions for the process mean and the process standard deviation, respectively. This study utilizes the process capability index as the object function and adopts the 100 (1 − α)% confidence regions for the process mean and regions for the process standard deviation as the feasible solution areas. Subsequently, we apply mathematical programming to find a 100 (1 − α)% confidence interval for the process capability index . In the Section 3, we develop a fuzzy testing model using the 100 (1 − α)% confidence interval of the process capability index to measure the process quality, so as to learn whether it reaches the required quality level. In this model, we first derive a triangular fuzzy number and then obtain its membership function. Next, based on fuzzy testing rules, we can determine whether the process quality satisfies the requirement, which can serve as a reference for other industries. As mentioned before, central Taiwan is an industrial center for machine tools. Therefore, in the Section 4, an axis manufactured by a machining factory in the central region of Taiwan is used as an empirical example to illustrate how to apply the proposed fuzzy testing model. In the Section 5, conclusions are presented.
2. Confidence Interval for Process Capability Index CPMK
A random variable, denoted with X, has a normal distribution with the mean (μ) and the standard deviation (σ). Let (X1, X2, …, Xn) be a random sample received from a normal process. Then the Maximum Likelihood Estimators (MLEs) of the process mean () and the process standard deviation (σ) are written in Equation (5) and Equation (6), respectively:
and
Furthermore, the estimator of the process capability index is denoted by
Let random variables be and . As normality is assumed, and are mutually independent, and so are random variables Z and K [20]. The random variable Z is denoted as Z ~ N(0,1), following a normal distribution, while the random variable K, denoted with , represents a chi-squared distribution including n − 1 degrees of freedom. Therefore, we have
and
where is the upper quintile of the standard normal distribution, is the lower quintile of , and is the lower quintile of . Thus, we can further obtain p(A) , where
where we have . In the random sample (X1, X2, …, Xn), the observed values are written as (x1, x2, …, xn). Let the observed values of and be and , expressed as follows:
and
Then the observed value for the estimator is denoted by
Furthermore, the 100 (1 − α)% confidence region of , denoted with , is written as follows:
where we have and . Chen [14] thinks that since the index is a function of , then the probability of belonging to is as high as 1 − α. Thus, in this paper, the process capability index was employed as an object function while the 1 − α confidence region of was used as a feasible solution area. Therefore, when , then we have . Accordingly, the upper confidence limit for the process capability index is defined in the model of mathematical programming as
For any process standard deviation, when σ is bigger than or equal to (), then we have . Therefore, the mathematical programming model of Equation (15) can be rewritten as below:
Similarly, for any process standard deviation, when σ is smaller than or equal to (), then we have . Therefore, the lower confidence limit for the process capability index in the mathematical programming model is displayed as follows:
Based on the above, this article proposes a process to explain how to use a mathematical programming method to solve the 100 (1 − α)% upper confidence limit and lower confidence limit of the index . Then, a confidence interval-based fuzzy testing method was developed using Chen’s method [14]. The development process of this fuzzy test is as follows:
Step 1: Expressing the index as a function of mean and standard deviation is as follows:
Step 2: Derive the 100 (1 − α)% confidence region of as shown in Equation (14).
Step 3: Taking as the objective function and as the feasible solution area, the maximum value and the minimum value are respectively obtained as shown in Equations (16) and (17).
Step 4: According to the confidence interval of index , the resemble triangular fuzzy number and its membership function are constructed as shown in Equation (38). Then, develop a confidence interval-based fuzzy test method.
Next, we derive the 100 (1 − α)% confidence interval for the process capability index based on Case 1, Case 2 , and Case 3 , respectively, as follows:
- Case 1:
In this case, we find and process capability index . According to Equations (16) and (17), the 100 (1 − α)% confidence interval for the process capability index is , where
- Case 2:
In this case, for any , we have . Based on Equation (17), the lower confidence limit for the process capability index is depicted below:
Similarly, for any , we have . Based on Equation (16), the upper confidence limit for the process capability index is shown as follows:
- Case 3:
In this case, for any , we have . Based on Equation (17), the lower confidence limit for the process capability index is displayed below:
Similarly, for any , we have . Based on Equation (16), the upper confidence limit of the process capability index can be depicted as follows:
Based on the above three cases, this paper builds a method for fuzzy testing upon the confidence interval for the process capability index .
3. Fuzzy Testing Model Based on Confidence Interval of Process Capability Index CPMK
As mentioned above, in pursuit of a rapid response mechanism, companies usually operate with a small sample size. Following several suggestions from previous studies, in this paper, we constructed a fuzzy testing method on the basis of the confidence interval for the process capability index , given a small sample size. Pearn and Chen [21] defined the levels required by the process capability indices in the following table.
To identify whether the process capability index is greater than or equal to C, the null hypothesis, denoted with H0, and the alternative hypothesis, denoted with H1, for fuzzy testing are stated below:
H0: C (indicating the process capability has achieved the desired level);
H1: C (indicating the process capability has not achieved the desired level).
Customers or process engineers can propose the required value C corresponding to the process capability index with reference to Table 1. Based on the statistical testing rules mentioned above and Chen’s method [14], this paper builds the fuzzy testing model upon the observed values for the estimator and the 100 (1 − α)% confidence interval of the process capability index . According to Chen and Lin [22], the α—cuts of the triangular fuzzy number can be written as follows:

Table 1.
The levels required by the process capability indices.
As mentioned earlier, this paper derived the 100 (1 − α)% confidence interval for the process capability index from Case 1 , Case 2 , and Case 3 . According to these three cases, (α) and (α) can be depicted separately as follows.
- Case 1:
In this case, the process capability index is represented as
The observed values of the estimator is represented as
Based on the above equations, Equations (19) and (20), (α) and (α) are expressed as follows:
- Case 2:
The process capability index is represented as
The observed value of the estimator is represented as
Based on the above equations, Equations (21) and (22), (α), and (α) are expressed as follows:
- Case 3:
In this case, the process capability index is defined as:
The observed values of the estimator is defined as:
Based on the above equations, Equations (23) and (24), (α) and (α) are derived as follows:
and
Therefore, we have the resemble triangular fuzzy number, (KL, KM, KR), where KL (0.01), KM (1) (1) and KR (0.01). Its membership function is expressed as follows:
- (1)
- When the upper confidence limit of the process capability index exceeds or equals C ( C), do not reject H0 and conclude that C.
- (2)
- When the upper confidence limit of the process capability index is smaller than C ( C), reject H0 and conclude that C.
Then, this paper developed a fuzzy testing method, considering the confidence interval for the process capability index based on statistical testing rules. According to Equation (36), for the fuzzy number , its membership function h(x) is presented with the vertical line x C in Figure 1.
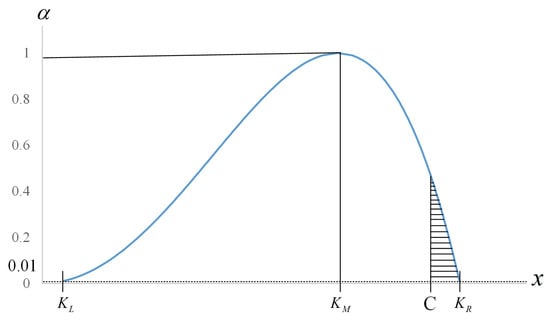
Figure 1.
Membership function h(x) with vertical line x = C.
Based on Chen and Lin [22], let AT denote the area in the diagram of membership function h(x), and let AR denote the area in the same graph but to the right of membership function h(x) from the vertical line x C, such that
and
According to Yu et al. [23] and based on Equations (39) and (40), we let dT KR − KL and dR KR − C. Then, we have dR/dT (KR − C)/(KR − KL). Also, we denote Case 1 as , Case 2 as , and Case 3 as . More detailed explanations are listed below:
- Case 1:
- Case 2:
- Case 3:
Based on Yu et al. [23], we let 0 0.5, then the fuzzy testing rules of the process capability index are shown as follows:
- (1)
- If dR/dT , then H0 is rejected, and we can conclude that C.
- (2)
- If dR/dT > , then H0 is not rejected, and we can conclude that C.
4. An Application Example
It is known that the central region of Taiwan is a machine tool center. Therefore, this section of this paper demonstrates how to apply the proposed fuzzy testing model through an empirical example involving the axis machined by a manufacturer in central Taiwan. The fuzzy testing model built on the confidence interval of the process capability index is an effective approach for deciding whether the process capability is acceptable or requires improvement. The target value T of the axis machined by the factory is 1.80 mm (T = 1.80), and the tolerance is 0.05 mm. Accordingly, the lower specification limit (LSL) is 1.75 mm (LSL = 1.75) and the upper specification limit (USL) is 1.85 mm (USL = 1.85). Thus, T = (USL + LSL)/2 and d = (USL − LSL)/2. According to customer requirements, the process engineer sets the required value for the process capability index as 1.00. Aiming to gauge whether the value of the process capability index exceeds or equals 1.00, the null hypothesis (H0) and the alternative hypothesis (H1) for fuzzy testing are listed as follows:
H0: 1.00 (showing that the process capability is sufficient);
H1: 1.00 (showing that the process capability is insufficient).
As mentioned earlier, in pursuit of a quick response mechanism, companies often opt for a small sample size. Let (x1, x2, …, x16) be the observed values for a random sample (X1, X2, …, X16). Then the observed values of and are and , respectively, as shown below:
and
Thus,
and
The target value T belongs to the interval (1.793, 1.834). Thus, the observed value of the estimator is calculated as follows:
Based on Equation (50), we obtain the following values of KR and KM:
and
Thus, the value of dR/dT is calculated as follows:
Based on Yu et al. [23], we let 0 0.5 and reviewed the fuzzy testing rules of the process capability index . We obtained the following result:
- (1)
- If dR/dT , then H0 is rejected, and we can conclude that C.
The process engineer, drawing from past professional experience, analyzed and set the value of to 0.2; that is, = 0.2. According to the above fuzzy testing rule, since dR/dT is less than 0.2, the null hypothesis H0 is rejected, and the conclusion 1.00 is drawn. In fact, the observed value of the estimator is 0.758 ( 0.758), the upper confidence limit of the process capability index is 1.120 ( 1.120) with If the result of the statistical inference shows that it indicates that the proposed fuzzy testing model in this paper demonstrates greater practicality compared to the conventional statistical testing model.
5. Conclusions
Various process capability indices are applied to the quantitative measurement of the potential and performance of a process in the manufacturing industry. Not only can an internal process engineer use them to assess process quality, but an external sales department can also utilize them as a communication tool. The process capability index can quickly detect process deviations from the target value, which is conducive to the promotion of smart manufacturing. Therefore, in this paper, we utilized the process capability index as a tool to evaluate process quality. Process capability indices, as noted by some studies, have unknown parameters and therefore must be estimated from sample data. In addition, as highlighted by many studies, companies typically pursue a rapid response mechanism, so they need to make decisions using a small sample size. Consequently, this study, based on some suggestions from previous studies for the case of small sample size, proposed the process capability index with a 100 (1 − α)% confidence interval. In the normal process condition where the sample mean and the sample variation are mutually independent, this study derived the 100 (1 − α)% confidence region of . Then, this study adopted the process capability index as an object function as well as the 100 (1 − α)% confidence region of as a feasible solution area, aiming to acquire the 100 (1 − α)% confidence interval of the process capability index . Immediately afterward, the 100 (1 − α)% confidence interval of the process capability index was utilized to establish a fuzzy testing model to evaluate process quality and see if it can achieve the required quality level. In this model, we first derived the triangular fuzzy number and then obtained its membership function h(x). According to the membership function h(x), this study established fuzzy testing rules. Through these rules, we can tell if the process quality attains the required level, which can serve as a reference for other industries. As mentioned earlier, central Taiwan is an industrial center for machine tools. Accordingly, this study illustrated the use of the proposed fuzzy testing model with an example of the axis machined by a factory located in the central region of Taiwan. It is evident from this example that the proposed fuzzy testing model can exhibit greater practicality compared to the conventional statistical testing model.
Author Contributions
Conceptualization, W.L. and K.-S.C.; methodology, W.L., K.-S.C. and C.-M.Y. (Chun-Min Yu); software, T.-H.H.; validation, T.-H.H. and C.-M.Y. (Chun-Ming Yang); formal analysis, W.L., K.-S.C. and C.-M.Y. (Chun-Min Yu); resources, W.L.; data curation, C.-M.Y. (Chun-Ming Yang); writing—original draft preparation, W.L., T.-H.H., K.-S.C., C.-M.Y. (Chun-Min Yu) and C.-M.Y. (Chun-Ming Yang); writing—review and editing, W.L., K.-S.C. and C.-M.Y. (Chun-Min Yu); visualization, C.-M.Y. (Chun-Min Yu); supervision, K.-S.C.; project administration, W.L.; funding acquisition, W.L. All authors have read and agreed to the published version of the manuscript.
Funding
This research was partially funded by the Guangxi Philosophy and Social Sciences Research Project under grant No. 23AGL001 and the National Natural Science Foundation of China under grant No. 72361002.
Data Availability Statement
The data that support the findings of this study are available from the corresponding author upon reasonable request.
Conflicts of Interest
The authors declare no conflicts of interest.
References
- Anderson, N.C.; Kovach, J.V. Reducing welding defects in turnaround projects: A lean six sigma case study. Qual. Eng. 2014, 26, 168–181. [Google Scholar] [CrossRef]
- Gijo, E.V.; Scaria, J. Process improvement through Six Sigma with Beta correction: A case study of manufacturing company. Int. J. Adv. Manuf. Technol. 2014, 71, 717–730. [Google Scholar] [CrossRef]
- Shafer, S.M.; Moeller, S.B. The effects of Six Sigma on corporate performance: An empirical investigation. J. Oper. Manag. 2012, 30, 521–532. [Google Scholar] [CrossRef]
- Liao, M.Y.; Pearn, W.L. Modified weighted standard deviation index for adequately interpreting a supplier’s lognormal process capability. Proc. Inst. Mech. Eng. Part B-J. Eng. Manuf. 2019, 233, 999–1008. [Google Scholar] [CrossRef]
- Li, W.; Liu, G. Dynamic failure mode analysis approach based on an improved Taguchi process capability index. Reliab. Eng. Syst. Saf. 2022, 218, 108152. [Google Scholar] [CrossRef]
- Shu, M.H.; Wang, T.C.; Hsu, B.M. Generalized quick-switch sampling systems indexed by Taguchi capability with record traceability. Comput. Ind. Eng. 2022, 172, 108577. [Google Scholar] [CrossRef]
- Sanchez-Marquez, R.; Jabaloyes Vivas, J. Building a cpk control chart—A novel and practical method for practitioners. Comput. Ind. Eng. 2021, 158, 107428. [Google Scholar] [CrossRef]
- Kane, V.E. Process capability indices. J. Qual. Technol. 1986, 18, 41–52. [Google Scholar] [CrossRef]
- Boyles, R.A. The Taguchi Capability Index. J. Qual. Technol. 1991, 23, 17–26. [Google Scholar] [CrossRef]
- Chan, L.K.; Cheng, S.W.; Spiring, F.A. A New Measure of Process Capability: Cpm. J. Qual. Technol. 1988, 20, 162–175. [Google Scholar] [CrossRef]
- Pearn, W.L.; Kotz, S.; Johnson, N.L. Distributional and Inferential Properties of Process Capability Indices. J. Qual. Technol. 1992, 24, 216–231. [Google Scholar] [CrossRef]
- Choi, B.C.; Owen, D.B. A study of a New Capability Index. Commun. Stat.-Theory Methods 1990, 19, 1231–1245. [Google Scholar] [CrossRef]
- Vännman, K. A unified approach to capability indices. Stat. Sin. 1995, 5, 805–820. [Google Scholar]
- Chen, K.S. Fuzzy testing decision-making model for intelligent manufacturing process with Taguchi capability index. J. Intell. Fuzzy Syst. 2020, 38, 2129–2139. [Google Scholar] [CrossRef]
- Wu, C.H.; Hsu, Y.C.; Pearn, W.L. An improved measure of quality loss for notching processes. Qual. Reliab. Eng. Int. 2021, 37, 108–122. [Google Scholar] [CrossRef]
- Arif, O.H.; Aslam, M.; Jun, C.H. Acceptance sampling plan for multiple manufacturing lines using EWMA process capability index. J. Adv. Mech. Des. Syst. Manuf. 2017, 11, JAMDSM0004. [Google Scholar] [CrossRef][Green Version]
- Chien, C.F.; Hong, T.Y.; Guo, H.Z. An empirical study for smart production for TFT-LCD to empower Industry 3.5. J. Chin. Inst. Eng. 2017, 40, 552–561. [Google Scholar] [CrossRef]
- Wu, M.F.; Chen, H.Y.; Chang, T.C.; Wu, C.F. Quality evaluation of internal cylindrical grinding process with multiple quality characteristics for gear products. Int. J. Prod. Res. 2019, 57, 6687–6701. [Google Scholar] [CrossRef]
- Lo, W.; Yang, C.M.; Lai, K.K.; Li, S.Y.; Chen, C.H. Developing a novel fuzzy evaluation model by one-sided specification capability indices. Mathematics 2021, 9, 1076. [Google Scholar] [CrossRef]
- Chen, K.S.; Yu, C.M.; Huang, M.L. Fuzzy selection model for quality-based IC packaging process outsourcers. IEEE Trans. Semicond. Manuf. 2022, 35, 102–109. [Google Scholar] [CrossRef]
- Pearn, W.L.; Chen, K.S. One-sided capability indices Cpu and Cpl: Decision making with sample information. Int. J. Qual. Reliab. Manag. 2002, 19, 221–245. [Google Scholar] [CrossRef]
- Chen, H.Y.; Lin, K.P. Fuzzy supplier selection model based on lifetime performance index. Expert Syst. Appl. 2022, 208, 118135. [Google Scholar] [CrossRef]
- Yu, C.M.; Lai, K.K.; Chen, K.S.; Chang, T.C. Process-quality evaluation for wire bonding with multiple gold wires. IEEE Access 2020, 8, 106075–106082. [Google Scholar] [CrossRef]

Disclaimer/Publisher’s Note: The statements, opinions and data contained in all publications are solely those of the individual author(s) and contributor(s) and not of MDPI and/or the editor(s). MDPI and/or the editor(s) disclaim responsibility for any injury to people or property resulting from any ideas, methods, instructions or products referred to in the content. |
© 2024 by the authors. Licensee MDPI, Basel, Switzerland. This article is an open access article distributed under the terms and conditions of the Creative Commons Attribution (CC BY) license (https://creativecommons.org/licenses/by/4.0/).