Abstract
Customers’ bounded rationality significantly influences the effectiveness of advertising and related decision-making in customer-intensive services. This paper, based on the M/M/1 queuing model and incorporating the characteristics of customers’ bounded rationality, conducts an optimization analysis of the decision-making of customer-intensive service providers. In this optimization process, we use the Gumbel distribution to model the random noise in customers’ bounded rationality, where the scale parameter characterizes the degree of bounded rationality, and customers’ choices follow a multinomial logit (MNL) choice model. We adopt the symmetric Nash equilibrium to prove the uniqueness of equilibrium in the duopoly market. Furthermore, we derive the optimal service rate and corresponding advertising expenditure levels for both monopoly and duopoly markets through optimization analysis. Our findings indicate that, regardless of market structure, an increase in the scale parameter of the Gumbel distribution, which captures customers’ bounded rationality, leads service providers to adopt a lower service rate to attract customers and reduce advertising expenditures. Notably, this strategy paradoxically results in higher profits for service providers. Additionally, we mathematically prove that, in both monopoly and duopoly markets, the proportion of customers choosing to enter the system follows a unimodal function of the service rate, and a unique and stable Nash equilibrium exists. Furthermore, we find that in the duopoly market, service providers, as a competitive strategy, set a lower service rate compared to the monopoly market. However, in the duopoly market, the proportion of customers attracted by each service provider is lower than in the monopoly market. We also confirmed the results through numerical simulation analysis.
Keywords:
customer-intensive services; bounded rationality; Gumbel distribution; M/M/1 queuing theory; game theory MSC:
90B15
1. Introduction
With the continuous development of the socio-economic landscape, the service industry has become increasingly vital within the economic system, with customer-intensive services standing out in particular. Customer-intensive services refer to service formats that require providers to invest substantial effort and patience, such as medical care, psychological counseling, and financial consulting.
In these services, the impact of service rate on customer utility perception differs from that in general services. Specifically, within a certain range, a slower service rate often leads to higher perceived utility for customers [1,2,3]. For example, psychological counseling and medical services are typical cases of such services. When doctors provide patient and meticulous care, they are often more effective in alleviating patients’ psychological or health concerns.
However, a slower service rate in queue inevitably extends customers’ waiting times within the service system, thereby increasing their waiting costs. In the medical field, excessive waiting times frequently exacerbate tensions between patients and healthcare providers. This conflict creates a dilemma for customer-intensive service providers when determining the optimal service rate [2,3]. Therefore, we incorporate relevant studies and adopt the M/M/1 queuing model, where the arrival rate of customers follows a Poisson distribution, and the service rate follows an exponential distribution [1,2,3].
When facing challenges in determining the optimal service rate, customer-intensive service providers often employ strategies such as value-added services, advertising campaigns, or waiting-time compensation to enhance overall consumer utility. Among these, effective advertising plays a crucial role in helping customers gain a comprehensive understanding of the service, strengthening their trust in the provider, and ultimately attracting more customers to the service system. For instance, many healthcare institutions engage in large-scale advertising campaigns to boost their brand awareness and enhance patient trust, thereby attracting more patients into their service network [4].
Although advertising can help mitigate the challenges customer-intensive service providers face in service rate decisions, its effectiveness warrants careful consideration. The effectiveness of advertising is closely linked to customers’ bounded rationality, as more rational customers are generally less influenced by advertisements. However, in reality, customers are not fully rational. The degree of bounded rationality significantly affects the impact of advertising, which in turn influences service providers’ decisions regarding service rates. To ensure that operational decisions align with real-world conditions, it is essential to account for customers’ bounded rationality [5]. Unlike traditional studies that assume customers are fully rational, bounded rationality can cause deviations in operational decisions from actual market demand. To measure this customer bounded rationality, we use the Gumbel distribution to model the random noise in customers’ bounded rationality, ensuring that customers’ choice of service providers follows the multinomial logit (MNL) choice model. This distribution allows us to characterize the degree of bounded rationality through its scale parameter, thereby helping us mathematically verify the impact of bounded rationality on optimal decision-making. The application of the Gumbel distribution effectively integrates parameter estimation with customer choice behavior [6,7].
Building on the analysis above, this paper primarily addresses the following questions: 1. How should customer-intensive service providers determine the optimal service rate and advertising intensity considering customers’ bounded rationality? 2. What impact does the degree of customers’ bounded rationality have on the optimal advertising and service rate decisions of customer-intensive service providers? 3. In a duopoly market, how should customer-intensive service providers formulate competitive strategies based on customers’ bounded rationality?
To address the above questions, this paper, based on customers’ bounded rationality, combines the M/M/1 queuing model to develop an operational decision-making model for customer-intensive service providers regarding service rate and advertising intensity. First, the study examines how, in a monopoly market, customer-intensive service providers can optimize service rate and advertising intensity based on customers’ bounded rationality characteristics, and analyzes the impact of the degree of bounded rationality on the optimal decisions. Specifically, we use the Gumbel distribution to model the random noise in customers’ bounded rationality, where the scale parameter describes the degree of bounded rationality. Subsequently, the model is extended to a duopoly market, where the paper explores the rationale behind customer-intensive service providers’ competitive strategy decisions under conditions of bounded rationality. This paper aims to provide theoretical support for customer-intensive service providers, helping them make more practical decisions regarding service rate and advertising intensity.
The main innovations and contributions of this paper are as follows:
- Incorporating customers’ bounded rationality into the decision-making framework for service rate and advertising intensity of customer-intensive service providers, thereby expanding research in the field of customer-intensive services and making service providers’ decisions more realistic;
- A comparative analysis of how the degree of bounded rationality affects decision-making in monopoly and duopoly markets, providing decision-making guidelines applicable to different market structures;
- The study finds that, regardless of the market structure, an increase in customers’ bounded rationality leads service providers to reduce both service rate and advertising intensity, which, when advertising costs are high, may actually increase service providers’ profits. Additionally, in a duopoly market, service providers set lower service rates and advertising levels compared to those in a monopoly market, which results in reduced profits.
2. Literature Review
This study is closely related to the fields of customer-intensive service with queueing model, advertising, and customers’ bounded rationality. Customer-intensive services typically require service providers to invest more effort and time, meaning that slower service rates can deliver higher perceived value to customers. Typical examples include healthcare services, financial consulting, and psychological counseling [2,3,8]. Anand et al. [3] pointed out that in these types of services, customers expect more personalized services, but this often results in longer waiting times in queue, which forces service providers to face trade-offs when determining service rates. Therefore, optimizing service rates while ensuring service quality has become a core issue in academic research. To address this dilemma, existing studies primarily analyze advertising, online reviews [9], and social interactions [10] from different perspectives, attempting to optimize service rates by influencing customer perceptions and behaviors. For example, Zhan et al. [2] explored how advertising affects the optimal service rate in different market sizes, while changes in market size may also encourage platforms to attract more customers and service providers through price adjustments [11]. Additionally, Fu et al. [12] examined how customers’ heterogeneous perceptions of advertising influence the optimal decisions of customer-intensive service providers, offering important insights for this study. From the perspective of social interaction, Li et al. [10] analyzed how customer interactions influence the optimal service rate and profits, and Jiang [13] further explored the impact of social interaction on the operations and equilibrium of customer-intensive services, complementing the research by Li et al. [10]. The service rate affects waiting time, and in queuing theory, waiting time can be modeled based on Markov chains [14]. Specifically, in batch arrival and batch service queuing systems, customers arrive following a Poisson process, while the service rate follows an exponential distribution. Under these conditions, the server capacity can be adjusted based on customer service requests [15]. The studies mentioned above on customer-intensive services all use the M/M/1 queue model for analysis, which provides theoretical support for our application of the M/M/1 model. By integrating these studies, queuing systems in service operations can be effectively analyzed. However, current research has not fully considered the role of customers’ bounded rationality in the advertising efforts of customer-intensive service providers. This paper addresses this gap by systematically analyzing how bounded rationality influences the advertising and operational decisions of customer-intensive service providers, thus offering new theoretical insights and practical guidance for this field.
With the evolution of modern commerce, the role of advertising in market competition has become increasingly critical. First, advertising can enhance the brand visibility of service providers and provide additional utility to consumers [2,16]. As an important communication bridge between businesses and consumers, advertising not only promotes the development of customer-centric sales models [17], but also helps consumers familiarize themselves with the characteristics of specific products and services before making a purchase decision, thereby improving the accuracy of their purchasing decisions [18]. Research shows that advertising typically has a positive effect on consumer purchasing decisions [19,20]. This is particularly crucial for the development of the service industry, and therefore, the role of advertising in this field warrants further exploration. Moreover, advertising has also been applied in customer-intensive services, such as beauty, healthcare, and other similar sectors [21,22,23]. Fu et al. [12] further point out that in customer-intensive service industries, there is heterogeneity in consumers’ perception of advertising effects, and advertising not only impacts the demand level but also influences service rates and provider profits. Therefore, it is essential to explore the role of advertising in the competition between service providers, which is one of the key reasons for extending our study from a monopoly market to a duopoly market. At the same time, the development of the internet has continuously transformed the way advertising is disseminated [17]. Tapanainen et al. [24] found that eWOM (electronic word-of-mouth) supported by social media has become an influential marketing tool, further extending the reach of advertising. Additionally, Lou [16] discovered that with the support of emerging digital technologies, the role of advertising is being redefined and argued that persuasive knowledge does not always have a negative impact on advertising effectiveness. Existing research has thoroughly revealed the crucial role of advertising in capturing consumer psychology and driving the development of the service industry. Building on this foundation, this paper further explores how customers’ bounded rationality in the context of customer-intensive services influences advertising effectiveness, and analyzes the optimal advertising strategies in monopoly and duopoly markets, thereby providing new theoretical contributions to the related literature.
The core focus of this study is the impact of bounded rationality in customer-intensive services. In such services, the M/M/1 queue system is widely used as a classical model, where customers arrive according to a Poisson process and the service rate follows an exponential distribution. However, since the emphasis of this study is on customer bounded rationality, we draw on the works of Zhang and Wang [1], as well as Li et al. [25], by incorporating the Gumbel distribution into the customer utility model to capture the characteristics of bounded rationality. Specifically, the scale parameter of the Gumbel distribution effectively reflects the intensity of bounded rationality, providing a solid theoretical foundation for model development. Furthermore, Zhang and Wang [26] explored the influence of bounded rationality on customer decisions from the perspectives of profit maximization and social welfare maximization. In the field of bounded rationality, Dai et al. [27], Muthaffar and Vilches-Montero [28], and Luo et al. [29] have further analyzed the effects of customer bounded rationality under different models and market conditions, particularly in scenarios where such bounded rationality may harm social welfare. Therefore, after applying the Gumbel distribution to model customer bounded rationality, this study extends the model to investigate the specific impact of bounded rationality on customer-intensive services, expanding the analysis to monopoly and duopoly market settings. To achieve a more comprehensive and in-depth analysis, Nash equilibrium and the game-theoretic structure of the duopoly market will be incorporated into our research framework. In summary, this study not only integrates the service provider’s advertising strategy but also delves into how the degree of customer bounded rationality affects the optimal decisions of service providers, thereby providing new theoretical support for the operational optimization of customer-intensive services.
3. Base Model Construction
3.1. Utility Analysis
Assume that customer-intensive service providers offer services to customers in the market and attract them through advertising. The basic service utility provided by such service providers is , the advertising intensity is , and the service rate is , where . In a service field with high industry standardization, the price level is influenced by the industry standard. Therefore, in this study, price is not treated as a decision variable. The decision variables are the advertising intensity and the service rate . We assume that customers have limited cognitive abilities when evaluating service quality and waiting times, and therefore are boundedly rational. Consider a representative customer who has three options: to balk (abandon the queue) or to choose to join server , where . We can simply represent the balking option as . To align with practical operations and ensure that the system does not experience idle capacity, we assume that the potential demand is much larger than the system’s service capacity limit, i.e., . This assumption reflects a scenario where the demand exceeds the system’s ability to serve customers, ensuring that the service capacity is fully utilized without idle time.
In the market, service providers operate with a single-server setup, where customers arrive at the service system following a Poisson process with an average arrival rate of . The service provider offers services at a rate , which follows an exponential distribution. As a result, the service system adheres to the conditions of an M/M/1 queueing system [2,3]. Consequently, the average waiting time for customers in the system is given by . The reason we apply the M/M/1 queuing model rather than the M/G/1 queuing model is primarily due to the differences in the assumptions about the service time distribution. While the M/G/1 queuing model has greater general applicability in terms of service time assumptions, the complexity of the waiting time in the system makes it less convenient to derive effective managerial insights when analyzing service provider decisions. This is why many studies in the literature on customer-intensive services opt for the M/M/1 model over the M/G/1 model [1,2,3,10,11,12,25,26]. The M/M/1 model is mathematically simpler and better reflects the underlying managerial significance of the mathematical derivations, making it more useful for understanding practical service provider decisions.
Assume that customers have an expected advertising intensity of , while the actual advertising intensity provided by the service provider is aa. Based on reference point theory, customers evaluate the actual advertising intensity relative to their expectation , leading to a perceived utility expressed as , where represents the customer’s sensitivity to the difference between actual and expected advertising intensity [2,30]. According to Anand et al. [3], customers perceive a baseline service rate and exhibit a sensitivity to variations in the service rate. Accordingly, the customer’s net utility, incorporating the effects of advertising, can be formulated as follows:
In the above equation, represents the waiting cost per unit time, while denotes the monetary cost that customers need to pay (i.e., the service price). The term indicates the proportion of customers who choose to enter the service system under the influence of bounded rationality. One key characteristic of customer-intensive services is that an increase in service rate within a certain range leads to a decrease in perceived utility . Therefore, Equation (1) aligns with the features of customer-intensive services and has been widely used by scholars to describe customer utility in such contexts . In this formulation, can be interpreted as the intrinsic value based on the service rate [2], where captures the customer’s perception of the baseline service rate. Additionally, the equation highlights the presence of dual reference points—one for service rate and another for advertising intensity. This aspect has not been explicitly addressed in prior research, making it one of the key innovations of our study.
3.2. Bounded Rationality Analysis
Furthermore, in contrast to traditional studies that assume customers are fully rational, we extend our analysis by considering the impact of customers’ bounded rationality on service rate and advertising levels. To capture bounded rationality, we introduce a random variable to represent the random noise in customers’ perceived utility when choosing service provider , where . Each customer has a perceived utility for the service provided by firm , denoted as , which can be expressed as , where represents the perceived utility of opting out of the system, given by . Thus, it is essential to analyze the distribution of the random variable . A representative customer makes a choice that maximizes their perceived utility among three options: (1) opting out, (2) joining server 1, or (3) joining server 2. The prior probability that a representative customer selects server over the other options (i.e., opting out or joining a different queue) is given by . For analytical tractability, following the study by Li et al. [25], we assume that the error term follows an independent and identically distributed (i.i.d.) double-exponential (Gumbel) distribution, with the cumulative distribution function given by , where is the scale parameter, which controls the dispersion of the distribution, and is the location parameter, which determines the central tendency of the distribution. By assuming the error term follows the Gumbel distribution, we can derive a multinomial logit (MNL) choice model, which is widely used in decision-making and discrete choice analysis.
Furthermore, we explain the reasons for applying the Gumbel distribution in this study, which can be summarized in two main points: First, the Gumbel distribution has excellent mathematical properties, including location and scale parameters, which effectively capture customer choice behavior within the system. In particular, the scale parameter is well-suited to measure the degree of bounded rationality of customers, which is the core focus of our research. Second, assuming that the error terms follow independent and identically distributed double-exponential (Gumbel) distributions helps improve the tractability of the model analysis, as we aim to provide service providers with intuitive and practical managerial insights.
According to Li et al. [25] and McKelvey & Palfrey [31], the probability that a representative customer selects service provider is given by the following formula:
The term in the above expression represents the standardized utility when the customer chooses not to enter the system. Given the advertising intensity and service rate of service provider 2, we designate service provider 1 as the benchmark provider.
Proposition 1.
Given that an increase in the advertising intensity of the benchmark service provider 1 leads to a higher proportion of customers choosing to enter its system, i.e., (All proofs are available in Appendix A).
Proposition 1 implies that increasing advertising levels enhances customer utility, thereby increasing the likelihood of customers joining the system. This result highlights the necessity of incorporating advertising in the model. For those customers who choose to exit the system, their probability of opting out can be expressed as follows:
The above represents a multinomial logit (MNL) choice model. By solving Equation (2), we can determine the equilibrium proportion , which corresponds to the logit equilibrium as defined by McKelvey and Palfrey [31]. It is important to note that the system stability condition is inherently ensured by customer choice behavior. This condition is also a fundamental requirement for classical queuing systems [32]. When approaches , customers experience infinitely negative utility, as their expected waiting time tends to infinity. According to Equation (2), the probability of choosing such a service provider approaches zero, ensuring that remains strictly below . Additionally, it must be ensured that , meaning that service providers’ advertising efforts in the market must be non-negative. This aligns with real-world operational scenarios, as firms do not engage in deliberate negative advertising strategies.
4. Decision-Making in a Monopoly Market
We first analyze the optimal decision-making of a service provider with monopolistic characteristics, particularly in cases where the provider enjoys exclusivity in certain regions. In such a scenario, the service provider must determine its optimal strategy while accounting for customers’ bounded rationality [2]. In the MNL model described in Equation (2), the parameter measures the degree of customers’ bounded rationality. According to Huang et al. [33], a higher value of corresponds to a greater level of bounded rationality:
- As , customers exhibit fully bounded rationality and make random choices among the three available options. In this extreme case, customer behavior becomes irrational, as choices are no longer utility-driven;
- As , customers exhibit full rationality, and their choice probabilities converge to the equilibrium selection of fully rational and identical customers.Based on Equations (2) and (3), and , we can express as follows:
After taking the logarithm of both sides, this characterization of customer rationality enables the monopolistic service provider to optimize both its advertising intensity and service rate accordingly.
Because , the above formula illustrates the relationship between the degree of customer bounded rationality , customer utility , and the customer choice probability . Using this derived formula, the impact of bounded rationality on the customer choice probability can be effectively reflected.
From the above model, we can observe that when customers exhibit full rationality, i.e., as , the utility function simplifies to . Defining , we can derive the following conclusions.
Proposition 2.
If
, then all customers will enter the system, leading to a choice probability of
. However, if
, there exists a mixed equilibrium strategy , where the probability satisfies .
When , the outcome aligns with traditional research—if customers are fully rational and still obtain non-negative utility when all enter the system, then all will choose to enter and purchase the service. Conversely, when , not all customers enter the system; instead, they enter with probability . This equilibrium analysis for is consistent with conventional results.
For the subsequent analysis, we impose the restriction . This restriction facilitates sensitivity analysis since, within this range (), the equilibrium service rate and advertising remain continuous functions of .
In this monopolistic market, customers have only two choices: either to enter the service provider’s system or to opt out. Therefore, Equation (5) can be rewritten as follows:
Based on the above formula, the logit choice model in a monopolistic system with a single service provider can be expressed as follows:
Corollary 1.
As the level of customer bounded rationality increases, the equilibrium strategy for the monopolistic service provider should involve increasing advertising intensity a.
For the service rate ,
- When , if , then ; otherwise, if , then ;
- When , if , then ; otherwise, if , then .
For a monopolistic service provider, an increase in customers’ bounded rationality level necessitates a higher level of advertising to better align with customer demand. The impact of on the service rate , however, depends on the proportion of customers entering the system and their sensitivity to service rate . When the proportion of customers choosing to enter the system is high (), and their sensitivity to service speed is significant (), an increase in suggests that the service provider should lower the service rate to enhance customers’ perceived utility.
In a monopolistic market, this logit-based choice model converges to the fully rational customer selection scenario as , justifying the introduction of to capture bounded rationality. A similar conclusion holds in a dual-server setting. While prior studies, such as those by Zhan et al. [2] and Li et al. [25], have explored optimal decisions under these conditions, our analysis focuses on optimizing decision-making for customer-intensive service providers within the framework of Equation (6). Based on our previous discussion, in this monopolistic market, the probability of customer entry is determined by the sign of . When , the profit maximization problem is formulated as follows (We define this scenario as scenario ML, and will denote it with the subscript “ml” below):
From the above, we observe that the relationship between advertising cost and advertising intensity aa is given by , where this advertising cost is treated as a unit cost. For instance, service providers may engage in marketing activities directed at each individual customer. Examples include restaurants like Starbucks and McDonald’s offering coupons or free drinks to new registered members to attract customer spending; ride-sharing platforms like Uber and Didi offering first-time ride discounts to new users; or hotel and travel platforms like Ctrip and Marriott providing discounts or offers for first-time bookings. These marketing expenditures are calculated per customer entering the system. Similarly, gyms and beauty salons often attract new customers by offering free trial classes or treatments. These marketing expenditures reflect the relationship between advertising costs and the number of customers entering the system, aligning with the model setup , and illustrate the characteristic of unit marketing costs per customer.
When , the profit maximization problem is formulated as follows (We define this scenario as scenario MS, and will denote it with the subscript “ms” below):
Therefore, we can derive the following proposition.
Proposition 3.
If the optimal advertising intensity under the condition is , the optimal service rate is given by , where .
Once , the optimal advertising intensity is given by the following:
And the optimal service rate is given by the following:
where .
The above proposition provides the optimal advertising intensity and service rate level under monopoly conditions. When , the utility within the service system is sufficiently high (likely due to the intrinsic value of customer-intensive services), and the probability of a customer choosing to enter the system, . In this case, the service provider does not need to conduct advertising, thereby reducing advertising costs.
However, when the utility in the customer-intensive service system is relatively low, i.e., , the probability of a customer entering the system becomes . In this scenario, both the optimal advertising level and service rate are influenced by parameters such as and .
Based on the above proposition, we can derive the following corollary:
Corollary 2.
In the case where , as the customer’s bounded rationality level changes, the optimal advertising level, service rate, and profit satisfy , , and .
The service rate is a core element in customer-intensive services, and the above corollary provides important managerial insights. When customers’ bounded rationality increases in the market, customer-intensive service providers should further reduce the service rate to enhance customer utility. This suggests that the degree of customers’ bounded rationality affects their perception of the utility derived from service speed, meaning that service providers must lower the service rate to meet customers’ needs.
As for the optimal advertising level, when the bounded rationality level is relatively low, an increase in may lead service providers to reduce the optimal advertising level, even though this could, to some extent, decrease advertising costs. Surprisingly, this could be beneficial to the service provider’s profit, particularly when the advertising cost coefficient is high (i.e., when ). In such cases, an increase in customer bounded rationality may prompt service providers to reduce advertising intensity, significantly lowering advertising costs and thus increasing profits. However, if the advertising cost coefficient is low, the reduction in advertising level may not result in substantial cost savings, and the decrease in customer utility could be more significant, leading to a reduction in service provider profits.
Corollary 3.
In the case where , as the customer’s sensitivity to advertising changes, the optimal advertising level, service rate, and profit satisfy and , .
The above proposition illustrates the impact of customer advertising sensitivity on the operational decisions and profits of customer-intensive service providers. As increases, service providers can enhance the service rate, which is crucial in customer-intensive services. Increasing the service rate effectively reduces customer waiting time within the service system, thereby lowering customer waiting costs. Additionally, an increase in kk will motivate service providers to raise their advertising level, as higher indicates that customers are more sensitive to advertisements.
However, increasing the advertising level also leads to higher advertising costs. Therefore, when the advertising cost coefficient is low, i.e., , the provider’s profit will increase. On the other hand, when the advertising cost coefficient is high, i.e., , the provider’s profit will decrease due to the sharp increase in advertising costs. This effect contrasts with the influence of customer limited rationality level , where increasing typically leads to lower profits.
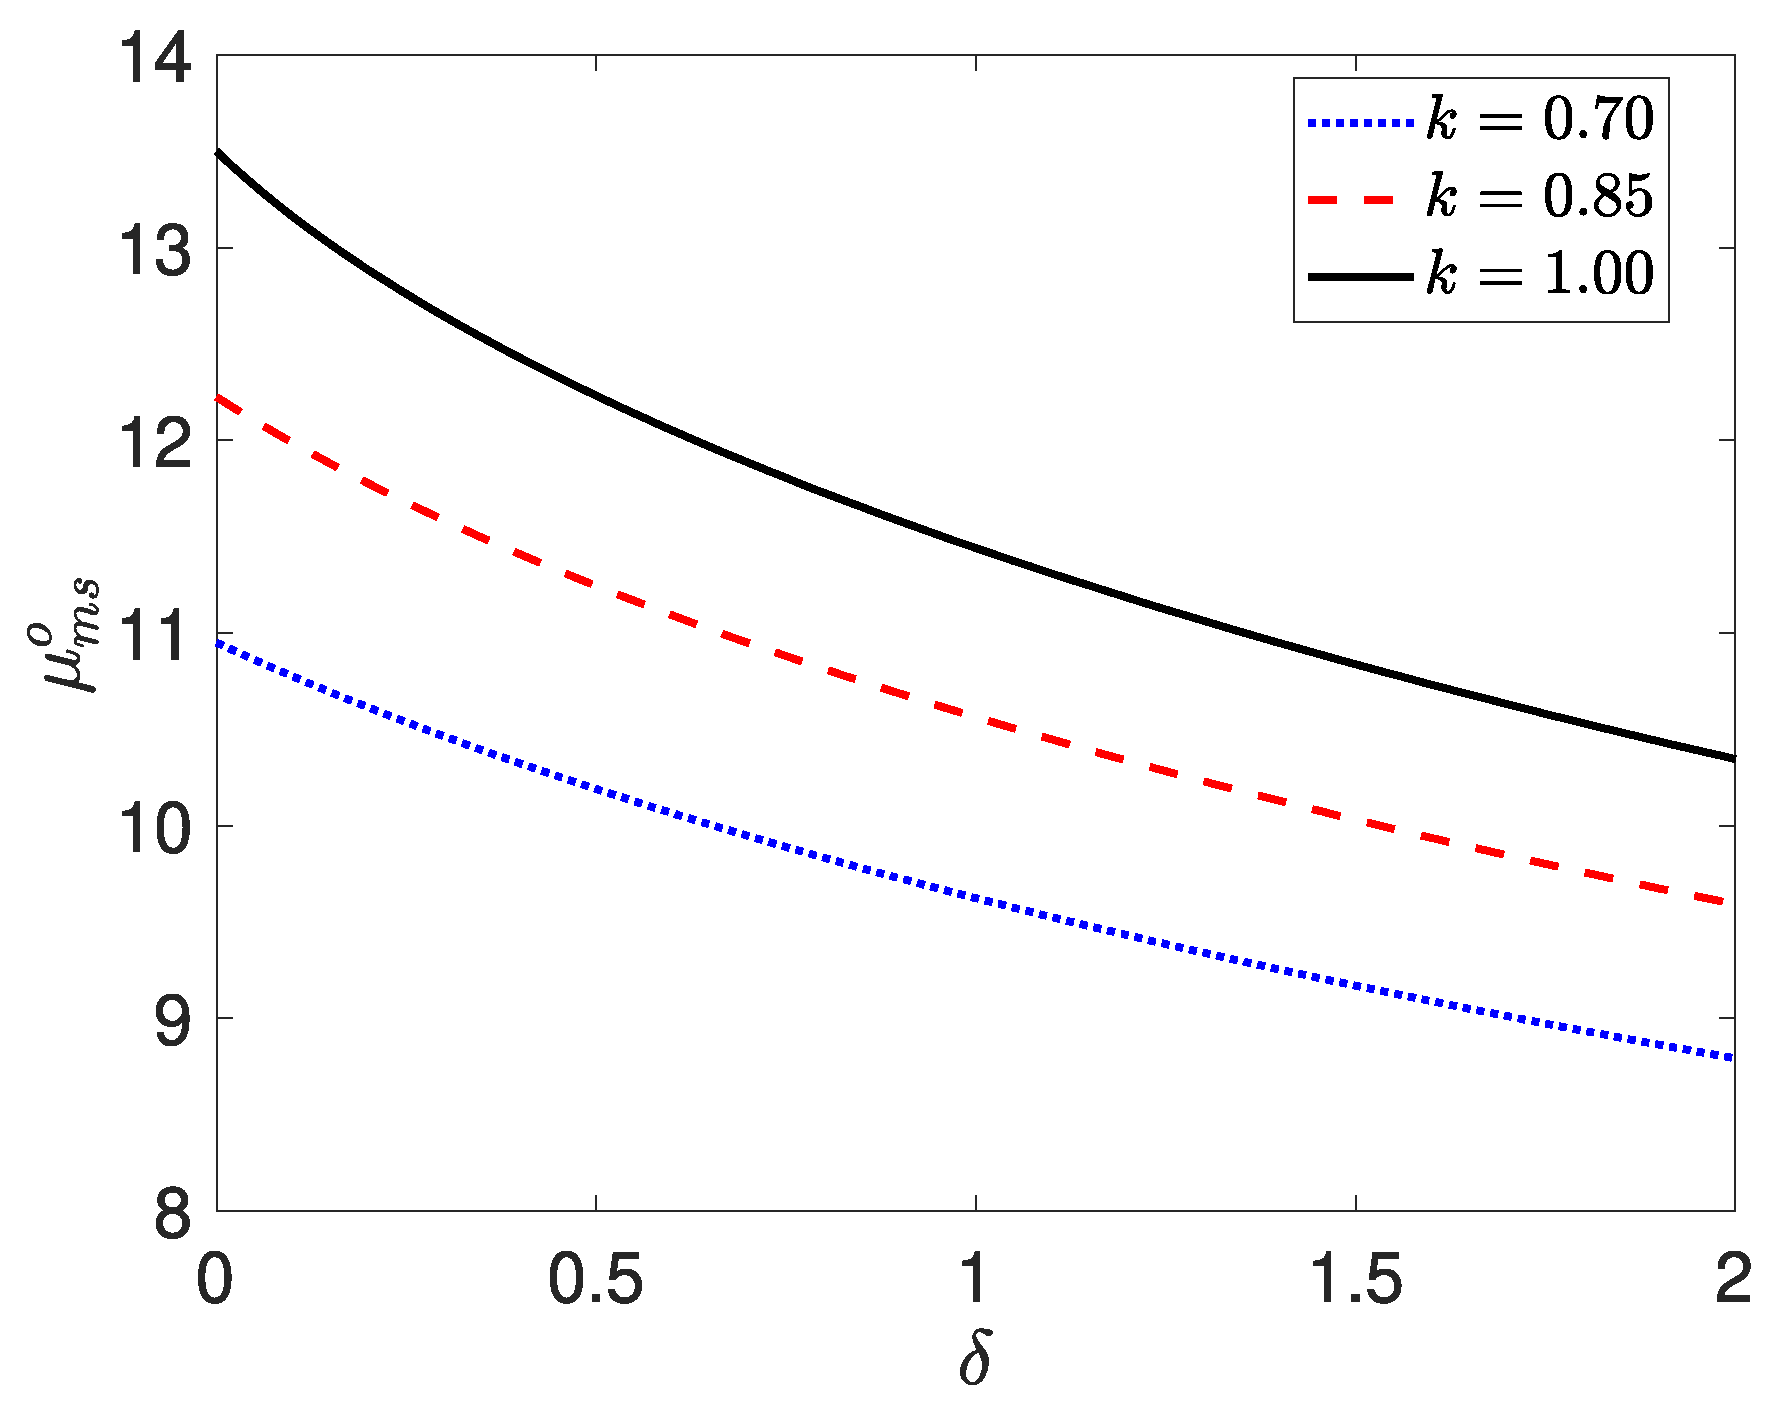
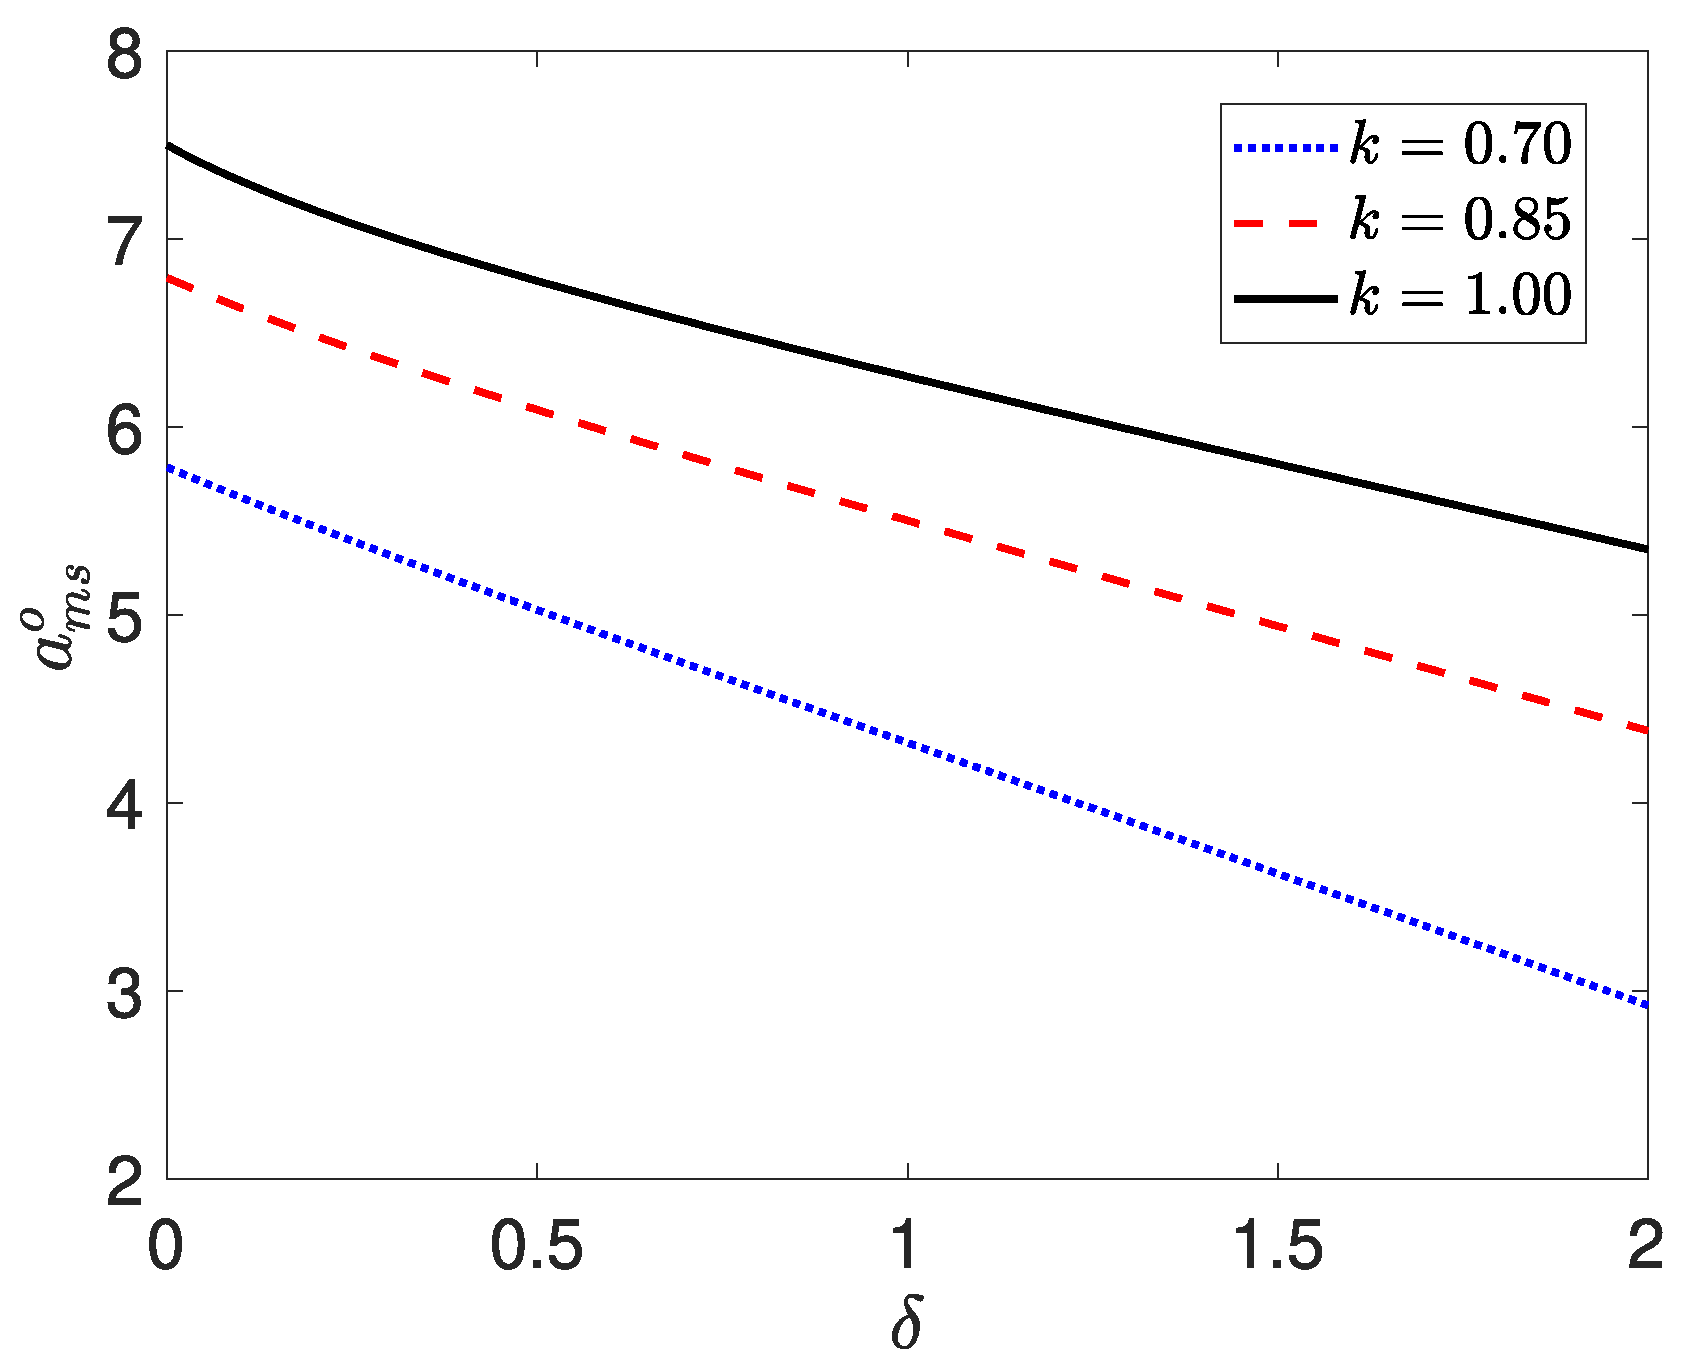
We will next conduct a numerical simulation analysis to specifically model the impact of customer bounded rationality on service providers’ decisions and profits. Building on the research structure and simulation approach of Zhan et al. [2] and Li et al. [25], we will create a dataset that satisfies the conditions of the theoretical model for the simulation analysis. For our study, the conditions of the theoretical model must meet the following requirements: , , , , and (where and are determined by the optimization results). Based on these conditions, we have designed the following dataset: , , , , , , and . Service providers can adjust the dataset according to their specific market research and operational needs, reflecting the generalizability and robustness of our study. In Figure 1, Figure 2 and Figure 3, we will analyze the influence of customer limited rationality on the optimal service rate , advertising level , and profit . In Figure 4, we will change the advertising cost coefficient from to to illustrate how profits vary with different values of .
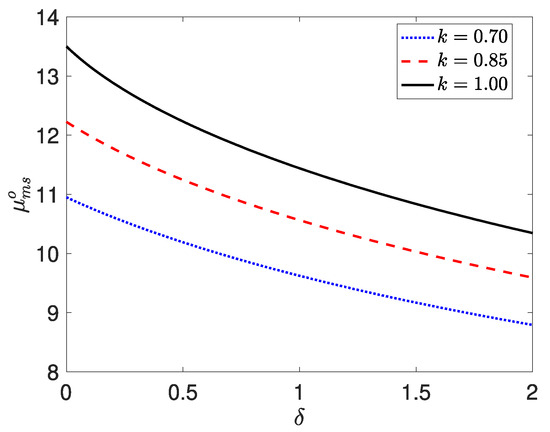
Figure 1.
The optimal with respect to at different when
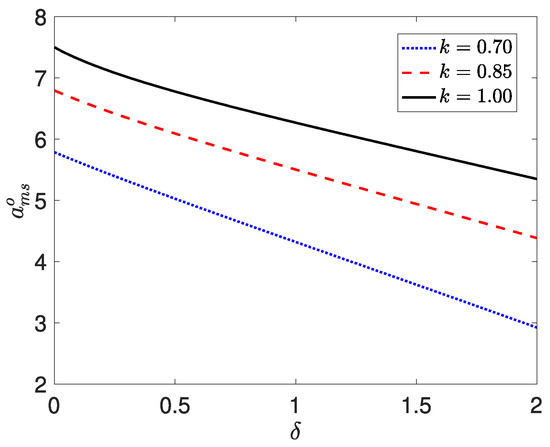
Figure 2.
The optimal with respect to at different when
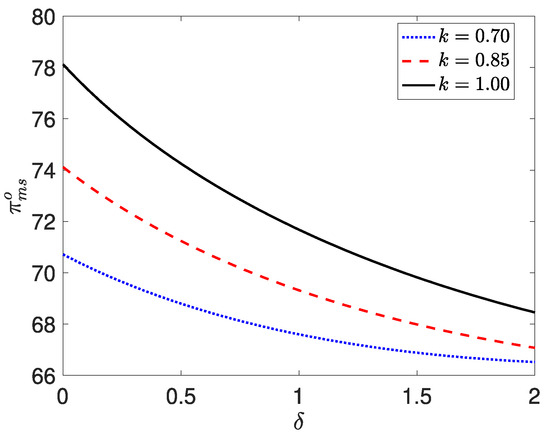
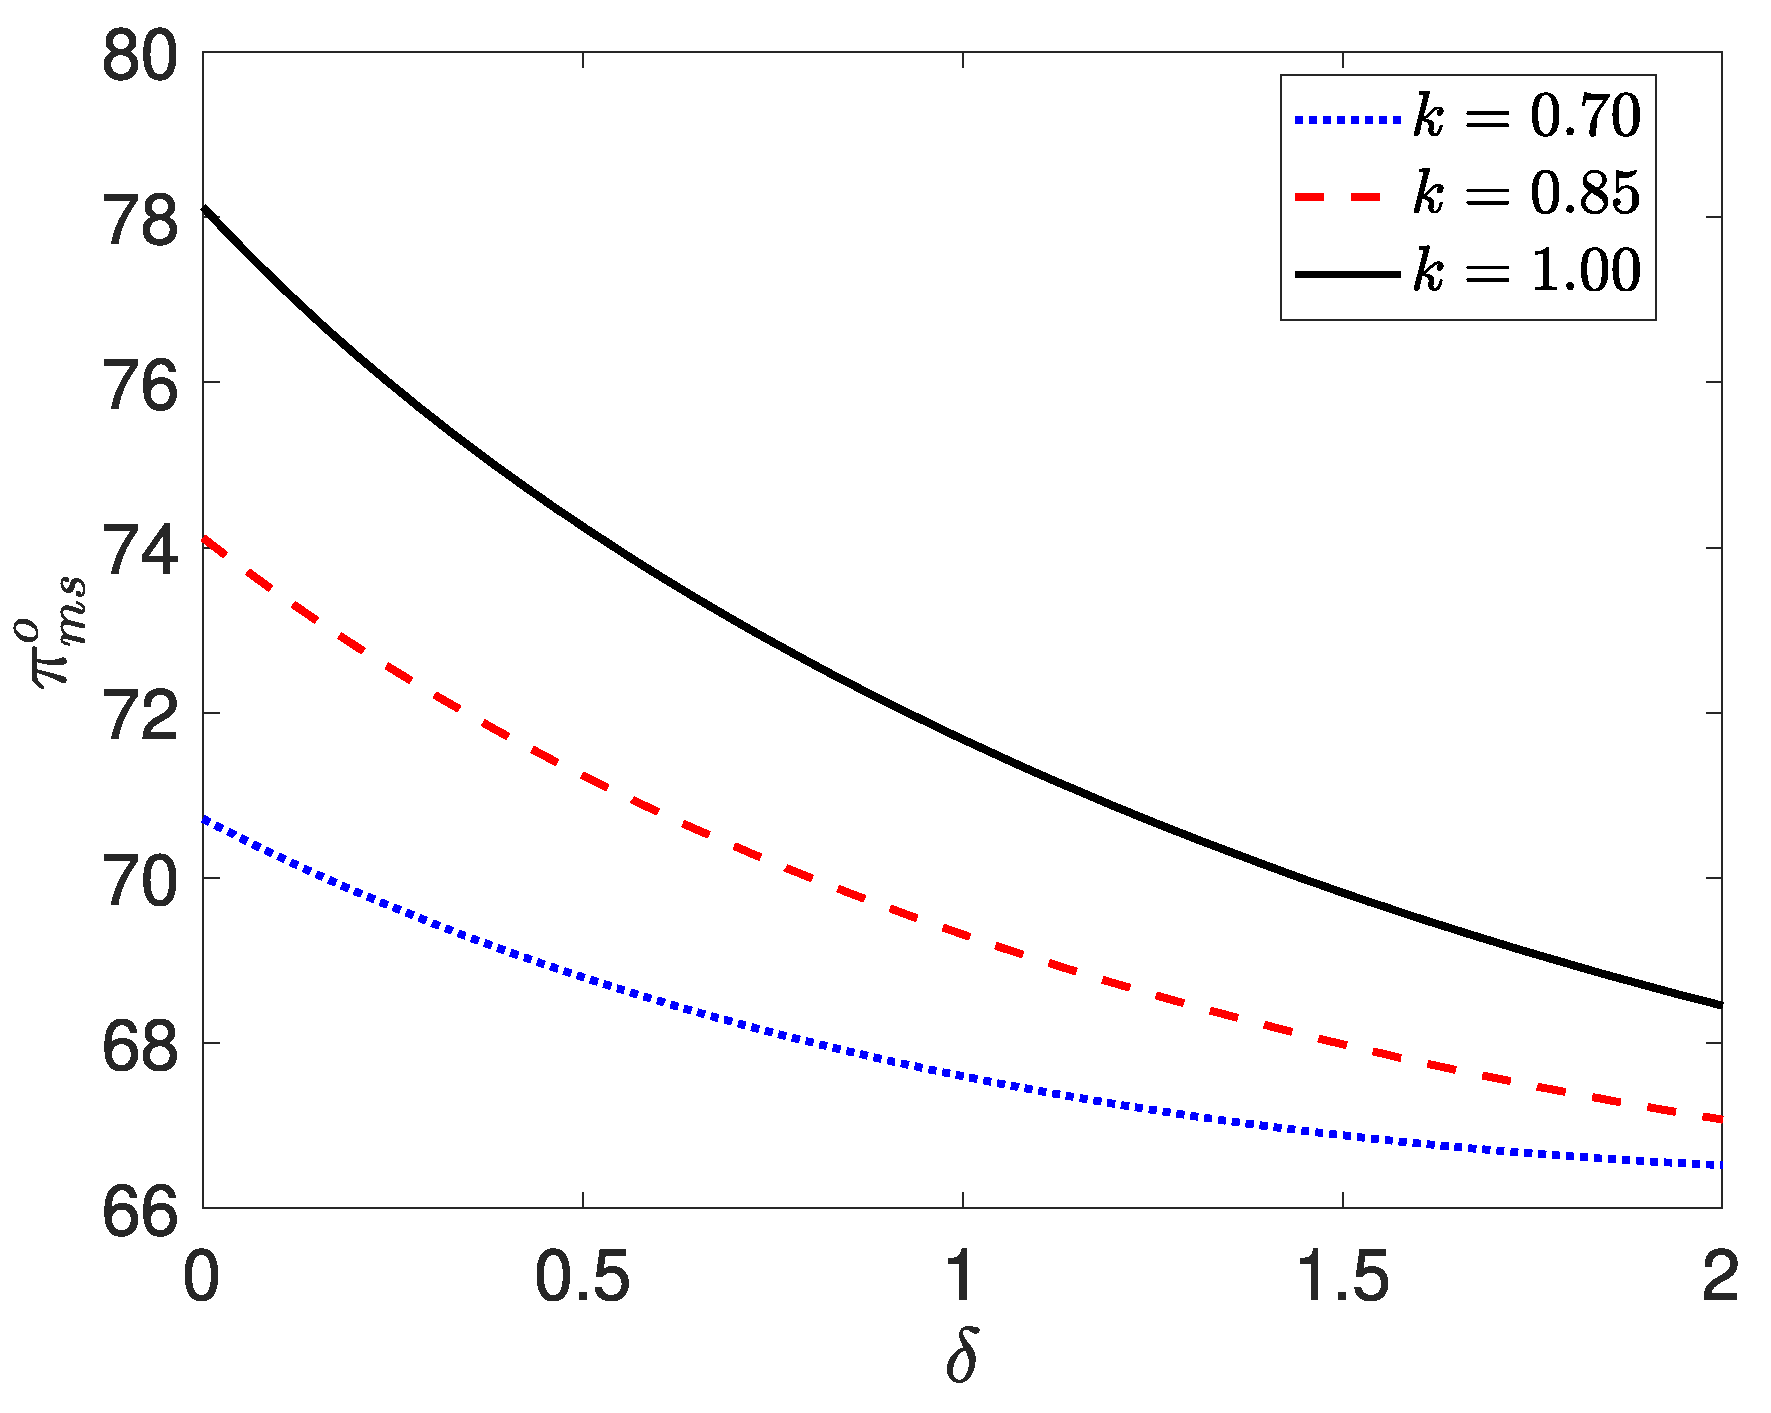
Figure 3.
The optimal with respect to at different when
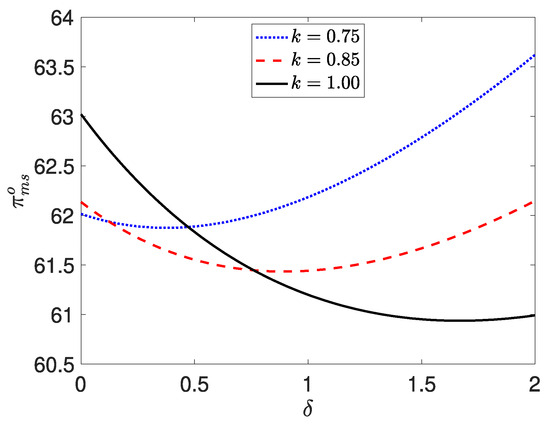
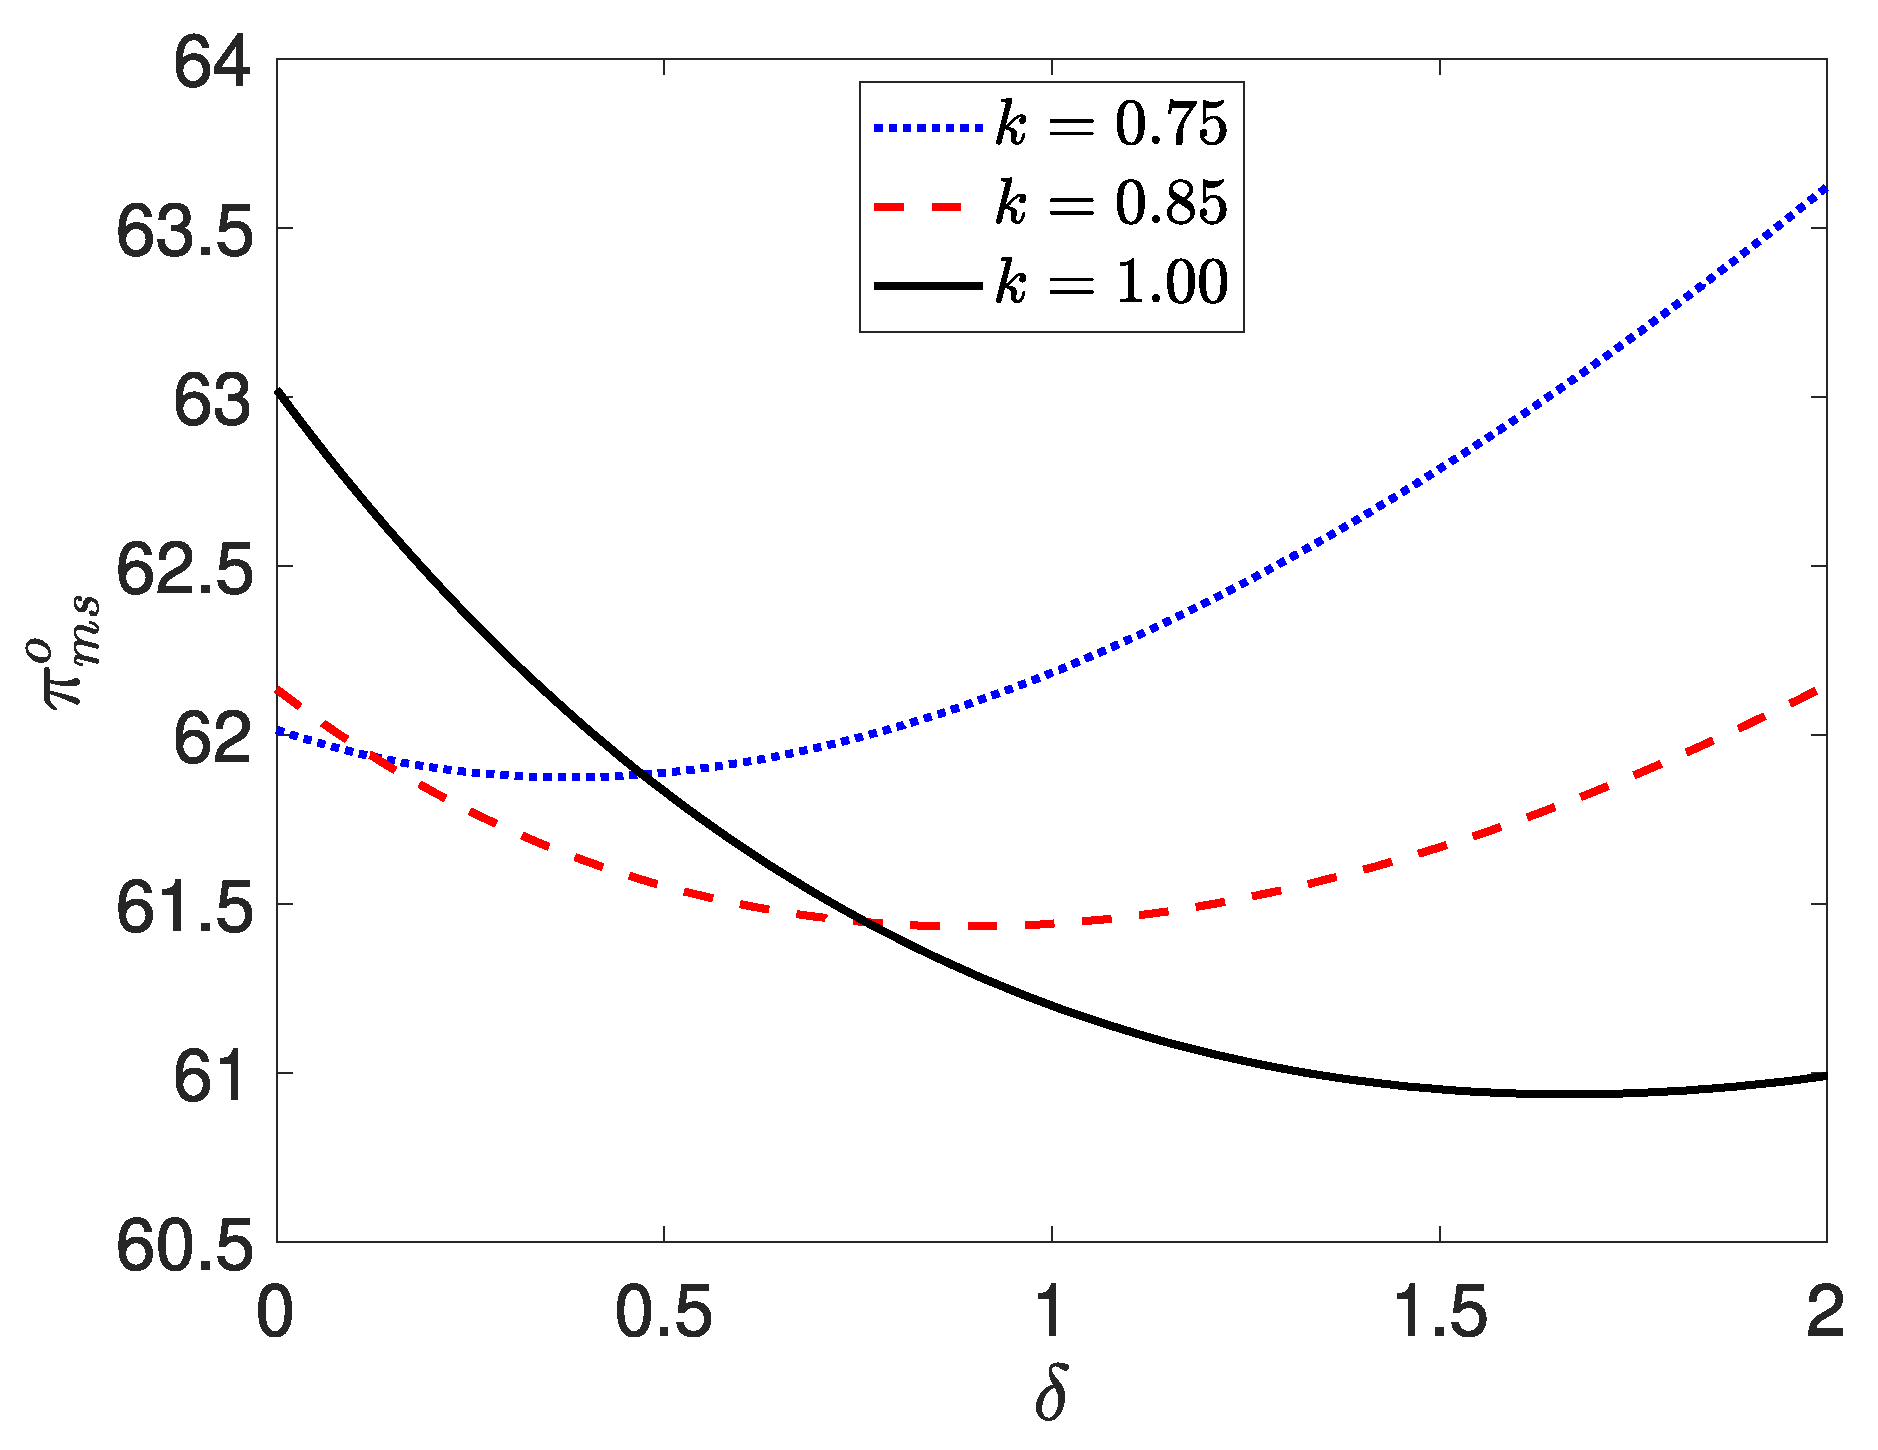
Figure 4.
The optimal with respect to at different when
From Figure 1 and Figure 2, it can be observed that as customer limited rationality increases, the monopoly service provider should reduce both service speed and advertising level. However, a higher advertising sensitivity coefficient will counteract this reduction trend, causing the service speed and advertising level to increase at the same level. This demonstrates the offsetting effect between customer limited rationality and customer advertising sensitivity.
Comparing Figure 3 and Figure 4, it can be observed that if the advertising cost coefficient is low (), the reduction in advertising level leads to a smaller decrease in costs, while customer demand significantly decreases, resulting in a reduction in the service provider’s profit. However, if is high (), the reduction in advertising level can effectively save advertising costs, leading to a profit increase after an initial decrease. This highlights the importance of the advertising cost coefficient in influencing the service provider’s profit.
5. Decision-Making in a Duopoly Market
In the previous section, we analyzed the optimal decision-making problem for a service provider in a monopolistic market. Now, we consider a duopolistic competitive market where two service providers engage in strategic interactions regarding service rate and advertising intensity. Each service provider offers the same utility function to customers.
We model this competition as a two-stage game. In the first stage, both service providers set their service rates and then determine their advertising intensities to compete for market shares . Let represent the market share vector and represent the service rate vector. In the second stage, customers observe the service rates and choose a service provider based on a logit choice model. To determine the Nash equilibrium of service rate competition, we first analyze the best response of a given service provider when the other provider has already set its service rate. We then prove the existence of a symmetric equilibrium in this competition. Furthermore, we demonstrate that this equilibrium is both unique and stable. Finally, we analyze the optimal decisions for service rate competition and advertising strategies.
Service Provider’s Best Response Function
Similar to the studies by Anand et al. [3] and Li et al. [10], we assume that the capacity cost of the service provider is independent of the service rate, meaning it remains a fixed value. However, the cost of advertising is influenced by the intensity of advertising efforts, making it essential to account for advertising costs in the decision-making process. In customer-intensive services, the service rate is a critical factor for service providers. Therefore, we focus on the optimal response concerning service rate selection. Given a fixed level of advertising intensity, service provider 1’s best response is to choose the service rate to maximize its market share , which can be derived from Equation (6). Building on the work of McKelvey and Palfrey [32], we analyze the uniqueness of and establish the following proposition regarding the optimal response.
Proposition 4.
In a duopoly market, given a fixed level of advertising intensity, the market share of the designated service provider 1, denoted as , is a unimodal function of its service rate , assuming the competitor’s service rate is fixed. There exists a unique optimal solution, denoted as , at which the market share is given by . In addition, similar to the derivation process of Equation (5), the following equation can be obtained:
This proposition demonstrates the unimodality of , which aligns with the characteristics observed in the monopoly market. It indicates that in both monopoly and duopoly markets, the market share remains a unimodal function of the service rate. Consequently, there exists an optimal service rate that maximizes the market share. Furthermore, under equilibrium conditions, we can derive the following conclusions.
Proposition 5.
In a speed–quality competition within a duopoly market, there exists a symmetric Nash equilibrium. The equilibrium service rate, denoted as , satisfies the following equation:
The corresponding market share is given by .
Following the findings of Li et al. [25], we know that given the advertising intensity aa, the above equilibrium is both stable and unique. The proof of this conclusion can be established using a tâtonnement scheme, which allows service providers to sequentially adjust their service rates based on the competitor’s actions. In this tâtonnement adjustment process, the monotonic decrease in service rates reflects a key characteristic of speed–quality competition—service providers must lower their service rates to attract customers from competitors. Consequently, the equilibrium point reaches the lower bound of this convergence process.
Building upon the equilibrium process discussed above, we need to analyze how service providers determine the optimal advertising intensity and service rate in equilibrium. Therefore, the profit maximization problem for service providers in a duopoly market is formulated as follows:
Therefore, based on the above profit maximization problem, we derive the following conclusion:
Proposition 6.
In the equilibrium state, the optimal advertising intensity is given by:
The optimal service rate
satisfies the following equation:
At equilibrium, the market share is given by .
The above proposition presents the optimal decisions of service providers in a duopoly market. Comparing them with the optimal decisions in a monopoly market, we find that the functional forms of the optimal decisions in both market environments are similar. The only differences lie in the terms and . Therefore, we will next focus on analyzing the differences in optimal decisions and profits between the duopoly and monopoly markets.
Corollary 4.
In a duopoly competition market, the impact of customer bounded rationality and advertising sensitivity on the optimal advertising intensity, service rate, and service provider profit is consistent with the conclusions in Corollaries 2 and 3.
This corollary indicates that, regardless of whether the market is a monopoly or a duopoly, the effects of customer bounded rationality and advertising sensitivity on the service provider’s optimal decisions and profits remain the same. This provides a more convenient approach for service providers in their decision-making process. Moreover, it highlights the consistency of bounded rationality’s influence across different market structures, making it an essential factor to consider.
Next, we will compare the differences in the optimal decisions and profits of service providers under the influence of customer bounded rationality in monopoly and duopoly markets. Since in a monopoly market, when , the optimal advertising intensity is (i.e., the service provider does not engage in advertising), this case will not be included in our comparison. Instead, we will focus on the scenario where in a monopoly market, referred to as the MS case.
Corollary 5.
By comparing the monopoly market (MS) and the duopoly market, we obtain the following results , .
Regarding advertising intensity and service provider profits, we consider the case where customers are relatively rational and advertising costs are low, i.e., and . Under these conditions, we derive , .
This corollary indicates that, paradoxically, a service provider in a monopoly market sets a higher service rate. However, this is detrimental to customers in customer-intensive services, as service utility increases when the service rate decreases. This suggests that the service provider in a monopoly market offers lower service quality. Nevertheless, the result implies that even though the monopolistic service provider offers lower service quality, customers have a higher probability of making a purchase, highlighting the market advantage of a monopolistic service provider.
Regarding advertising intensity, we first consider the scenario where customers are relatively rational and advertising costs are low. Under such conditions, both the advertising intensity and the profits of service providers in the duopoly market are lower than those in the monopoly market. This occurs because, in a duopoly market, service providers adopt a lower service rate , which enhances customer utility. As a result, to save on advertising costs, their optimal advertising intensity is lower. Furthermore, due to competitive pressure from rivals, service providers in the duopoly market experience lower profits.
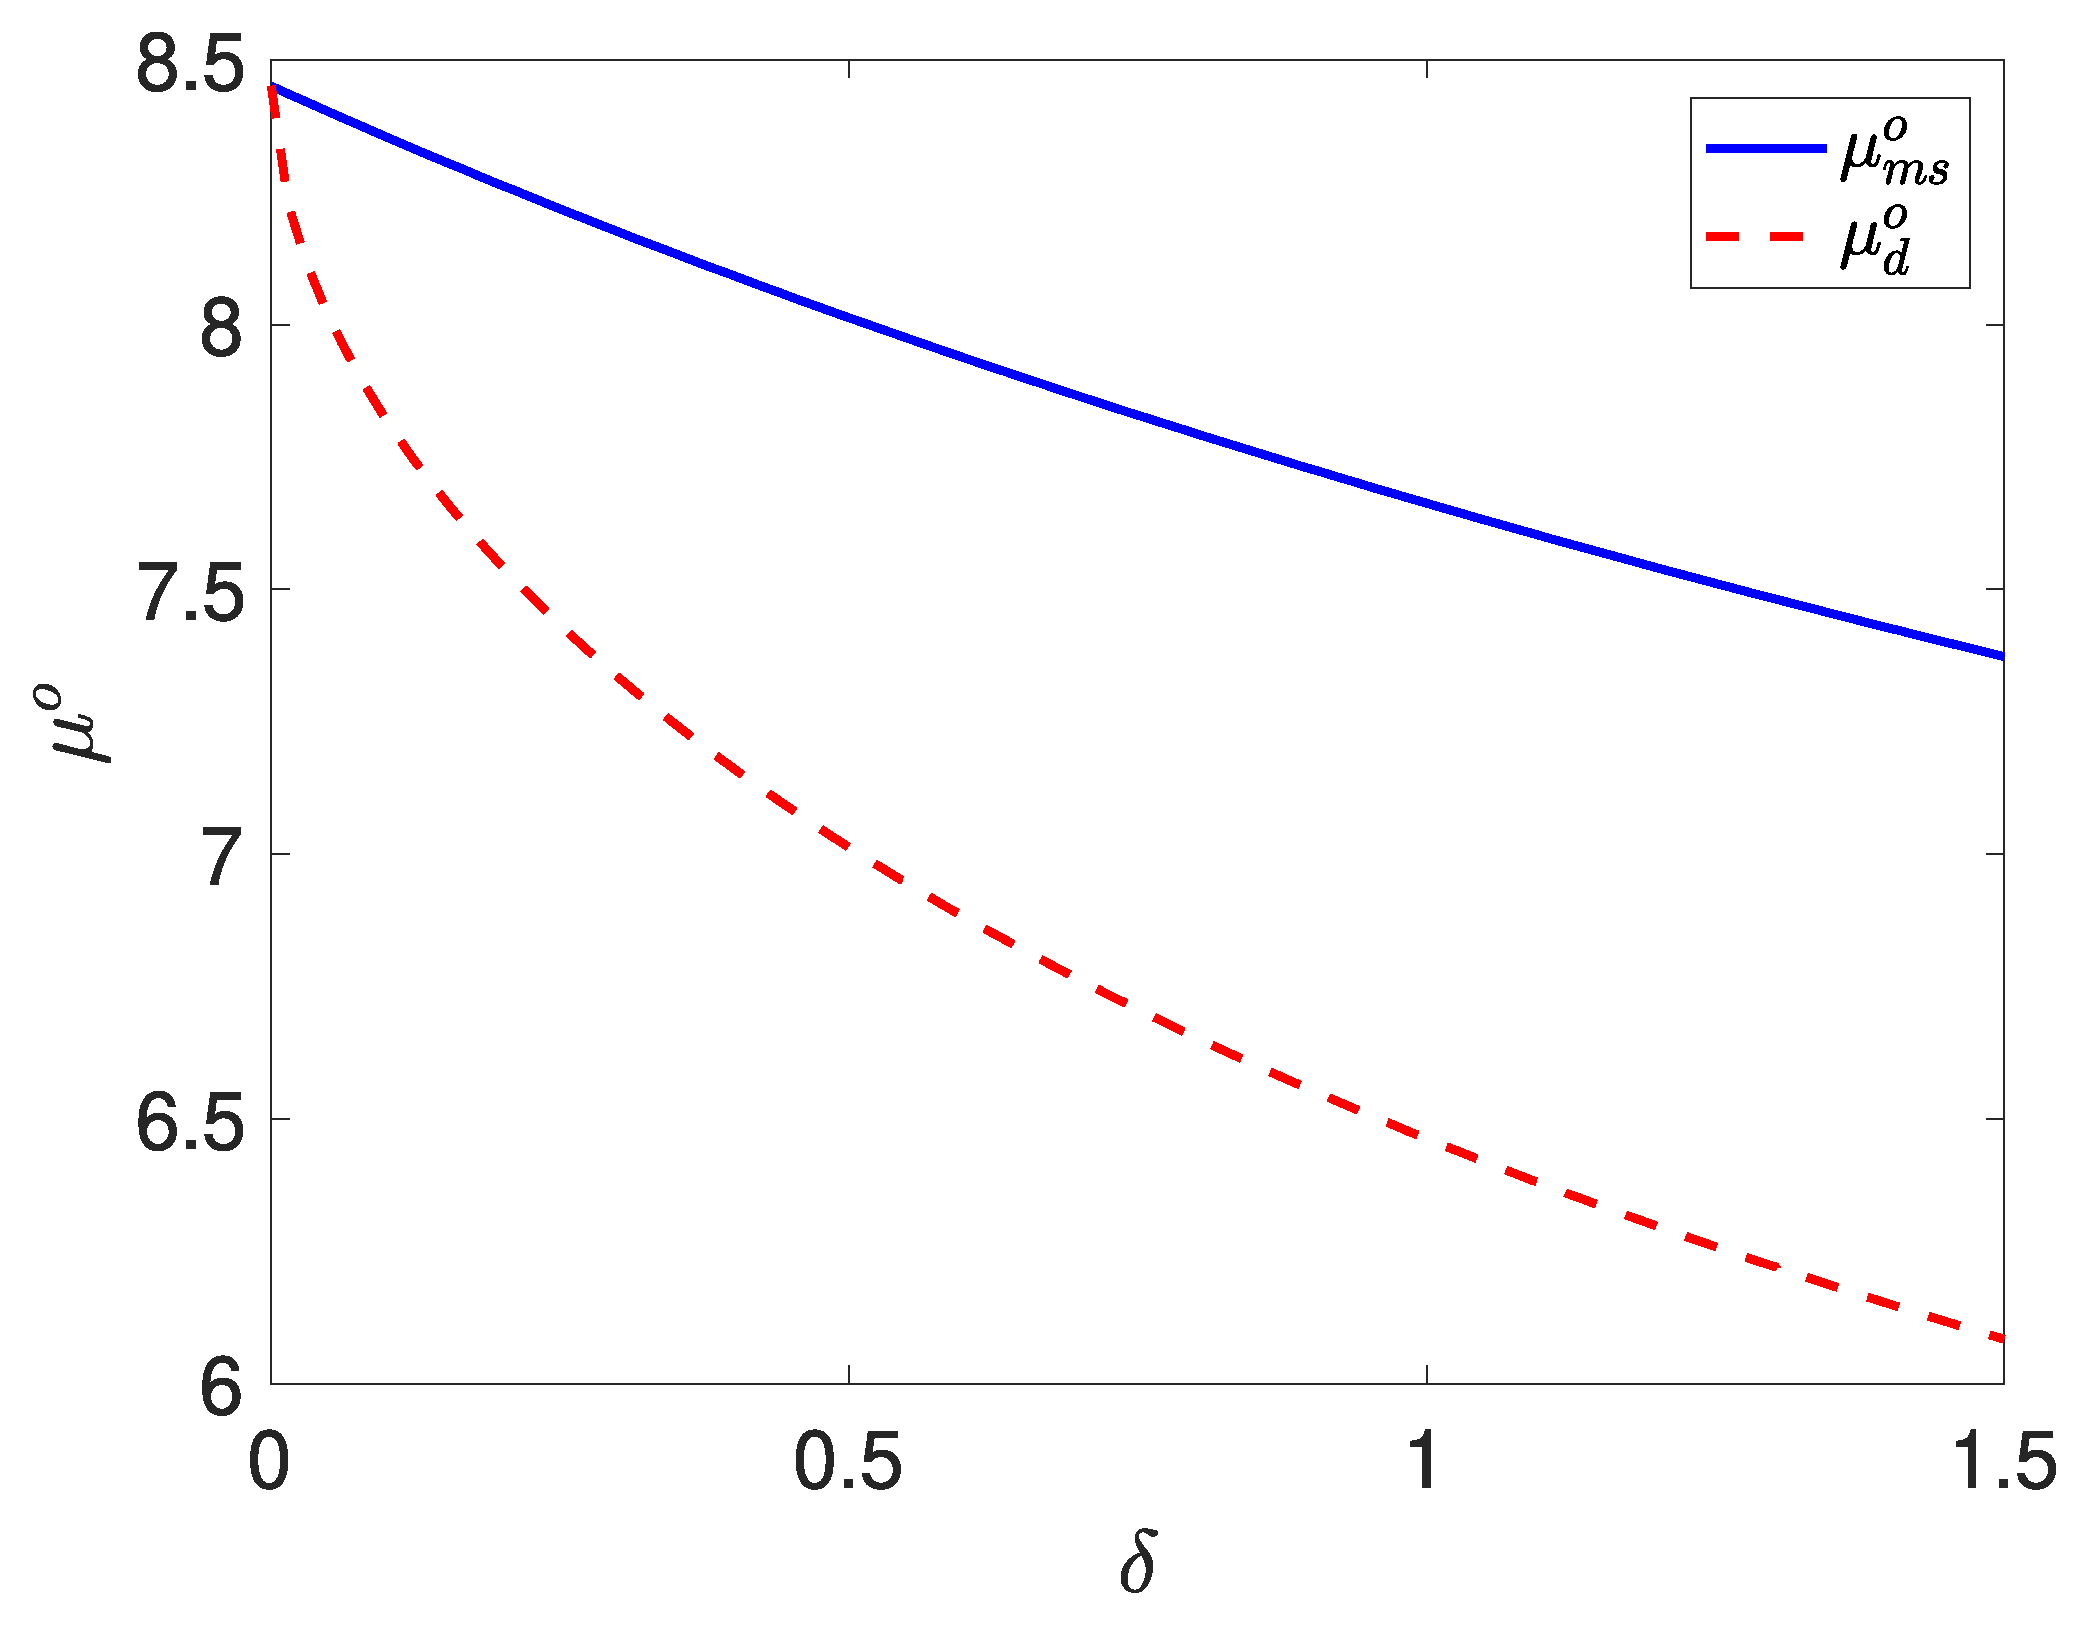
Next, we will conduct a numerical analysis to further illustrate the differences in the optimal decisions and profits of service providers in monopoly and duopoly markets as customer bounded rationality varies. The parameter settings are as follows , , , , , , , . Figure 5, Figure 6 and Figure 7, respectively, depict the variations in service rate, advertising intensity, and service provider profit in monopoly and duopoly markets as a function of customer bounded rationality.

Figure 5.
The comparison between and
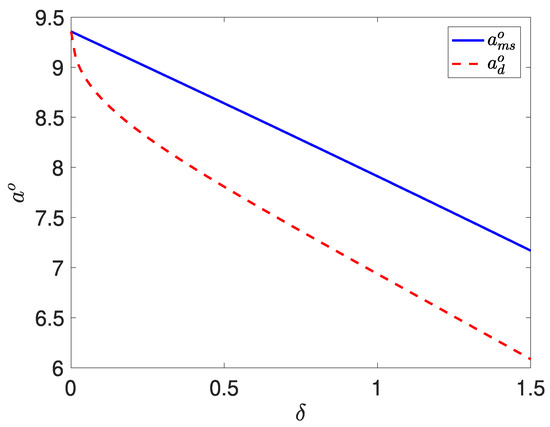
Figure 6.
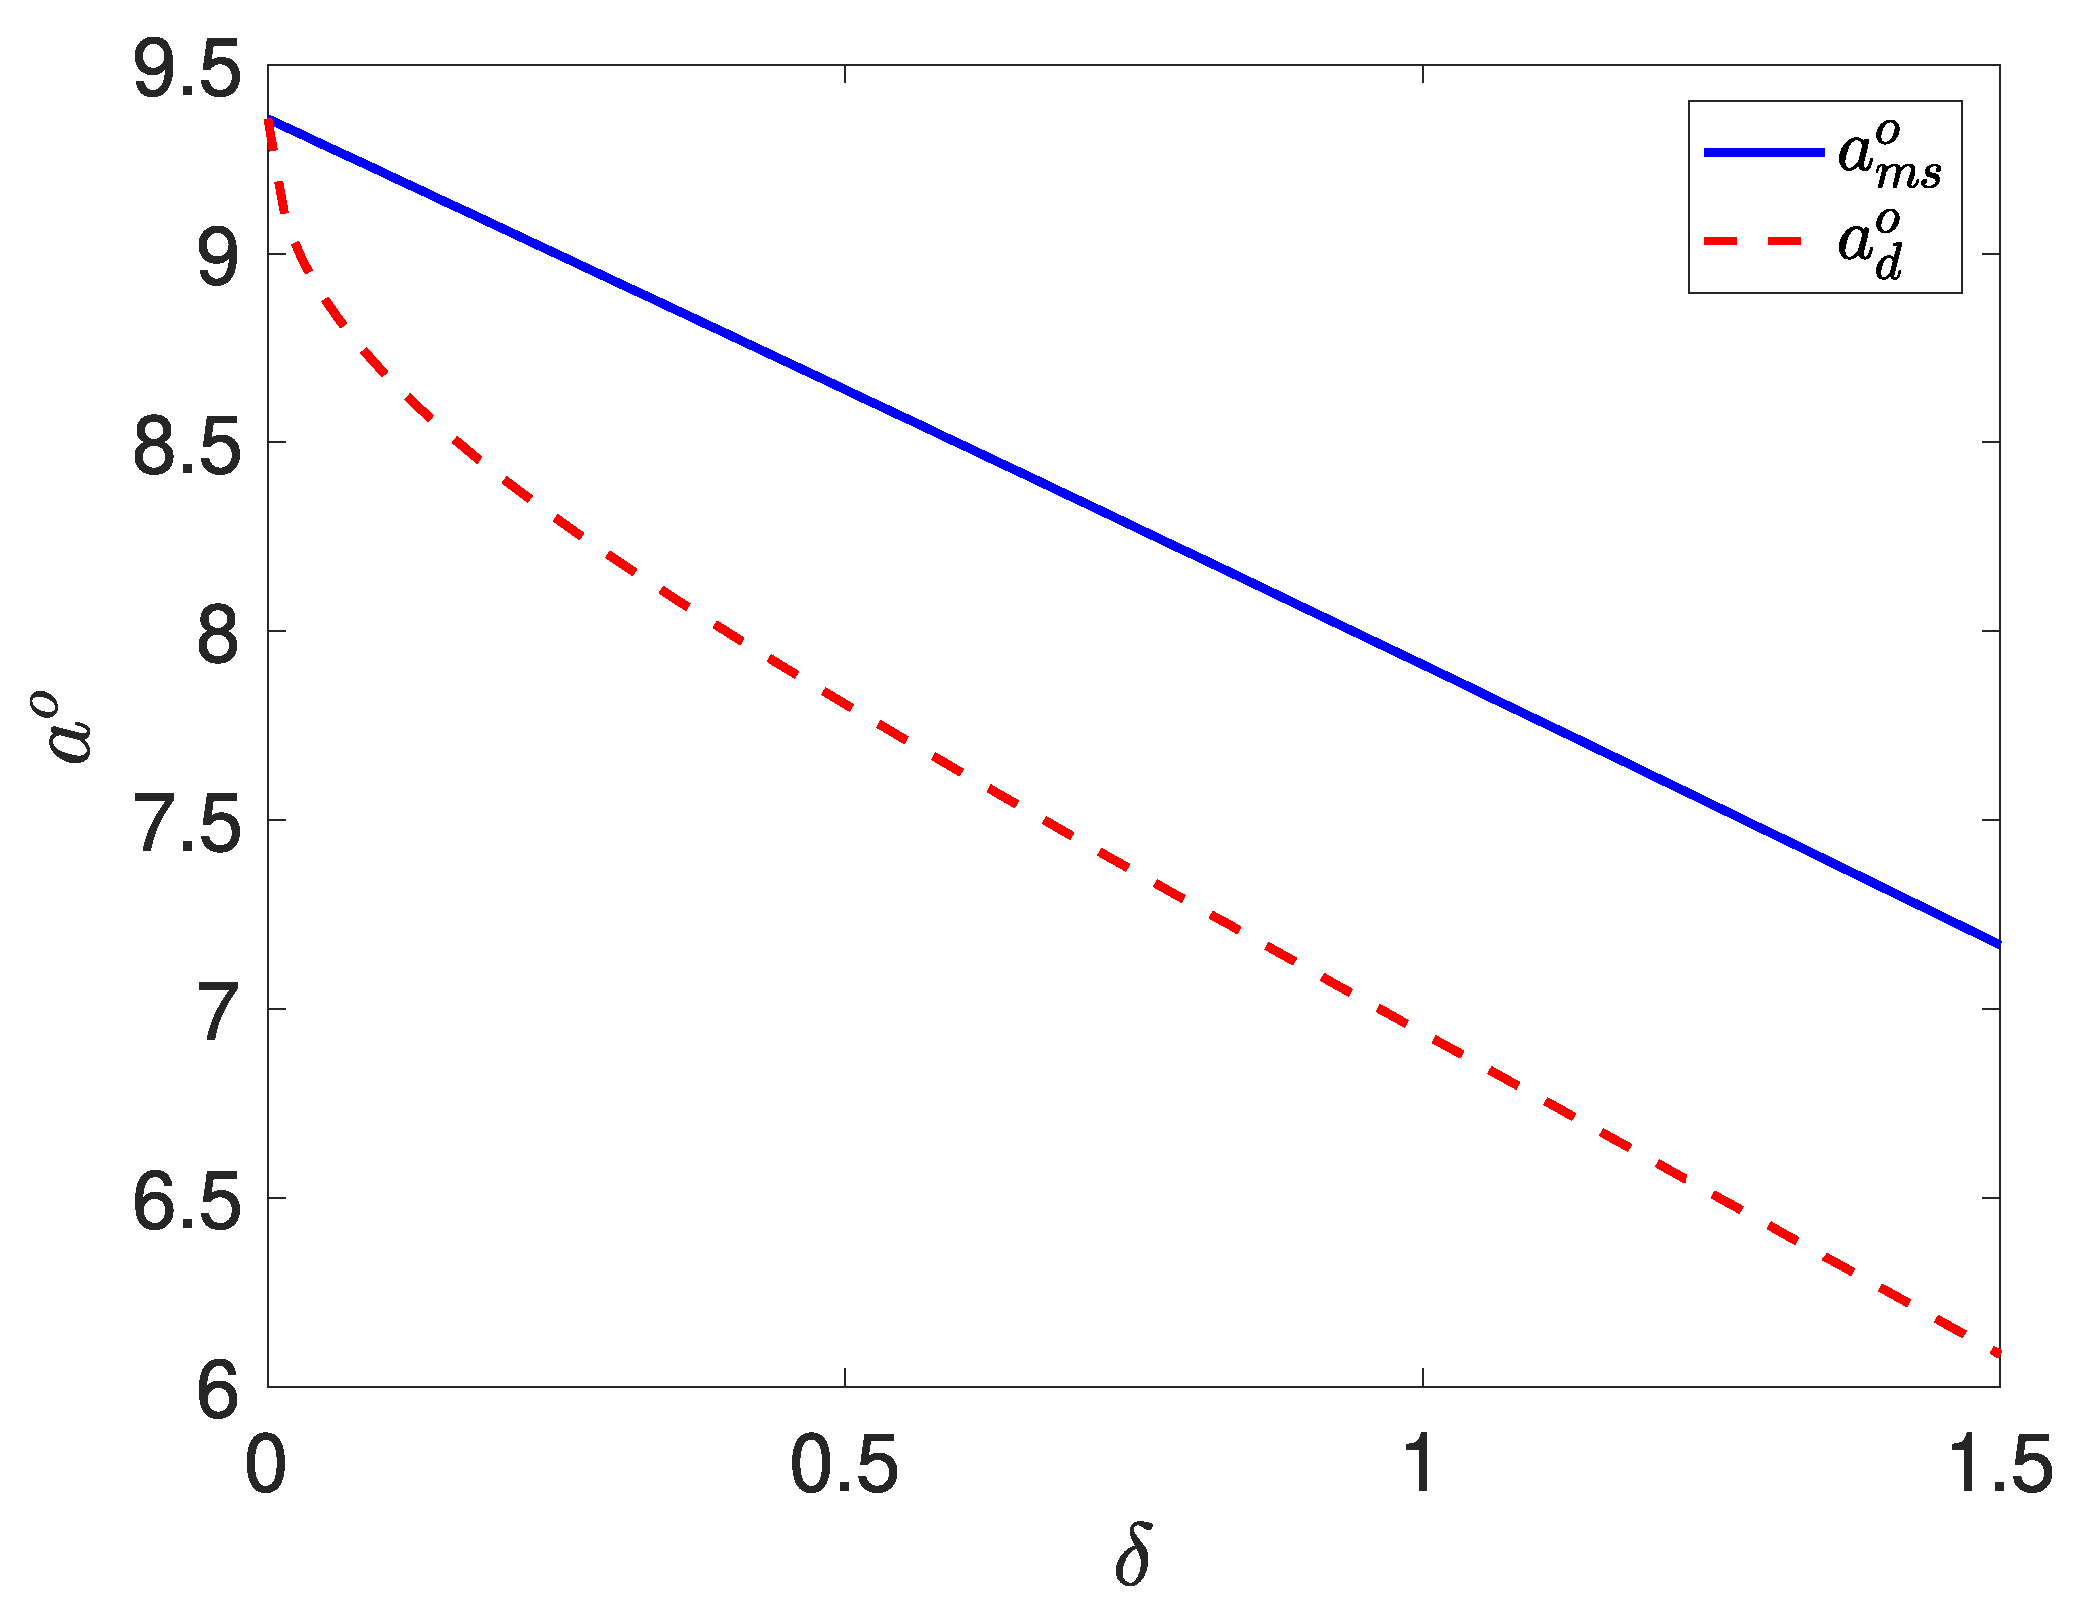
The comparison between and
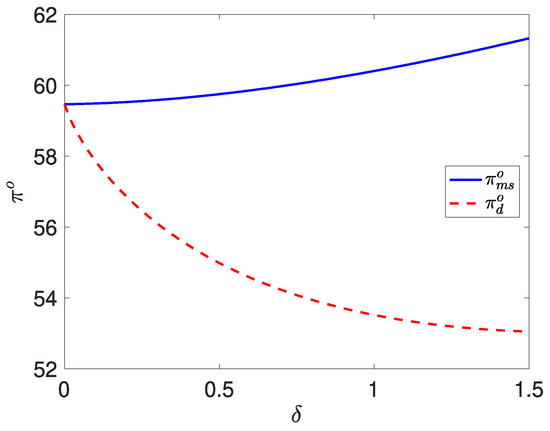
Figure 7.
The comparison between and
From Figure 5, Figure 6 and Figure 7, it can be observed that when the customer bounded rationality level , the service rates, advertising intensity, and profits in both the monopoly and duopoly markets are identical. This is because, at this point, there is an abundant potential customer base, and service providers in the duopoly market can attract enough demand without the need for competition. However, when , as increases, service rates, advertising intensity, and profits in the monopoly market become higher than those in the duopoly market. The differences between the two markets gradually increase with . This also highlights that in the duopoly market, service providers of customer-intensive services are more inclined to compete with lower service rates (higher quality) and lower advertising intensity. They focus more on the essence of customer-intensive services. This provides theoretical support for service providers’ decision-making in different market structures.
6. Conclusions
Service rate and advertising intensity are key operational decision factors for customer-intensive service providers. To address the challenges in decision-making and make operational strategies more realistic, this paper incorporates customer bounded rationality into the decision-making process of service providers. First, based on the M/M/1 queuing model, a comprehensive decision-making model for customer-intensive service providers considering bounded rationality is constructed, and the optimal service rate and advertising strategy for service providers in a monopoly market are analyzed. The model is then extended to a duopoly market to further explore how service providers formulate appropriate competitive strategies based on the level of customer bounded rationality. Based on theoretical analysis and numerical simulations, the following conclusions are drawn:
- In a monopoly market or a duopoly market, an increase in the level of customer bounded rationality will prompt customer-intensive service providers to reduce their service rates. Since lower service rates in customer-intensive services lead to higher perceived service value for customers, this means that an increase in customer bounded rationality can enable service providers to enhance the perceived value of their services. Furthermore, this level of bounded rationality will also lead to a reduction in the optimal level of advertising, potentially allowing service providers to increase their profits by lowering advertising costs;
- Whether in a monopoly market or a duopoly market, service providers can control the service rate to optimize customer demand within the system. This is because the proportion of customers choosing to enter the system is a unimodal function of the service rate, with a unique optimal value. Moreover, since demand has an optimal value, service providers can also optimize their profits accordingly based on this optimal service rate;
- In both types of markets, when customer sensitivity to advertising increases, service providers should raise their advertising levels and increase the service rate. This means that by increasing advertising efforts, service providers can attract more customers, while also reducing congestion in the system by offering a higher service rate, thus effectively lowering customer waiting costs. If the advertising cost coefficient is relatively low, the service provider’s profit will increase. On the other hand, if the advertising cost coefficient is too high, the service provider’s profit will decrease as advertising costs rise sharply;
- In a duopoly market, service providers should set lower service rates and lower advertising levels compared to those in a monopoly market, in order to compete with their rivals. This is because, in customer-intensive services, a lower service rate implies higher service quality. Therefore, the optimal strategy for service providers in a duopoly market is to adopt a high service quality, low advertising strategy, which involves allocating more resources towards improving the quality of the service itself.
Limitations and Future Directions: This paper primarily explores the decision-making of customer-intensive service providers regarding service rates and advertising intensity under customer bounded rationality in monopoly and duopoly markets. However, decision-making behavior in a perfectly competitive market has not been addressed, which is a key area for future research. Additionally, since customers in the market may perceive advertising effects and service rates differently, future research will consider the impact of customer heterogeneity on the decision-making of customer-intensive service providers to enrich and expand the theoretical and practical implications.
Considering other distributions, our analysis shows that normal distributions, two-point distributions, and others may not effectively capture the degree of bounded rationality of customers, making it difficult to accurately model bounded rationality. While exponential and logistic distributions can also reflect bounded rationality to some extent, as discussed in the literature [26], the advantage of the Gumbel distribution lies in its scale parameter, which can more precisely measure the degree of bounded rationality of customers. This is the key advantage of the Gumbel distribution over other distributions.
Author Contributions
Conceptualization, G.F.; methodology, G.F. and W.Z.; software, W.Z.; validation, G.F. and W.Z.; formal analysis, G.F.; investigation, G.F. and W.Z.; resources, M.J.; writing—original draft preparation, G.F. and W.Z.; writing—review and editing, G.F., M.J. and W.Z.; supervision, M.J.; project administration, M.J.; funding acquisition, M.J. All authors have read and agreed to the published version of the manuscript.
Funding
This research was supported in part by the National Natural Science Foundation of China Grant No. 71831005 and No. 71502044.
Data Availability Statement
Data will be provided upon request.
Conflicts of Interest
Author Gang Fu was employed by the company Heilongjiang Transportation Investment Group Co., Ltd. All authors declare that the research was conducted in the absence of any commercial or financial relationships that could be construed as a potential conflict of interest.
Appendix A
Proof of Proposition 1.
Given that an increase in causes the expression to increase, we can conclude that the exponential term will also increase.
As a result, for a given , the value of is given by the following:
Since the numerator of this expression increases as increases, it follows that will also increase with an increase in .
Thus, we have shown that an increase in leads to an increase in , as required by the proposition. □
Proof of Proposition 2.
Since represents the net utility when all customers enter the system, when , it means that all customers will receive non-negative utility from entering the system, and thus . On the other hand, when , only a portion of the customers will enter the system, as they are the ones who can achieve non-negative utility. Therefore, satisfies the following equation:
□
Proof of Corollary 1.
Let . We then obtain the following derivatives .
Thus . Therefore, when , we have , so the sign of depends on . If , then , and if , then . When . If , then , and if , then . □
Proof of Proposition 3.
If for any values of and , the condition holds, the optimal advertising level is , because all customers can enter the system. In this case, the service provider, in order to reduce advertising costs, does not offer any advertising. The optimal service rate is given by the equation:
By solving, we find the following:
where
In customer-intensive services, the smaller the service rate, the greater the customer utility. Therefore, the optimal service rate is . When , the profit function of the service provider is . We need to analyze the relationship between the probability of customers choosing to enter the system and . We know that
Therefore, let . Then, we have the partial derivatives and .
Thus, the sign of depends on the sign of . We can set and compute the following:
Thus, we can prove that as increases, is a unimodal function of , and the maximum value of is achieved when . Therefore, the optimal is .
Consequently, the profit function of the service provider can be rewritten as Since the relationship between the advertising level and the service rate is given by the following:
The profit function becomes the following:
Taking the first derivative of with respect to gives rise to the following:
We also find the second derivative . Thus, the optimal service rate satisfies the equation:
□
Proof of Corollaries 2 and 3.
Let . From this, we can compute the partial derivatives as follows:
Thus, we obtain the following conditions and . Furthermore, we know that the optimal advertising level satisfies the following:
Taking the derivatives of with respect to and , we obtain the following:
Thus, we have . Since the optimal profit at the optimal advertising and service rate levels is given by ,we can compute
Thus, we have .
Similarly, for , we have . Again, we have . □
Proof of Proposition 4.
In the duopoly market, we have the following equation:
Taking the derivative of the above function with respect to , we obtain
Rearranging, we obtain the following:
Thus, we obtain
The sign of depends on the term . Based on the proof of Proposition 3, we know that is a unimodal function of , achieving its maximum at . □
Proof of Proposition 5.
To analyze the equilibrium strategy in a symmetric equilibrium setting for service providers 1 and 2, we assume that the equilibrium market share satisfies:
Substituting this into the given equilibrium condition gives rise to the following:
□
Proof of Proposition 6.
The profit function for the service provider is given by the following:
Rewriting using its equilibrium form results in the following:
From the equilibrium advertising level equation, we obtain the following:
Solving for , we obtain
Substituting this into the profit function, we obtain
Taking the first and second derivatives of with respect to , we derive the optimal service rate , which satisfies the following:
Thus, the proposition is proven. □
Proof of Corollary 4.
The proof is similar to that of Corollaries 2 and 3 and is therefore omitted. □
Proof of Corollary 5.
Let there exist a function as follows:
The service rate satisfies the following equation:
Clearly, when , we obtain and ; when , we obtain and .
Define the function as follows:
Taking the derivative of with respect to , we obtain
Taking the derivative of with respect to , we obtain
Since , it follows that . Since , we obtain . Additionally, differentiating with respect to , we obtain
As , we must have , which implies . Moreover, we obtain . Since the profit function is given by the following:
Differentiating with respect to :. When , we must have , leading to the conclusion that . □
References
- Zhang, Y.; Wang, J.T. Optimal Price and Speed Decisions in Customer-intensive Service Systems with Boundedly Rational Customers. Oper. Res. Manag. Sci. 2023, 32, 85. (In Chinese) [Google Scholar]
- Zhan, W.T.; Jiang, M.H.; Li, C.Z. The service strategy of customer-intensive services under advertising effects. Kybernetes 2021, 50, 2453–2470. [Google Scholar] [CrossRef]
- Anand, K.S.; Veeraraghavan, S.; Pa, M.F. Quality-speed conundrum: Trade-offs in customer-intensive services. Manag. Sci. 2011, 57, 40–56. [Google Scholar] [CrossRef]
- Yoon, T.J.; Kim, T.T. The role of advertising in high-tech medical procedures: Evidence from robotic surgeries. J. Mark. 2024, 88, 97–115. [Google Scholar] [CrossRef]
- Harstad, R.M.; Selten, R. Bounded-rationality models: Tasks to become intellectually competitive. J. Econ. Lit. 2013, 51, 496–511. [Google Scholar] [CrossRef]
- Hassan, N.M.; Alamri, O.A. Estimation of Gumbel Distribution Based on Ordered Maximum Ranked Set Sampling with Unequal Samples. Axioms 2024, 13, 279. [Google Scholar] [CrossRef]
- Daud, H.; Suleiman, A.A.; Ishaq, A.I.; Alsadat, N.; Elgarhy, M.; Usman, A.; Wiratchotisatian, P.; Ubale, U.A.; Liping, Y. A new extension of the Gumbel distribution with biomedical data analysis. J. Radiat. Res. Appl. Sci. 2024, 17, 101055. [Google Scholar] [CrossRef]
- Liu, Y.; Wang, X.; Gilbert, S.; Lai, G. On the participation, competition and welfare at customer-intensive discretionary service platforms. Manuf. Serv. Oper. Manag. 2023, 25, 218–234. [Google Scholar] [CrossRef]
- Zhao, C.; Zhang, Y. Dynamic quality and pricing decisions in customer-intensive service systems with online reviews. Int. J. Prod. Res. 2019, 57, 5725–5748. [Google Scholar] [CrossRef]
- Li, C.Z.; Jiang, M.H.; Yuan, X.C. Managing price and service rate in customer-intensive services under social interactions. J. Bus. Econ. Manag. 2019, 20, 878–896. [Google Scholar] [CrossRef]
- Yu, J.; Fang, Y.; Zhong, Y.; Zhang, X.; Zhang, R. Pricing and quality strategies for an on-demand housekeeping platform with customer-intensive services. Transp. Res. Part E Logist. Transp. Rev. 2022, 164, 102760. [Google Scholar] [CrossRef]
- Fu, G.; Dong, L.; Zhan, W.; Jiang, M. Optimal Decision Making for Customer-Intensive Services Based on Queuing System Considering the Heterogeneity of Customer Advertising Perception. Systems 2022, 10, 261. [Google Scholar] [CrossRef]
- Jiang, X. Striking A Balance: Managing Customer-Intensive Services in Social Interaction Contexts. Int. Interdiscip. Bus. Econ. Adv. J. 2024, 5, 01–07. [Google Scholar]
- Zhan, W.; Jiang, M.; Wang, X. The optimal capacity decision of the catering merchant in omnichannel–service, production and delivery capacity. Kybernetes 2023, 53, 1958–1986. [Google Scholar] [CrossRef]
- Niranjan, S.P.; Latha, S.D.; Vlase, S.; Scutaru, M.L. Analysis of Bulk Queueing Model with Load Balancing and Vacation. Axioms 2025, 14, 18. [Google Scholar] [CrossRef]
- Lou, C. Social media influencers and followers: Theorization of a trans-parasocial relation and explication of its implications for influencer advertising. J. Advert. 2022, 51, 4–21. [Google Scholar] [CrossRef]
- Shah, D.; Murthi, B.P.S. Marketing in a data-driven digital world: Implications for the role and scope of marketing. J. Bus. Res. 2021, 125, 772–779. [Google Scholar] [CrossRef]
- De Cicco, R.; Iacobucci, S.; Pagliaro, S. The effect of influencer–product fit on advertising recognition and the role of an enhanced disclosure in increasing sponsorship transparency. Int. J. Advert. 2021, 40, 733–759. [Google Scholar] [CrossRef]
- Hanaysha, J.R.; Al Shaikh, M.E.; Alzoubi, H.M. Importance of marketing mix elements in determining consumer purchase decision in the retail market. Int. J. Serv. Sci. Manag. Eng. Technol. 2021, 12, 56–72. [Google Scholar] [CrossRef]
- Sigue, S.; Gromova, E. The role of advertising in the choice between reselling and agency selling. Int. Trans. Oper. Res. 2025, 32, 2311–2335. [Google Scholar] [CrossRef]
- Ariffin, S.; Manan, H.A.; Maknu, T.S.R.; Zakaria, F.N. Effects of social media advertisements on intention to purchase health and beauty products. J. Int. Bus. Econ. Entrep. 2020, 5, 59. [Google Scholar]
- Faerber, A.E.; Kreling, D.H. Content analysis of false and misleading claims in television advertising for prescription and nonprescription drugs. J. Gen. Intern. Med. 2014, 29, 110–118. [Google Scholar] [CrossRef]
- Zhang, L.; Zhou, J.; Zhao, Z.; Jing, Z. Treatment false advertisement in China: A tragedy. Lancet 2016, 387, 2505–2506. [Google Scholar] [CrossRef]
- Tapanainen, T.; Dao, T.K.; Nguyen, T.T.H. Impacts of online word-of-mouth and personalities on intention to choose a destination. Comput. Hum. Behav. 2021, 116, 106656. [Google Scholar] [CrossRef]
- Li, X.; Guo, P.; Lian, Z. Quality-speed competition in customer-intensive services with boundedly rational customers. Prod. Oper. Manag. 2016, 25, 1885–1901. [Google Scholar] [CrossRef]
- Zhang, Y.; Wang, J. Quality-speed trade-offs in customer-intensive services with boundedly rational customers and retrials. Comput. Ind. Eng. 2022, 167, 107983. [Google Scholar] [CrossRef]
- Dai, T.; Yu, M.; Wu, Y. When to announce the queueing information for bounded rationality customers: A discrete-event–based simulation model. Simulation 2024, 100, 997–1017. [Google Scholar] [CrossRef]
- Muthaffar, A.; Vilches-Montero, S. Empowering retailers: A bounded rationality perspective to enhancing omnichannel journey satisfaction. J. Retail. Consum. Serv. 2023, 75, 103536. [Google Scholar] [CrossRef]
- Luo, S.; Fang, S.C.; Zhang, J.; King, R.E. Price competition and cost efficiency facing buyer’s bounded rationality. Int. J. Prod. Econ. 2023, 266, 109062. [Google Scholar] [CrossRef]
- Zhan, W.; Zhang, S.; Zhao, Y.; Li, W.; Huang, X.; Jiang, M. Research on the optimal decision-making of experiential service providers based on advertising effects. Ind. Eng. Manag. 2024, 29, 54–66. (In Chinese) [Google Scholar]
- McKelvey, R.D.; Palfrey, T.R. Quantal response equilibria for normal form games. Games Econ. Behav. 1995, 10, 6–38. [Google Scholar] [CrossRef]
- Zhan, W.; Liu, J.; Yuan, X.; Huang, X.; Jiang, M. The optimal decision of service provider considering extra waiting area value-added services–pooled or dedicated? RAIRO-Oper. Res. 2024, 58, 4307–4340. [Google Scholar]
- Huang, T.; Allon, G.; Bassamboo, A. Bounded rationality in service systems. Manuf. Serv. Oper. Manag. 2013, 15, 263–279. [Google Scholar] [CrossRef]

Disclaimer/Publisher’s Note: The statements, opinions and data contained in all publications are solely those of the individual author(s) and contributor(s) and not of MDPI and/or the editor(s). MDPI and/or the editor(s) disclaim responsibility for any injury to people or property resulting from any ideas, methods, instructions or products referred to in the content. |
© 2025 by the authors. Licensee MDPI, Basel, Switzerland. This article is an open access article distributed under the terms and conditions of the Creative Commons Attribution (CC BY) license (https://creativecommons.org/licenses/by/4.0/).