Article

Investigation on Unsteady Cavitation Flow and Excited Pressure Fluctuations in Regulating Valve

1
School of Mechatronic Engineering, China University of Mining and Technology, Xuzhou 221116, China
2
School of Electrical and Control Engineering, Xuzhou Institute of Technology, Xuzhou 221018, China
*
Author to whom correspondence should be addressed.
Machines 2022, 10(1), 32; https://doi.org/10.3390/machines10010032
Submission received: 17 November 2021 / Revised: 28 December 2021 / Accepted: 30 December 2021 / Published: 2 January 2022
(This article belongs to the Special Issue Advanced Control of Industrial Electro-Hydraulic Systems)

Abstract

:
A multi-field synchronous measurement system for the cavitation flow in a regulating valve was established. The system combines a high-speed full-flow field display system with a pressure measurement system to realize the simultaneous acquisition of cavitation shapes and pressure pulsations. Cavitation flow occurs near the throttle orifice, which is obviously a quasi-periodic behavior. The unsteady cavitation flow mainly includes three stages: the growth of the attached cavity, the fracture and shedding of the attached cavity and the growth and collapse of the free cavity. The time evolution of the cavitation behaviors is highly related with excited pressure fluctuations. With the increasing attached cavity area, the corresponding pressure in the flow field decreases slowly. When the attached cavity falls off and develops downstream, the cavity area decreases gradually, and the pressure increases gradually. When the free cavity shrinks and collapses, the pressure in the flow field reaches the peak value. The pressure pulsation and the change of cavity area have the same dominant frequency, around 2000 Hz, at the monitoring point in the upstream, throat and expansion monitoring points. Furthermore, with increasing inlet pressure, the mean and variance values of cavitation area become larger, and the excited pressure fluctuation at each measuring point becomes more intense. The mean value of pulsating pressure at the throat gradually increases, while the pressure in the expansion section presents a downward trend. The variance of pressure pulsation and the maximum pressure also increase gradually with the increase in inlet pressure. The change of cavitation area and the pressure pulsation in the regulating valve complement each other. The results in this paper could provide experimental guidance on optimizing the structure of the valve, inhibiting cavitation occurrence and prolonging the service life of the valve.

1. Introduction

Coal liquefaction is an advanced clean coal technology that converts solid coal into liquid fuel, chemical raw materials and products by chemical processing. Coal liquefaction technology is the only recent method that allows the conversion of coal into clean energy. The regulating valve is one of the core parts in coal liquefaction project, which mainly relies on imports. In current systems, the service life of the regulating valve ranges from one month to half a year, which seriously affects the stable operation of coal liquefaction project [1,2,3]. Due to the complex flow channel structure, cavitation occurs more easily at the orifice and downstream, which may cause serious damage to the regulating valve [2,4]. Therefore, it is necessary to research the cavitation flow and induced pressure pulsation in the regulating valve and improve its service life, regulating the precision and working stability of the system.
The flow field in the valve is directly related to the structural optimal design of the regulating valve and also restricts the development of fluid mechanics. Oshima [5] investigated cavitation in a half-cut test hydraulic poppet valve and indicated that cavitation bubble affects the flow rate, noise level and pressure distributions. Zhang [6] numerically studied the quasi-steady and unsteady cavitating flows with the CFD (computational fluid dynamics) approach. Two cavitation models, the full cavitation model (FCM) and dynamic cavitation model (DCM), were used to calculate the cavitating flow. The results show a good ability to simulate the transient characteristics of the highly unsteady cavitation cloud flow. Jazi [7] studied the relationship between the square root of the pressure difference and the flow rate, and cavitation was detected from initiation to full development by analyzing the changes in the high-frequency signal while the percentage of openings below 12%. Min [4] pointed out that the cavitation is affected by the pressure difference at the port or vibration amplitude of the poppet valve. Liang [8] analyzed the unsteady cavitation process inside a water hydraulic poppet valve numerically, and revealed that the unsteady cavitation process was a periodically changing process. Domnick [9] simulated the unsteady flow field in the valve using various turbulence models, and the pressure field acting on the valve plug was also discussed. Stutz [10] used the X-ray attenuation device to study the cavitation phenomenon, and the results show that the size of the cavitation area has an effect on the frequency of cavitation cloud shedding. The vortex-inducing cavitation in the control valve greatly influences the flow capacity of the hydraulic system and may cause damage to the mechanical components’ surfaces [11]. Thus, understanding the cavitation flow is important for the optimal structural design of the valve.
The complex pressure fluctuation phenomenon caused by the periodic change of cavitation flow is another focal point [12]. Petkovsek [13] detected shock waves inside the cavitating flow and pointed out that shock wave front velocities and local pressure waves caused by cloud collapse could be higher than 700 m/s and 5 MPa, respectively. Choi [14] investigated the frequency spectrum characteristics of pressure fluctuations in the process of cavitation cloud shedding and collapse. Brinkhorst [15] revealed that the three-dimensional flow behavior of the cavity closure region may prevent the uniform flow of the reentry jet, resulting in the local and circumferential narrowing of the reentry jet, but the influence on the whole cavity is small. Chen [16] captured the development of cavitation by using a high-speed camera, and the pressure fluctuation process during cavitation evolution was also analyzed. They pointed out that the quasi-periodic pressure fluctuations in sheet/cloud cavitation was highly related with the cavitation behaviors. Reute [17] used multi-field synchronous measurement technology to simultaneously observe the velocity of the flow field and the shape of the cavity during the development of a single cavity and found that the wall effect has a very strong influence on the collapse process of the cavity. Leroux [18] found that the shock wave produced by the collapse of the large-scale cavity cloud has a significant influence on the growth of the residual cavity. Stanley [19] investigated the different velocities of wave, a traveling-wave-style deformation of the cavity interface and a translational pulse, driving the periodic cloud shedding. Foeth [20] found that the collision of the side-entrant flow pinches off the sheet cavity, resulting in vapor clouds shedding. Smith [21] found that the shedding and collapse of the attachment cavity are mainly caused by the instability of the cavitation flow, the formation of the re-clamping jet, the propagation of shock waves and the complex coupling mechanism. Ganesh [22] identified two cavity shedding mechanisms: one is the re-entrant flow in the cavity closure and the other is bubbly shock propagation. Kambayashi [23] evaluated the pulsating flow rates numerically based on the unsteady energy equation for incompressible flows, experimentally using a hot wire anemometer. Long [24] pointed out that the cavity evolution around the sphere is a quasi-periodic process with growing and contracting cavities. Sayyaadi [25] obtained the fluctuation vectors of the cavitation length combination with the light intensity comparison technique and high-speed photography. The fluctuation patterns at various cavitation flow regimes were simulated using sinusoidal polynomials.
However, there are few studies involving the pressure pulsation during the development of unstable cavitation flow in the regulating valve, and there is also a lack of correspondence with the development of pressure pulsation and the evolution of the cavitation cloud. The relationship between the cavitation evolution and excited pressure fluctuation is important to the valve structure optimization design. In this paper, the synchronous acquisition system for unsteady cavitation flow field and pressure pulsation signals in the regulating valve was designed, and the characteristics of cavitation evolution and pressure pulsation in both the time and frequency domain were analyzed. The results are conducive to an in-depth understanding of the cavitation flow in the regulating valve and provide reference information for shock and noise reduction and control accuracy improvement of the valve.

2. Experimental Setup

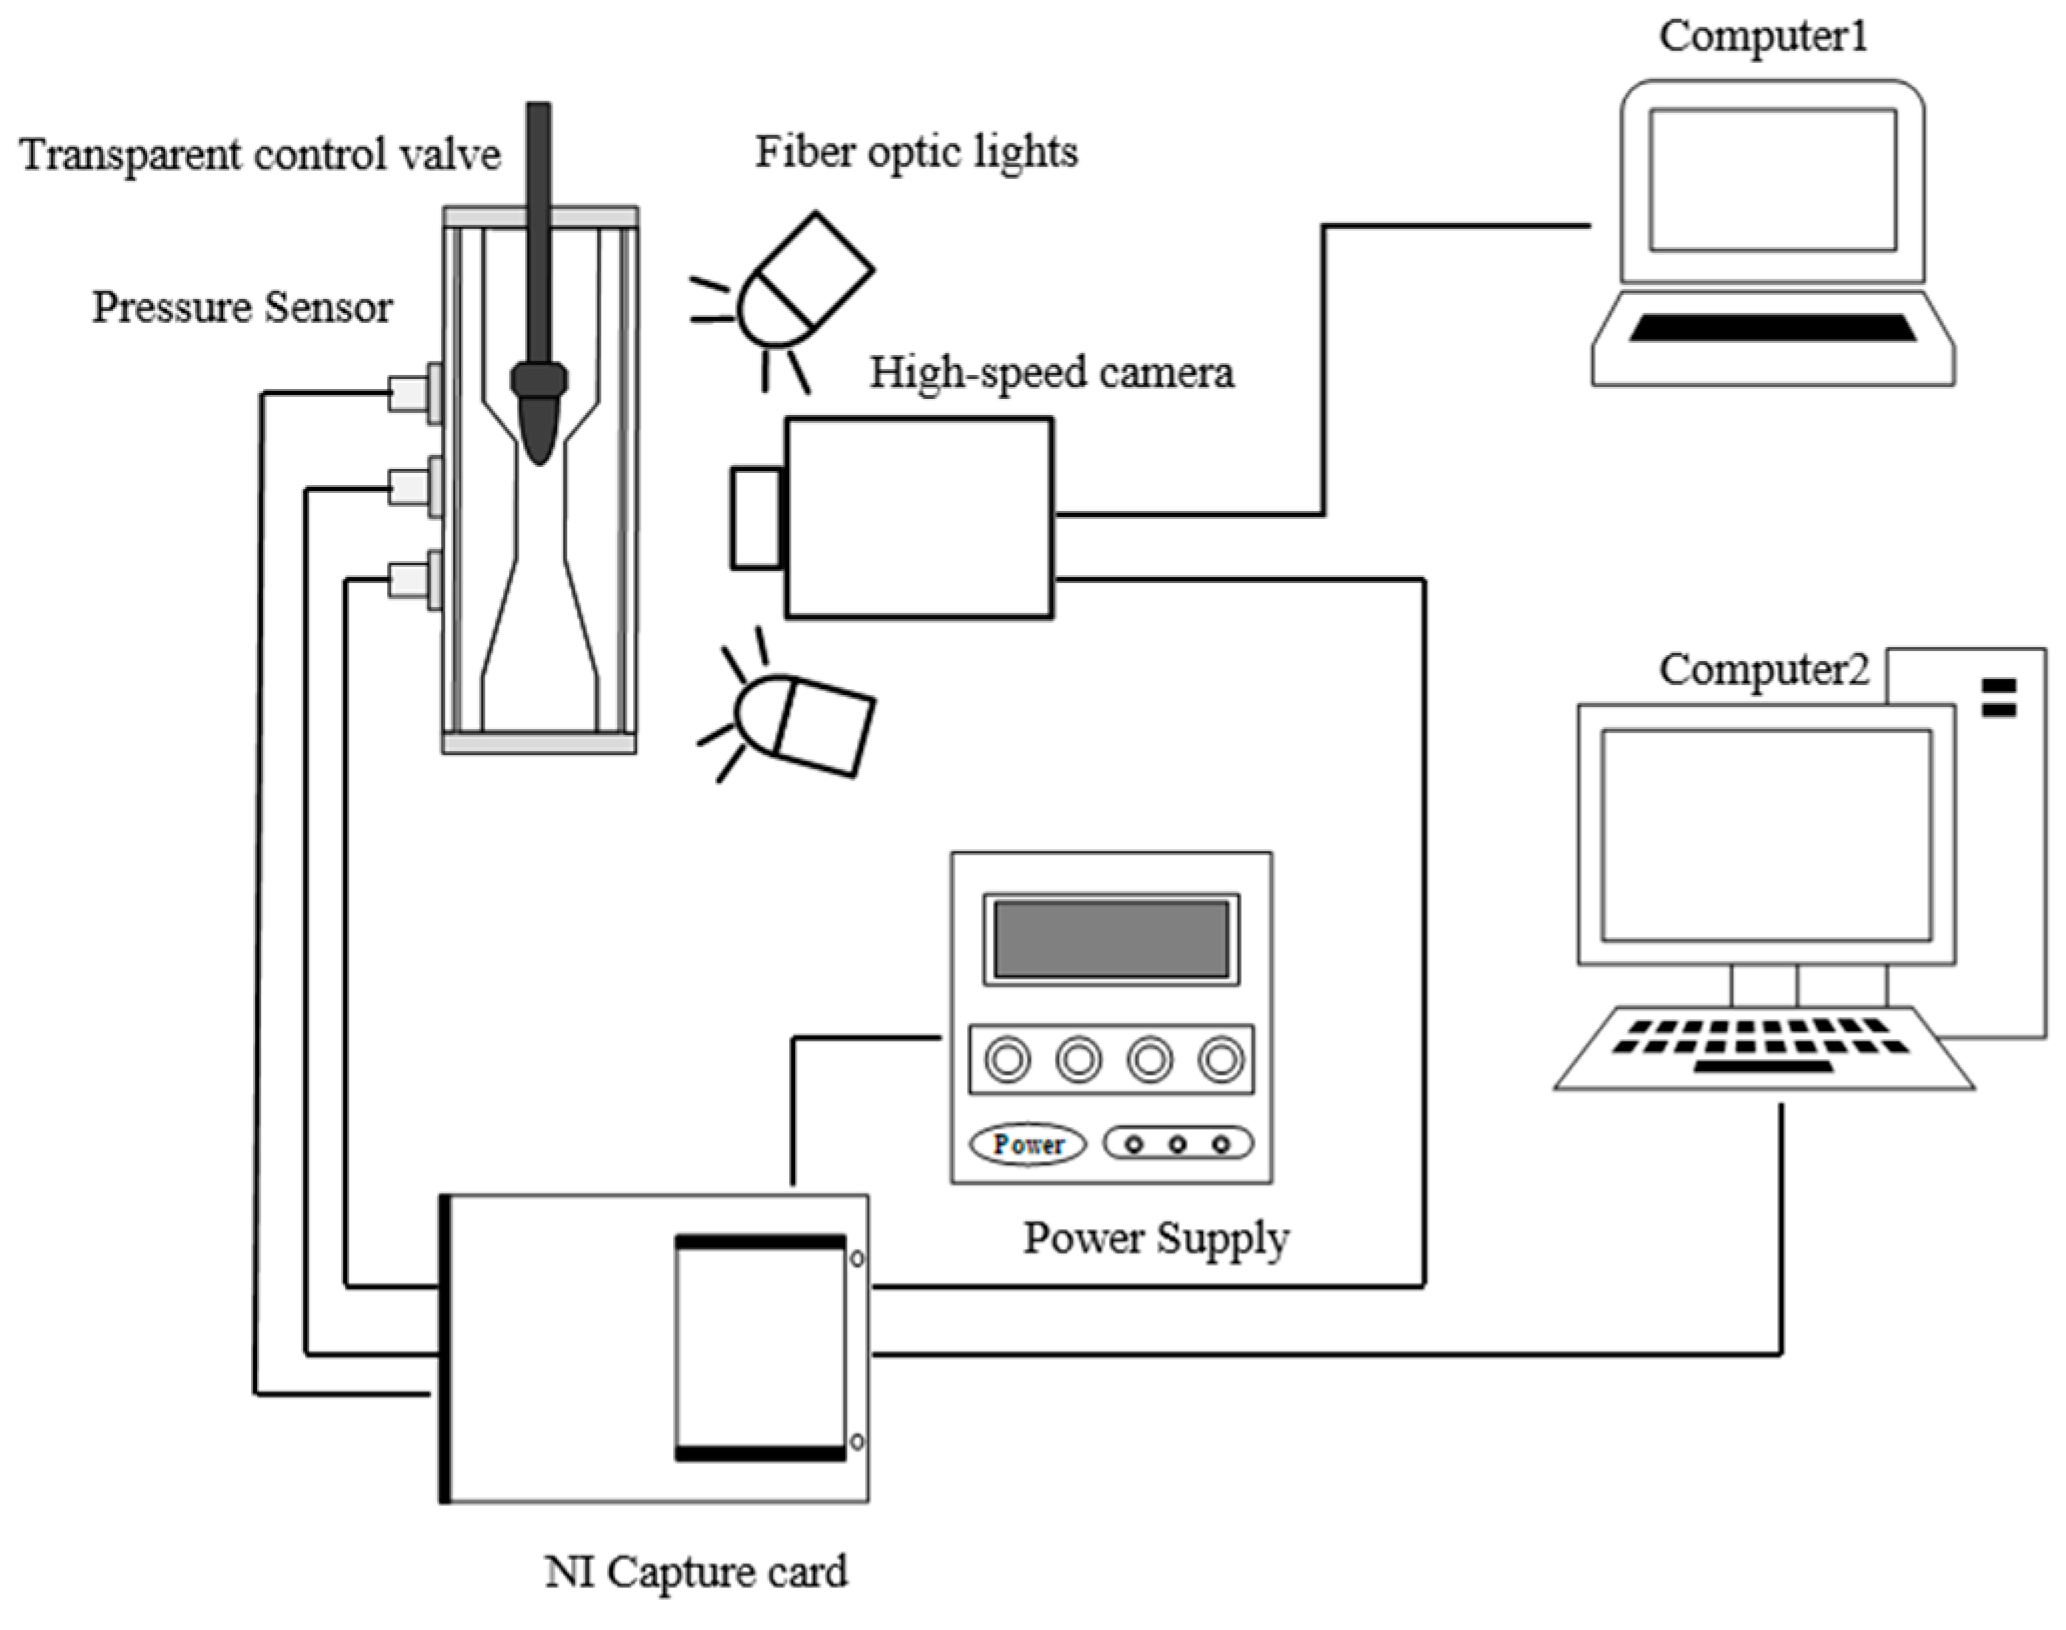
2.1. Hydraulic System

Figure 1a is a schematic diagram of the hydraulic system, which mainly includes a hydraulic pump, an accumulator, a one-way valve, a relief valve, a back pressure valve, a flow meter, a transparent experimental valve, two pressure gauges, an air cooler, a console, etc. The plunger pump is used to supply oil to the system, which can provide a maximum pressure of 31.5 MPa. The accumulator absorbs the pressure pulsation in the hydraulic system, and the air cooler is used to ensure a constant temperature. The console is used for real-time monitoring of oil temperature, flow rate and inlet and outlet pressure. In order to observe the unsteady cavitation flow in the valve, a transparent regulating valve made of polymethyl methacrylate is used for good visualization observation, whose inlet and outlet pressure is regulated by a relief valve and a back pressure valve, respectively. The flow channel of this transparent experimental valve was designed according to the actual regulating valve in coal liquefaction, and its size was scaled down to one-tenth of the original geometry [26]. Figure 1b is a schematic diagram of the internal structure of the transparent regulating valve. The blue arrows represent the flow direction of the oil. In order to monitor the pressure pulse in the flow channel, three pressure monitoring points are selected on the inner wall of the valve. Pressure sensors are located at the upstream, throat and expansion section to measure the pressure pulsation in real time.
No. 46 antiwear hydraulic oil is used in our system, whose vapor pressure is 400 Pa. Although there is a degassing device in the oil tank, the pump runs for a long time in order to remove the dissolved gases at the beginning of the experiment. The evolution of the cavitation cloud and pressure pulsation are collected in a steady working condition.

2.2. A Synchronous Measurement System

Figure 2 is a schematic diagram of the multi-field synchronous measurement system. There are two parts in this system: one is a high-speed flow field observing system and the other is a dynamic pressure measurement system. The high-speed flow observing system mainly consists of a high-speed camera, two optical fiber lamps, a transparent regulate valve and the corresponding data acquisition system. The high-speed camera (Phantom VEO-710L) is used to observe the unsteady cavitation cloud in the flow channel, and the two optical fiber lights (LA-100USW) are used as for illumination. This high-speed camera operates at 20,000 fps. The dynamic pressure measurement system mainly includes three pressure transmitters with high frequency and sensitivity, a multi-channel synchronous data acquisition card, a stabilized DC power supply device and the data acquisition system. The type of pressure sensor, which is produced by AIER, is AE-S-G-H3-M1-J2-P1-V2-1.Its measuring range is 0–10 MPa, the input voltage is 0–10 VDC, and the measurement frequency response is 0–200 kHz. The time synchronization of the high-speed flow field observing system and the dynamic pressure measurement system is guaranteed by a self-designed multi-function synchronization trigger system based on LabVIEW.
Figure 3 shows the operation flow chart of this experiment, which presents the hydraulic system, the high-speed flow field observing system and the dynamic pressure measurement system one by one. Then, the pressure sampling frequency is set to 20 kHz, the sampling time is set to 1 s, and the delay triggering time is set to 500 ms. After the inlet and outlet pressure, the opening of the valve is adjusted, and the experimental system works in steady working condition, and the pressure acquisition signal is gathered by the LabVIEW. The NI capture card gives a high-level signal to the camera, and the camera starts to capture the cavitation flow image. After the collection is finished, the data is stored, and the results are analyzed.

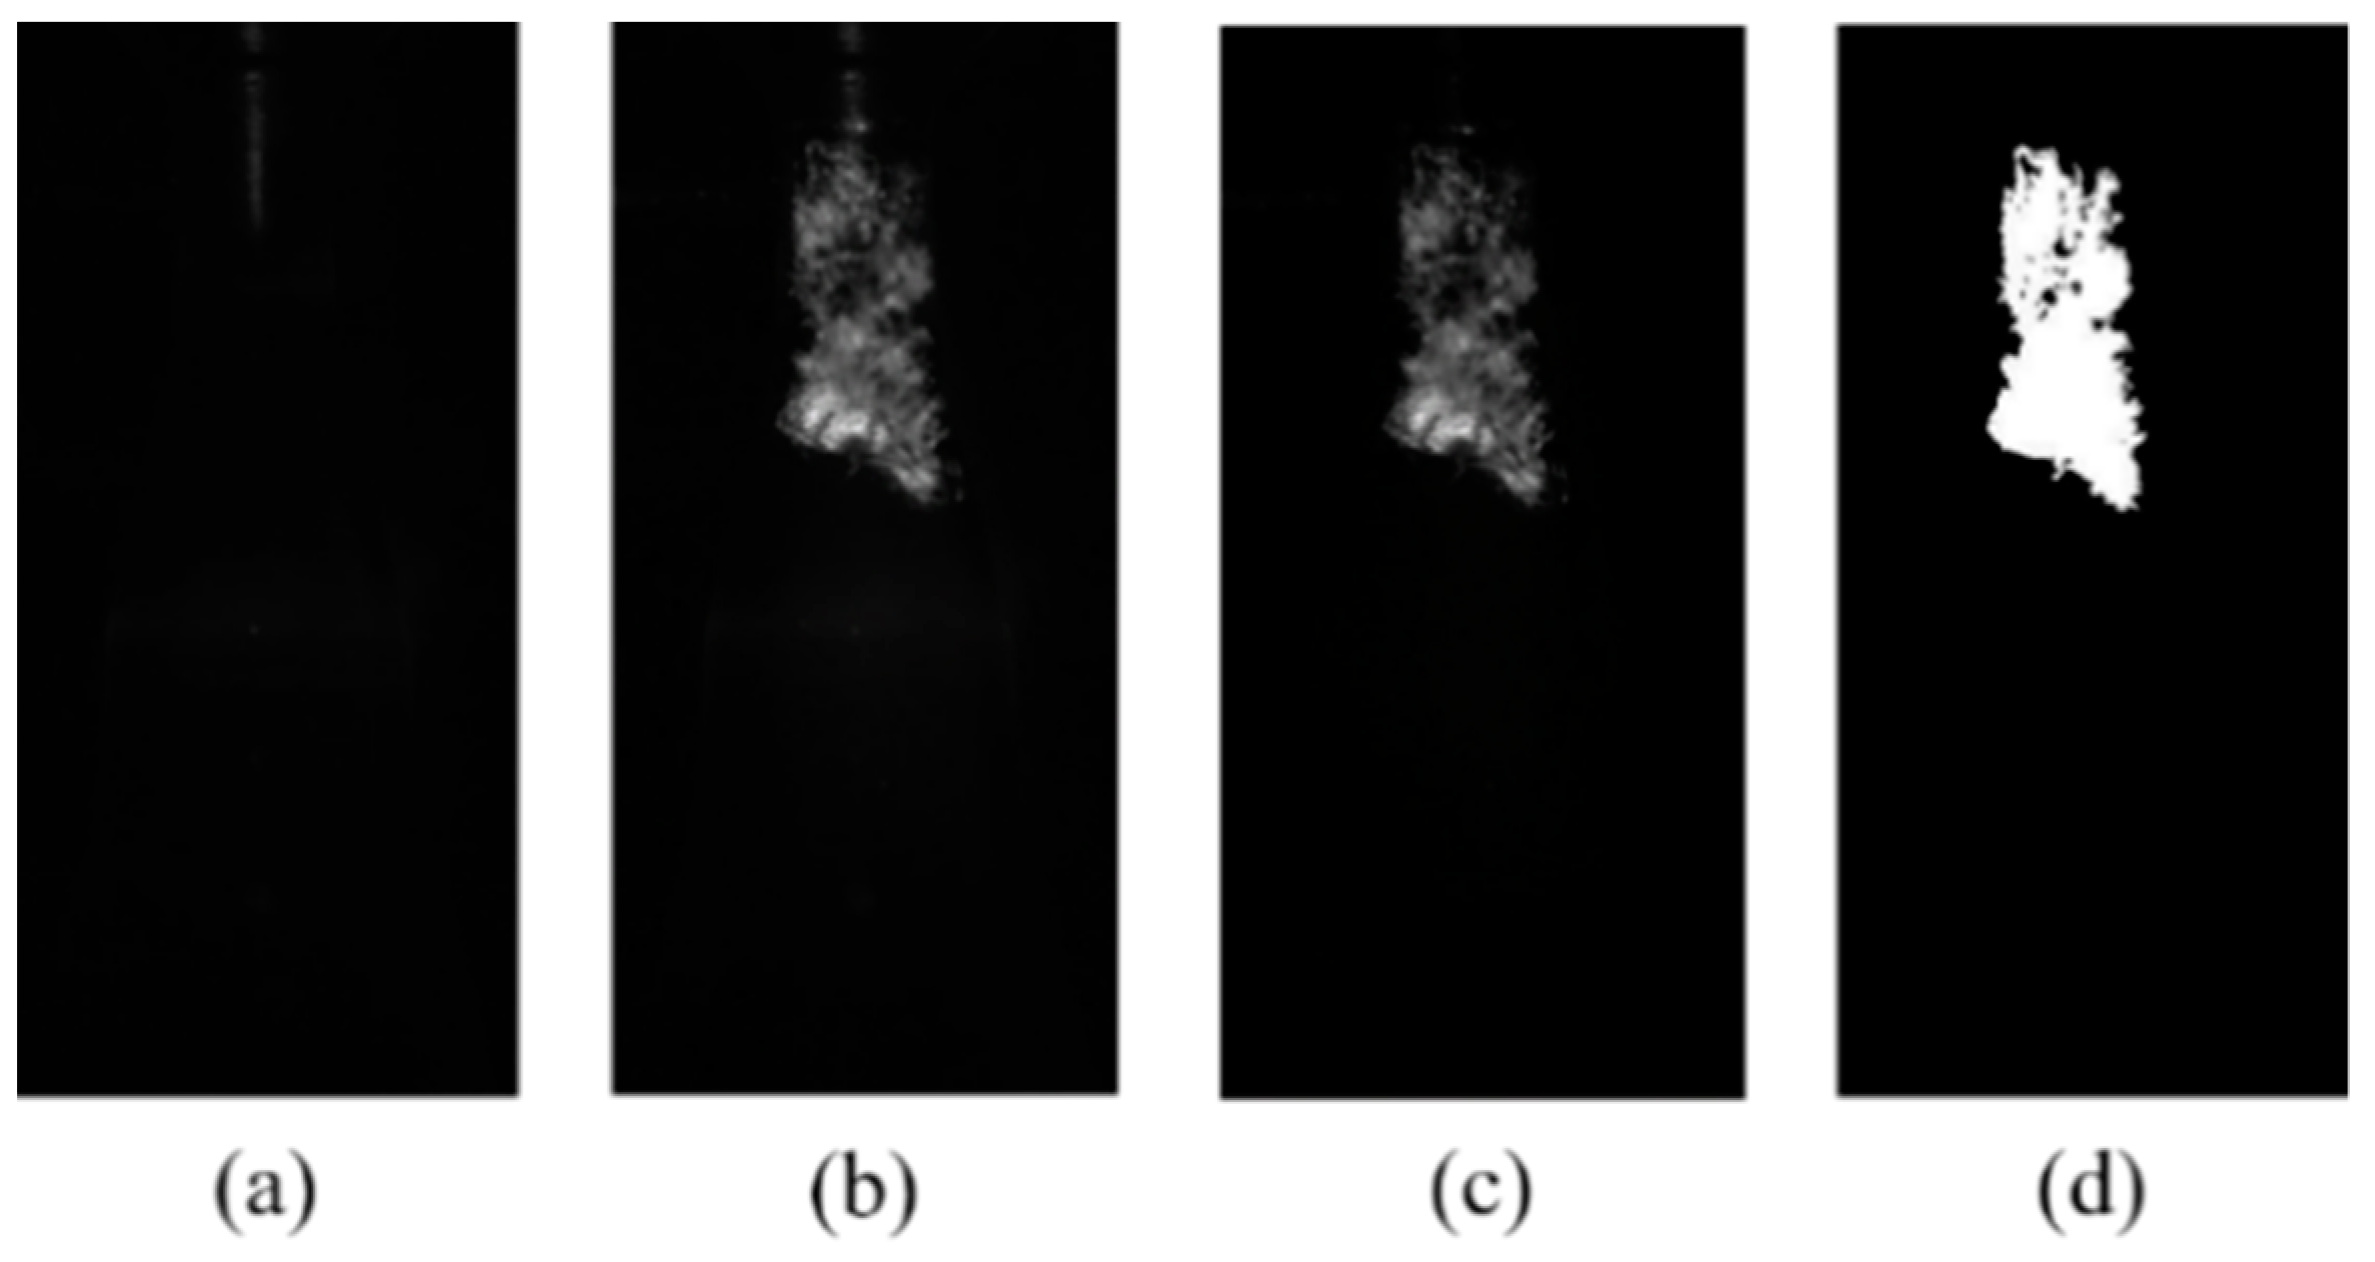
2.3. Typical Results

Figure 4 shows the extraction process of the cavity area. Figure 4a is an original image collected by the high-speed camera without a cavitation bubble. Figure 4b is the original image collected by the high-speed camera with a cavitation bubble. The gray value of Figure 4a is calculated to form matrix A, while the gray value of Figure 4b is matrix B. In order to eliminate the influence of the valve wall on the analysis of cavity area and cavity evolution, matrix C is defined to matrix B minus matrix A, which is shown in Figure 4c. Then, the gray value of matrix C is calculated to form matrix D, whose binaries image is shown in Figure 4d. The white area in Figure 4d is the area where cavitation bubble appears; the number of pixels is calculated as the cavitation area S.

3. Results and Discussion

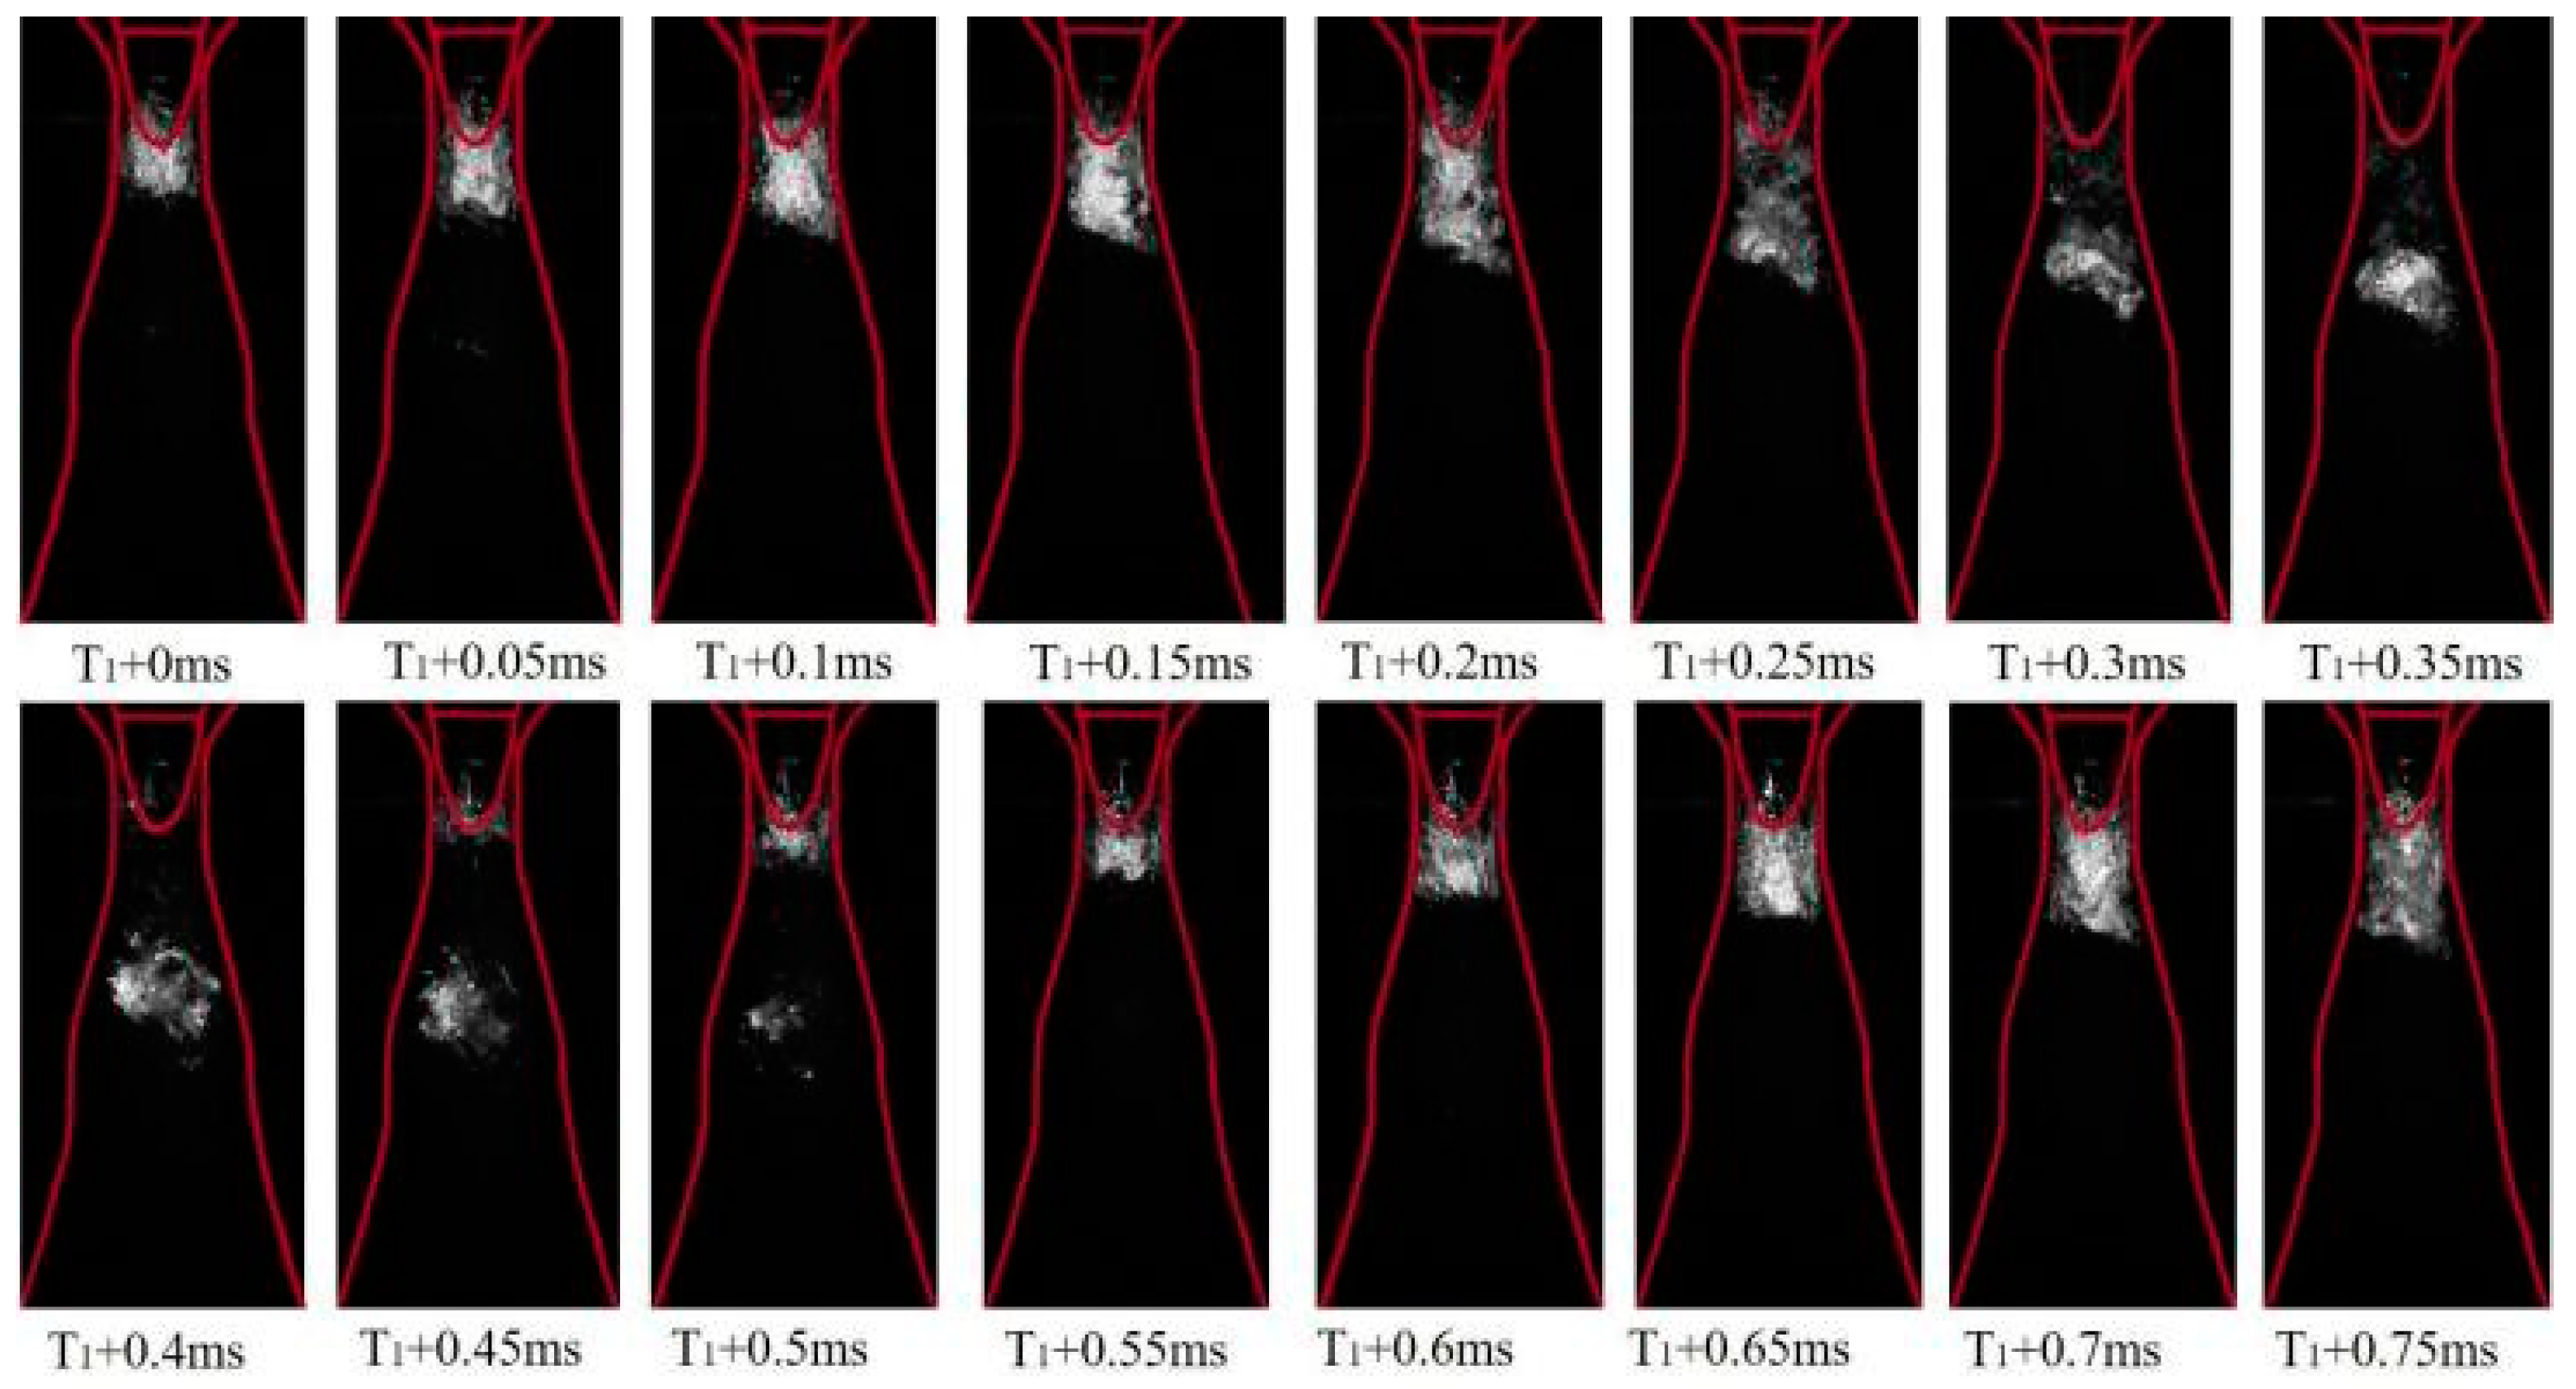
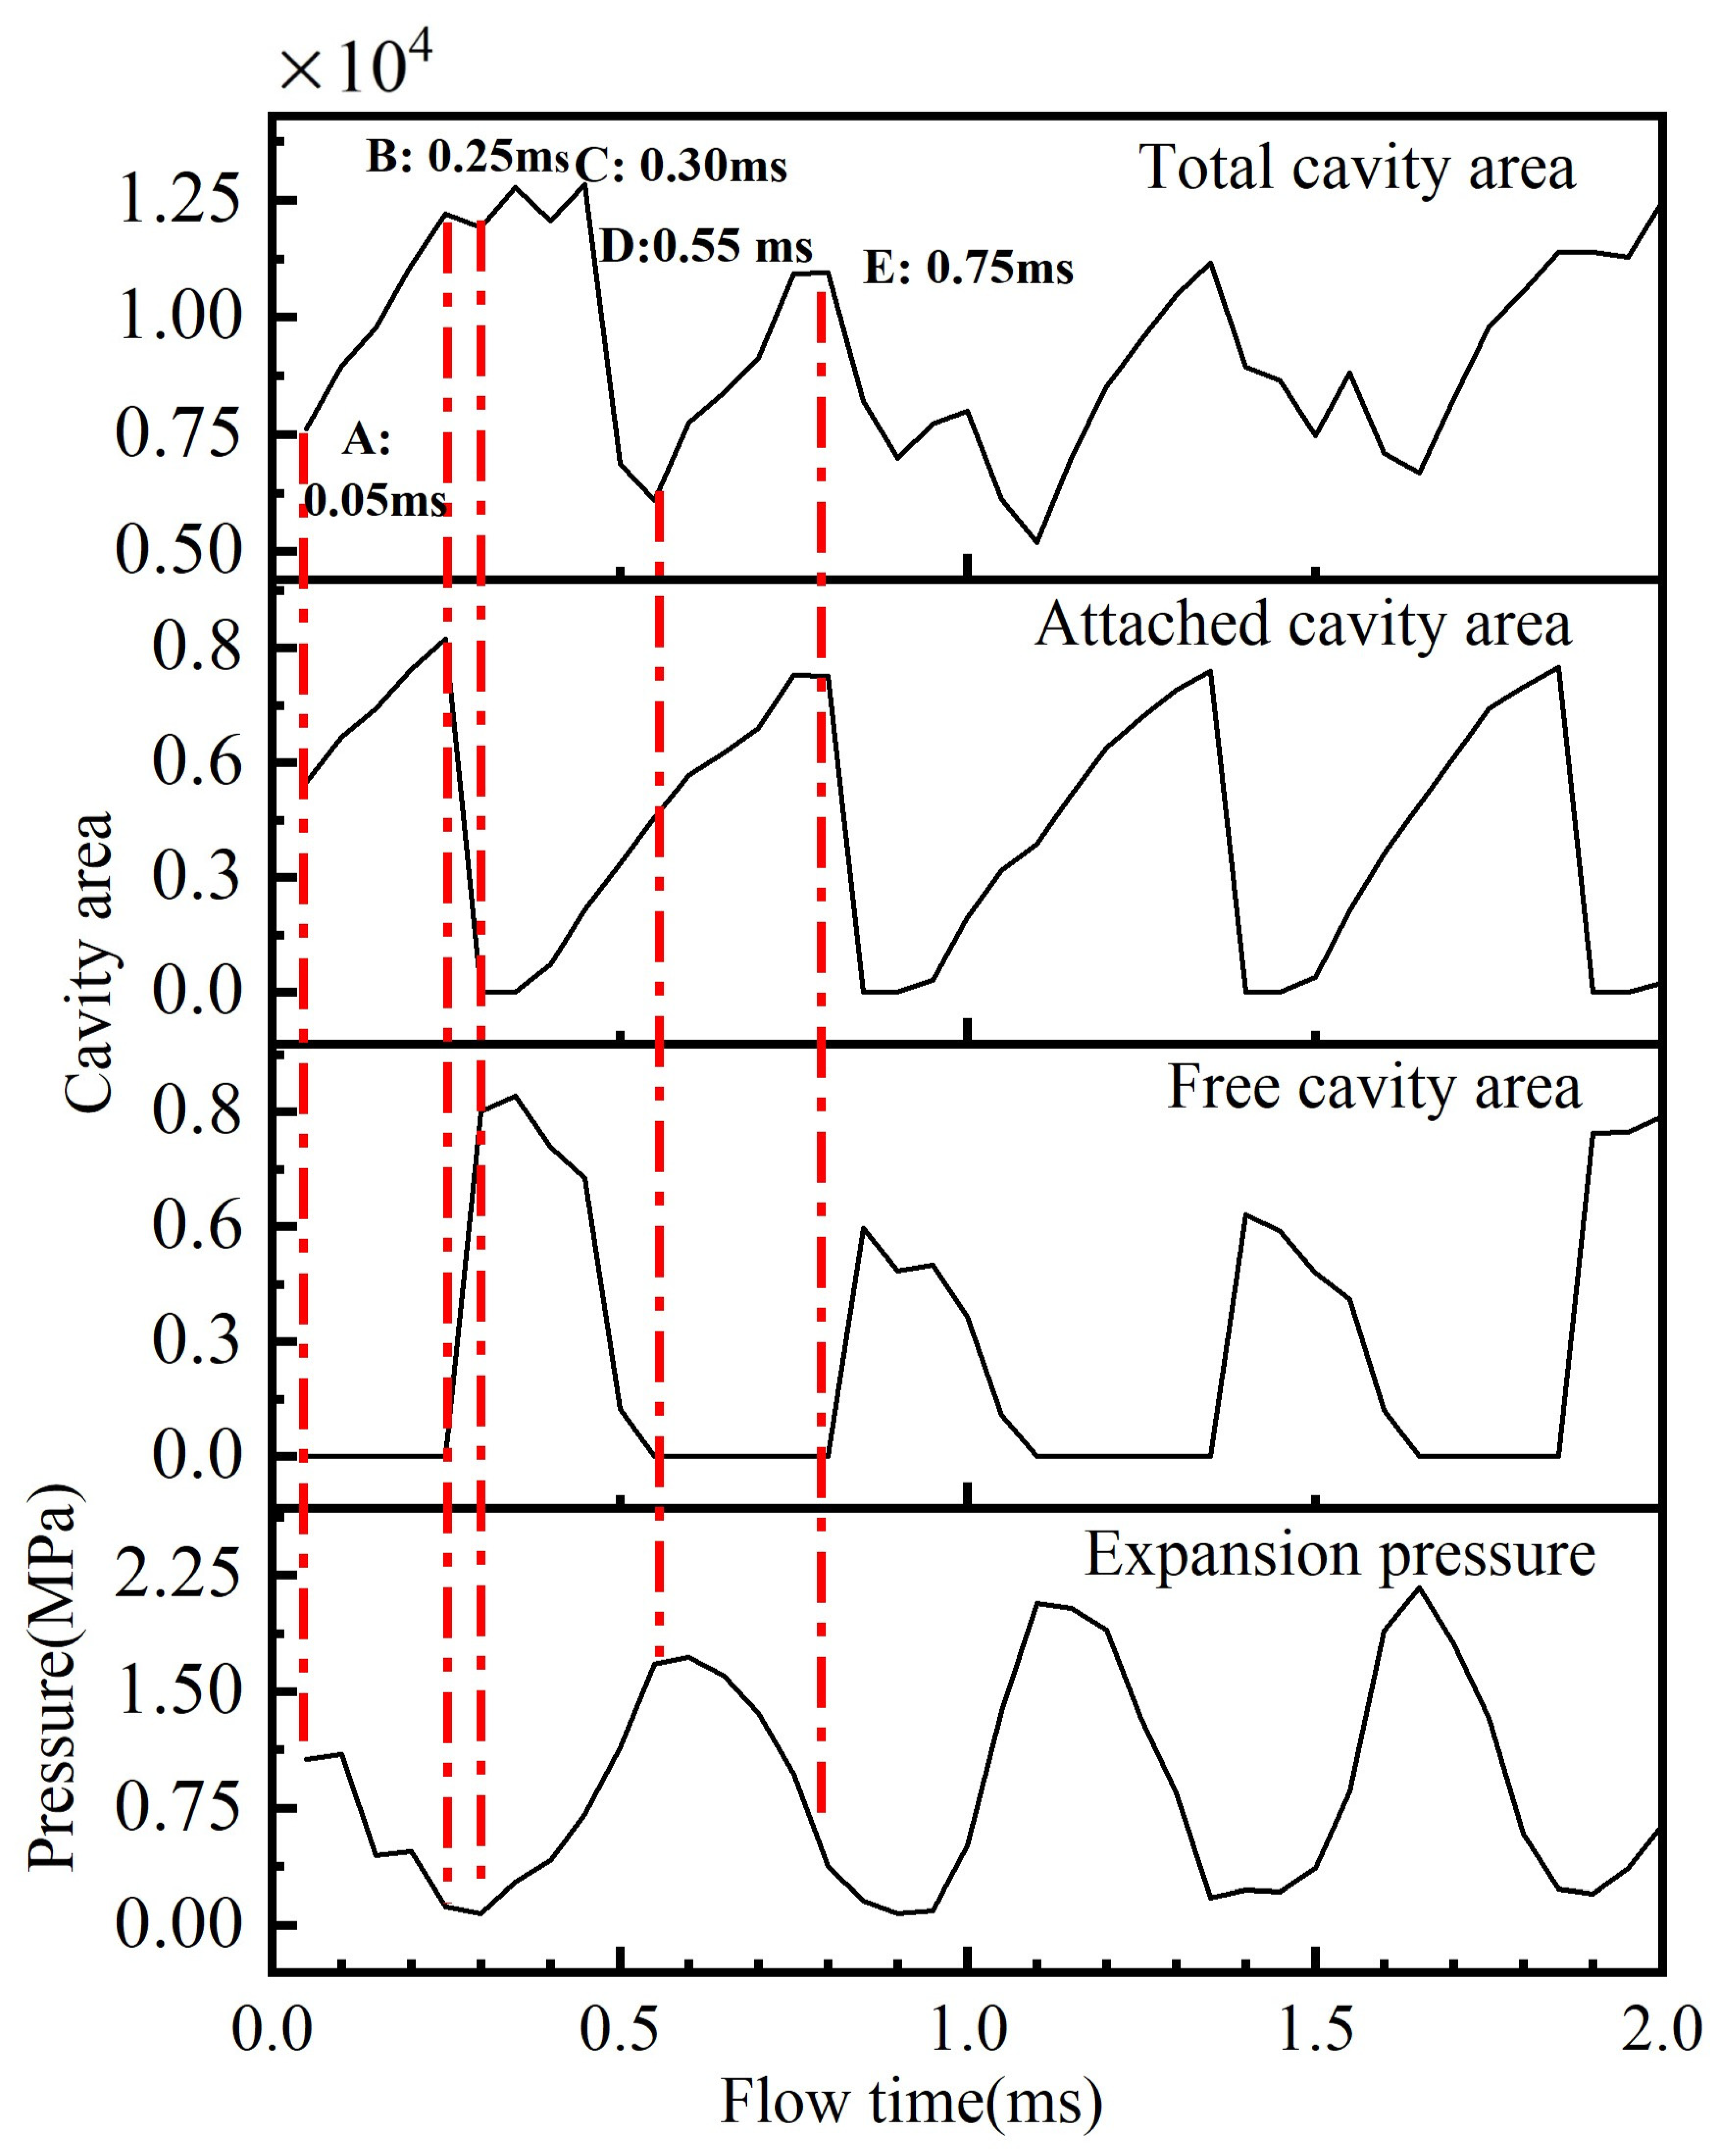
3.1. Time Evolution of Cavitation Behaviors and Its Excited Pressure Fluctuation

Figure 5 shows the quasi-periodic behavior of cavitation flow when the inlet pressure is 4.5 MPa, the outlet pressure is 1.0 MPa and the opening is 30%. The bright white area is the above-mentioned cavitation flow, while the dark area is the liquid phase and the valve wall. In order to distinguish cavitation flow more easily, the contour line of the flow channel in the regulating valve is drawn by the red line. The mechanism causing the periodic shedding was a combination of a traveling-wave deformation of the cavity interface and a translational pulse [19]. The cavitation cloud occurs near the throttle orifice, which is obviously a quasi-periodic behavior. The unsteady cavitation flow mainly includes three stages: the growth of the attached cavity, the fracture and shedding of the attached cavity and the growth and collapse of the free cavity. This classification of cavitation flow is consistent with the reports of Chen et al. [16]. Due to the throttling effect of the orifice, the flow rate of the oil at the orifice increases, and the pressure decreases. While the pressure is lower than the saturated vapor pressure, the cavitation bubble appears at the orifice. It was found that between T1 and T1 + 0.25 ms, the attached cavity gradually develops downstream, and the throat is always filled with attached cavitation bubbles. The width of the attached cavity is almost the same during this stage, but the length of the attached cavity grows. This is the growth of the attached cavity stage. At T1 + 0.3 ms, the attached cavities obviously fall off and break up into dissociated cavities. Between T1 + 0.3 ms and T1 + 0.55 ms, there is a firstly small increase in the free cavity area, and then the free cavity shrinks until it has completely collapsed and disappears because of the higher pressure downstream. This is called the growth and collapse of the free cavity stage. Between T1 + 0.35 ms and T1 + 0.7 ms, a new attached cavity is generated and continues to grow. Generally, the time evolution of the attached cavity and the free cavity present a quasi-periodic behavior; the lifetime is about 0.5 ms, and the corresponding area change frequency is 2000 Hz. As discussed in Refs. [8,27], considering the axisymmetric structure of the valve, the computational domain could be simplified to a two-dimensional axisymmetric geometric model, so a cavitation area in our valve is same as the area measured from another direction. The experimental results in this paper are similar to the numerical simulation in Ref [28].
Figure 6 is the extractive area of the cavity flow in Figure 5 and its excited pressure fluctuations obtained experimentally at the expansion section. It can be seen that the overall change of cavitation area presents an obvious periodicity, although there is a slight difference between individuals. Between T1 and T1 + 0.25 ms, the width of the attached cavity is almost the same, and the length is continuously increasing. The area of the attached cavity increases, but the area of the free cavity is zero. Between T1 + 0.3 ms and T1 + 0.55 ms, the attached cavity falls off and breaks into free cavity, and then the free cavity continues to collapse. During this time, newly attached cavity is generated and continues to grow. The change process of cavity area in Figure 6 corresponds with the shape evolution in Figure 5. When the area of the free cavity shrinks, the pressure at expansion section in the flow channel increases. The larger the shrinkage speed of cavitation area, the higher increasing rate of pressure. At the time all the free cavity collapses completely, the pressure at the throat increases and reaches a peak. After that, the attached cavity grows slowly, and the pressure at expansion section also decreases gradually and finally approaches the saturated vapor pressure. When the attached cavity grows to the maximum shape, the pressure at the expansion section still decreases. The evolution of cavitation behaviors is closely related to its excited pressure fluctuation, and the variation of the cavitation area is the main reasons for the pressure fluctuation.
Figure 7 shows the power spectral density distribution of the pressure pulsation and the change of the cavitation area at these three pressure monitoring points. At the upstream section, the frequency of pressure pulsation is mainly concentrated at 175 Hz, which is the pressure pulsation frequency when the pump works. It should be noted that there is also small power spectral density located at 2000 Hz because of high-pressure shocks downstream. At the throat section, the dominant frequency of pressure pulsation is apparently near 2000 Hz, but the valve of dimensionless power spectral density is small. At the expansion section, the frequency of pressure pulsation is also near 2000 Hz. The cavitation area in the frequency domain is located from 700 Hz to 4000 Hz, and its dominant frequency is near 2000 Hz. The power spectral density distribution of pressure pulsation at upstream section, throat section and expansion section all have the same dominant frequency. The power spectral density at the upstream section is mainly affected by the pressure pulsation from the pump. The power spectral density near 2000 Hz at the expansion section is much higher than it is at the throat section. This is due to a large-scale free cavity collapsing near the expansion section, which excites serious pressure fluctuations. At the same time, the throat section is covered by the attached cavity for a long time, so slight pressure fluctuations are measured. Furthermore, the change of cavitation area in the frequency domain has the same main frequency with the pressure pulsation at the throat and the expansion section, which further shows that the evolution of cavitation shape is closely related to the pressure fluctuation.

3.2. Influence of Inlet Pressure on Cavity Area

The inlet pressure is also one of the most important factors affecting the cavitation flow and pressure pulsation in the regulating valve [1]. Figure 8 shows the frequency distribution of cavity area under different inlet pressures, which shows that there is an obvious dominant frequency of the cavitation area. When the inlet pressure increases from 3.5 MPa to 5.5 MPa, the dominant frequency of cavity area is about 1950 Hz, which is equal to the large-scale attached cavity shedding frequency. Furthermore, there is the other dominant frequency with its double frequency, about 3900 Hz, which corresponds to the frequency of small-scale shedding cavities. With the decreasing inlet pressure, the frequency of the cavitation area rises. When the inlet pressure is 4.0 MPa, the frequency of cavity area is concentrated between 3500 Hz and 4500 Hz. Because there is no obvious large-scale attached cavity shedding, this power spectral density distribution of the cavity area is mainly caused by the small-scale cavitation shedding. When the inlet pressure decreases to 3.5 MPa, the attached cavitation flow is relatively stable, and there is no obvious change that could be found in the cavitation shape and area. This is the reason why the power spectral density distribution is small.
In order to better describe the effect of inlet pressure on cavitation area, the mean values of the cavitation area under different inlet pressure are used, which are defined as follows:
S 1 = 1 N i = 1 N S ( i )
while the variance values of the cavitation area under different inlet pressure is proposed to discuss the fluctuation degree of the cavitation area, which is
S 2 = 1 N 1 i = 1 N ( S ( i ) S 1 ) 2
where S(i) is the value of cavitation areas at time i. Figure 9 shows the changes in the mean and the variance values of the cavitation area under different inlet pressure. It could be found that both the mean and the variance values of the cavitation area rise with the increasing input pressure. The change of the cavity area becomes more intense, and the overall cavity area also increases obviously while the input pressure arises. Because the pressure difference at the inlet and outlet valve port becomes larger, the corresponding flow rate of the oil also rises, resulting in more dramatic developing attached cavity and the increasing cavity area. Due to the larger area of the cavity, greater energy will be generated during their collapse, which promotes the further collapse of the neighboring cavity. That is to say, the cavitation bubble expands, and the change process of cavitation clouds becomes more obvious with the increase in inlet pressure.

3.3. Influence of Inlet Pressure on Pressure Pulsation

The periodic changes of cavity area also induce a complex pressure fluctuation phenomenon. The average values of the pressure signal are shown as follows:
P 1 = 1 N i = 1 N P ( i )
where P(i) represents the value of pressure signal obtained at time i. Figure 10 shows the average values of pressure pulsation obtained by the three pressure measuring points under different inlet pressures. As the inlet pressure increases, the pressure at the throat increases slightly. When the inlet pressure increases from 3.5 MPa to 5.5 MPa, the cavitation occurs, and the pressure at the throat is relatively low. The pressure at the throat only increases from 0.1 MPa to 0.4 Mpa, while the inlet pressure increases from 3.5 MPa to 5.5 MPa, because the attached cavity in the throat begins to fall off and break into the free cavity, and less attached cavity stays at the throat section. Furthermore, freer cavity could be found downstream, which enlarges the total cavitation area, resulting in an intense pressure pulsation. When the inlet pressure is between 3.5 MPa and 5.5 MPa, the pressure pulsation at the expansion section shows a downward trend. As the inlet pressure increases, the average area of free cavity gradually enlarges, and the pressure measurement point at the expansion section is covered by less free cavity, so the average values of pressure fluctuation at the expansion section gradually decrease.
The variance of pressure fluctuation is used to discuss the intensity of the fluctuation in a period of time, which is shown as:
P 2 = 1 N 1 i = 1 N ( P ( i ) P 1 ) 2
Figure 11 shows the variance of pressure fluctuation at the throat and the expansion section under different inlet pressures. When the inlet pressure is 3.5 MPa, there is attached cavity at the throat section that is relatively stable. Due to the stable attached cavity at the throat section, the value of pressure fluctuation is at a relatively low level. As the inlet pressure increases, the variances of pressure fluctuation at the throat and the expansion section increase gradually. Greater inlet pressure induces more intense cavity collapses, resulting in larger pressure fluctuations. The pressure fluctuation at the expansion section is stronger than that at the throat position. The reason is as follows: the throat position is covered by the attached cavity for a long time, while the expansion section is covered by the free cavity, which collapses more drastically.
Figure 12 shows the maximum value of pressure fluctuation at the throat and expansion section. When the inlet pressure is 3.5 MPa, the maximum pressure at the throat section is about 1.0 MPa because it is covered by the attached cavity for a long time. At the same time, the expansion section is affected by a few free cavities, so the pressure at the expansion section is a bit higher than it at the throat section. When the inlet pressure increases from 4.0 MPa to 5.5 MPa, both the maximum value of pressure fluctuation at the throat and the expansion section increase. The maximum pressure at the expansion section increases from 2.6 MPa to 4.8 MPa, while it at the throat section increases from 1.1 MPa to 2.3 MPa. With the increase in the inlet pressure, the maximum pressure growth rate at the throat measuring point is smaller than it is at the expansion section. The throat of the valve suffers dramatic changes in pressure fluctuations, which is the weak part of the valve. The optimal design of throat structures is beneficial for reducing the pressure impact and noise of hydraulic valve.
The pressure pulse factor is also used to estimate whether there is an impact on the signal, which is defined as:
I = ( P max P min ) P 1
where Pmax is the maximum pressure, and Pmin is the minimum pressure. Figure 13 shows the pressure pulse factor at the three pressure monitoring points at about 0.5 s with increasing inlet pressure. It can be seen that the pressure pulse factor at the upstream section is always the smallest, while it is the largest at the throat section. Because the most dramatic changes of the pressure could be found at the throat section, more pressure spikes will induce a higher-pressure pulse factor. Furthermore, the cavitation area changes significantly at the throat section, and so induces the strongest change of the flow field. With a different applied pressure, the throat will be the weakest part of the regulating valve, which has certainly proven to be susceptible to cavitation erosion. The structure of the throat requires more attention.

4. Conclusions

A synchronous multi-physical field measurement system was built, and the pressure pulsation and the change of cavitation area at the upstream, throat and expansion section of the regulating valve were obtained experimentally. The time domain and frequency domain characteristics of the pressure pulsation at the three measuring points were analyzed. The conclusions are as follows:
(1)
The cavitation flow in the regulating valve is a quasi-periodic process with a period about 0.5 ms. A typical unsteady cavitation development process could be divided into three processes: the growth of the attached cavity, the fracture and shedding of the attached cavity and the growth and collapse of the free cavity.
(2)
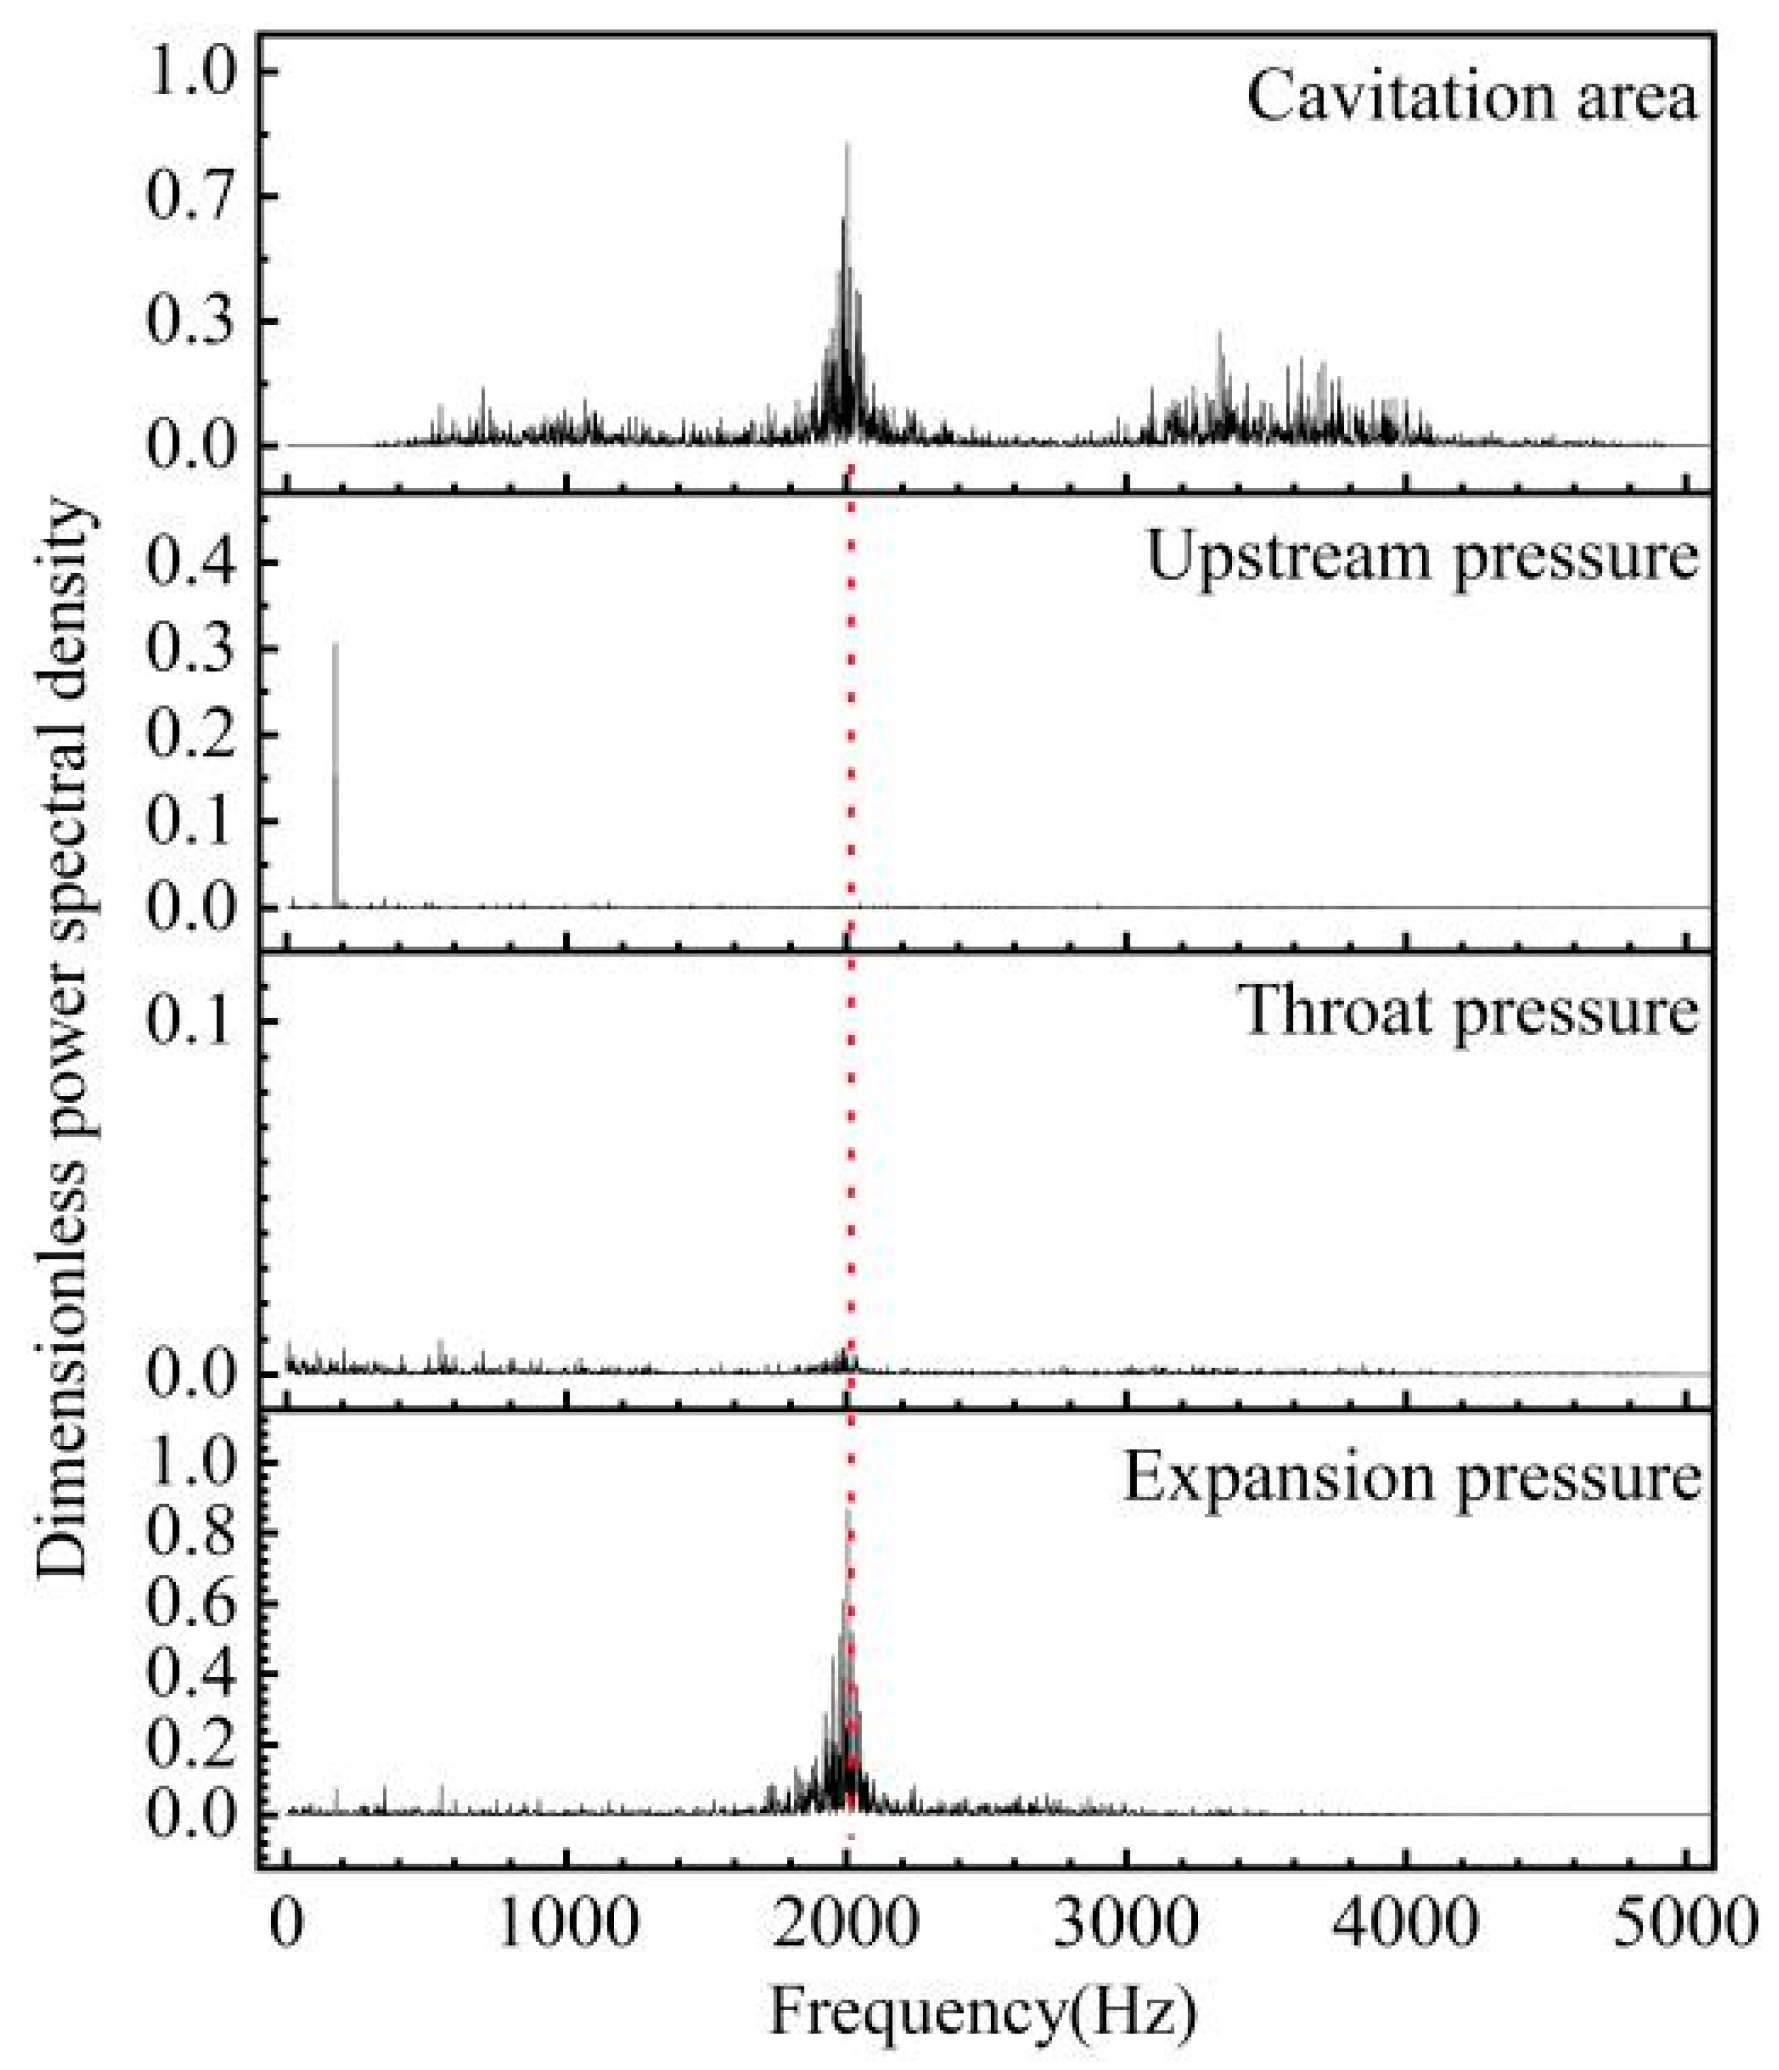
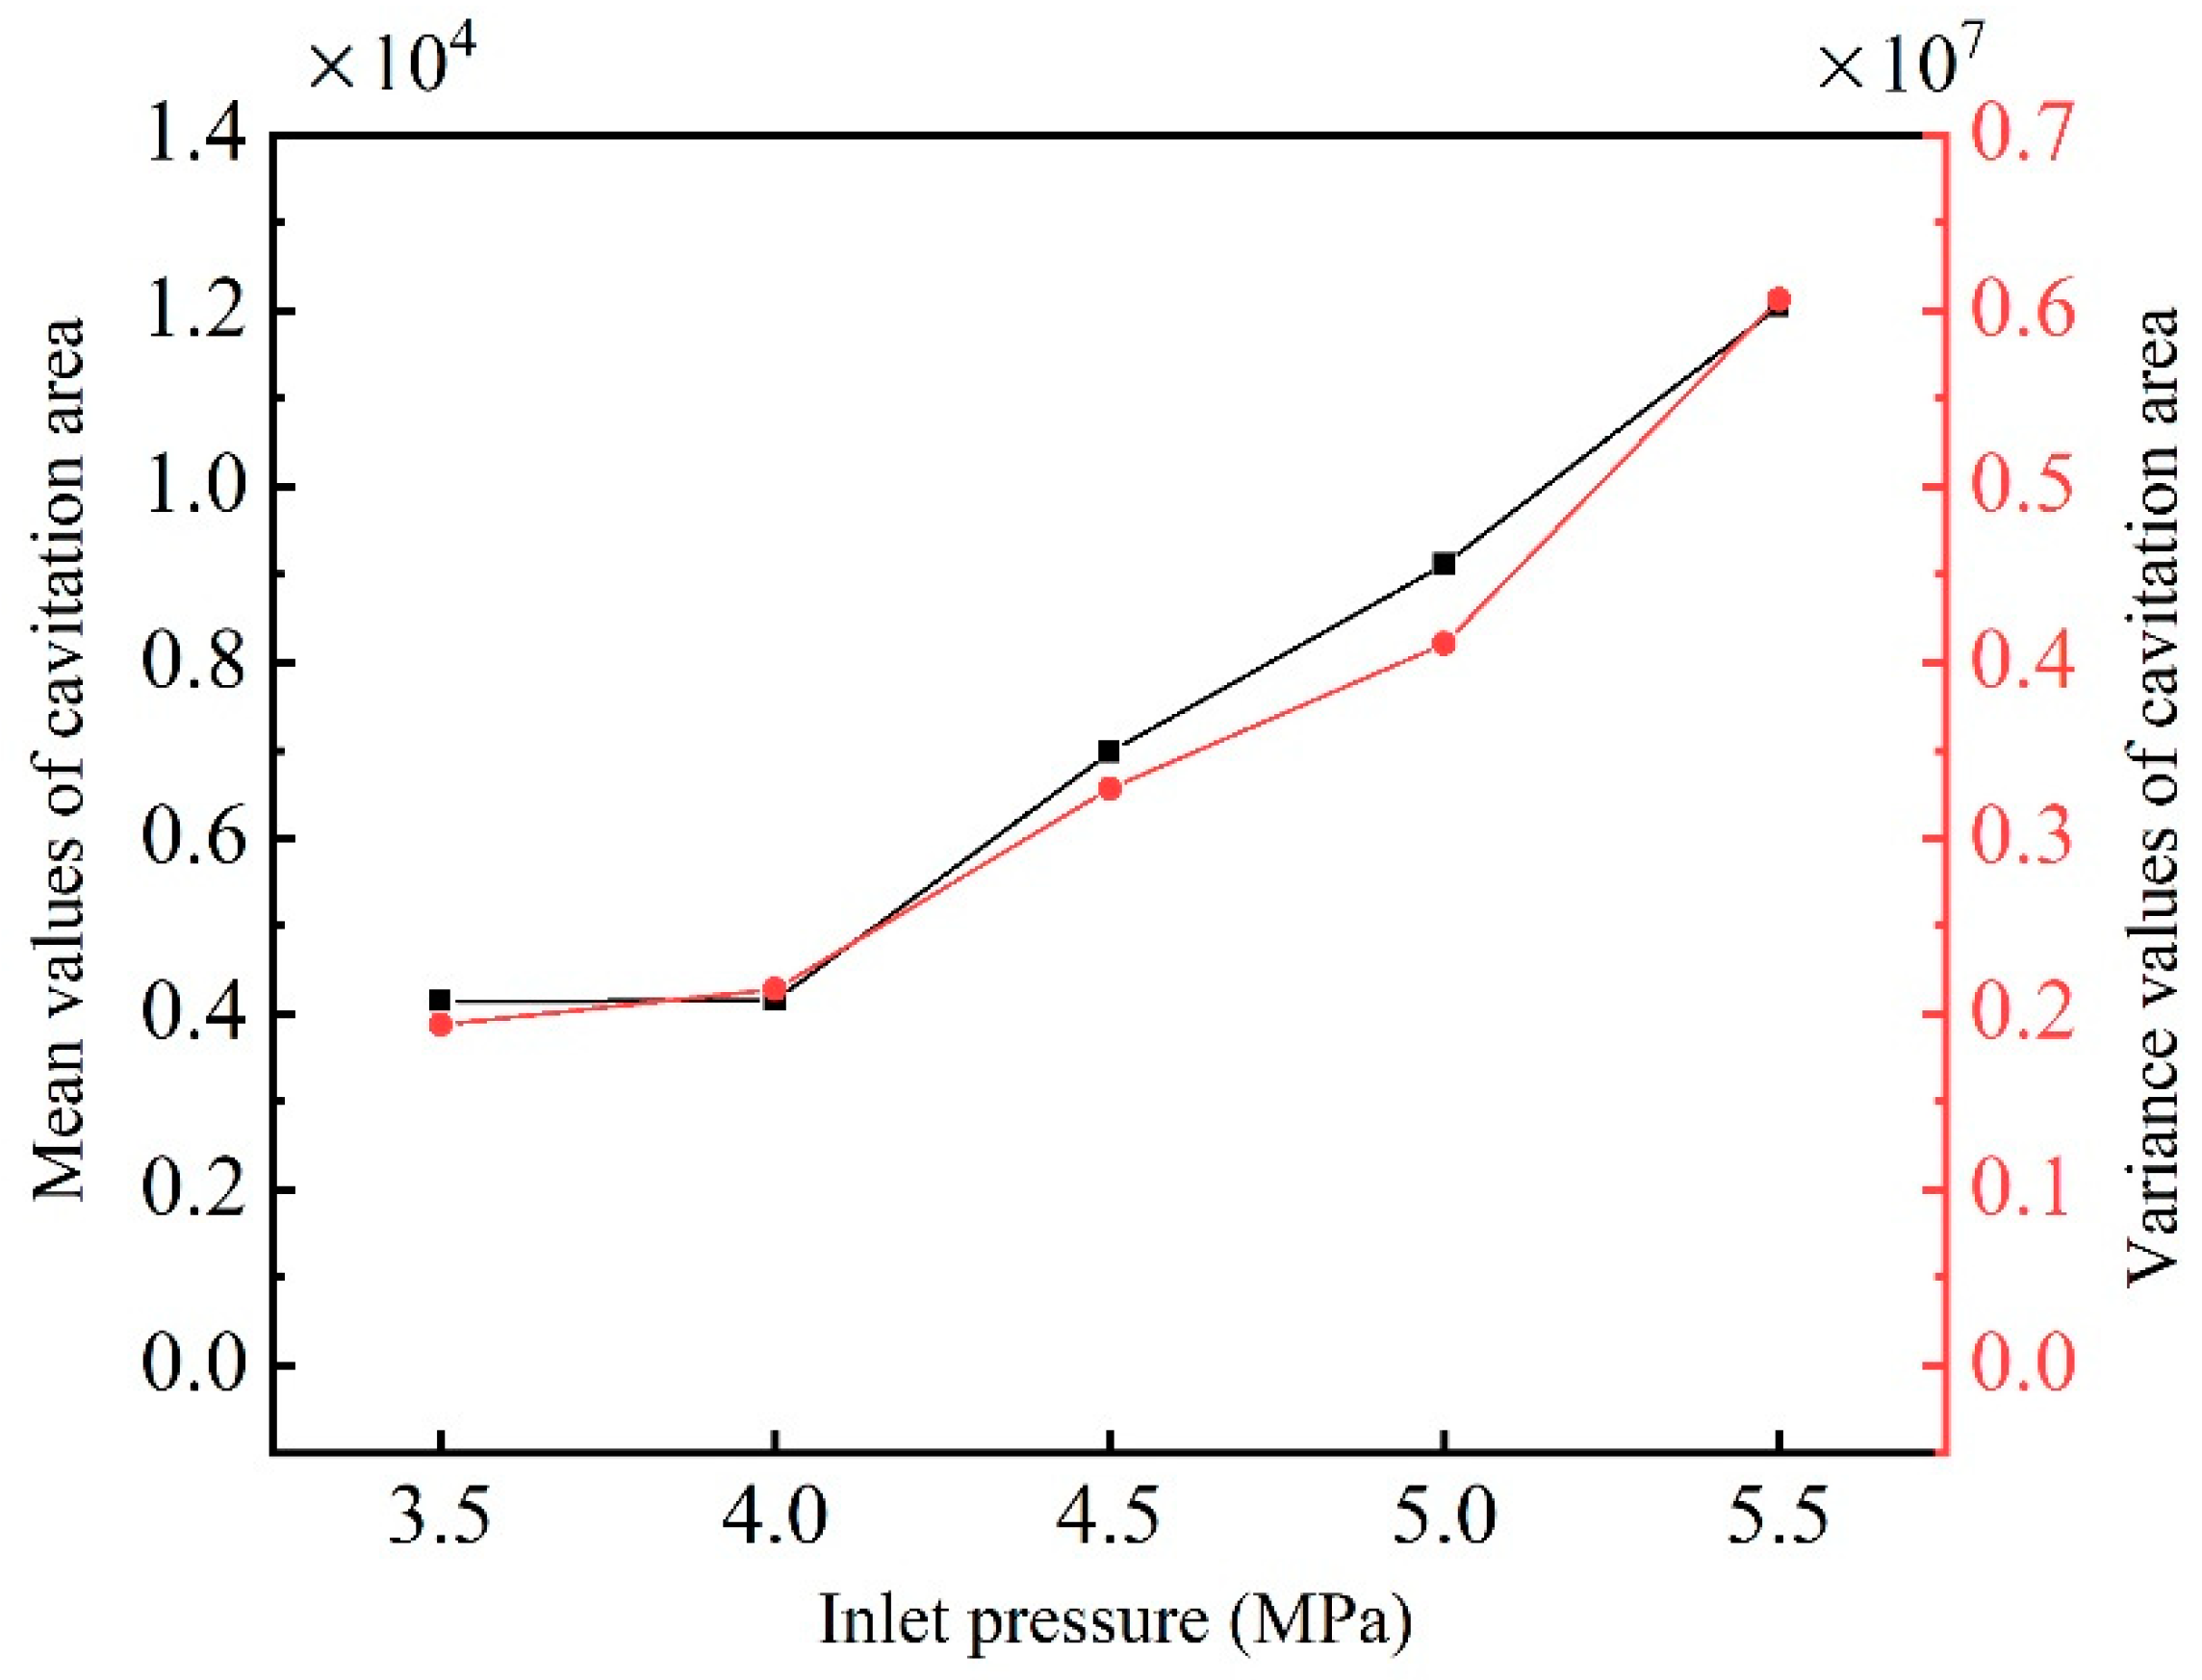
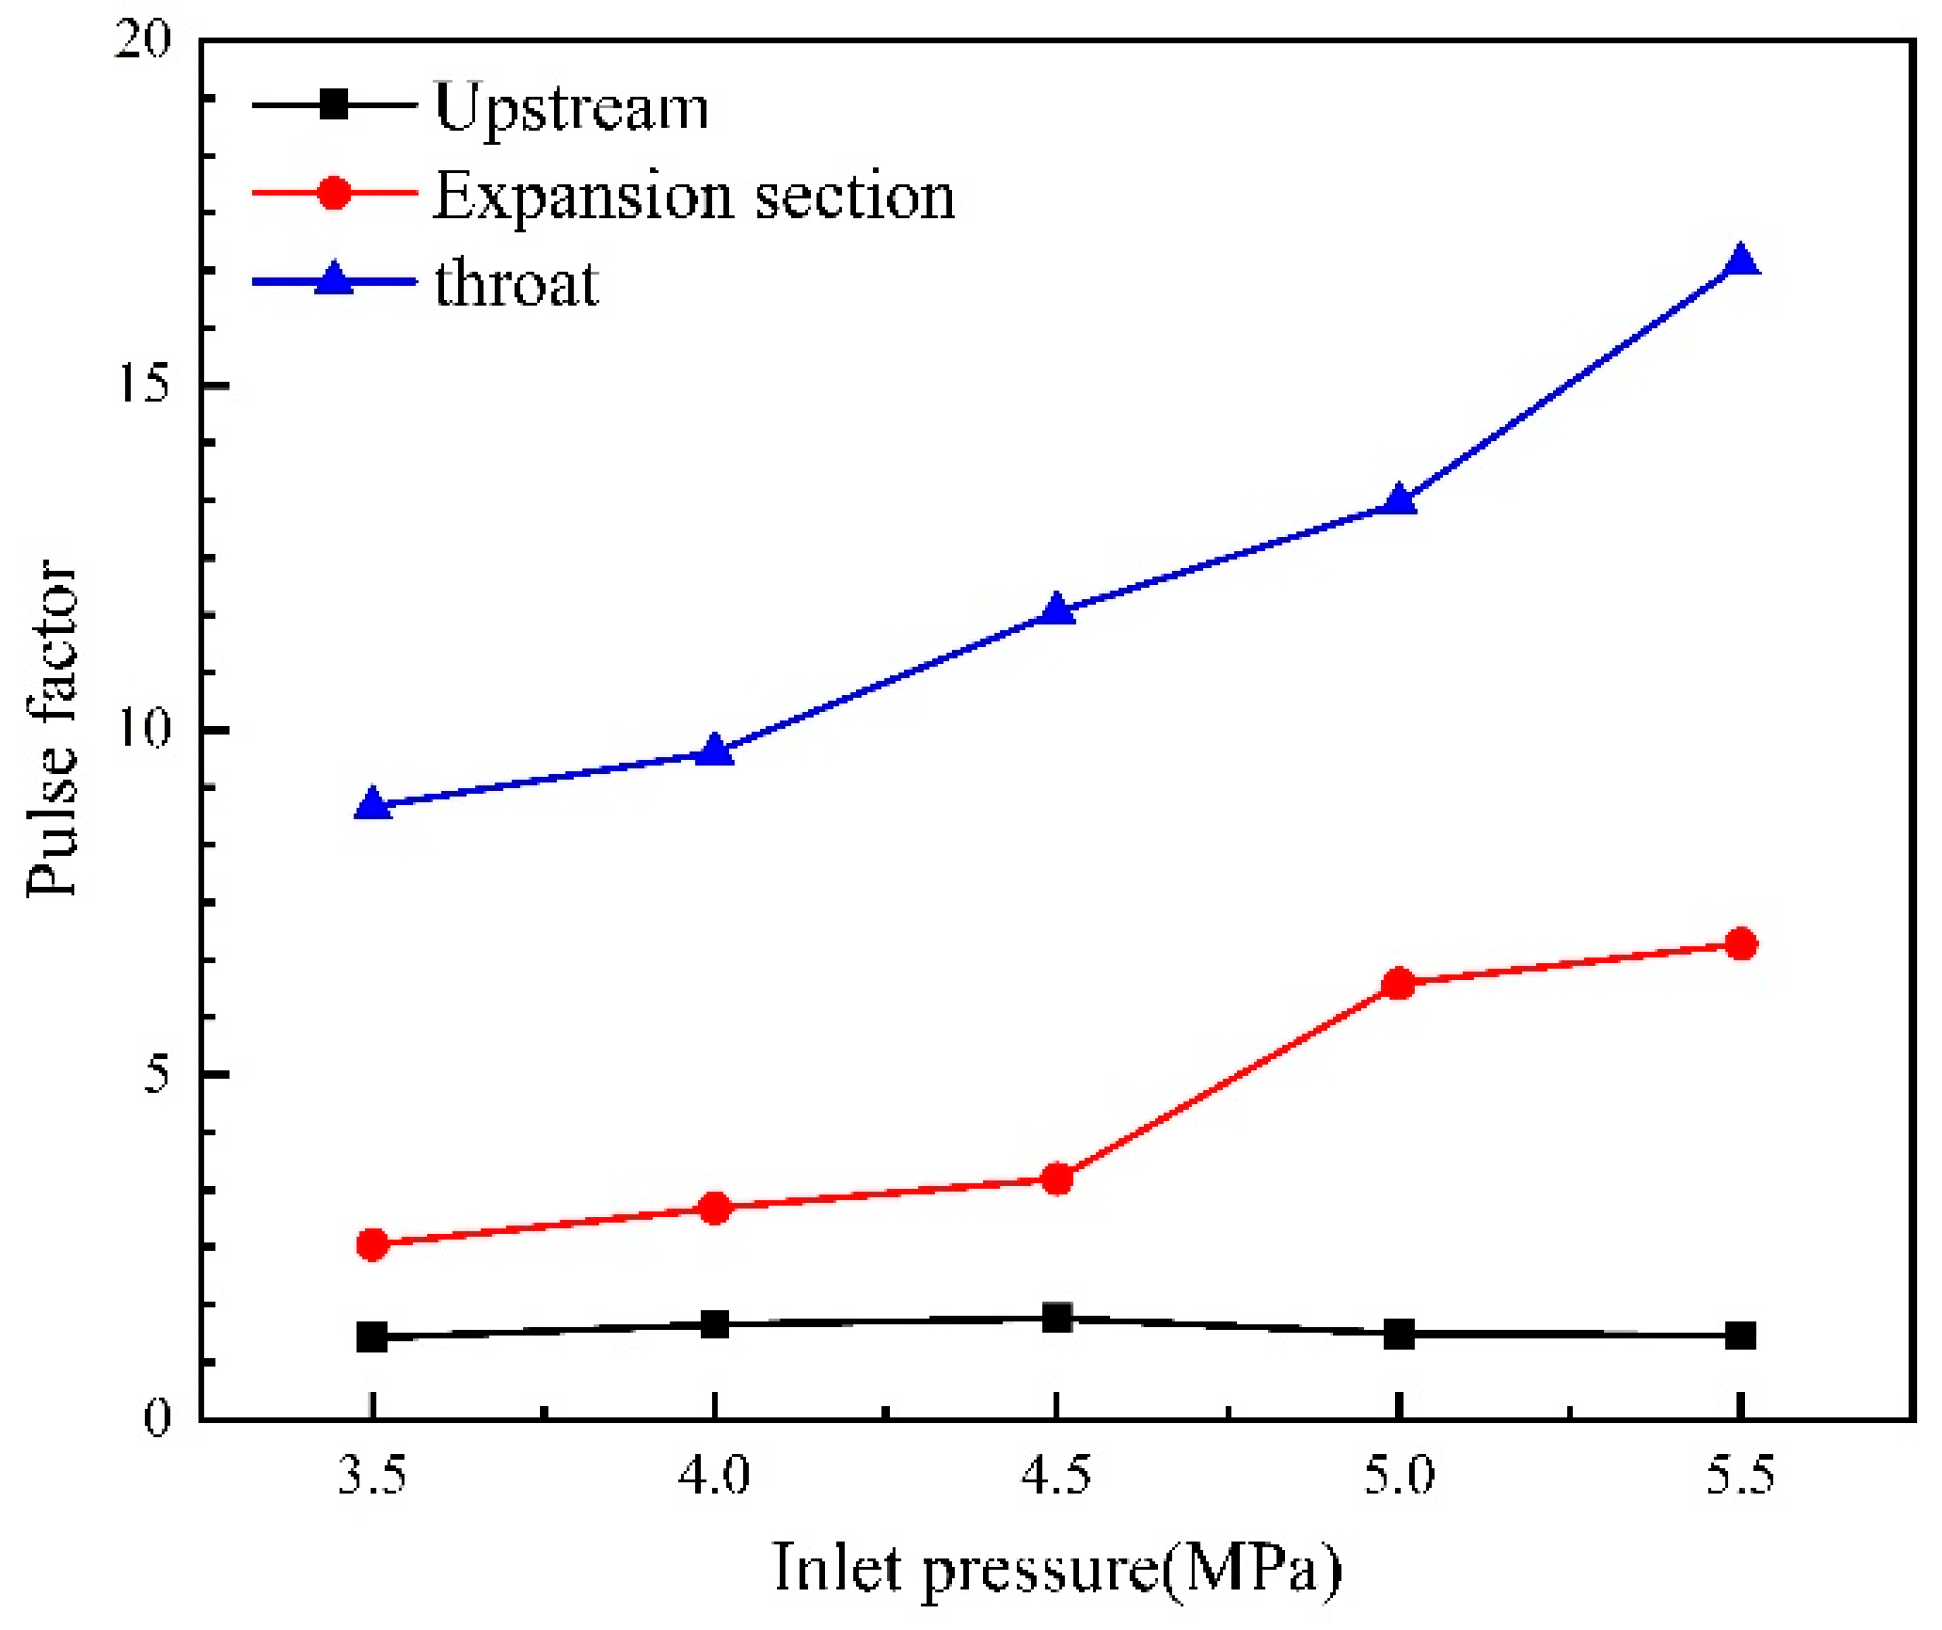
The time evolution of the cavitation flow is highly related with excited pressure fluctuations. The dominant frequency of pressure and the cavity area is almost the same, about 2000 Hz. The characteristics of pressure pulsation at the three measuring points are different. The pressure pulsation at the upstream section is mainly affected by the pressure pulsation of the pump. The power spectral density of dominant frequency at the expansion section is much higher than that at the throat. With the increase in inlet pressure, the frequency of cavity area gradually decreases, and the mean value of cavity area and the variance value of cavitation area gradually increase.
(3)
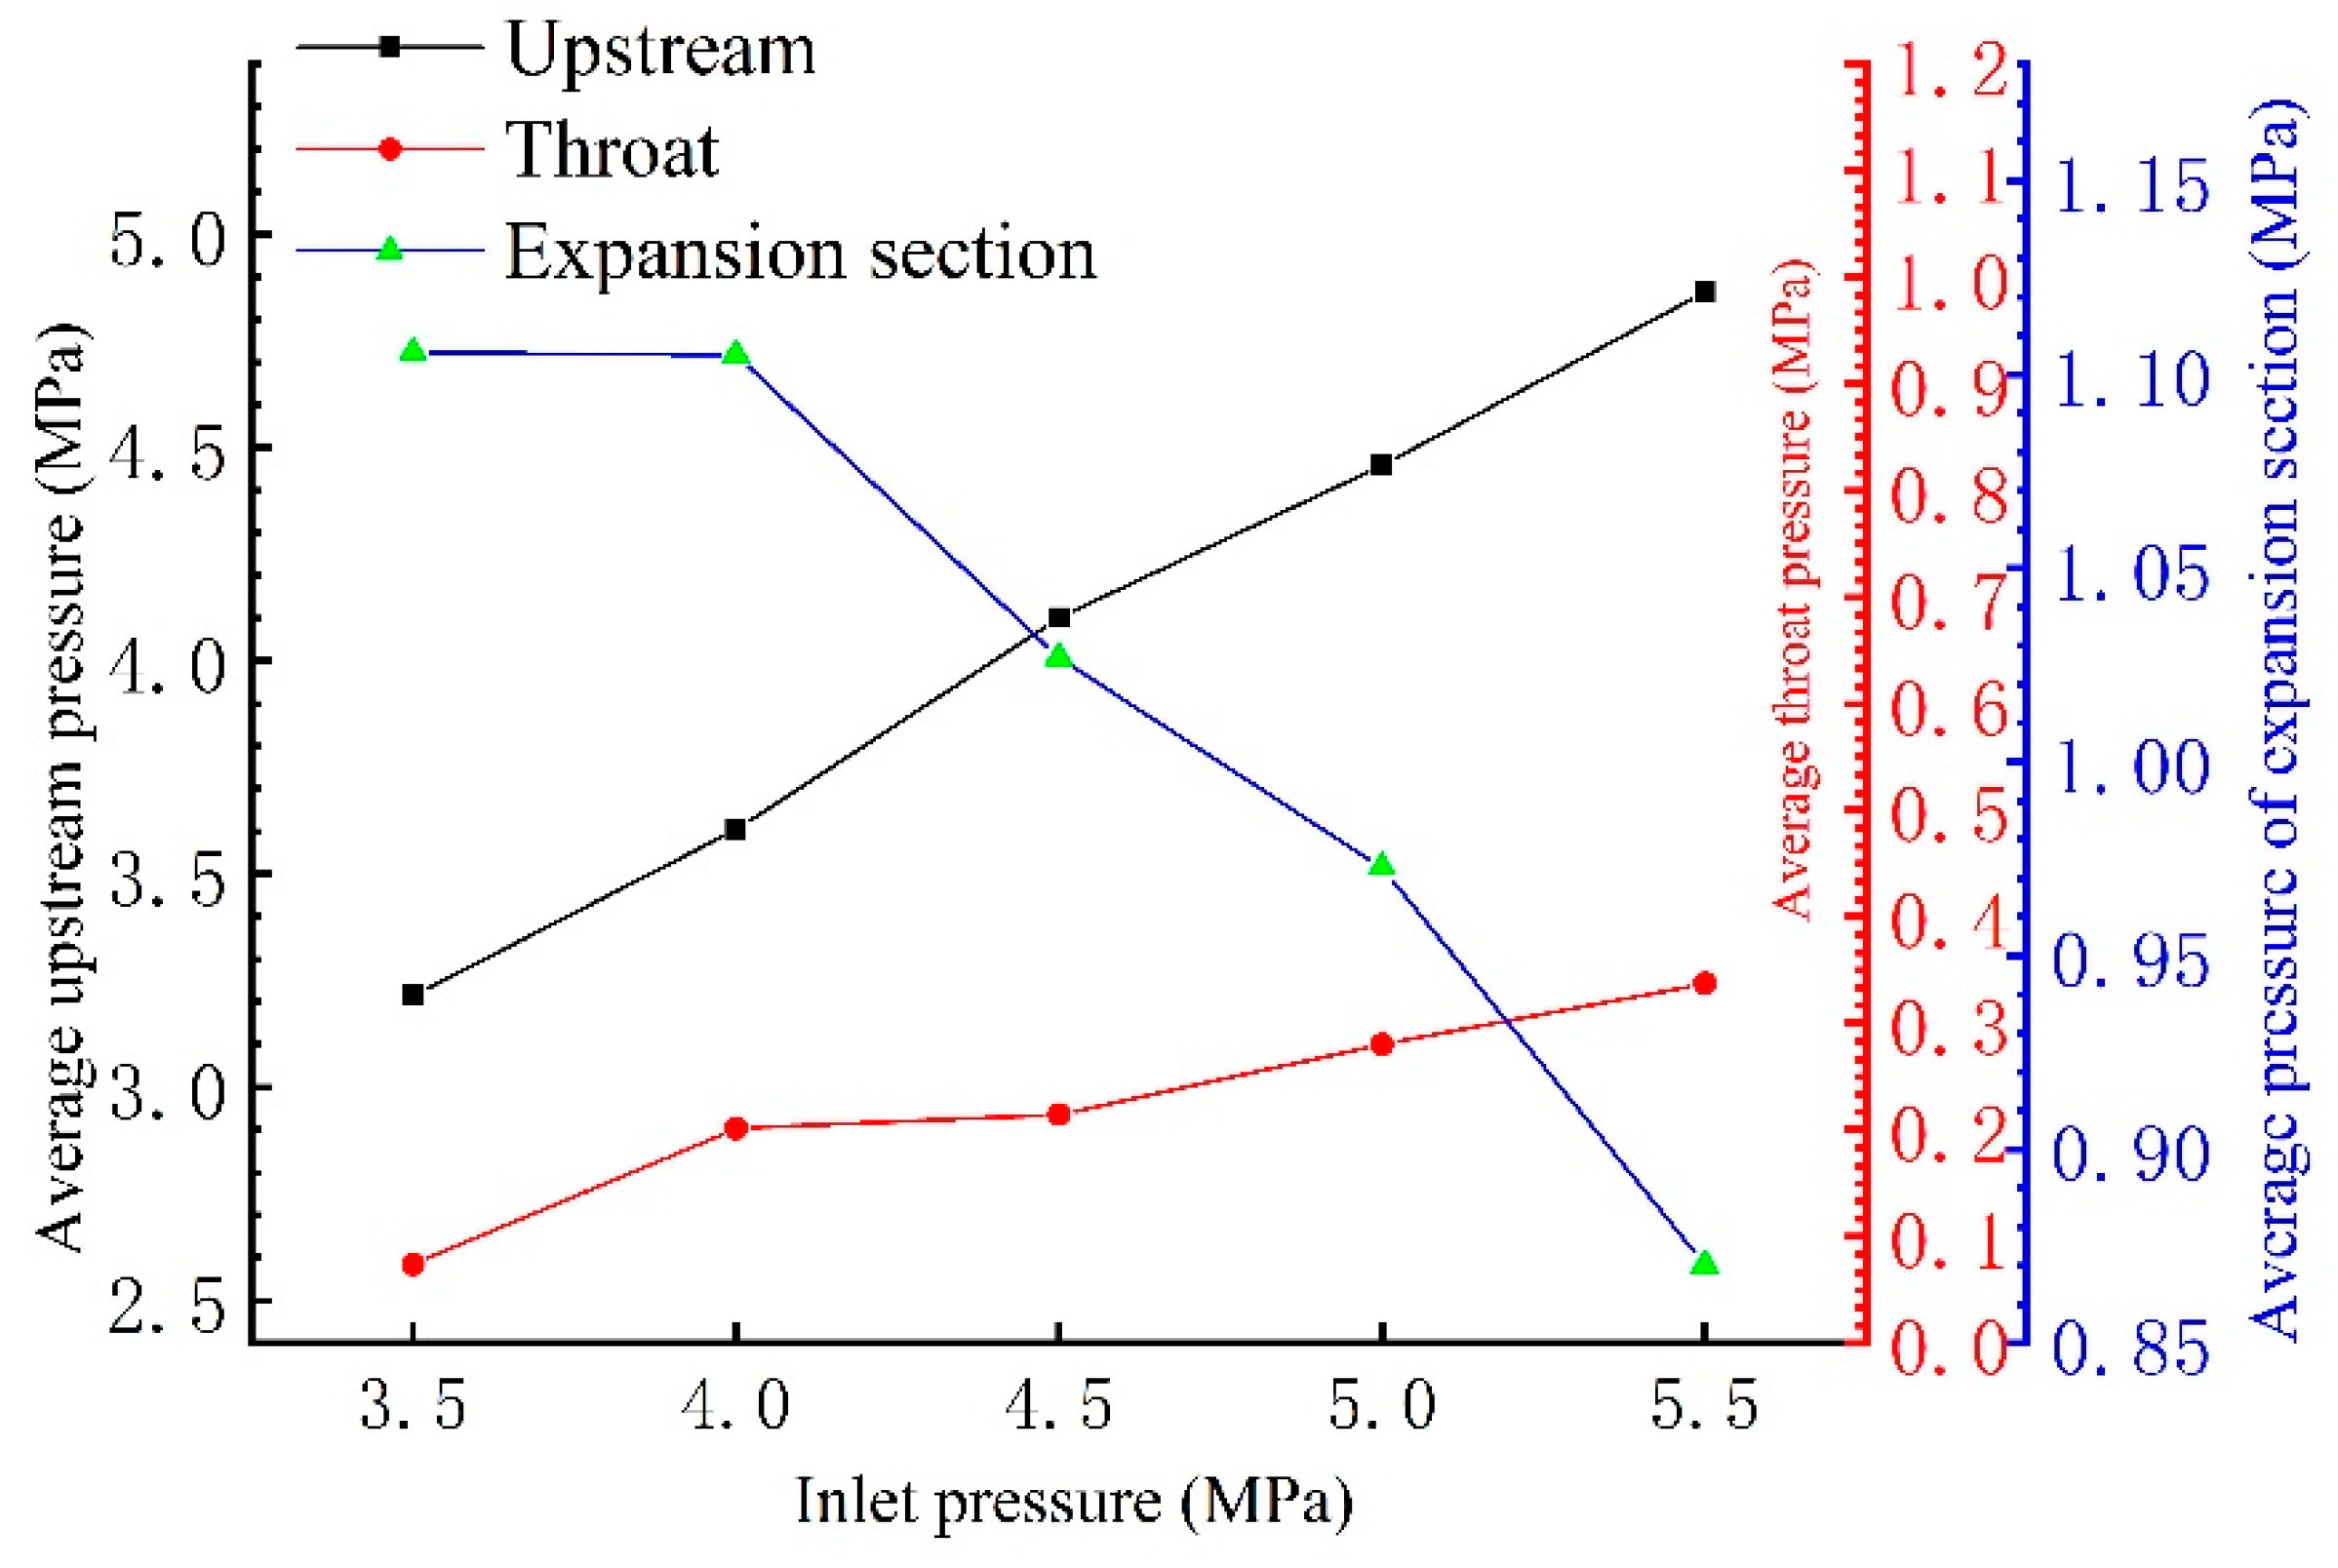
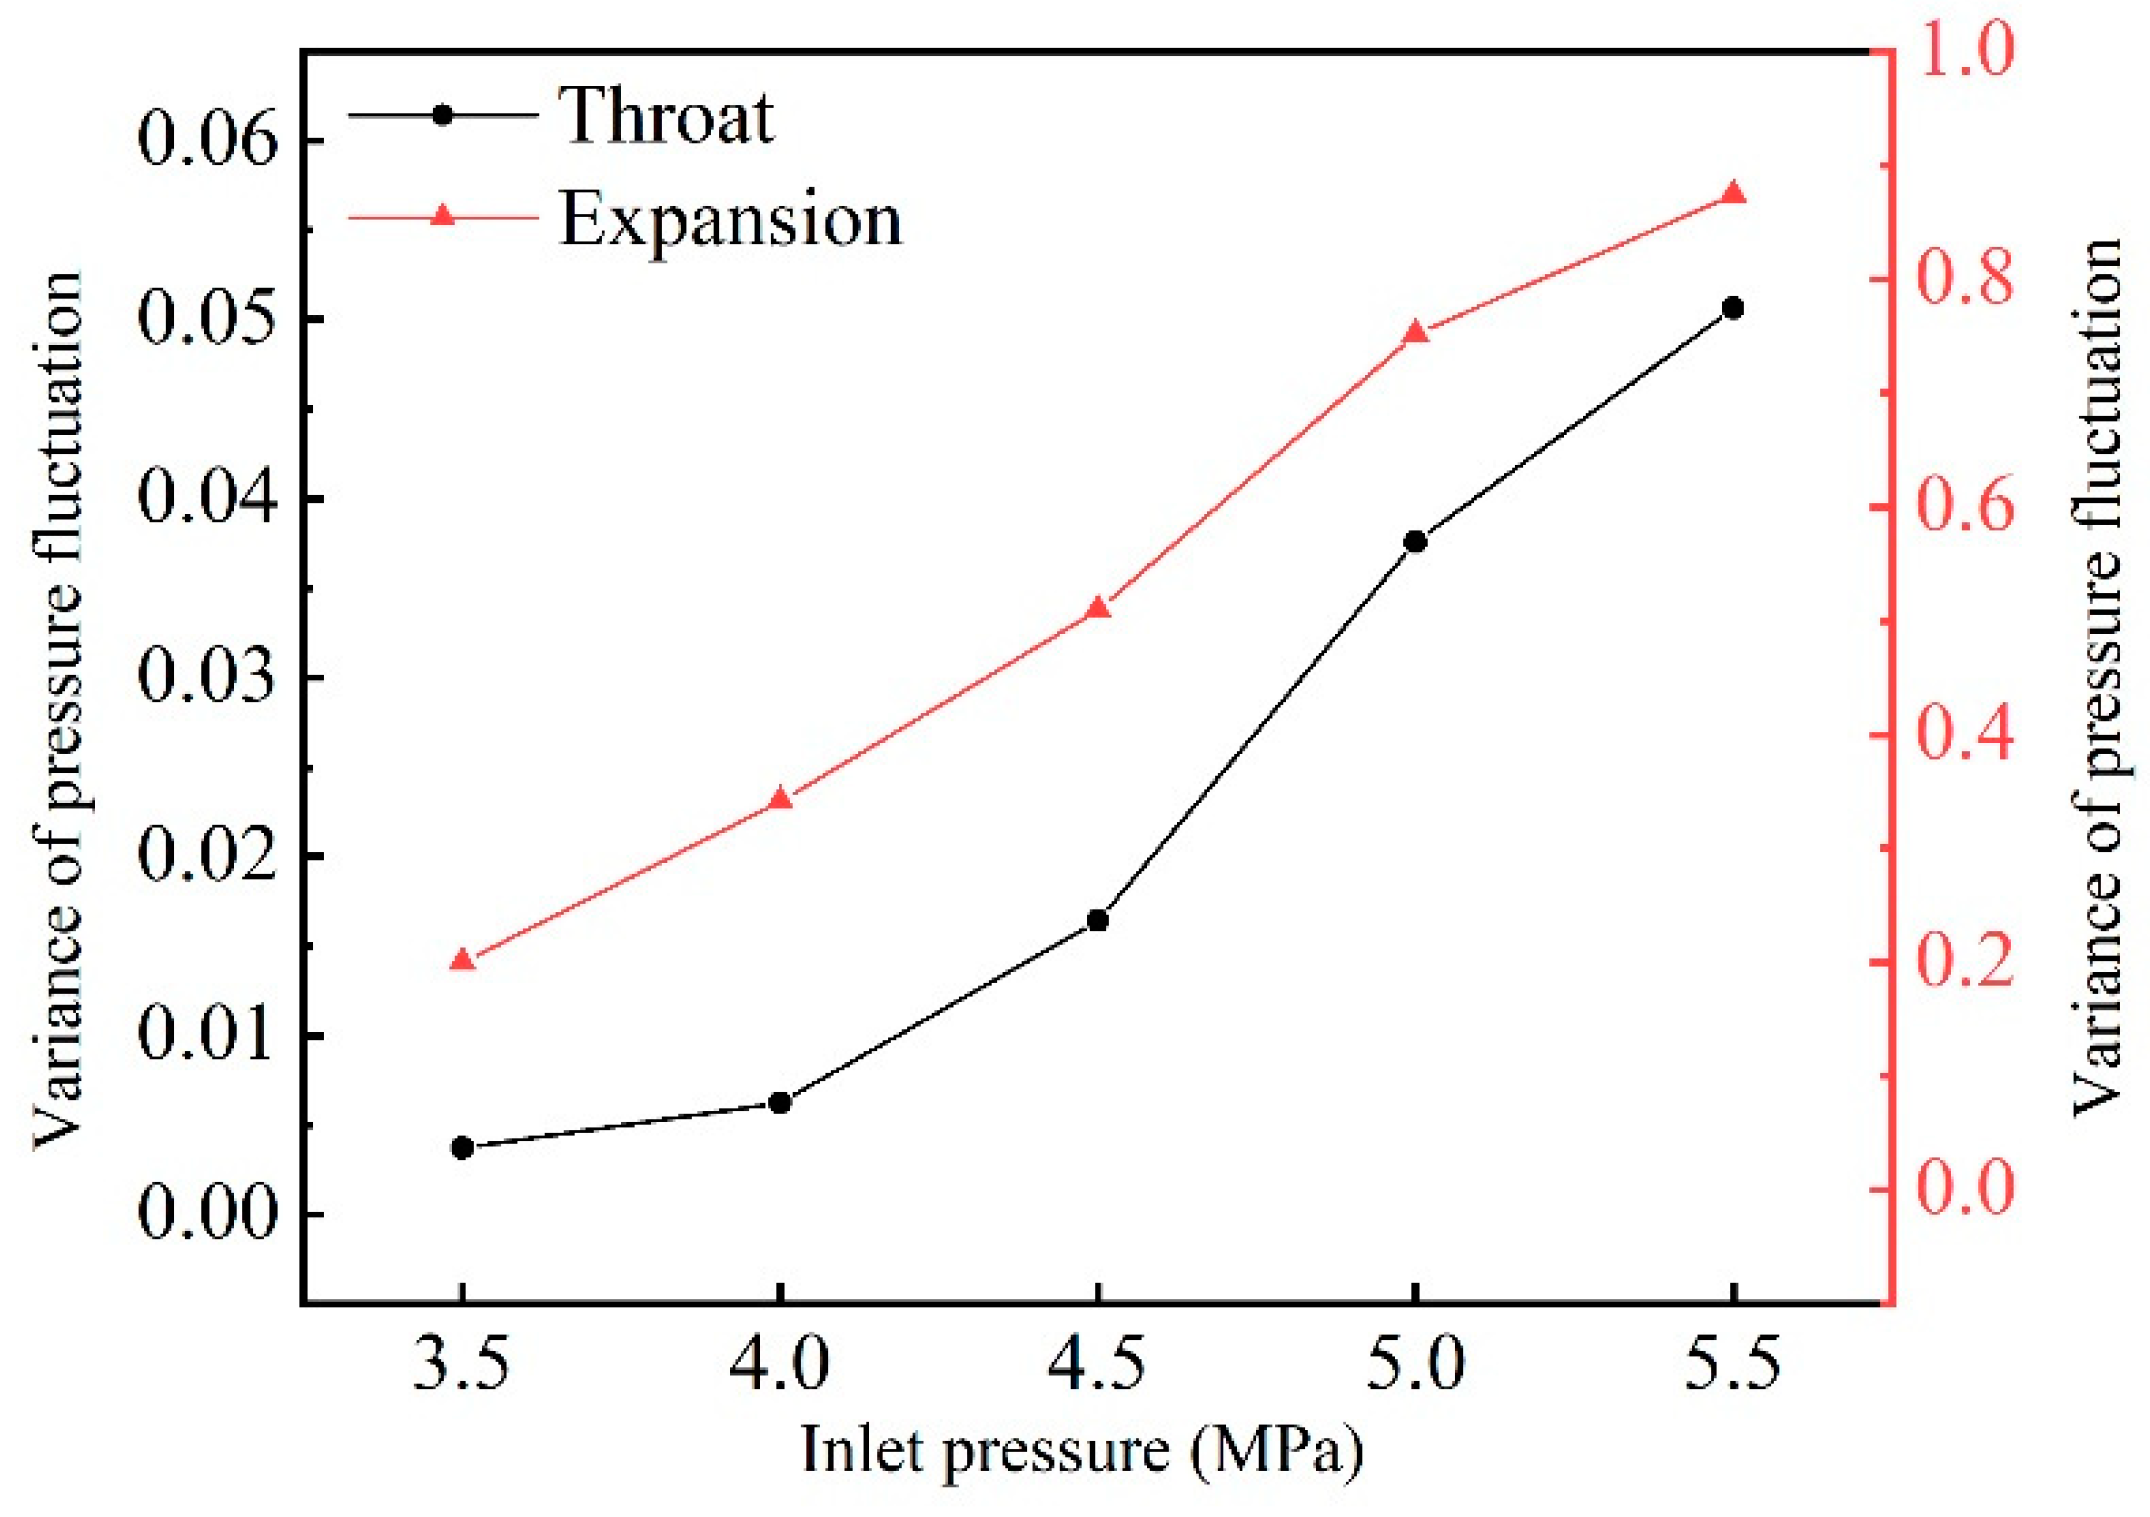
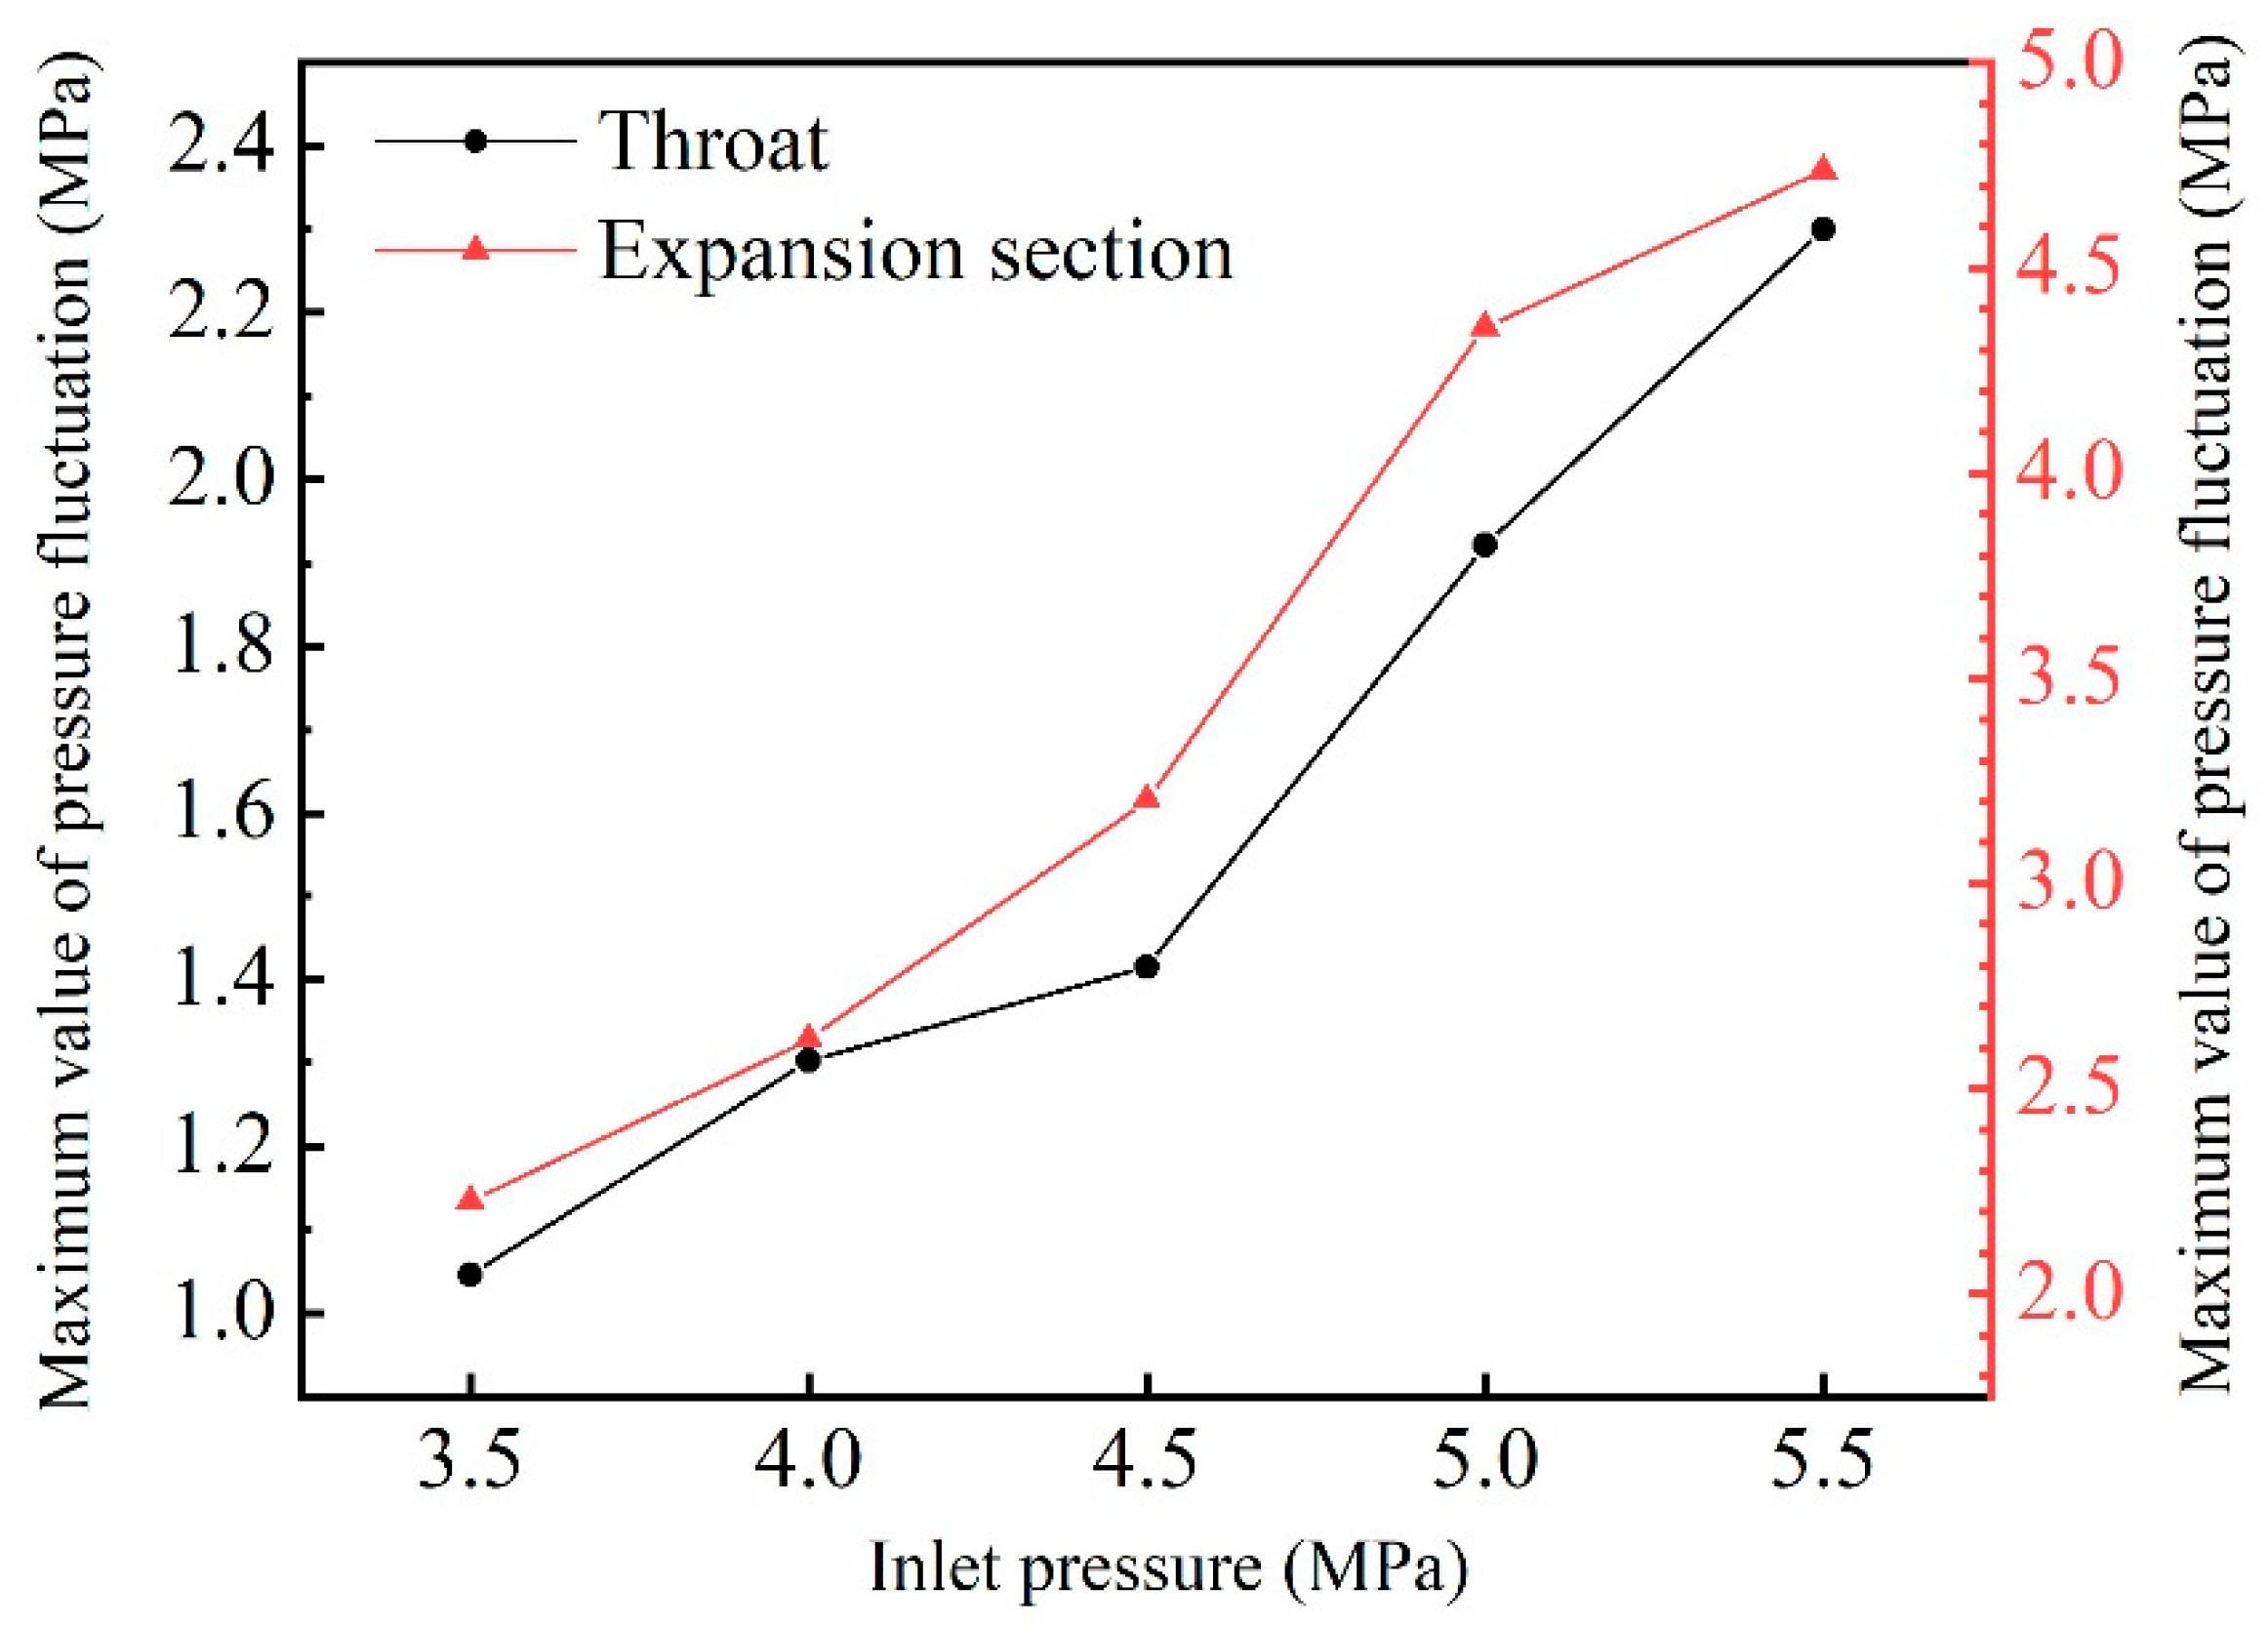
The change of cavity area is also an important reason for the excited pressure pulsation. With the increase in inlet pressure, the attached cavity at the throat section began to fall off and break into free cavity, and the mean value of pressure pulsation gradually increased. At the expansion section, the pressure decreases due to continuous coverage of free cavity. In addition, with the increase in inlet pressure, the pressure fluctuation at each measuring point becomes more intense, and the variance value of pressure fluctuation and the maximum pressure value also increase gradually.
The experimental results in this paper describe the changes of cavitation area and pressure pulsation in the regulating valve well. The change of cavitation area and the pressure pulsation complement each other. The pressure pulsation around the expansion section and the throat section changed obviously, so these important parts of the valve could be reasonably optimized in order to inhibit the cavitation phenomenon and prolong the service life of the valve.

Author Contributions

Conceptualization, X.L. and J.H.; methodology, B.L.; validation, J.C. and Q.L.; investigation, Y.Z.; writing—original draft preparation, Y.X.; writing—review and editing, X.L. All authors have read and agreed to the published version of the manuscript.

Funding

This research was funded by the National Natural Science Foundation of China, under grant number 51875559, the Fundamental Research Funds for the Central Universities, under grant number 2015XKMS026 and the Priority Academic Program Development of Jiangsu Higher Education Institutions (PAPD).

Institutional Review Board Statement

Not applicable.

Informed Consent Statement

Not applicable.

Data Availability Statement

Not applicable.

Conflicts of Interest

The authors declare no conflict of interest.

References

  1. Liu, X.; He, J.; Li, B.; Zhang, C.; Xu, H.; Li, W.; Xie, F. Study on Unsteady Cavitation Flow and Pressure Pulsation Characteristics in the Regulating Valve. Shock. Vib. 2021, 2021, 6620087. [Google Scholar] [CrossRef]
  2. Jin, H.Z.; Zheng, Z.J.; Ou, G.F.; Zhang, L.T.; Rao, J.; Shu, G.P.; Wang, C. Failure analysis of a high pressure differential regulating valve in coal liquefaction. Eng. Fail. Anal. 2015, 55, 115–130. [Google Scholar] [CrossRef]
  3. Zheng, K.X.; Hu, H.X.; Chen, F.G.; Zheng, Y.G. Failure analysis of the blackwater regulating valve in the coal chemical industry. Eng. Fail. Anal. 2021, 125, 105442. [Google Scholar] [CrossRef]
  4. Min, W.; Wang, H.Y.; Zheng, Z.; Wang, D.; Ji, H.; Wang, Y.B. Visual experimental investigation on the stability of pressure regulating poppet valve. Proc. Inst. Mech. Eng. Part C J. Mech. Eng. Sci. 2020, 234, 2329–2348. [Google Scholar] [CrossRef]
  5. Oshima, S.; Leino, T.; Linjama, M.; Koskinen, K.T.; Vilenius, M.J. Effect of Cavitation in Water Hydraulic Poppet Valves. Int. J. Fluid Power 2001, 2, 5–13. [Google Scholar] [CrossRef]
  6. Zhang, X.; Zhang, W.; Chen, J.; Qiu, L.; Sun, D. Validation of dynamic cavitation model for unsteady cavitating flow on NACA66. Sci. China Technol. Sci. 2014, 57, 819–827. [Google Scholar] [CrossRef]
  7. Jazi, A.M.; Rahimzadeh, H. Detecting cavitation in globe valves by two methods: Characteristic diagrams and acoustic analysis. Appl. Acoust. 2009, 70, 1440–1445. [Google Scholar] [CrossRef]
  8. Liang, J.; Luo, X.; Liu, Y.; Li, X.; Shi, T. A numerical investigation in effects of inlet pressure fluctuations on the flow and cavitation characteristics inside water hydraulic poppet valves. Int. J. Heat Mass Transf. 2016, 103, 684–700. [Google Scholar] [CrossRef]
  9. Domnick, C.B.; Benra, F.-K.; Brillert, D.; Dohmen, H.J.; Musch, C. Numerical Investigation on the Time-Variant Flow Field and Dynamic Forces Acting in Steam Turbine Inlet Valves. J. Eng. Gas Turbines Power-Trans. ASME 2015, 137, 081601. [Google Scholar] [CrossRef]
  10. Stutz, B.; Legoupil, S. X-ray measurements within unsteady cavitation. Exp. Fluids 2003, 35, 130–138. [Google Scholar] [CrossRef]
  11. Dular, M.; Bachert, B.; Stoffel, B.; Sirok, B. Relationship between cavitation structures and cavitation damage. Wear 2004, 257, 1176–1184. [Google Scholar] [CrossRef]
  12. Kan, X.-Y.; Yan, J.-L.; Li, S.; Zhang, A.M. Rupture of a rubber sheet by a cavitation bubble: An experimental study. Acta Mech. Sin. 2021, 37, 1489–1497. [Google Scholar] [CrossRef]
  13. Petkovsek, M.; Hocevar, M.; Dular, M. Visualization and measurements of shock waves in cavitating flow. Exp. Therm. Fluid Sci. 2020, 119, 10. [Google Scholar] [CrossRef]
  14. Choi, M.J.; Kwon, O. Temporal and spectral characteristics of the impulsive waves produced by a clinical ballistic shock wave therapy device. Ultrasonics 2021, 110, 106238. [Google Scholar] [CrossRef]
  15. Brinkhorst, S.; von Lavante, E.; Wendt, G. Experimental and numerical investigation of the cavitation-induced choked flow in a herschel venturi-tube. Flow Meas. Instrum. 2017, 54, 56–67. [Google Scholar] [CrossRef]
  16. Chen, G.; Wang, G.; Hu, C.; Huang, B.; Gao, Y.; Zhang, M. Combined experimental and computational investigation of cavitation evolution and excited pressure fluctuation in a convergent-divergent channel. Int. J. Multiph. Flow 2015, 72, 133–140. [Google Scholar] [CrossRef]
  17. Reuter, F.; Gonzalez-Avila, S.R.; Mettin, R.; Ohl, C.-D. Flow fields and vortex dynamics of bubbles collapsing near a solid boundary. Phys. Rev. Fluids 2017, 2, 064202. [Google Scholar] [CrossRef]
  18. Leroux, J.B.; Coutier-Delgosha, O.; Astolfi, J.A. A joint experimental and numerical study of mechanisms associated to instability of partial cavitation on two-dimensional hydrofoil. Phys. Fluids 2005, 17, 20. [Google Scholar] [CrossRef] [Green Version]
  19. Stanley, C.; Barber, T.; Rosengarten, G. Re-entrant jet mechanism for periodic cavitation shedding in a cylindrical orifice. Int. J. Heat Fluid Flow 2014, 50, 169–176. [Google Scholar] [CrossRef]
  20. Foeth, E.-J.; van Terwisga, T.; van Doorne, C. On the collapse structure of an attached cavity on a three-dimensional hydrofoil. J. Fluids Eng.-Trans. ASME 2008, 130, 071303. [Google Scholar] [CrossRef] [Green Version]
  21. Smith, S.M.; Venning, J.A.; Pearce, B.W.; Young, Y.L.; Brandner, P.A. The influence of fluid-structure interaction on cloud cavitation about a stiff hydrofoil. Part 1. J. Fluid Mech. 2020, 896, A1. [Google Scholar] [CrossRef]
  22. Ganesh, H.; Makiharju, S.A.; Ceccio, S.L. Bubbly shock propagation as a mechanism for sheet-to-cloud transition of partial cavities. J. Fluid Mech. 2016, 802, 37–78. [Google Scholar] [CrossRef] [Green Version]
  23. Kambayashi, I.; Kang, D.; Nishimura, N. Theoretical, Numerical, and Experimental Study on an Unsteady Venturi Flowmeter for Incompressible Flows. J. Fluids Eng. 2021, 143, 021308. [Google Scholar] [CrossRef]
  24. Long, Y.; Long, X.; Ji, B. LES investigation of cavitating flows around a sphere with special emphasis on the cavitation-vortex interactions. Acta Mech. Sin. 2020, 36, 1238–1257. [Google Scholar] [CrossRef]
  25. Sayyaadi, H. Instability of the cavitating flow in a venturi reactor. Fluid Dyn. Res. 2010, 42, 055503. [Google Scholar] [CrossRef]
  26. Liu, X.M.; Wu, Z.H.; Li, B.B.; Zhao, J.Y.; He, J.; Li, W.; Zhang, C.; Xie, F.W. Influence of inlet pressure on cavitation characteristics in regulating valve. Eng. Appl. Comput. Fluid Mech. 2020, 14, 299–310. [Google Scholar] [CrossRef]
  27. Han, M.; Liu, Y.; Wu, D.; Zhao, X.; Tan, H. A numerical investigation in characteristics of flow force under cavitation state inside the water hydraulic poppet valves. Int. J. Heat Mass Transf. 2017, 111, 1–16. [Google Scholar] [CrossRef]
  28. Ou, G.-F.; Rao, J.; Zhang, L.-T.; Zheng, Z.-J.; Ye, J. Numerical investigation of cavitation erosion/solid particle erosion in high differential pressure control valves in coal liquefaction. Mocaxue Xuebao/Tribol. 2013, 33, 155–161. [Google Scholar]
Figure 1. (a) Schematic diagram of the hydraulic system. (b) Flow channel structure and schematic diagram of three monitoring point.
Machines 10 00032 g001
Figure 2. Schematic of the synchronous measurement system.
Machines 10 00032 g002
Figure 3. Operation flow chart of this experiment.
Machines 10 00032 g003
Figure 4. Calculation method of cavity area: (a) Original image without cavitation bubble. (b) Original image with cavitation bubble. (c) The image of cavitation flow. (d) The gray value of cavity area.
Machines 10 00032 g004
Figure 5. Quasi-periodic behavior of cavitation flow while Pin = 4.5 MPa, Pout = 1.0 MPa and the opening is 30%.
Machines 10 00032 g005
Figure 6. Variation of cavity area and excited pressure fluctuations while Pin = 4.5 MPa, Pout = 1.0 MPa and the opening is 30%.
Machines 10 00032 g006
Figure 7. Power spectral density distribution of the pressure pulsation and the variation of cavitation area at the three measuring points.
Machines 10 00032 g007
Figure 8. Power spectral density of cavitation area under different inlet pressures.
Machines 10 00032 g008
Figure 9. Mean and variance values of cavitation areas under increasing inlet pressures.
Machines 10 00032 g009
Figure 10. The average values of pressure fluctuation at three measuring points under increasing inlet pressures.
Machines 10 00032 g010
Figure 11. The variance of pressure fluctuation at throat and expansion section under increasing inlet pressures.
Machines 10 00032 g011
Figure 12. Changes of the maximum pressure at the throat and expansion section under increasing inlet pressures.
Machines 10 00032 g012
Figure 13. Pressure pulse factor at three measurement points with increasing inlet pressures.
Machines 10 00032 g013
Publisher’s Note: MDPI stays neutral with regard to jurisdictional claims in published maps and institutional affiliations.

