Article

An Intelligent Predictive Algorithm for the Anti-Rollover Prevention of Heavy Vehicles for Off-Road Applications

1
Department of Mechanical and Aerospace Engineering, Politecnico di Torino, 10129 Torino, TO, Italy
2
Department of Management and Production Engineering, Politecnico di Torino, 10129 Torino, TO, Italy
3
Sezione Mobilità e Contromobilità—Caporeparto Mobilità, Centro Polifunzionale di Sperimentazione, 00010 Montelibretti, RM, Italy
*
Author to whom correspondence should be addressed.
Machines 2022, 10(10), 835; https://doi.org/10.3390/machines10100835
Submission received: 31 July 2022 / Revised: 1 September 2022 / Accepted: 8 September 2022 / Published: 21 September 2022
(This article belongs to the Special Issue Advances of Machine Design in Italy 2022)

Abstract

:
Rollover detection and prevention are among the most critical aspects affecting the stability and safety assessment of heavy vehicles, especially for off-road driving applications. This topic has been studied in the past and analyzed in depth in terms of vehicle modelling and control algorithms design able to prevent the rollover risk. However, it still represents a serious problem for automotive carmakers due to the huge counts among the main causes for traffic accidents. The risk also becomes more challenging to predict for off-road heavy vehicles, for which the incipient rollover might be triggered by external factors, i.e., road irregularities, bank angles as well as by aggressive input from the driver. The recent advances in road profile measurement and estimation systems make road-preview-based algorithms a viable solution for the rollover detection. This paper describes a model-based formulation to analytically evaluate the load transfer dynamics and its variation due to the presence of road perturbations, i.e., road bank angle and irregularities. An algorithm to detect and predict the rollover risk for heavy vehicles is also presented, even in presence of irregular road profiles, with the calculation of the ISO-LTR Predictive Time through the Phase-Plane analysis. Furthermore, the artificial intelligence techniques, based on the recurrent neural network approach, is also presented as a preliminary solution for a realistic implementation of the methodology. The paper finally assess the efficacy of the proposed rollover predictive algorithm by providing numerical results from the simulation of the most severe maneuvers in realistic off-road driving scenarios, also demonstrating its promising predictive capabilities.

1. Introduction

Nowadays, vehicle rollover detection and prevention are two critical aspects that must be taken into account for the safety of car passengers and pedestrians to avoid dramatic fatal crashes [1] and accidents in the urban scenario. An analysis of the sequence critical events leading to loss of control, and hence to rollover of vehicles equipped with Electronic Stability Control (ESC) Systems is provided in [2], while typical scenarios and characteristics of rollover accidents are investigated in [3], referring to the test criteria of National Highway Traffic Safety Administration (NHTSA) [1,4]. Vehicles with a high position of the Centre of Gravity (CoG) are more prone to rollover, as it happens for buses [5,6], heavy commercial vehicles [7,8], and articulated heavy vehicles [9,10,11,12,13,14]. In a similar way, two-wheel vehicles are affected by stability issues [15,16]; hence, their components must be dynamically optimised [17], through a component to assembly dynamic analysis [18,19]. The rollover prevention is a typical challenge for the automotive sector, especially for fuel cell and hydrogen trucks, where the safety requirements demanded for their storage systems are stricter than for light-duty vehicle segments [20].
The root cause of rollover can be addressed to external factors, i.e., road irregularities and its bank angle, which also influence the powertrain management [21], and to aggressive input from the driver on the steering wheel. Considering these factors, rollovers are sometimes categorized, as conducted in [22,23,24], into two main types: un-tripped rollovers and tripped rollovers. The former [25] is related to driver fast maneuvering on smooth roads, while the latter [26] occurs due to sudden impacts that may apply lateral or vertical forces to the vehicle tyres [27,28], hence possible root causes are impacts with guardrails or hits with road objects as curbs and bumps [29]. In the last decades many researchers have studied the vehicle rollover risk, whose knowledge is mandatory for developing practical rollover prevention systems, which may be implemented using different control logic, through a two-stages process. Indeed, the first step is the detection of rollover risk, whereas the second is its mitigation and control, e.g., through an active handling suspension controller [30] or by means of a Model Predictive Control (MPC) strategy through active front steering [31], or using a braking system for vehicle dynamics control [32]. Several rollover indices (RIs) have been proposed in literature, starting from static rollover index, as the Static Stability Factor (SSF) [33,34,35], which only considers the geometrical parameters of vehicles. The vehicle dynamics [36,37] plays a key role in the rollover risk phenomena, and hence also for the indicators adopted to prevent it, which consider the most important vehicle states for rollover, such as roll angle and roll rate [38,39,40], lateral acceleration [41,42,43,44], side slip angle [45], yaw angle [46] and yaw rate [47,48]. The load transfer ratio ( L T R ) [49,50,51], which is based on the computation of vertical tire forces, is one of the widely used RIs for dynamic simulations, and shows a direct measure of how close the vehicle is to rollover [49]. A predictive L T R [52] has been proposed to provide a better prediction of rollover propensity w.r.t traditional L T R , while in [53] the contour line of load transfer ratio (CL-LTR) is proposed for an accurate prediction of vehicle rollover threat. Moreover, time to rollover ( T T R ) [39,43] and the rollover index (RI) [38,54] are used widely for the rollover risk detection. At a glance, many RIs have been proposed in literature, with slight differences on the factors affecting the rollover, thus some RIs are more adapt for specific rollover conditions and not work well in other situations. For example, an extensive research investigation is focused on the untripped rollover risks and only a minimal attention is reserved to tripped rollover conditions which represent the most critical aspect for off-road and autonomous driving applications where the disturbance from the external environment play an important role [55]. Additionally, the artificial intelligence (AI) techniques are also proposed in literature [56,57] to obtain better anti-rollover prevention features. In particular, [58] has identified the Recurrent Neural Networks (RNN) as potential rollover risk-detector algorithm. However, by considering time and costs constraints [59], the big experimental data required to generate an efficient algorithm is not always possible.
Based on the widespread and in-depth bibliographic research found in the literature, to the knowledge of the authors, there are still many open questions on the rollover prevention assessment that the present activity attempts to solve. This paper aims to cover some relevant aspects in the the detection and prevention of the incipient rollover, with the following contributions:
  • The development of a non-linear three degrees-of-freedom mathematical model as simple as effective to catch the lateral load transfer dynamics even in presence of a banked road;
  • The formulation of a model-based algorithm for the analytical identification of the critical rollover limits through the development of characteristic maps in the phase plane portrait, able to exhibit the influence of road local irregularities and global geometric factors, i.e., the bank angle;
  • The formulation of a statistical algorithm, based on the recurrent neural network approach, for the estimation of the load transfer ratio in a realistic scenario, by considering typical measurable quantities available for an experimental implementation;
  • The numerical assessment of a real-time algorithm able to predict in advance the time to reach a specific load transfer ratio considered as the incipient rollover limit.
It is also important to note that one of the most important advantages related to the methodology described in the paper is the versatility of application to different powertrain and vehicle architectures, by providing an algorithm that requires the typical measurements available onboard the vehicle.
The manuscript is organised as follows: Section 2 describes the set of equations used for modelling the non-linear vehicle roll dynamics; Section 3 presents the two algorithms adopted for the load transfer ratio estimation; the the phase plane analysis of load transfer characteristics is carried out in Section 4; the ISO-LTR predictive time is introduced in Section 5 and its simulation assessment is shown in Section 6; finally, some conclusions are drawn in Section 7.

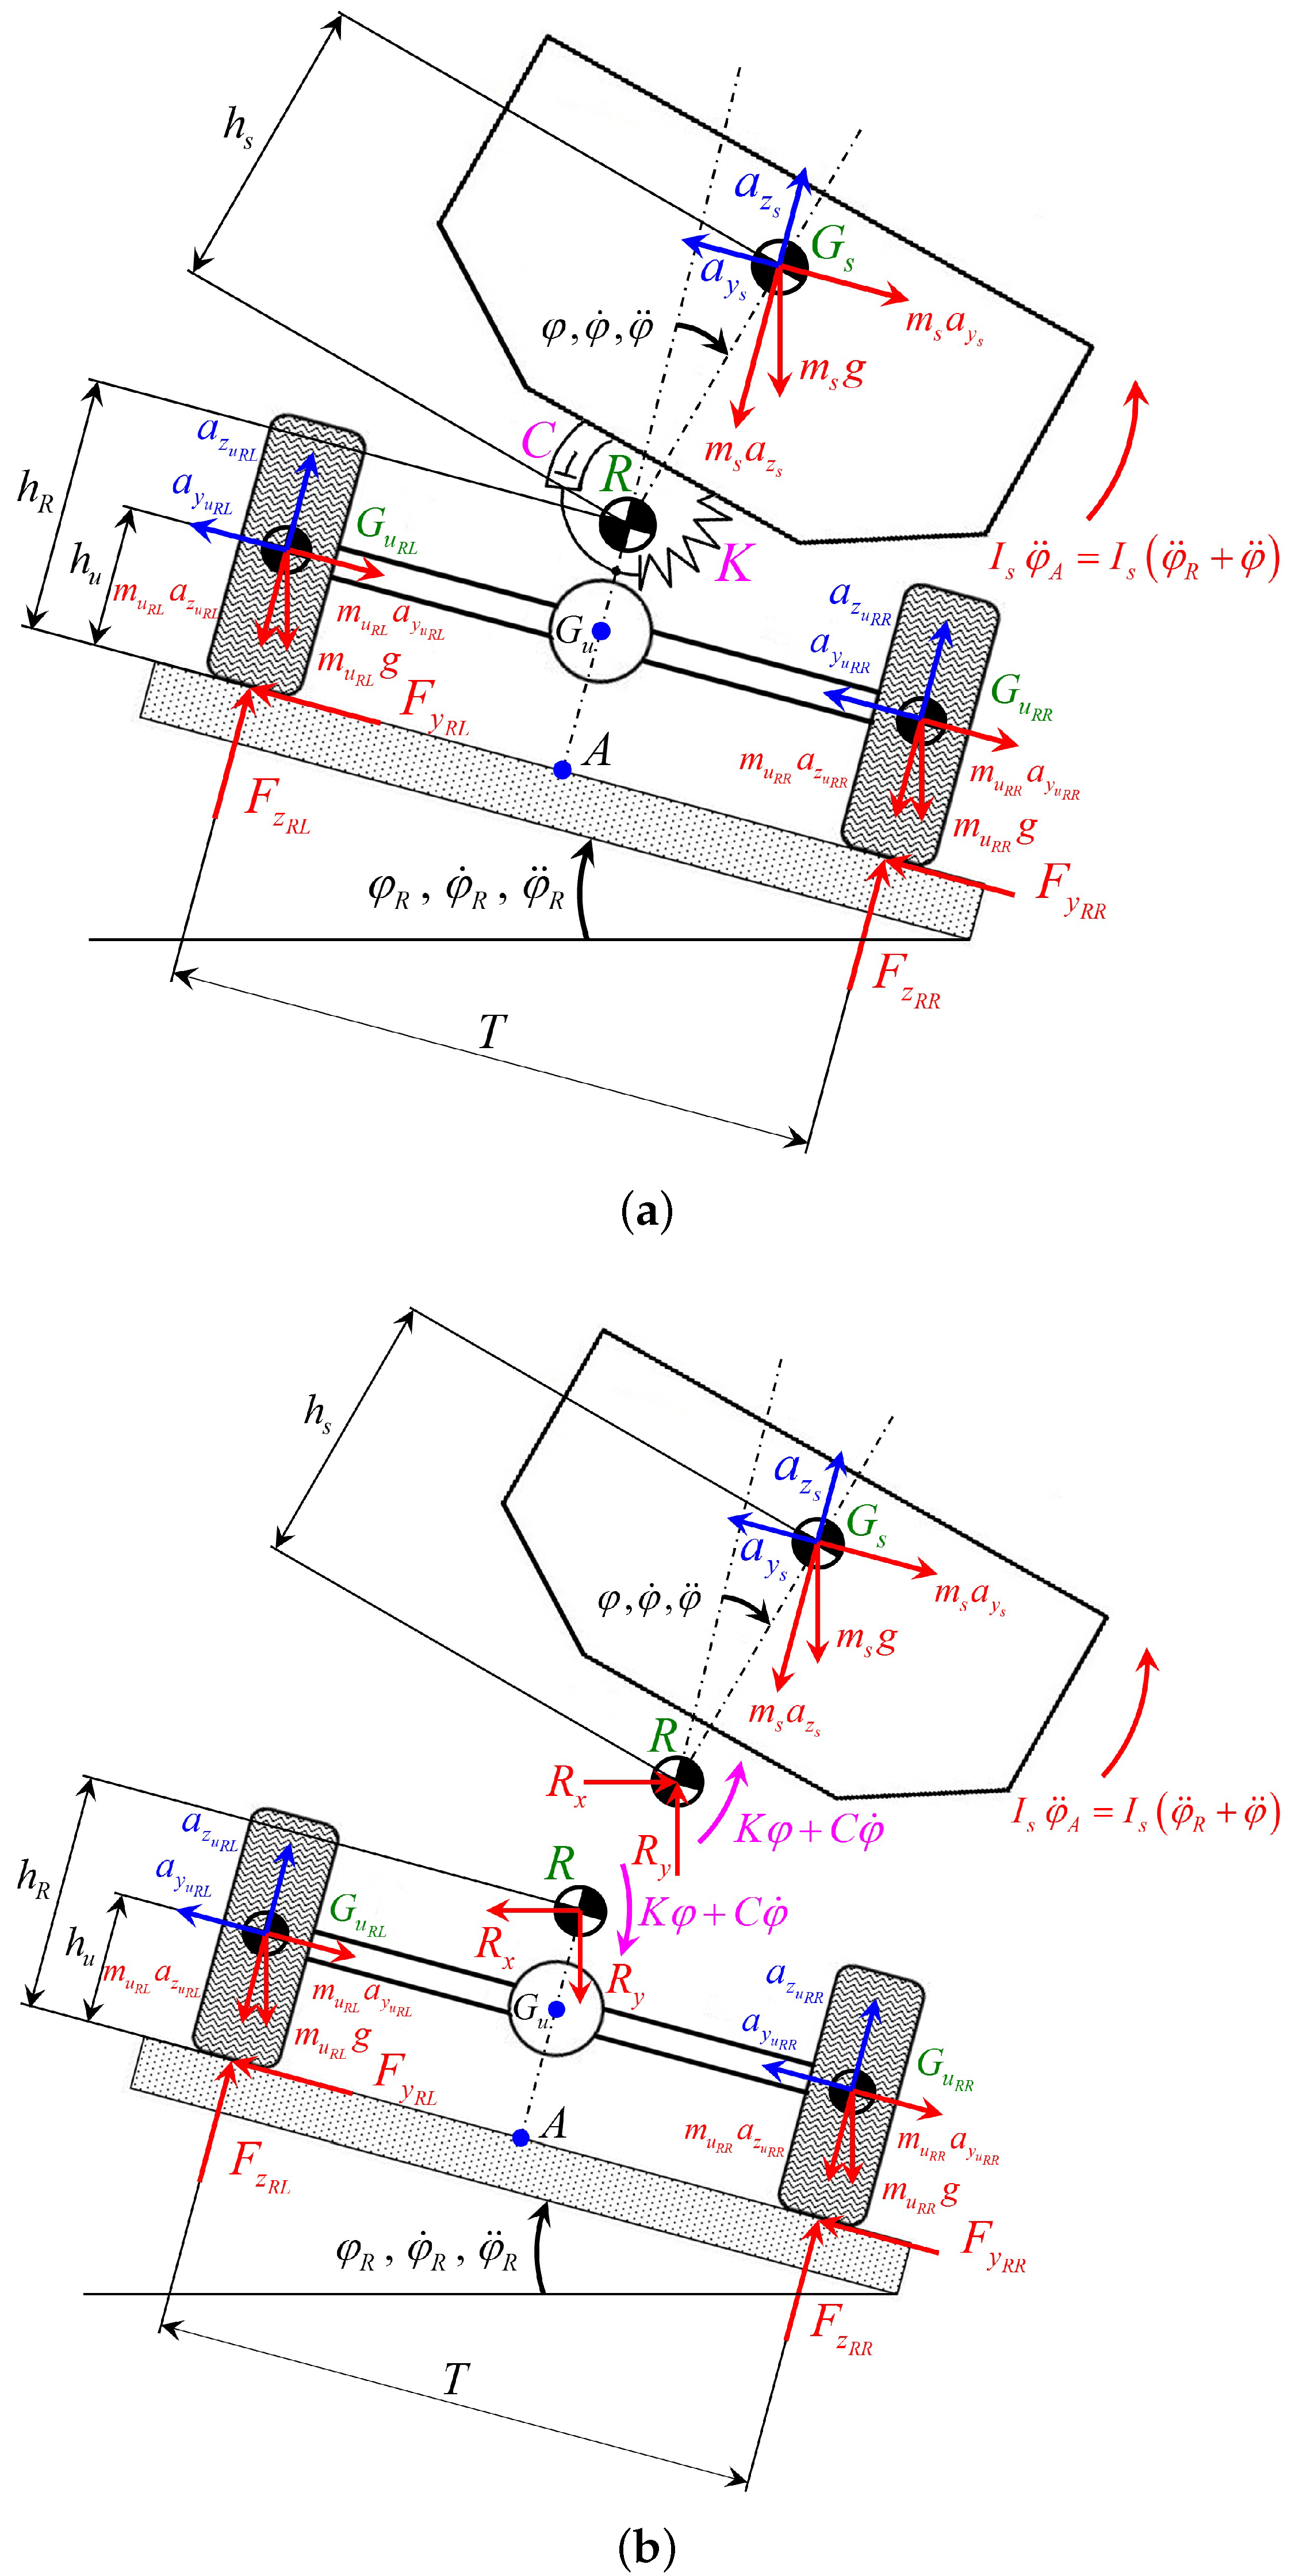
2. Vehicle Model Description

The evaluation of the rollover condition, together with the definition of a predictive index to prevent the incipient risk, is firstly carried out by investigating the influence of the most relevant quantities on the load transfer dynamics. A straightforward methodology is proposed with a three degrees-of-freedom (dofs) vehicle model to obtain an analytical and a straightforward approach for analysing the vehicle roll dynamics on flat and banked roads. The 3-dofs of the vehicle model, whose scheme is reported in Figure 1, are the vertical and the lateral vehicle motions (with respect to the road plane) and the relative roll motion between the sprung and the unsprung masses. The virtual roll axis is R, G s is the CoG of the sprung mass and G u i is the CoG of the i t h = F L ,   F R ,   R L ,   R R unsprung mass. The hypothesis behind the model are:
1.
All the bodies below the suspension system (tires, calipers, wheels carriers, suspension rods, etc. …) are considered as a unique rigid body, connected to the sprung mass m s through the virtual roll axis R, and represented by four lumped masses m u i , where i = F L , F R , R L and R R , each one placed in the the Front Left (FL), Front Right (FR), Rear Left (RL) and Rear Right (RR) wheel rotational centers, respectively;
2.
The roll moment of inertia of the unsprung mass is considered negligible;
3.
The road bank angle ϕ R is supposed to be equal for the front and the rear axles: absolute roll angle of the unsprung mass is ϕ R ;
4.
The front and rear suspensions are represented as an equivalent torsional spring and damper system.
From Figure 1a, the following set of equilibrium equations for the whole vehicle is drawn:
F z R + F z L m s a z s i m u i a z u i m g cos ϕ R = 0 F y R + F y L m s a y s i m u i a y u i m g sin ϕ R = 0 F z R F z L T 2 m s a y s h R + h s cos ϕ m s g h R sin ϕ R + h s sin ϕ R + ϕ + m s a z s h s sin ϕ i m u i a y u i h u m u g h u sin ϕ R G I s ϕ ¨ R + ϕ ¨ = 0
where F z R = F z F R + F z R R and F z L = F z F L + F z R L are the total vertical forces on the right and left tyres, respectively. F y R = F y F R + F y R R and F y L = F y F L + F y R L are the right and left side total lateral forces, respectively. m s is the sprung mass, m u i is the i t h = F L , F R , R L , R R lumped unsprung mass ( m u = i m u i ) and m = m s + m u is the vehicle total mass. a z s and a z u i are the vertical components of the sprung and i t h unsprung mass, respectively. a y s and a y u i are the lateral components of the sprung and i t h unsprung mass, respectivelly. Moreover, the two angle ϕ R and ϕ are the bank angle and the roll angle of the sprung mass w.r.t. the unsprung mass. The absolute sprung mass roll angle is ϕ A = ϕ R + ϕ . h u and h R are the heights of the unsprung mass and roll centre from the road, respectively, and h s is the distance between the sprung mass CoG from the roll centre. g is the gravity acceleration, T is the vehicle track width and I s is the roll sprung mass moment of inertia. R x and R y represent the horizontal and vertical components of the internal reaction in the virtual roll axis, respectively.
The term G groups together the relative vertical dynamics between the left and right unsprung masses and it is defined as reported in Equation (2):
G = T 2 m u F R a z F R + m u F L a z F L m u R R a z R R m u R L a z R L
The roll equilibrium equation for the vehicle unspung mass from Figure 1b is:
F z R F z L T 2 = = F y R + F y L h R i m u i a y u i + m u g sin ϕ R h R h u + K ϕ + C ϕ ˙ G
where K and C are the roll stiffness and damping, respectively. Finally, roll equilibrium equation for the vehicle sprung mass from Figure 1b is:
I s ϕ ¨ R + ϕ ¨ + K ϕ + C ϕ ˙ = m s a y s h s cos ϕ + m s a z s h s sin ϕ + m s g h s sin ϕ
The heavy vehicle analysed within the present paper is defined by the parameters listed in Table 1.

3. Load Transfer Ratio Estimation

The most accurate, and widely disseminated, index for detecting the incipient rollover risk is the Load Transfer Ratio ( L T R ) defined as the the relative vertical force on tires between the right and left sides of a vehicle:
L T R = F z R F z L F z R + F z L
When the L T R is equal to 0, the vertical load is equally distributed between the two sides, by means that the vehicle is far away from the rollover condition. The vehicle is very likely to rollover when the wheels on one side lift off the ground, condition verified when L T R = ± 1 .
However, the experimental acquisition of L T R is not feasible to realize since there are no sensors able to provide a direct measurement of the vertical tire load. For this reason, many authors have proposed multiple solutions to provide an accurate estimation of the L T R from the measurements commonly available onboard passenger cars, e.g., accelerations, linear and angular velocities, roll and pitch angles. Simple static [34,35], and dynamic indices have been used, in different works analysed in [24], to detect rollover risk during dynamic manoeuvres. The L T R proposed in [60] only considers the lateral acceleration and the roll angle, while [61,62] neglects the unsprung masses, by placing the roll centre very close to the road plane at h R 0 and assuming the vehicle CoG height as the effective arm for lateral acceleration. Other proposed L T R indices are based on suspension parameters [50,63], by considering the effective torsional stiffness, torsional damping, roll angle and roll rate, and subsequently revised in [64] with the inclusion of the sprung mass lateral acceleration. RIs based on the tyre deflection is proposed in [65,66], also adapted for heavy vehicles. A more complex index, which considers the rolling motion, the lateral acceleration, and the time to wheel lift (TTWL) is proposed in [38], where the TTWL is achieved with a phase plane analysis of roll angle and roll rate. Although a RI for banked roads is already developed in [67], the road bank angle influence receives a lower attention from the literature since its effect is not as relevant as for off-road designed vehicles. Finally the index proposed in [22] tries to to consider both tripped and untripped rollovers, by developing a four dofs vehicle model.
However, most of the above mentioned formulations does not include the influence of road global, i.e., bank angle, and local, i.e., speed bumps or potholes, irregularities on the load transfer among the four wheels, which represents a fundamental aspect for the off-road driving scenario. The present section of the paper describes a model-based and a statistic formulation for the L T R estimation. The first approach aims at providing an analytical methodology to express the L T R as function of the vehicle states and road profile, able to predict their influences on the L T R dynamics. However, the accuracy of the model-based estimation is drastically affected by the model parameters uncertainties, a drawback that is improved by proposing an alternative approach based on the Recurrent Neural-Network (RNN) theory, thus allowing an improved estimation of the L T R directly from conventional measurements.

3.1. Model-Based Estimation
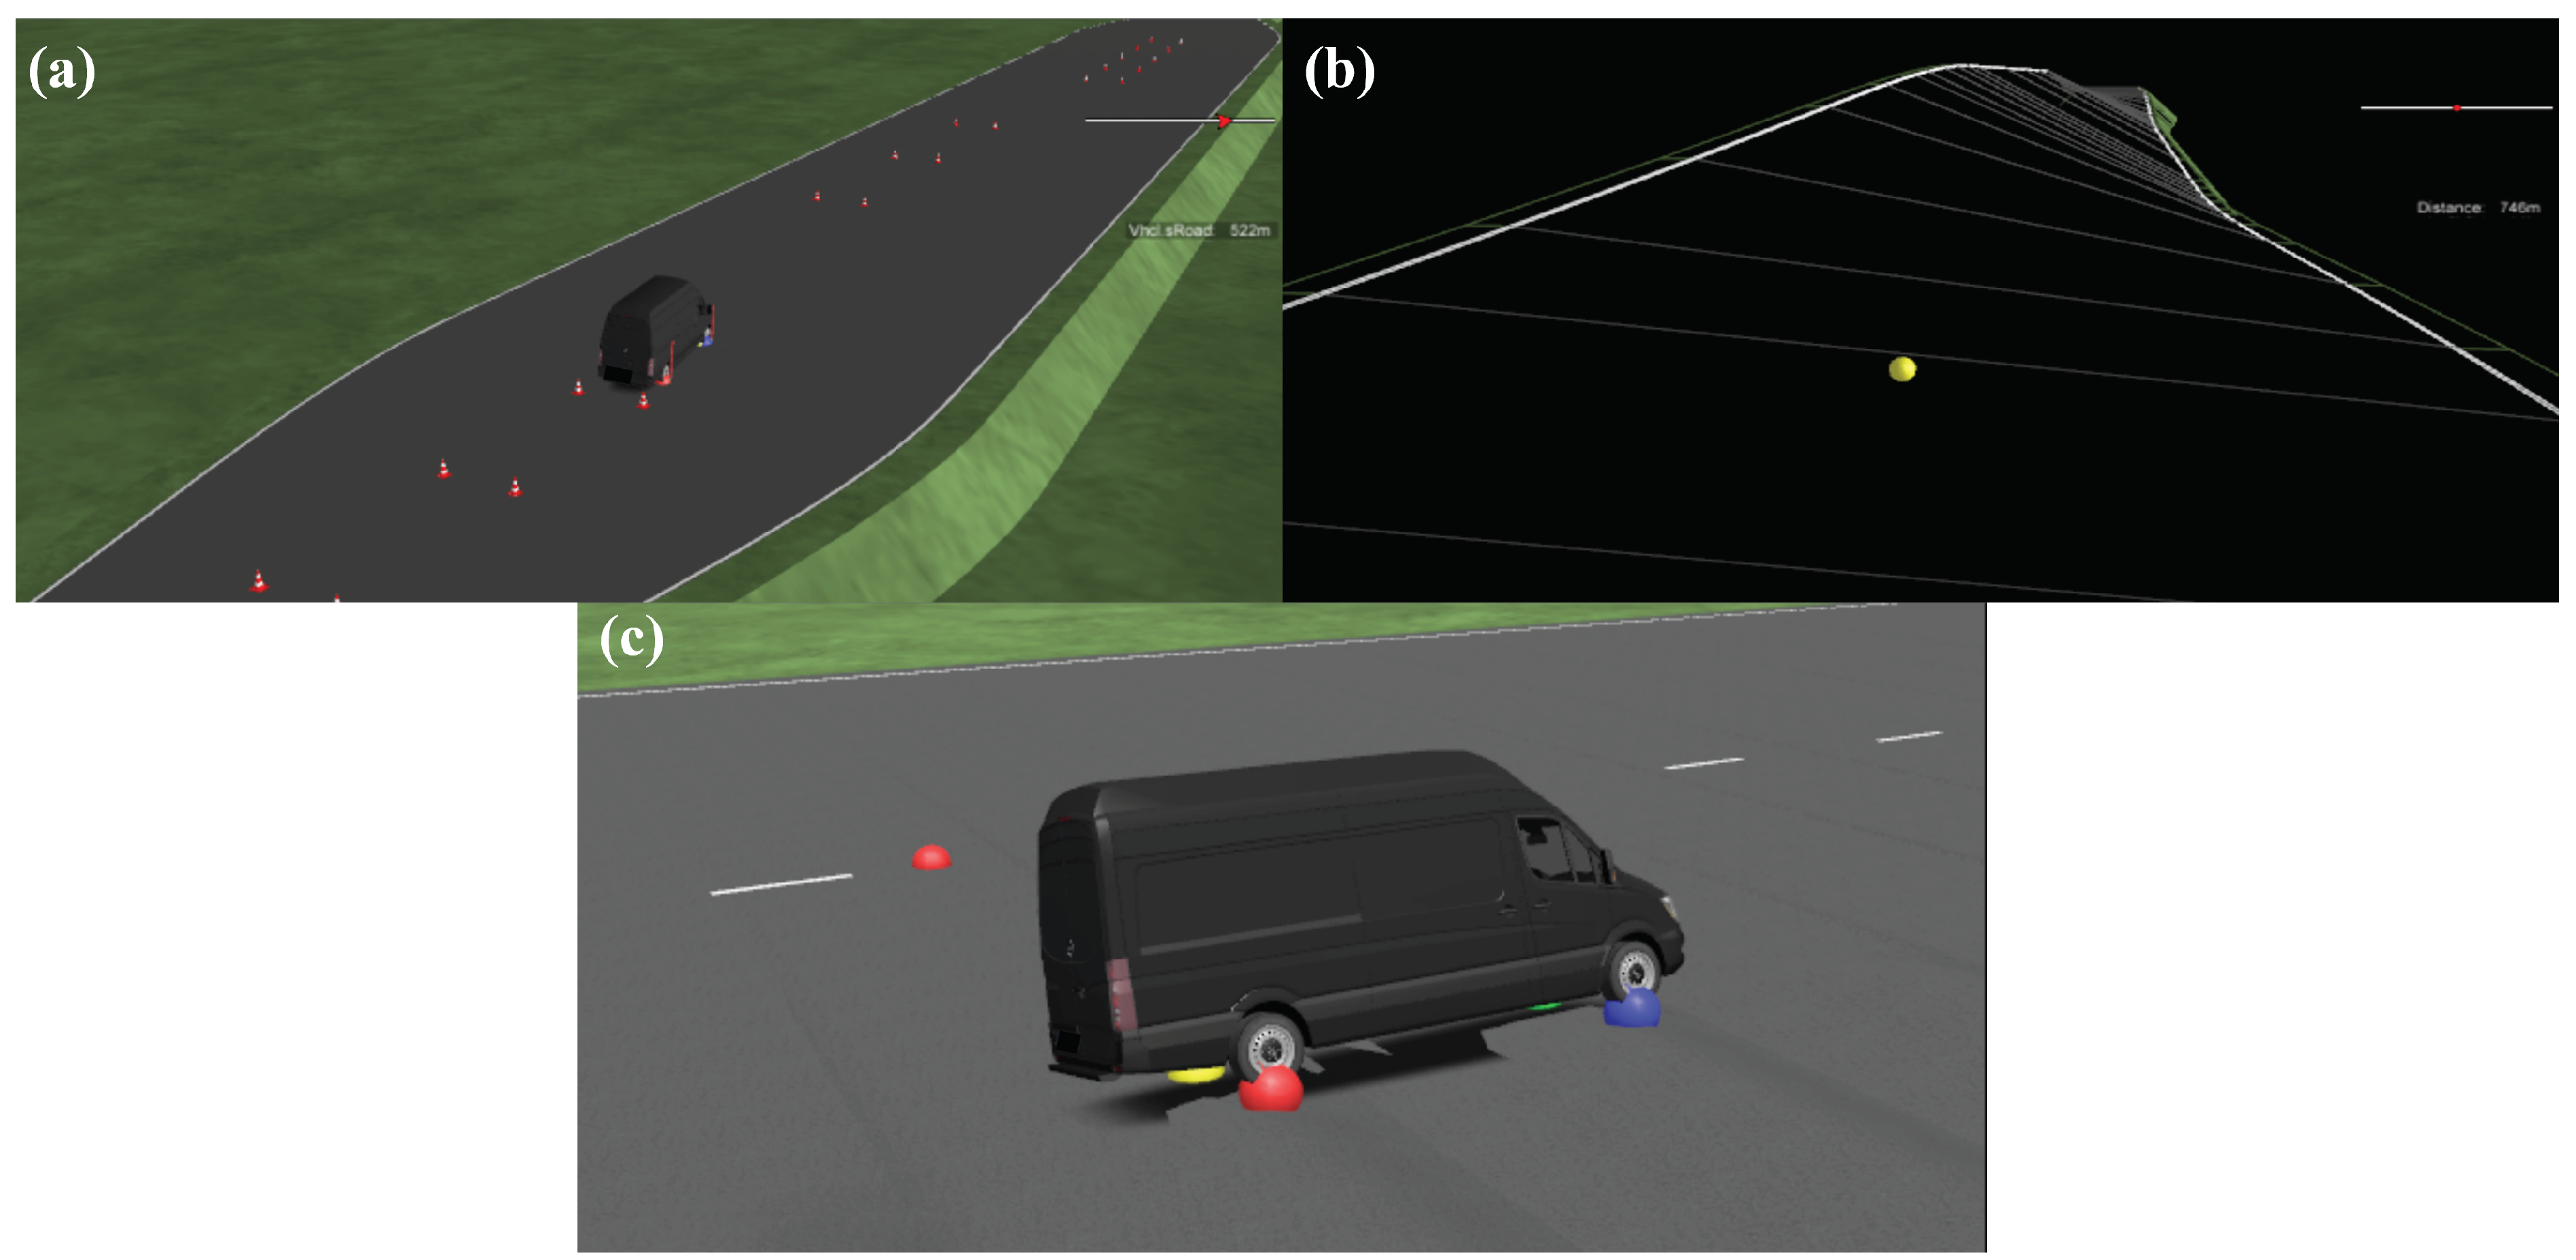
The L T R model-based estimation is obtained from the 3-dofs model presented in the previous section. By combining the roll equilibrium equations of Equations (1) and (4) and by considering the vertical equilibrium equation in Equation (1), the LTR is then calculated as follows:
L T R e s t = 2 T K ϕ + C ϕ ˙ + m s a y s h R + i m u i a y u i h u + m s g h R + m u g h u sin ϕ R G m g cos ϕ R + m s a z s + i m u i a z u i
For a direct comparison against the L T R formulation commonly available in the literature, the particular cases of a ) negligible unsprung dynamics and vertical accelerations ( m u i = 0 and a z s = a z i = 0 ) and b ) negligible unsprung dynamics and vertical accelerations on a flat road ( m u i = 0 , a z s = a z i = 0 and ϕ R = 0 ) are also reported in Equation (7) and in Equation (8):
L T R e s t , s p r u n g = 2 T K ϕ + C ϕ ˙ + m s a y s h R + m s g h R sin ϕ R m g cos ϕ R
L T R e s t , f l a t = 2 T K ϕ + C ϕ ˙ + m s a y s h R m g
Three driving scenarios, shown in Figure 2, are built in IPG CarMaker® to simulate the realistic behavior of a heavy duty vehicle and to compare the efficacy and the reliability of the L T R formulations in Equations (6)–(8):
(a)
A double lane change manouvre (ISO 3888-1) on a flat road at an initial vehicle speed of 100 km / h ;
(b)
A straight manoeuvre on a banked road, whose bank angle is smoothly increased from 0 deg to 30 deg , at constant vehicle speed ( 30 km / h );
(c)
A straight manoeuvre on a road with a flat surface under the left vehicle side and an asymmetrical sinusoidal profile (wavelength equal to the vehicle wheelbase and height amplitude of 10 cm ) under the right vehicle side, called asymmetrical waves road in the rest of the paper.
The first scenario is chosen to evaluate the influence of the maneuver severity, imposed by the driver behavior, on the L T R dynamics. The simulation results are reported in Figure 3, in terms of L T R estimation, driver commands, vehicle speeds, accelerations and roll angles.
Figure 3 shows that the manoeuvre is aggressive enough to push multiple times the L T R towards the rollover condition. It is clear that the lateral acceleration, imposed by the severity of the test and by the dynamic response of the driver, represents the main cause for the marked transfer loads from one vehicle side to the other one. Indeed, the road is flat and does not influence the roll dynamics meanwhile the unsprung mass only slightly affect the L T R dynamics, as shown by the comparison of L T R e s t against L T R e s t , s p r u n g and L T R e s t , f l a t , due to the low frequency content of steering wheel angle imposed by the driver.
The second scenario aims at investigating the effect of the road bank angle on the vehicle transfer loads, as shown in the simulation results of Figure 4.
The straight manoeuvre is selected to minimize the influence of lateral accelerations and to focus the attention on the bank angle effect on the load transfer dynamics. The road is banked up to 30 deg that represents a suitable threshold for approaching the rollover limit, identified by the condition L T R = 1 . The general formulation of L T R e s t is able to provide a perfect estimation of the actual L T R , meanwhile the basic formulation L T R e s t , f l a t completely underestimate the load transfer behavior since it is valid only for flat roads. The estimation L T R e s t , s p r u n g is closer to the actual L T R behavior than the L T R e s t , f l a t , but it shows a lower accuracy at high bank angles since the unsprung mass still play an important role in the roll dynamics, although m u represents only the 16 % of the total vehicle mass. Finally, the last driving scenario is designed to evaluate the influence of the unsprung mass on the L T R estimation, by exciting the vehicle roll dynamics with a sinusoidal road profile applied only to the right side of the vehicle. The manoeuvre on the asymmetrical waves road, with a wavelength equal to the vehicle wheelbase, is run at the constant speed of 40 km / h , in order to excite the higher frequency content of the unsprung mass vertical dynamics. The simulation results are shown in Figure 5.
This manoeuvre can also evaluate the effect of a local road disturbances, i.e., road bump, pothole, etc. …, which are typical conditions for the off-road applications and it has a different impact on the roll dynamics with respect to a global road geometry such us the presence of a bank angle. Indeed, the roll dynamics derived from the asymmetrical excitation induces a persistent condition of incipient rollover: during the small time frame of 1 s , the tires of the right vehicle side lift off three times. In this contest, the unsprung mass influence becomes much more important with respect the previous driving manoeuvres, and it is appreciable how the generic model-based estimation L T R e s t is still reliable in detecting the L T R dynamics, if compared against the other two formulations.

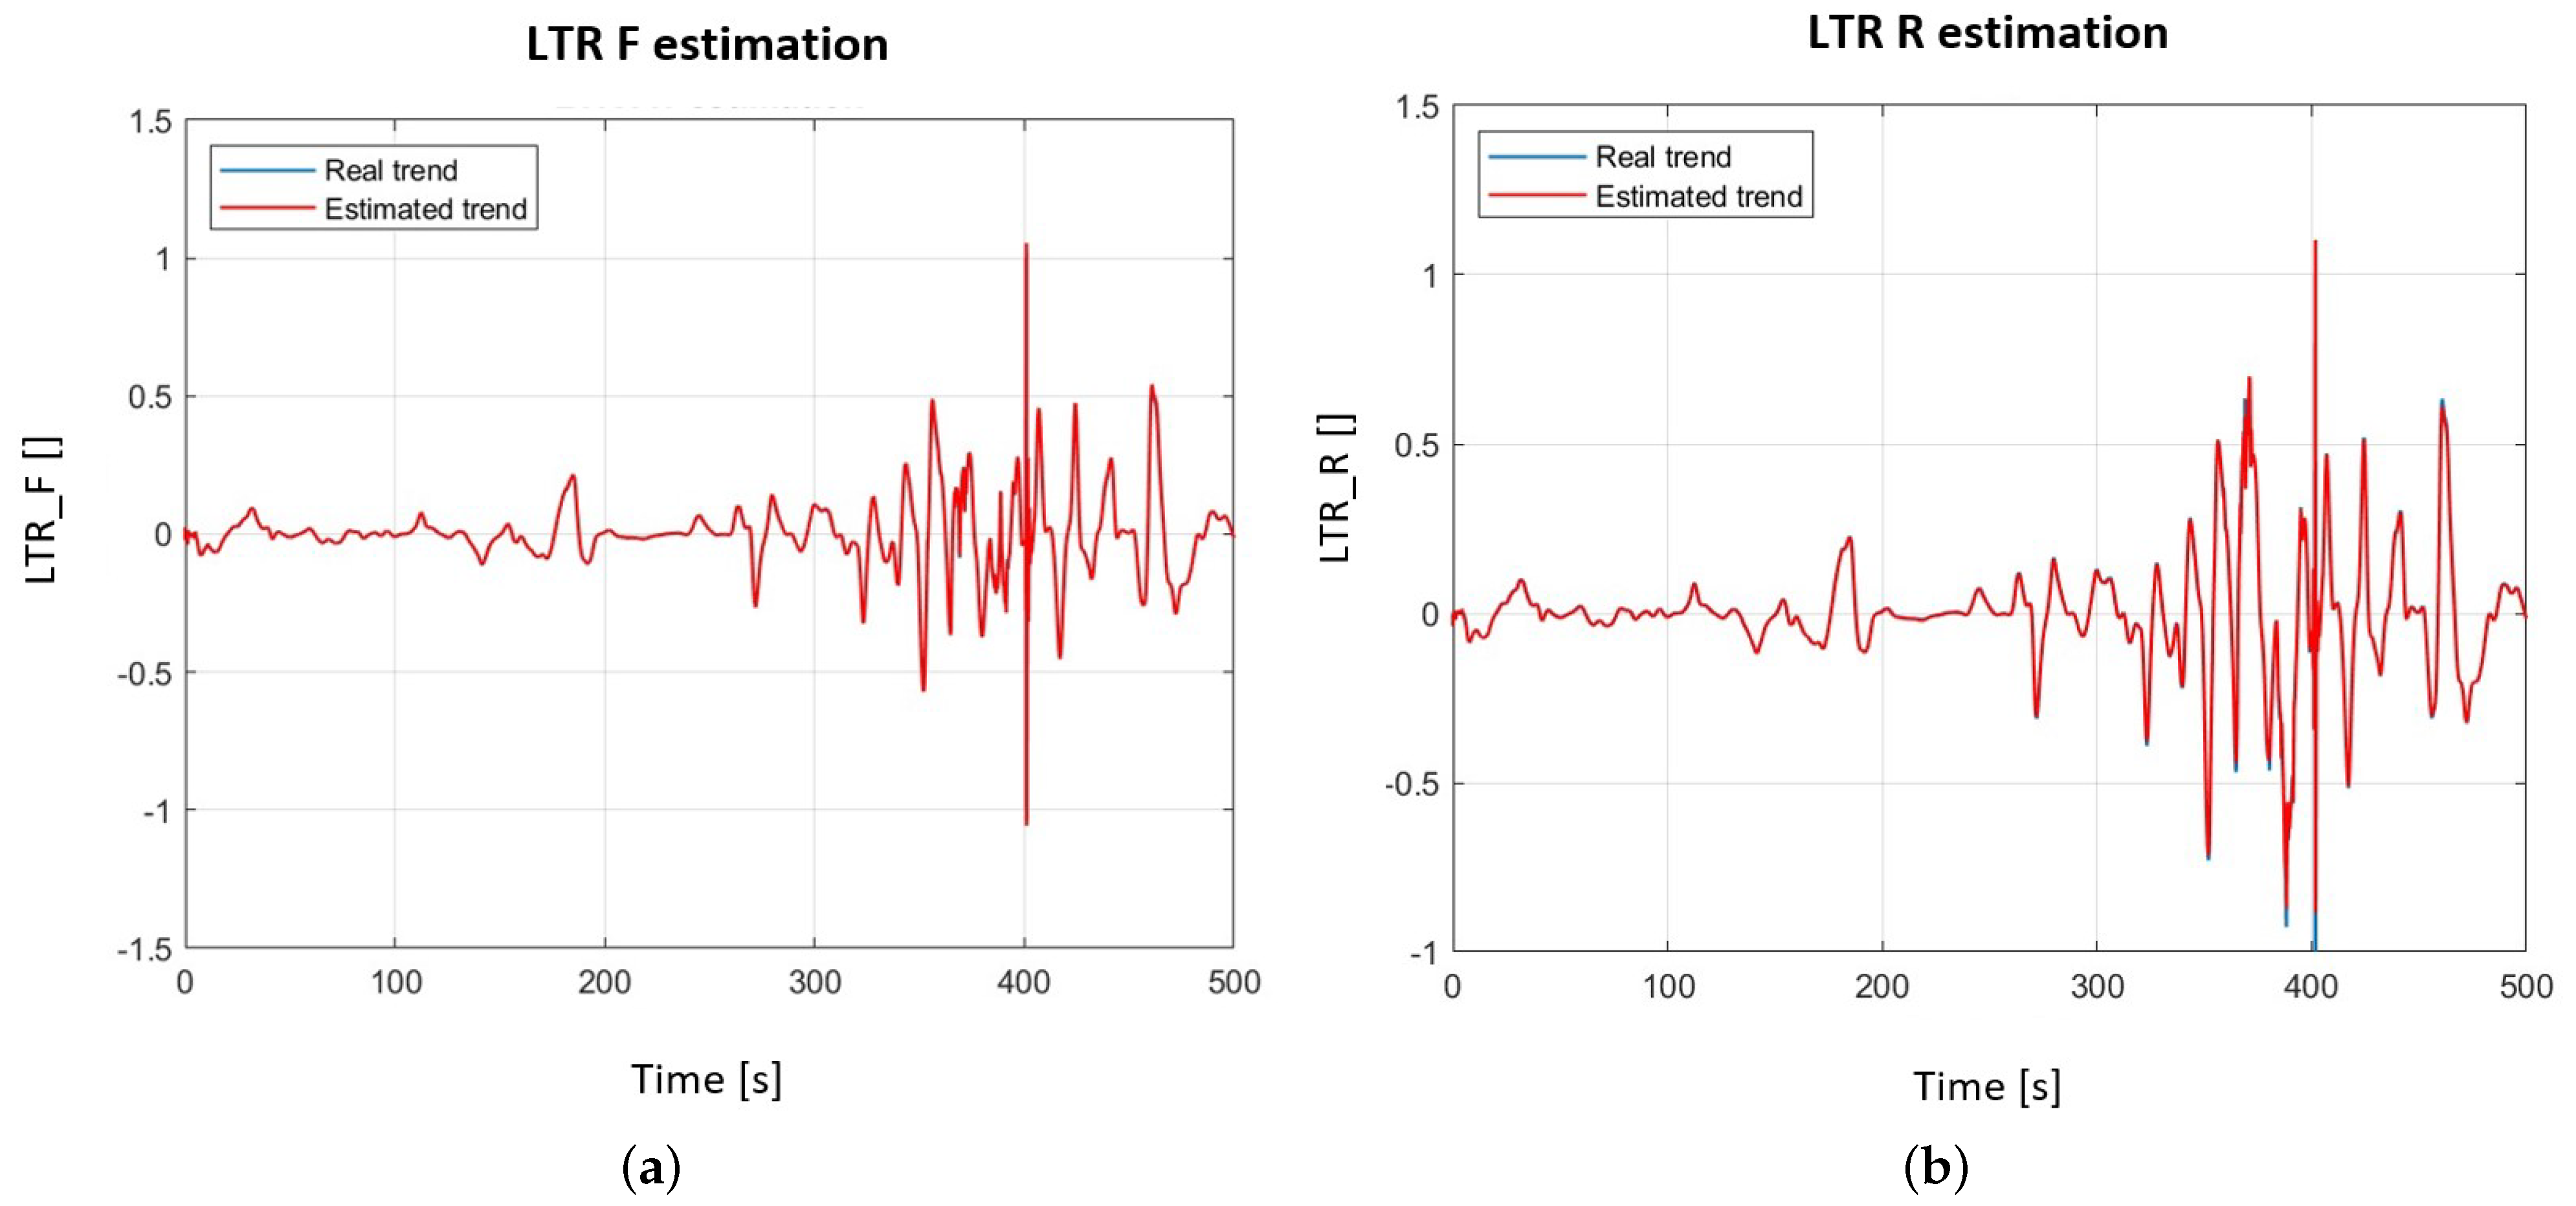
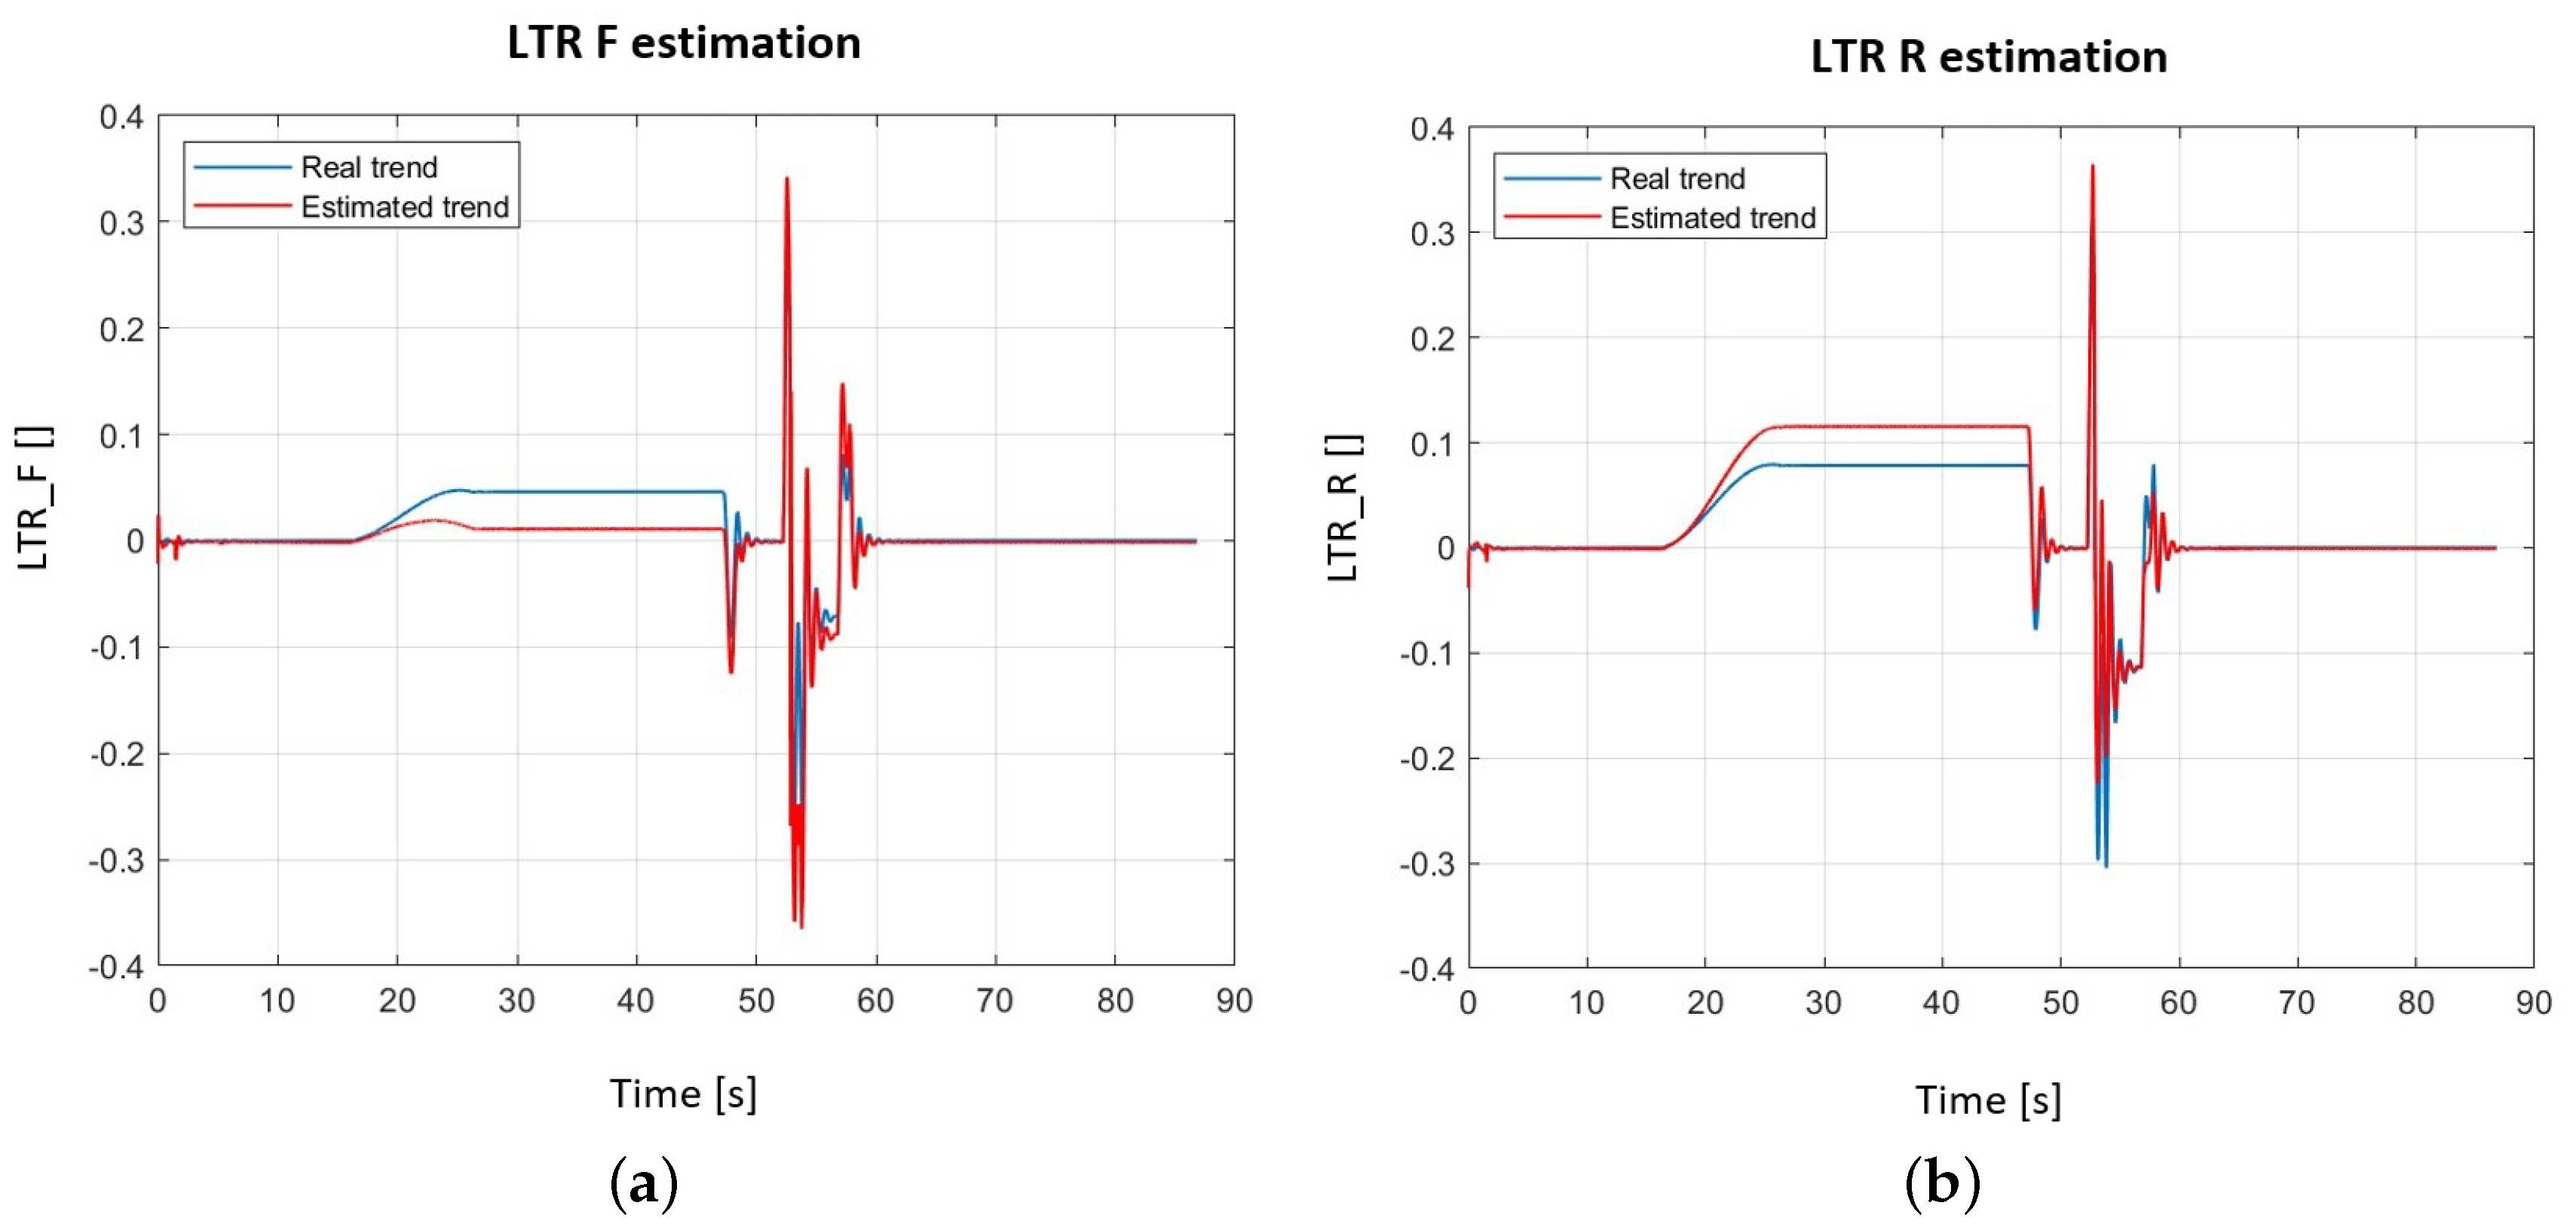
3.2. Recurrent Neural Network Estimation

As previously anticipated in Section 3, RNNs can be used to improve the estimation of rollover indicators, such as L T R and roll angle. The algorithm presented differentiates from the literature in terms of architecture, standardization method, inputs and outputs selection. In particular, the outputs are not defined as discretized quantities (higher or lower rollover risk factors), but they provide directly the estimation of the L T R . The RNNs method is chosen by considering the nature of the problem, since they belong to the category of artificial neural network designed to recognize patterns from a set of time histories.
The methodology adopted is characterized by two main phases. The first one consist in the generation of a large time domain dataset which is needed to successfully train the neural networks. Due to the big amount of required data, the time histories are generated by simulating the behaviour of the vehicle in the IPG CarMaker® environment. In particular, a set of 15 maneuvers (and related scenarios), are selected to induce the rollover risk. Each manoeuvre is 500 s long, to impose the same weight for the RNN training. In total, a starting dataset of 750 , 000 points is obtained for each variable of interest, sampled at constant frequency of 100 Hz . The variables obtained from IPG CarMaker® used for the neural networks inputs and outputs are shown in Table 2.
The approach developed suggests an integration between the neural network algorithm with the simulation environment (IPG CarMaker®), which represents its data provider. This leads to the following practical implications:
  • the RNN algorithm can be developed and tested with a considerable amount of simulated driving scenarios, without requiring an extensive experimental campaign, thus reducing time and costs;
  • If the vehicle dynamic behavior is well described by the mathematical model, the neural network designed with a simulated data can be directly deployed on an experimental setup with a lower time and cost effort.
The second phase consisted in the training and testing of the AI algorithms, articulating the process in several steps with the Deep Learning Toolbox available in Matlab®. Firstly, a data pre-process and normalisation elaboration is carried out to obtain dimensionless quantities. The processed data is then adopted to elaborate the architecture of the RNN, by testing multiple solutions, leading to the final solution reported in Table 3.
The features indicated in Table 3, corresponds to the inputs of the RNN, and so the responses for the outputs. In particular, regarding the RNN architecture selection, the number of hidden units (the neurons) is chosen through empirical rules. It has been observed that with more than 100 hidden units, the results do not improve in accuracy and the process becomes excessively time consuming, while a smaller number of neurons inevitably leads to a decline in terms of performance (measured by RMSE and loss function). The number and the typology of layers have been chosen following a similar criteria.
Given the RNN architecture, the algorithm training is ready to start by obtaining a neural network that, provided with the 8 inputs (Table 2), is able to estimate the 3 outputs with good precision and immediate response. This is also validated during the testing phase, where the features are known, and the vehicle responses not. The results related to three different maneuvers, generated in the IPG CarMaker® environment, are presented.
The first maneuver analyzed simulates the vehicle driving over the Bernina Pass. This is a completely unknown road to the RNN, and the results obtained, shown in Figure 6a,b are definitely promising in terms of accuracy (see the resultant Mean Absolute Error and Mean Square Error in Table 4). Moreover, the RNN estimates are collected in the lapse of 0.01–0.05 s . For the sake of brevity, results related to the roll angle have been omitted.
The second maneuver presented is obtained from one of the 15 database composing the training. The analysis aims at understanding if similar maneuvers to the ones already adopted for the RNN training, lead to an accuracy worsening, since the weights introduced in the RNN are influenced by the maneuvers set. Results in Figure 7a,b show how the RNN keep their high level of performance. There are only minimal differences that can be considered negligible for the required accuracy.
The Fishook manoeuvre, whose estimating results are shown in Figure 8a,b, produces the less promising results (as confirmed by Table 4). The reasons behind that is that the manoeuvre time length and speed profile are lower w.r.t. to the other manoeuvres introduced in the data set.
To provide a quantitative information related to the accuracy of the neural networks, the Mean Absolute Error (MAE) and the Mean Square Error (MSE) are reported for each manouvre in Table 4.

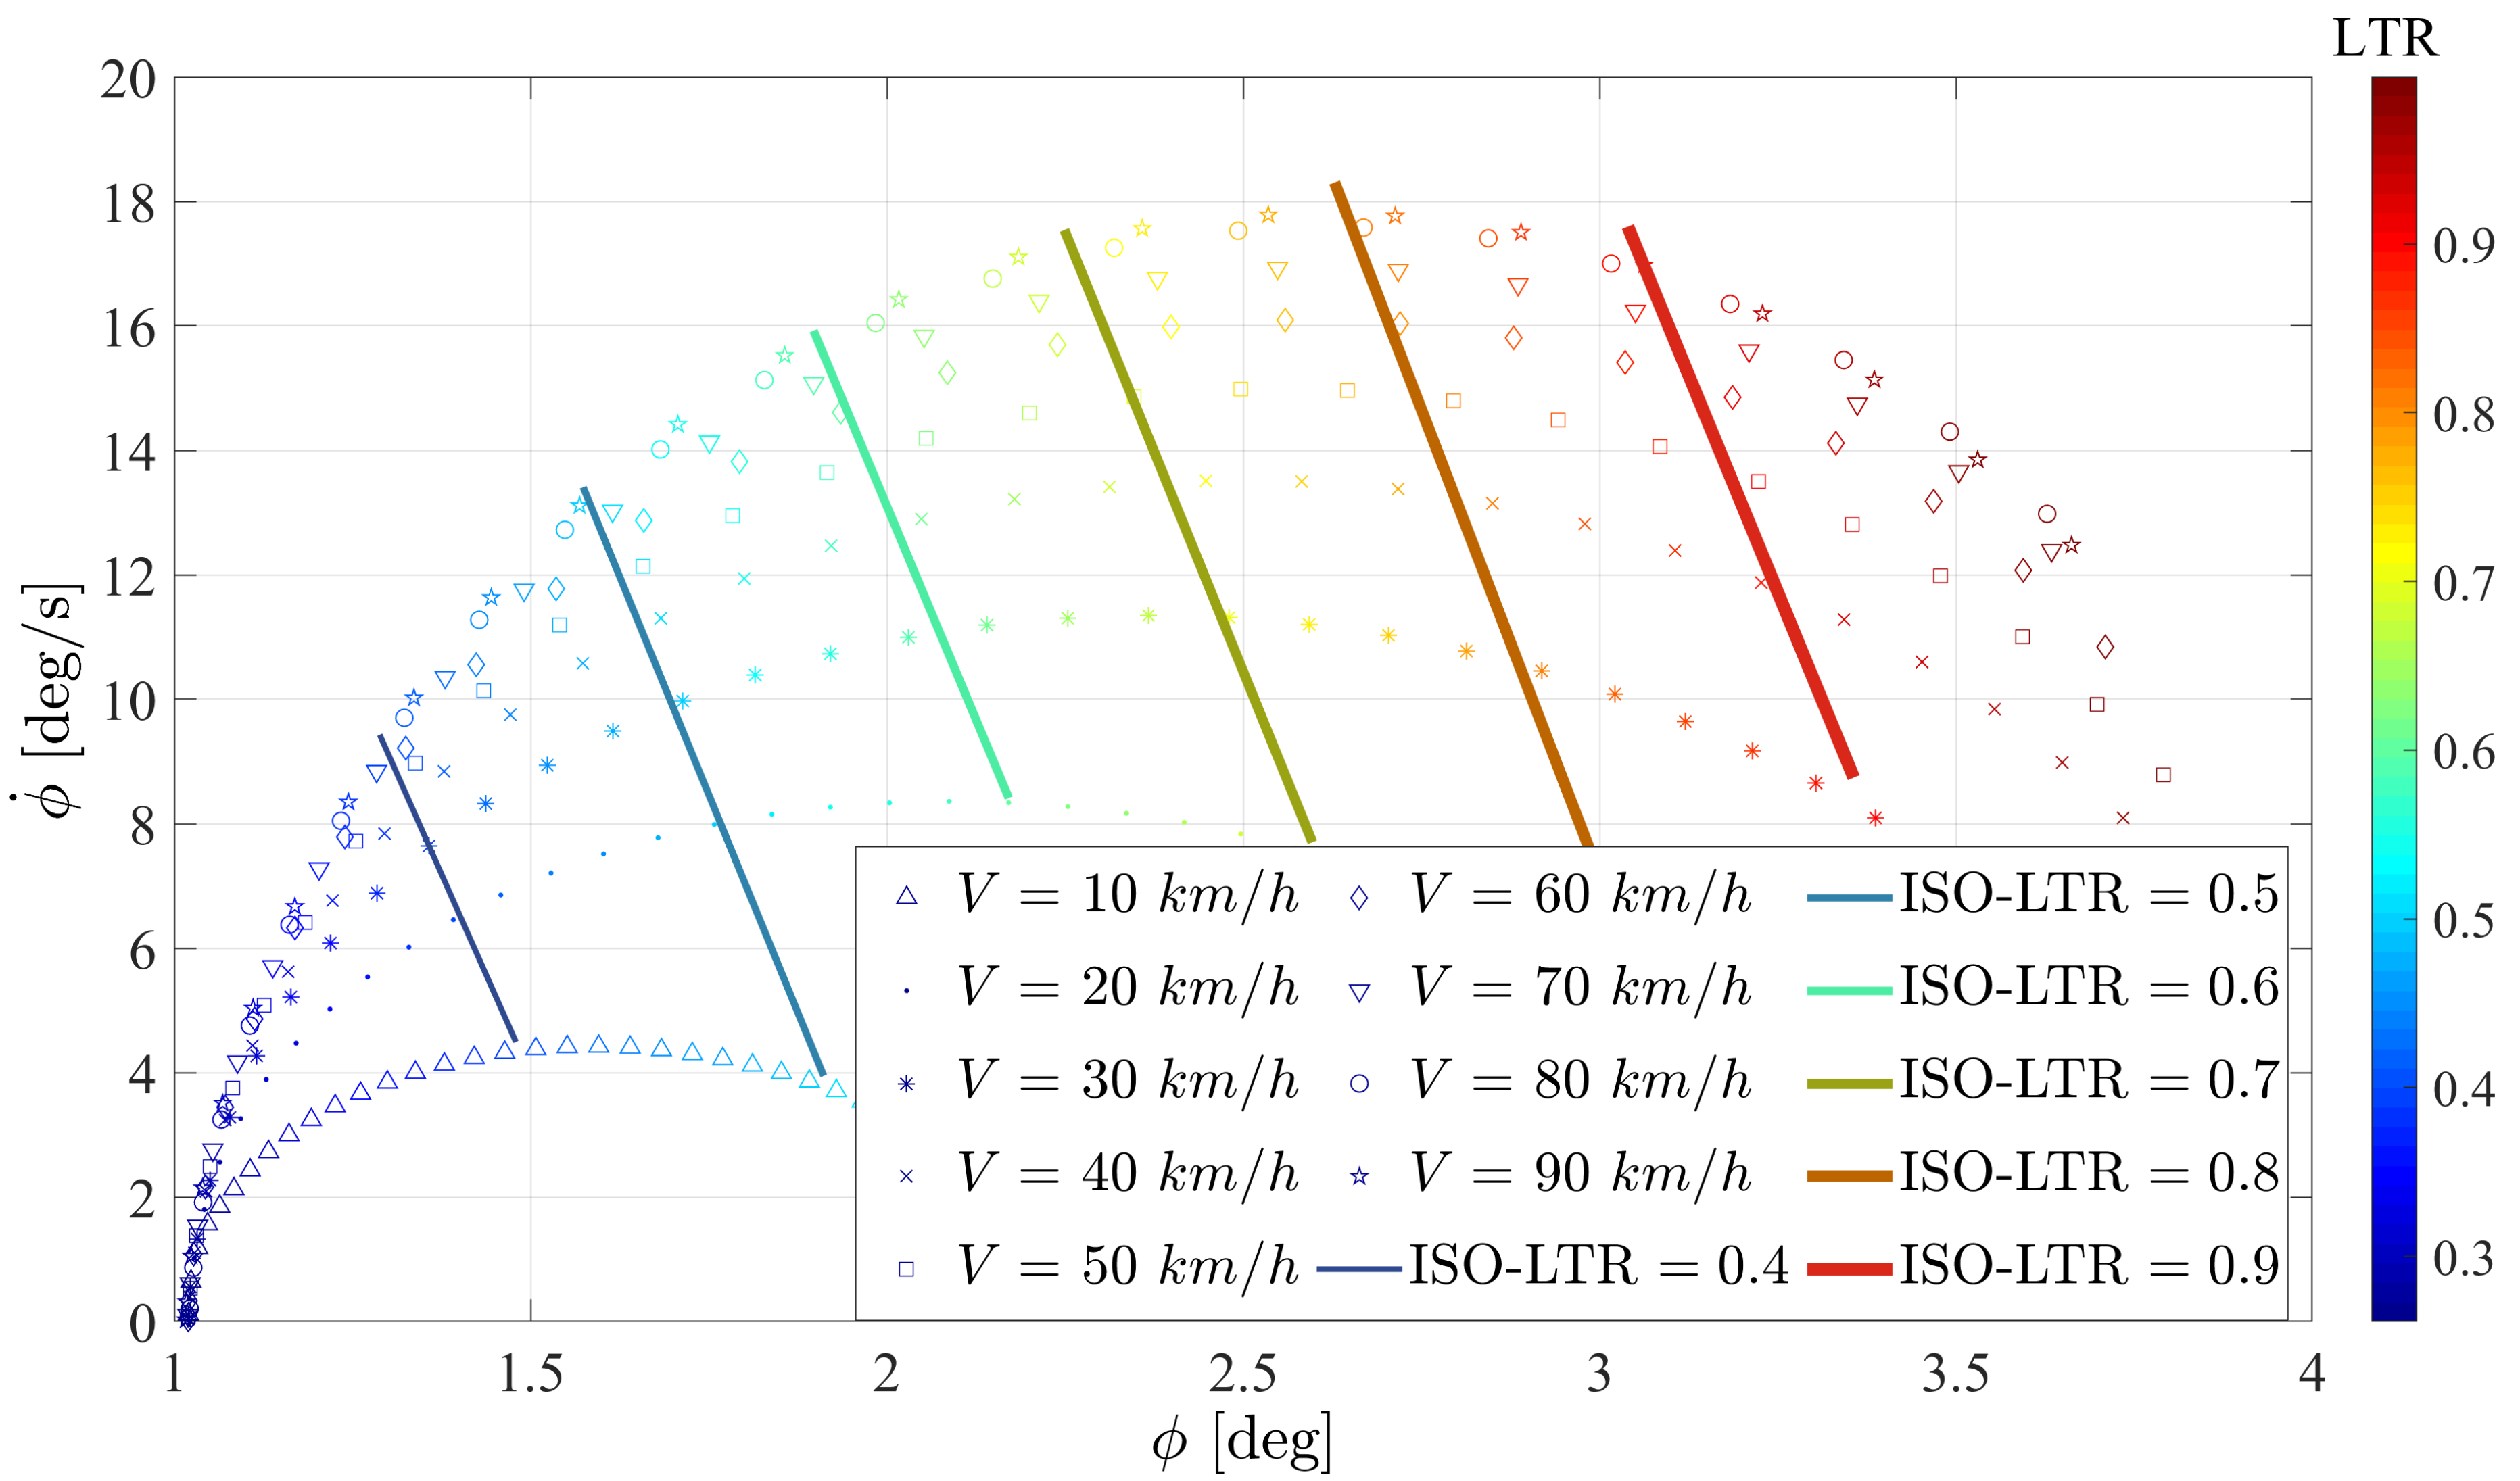
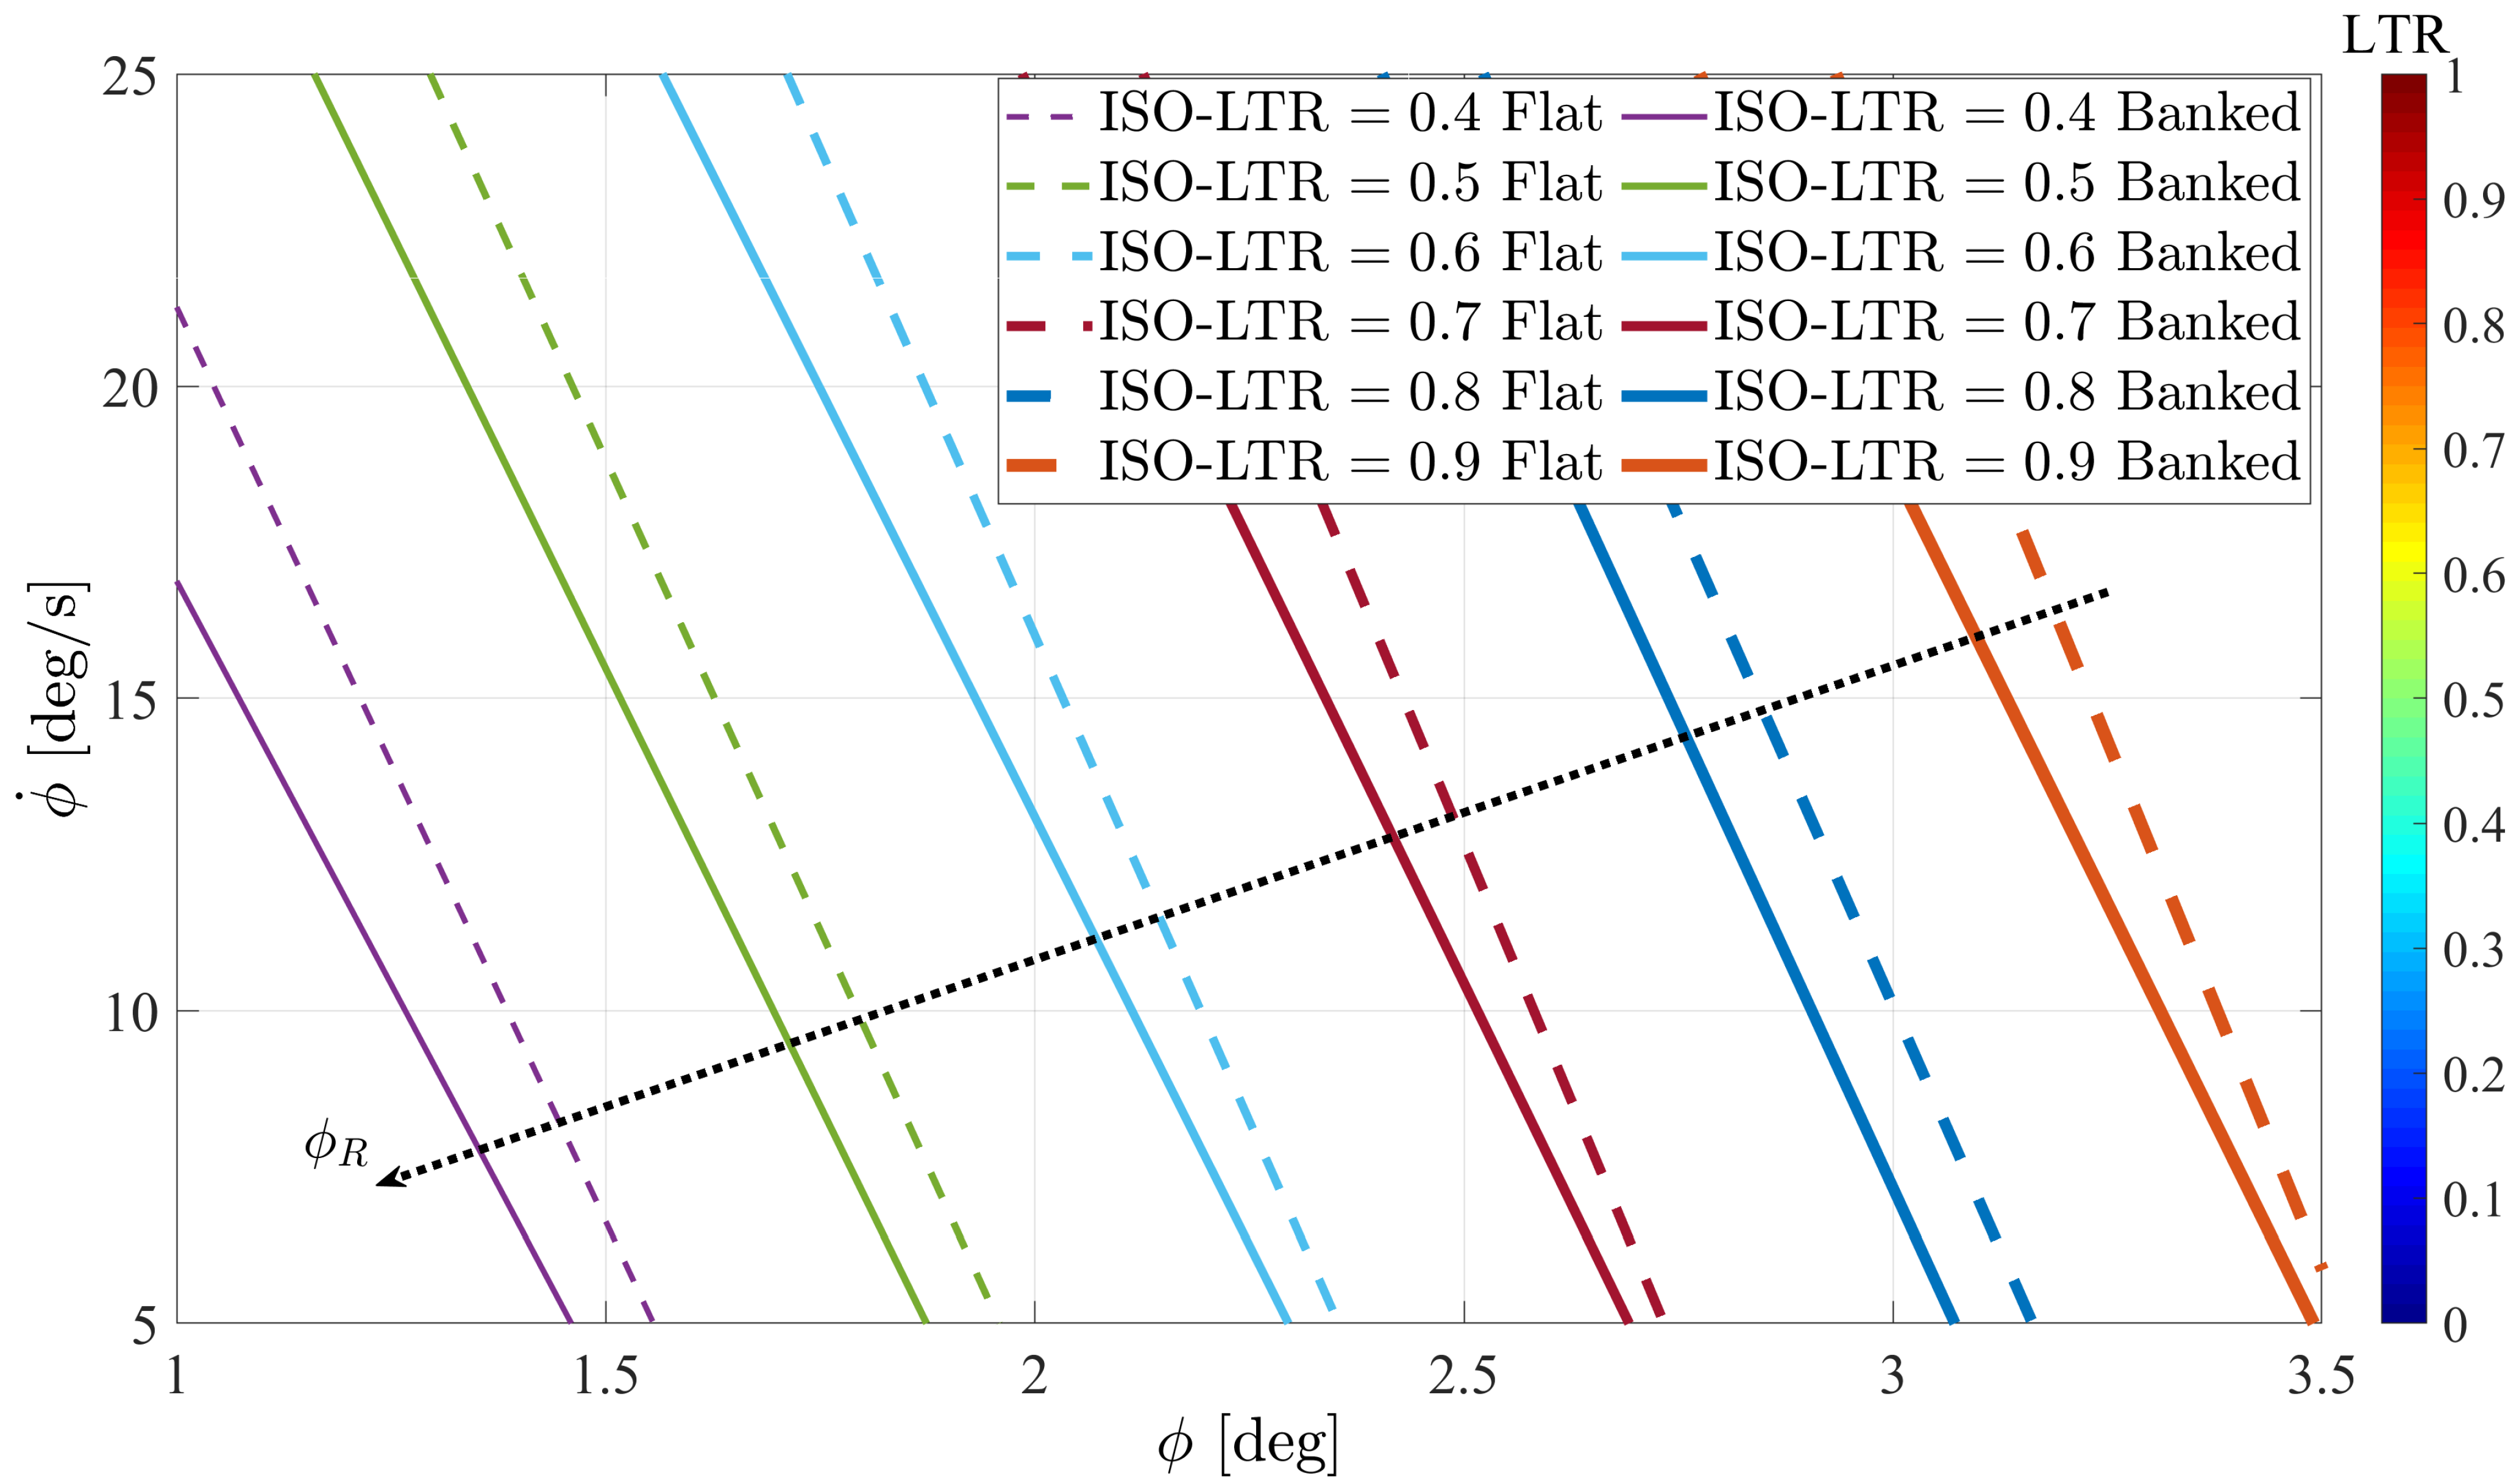
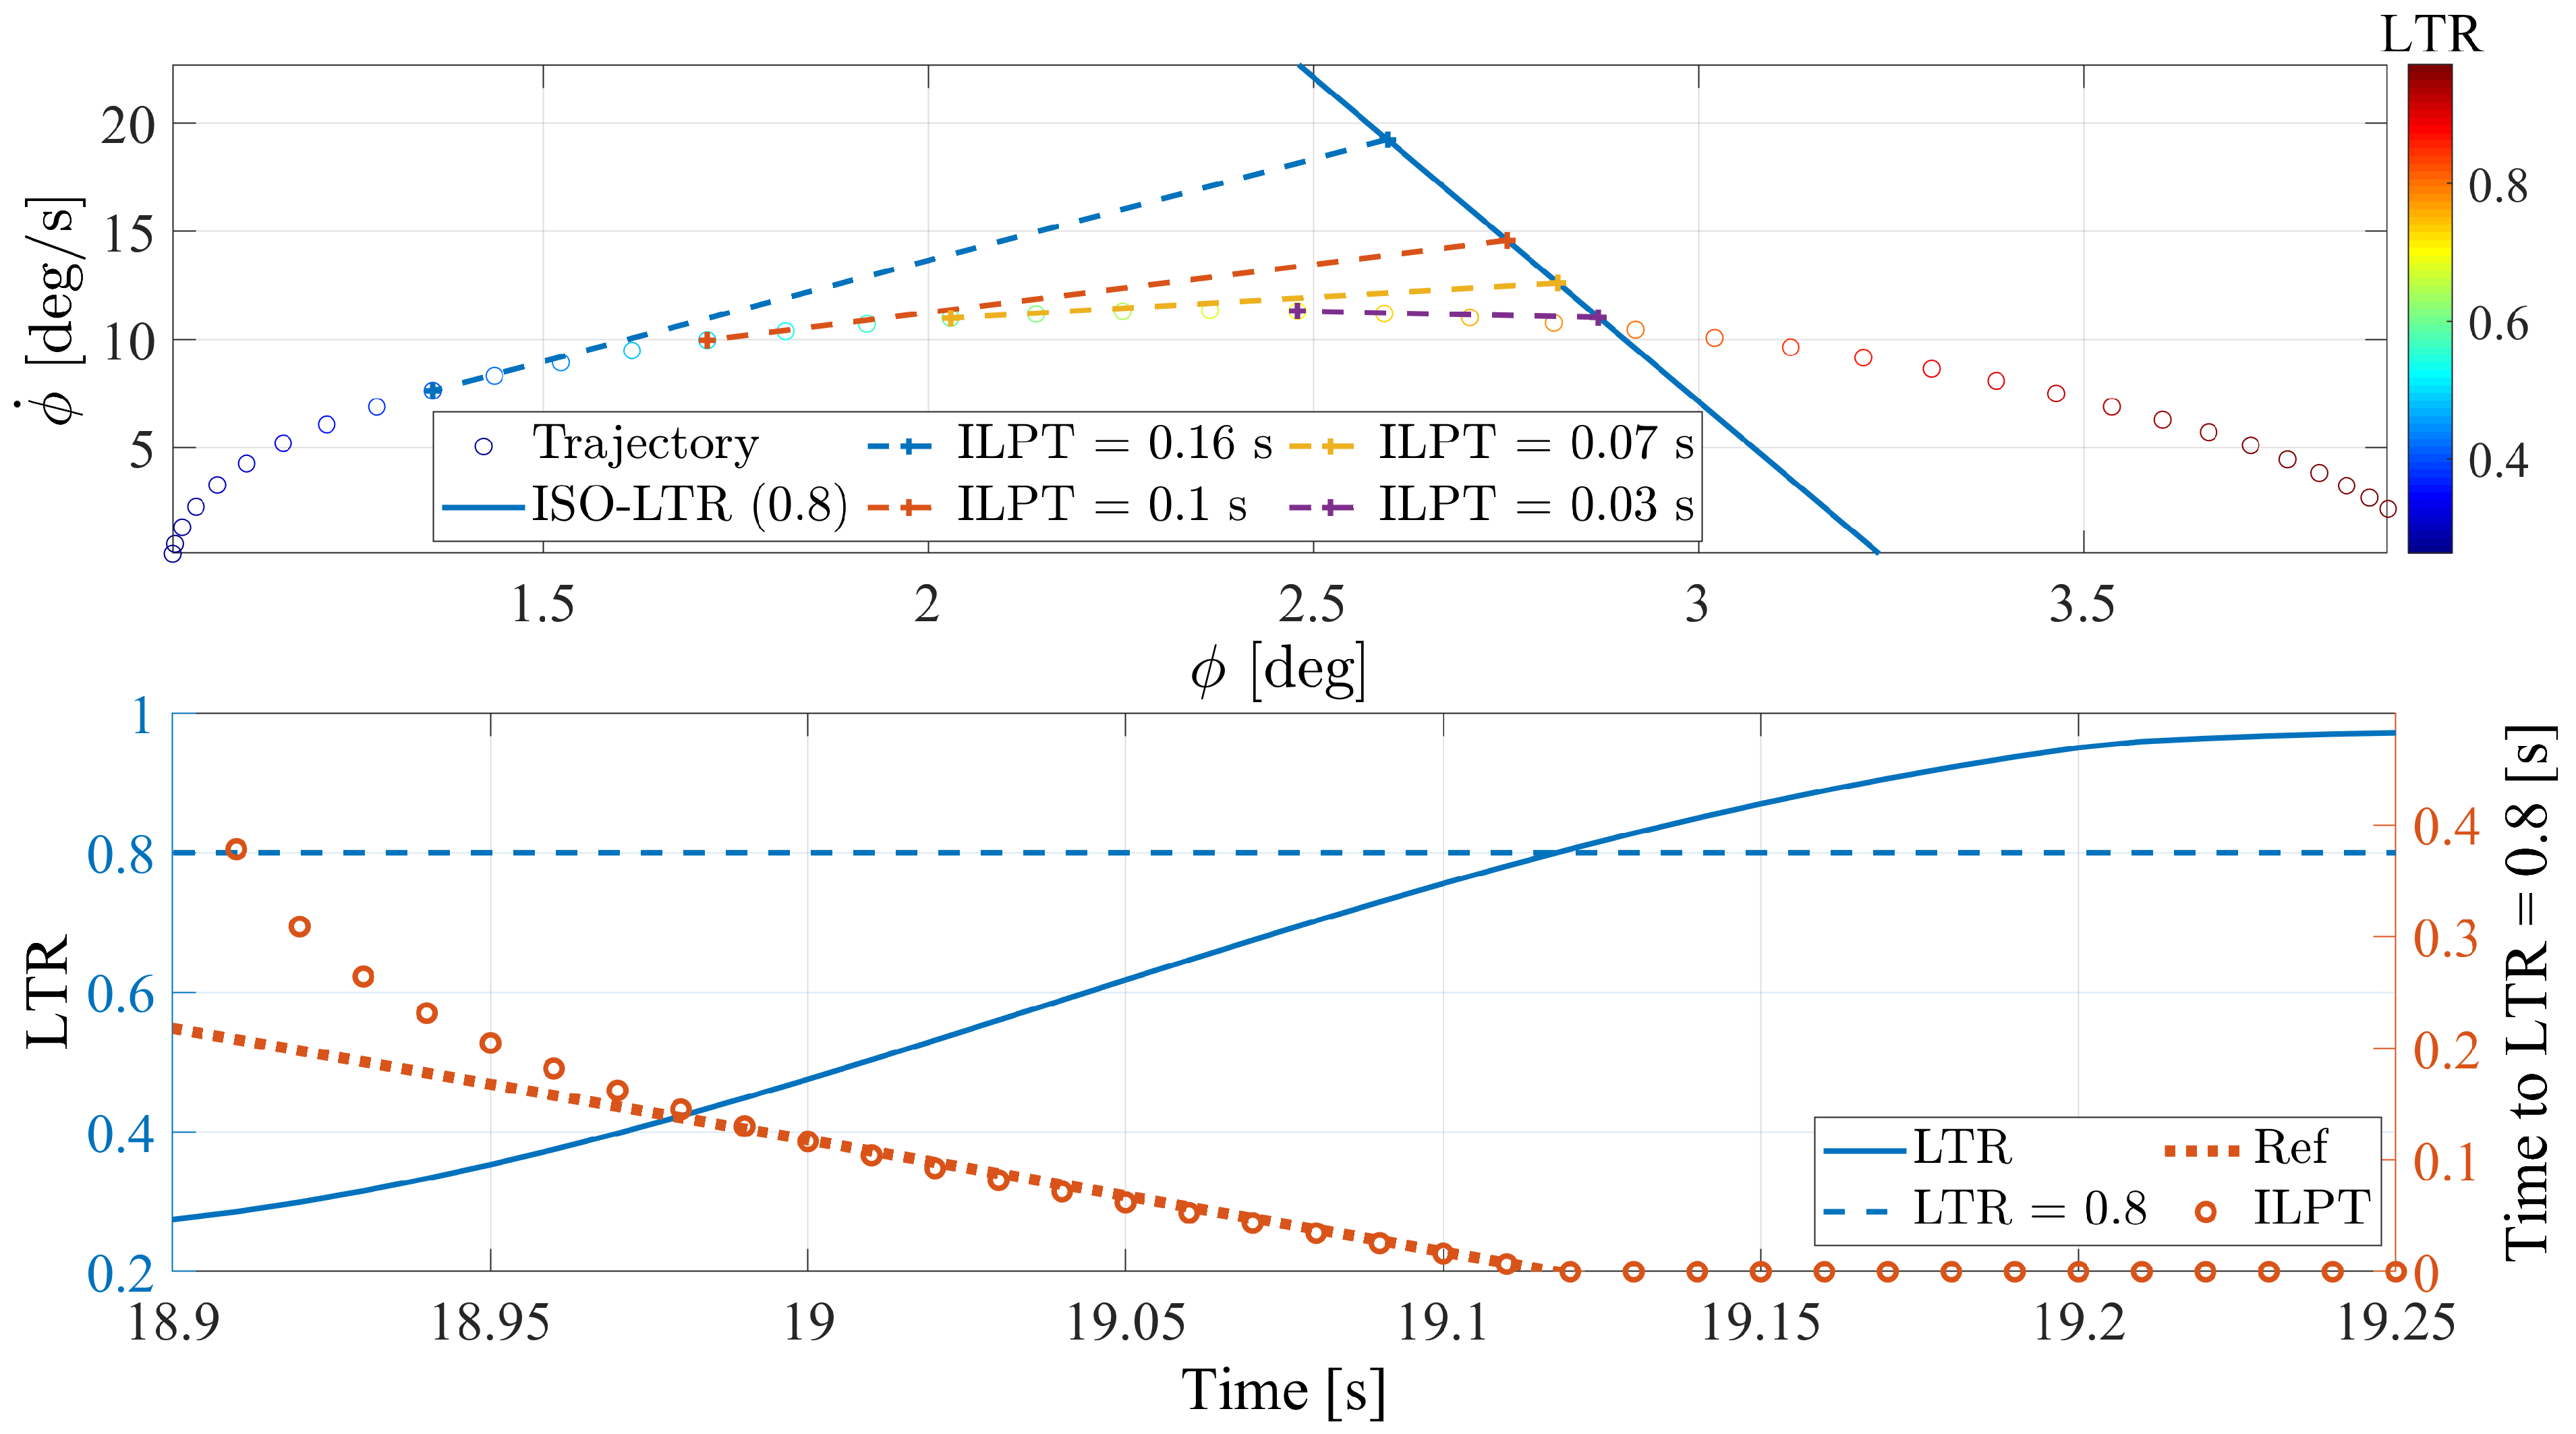
4. ISO-LTR Phase Plane Portrait

As mentioned in the previous section, the model-based L T R formulation, expressed in its more robust and generic form by the Equation (6), is not suitable for a realistic implementation of the LTR estimation but rather it represents a valid tool for the analytical correlation between the vehicle states and the L T R dynamics. One of the most adopted tool to evaluate the vehicle states dynamics is the phase plane analysis. By focusing the attention only to the relative roll dynamics between the sprung and the unsprung masses, the vehicle states selected for plotting the phase plane map are the relative roll angle ϕ and roll rate ϕ ˙ between the sprung and the unsprung masses. The phase plane analysis has the fundamental advantage to describe the trajectory of the vehicle states in a unique plot that can also be obtained with complex and non-linear models or directly from experimental measurements. In this paper, the phase-plane plot is drawn by running a fast ramp steering manoeuvre at constant speed in the IPG CarMaker® simulation environment. According the NHTSA’s standard (49 CFR Part 575), a steering wheel rate of 720 deg / s is imposed, and the test is repeated at different vehicle speeds with step of 10 km / h . An example of simulation results obtained during a fast ramp steering manoeuvre at 70 km / h on a 10 deg banked road is shown in Figure 9.
This aggressive manoeuvre is able to depict the transient behavior of the vehicle roll dynamics at a constant vehicle speed and road bank angle, through a trajectory line in the phase plane plot. The manoeuvre is repeated for different vehicle speeds, thus obtained the phase plane portrait for a predefined value of the road bank angle. An example of the phase plane portrait for a a 10 deg banked road is reported in Figure 10.
Each trajectory in the phase plane portrait represents the ϕ ˙ ϕ correlation during a fast ramp steering manoeuvre at constant vehicle speed and include the steady-state and the transient responses of the vehicle roll dynamics. Each trajectory shows a colour variation as function of the corresponding L T R value, passing from a lower rollover risk represented by a blue markers ( L T R = 0 ) to a high level of rollover risk with the red markers ( L T R = 1 ) indicating that the left wheels lifted off.
When the phase plane portrait ϕ ˙ , ϕ is built and defined for a specific boundary condition, i.e., the road bank angle, the ISO-LTR characteristics, i.e., the locus of constant vertical load transfers ( L T R = q , with q = 0.4 , 0.5 , , 0.9 ), can be drawn, as shown in Figure 10 for ϕ R = 10 deg . The ISO-LTR characteristics map is characterized by parallel lines, each corresponding to a constant L T R level.
By combining the vehicle roll equilibrium equation in Equation (1) with the roll equilibrium equation of the sprung mass in Equation (4), the following analytical expression of the linear ISO-LTR characteristics in the phase-pane is obtained:
ϕ ˙ = K C ϕ m s a y s h R + i m u i a y u i h u C q T 2 m s a z s + q T 2 i m u i a z u i G C + + q T 2 m g cos ϕ R m s g h R + m u g h u sin ϕ R C
The slope of the ISO-LTR linear characteristics is always negative and it depends on the vehicle suspension system parameters through the total roll stiffness K and roll damping C coefficients. In particular, an increment of the total roll stiffness or, equivalently, a reduction of the total roll damping, would lead a lower ISO-LTR lines sensitivity to the relative roll rate ϕ ˙ . On the other hand, the severity of the manoeuvre imposed by the driver, the local road perturbations, e.g., road bumps, potholes, etc. …, and the road bank angle will affect the last three contributions of the ISO-LTR linear characteristics, respectively, thus substantially producing an horizontal shift of the ISO-LTR characteristics.
It is possible to express the ISO-LTR characteristics in the phase plane through the following linear equation:
ϕ ˙ L T R = q = k ϕ L T R = q + n
where k = K C and n = f a y s , a y u i , a z s , a z u i , ϕ R are the slope and the x intercept of the ISO-LTR corresponding to L T R = q , respectively.
To provide a proof of this conclusion, the influence of the the road bank angle on the phase-plane portrait and the distribution of the ISO-LTR lines are shown in Figure 11.
The figure demonstrates that the ISO-LTR lines keep the same negative slope, not influenced by the road bank angle, whose main effect is a shift of the ISO-LTR characteristics towards smaller relative roll angles ϕ .

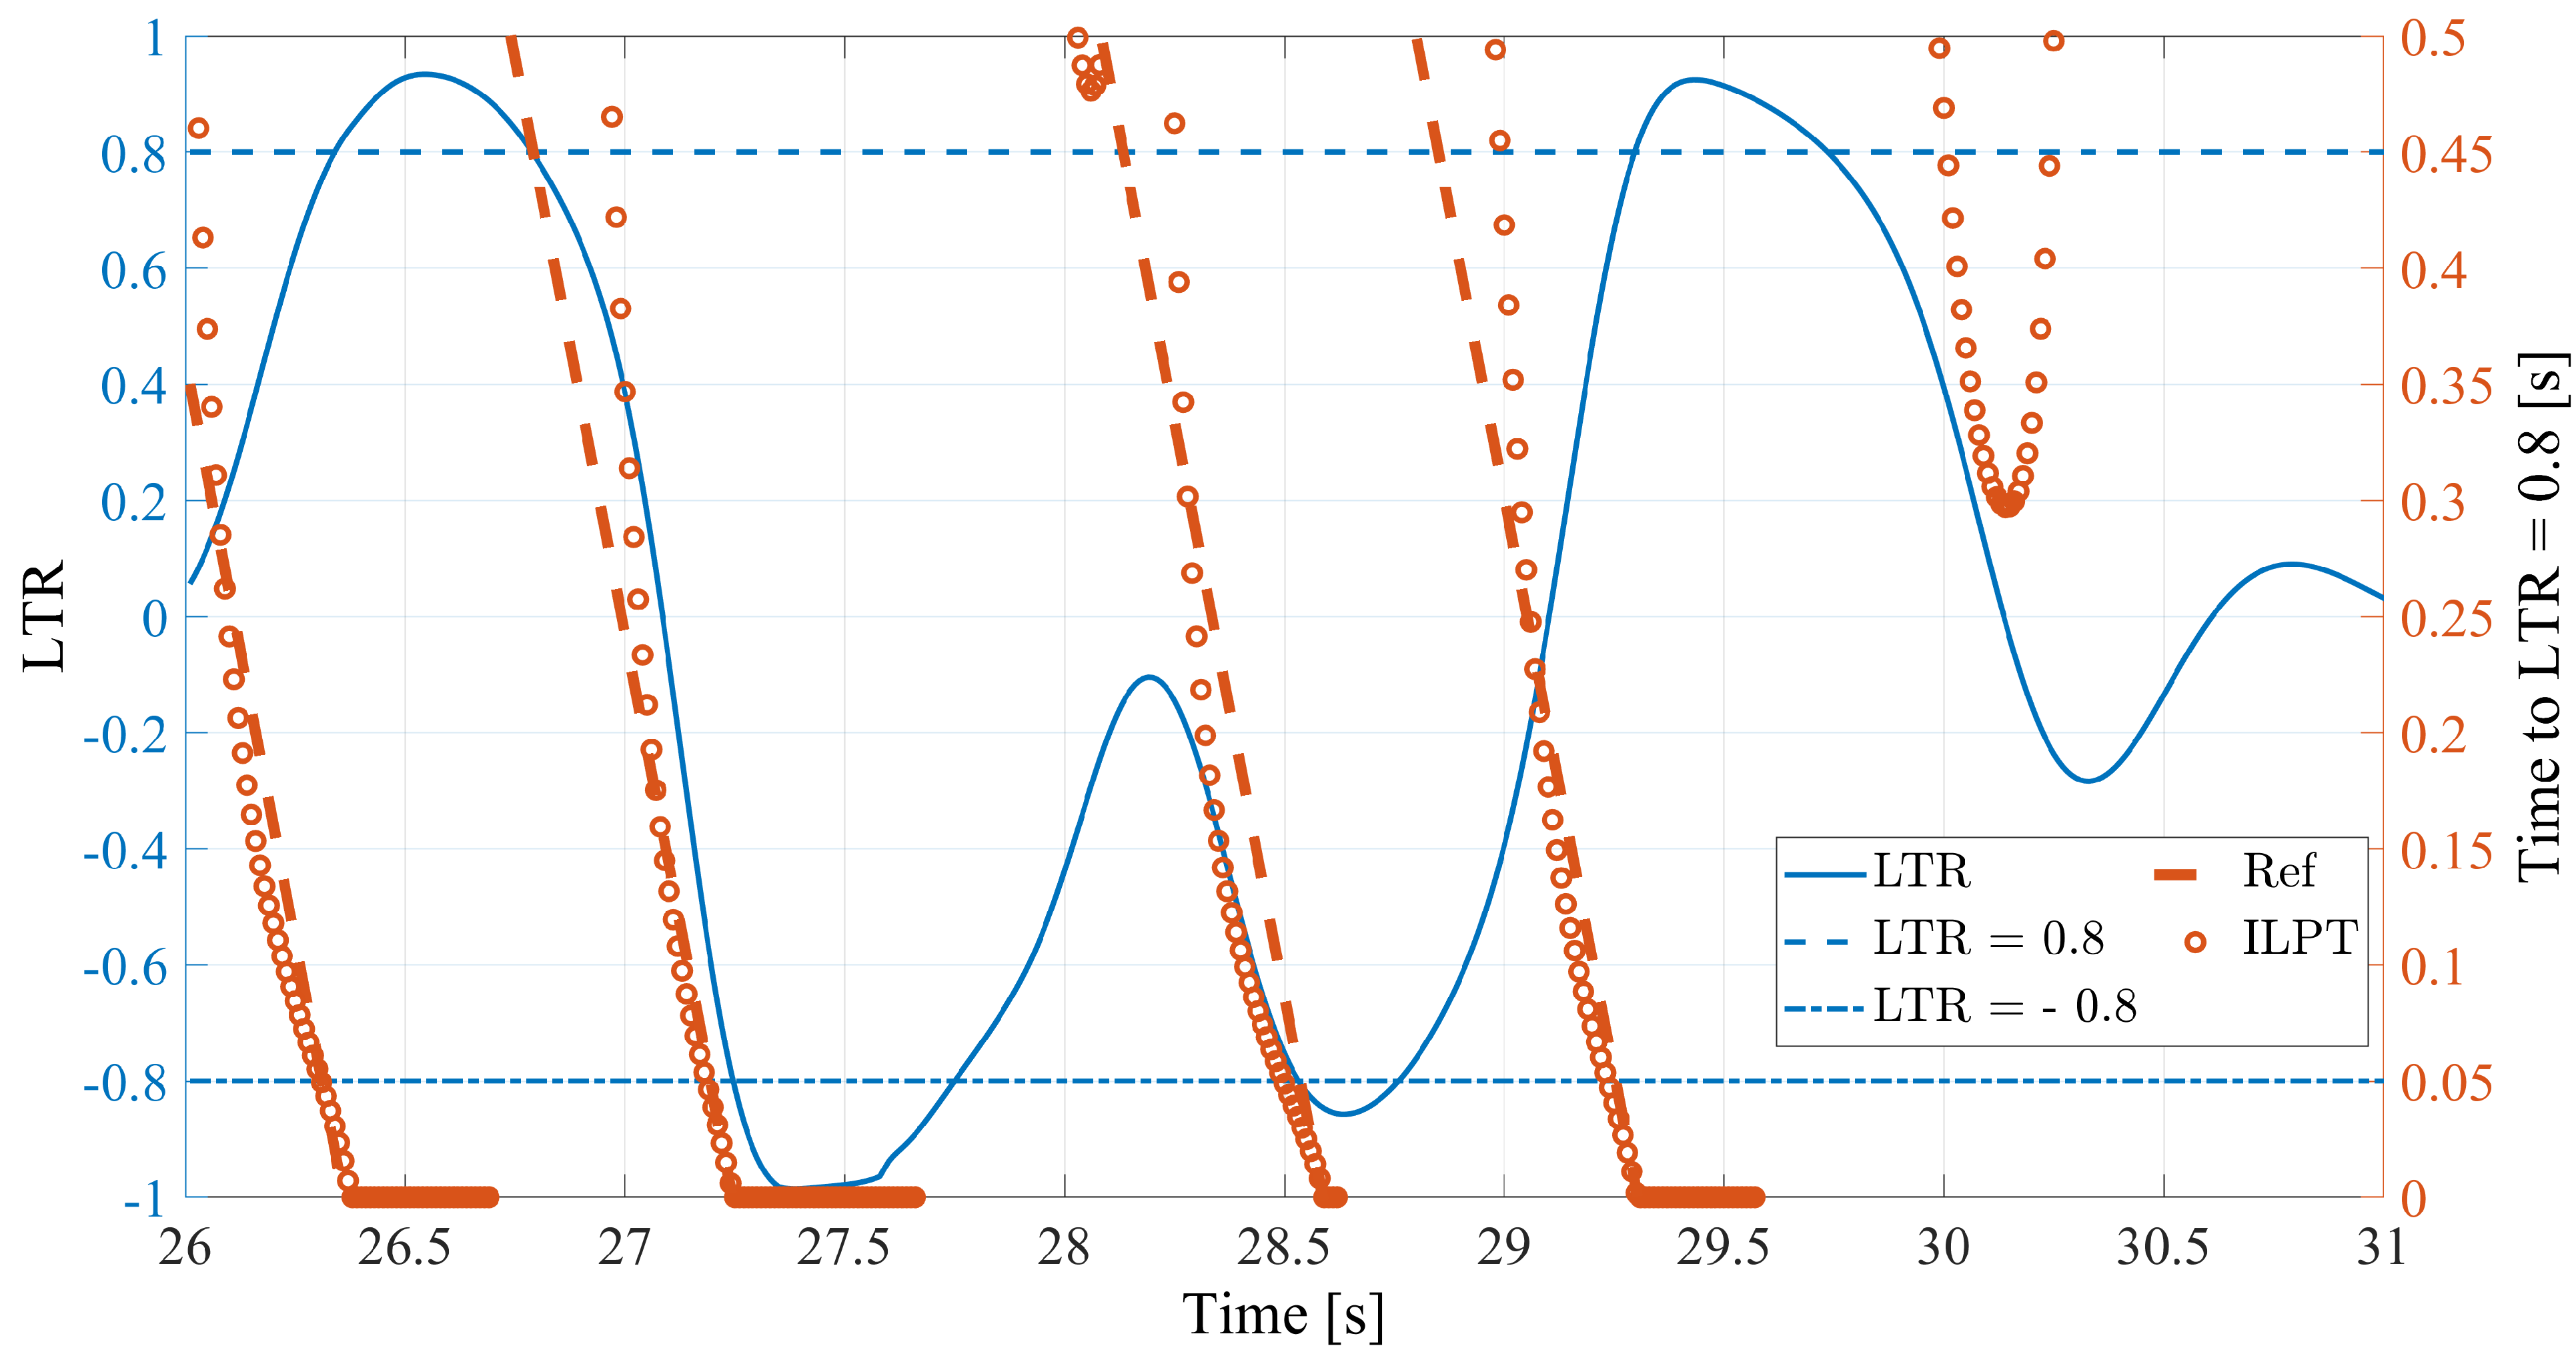
5. ISO-LTR Predictive Time

The previous sections present the mathematical background to detect the incipient rollover risk through the evaluation of the L T R , its representation on the phase plane plot through the definition of the ISO-LTR characteristics and their perturbations due to the driver behaviour, the local and global road profile geometry. The present section aims at providing a predictive indication of the time the vehicle requires to cross one of the ISO-LTR lines, defined as the ISO-LTR Predictive Time ( I L P T ) in the rest of the paper.
The principle underlying the procedure, based on the formulation proposed by [53], is described by Figure 12 in the phase plane plot.
The figure shows three trajectories corresponding to different manoeuvres represented in the phase plane. After a generic time instant, the three trajectories reach the points P , P I , P I I approaching to the same roll angle but with different roll rates. The condition of incipient rollover is identified by the blue ISO-LTR line. The I L P T is defined as the time required to reach the intersection point between the ISO-LTR line and the tangent line at the current point of the phase plane trajectories. For example, the tangent line in P is expressed by:
ϕ ˙ = k P ϕ ϕ P + ϕ ˙ P
where ϕ ¨ P , ϕ ˙ P and ϕ P represent the relative roll acceleration, roll rate and roll angle corresponding to the point P of the phase plane trajectory and k P = ϕ ¨ P ϕ ˙ P is the slope of the tangent line. The intersection point between the tangent line and the ISO-LTR line Q is then calculated as follows:
ϕ Q = k P ϕ P ϕ ˙ P + n k P k ϕ ˙ Q = k k P ϕ P k ϕ ˙ P + k P n k P k
Hence, the I L P T represents the time required to reach point Q from point P, under the hypothesis to follow the tangent line expressed by Equation (11), as also described by [53]:
I L P T = 1 s i g n z 2 ϕ Q ϕ P 2 + ϕ ˙ Q ϕ ˙ P 2 ϕ ˙ P 2 + ϕ ¨ P 2
with:
z = ϕ ˙ P k ϕ P n ϕ ˙ P + k ϕ P n
where z is introduced to saturate the I L P T to 0 when the point P crosses the corresponding ISO-LTR line. The calculation of the I L P T requires the knowledge of the current relative roll acceleration, roll rate and roll angle and the parameters k and n of the selected ISO-LTR line. The I L P T provides a time information only if it exceeds a predefined upper thresholds, i.e., 0.5 s above which the vehicle is far away from the rollover risk.

6. Simulation Results

The predictive capabilities of the I L P T are verified in IPG CarMaker® environment through the simulation of the following driving manoeuvres:
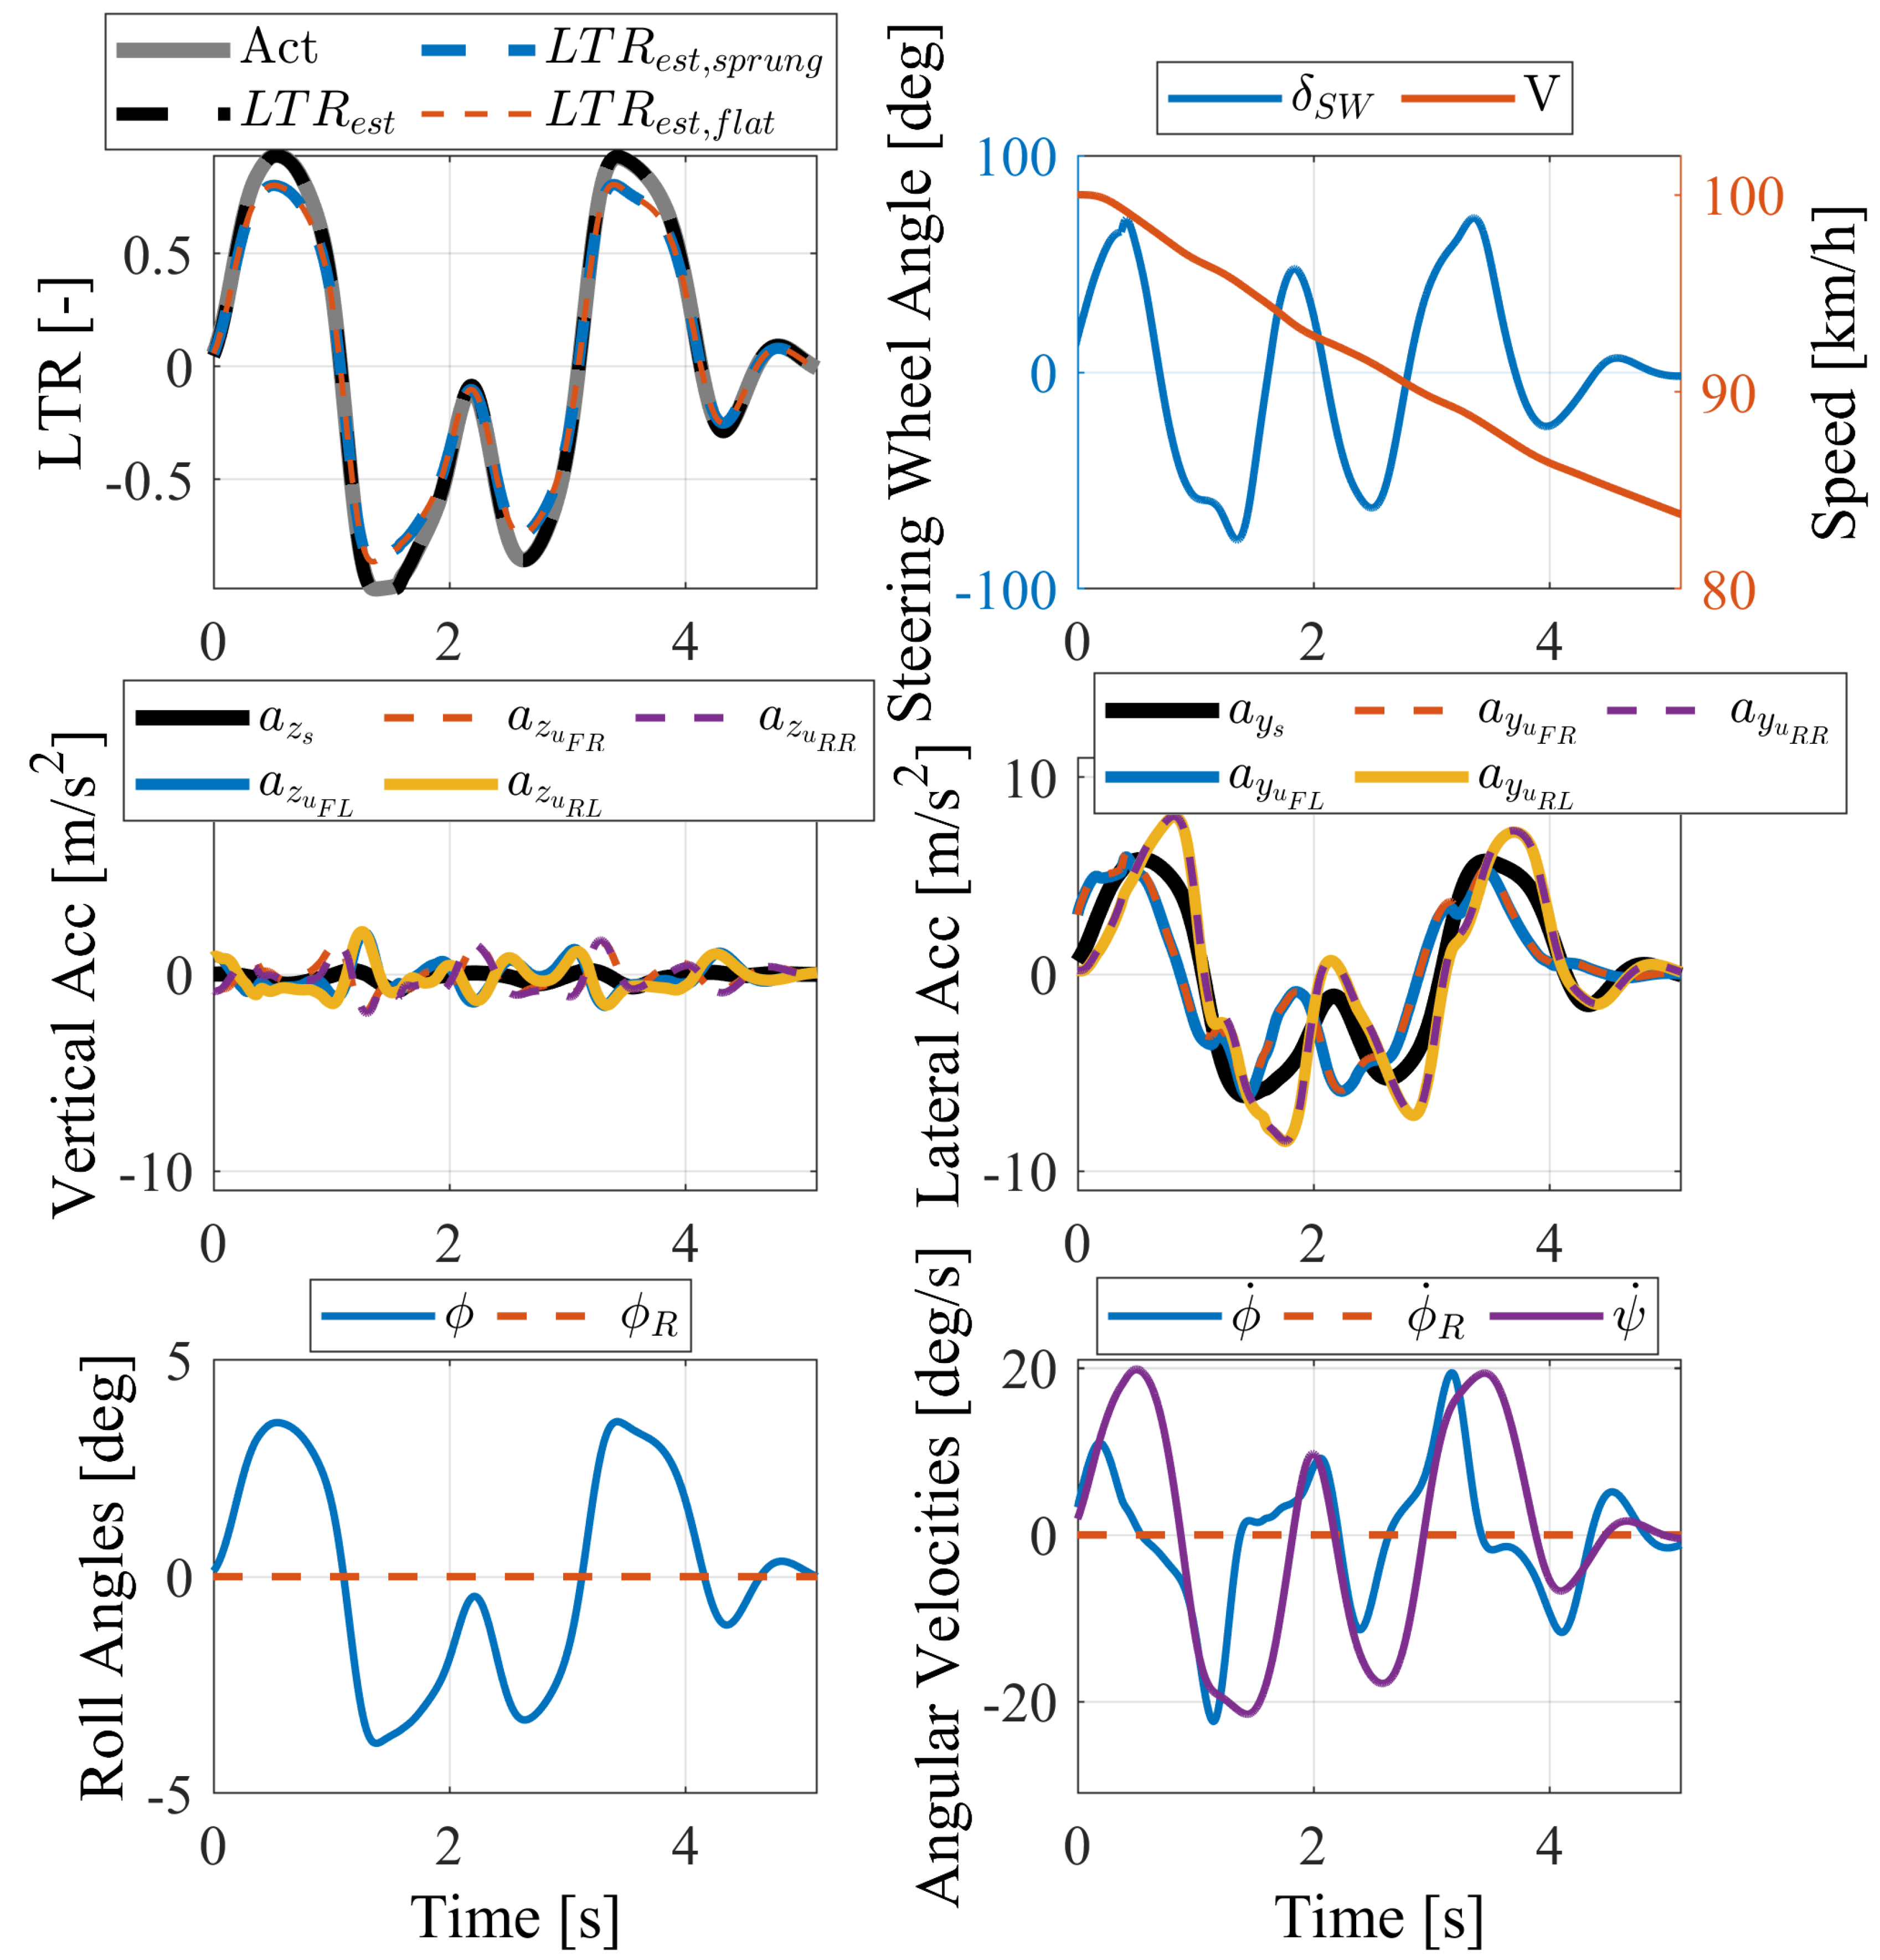
  • A fast ramp steering on a banked road;
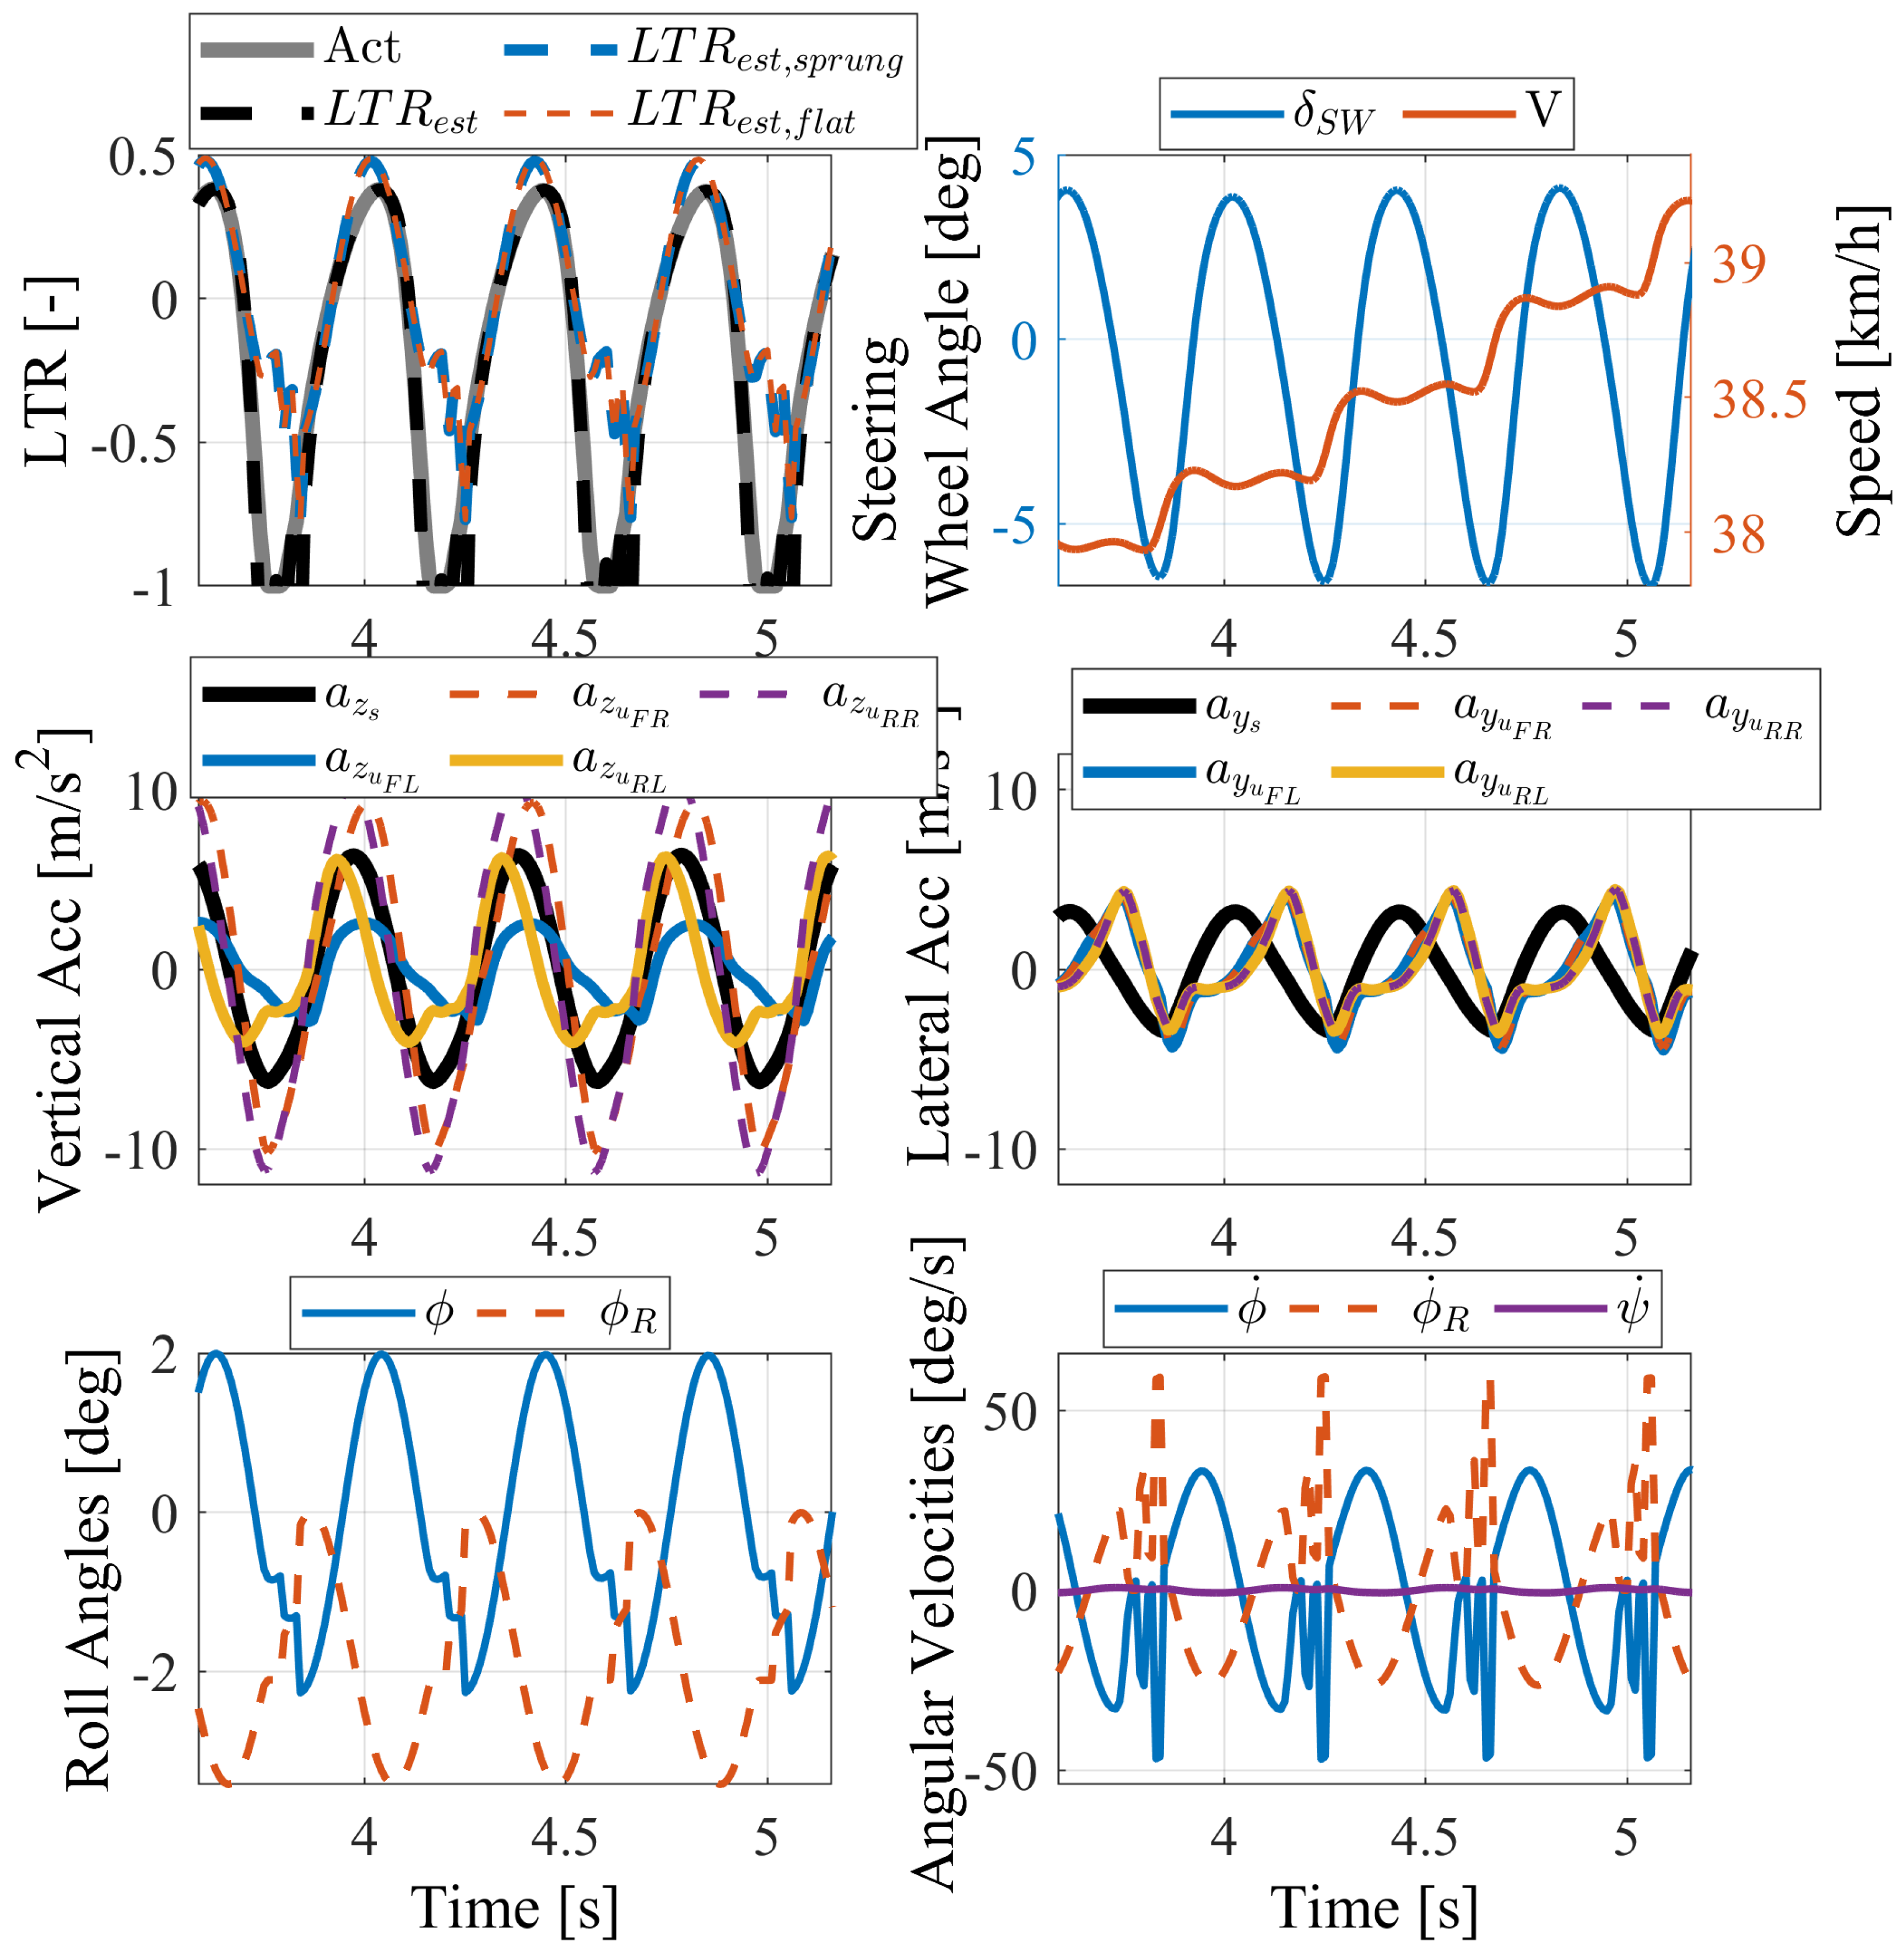
  • A double lane change on a flat Road (ISO 3888-1).
The simulation results are analyzed both in the phase plane and in the time domains. The phase-plane analysis provides a graphical interpretation for the I L P T calculation. On the other hand, the time domain analysis is carried out to asses the methodology accuracy in predicting the critical condition. Indeed, the reference time T R e f , i.e., the time required to reach a defined L T R threshold L T R t h , is backward evaluated from the whole post-processed time history and it is compared against the I L P T estimation. T R e f is represented in the time domain as 45 deg inclined lines:
T R e f = t + T L T R = L T R t h
where T L T R = L T R t h is the time that L T R = L T R t h , and it is detected by a backward analysis of the L T R time history. The T R e f represents a key quantity to asses the performance of any predictive algorithm to detect a particular event, i.e., the incipient rollover, but it can be only calculated when the whole time history up to the event occurrence is available and it is not suitable for a real-time implementation. The L T R threshold, here considered as potentially critical to provoke the vehicle rollover, is assumed to be ± 0.8 . The smaller the deviation between I L P T and T R e f , the better the predictive capabilities of the proposed methodology.

6.1. Fast Ramp Steering on a Banked Road

The first manoeuvre is one from the simulation set adopted in the previous section to draw the ISO-LTR characteristics of Figure 10.
The resultant phase plane trajectory of the manoeuvre is reported in the topside of the Figure 13, where the graphical solution for the I L P T calculation is provided for four time instants. The resultant I L P T , elaborated in real-time during the manoeuvre, is plotted in the downside of Figure 13 where the L T R time history is also compared against the threshold L T R t h .
At the beginning of the manoeuvre, when the L T R level indicates a substantial distance from the rollover risk, the I L P T (red circles) deviates from the T R e f (red dashed line) to reach the condition of L T R = 0.8 , event that occurs after 0.24 s from the application of the ramp steering. The time deviations between the estimated I L P T and the T R e f suddenly drops down after 0.05 s , when the I L P T starts tracking the reference time until the occurrence of the critical threshold L T R = 0.8 . This deviation can be graphically explained by the phase-plane portrait in Figure 13. At the beginning of the ramp steering (left side of the trajectory), the trajectory strongly deviates from the tangent line (dashed lines). As soon as the trajectory is approaching the ISO-LTR line (blue continuos line), the tangent line begins to better approximate the future phase-plane trajectory thus allowing the convergence of the I L P T towards the T R e f . It is also interesting to note that the I L P T slightly underestimates the T R e f when approaching the corresponding ISO-LTR line, thus providing a more conservative estimate.

6.2. Double Lane Change on a Flat Road

The methodology is also applied to a second manoeuvre that is not used to extrapolate the ISO-LTR characteristics or any other results shown in the previous sections. This is the double lane change test which represent a critical manoeuvre from the rollover point of view. The time domain plot of the L T R , the I L P T and reference time are shown in Figure 14.
During the double change manoeuvre, the vehicle crosses four times the L T R threshold. In all cases, the methodology is able to detect in advance the critical point as highlighted by the I L T P that starts dropping to zero when the vehicle is approaching the L T R threshold. Even during this maneuver, the I L P T tends to underestimate the reference time when the vehicle is getting closer to the ISO-LTR boundary, thus providing a conservative and safer prediction. During the last part of the maneuver, the algorithm provides a false positive indication of dangerous situation since the I L T P drops to 0.3 s even if the L T R did not reach the threshold of 0.8 after this point. This behavior is explained by the sudden reduction of the L T R at t = 30 s , which is successfully recovered by the stabilizing intervention of the driver.
Even though the vehicle does not rollover during the maneuver, the I L P T can predict all the potential dangerous situations in a time frame of a few tenths of seconds, which is suitable for an active control logic to intervene.

7. Conclusions

The activity presented in this paper aims at providing some usefull tools and methodologies to detect and prevent the incipient risk of rollover, applied to heavy vehicles designed for off-road driving applications. The main conclusions drawn from the results and the methodologies presented can be summarized as follows:
  • A quantitative indication of the anti rollover risk is represented by the L T R , thus detecting the critical limit above which a wheel lifted off occurs. However, the L T R does not represent a measurable quantity due to the extreme difficulty in estimating the vertical load transfers among the vehicle corners. The paper proposes three L T R model-based formulations, by considering an increased level of complexity. The most generic formulation includes the influence of the road bank angle, unsprung masses and vertical dynamics. Numerical simulations of aggressive manoeuvres on flat roads, banked roads and in presence of asymmetrical speed bump waves, show the significant reliability of the generic model-based formulation when compared to the two simplified versions widespread in the literature;
  • The incipient rollover occurs when a defined L T R threshold is approached. The paper proves that the ISO-LTR characteristics, i.e., the combination of vehicle relative roll speeds and angles where the L T R is constant, are linear in the phase plane portrait of the vehicle roll dynamics. This is analytically explained through the L T R model-based formulation, and numerically verified with multiple simulations in IPG CarMaker®. The paper also shows that the L T R model-based formulation provides a qualitative tool to predict how the ISO-LTR lines would change when a road perturbation, i.e., road bank angle or irregularities, is encountered. The ISO-LTR slopes are only influenced by the suspension system configuration and parameters (total roll stiffness and damping), meanwhile the severity of the manoeuvre (lateral and vertical accelerations) and the road global and local perturbations provoke an horizontal shift of the ISO-LTR lines;
  • The model-based formulation is essential to analytically evaluate the main influencing factors on the load transfer dynamics between the left and right vehicle sides. However, any mathematical formulation is affected by parameters uncertainties, external disturbances and unmodeled dynamics that compromises its effectiveness for a realistic implementation, especially when noisy experimental measurements are input to the analytical formulation. For this reason, the statistical approach, based on the recurrent neural network principle, is proposed as an alternative methodology to estimate the LTR in a realistic scenario. Indeed, the input of the RNN algorithm are typical measurable quantities available for an experimental implementation, which represent the natural following step the authors are going to explore in the near future. The RNN approach provides excellent results in estimating the front and the rear load transfers even in presence of complex and realistic driving scenarios.
  • The detection of current L T R is not sufficient to predict the incipient risk of rollover. A ISO-LTR Predictive Time is then derived to proactively calculate the necessary time to reach a particular L T R threshold. The proposed predictive index is then successfully verified through a fast ramp steering maneuver on a banked road and during an aggressive double lane change manoeuvre. In both cases, the I L P T demonstrates promising predictive capabilities, compatible with the intervention of a control active strategy.

Author Contributions

Conceptualization, A.T., L.D., G.P. and M.V.; methodology, A.T., L.D. and M.V.; software, A.T. and F.V.; validation, A.T., L.D. and F.V.; formal analysis, A.T., L.D. and M.V.; investigation, A.T., L.D., G.P. and M.V.; writing—original draft preparation, A.T., L.D. and F.V.; writing—review and editing, A.T., L.D., F.V., G.P. and M.V.; visualization, L.D.; supervision, A.T., L.D. and M.V. All authors have read and agreed to the published version of the manuscript.

Funding

This research received no external funding.

Institutional Review Board Statement

Not applicable.

Informed Consent Statement

Not applicable.

Data Availability Statement

Not applicable.

Conflicts of Interest

The authors declare no conflict of interest.

References

  1. Deutermann, W. Characteristics of Fatal Rollover Crashes; NHTSA Tecnical Report DOT HS 809 438; National Center for Statistics and Analysis Research and Development: Washington, DC, USA, 2002; pp. 1–52. [Google Scholar]
  2. Padmanaban, J.; Shields, L.E.; Scheibe, R.R.; Eyges, V.E. A comprehensive review of rollover accidents involving vehicles equipped with Electronic Stability Control (ESC) systems. Ann. Adv. Automot. Med. 2008, 52, 9–19. [Google Scholar]
  3. Han, I.; Rho, K. Characteristic analysis of vehicle rollover accidents: Rollover scenarios and prediction/warning. Int. J. Automot. Technol. 2017, 18, 451–461. [Google Scholar] [CrossRef]
  4. Rollover Resistance; NHTSA Tecnical Report RIN 2127-AI81; Department of Transportation: Washington, DC, USA, 2001; pp. 1–159.
  5. Matolcsy, M. The severity of bus rollover accidents. In Proceedings of the 20th International Technical Conference on the Enhanced Safety of Vehicles (ESV), Lyon, France, 18–21 June 2007; pp. 1–10. [Google Scholar]
  6. Liang, C.C.; Le, G.N. Analysis of bus rollover protection under legislated standards using LS-DYNA software simulation techniques. Int. J. Automot. Technol. 2010, 11, 495–506. [Google Scholar] [CrossRef]
  7. Winkle, C.B.; Ervin, R.D. Rollover of Heavy Commercial Vehicles. In Tecnical Report UMTRI-99-19; University of Michigan-Transportation Research Institute: Ann Arbor, MI, USA, 1999; pp. 1–64. [Google Scholar]
  8. Vella, A.D.; Lisitano, D.; Tota, A.; Wang, B. Analysis of heavy commercial vehicle cornering behaviour through a multibody model. Int. J. Mech. Control 2020, 21, 39–50. [Google Scholar]
  9. Furleigh, D.; Vanderploeg, M.; Oh, C. Multiple steered axles for reducing the rollover risks of heavy articulated trucks. SAE Trans. 1988, 97, 837–841. [Google Scholar]
  10. Sampson, D.J.M.; Cebon, D. An investigation of roll control system design for articulated heavy vehicles. In Proceedings of the 4th International Symposium on Advanced Vehicle Control (AVEC’98), Nagoya, Japan, 14–18 September 1998; pp. 1–6. [Google Scholar]
  11. Lin, R.C.; Cebon, D.; Cole, D.J. Active roll control of articulated vehicles. Veh. Syst. Dyn. Int. J. Veh. Mech. Mobil. 2007, 26, 17–43. [Google Scholar] [CrossRef]
  12. Tota, A.; Velardocchia, M.; Rota, E.; Novara, A. Steering behavior of an articulated amphibious all-terrain tracked vehicle. In Proceedings of the SAE 2020 World Congress & Exhibition (SAE WCX 2020), Online, 21–23 April 2020; pp. 1–11. [Google Scholar]
  13. Tota, A.; Galvagno, E.; Velardocchia, M.; Rota, E.; Novara, A. Articulated Steering Control for an All-Terrain Tracked Vehicle. In Proceedings of the International Federation for the Promotion of Mechanism and Machine Science (IFToMM ITALY 2020), Online, 9–11 September 2020; pp. 823–830. [Google Scholar]
  14. Tota, A.; Galvagno, E.; Velardocchia, M. Analytical Study on the Cornering Behavior of an Articulated Tracked Vehicle. Machines 2021, 9, 38. [Google Scholar] [CrossRef]
  15. Cossalter, V.; Lot, R.; Massaro, M. The influence of frame compliance and rider mobility on the scooter stability. Veh. Syst. Dyn. 2007, 45, 313–326. [Google Scholar] [CrossRef]
  16. Vasquez, F.; Lot, R.; Rustighi, E. Optimisation of off-road motorcycle suspensions. In Proceedings of the 15th European Automotive Congress, Madrid, Spain, 2–4 October 2017; pp. 1–10. [Google Scholar]
  17. Bonisoli, E.; Lisitano, D.; Dimauro, L. Detection of critical mode-shapes in flexible multibody system dynamics: The case study of a racing motorcycle. Mech. Syst. Signal Process. 2022, 180, 109370. [Google Scholar] [CrossRef]
  18. Bonisoli, E.; Lisitano, D.; Dimauro, L. Experimental and numerical mode shape tracing from components to whole motorbike chassis. In Proceedings of the 28th International Conference on Noise and Vibration Engineering (ISMA 2018) and 7th International Conference on Uncertainty in Structural Dynamics (USD 2018), Leuven, Belgium, 17–19 September 2018; pp. 3597–3604. [Google Scholar]
  19. Bonisoli, E.; Lisitano, D.; Dimauro, L.; Peroni, L. A proposal of dynamic behaviour design based on mode shape tracing: Numerical application to a motorbike frame. In Proceedings of the Society for Experimental Mechanics Series (37th IMAC), Orlando, FL, USA, 28–31 January 2019; Springer: New York, NY, USA, 2020; pp. 149–158. [Google Scholar]
  20. Roland Berger. Fuel Cells Hydrogen Trucks. Available online: https://www.fch.europa.eu/publications/study-fuel-cells-hydrogen-trucks (accessed on 27 August 2022).
  21. Tota, A.; Galvagno, E.; Dimauro, L.; Vigliani, A.; Velardocchia, M. Energy management strategy for hybrid multimode powertrains: Influence of inertial properties and road inclination. Appl. Sci. 2021, 11, 11752. [Google Scholar] [CrossRef]
  22. Phanomchoeng, G.; Rajamani, R. New rollover index for the detection of tripped and untripped rollovers. IEEE Trans. Ind. Electron. 2013, 60, 4726–4736. [Google Scholar] [CrossRef]
  23. Jin, Z.; Zhang, L.; Zhang, J.; Khajepour, A. Stability and optimised H Control Tripped Untripped Veh. Rollover. Veh. Syst. Dyn. 2016, 54, 1405–1427. [Google Scholar] [CrossRef]
  24. Ataei, M.; Khajepour, A.; Jeon, S. A general rollover index for tripped and un-tripped rollovers on flat and banked roads. Proc. Inst. Mech. Eng. Part J. Automob. Eng. 2019, 233, 304–316. [Google Scholar] [CrossRef]
  25. Johansson, B.; Gäfvert, M. Untripped SUV rollover detection and prevention. In Proceedings of the 43rd IEEE Conference on Decision and Control, Atlantis, Bahamas, 14–17 December 2004; pp. 6461–6466. [Google Scholar]
  26. Nalecz, A.G. Influence of vehicle and roadway factors on the dynamics of tripped rollover. Int. J. Veh. Des. 2014, 10, 321–346. [Google Scholar]
  27. Venturini, S.; Bonisoli, E.; Rosso, C.; Rovarino, D.; Velardocchia, M. Modal analyses and meta-models for fatigue assessment of automotive steel wheels. In Proceedings of the Conference Proceedings of the Society for Experimental Mechanics Series (38th IMAC), Houston, TX, USA, 10–13 February 2020; pp. 155–163. [Google Scholar]
  28. Rovarino, D.; Actis, C.L.; Bonisoli, E.; Rosso, C.; Venturini, S.; Velardocchia, M.; Baecker, M.; Gallrein, A. A Methodology for Automotive Steel Wheel Life Assessment; SAE Technical Paper; SAE: St. Joseph, MN, USA, 2020; pp. 1–10. [Google Scholar] [CrossRef]
  29. Vella, A.D.; Tota, A.; Vigliani, A. On the Road Profile Estimation from Vehicle Dynamics Measurements; SAE Technical Paper; SAE: St. Joseph, MN, USA, 2021; pp. 1–10. [Google Scholar] [CrossRef]
  30. Yang, H.; Liu, L.Y. A robust active suspension controller with rollover prevention. SAE Int. J. Passeng. Cars-Mech. Syst. 2003, 112, 992–997. [Google Scholar]
  31. Ataei, M.; Khajepour, A.; Jeon, S. Model predictive rollover prevention for steer-by-wire vehicles with a new rollover index. Int. J. Control 2020, 93, 140–155. [Google Scholar] [CrossRef]
  32. Fortina, A.; Velardocchia, M.; Sorniotti, A. Braking System Components Modelling; SAE Technical Paper; SAE: St. Joseph, MN, USA, 2003; pp. 1–12. [Google Scholar] [CrossRef]
  33. Lapapong, S. Vehicle rollover prevention for banked surfaces. PhD Thesis, The Pennsylvania State University, State College, PA, USA, 2010. [Google Scholar]
  34. Huston, R.L.; Kelly, F.A. Another look at the static stability factor (SSF) in predicting vehicle rollover. Int. J. Crashworthiness 2014, 19, 567–575. [Google Scholar] [CrossRef]
  35. Pai, J. Trends and Rollover-Reduction Effectiveness of Static Stability Factor in Passenger Vehicles; NHTSA Tecnical Report DOT HS 812 444; National Center for Statistics and Analysis Research and Development: Washington, DC, USA, 2017; pp. 1–141. [Google Scholar]
  36. Rajamani, R. Vehicle Dynamics and Control, 2nd ed.; Springer: New York, NY, USA, 2011; pp. 1–498. [Google Scholar]
  37. Velardocchia, M.; Vigliani, A. Control systems integration for enhanced vehicle dynamics. Open Mech. Eng. J. 2013, 7, 58–69. [Google Scholar] [CrossRef]
  38. Yoon, J.; Kim, D.; Yi, K. Design of a rollover index-based vehicle stability control scheme. Veh. Syst. Dyn. Int. J. Veh. Mech. Mobil. 2007, 45, 459–475. [Google Scholar]
  39. Dahmani, H.; Chadli, M.; Rabhi, A.; El Hajjaji, A. Vehicle dynamic estimation with road bank angle consideration for rollover detection: Theoretical and experimental studies. Veh. Syst. Dyn. 2013, 51, 1853–1871. [Google Scholar] [CrossRef]
  40. Zhang, X.; Yang, Y.; Guo, K.; Yang, Y.; He, G. Vehicle roll centre estimation with transient dynamics via roll rate. Veh. Syst. Dyn. 2020, 55, 699–717. [Google Scholar] [CrossRef]
  41. Odenthal, D.; Bünte, T.; Ackermann, J. Nonlinear steering and braking control for vehicle rollover avoidance. In Proceedings of the 1999 European Control Conference (ECC), Karlsruhe, Germany, 31 August–3 September 1999; pp. 1–6. [Google Scholar]
  42. Wielenga, T.J.; Chace, M.A. A Study in Rollover Prevention Using Anti-Rollover Braking; SAE Technical Paper; SAE: St. Joseph, MN, USA, 2000; pp. 1–10. [Google Scholar] [CrossRef]
  43. Chen, B.; Peng, H. Differential-braking-based rollover prevention for sport utility vehicles with human-in-the-loop evaluations. Veh. Syst. Dyn. 2001, 36, 359–389. [Google Scholar] [CrossRef]
  44. Huang, Z.; Nie, W.; Kou, S.; Son, X. Rollover detection and control on the non-driven axles of trucks based on pulsed braking excitation. Veh. Syst. Dyn. 2018, 56, 1864–1882. [Google Scholar] [CrossRef]
  45. Guizhen, Y.; Honggang, L.; Pengcheng, W.; Xinkai, W.; Yunpeng, W. Real-time bus rollover prediction algorithm with road bank angle estimation. Chaos, Solitons Fractals 2016, 89, 270–283. [Google Scholar] [CrossRef]
  46. Cao, J.; Jing, L.; Guo, K.; Yu, F. Study on integrated control of vehicle yaw and rollover stability using nonlinear prediction model. Math. Probl. Eng. 2013, 2013, 643548. [Google Scholar] [CrossRef]
  47. Ricco, M.; Zanchetta, M.; Rizzo, G.C.; Tavernini, D.; Sorniotti, A.; Chatzikomis, C.; Velardocchia, M.; Geraerts, M.; Dhaens, M. On the design of yaw rate control via variable front-to-total anti-roll moment distribution. IEEE Trans. Veh. Technol. 2020, 69, 1388–1403. [Google Scholar] [CrossRef]
  48. Ricco, M.; Percolla, A.; Rizzo, G.C.; Zanchetta, M.; Tavernini, D.; Dhaens, M.; Geraerts, M.; Vigliani, A.; Tota, A.; Sorniotti, A. On the model-based design of front-to-total anti-roll moment distribution controllers for yaw rate tracking. Veh. Syst. Dyn. 2022, 60, 569–596. [Google Scholar] [CrossRef]
  49. Goldman, R.W.; El-Gindy, M.; Kulakowski, B.T. Rollover dynamics of road vehicles: Literature survey. Int. J. Heavy Veh. Syst. 2001, 8, 103–141. [Google Scholar] [CrossRef]
  50. Solmaz, S.; Corless, M.; Shorten, R. A methodology for the design of robust rollover prevention controllers for automotive vehicles with active steering. Int. J. Control 2007, 80, 1763–1779. [Google Scholar] [CrossRef]
  51. Imine, H.; Benallegue, A.; Madani, T.; Srairi, S. Rollover risk prediction of heavy vehicle using high-order sliding-mode observer: Experimental results. IEEE Trans. Veh. Technol. 2014, 63, 2533–2543. [Google Scholar] [CrossRef]
  52. Larish, C.; Piyabongkarn, D.; Tsourapas, V.; Rajamani, R. A new predictive lateral load transfer ratio for rollover prevention systems. IEEE Trans. Veh. Technol. 2013, 62, 2928–2936. [Google Scholar] [CrossRef]
  53. Zhang, X.; Yang, Y.; Guo, K.; Lv, J.; Peng, T. Contour line of load transfer ratio for vehicle rollover prediction. Veh. Syst. Dyn. 2017, 55, 1748–1763. [Google Scholar] [CrossRef]
  54. Yoon, J.; Cho, W.; Koo, B.; Yi, K. Unified chassis control for rollover prevention and lateral stability. IEEE Trans. Veh. Technol. 2009, 58, 596–609. [Google Scholar] [CrossRef]
  55. Tota, A.; Velardocchia, M.; Güvenç, L. Path Tracking Control for Autonomous Driving Applications. In Proceedings of the International Conference on Robotics in Alpe-Adria-Danube Region (RAAD 2017), Turin, Italy, 21–23 June 2017; pp. 456–467. [Google Scholar]
  56. Sellami, Y.; Imine, H.; Boubezoul, A.; Cadiou, J.C. Rollover risk prediction of heavy vehicles by reliability index and empirical modelling. Veh. Syst. Dyn. 2018, 56, 385–405. [Google Scholar] [CrossRef]
  57. Zhu, T.; Yin, X.; Na, X.; Li, B. Research on a Novel Vehicle Rollover Risk Warning Algorithm Based on Support Vector Machine Model. IEEE Access 2020, 8, 108324–108334. [Google Scholar] [CrossRef]
  58. Chen, X.; Chen, W.; Hou, L.; Hu, H.; Bu, X.; Zhu, Q. A novel data-driven rollover risk assessment for articulated steering vehicles using RNN. J. Mech. Sci. Technol. 2020, 34, 2161–2170. [Google Scholar] [CrossRef]
  59. Baldi, M.M.; Perboli, G.; Tadei, R. Driver maneuvers inference through machine learning. In Lecture Notes in Computer Science (including Subseries Lecture Notes in Artificial Intelligence and Lecture Notes in Bioinformatics) 10122 LNCS; Springer: Cham, Switzerland, 2016; pp. 182–192. [Google Scholar] [CrossRef]
  60. Ackermann, J.; Odenthal, D. Damping of vehicle roll dynamics by gain scheduled active steering. In Proceedings of the 1999 European Control Conference (ECC), Karlsruhe, Germany, 31 August–3 September 1999; pp. 4100–4106. [Google Scholar]
  61. Rajamani, R.; Piyabongkarn, D.N.; Tsourapas, V.; Lew, J.Y. Real-time estimation of roll angle and CG height for active rollover prevention applications. In Proceedings of the IEEE 2009 American Control Conference, St. Louis, MO, USA, 10–12 June 2009. [Google Scholar]
  62. Rajamani, R.; Piyabongkarn, D.N. New paradigms for the integration of yaw stability and rollover prevention functions in vehicle stability control. IEEE Trans. Intell. Transp. Syst. 2013, 14, 249–261. [Google Scholar] [CrossRef]
  63. Lee, S.; Yakubl, F.; Kasahara, M.; Mori, Y. Rollover prevention with predictive control of differential braking and rear wheel steering. In Proceedings of the 6th IEEE Conference on Robotics, Automation and Mechatronics (RAM), 12–15 November 2013; pp. 144–149. [Google Scholar] [CrossRef]
  64. Huang, H.H.; Yedavalli, R.K.; Guenther, D.A. Active roll control for rollover prevention of heavy articulated vehicles with multiple-rollover-index minimisation. Veh. Syst. Dyn. 2012, 50, 471–493. [Google Scholar] [CrossRef]
  65. Gaspar, P.; Szaszi, I.; Bokor, J. Reconfigurable control structure to prevent the rollover of heavy vehicles. Control Eng. Pract. 2005, 13, 699–711. [Google Scholar] [CrossRef]
  66. Boada, M.J.L.; Boada, B.L.; Gauchia Babe, A.; Calvo Ramos, J.A.; Lopez, V.D. Active roll control using reinforcement learning for a single unit heavy vehicle. Int. J. Heavy Veh. Syst. 2009, 16, 596–609. [Google Scholar] [CrossRef]
  67. Dahmani, H.; Chadli, M.; Rabhi, A.; El Hajjaji, A. Fuzzy observer for detection of impending vehicle rollover with road bank angle considerations. In Proceedings of the IEEE 18th Mediterranean Conference on Control and Automation (MED’10), Marrakech, Marocco, 23–25 June 2010; pp. 1497–1502. [Google Scholar] [CrossRef]
Figure 1. Free body diagrams of: whole vehicle (a), sprung and unsprung masses (b).
Machines 10 00835 g001
Figure 2. Driving scenarios created in IPG CarMaker® for the L T R estimation: double lane change manoeuvre on a flat road (a), straight manoeuvre on a banked road (b) and straight manoeuvre on an asymmetrical waves road (c).
Machines 10 00835 g002
Figure 3. Double lane change manoeuvre at initial speed of 100 km / h on a flat road. From the top left side to the down right side: L T R , steering wheel angle and vehicle speed, vertical accelerations, lateral accelerations, roll angles and angular velocities.
Machines 10 00835 g003
Figure 4. Straight manoeuvre at 30 km / h on a banked road. From the top left side to the down right side: L T R , steering wheel angle and vehicle speed, vertical accelerations, lateral accelerations, roll angles and angular velocities.
Machines 10 00835 g004
Figure 5. Straight manoeuvre at 40 km / h on an asymmetrical waves road. From the top left side to the down right side: L T R , steering wheel angle and vehicle speed, vertical accelerations, lateral accelerations, roll angles and angular velocities.
Machines 10 00835 g005
Figure 6. Estimation of the vehicle Load Transfer Ratio at front (a) and rear (b) axles driving over the Bernina Pass.
Machines 10 00835 g006
Figure 7. Estimation of the vehicle Load Transfer Ratio at front (a) and rear (b) axles driving over the Stelvio Pass.
Machines 10 00835 g007
Figure 8. Estimation of the vehicle Load Transfer Ratio at front (a) and rear (b) axles during a FishHook maneuver.
Machines 10 00835 g008
Figure 9. Fast ramp steering manoeuvre at 70 km / h on a 10 deg banked road. From the top left side to the down right side: L T R , steering wheel angle and vehicle speed, vertical accelerations, lateral accelerations, roll angles and angular velocities.
Machines 10 00835 g009
Figure 10. ISO-LTR characteristics obtained during a fast ramp steering manoeuvre on a 10 deg banked road at different speeds.
Machines 10 00835 g010
Figure 11. Comparison of the ISO-LTR characteristics for a flat and a 10 deg banked road.
Machines 10 00835 g011
Figure 12. Schematic principle of the I L P T definition.
Machines 10 00835 g012
Figure 13. Fast ramp steering manoeuvre at 30 km / h on a 10 deg banked road: phase plane trajectory (top), L T R , reference ( T R e f ) and estimated ( I L T P ) time to reach L T R = 0.8 (down).
Machines 10 00835 g013
Figure 14. Double lane change manoeuvre at initial speed of 100 km / h on a flat road: L T R , reference ( T R e f ) and estimated ( I L T P ) time to reach L T R = 0.8 .
Machines 10 00835 g014
Table 1. Vehicle parameters.
TypeDescriptionParameterValue
SpringsTotal roll stiffnessK 209 , 000 Nm / rad
DampersTotal roll dampingC 6122.8 Nms / rad
Masses and inertiaRoll sprung mass moment of inertia I s 801.34 kgm 2
Sprung mass m s 1923.9 kg
FR unsprung mass m u F R 78.715 kg
FL unsprung mass m u F L 78.715 kg
RR unsprung mass m u R R 109.314 kg
RL unsprung mass m u R L 109.314 kg
Total massm 2300 kg
DistancesFront axle from the sprung mass CoGa 2.119 m
Rear axle from the sprung mass CoGb 2.221 m
WheelbaseL 4.34 m
Track widthT 1.674 m
Unsprung mass CoG height h u 0.324 m
Roll centre height h R 0.1998 m
Sprung mass CoG from the roll centre h s 1.0852 m
Front tyre radius r F 0.324 m
Rear tyre radius r R 0.324 m
Table 2. RNN: inputs and outputs.
TypeDescriptionUnits
InputsLongitudinal speed m / s
Longitudinal acceleration m / s 2
Lateral acceleration m / s 2
Vertical acceleration m / s 2
roll rate deg / s
yaw rate deg / s
pitch rate deg / s
steer angle deg
OutputsRoll angle deg
Front load transfer ratio
Rear load transfer ratio
Table 3. RNN: Architecture.
TypeDescriptionCharacteristics
LayersSequence inputNumber of features (8)
LSTMNumber of hidden units (100)
Fully connectedNumber of Responses (3)
Regression
Main HyperparametersAdamAdaptive moment estimation
MaxEpochs850
GradientThreshold1
InitialLearnRate0.01
LearnRateDropPeriod425
LearnRateDropFactor0.2
Table 4. Results: Mean Absolute Error and Mean Square Error related to the tested maneuvers.
ManeuverErrorValues
BerninaMAE L T R Front 0.0026
MAE L T R Rear 0.0030
MAE Roll 0.0500 deg
MSE L T R Front 9.7767 × 10 5
MSE L T R Rear 1.1046 × 10 4
MSE Roll 0.0048
StelvioMAE L T R Front 0.0066
MAE L T R Rear 0.0063
MAE Roll 0.0802 deg
MSE L T R Front 1.0434 × 10 4
MSE L T R Rear 8.8145 × 10 5
MSE Roll 0.0141
FishHookMAE L T R Front 0.0146
MAE L T R Rear 0.0138
MAE Roll 0.106 deg
MSE L T R Front 6.1685 × 10 4
MSE L T R Rear 5.3661 × 10 4
MSE Roll 0.0291
Publisher’s Note: MDPI stays neutral with regard to jurisdictional claims in published maps and institutional affiliations.

