Article

Degeneration Effects of Thin-Film Sensors after Critical Load Conditions of Machine Components

1
Institute of Micro Production Technology (IMPT), Leibniz University Hannover, 30823 Garbsen, Germany
2
DLR Institute for Quantum Technologies, Ulm University, 89069 Ulm, Germany
*
Author to whom correspondence should be addressed.
Machines 2022, 10(10), 870; https://doi.org/10.3390/machines10100870
Submission received: 31 August 2022 / Revised: 21 September 2022 / Accepted: 24 September 2022 / Published: 27 September 2022

Abstract

:
In the context of intelligent components in industrial applications in the automotive, energy or construction sector, sensor monitoring is crucial for security issues and to avoid long and costly downtimes. This article discusses component-inherent thin-film sensors for this purpose, which, in contrast to conventional sensor technology, can be applied inseparably onto the component’s surface via sputtering, so that a maximum of information about the component’s condition can be generated, especially regarding deformation. This article examines whether the sensors can continue to generate reliable measurement data even after critical component loads have been applied. This extends their field of use concerning plastic deformation behavior. Therefore, any change in sensor properties is necessary for ongoing elastic strain measurements. These novel fundamentals are established for thin-film constantan strain gauges and platinum temperature sensors on steel substrates. In general, a k-factor decrease and an increase in the temperature coefficient of resistance with increasing plastic deformation could be observed until a sensor failure above 0.5% plastic deformation (constantan) occurred (1.3% for platinum). Knowing these values makes it possible to continue measuring elastic strains after critical load conditions on a machine component in terms of plastic deformation. Additionally, a method of sensor-data fusion for the clear determination of plastic deformation and temperature change is presented.

1. Introduction

The sensory acquisition of measurement data is necessary in many branches of industry, e.g., to comply with safety, process or application limits. Important measurement variables are strain and temperature, which are usually measured using resistive sensors. In the automotive sector, for example, metallic strain gauges are used to measure the strain and compression condition of cast parts and engine blocks [1]. In the energy sector, strain gauges are used in 3D-woven composite spar caps for structural health monitoring (SHM) of wind-turbine blades and a reduction in measurement costs [2]. In the construction sector, deformations and crack building in buildings are measured with specially encapsulated strain gauges inserted into deep measurement boreholes that thus detect potential damage at an early stage [3]. For higher-level monitoring of machine components such as bearings, different approaches are used. They all aim to prevent damage caused by complex conditions like high speeds and heavy loads over a long period of time [4]. Here, the behavior at the elastohydrodynamic (EHD) rolling contact is of particular interest. Different approaches for the sensory monitoring of bearings are currently carried out by externally mounted sensors outside of the tribologically loaded EHD contact. Gao et al. presented a piezoelectric vibration sensor unit that was attached on the backside of one bearing washer to measure the force of the roller on the washer [5,6]. Marble et al. measured the cage motion and temperature with a sensor that is integrated to the cage to draw conclusions about the condition of the lubrication [7]. Large magnetic stray flux sensors were used to detect bearing faults such as cracks or holes in the outer race or a deformation of the seal [8]. Newer approaches show the use of neural network models using multi-sensor data from two accelerometers used as vibration sensors [9].
One approach to obtain the maximum measurement information directly at the contact point of the bearing washer and rollers is to use strain gauges in thin-film technology, which are produced directly on the bearing washer where the EHD contact is located. They can generate data at previously inaccessible measurement positions [10] due to their small thickness of less than 5 µm [11]. They withstand temperatures up to at least 400 °C [12]—which surpasses the range of conventional polymer film-based sensors [13]—, have high adhesion on steel [12] and can be applied and structured on curved surfaces as well [14].
Different sensor layers have been used in the literature. With a sensor layer based on amorphous diamond-like carbon (DLC) produced in a chemical vapor deposition (CVD) process, high measurement signals with increasing strain were detected. Due to the semiconductor behavior of the DLC layer, a high temperature sensitivity was observed as well [15]. Other investigations show the measurement of the temperature change at the rolling contacts in a two-disk test rig with different machine conditions concerning pressure and friction [16]. Here, a 4.6 µm Al2O3 insulation layer and a one-dimensional sensor line of 200 nm chromium was used that revealed a positive resistance change with increasing temperature and a negative resistance change for increasing pressure.
To further extend the application range of component-inherent thin-film sensors to extreme mechanical stresses, knowledge of their behavior under plastic deformation and of their application limits is important. This is due to a possible change in the sensor properties with plastic deformation because of, e.g., geometry effects, crystal defects or crack formation. Only if the property change is known—especially the sensitivity for strain and temperature—is a further use of the sensors with high accuracy possible. Therefore, this article targets the influence of plastic deformation on sensor properties such as resistance, strain and temperature behavior, which is presented after the details of sensor manufacturing. In the end, a sensor-data fusion method is shown to determine the stress condition of a machine component regarding deformation and temperature.

2. Materials and Methods

This section describes the processes for thin-film sensor production on stainless steel substrates in detail using cathode sputtering. As insulation layer, Al2O3 was applied. Constantan (Cu54Ni45Mn1) is used for the strain-gauge sensor layer and platinum (Pt) for the temperature sensor. Afterwards, the special tensile specimen geometry of the substrate is shown. Finally, the characterization and test methods are explained concerning elastic and plastic deformation and temperature behavior.

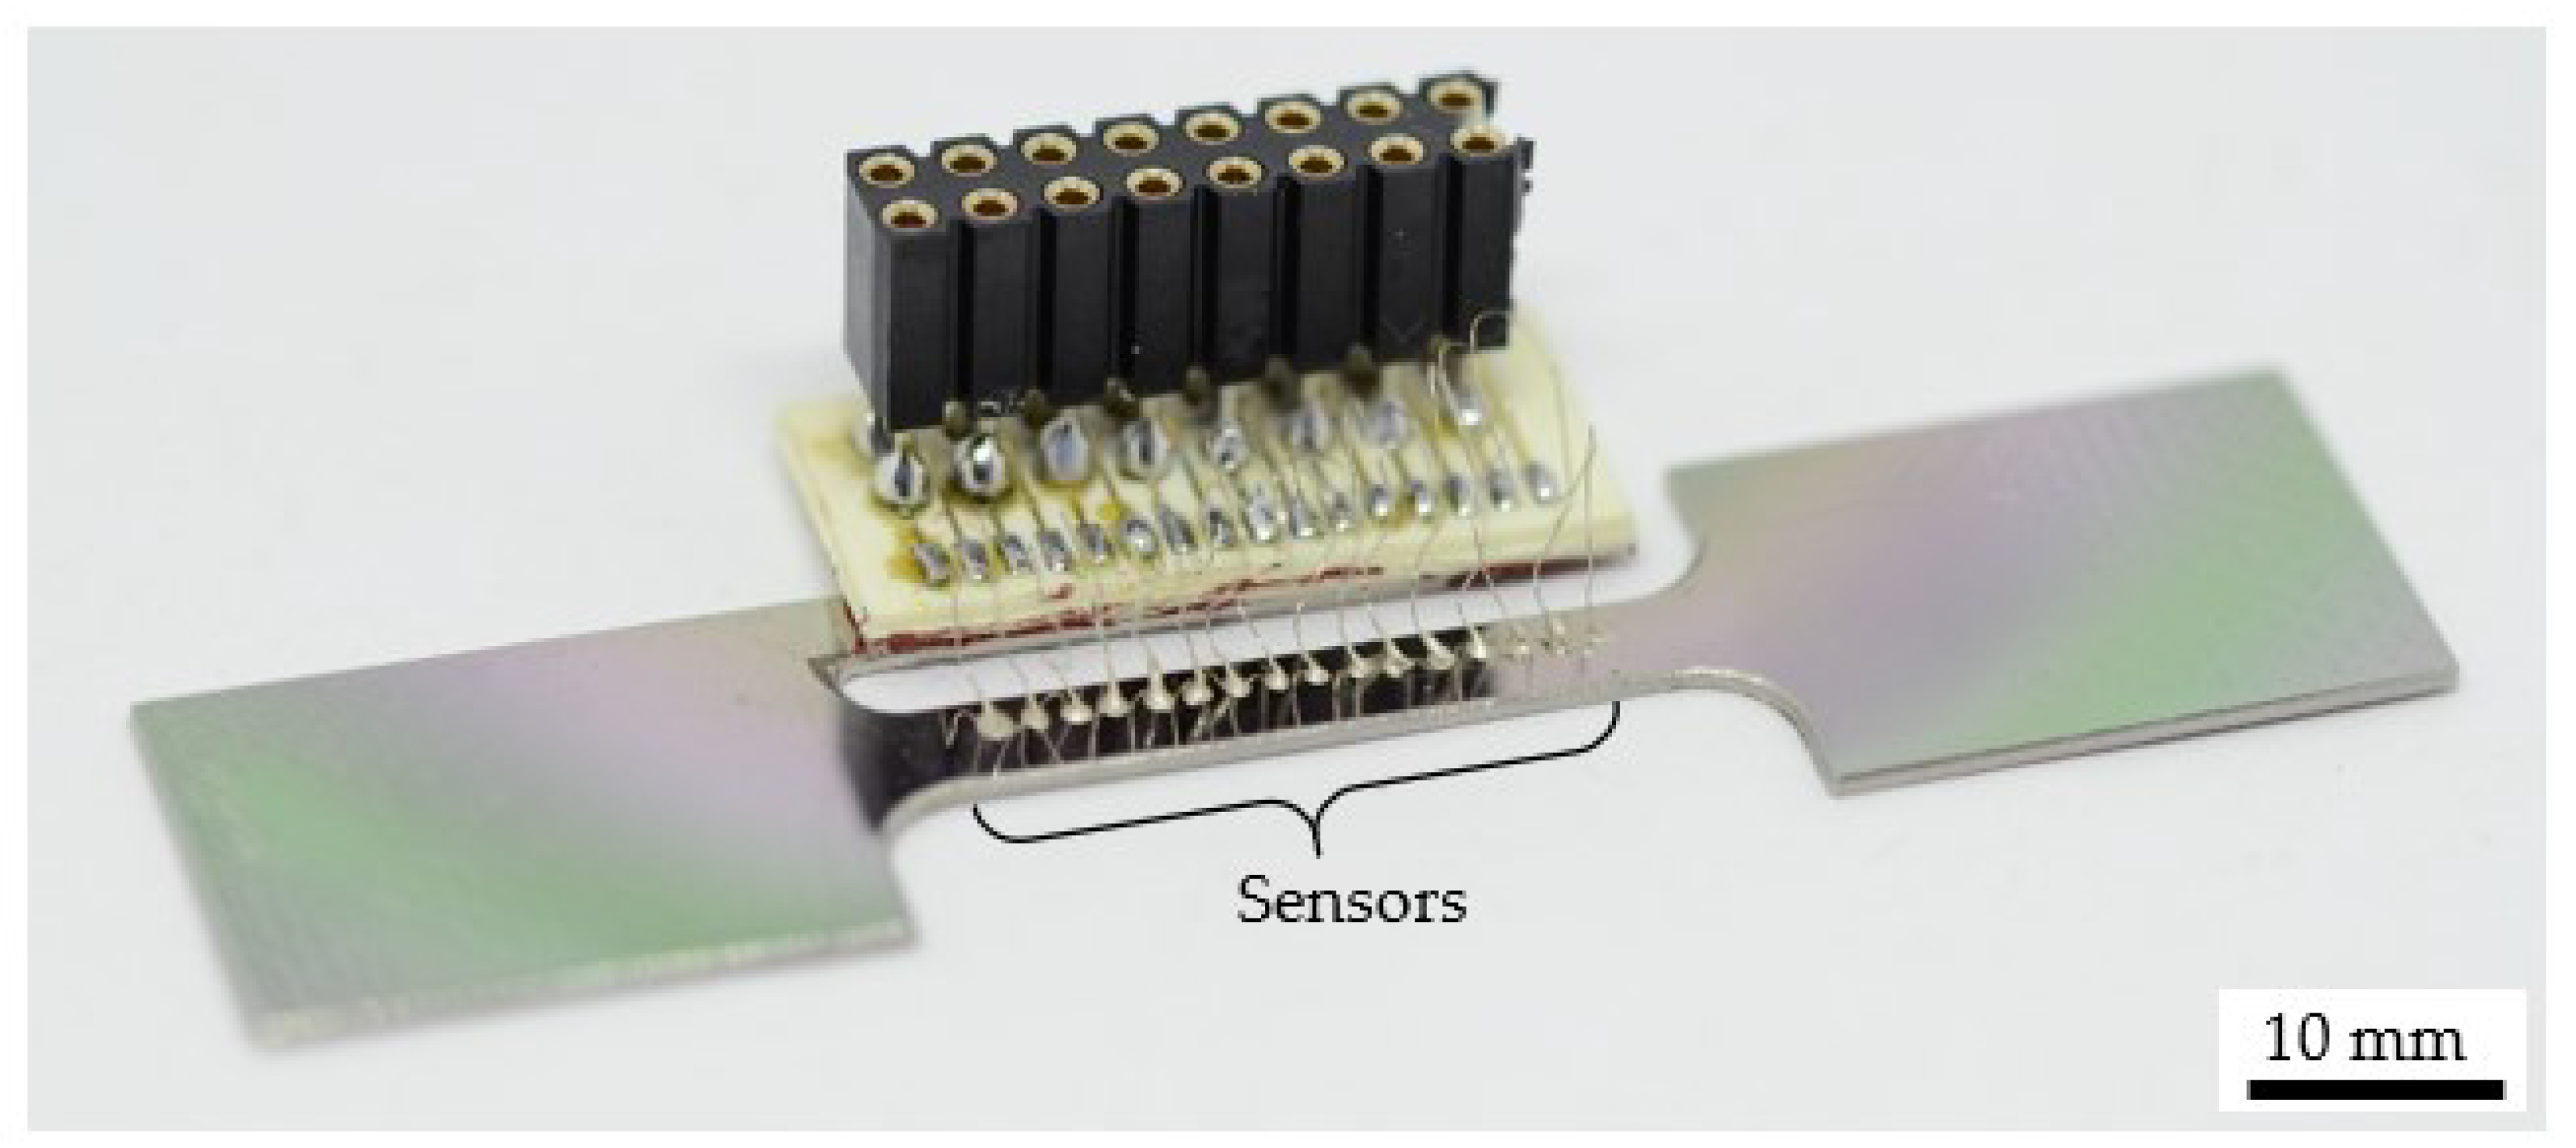
2.1. Sensor Manufacturing

2.1.1. Sensor Design

The sensor design contains three strain gauges (rotated by 45° each, named Sg 0°, Sg 45° and Sg 90°) and a rotationally symmetric temperature sensor (T sensor). The strain gauges build a rosette that can be used in the future for the determination of the two main directions and quantities of mechanical stress [17]. The strain gauges consist of 10 parallel lines with a width of 10 µm connected by meander curves resulting in a total length of 5 mm. The temperature sensor has a total length of 6.54 mm and a width of 13 µm. All sensors cover small areas of approximately 0.18 mm2 to enable local measurements for the application in the future.
The complete sensor system is shown in Figure 1.

2.1.2. Sputter Deposition

For plastic and elastic investigations, an austenitic stainless steel disc (1.4301 (X5CrNi18-10), diameter: 100 mm, thickness: 0.8 mm) was used as a substrate for the deposition of component-integrated strain gauges and temperature sensors. The arithmetic mean roughness value Ra was 9 nm and the mean roughness depth Rz was 86 nm, measured with a tactile roughness measurement device. At the beginning of the deposition of the insulation layer in a SenVac Z550 sputtering system, the disc was subjected to a sputter etching process in order to improve the adhesion strength of the following insulation layer. The etching was performed with a power of 200 W and a DC bias voltage of 108 V for a period of 5 min with a base pressure of 1.1∙10−4 mbar and a sputtering pressure of 3.1∙10−3 mbar in a pure argon atmosphere. Afterwards, the insulation layer was directly applied to prevent contamination of the surface. The insulation layer, formed out of Al2O3, was applied with a power of 400 W (1.88 W/cm2) at a base pressure below 2.3∙10−5 mbar and a process pressure of 3.1∙10−3 mbar in a pure argon atmosphere. With a deposition rate of 8.3 nm/min, a 2 µm-thick insulation layer was deposited. The sensors were then processed by microtechnological methods. For deposition and structuring of the strain gauges and the temperature sensor, a lift-off process was used. After the spin coating of the resist AZ® 5214 E, a softbake, the exposure and the development, the constantan strain gauges were sputtered with the SenVac Z550 system. A 300 nm-thick layer was produced with a power of 200 W and a sputtering pressure of 4.2∙10−3 mbar in a pure argon atmosphere, resulting in a deposition rate of 16.2 nm/min over a period of 18.5 min. After the final lift-off, the platinum temperature sensor was manufactured in the same lift-off process. This time, a Kenotec MRC sputtering system was used for platinum sputter deposition in a pure argon atmosphere with a base pressure of 2.7∙10−7 mbar, a sputtering pressure of 9.1∙10−3 mbar and a power of 200 W (0.94 W/cm2). With a deposition rate of 14.4 nm/min, a 260 nm-thick layer was deposited and the final lift-off took place.

2.1.3. Sample Preparation

For the sensor evaluation, tensile specimens were milled from the disc. The layout was created based on the standard DIN 50125 [18] with a total length of 68 mm, a width of 3.6 mm and a thickness of 0.8 mm. The test length was 22 mm. The width was chosen to enable high strains in the tensile specimen with a force of up to 2500 N, which is the maximum load of the tensile testing machine used. As a special feature, a steel bar was left at one edge where a circuit board was attached using high-temperature silicone. A conductive two-component silver adhesive was used for the electrical contacting of the sensor’s contact pads to the soldering pads of the circuit board with thin wires. Due to the possibility of high plastic deformation of the specimen, they were used in an appropriate loop. A final tensile specimen is shown in Figure 2. Two such samples were manufactured and characterized.

2.2. Measurement Details

The basic characteristics for resistance-based thin-film sensors are the initial resistance R0 at room temperature and the insulation resistance Rins. Additional important values for strain gauges are the k-factor (k), which describes the strain sensitivity, and the temperature coefficient of resistance (TCR), which qualifies the resistance change due to a change in temperature, given by Equations (1) and (2). Here, ∆R represents the resistance change in the initial resistance value R0 caused by either a variation in strain ∆ε or in temperature ∆T. These four characteristics (R0, Rins, k-factor and TCR) will be examined for their dependence on plastic deformation.
k = (ΔR/R0)/Δε
TCR = (ΔR/R0)/ΔT
The resistance measurements were performed using the multimeter Keithley DAQ6510 in four-wire technology. For the insulation resistance, a tera-ohm meter Fischer TO3 was used with a measurement voltage of 10 V. The two electrodes were connected to one contact pad of each sensor and to the metal substrate.
The strains in the elastic range for the evaluation of the k-factor and in the plastic range for the irreversible plastic deformation were initiated with the tensile testing machine Mecmesin MultiTest 2.5-xt. For the elastic strain, a preload Fpre of 100 N and a maximum load Fmax of 350 N were chosen. This results in strain values of 172 µm/m and 602 µm/m, which finally led to an elastic strain difference ∆ε of about 430 µm/m for the characterization of the k-factor. The strain was calculated according to Equations (3), (4) and finally Equation (5) [12]. With the strain ε, the mechanical stress σ, the Young’s modulus E, and the cross-sectional area A—which is the product of the sample width w and the thickness t—, the strain difference ∆ε is calculated. For the plastic deformation, values of 0.01%, 0.19%, 0.54%, 0.92% and 1.30% were achieved with force values of 616 N, 800 N, 900 N, 950 N and 1250 N.
ε = σ/E
σ = F/A
Δε = (FmaxFpre)/(E·w·t)
For determination of the TCR, a hot plate was used in the temperature range from 30 °C to 100 °C. Here, only the cooling curves were used for the evaluation since the samples were removed from the hot plate to accelerate the cooling process which results in a homogenous temperature decrease. The temperature measurement took place with a commercial temperature sensor (Pt100, type PTFM101B1A0) from TE Connectivity. This was attached to the tensile specimen with high-temperature silicone from Pattex to enable live measurements of the temperature.
The characterization procedure started with the measurement of the initial resistance and the insulation resistivity, followed by the k-factor and the TCR. A plastic deformation in steps of approximately 0.35% beginning with the yield strength (plastic deformation of 0.2%) was then carried out until the irreversible destruction of the sensors. The resulting plastic deformation was determined using a reflected light microscope from Nikon with a lens with a magnification of 10. The change in distance between the left contact pad of the strain gauge Sg 0° to the right contact pad of the temperature sensor was measured. Since these structures exhibit the longest distance for measurement, the accuracy increases when normalized on the initial length, which was 18.5 mm. It could be measured with a standard variation of ±1 µm. A plastic deformation of, for example, 1% (185 µm), would lead to a percentage error of ±0.54%, which is negligible. For the optical analysis of the sensor failure, lenses with a magnification of 10 and 100 were used.
For all measurement parameters, at least three values were taken. The following figures include the resulting standard deviations, which are basically not visible due to their small values.
The surface roughness values were measured with the tactile measurement device HOMMEL-ETAMIC W5 from Jenoptik. Here, the length of the measurement was set to 4.8 mm and the velocity of the diamond tip was 0.5 mm/s. For the analysis, a filter according to ISO 11562 [19] was used.

3. Results

With the fabricated sensors, the influence of plastic deformation on the insulation resistance, initial resistance, the k-factor and the temperature coefficient of resistance (TCR) can be determined. Two samples were characterized. Since the thin-film manufacturing happened with the same deposition processes, similar behavior of both tensile specimens was measured resulting in maximum standard deviations of 5.6%.

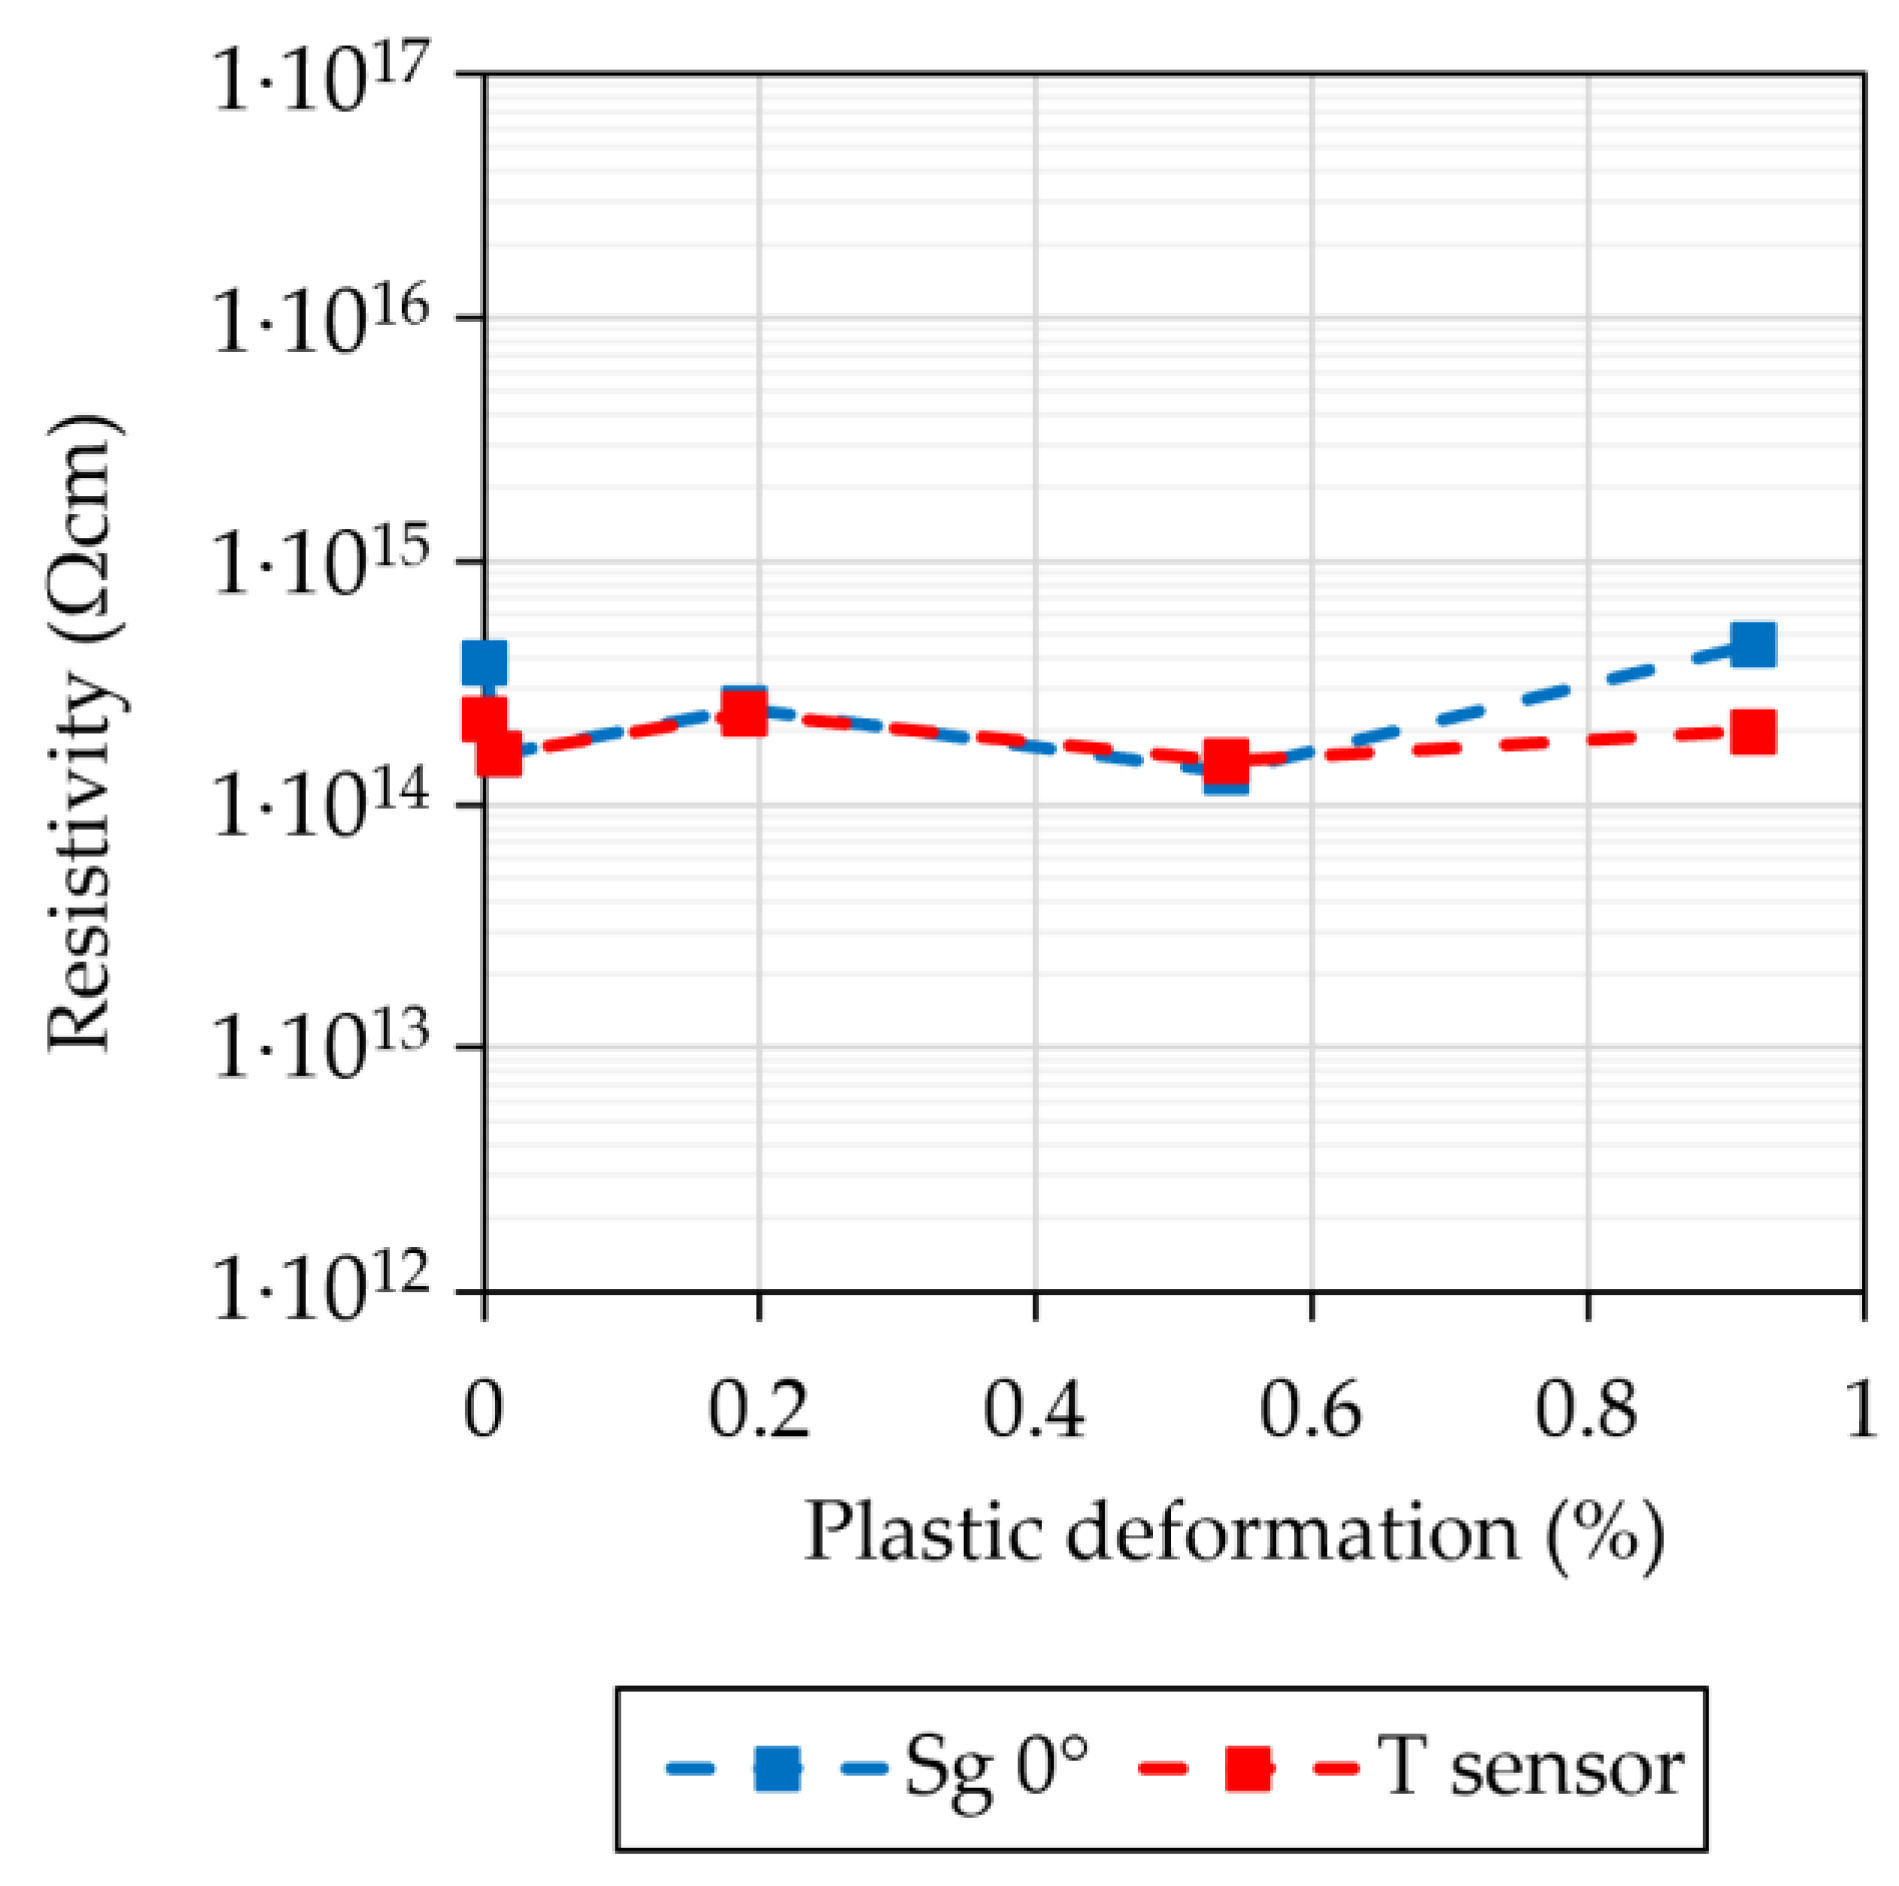
3.1. Influence of Plastic Deformation on the Insulation Resistivity

The insulation resistance and therefore its resistivity of the Al2O3 layer stays constant, as Figure 3 proves. The resistivity—calculated according to Equation (6)—does not change significantly up to a plastic deformation of at least 0.9% with a mean value of 2.2∙1014 ± 1.0∙1014 Ωcm, which is comparable to the literature [20,21]. The mean resistance value was 1.9 ± 0.8 TΩ. For simplification, only the values of one constantan strain gauge and the platinum temperature sensor are shown.

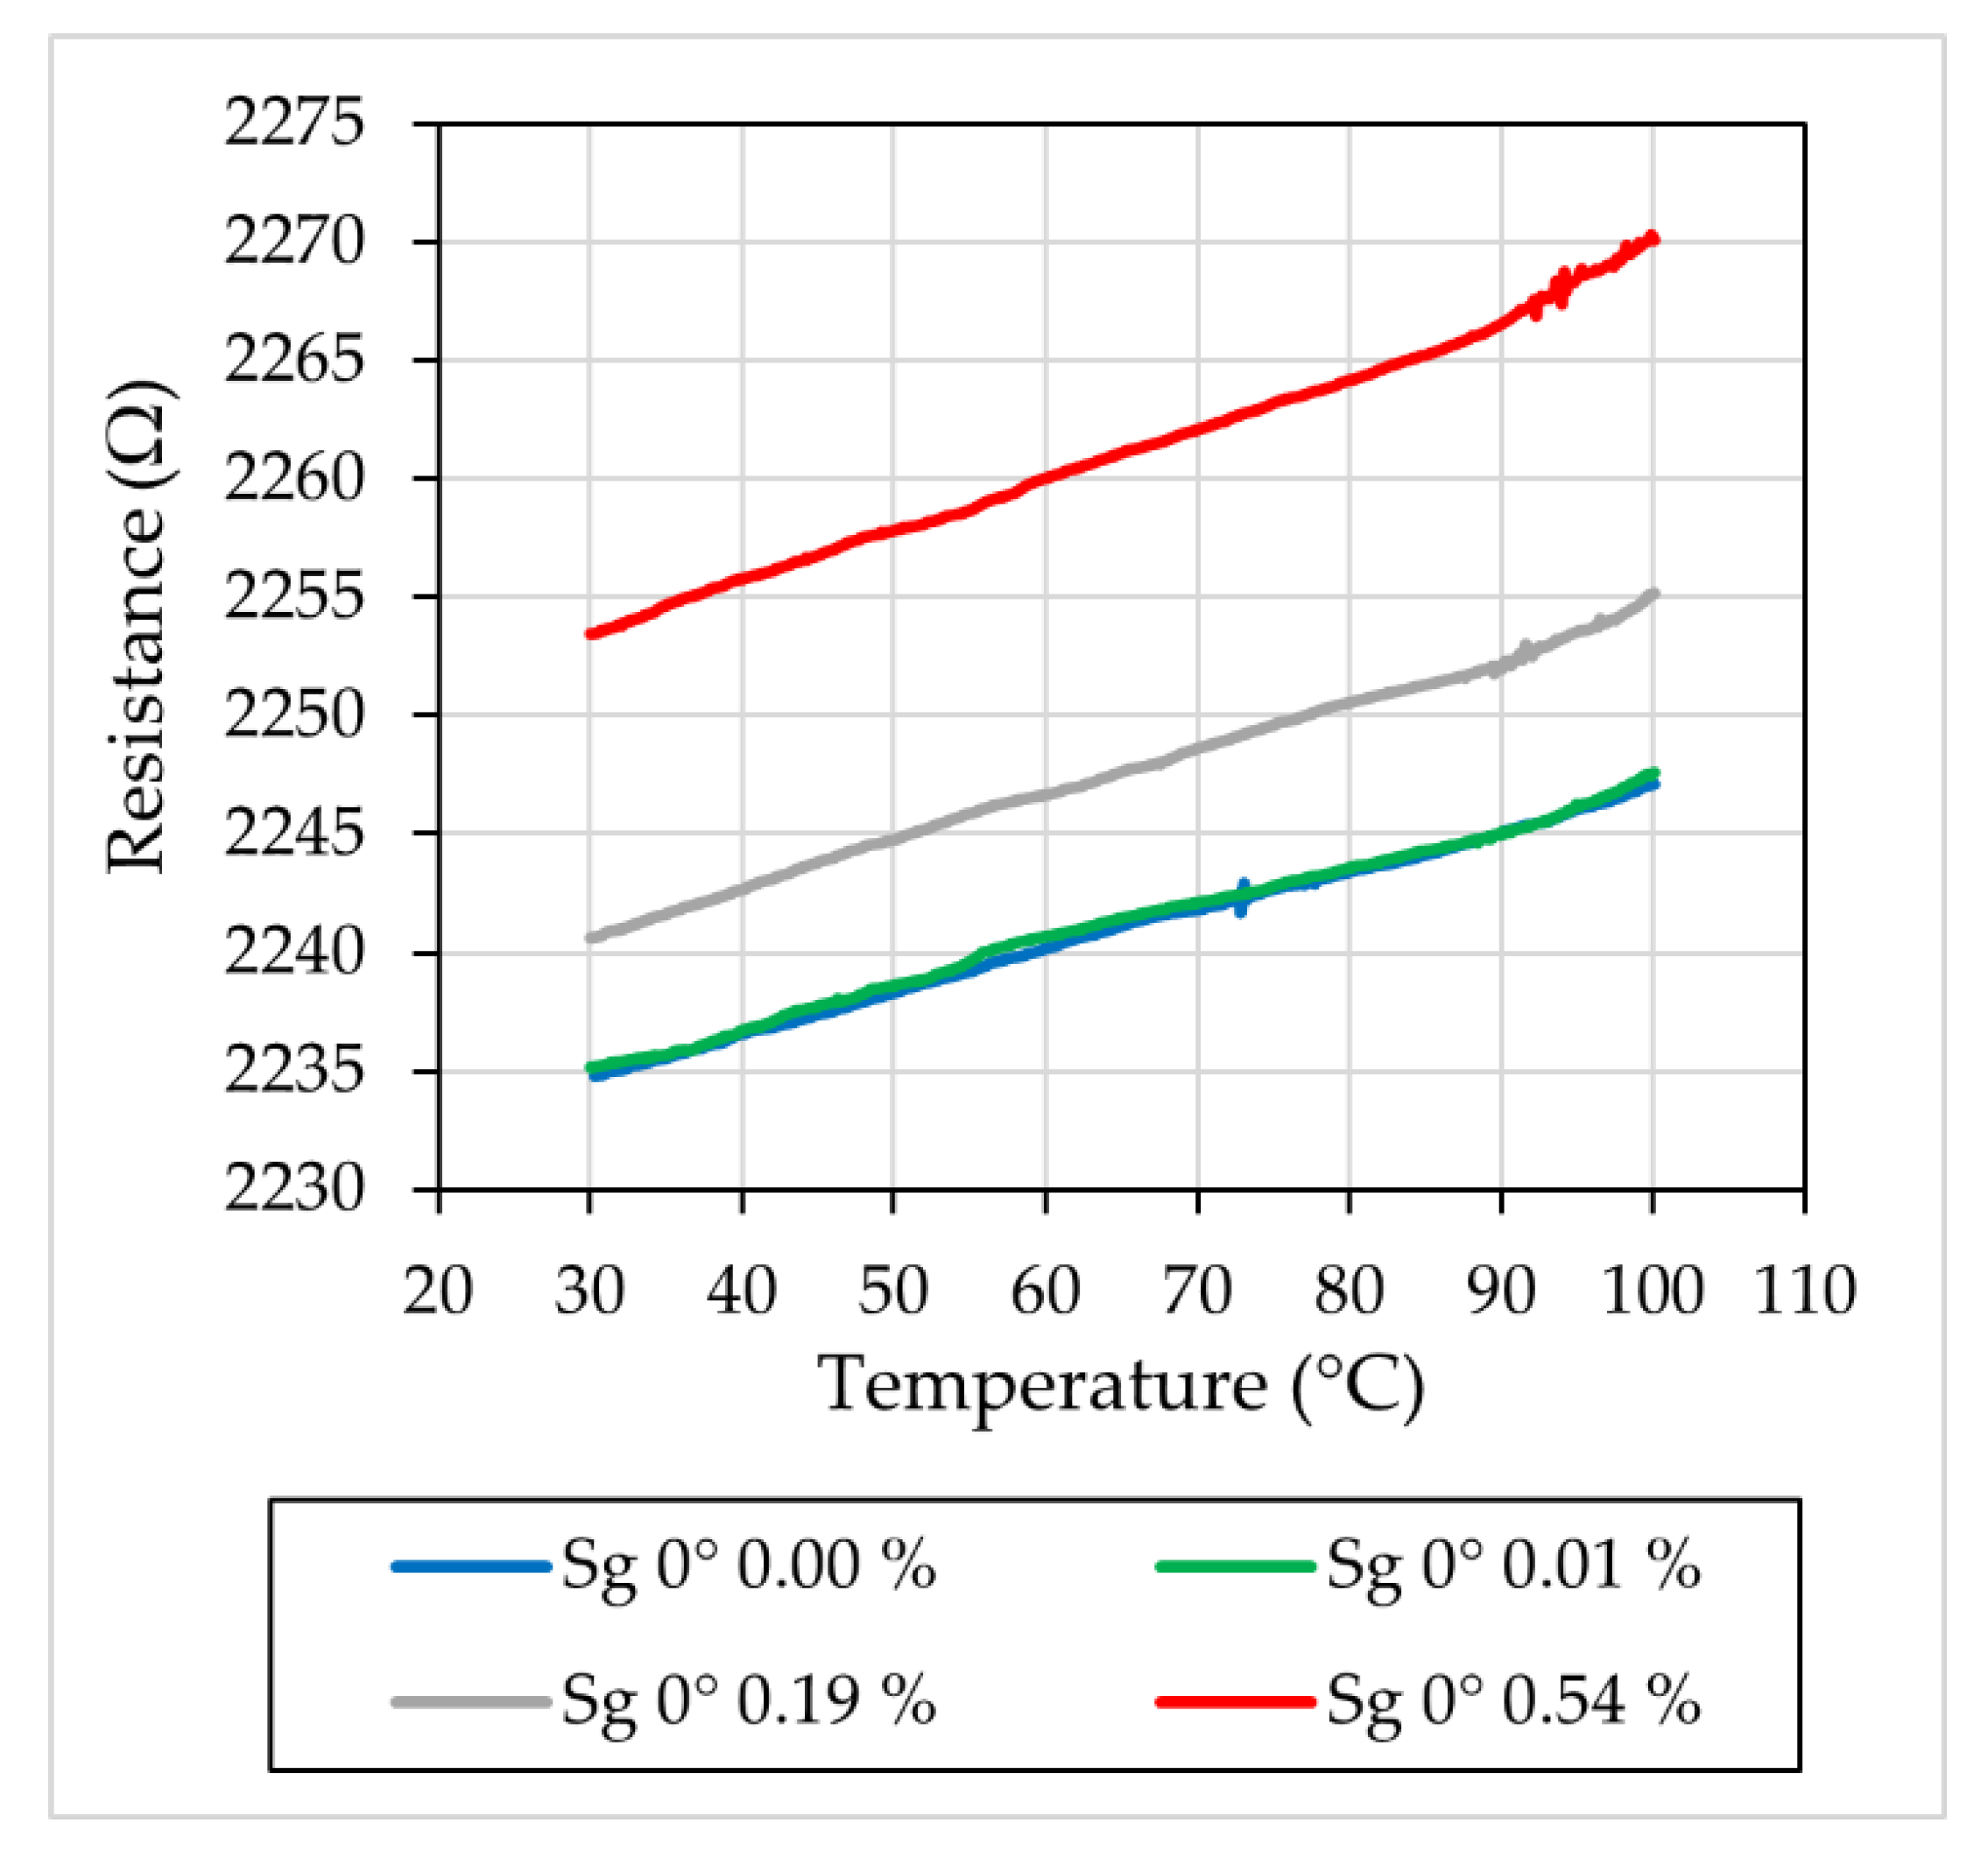
3.2. Influence of Plastic Deformation on the Initial Resistance

The initial resistance values for the three strain-gauge sensors and the temperature sensor were first measured at room temperature without applying any elastic or plastic strain. The result and a comparison with values from the literature is given in Table 1.
The initial resistance of the individual sensors changed with increasing plastic deformation. Different behaviors could be observed for the absolute values, as Figure 4a reveals. For comparing without the influence of the different initial resistance values before the plastic deformation, Figure 4b shows the normalized resistance change in the individual sensors. Regarding the three strain gauges, the strain gauge aligned in the direction of elongation (Sg 0°) experienced the highest resistance change of 0.85% after a plastic deformation of approximately 0.5%. An increase of 0.4% can be observed for the strain gauge aligned at 45° (Sg 45°). In addition, it can be seen that the strain gauge arranged perpendicularly to the direction of elongation (Sg 90°) has a negative change in resistance of up to −0.2%. After a plastic deformation of 0.9%, the strain-gauge resistance values could not be measured anymore. Only the temperature sensor still showed reasonable resistance values at 0.9% plastic deformation. After additional plastic deformation up to a value of 1.3%, the platinum temperature sensor was no longer measurable, and thus no longer functional as well. An increase of 1.4‰ per 1‰ plastic deformation was detected.

3.3. Influence of Plastic Deformation on the Strain Sensitivity (k-Factor)

The most interesting characteristic of a strain gauge is the k-factor k, which describes the strain sensitivity. The k-factor decreases continuously with increasing plastic strain in Figure 5a for all four sensors. The constantan strain gauge (Sg 0°) has a value of 2.15 ± 0.02 in the beginning and a value of 1.96 ± 0.02 after a plastic deformation of 0.5%.
In the studied plastic region zone, the behavior can be considered approximately linear, which leads to a reduction of 17‰ per 1‰ plastic deformation. The strain gauge Sg 45° showed values from 0.79 ± 0.02 to 0.71 ± 0.01 (19‰ reduction per 1‰ plastic deformation). For the strain gauge Sg 90°, an initial k-factor of 0.26 ± 0.02 was measured, which decreased to a value of 0.23 ± 0.01 (22‰ reduction per 1‰ plastic deformation).
The k-factor of the temperature sensor decreased from 1.55 ± 0.02 to 1.42 ± 0.02 after a plastic strain of 0.9%, which is a reduction of 9‰ per 1‰ plastic deformation.
Once again, Figure 5b reveals comparable percentual decreases for the k-factor of the strain gauges and the significantly different behavior of the symmetric temperature sensor.

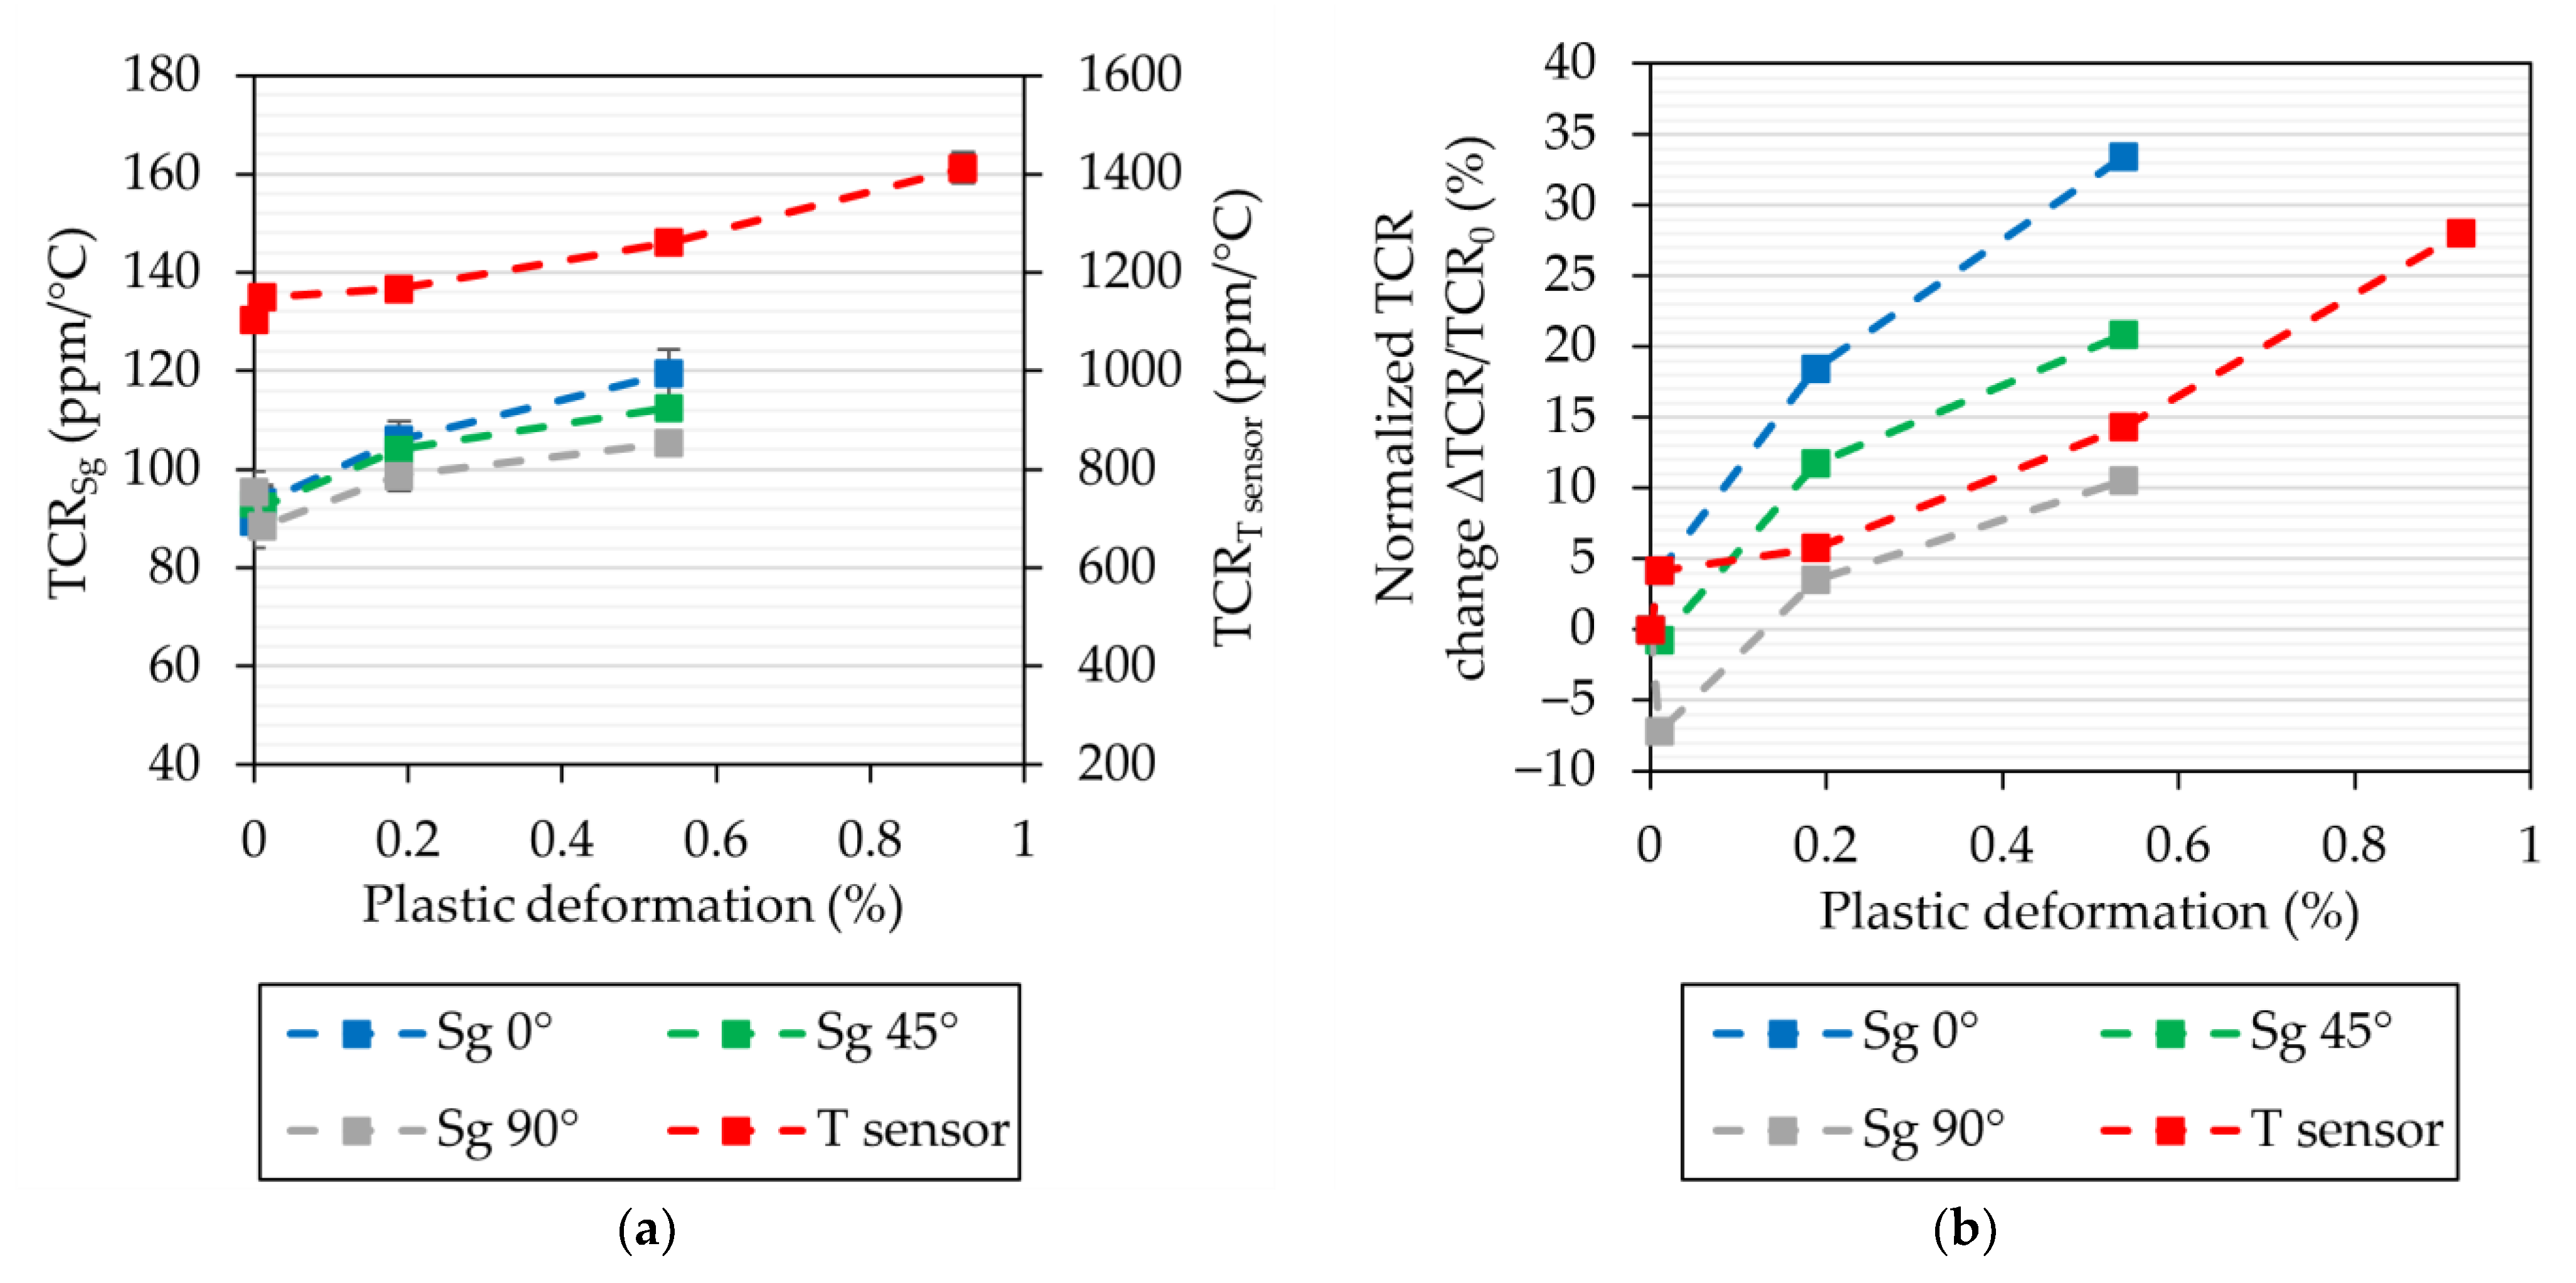
3.4. Influence of Plastic Deformation on the Temperature Coefficient of Resistance (TCR)

A change in the TCR could be observed as well. For each resistive sensor, a linear behavior of the resistance with increasing and decreasing temperature was assumed and observed. This enables a comparison of the single curves. As an example, the resistance change with temperature for strain gauge Sg 0° is shown in Figure 6 at different plastic deformation states. The linear regression showed coefficients of determination (R2) beginning with 0.9985 before any plastic deformation, decreasing to 0.9933 for maximal plastic deformation.
With increasing plastic deformation, the gradient of the resistance change increases, leading to increased TCR values for all sensors, shown in Figure 7a. The TCR of the constantan strain gauge Sg 0° increases from 89 ± 5 ppm/°C to a value of 119 ± 5 ppm/°C after a plastic strain of 0.5%, which is an increase of 62‰ per 1‰ plastic deformation. The strain gauges Sg 45° and Sg 90° showed values from 93 ± 3 ppm/°C to 112 ± 2 ppm/°C (39‰ per 1‰ plastic deformation) and 95 ± 4 ppm/°C to 105 ± 1 ppm/°C (20‰ per 1‰ plastic deformation).
The platinum temperature sensor shows an increase of 30‰ per 1‰ plastic deformation with values from 1103 ± 12 ppm/°C to 1,412 ± 32 ppm/°C.

4. Discussion

This section interprets the results based on the detailed description of the influence of plastic deformation on the different thin-film sensors and finally shows a method of sensor-data fusion to determine the stress condition of a machine component regarding deformation and temperature.

4.1. Insulation Resistivity

The comparison of the mean resistivity value of 2.2∙1014 Ωcm (mean resistance of 1.9 TΩ) with thin-film values from the literature shows good agreement (e.g., 1.2∙1014 Ωcm [10]). As expected, there is no difference between strain gauge and temperature sensor. Since the insulation resistance values stay constant over the investigated plastic deformation region up to at least 0.9%, no significant damage can be measured at first. Nevertheless, after optical microscopy, thin cracks in the Al2O3 layer could be observed after a plastic deformation of 0.9%, as shown in Figure 8. As expected, these defects are aligned perpendicularly to the strain direction of the tensile specimen.

4.2. Initial Resistance

The constantan resistivity shows a mean value of 1.34∙10−4 Ωcm. A small standard deviation below 1% could be measured for the three differently aligned constantan strain gauges which proves the existence of an isotropic and homogeneous sputter coating. Compared to the bulk value of 0.49∙10−4 Ωcm, an increase of factor 2.7 exists. For platinum, the same factor can be calculated even though the sensors were deposited with two different coating systems. One of the explanations for the increased resistivity values compared to values of bulk material can be the influence of scattering at grain boundaries and at interfaces with other materials, which play a major role for the resistivity value [24]. In the literature, a general decrease in the resistivity with increasing layer thickness can be found for different materials [25,26], which supports the explanation. Another aspect is the impact of surface roughness, which would influence both sensor types in the same way. A tactile roughness measurement resulted in an arithmetic mean roughness value Ra of 9 nm and a mean roughness depth Rz of 86 nm. The detailed influence of different roughness values on the thin-film resistivity has to be investigated in the future. A thin-film resistivity value for constantan from the literature is 1.10∙10−4 Ωcm [11], which is in the region of the measured value but still shows a deviation of 18%. Slightly different alloy compositions could be the reason here.
The normalized resistance changes show values of 1.7‰, 0.8‰ and −0.4‰ per 1‰ plastic deformation for the strain gauges Sg 0°, Sg 45° and Sg 90°. This is because the geometry of the strain gauges changes with increasing plastic deformation, which results in a change in resistance, according to Equation (6), where ρ, l and A represent the resistivity, the length and the cross-sectional area.
R = ρ · l/A
The highest change could be observed for the strain gauge aligned in strain direction (Sg 0°) because the length of the conductive tracks increases the most due to their alignment. The strain gauge aligned perpendicularly to the strain direction (Sg 90°) reveals a resistance decrease because the plastic deformation increases the width—and therefore the cross-sectional area A—and decreases the length l of the sensor’s conductive tracks (Equation (6)).
Since the insulation resistance was still present up to at least 0.9% plastic deformation (compare Figure 3), it can be assumed that cracks in the constantan layer are the reason for this behavior, which occurs at a plastic deformation between 0.5% and 0.9%. Optical images confirm this assumption, as Figure 8c proves. In contrast, the resistance of the platinum temperature sensor increases up to 1.8% at 1.3% plastic deformation when the failure takes place. The higher resilience of platinum against crack building can be seen in Figure 8d. This image shows a platinum conductor track after 1.3% plastic deformation. Several things have become obvious: First, on the left side, a crack of the Al2O3 layer is present which did not exist in the platinum layer (I). On the right side, a crack of the Al2O3 layer leads to the beginning of the formation of a crack in the platinum layer (III). Finally, in the middle, a complete crack has built that is responsible for the failure of the sensor (II). Due to its metal properties, platinum is more ductile than the alloy constantan and can withstand higher strains, which would correspond to the literature: The elongation at break is 25% [27] for constantan and 35% [28] for platinum. Since these values are for bulk material, further investigations have to be performed. Nevertheless, the results give important information about the maximum permitted plastic deformation. With this knowledge, on the one hand, the sensors can be applied at specific positions on machine components based on, for example, mechanical FEM simulations, where strain values appear that are below the critical plastic deformation. On the other hand, it can be assumed that a plastic deformation above 0.9% (1.3%) occurs if a failure of constantan (platinum) sensors is detected.

4.3. K-Factor

The k-factor value 2.15 for the constantan (Cu54Ni45Mn1) strain gauge is in agreement with values from the literature for bulk material (2.15 for Cu60Ni40 and 2.0 for Cu56Ni44 [13]) and thin-film sensors (2.07 for Cu54Ni45Mn1 [11]). The k-factor for the strain gauge perpendicular to the elongation direction shows a value of 0.26. According to Equation (7) [13], this corresponds to a cross-sensitivity of 12%. Polymer-foil based sensors are optimized for a low cross-sensitivity. Manufacturer specify values between 0.2 and 0.6% [29]. The comparatively high cross-sensitivity of 12% has to be reduced mainly through the adaption of the sensor layout. In any case, it has to be considered for further measurements on machine components. As expected, the k-factor of the strain gauge Sg 45° lies between the others.
q = k/k90°
For platinum, a k-factor of 1.55 was the result. It is remarkable that the resulting k-factor could be reduced with the developed symmetric sensor design by at least factor 2 compared to values from the literature of 3.8 [24]. This is an advantage concerning its usage as a temperature sensor with low strain impact.
The plastic deformation has a significant impact on the k-factor. The nearly linear decrease amounts to 17‰, 19‰ and 22‰ per 1‰ plastic deformation for the strain gauges Sg 0°, Sg 45° and Sg 90°. The k-factor decrease in the platinum temperature is 9‰ per 1‰ plastic deformation. These values show that strain measurements are still possible after critical loads of machine components with plastic deformations below 0.5%, even though the strain sensitivity will be reduced. Since the normalized resistance change is under 1.5% for all sensors, this behavior cannot be the reason for the maximum absolute k-factor decrease of 12% (compare Equation (1)). In general, mechanical strain influences the charge carrier transport mechanism. In this case, it is most likely that the plastic deformation creates different types of crystal defects in the material, which reduce the charge carrier mobility. It can be assumed that these defects influence the grain boundaries, whose condition plays a major role for the electrical resistance [24]. Further investigations have to be made to understand this behavior in detail.

4.4. Temperature Coefficient of Resistance (TCR)

The TCR describes the temperature sensitivity of the sensors. As the temperature influences the strain signal, low values close to zero are desired. For temperature sensors, the value should be high and the strain sensitivity low. That is the reason why constantan and platinum are chosen for the strain and temperature sensors.
Since the TCR should not depend on the alignment of the strain gauges, the results show an expected behavior of constant TCR values of the three strain gauges aligned in three different directions with a mean value of 92 ± 3 ppm/°C. It is in good agreement with the alignment-independent resistivity, as explained before. The literature for constantan thin films shows values close to zero as well (−52 ppm/°C [11], +75 ppm/°C [14]) even though bulk values seem to be even lower (±10 ppm/°C [30]). Differences can be found due to different substrate conditions or slightly different alloy compositions.
For the normalized TCR change with plastic deformation, differences were detected. This is because of the different alignments, since the plastic deformation only works in one direction, so the isotropic TCR behavior interferes with the anisotropic strain impact. This is the conclusion of the decreasing impact of the plastic strain on the TCR change with changing alignment of the strain gauge towards the perpendicular direction. The change decreased from 62‰ (Sg 0°) over 39‰ (Sg 45°) to 20‰ (Sg 90°) per 1‰ plastic deformation.
As expected, the TCR of the platinum temperature sensor is significantly higher than the value of the constantan strain gauges. Nevertheless, compared to bulk values (3850 ppm/°C [31]) and to other thin-film platinum sensors (1937 ppm/°C [10], 2600 ppm/°C [24]), the TCR is low with a value of 1103 ppm/°C. Reasons for this behavior might be the low thickness of 200 nm compared to 1 µm [24] for the value of 2600 ppm/°C so that the influence of scattering at defects, grain boundaries and interfaces increases [24].
As for the k-factor, the increase in the initial resistance of up to approximately 1.5% cannot be the main reason for the absolute TCR increase of up to 33% (compare Equation (2)).

4.5. Condition Monitoring

In summary, the plastic deformation results in a degradation of the thin-film sensors. These means a negative influence on the characteristic properties of strain gauges and a positive influence on the temperature sensor. Nevertheless, the knowledge about the behavior of the sensors properties enables the further use of the sensors after crucial machine loads, resulting in plastic deformations up to at least 0.5% without the need for generating a new characteristic curve of the sensor. With the combination of all this information, it is possible to determine the elastic strain εel, the plastic strain εpl and the temperature difference ΔT. In a real application on a machine component, the strains can occur in x-, y- and z-directions. To simplify the procedure, Equation (8) shows the dependency of a resistive sensor in only one direction.
RT,εel,εpl) = R0·[1 + aR·εpl + TCR0·ΔT·(1+aTCR·εpl) + k0·εel·(1+ak·εpl)]
Since it is only the information of one sensor, no final statement can be made for the origin of the resistance value. Without the elastic strain, Equation (8) simplifies and for each sensor, Equation (9) results, showing the dependency of the measurable resistance value R and the unknown plastic deformation εpl on the temperature change ΔT.
ΔT (R,εpl) = (R/R0 − 1 − aR·εpl)/(TCR0·(1+aTCR·εpl))
With its application on all sensors, the dependency of the temperature change can be illustrated in the dependency of the plastic deformation when a resistance value R is measured for each sensor. Due to the fact that this resistance value results out of both a possible temperature change and a possible plastic deformation, the values of these two physical values are not clear when measuring only one sensor. Sensor-data fusion has to be applied, as shown in Figure 9b as an example for one stress condition. Here, a temperature change of 20 °C and a plastic deformation of 0.5% are present, clearly displayed by the intersection of the single curves. Since there are only two unknown values, two sensors would have been enough for a clear assignment.
With this procedure, it is possible to determine the unknown values for the temperature change and the plastic deformation if the parameters of Equations (8) and (9) are known. Additionally, the deformation only takes place in one direction. Here, the direction parallel to strain gauge Sg 0° was chosen. If the direction of the plastic deformation on a real machine component is completely unknown, then seven unknown values appear in total: ΔT, εpl_x, εpl_y, εpl_z, εel_x, εel_y, εel_z. For there to be clear determination, all in all seven sensors would be needed. The solution of the emerging nonlinear system of equations would need the use of numerical algorithms such as Newton’s method [32], as mentioned above. In this way, and with the sensors applied on a real machine component, a measurement of the unknown values would be possible without interrupting the operation of the machine. For example, the thin-film sensors could be used on the racetracks of roller bearings by coating one of the bearing washers. In this use case, high loads can occur and a plastic deformation of the bearing can negatively influence the machine component’s behavior. Here, the sensor application is possible due to the advantage of the component-inherent sensor thickness, which can be below 5 µm [11], even when the sensor-layer system contains a necessary additional protection layer.
All in all, these investigations extend the state of the art concerning thin-film sensors with regard to the influence of plastic deformation. Through sensor-data fusion and the solution of linear (nonlinear) systems of equations, a statement can be made about both the plastic deformation and temperature change (and elastic deformation) at the same time.

5. Conclusions

This article shows first-time results of degeneration effects concerning the influence of plastic deformation on the properties of thin-film constantan strain gauges and platinum temperature sensors. Due to changing sensor properties, such as initial resistance, k-factor and temperature coefficient of resistance (TCR), the knowledge of their behavior is mandatory to enable elastic strain measurements after plastic deformation, which can occur in machine components due to critical loads. For the initial resistance, an increase in the range of 1% was detected, depending on the alignment of the strain gauges. The resistivity of the Al2O3 insulation layer showed a constant value of 2.2∙1014 Ωcm up to a plastic deformation of at least 0.9%. This results in a mean insulation resistance of 1.9 TΩ which is sufficient for the application. For constantan, a nearly linear k-factor decrease of 17‰ (9‰ for platinum) and an increase in the temperature coefficient of resistance of 62‰ (30‰ for platinum) per 1‰ plastic deformation could be observed until a sensor failure above 0.5% plastic deformation (about 1.3% for platinum). Optical analysis revealed that micro cracks are the reason. This new fundamental knowledge offers the potential to operate the sensors outside of the elastic deformation conditions and to draw conclusions about plastic processes in the work piece. In fact, intelligent sensor-data fusion enables the clear interpretation of the measured resistance values so that the elastic deformation, the plastic deformation and the temperature change can be determined precisely at the same time. As shown in this article for only one direction of deformation and with the elastic deformation set to zero, a linear system of equations has to be solved.
Based on the results, the position of the sensors can be chosen with respect to the maximum expected plastic deformation based on simulations. Thereby, the conflict of goals can be addressed regarding a measurement signal and an as high as possible resolution on the one hand and a long sensor lifetime at the other hand. Additionally, further elastic strain measurements after a critical load in terms of plastic deformation are enabled.
In the future, the application of the developed sensors will take place on large-diameter bearings coated with a unique sputtering system [33]. Therefore, a resilient protection layer has to be used. Additionally, an algorithm for the solution of the nonlinear system of equations has to be implemented. Based on the measured strains and normal and tangential forces, the slippage and the temperature are to be measured.

Author Contributions

Conceptualization, R.O., F.D. and M.C.W.; methodology, R.O. and T.S.; software, R.O. and T.S.; validation, R.O. and T.S.; formal analysis, R.O. and T.S.; investigation, T.S.; data curation, T.S.; writing—original draft preparation, R.O.; writing—review and editing, R.O., F.D. and M.C.W.; visualization, T.S. and R.O.; supervision, F.D. and M.C.W.; project administration, F.D. and M.C.W.; funding acquisition, M.C.W., F.D. and R.O. All authors have read and agreed to the published version of the manuscript.

Funding

The authors thank the German Research Foundation (DFG) that funded this work within the research project “Integrated sensors for intelligent large-diameter bearings” (WU 558/41-1) as part of the Priority Program 2305 “Sensor-integrating machine elements”.

Institutional Review Board Statement

Not applicable.

Informed Consent Statement

Not applicable.

Data Availability Statement

The data presented in this study are available on request from the corresponding author.

Conflicts of Interest

The authors declare no conflict of interest.

References

  1. Sediako, D.; Stroh, J.; Kianfar, S. Residual Stress in Automotive Powertrains: Methods and Analyses. Mater. Sci. Forum 2021, 1016, 1291–1298. [Google Scholar] [CrossRef]
  2. Zhao, D.; Rasool, S.; Forde, M.; Weafer, B.; Archer, E.; McIlhagger, A.; McLaughlin, J. Development of an embedded thin-film strain-gauge-based SHM network into 3D-woven composite structure for wind turbine blades. In Proceedings of the SPIE Smart Structures and Materials + Nondestructive Evaluation and Health Monitoring, Portland, OR, USA, 25–29 March 2017; Volume 10171, pp. 1–9. [Google Scholar] [CrossRef]
  3. Tegtmeier, F.L. Strain gauge based microsensor for stress analysis in building structures. Measurement 2008, 41, 1144–1151. [Google Scholar] [CrossRef]
  4. Chen, X.F.; Wang, S.B.; Qiao, B.J.; Chen, Q. Basic research on machinery fault diagnostics: Past, present, and future trends. Front. Mech. Eng. 2018, 13, 264–291. [Google Scholar] [CrossRef]
  5. Gao, R.X.; Holm-Hansen, B.T.; Wang, C. Design of a mechatronic bearing through sensor integration. In Proceedings of the Photonics East, Sensors and Controls for Intelligent Machining, Agile Manufacturing and Mechatronics, Boston, MA, USA, 1–6 November 1998; Volume 3518, pp. 244–250. [Google Scholar] [CrossRef]
  6. Holm-Hansen, R.X. Vibration Analysis of a Sensor-Integrated Ball Bearing. J. Vib. Acoust. 2000, 122, 384–392. [Google Scholar] [CrossRef]
  7. Marble, S.; Tow, D. Bearing health monitoring and life extension in satellite momentum/reaction wheels. In Proceedings of the 2006 IEEE Aerospace Conference, Big Sky, MT, USA, 4–11 March 2006; pp. 1–7. [Google Scholar] [CrossRef]
  8. Frosini, L.; Harlisca, C.; Szabo, L. Induction Machine Bearing Fault Detection by Means of Statistical Processing of the Stray Flux Measurement. IEEE Trans. Ind. Electron. 2014, 62, 1846–1854. [Google Scholar] [CrossRef]
  9. Liu, Y.; Yan, X.; Zhang, C.-A.; Liu, W. An Ensemble Convolutional Neural Networks for Bearing Fault Diagnosis Using Multi-Sensor Data. Sensors 2019, 19, 5300. [Google Scholar] [CrossRef] [PubMed]
  10. Heikebrügge, S.; Ottermann, R.; Breidenstein, B.; Dencker, F.; Wurz, M.C. Residual stresses from incremental hole drilling using directly deposited thin film strain gauges. Exp. Mech. 2022, 62, 701–713. [Google Scholar] [CrossRef]
  11. Ottermann, R.; Klaas, D.; Dencker, F.; Hoheisel, D.; Rottengatter, P.; Kruspe, T.; Wurz, M.C. Direct Deposition of Thin-Film Strain Gauges with a New Coating System for Elevated Temperatures. In Proceedings of the IEEE Sensors, Rotterdam, The Netherlands, 25–28 October 2020; pp. 1–4. [Google Scholar] [CrossRef]
  12. Klaas, D.; Ottermann, R.; Dencker, F.; Wurz, M.C. Development, Characterisation and High-Temperature Suitability of Thin-Film Strain Gauges Directly Deposited with a New Sputter Coating System. Sensors 2020, 20, 3294. [Google Scholar] [CrossRef] [PubMed]
  13. Keil, S. Dehnungsmessstreifen, 2nd ed.; Springer Verlag GmbH: Wiesbaden, Germany, 2017; ISBN 9783658136123. [Google Scholar]
  14. Ottermann, R.; Klaas, D.; Dencker, F.; Hoheisel, D.; Jung, S.; Wienke, A.; Duesing, J.F.; Koch, J.; Wurz, M.C. Directly Deposited Thin-Film Strain Gauges on Curved Metallic Surfaces. In Proceedings of the IEEE Sensors, Sydney, Australia, 31 October–4 November 2021; pp. 1–4. [Google Scholar] [CrossRef]
  15. Biehl, S.; Luethje, H.; Bandorf, R.; Sick, J.-H. Multifunctional thin film sensors based on amorphous diamond-like carbon for use in tribological applications. Thin Solid Films 2006, 515, 1171–1175. [Google Scholar] [CrossRef]
  16. Emmrich, S.; Plogmeyer, M.; Bartel, D.; Herrmann, C. Development of a Thin-Film Sensor for In Situ Measurement of the Temperature Rise in Rolling Contacts with Fluid Film and Mixed Lubrication. Sensors 2021, 21, 6787. [Google Scholar] [CrossRef] [PubMed]
  17. ASTM International. ASTM E837-20: Standard Test Method for Determining Residual Stresses by the Hole-Drilling Strain-Gage Method; ASTM: West Conshohocken, PA, USA, 2020; Available online: https://www.astm.org/e0837-20.html (accessed on 20 August 2022).
  18. ICS: 77.040.10; Deutsches Institut für Normung e.V. Standard DIN 50125: Testing of Metallic Materials-Tensile Test Pieces. Beuth Verlag GmbH: Düsseldorf, Germany, 2004. [CrossRef]
  19. ICS 17.040.40; Deutsches Institut für Normung e.V. Standard Geometrical product specifications (GPS)-Filtration-Part 21: Linear profile filters: Gaussian filters (ISO 16610-21:2011). Beuth Verlag GmbH: Düsseldorf, Germany, 2013. [CrossRef]
  20. Bartzsch, H.; Gloeß, D.; Boecher, B.; Frach, P.; Goedicke, K. Properties of SiO2 and Al2O3 films for electrical insulation applications deposited by reactive pulse magnetron sputtering. Surf. Coat. Technol. 2003, 174–175, 774–778. [Google Scholar] [CrossRef]
  21. Voigt, M.; Sokolowski, M. Electrical properties of thin rf sputtered aluminum oxide films. Mater. Sci. Eng. B 2004, 109, 99–103. [Google Scholar] [CrossRef]
  22. Waechter, M. Tabellenbuch der Chemie, 1st ed.; Wiley-VCH: Weinheim, Germany, 2012; ISBN 978-3-527-32960-1. [Google Scholar]
  23. Schmid, U. The impact of thermal annealing and adhesion film thickness on the resistivity and the agglomeration behavior of titanium/platinum thin films. J. Appl. Phys. 2008, 103, 054902. [Google Scholar] [CrossRef]
  24. Fricke, S.; Friedberger, A.; Mueller, G.; Seidel, H.; Schmid, U. Strain gauge factor and TCR of sputter deposited Pt thin film up to 850 °C. In Proceedings of the IEEE Sensors, Lecce, Italy, 26–29 October 2008; pp. 1531–1535. [Google Scholar] [CrossRef]
  25. Gordillo, G.; Mesa, F.; Calderon, C. Electrical and Morphological Properties of Low Resistivity Mo thin Films Prepared by Magnetron Sputtering. Braz. J. Phys. 2006, 36, 982–985. [Google Scholar] [CrossRef]
  26. Barbalas, D.; Legros, A.; Rimal, G.; Oh, S.; Armitage, N.P. Disorder-enhanced effective masses and deviations from Matthiessen’s rule in PdCoO2 thin films. arXiv 2022, arXiv:2205.05006, 1–10. [Google Scholar] [CrossRef]
  27. Isabellenhuette. Isotan Cu55Ni44Mn1 Data Sheet. 2021, pp. 1–4. Available online: https://www.isabellenhuette.de/fileadmin/Daten/Praezisionslegierungen/Datenblaetter_Widerstand/ISOTAN.pdf (accessed on 19 August 2022).
  28. AZO Materials. Platinum (Pt)–Properties, Applications–Data Sheet. 2013, pp. 1–3. Available online: https://www.azom.com/article.aspx?ArticleID=9235 (accessed on 19 August 2022).
  29. Hottinger Baldwin Messtechnik GmbH. Strain gages–Datasheet–Order No. 1-XY71-3/350, Foil Lot A421/17, Production Batch 812088898. Available online: https://www.hbm.com/en/2122/strain-gauge-datasheets/ (accessed on 20 August 2022).
  30. Duemke, A.; Lampe, K.; Machon, W.; Milde, H.; Moussaoui, M.; Scheurmann, M.; Vehreschild, K.; Zantis, F.-P. Friedrich-Tabellenbuch Elektrotechnik/Elektronik, 10th ed.; Bildungsverlag EINS: Koeln, Germany, 2007; ISBN 978-3-427-53030-5. [Google Scholar]
  31. ICS: 17.200.20; Deutsches Institut für Normung e. V. Standard DIN EN 60751:2009-05: Industrial platinum resistance thermometers and platinum temperature sensors (IEC 60751:2008). Beuth Verlag GmbH: Düsseldorf, Germany, 2009. [CrossRef]
  32. Dembo, R.S.; Eisenstat, S.C.; Steihaug, T. Inexact Newton Methods. SIAM J. Numer. Anal. 1982, 19, 400–408. [Google Scholar] [CrossRef]
  33. Klaas, D.; Becker, J.; Wurz, M.C.; Schlosser, J.; Kunze, M. New coating system for direct-deposition of sensors on components of arbitrary size. In Proceedings of the IEEE Sensors, Orlando, FA, USA, 30 October–3 November 2016; pp. 1–3. [Google Scholar] [CrossRef]
Figure 1. Overview of the sensor layout on the stainless steel tensile specimen, consisting of three constantan strain gauges in three different alignments (Sg 90°, Sg 45°, Sg 0°) and one symmetric platinum temperature sensor (T sensor).
Machines 10 00870 g001
Figure 2. Overview of the sensor layout consisting of three constantan strain gauges in three different alignments (Sg 90°, Sg 45°, Sg 0°) and one symmetric platinum temperature sensor.
Machines 10 00870 g002
Figure 3. Influence of the plastic deformation on the insulation resistivity.
Machines 10 00870 g003
Figure 4. Influence of the plastic deformation on (a) the absolute initial resistance values and (b) the normalized resistance change. Sg 0° = Strain gauge aligned parallel to the elongation direction, Sg 45° = Strain gauge aligned in an angle of 45°, Sg 90° = Strain gauge aligned perpendicular to the elongation direction, T sensor = Temperature sensor.
Machines 10 00870 g004
Figure 5. Influence of the plastic deformation on (a) the k-factor and (b) the normalized k-factor change.
Machines 10 00870 g005
Figure 6. Resistance changes with temperature at different plastic deformation states.
Machines 10 00870 g006
Figure 7. Influence of the plastic deformation on (a) the TCR and (b) the normalized TCR change.
Machines 10 00870 g007
Figure 8. Optical images of (a) a constantan strain gauge (Sg 90°) after a plastic deformation of 0.9%, (b) a platinum temperature sensor after a plastic deformation of 0.9%, (c) a constantan strain gauge (Sg 90°) after a plastic deformation of 1.3%, and (d) a platinum temperature sensor after a plastic deformation of 1.3%. Cracks in the Al2O3 insulation layer perpendicular to the strain direction are visible in (a,c,d). I shows a location where a crack is not transferred into the platinum layer, II shows a complete crack in platinum layer and III shows the beginning of the formation of a crack in the platinum layer.
Machines 10 00870 g008
Figure 9. (a) Exemplary resistance plot for strain gauge Sg 0° in dependency of the temperature change and the plastic deformation according to Equation (8). Any elastic strain is set to zero. (b) Correlation of the temperature change with the plastic deformation for exemplary visualization with measured resistance values in a stress case with a temperature change of 20 °C and a plastic deformation of 0.5% (see Equation (9)).
Machines 10 00870 g009
Table 1. Resistivity values of the manufactured thin-film sensors and comparison with bulk and thin-film values from the literature.
MaterialT Sensor
[10−4 Ωcm]
Sg 0°
[10−4 Ωcm]
Sg 45°
[10−4 Ωcm]
Sg 90°
[10−4 Ωcm]
Average
[10−4 Ωcm]
Std. dev.
[10−4 Ωcm]
Bulk
[10−4 Ωcm]
Thin-Film
[10−4 Ωcm]
Constantan-1.341.361.331.340.0130.49 [22]1.10 [11]
Platinum0.30-----0.11 [22]0.18 [23]
Publisher’s Note: MDPI stays neutral with regard to jurisdictional claims in published maps and institutional affiliations.

