Article

Investigation of the Voltage-Induced Damage Progression on the Raceway Surfaces of Thrust Ball Bearings

by
André Harder
,
Anatoly Zaiat
*,
Florian Michael Becker-Dombrowsky
,
Steffen Puchtler
and
Eckhard Kirchner
Department of Mechanical Engineering, Institute for Product Development and Machine Elements, Technical University of Darmstadt, Otto-Berndt-Straße 2, 64287 Darmstadt, Germany
*
Author to whom correspondence should be addressed.
Machines 2022, 10(10), 832; https://doi.org/10.3390/machines10100832
Submission received: 31 August 2022 / Revised: 14 September 2022 / Accepted: 16 September 2022 / Published: 21 September 2022

Abstract

:
In the course of the electrification of powertrains, rolling element bearings are increasingly subject to electrical damage. In contrast to mechanically generated pittings, voltage-induced surface damage is a continuous process. Though several approaches for the description of the damage state of a bearing are known, a generally accepted quantification for the bearing damage has not been established yet. This paper investigates surface properties, which can be used as a metric damage scale for the quantification of the electric bearing damage progression. For this purpose, the requirements for suitable surface properties are defined. Afterwards, thrust ball bearings are installed on a test rig, with constantly loaded mechanically and periodically damaged electrically in multiple phases. After each phase, the bearings are disassembled, the bearing surfaces are graded and measured for 45 different standardized surface properties. These properties are evaluated with the defined requirements. For the ones meeting the requirements, critical levels are presented, which allow for a quantified distinction between grey frosting and corrugation surfaces. These values are compared with measurements presented in the literature showing that the identified surface properties are suitable for the quantification of electrical bearing damages.

1. Introduction

Harmful electric bearing currents like electric discharge machining currents (EDM-currents) or rotor ground currents have been known for several decades [1,2,3,4]. Modern e-drive systems integrate electric motors and transmissions in one housing [5,6]. This increases the likeliness for currents appearing not only in motor bearings, but also in transmission bearings, especially in the case of insufficient isolation between motor and transmission [7,8]. Electric rolling bearing damages are responsible for a large amount of failures in e-drive systems [9,10]. Due to the new mobility concepts focusing on electric vehicles bearing faults caused by electric damages, these become more important within the scope of research [11,12]. The focus of research is the mitigation of the damage occurrence, the modelling of the occurring voltages and the monitoring of the damages [1]. Although the voltage induced bearing damages are known for some time, there is still no model established for the calculation of the lifetime of bearings under electric load.
Typical scales to describe the harmfulness of bearing currents are the apparent bearing current density [10] and the virtual electric power [13]. The bearing current density is the electric current passing through the bearing divided by the heartzian contact area. Muetze defines threshold values below which no harmful electric surface damages occur ( J < 0.1   A / mm 2 ) [10]. Although White Etching Cracks (WEC) can occur at current densities of J 10 6   A / mm 2 [14], typical electric bearing damages like grey frosting and corrugation patterns occur at apparent current density levels above J > 0.1   A / mm 2 . Therefore, it is possible to apply unharmful electric signals on bearings for a sensory utilization [15,16]. The virtual electric power is the product of the peak value of the voltage and the current applied on a bearing. It indicates the electric power, which is induced in the bearing and can also be used to quantify the likeliness of electric bearing damages [17]. Both values have the same disadvantages:
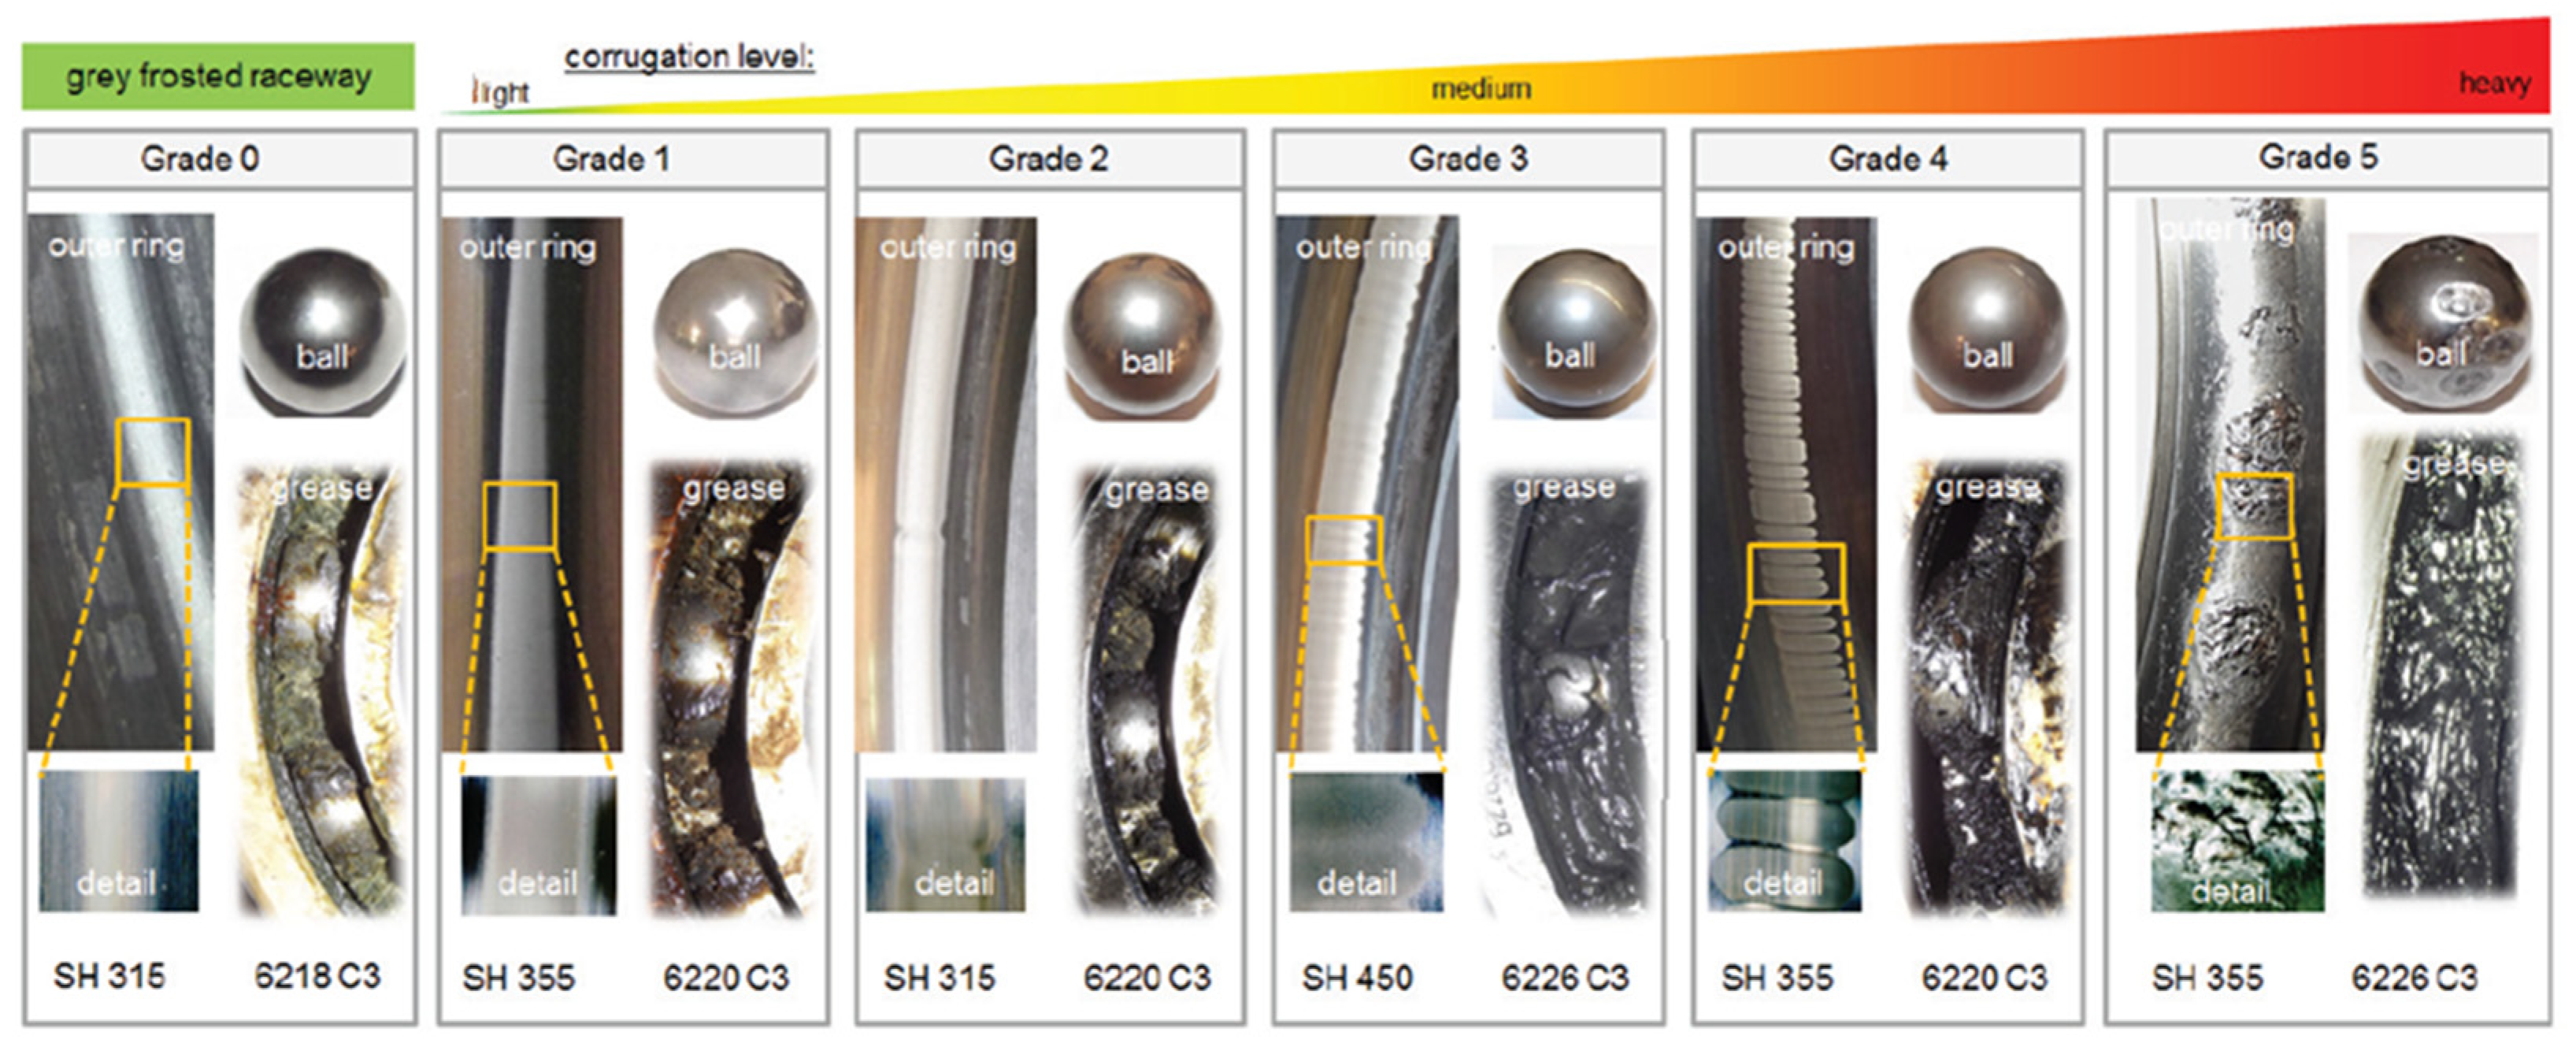
  • They describe if a corrugation progression is likely, but they do not provide information about the point in time when a damage occurs or the rapidity of its progression.
  • They do not quantify the bearing damage.
  • The bearing current is a quantity difficult to measure in real e-motor applications. Therefore, these two values of damage progression and damage value respective to the bearing current are difficult to obtain.
An approach to overcome these disadvantages is to monitor the bearing surface, which in turn lead to increasing bearing vibrations in case of surface damages. The state of the surface can be related to vibration measurement data allowing for a condition monitoring of the bearing [17]. Tischmacher [17] presented a scale to quantify bearing surface damages (cf. Figure 1). It differentiates between six different surface states, starting with zero as first grade for grey frosting damaged surfaces. Severe surface damages, including fatigue damages, are assigned to grade six. The advantage of this bearing surface evaluation is the availability of a scale which allows for a comparison of different bearing damages based on the degree of damage. Thus, the bearing surface is considered suitable to describe the electric bearing damage and works as a starting point for the development of a bearing lifetime calculation. Unfortunately, the scale presented by Tischmacher has several disadvantages:
  • The scale is ordinal, meaning it cannot be assumed that the differences between two different grades are equal. This leads to several obstacles like the inability to apply basic calculus operators like plus or minus, which makes calculations based on this scale impossible.
  • There is no objective quantification of the different scale grades. The grade of a specific bearing surface depends on the person evaluating it.
While the scale seems to be suitable for a qualitative and comparative description of the electric bearing damages, these disadvantages make this scale unsuitable for a quantitative description of the bearing damage. Several authors use different approaches to quantify the surface properties of electrically damaged bearing surfaces [18,19,20,21,22,23]. The shown results are measurements of standardized one- or two-dimensional surface properties, described by DIN ISO 4287 or ISO 25178-2 [24,25]. This surface properties are by design metrical scales suitable for quantitative descriptions of surfaces and independent of the evaluating person. Since each of the aforementioned publication uses different surface properties, the question is which surface property describes the electrical bearing damages sufficiently and is therefore suitable for the description of the electrical bearing damage.
To investigate this question, this paper uses the following approach: A test series on electrically damaged bearings under test rig condition is performed. The experiments are carried out on thrust ball bearings at different operation conditions (c.f. Section 2). After specific operation times, the subjective condition of the bearings is evaluated in a study and the surface properties are measured. Based on these data, the following requirements are defined, and a suitable surface property has to comply with the following:
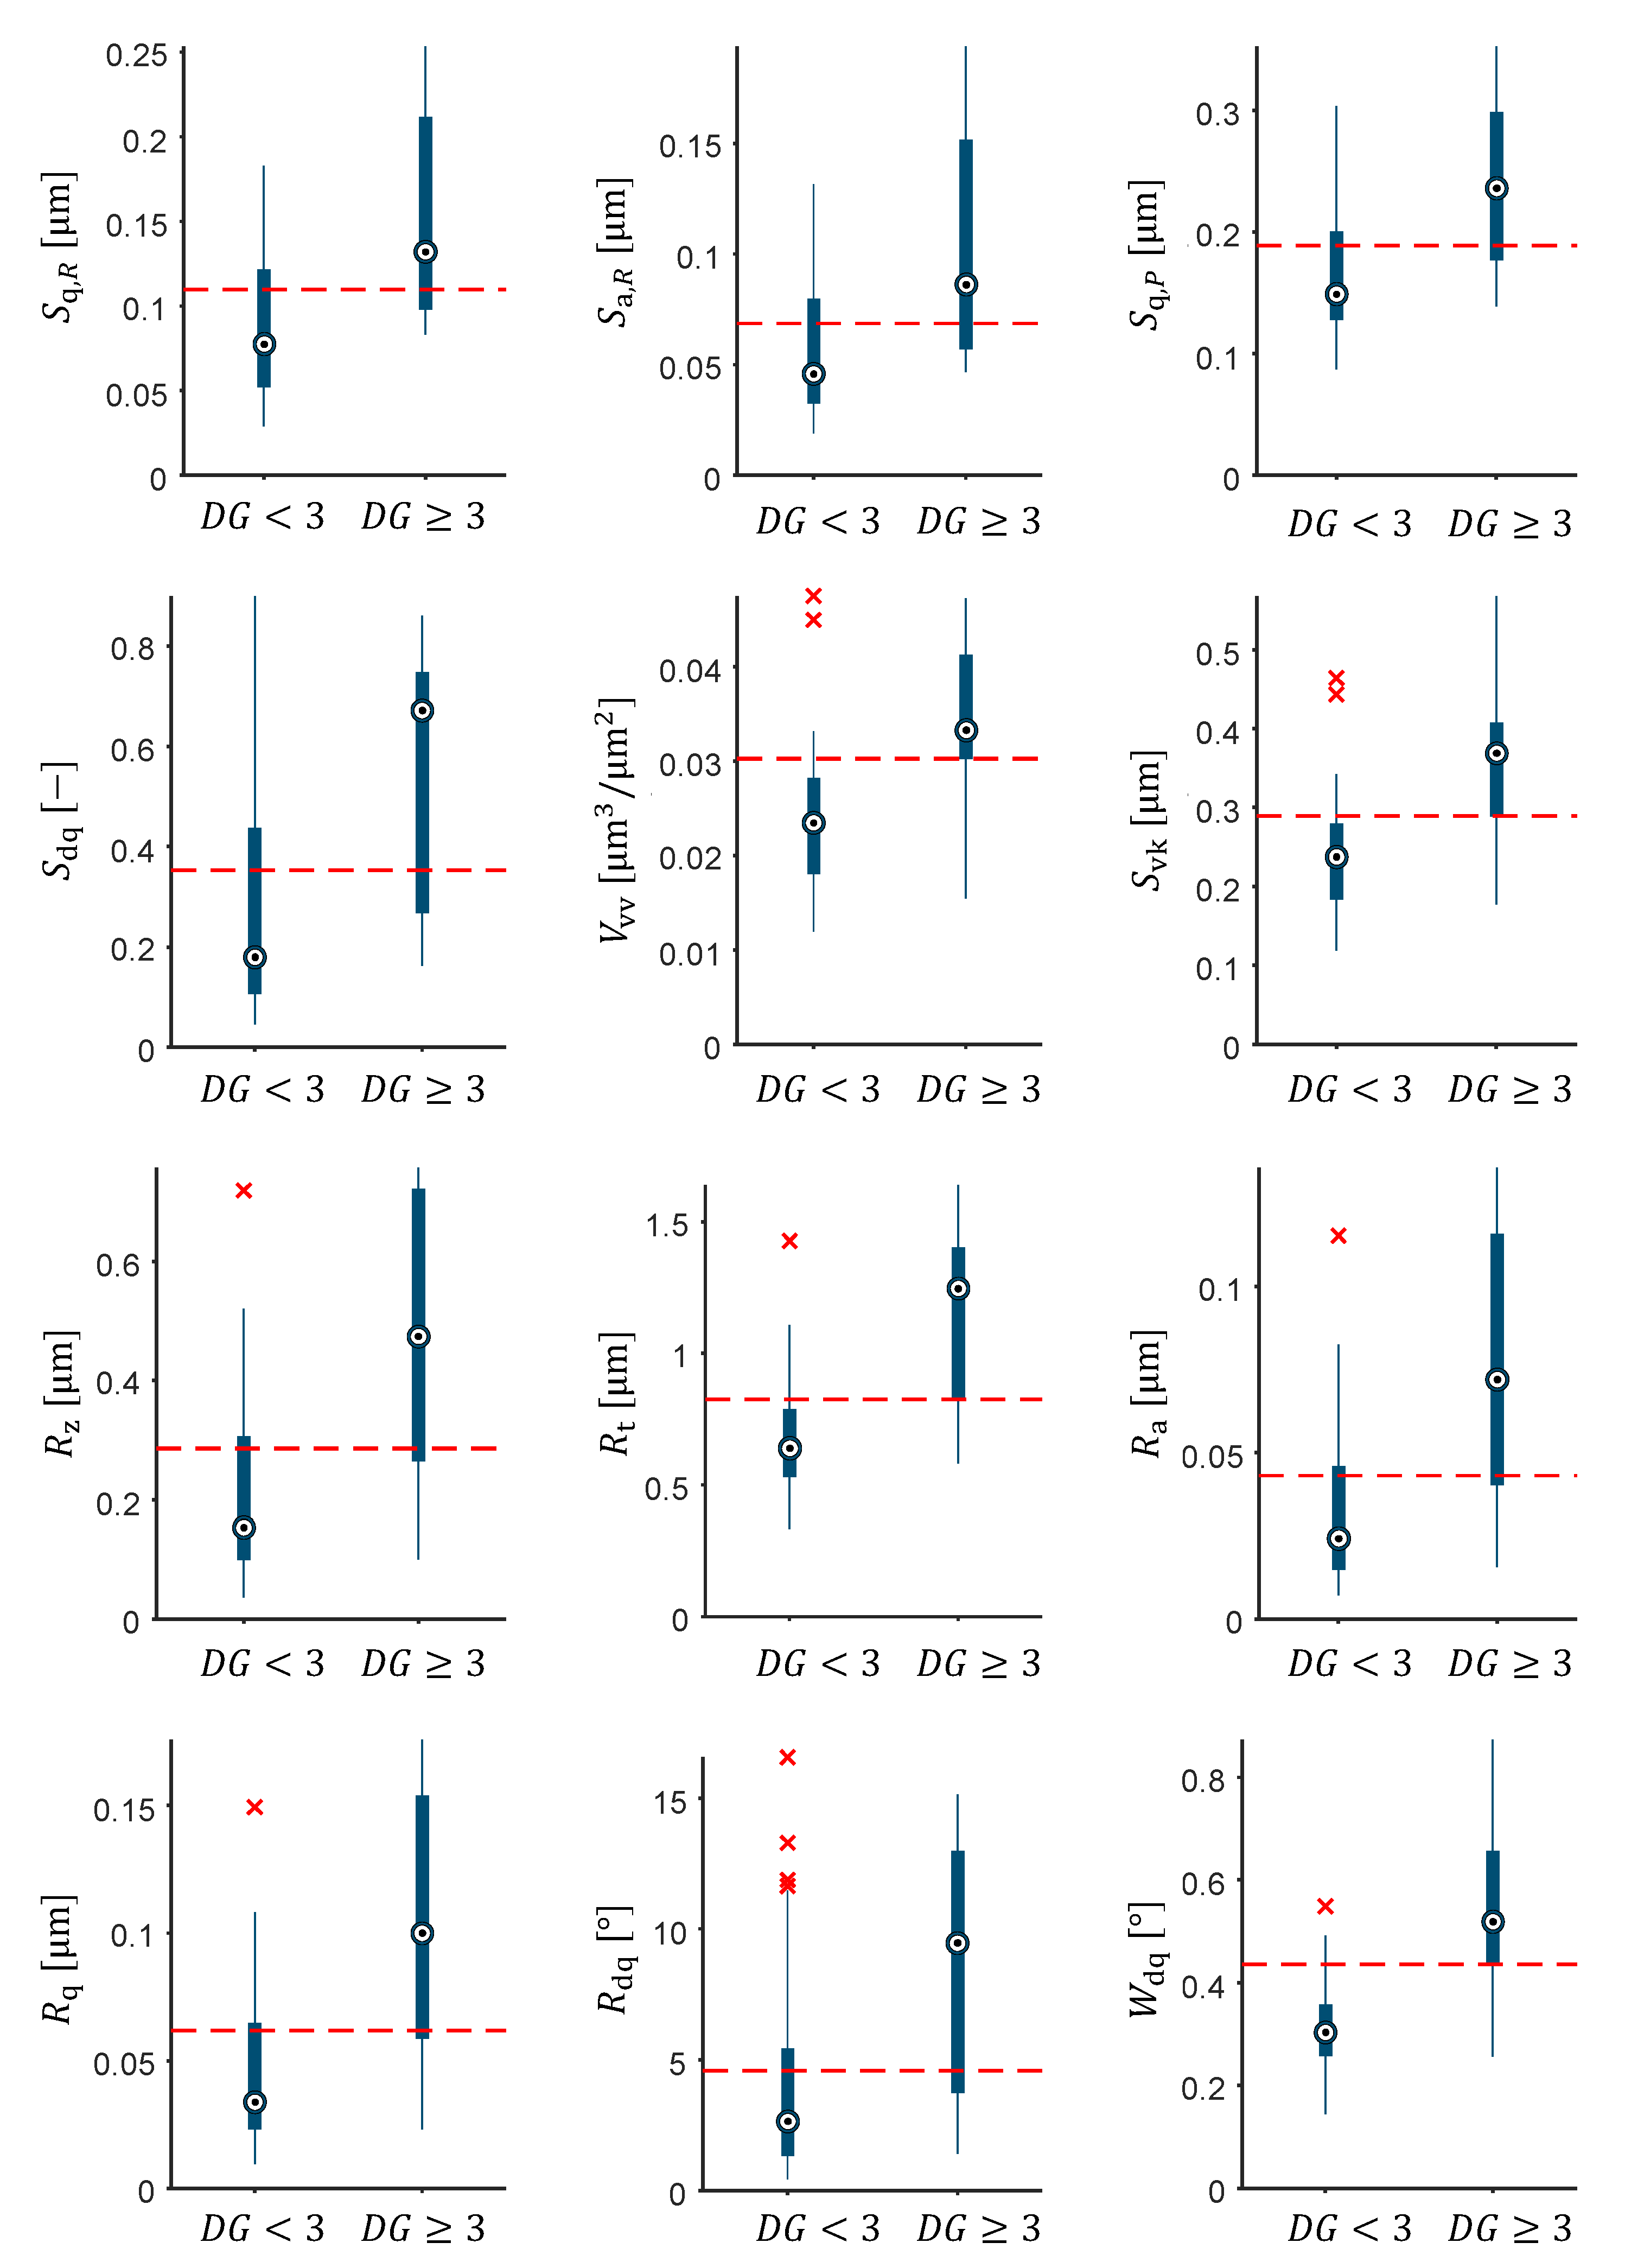
  • Requirement 1: At least a moderate correlation of | R | 0.3 of the Spearman Rank correlation coefficient has to exist between a suitable surface property and the subjective evaluation.
  • Requirement 2: A suitable surface property should allow for the distinction between corrugations and crater surfaces. Hence, the probability that the corrugation and grey frosting surfaces are equally distributed should be p < 0.05 in a Wilcoxon rank-sum test [26].
  • Requirement 3: The variation of the suitable surface property should be lower than the variation of the subjective surface evaluation.
  • Requirement 4: The variation of the suitable surface property should be independent from the value of the surface property. The surface property and its variation should have a Spearman rank correlation coefficient of | R | < 0.8 .
The first two requirements thereby evaluate the quality a surface property describing the investigated effect. The last two requirements define the necessary reliability of the measured data.
In the following, the experimental setup is described first in Section 2. Then, the study to visually evaluate the degree of damage on the basis of Tischmachers grading [17], which is introduced in Section 3. Afterwards, the deduced surface properties that meet the defined requirements are presented in the same chapter. For these suitable surface properties, the threshold values are defined at the end of Section 3, allowing for a distinction between grey frosting and corrugation patterns. These values are discussed in Section 4 based on the literature data. The most relevant findings are summed up, and a conclusion and an outlook on future work are given in Section 5.

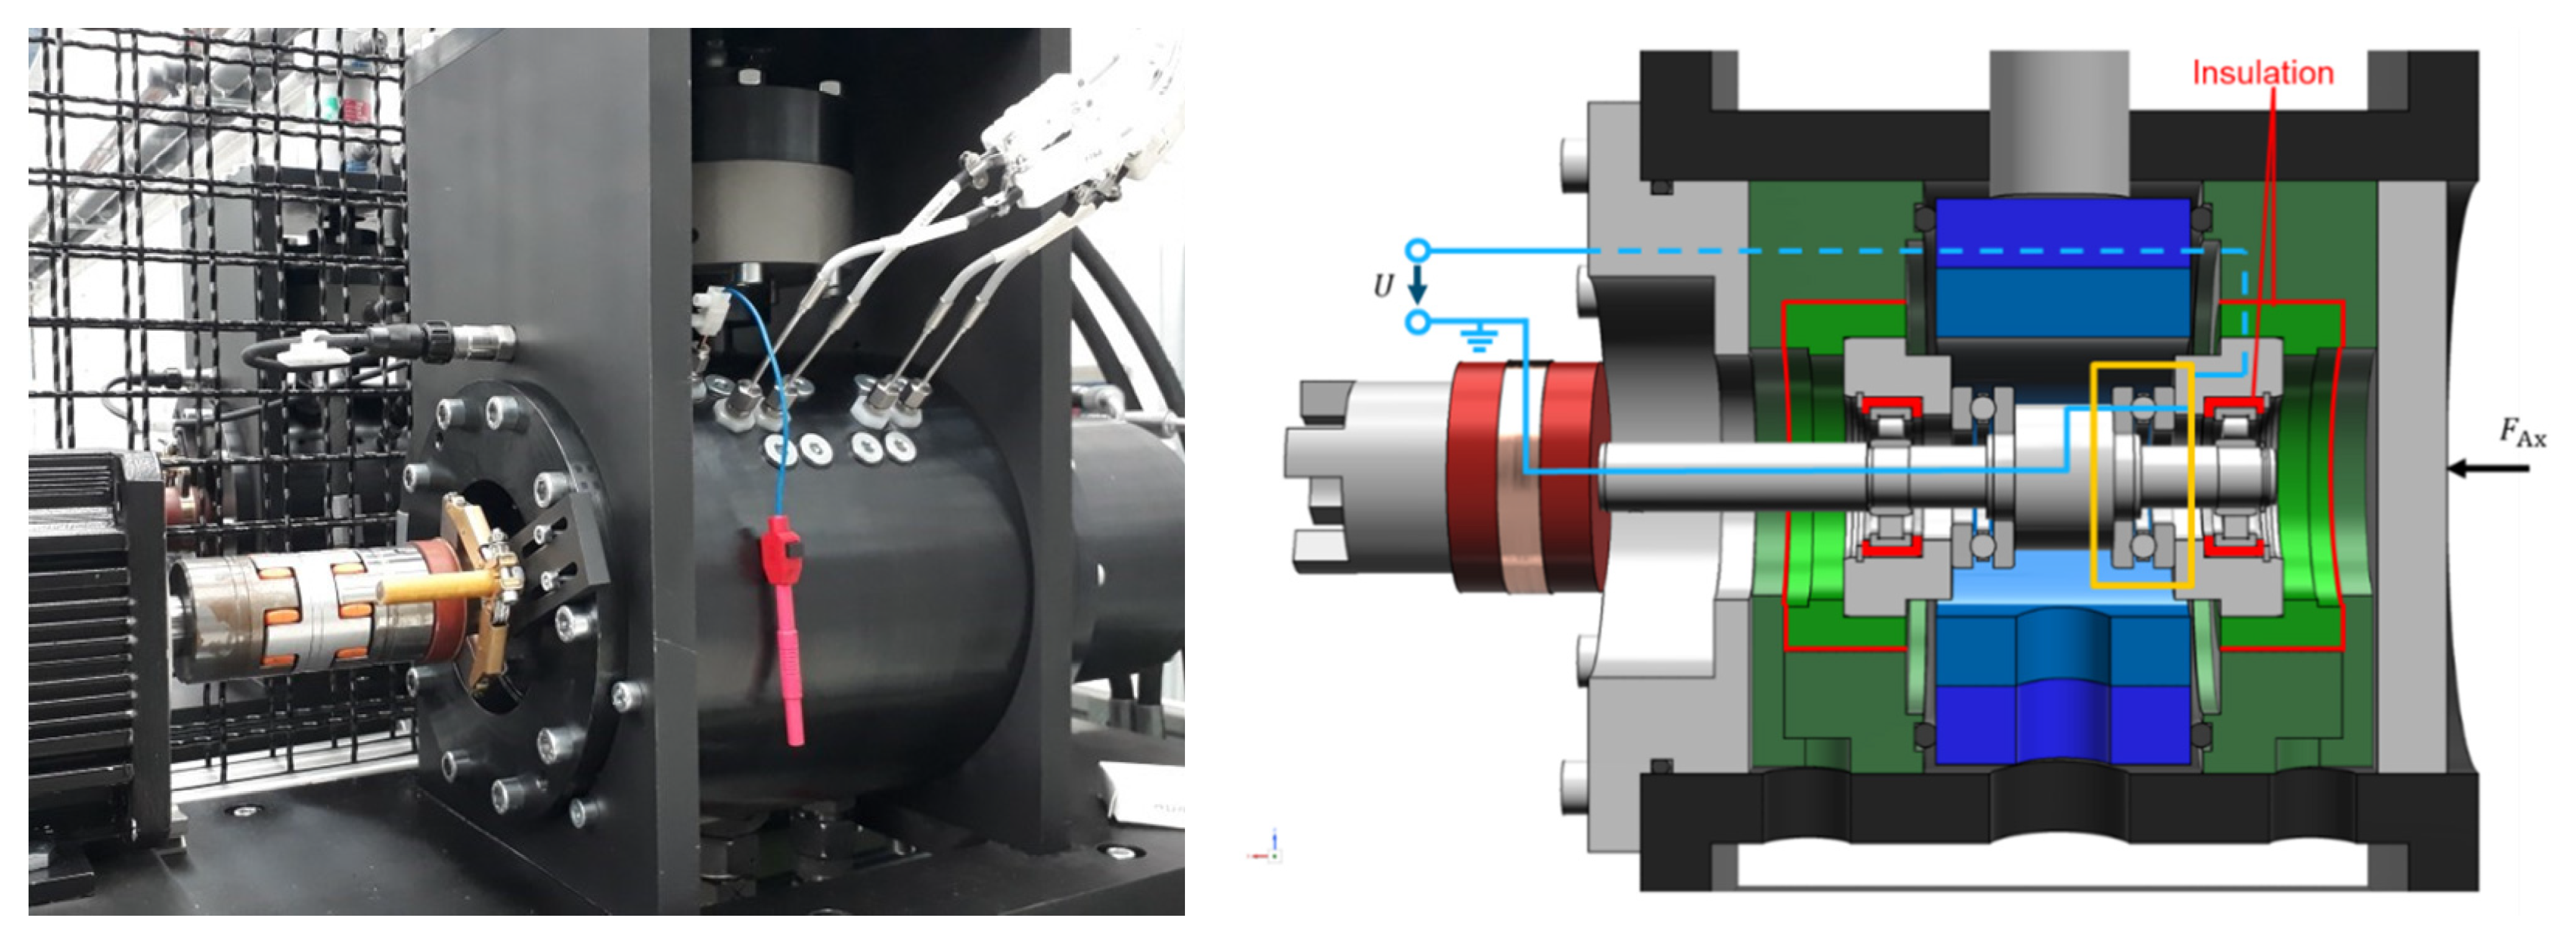
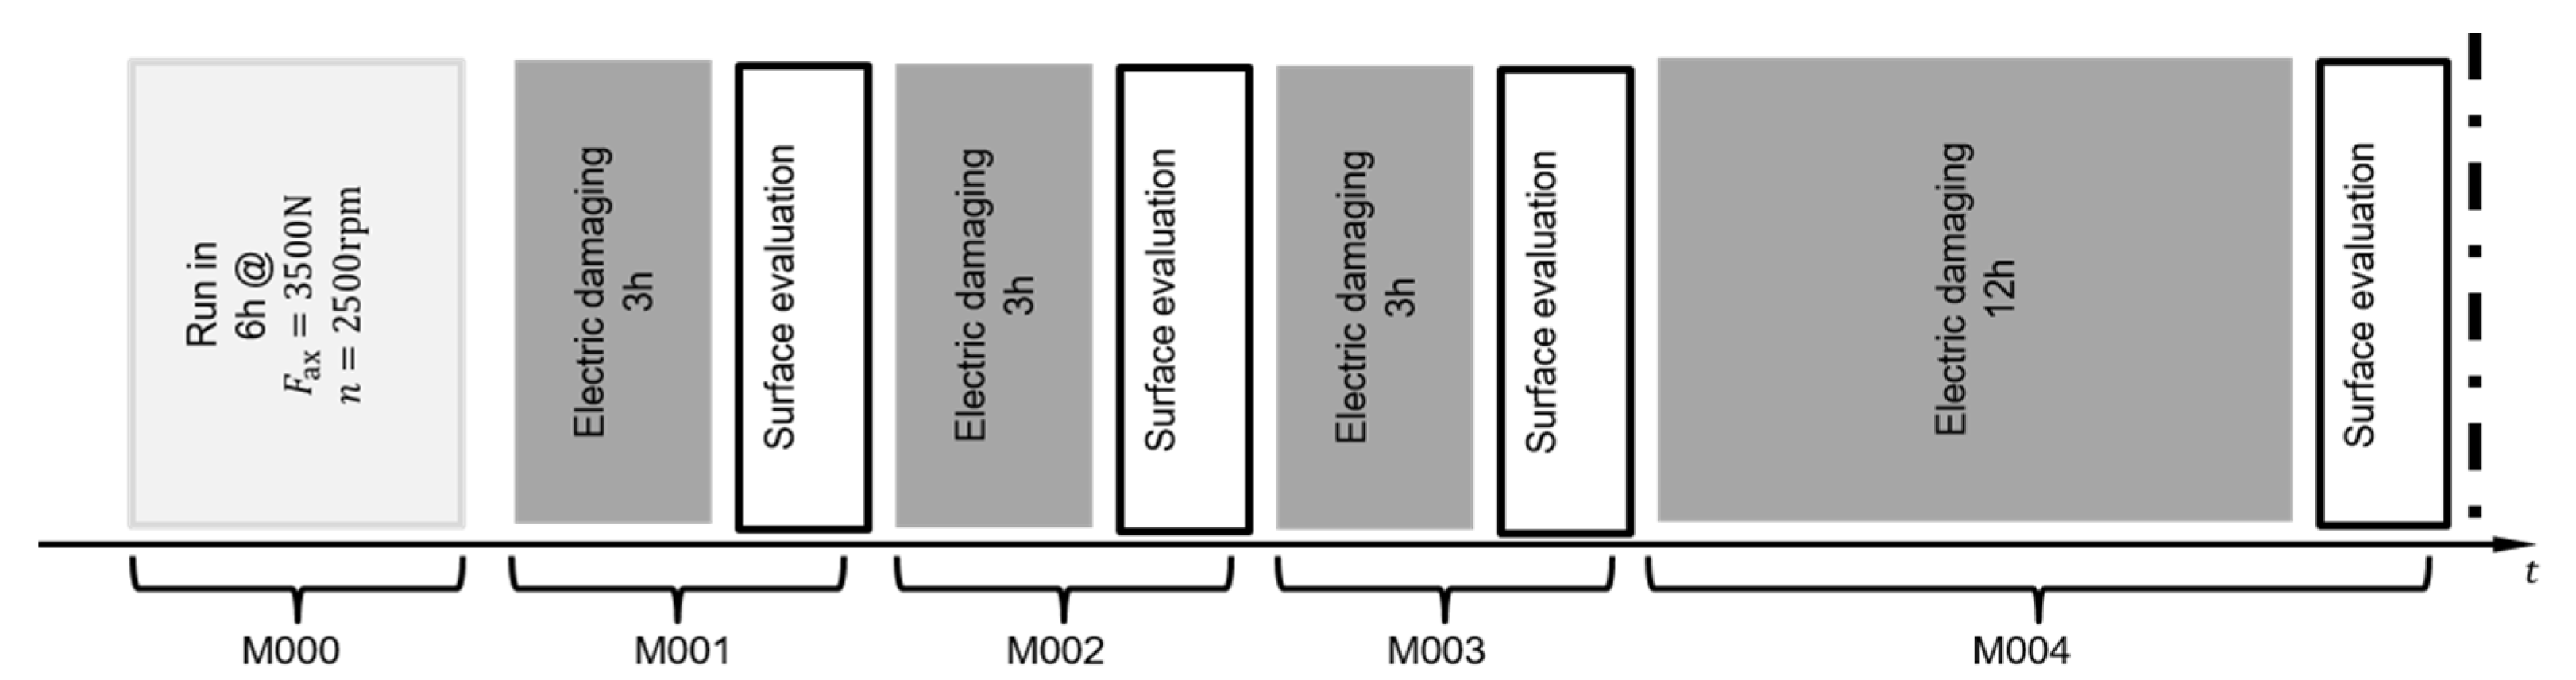
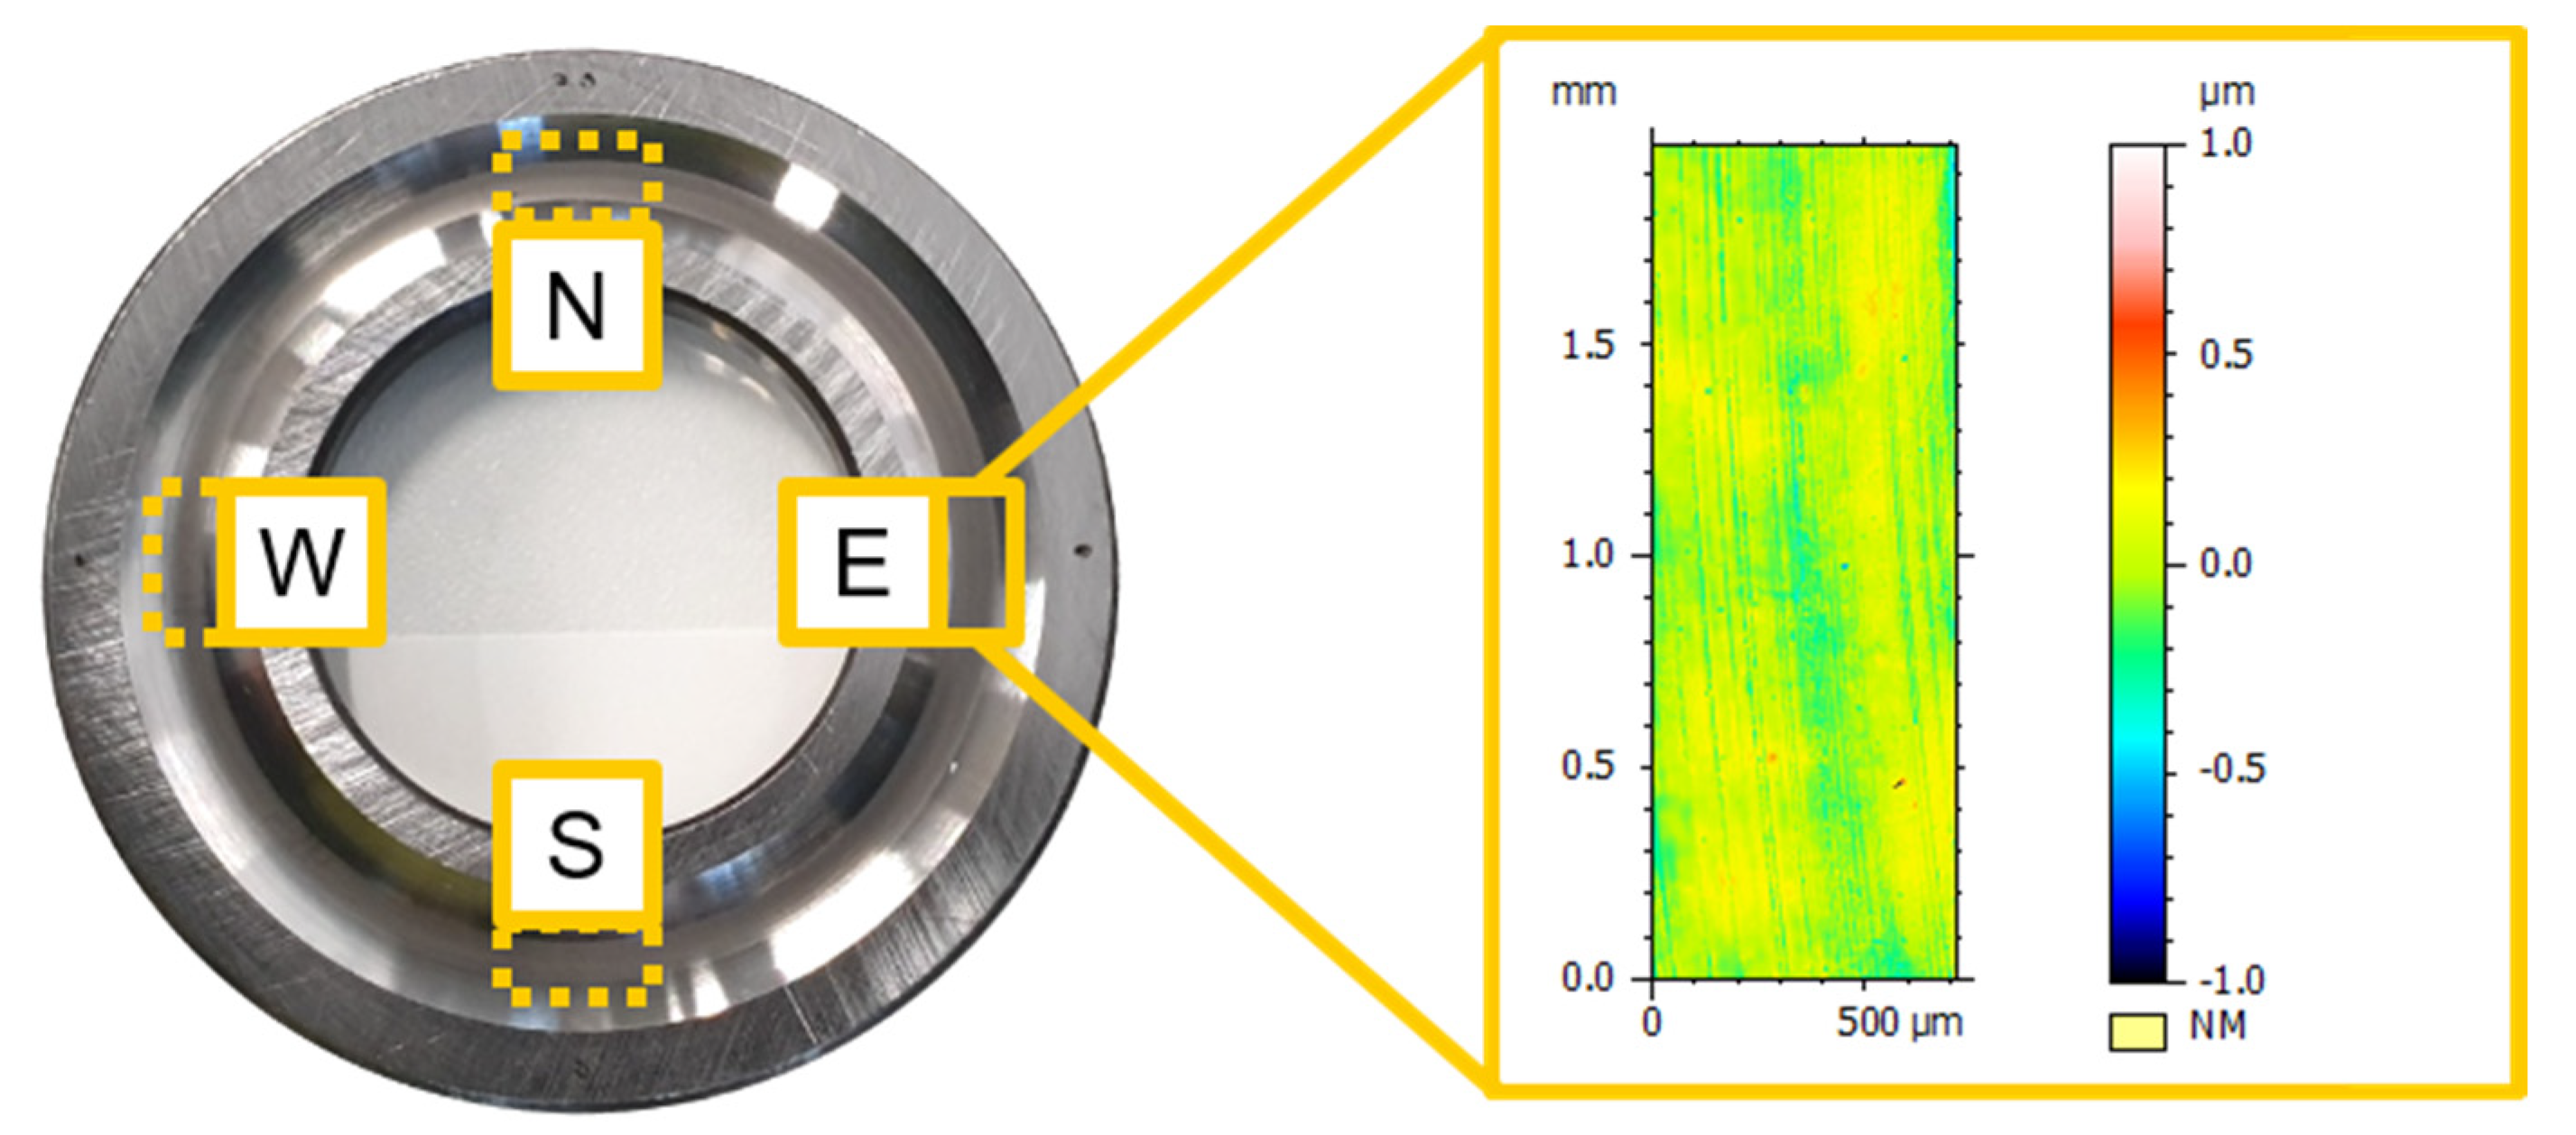
2. Materials and Methods
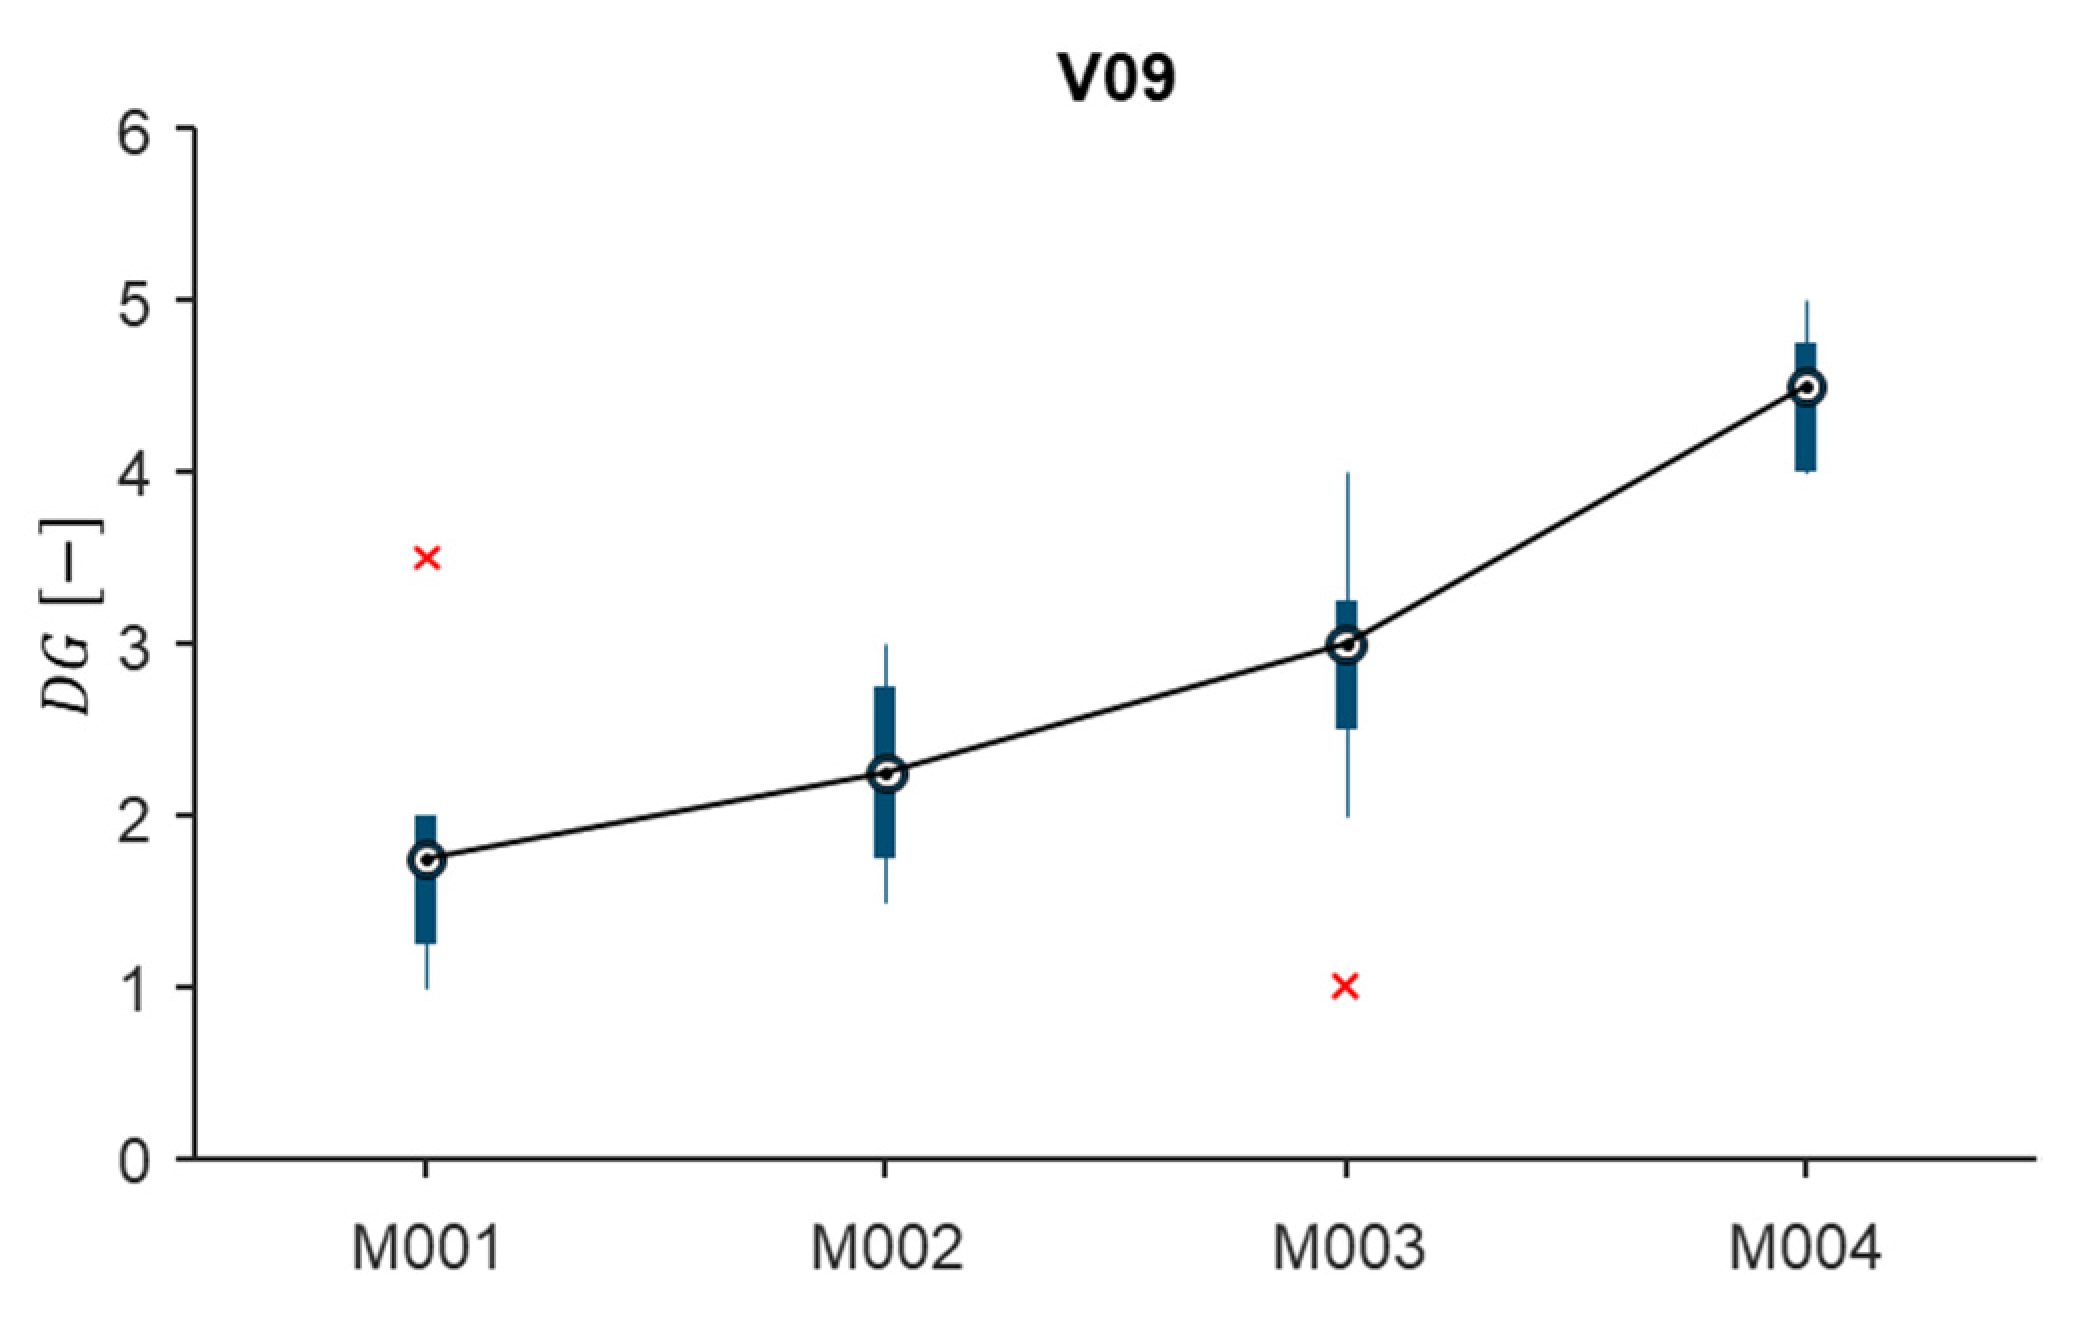
The experiments are conducted on the bearing test rig of the Institute for Product Development and Machine Elements (pmd) of the Technical University of Darmstadt [27]. The rest rig provides four testing cells, which can be operated separately (cf. Figure 2, left). In prior research, it was used for the investigation of the electric impedance of radial rolling element bearings [27]. One of the testing cells is modified for the experimental investigations of thrust ball bearings, like shown in Figure 2 on the right. Though thrust ball bearings are rarely used in electric drives, for investigations of the electric damage progression, this bearing type is used because of the possibility to investigate the bearing surface without destroying the bearing [19,20].
The setup consists of two thrust ball bearings supported by two roller bearings. The right thrust ball bearing (highlighted by the yellow box) is the investigated bearing, and the other ones are supporting. These are electrically isolated (red line) to ensure a definite current path. The shaft is connected to ground using a slip ring. A signal generator and an amplifier provide the voltage between housing and collector ring. A horizontal cylinder applies an axial force F Ax onto the bearing. The shaft in turn is connected to an external electric motor with a claw coupling. Internal force, sensors, acceleration and temperature sensors monitor the test cell. The test cell allows for a disassembly of the bearings without harming the contact surfaces of the bearings. Prior to the here-presented experiments, a test run was carried out, showing no significant changes on the bearing surfaces due to the assembly and disassembly of the test cell.
The experiment is designed as fractional factorial with five factors at two levels, resulting in a total of 16 tests. It includes five factors with two patterns. The factor combinations of axial load F Ax , revolution speed n, voltage amplitude U ^ , frequency f and the signal form are investigated, as seen in Table 1. The lubricant, oil temperature, bearing type and bearing size are constant during the investigation and listed in Table 2. In contrast to the grease-lubricated thrust ball bearings used in the industry, the tests in this paper are carried out with oil. The oil circuit is operated with a volume of 5 L per minute and 20 L in total. The oil is filtered before entering the test cell. The large amount of lubricant in comparison to grease-lubricated bearings as well as its constant circulation and filtration reduce the effect of lubricant deterioration on the bearing surfaces.
The experiment investigates the connection between the surface properties, vibration data of the test rig and the electric impedance of the damaged bearing, although this work focuses primarily on the bearing surfaces. The evaluation of the vibration and impedance data will be presented in later work. Figure 3 summarizes the experimental design.
Each test sequence is grouped in five different phases, as shown in Figure 4. The first phase is a run-in of the bearings for six hours under an axial load F Ax = 3500   N and a rotation speed n = 2500 rpm. The aim is to reduce surface peaks and obtain comparable starting conditions for the damaging phase. It is followed by three electric damaging phases of three hours each with disassembly and a surface evaluation at the end of each phase. The fifth and last phase is an electric damaging period of 12 hours. The operating conditions at each of the damaging phases are constant and given for all tests in Table A1.
For measurements of the runway surfaces, the white light interferometer Smart WLI from GBS is used. It enables a three-dimensional gauging of the surfaces to detect micro geometries and surface roughness. Using the Smart WLI, each bearing ring is measured at four marked positions on each bearing ring to ensure the comparability of the measurements after each damaging period. These areas are designated as “N”, “E”, S” and “W”. The area “N” is marked by two engraved dots, the other areas by one dot (c.f. Figure 5). Each scanned area has the size of about 2 mm × 0.7 mm.
The measurement principle is based on the objectives, which cause interference patterns during scanning of the surfaces. The patterns are detected by optical sensors and transformed into electrical signals. From these signals, topographical data are derived, and the raceway geometry and possible outliers are removed, leaving the raceway surface. An exemplary scan of the raceway surface in the course of voltage-induced damage can be taken from Figure 6. After the first damage period, it is observable that there are some remains of the honing process visible on the bearing surface. After the damage periods M002 and M003, these patterns reduce and a crater pattern is observable. After M004, there is a clear corrugation pattern observable. The black line at M003 resembles a contamination during the scanning process. Such contaminations were excluded from evaluation.
The surface properties extracted from the scans are listed in Table 3. The Variable X is used for properties, which are evaluated in different dimensions and filtered at different wavelengths, leaving different surfaces, such as the roughness or the waviness. For example, the maximum profile height is evaluated for the 2D surface at different extracted wavelengths. Therefore, the maximum profile height is calculated for the primary profile as well as for the roughness and waviness profile. The same procedure is applied at 1D surface properties. In total this leads to 45 different surface properties.
In addition to the surface property measurement the bearing damage scale presented by Tischmacher is used for the evaluation of the bearing damage in a study. For this purpose, digital photographs of the individual raceways are created in the course of increasing surface damage, as already shown in Figure 4. These are shown to eight persons, all research assistants at pmd who have a Master’s degree in mechatronic or mechanical engineering. Prior to conducting the assessment, all participating individuals were introduced to the damage scale. For the purpose of the study, the scale was extended to take unharmed bearing surfaces into account. Unharmed surfaces are therefore the new damage grade 0, and all other grades are increased by +1. Additionally, the participants were allowed to evaluate the surfaces with intermediate steps (e.g., 2.5) if a surface seems to be between to damage grades. To ensure an unbiased surface evaluation, the raceway images were evaluated by the participants in a random order.
The damage scale used in this study, like the evaluation scale according to Tischmacher, is an ordinal scale. Therefore, a mean value or standard deviation may not be calculated for the surveyed study results. Thus, the median of the degree of damage D G and the first quartile D G 0.25 , the third quartile D G 0.75 and the interquartile range Q D G were evaluated. In addition, the number N eval is indicated, describing the order of evaluation. An adjustment of the results, e.g., by removing outliers, was omitted.

3. Results

In the following section, the results of the damage assessment study are presented. Based on these results, the surface properties are evaluated and compared to the defined requirements for a suitable surface property. Due to the large amount of measured data obtained during the study, this paper focuses on the evaluated data leading to suitable surface properties. The complete set of data, including all study results of the surface evaluation, the surface scans and the evaluated surface properties and the monitoring data of the test rig are published in [28].

3.1. Degree of Damage Assessment Study

An investigation on the influence of the rating order shows that there is only a small rank correlation between the order and the damage grade ( R D G N = 0.2 ), and there is no rank correlation between the rating order and the interquartile range ( R Q N = 0.016 ). Furthermore, the rank correlation between the damage grade and interquartile range is also neglectable ( R D G Q = 0.008 ). This means that neither the rating order nor the interquartile range influence the results of the study—and therefore, the variation of the degree of damage depends on the degree of damage itself.
Figure 7 shows the course of the assessed degree of damage after each damage period of test V09 as a boxplot. The medians D G are encircled and connected by a line to describe the time course of the assessed damage. The interquartile range Q D G is shown as a rectangle, and readings outside the interquartile range are shown as a thin vertical line. Outliers with a deviation of more than 1.5   Q D G below the first quartile or above the third quartile are marked with a cross. Test V09 shows a clear tendency of an increasing damage grade D G with an increasing time of electrical damaging. In the other tests, which are shown in Figure A1, it is though observable that the increase of the damage grade over different tests is mostly insignificant, and in some cases, there is even a decrease observable. Furthermore, the median of the interquartile range is at Q ˜ D G = 1 , meaning that evaluated damage grade varies around one grade of the damage scale. Due to this variation, a precise description of the damage state is unlikely. It is possible though to use this scale to distinguish between corrugation damages and crater surfaces. All tests with observable corrugation patterns were evaluated with a damage grade of D G = 3 or higher.
As the results show, the damage grade assessment study is able to identify corrugation damages and to differentiate them from grey frosting. Thus, it is suitable for a qualitative evaluation of rolling bearing damages. Because the high median of the interquartile range is at Q ˜ D G = 1 , the use of this scale for a comparative damage description is limited. Reasons for the variability can be the study design and the design of the scale itself. Another aspect is that single deep craters in the surface are not considered in the scale, which lead to a high variability in the assessment.

3.2. Testing Surface Property Requirements

Based on the results of the surface assessment study the measured surface properties are compared with the requirements for properties suitable for the quantification of electric bearing damages.

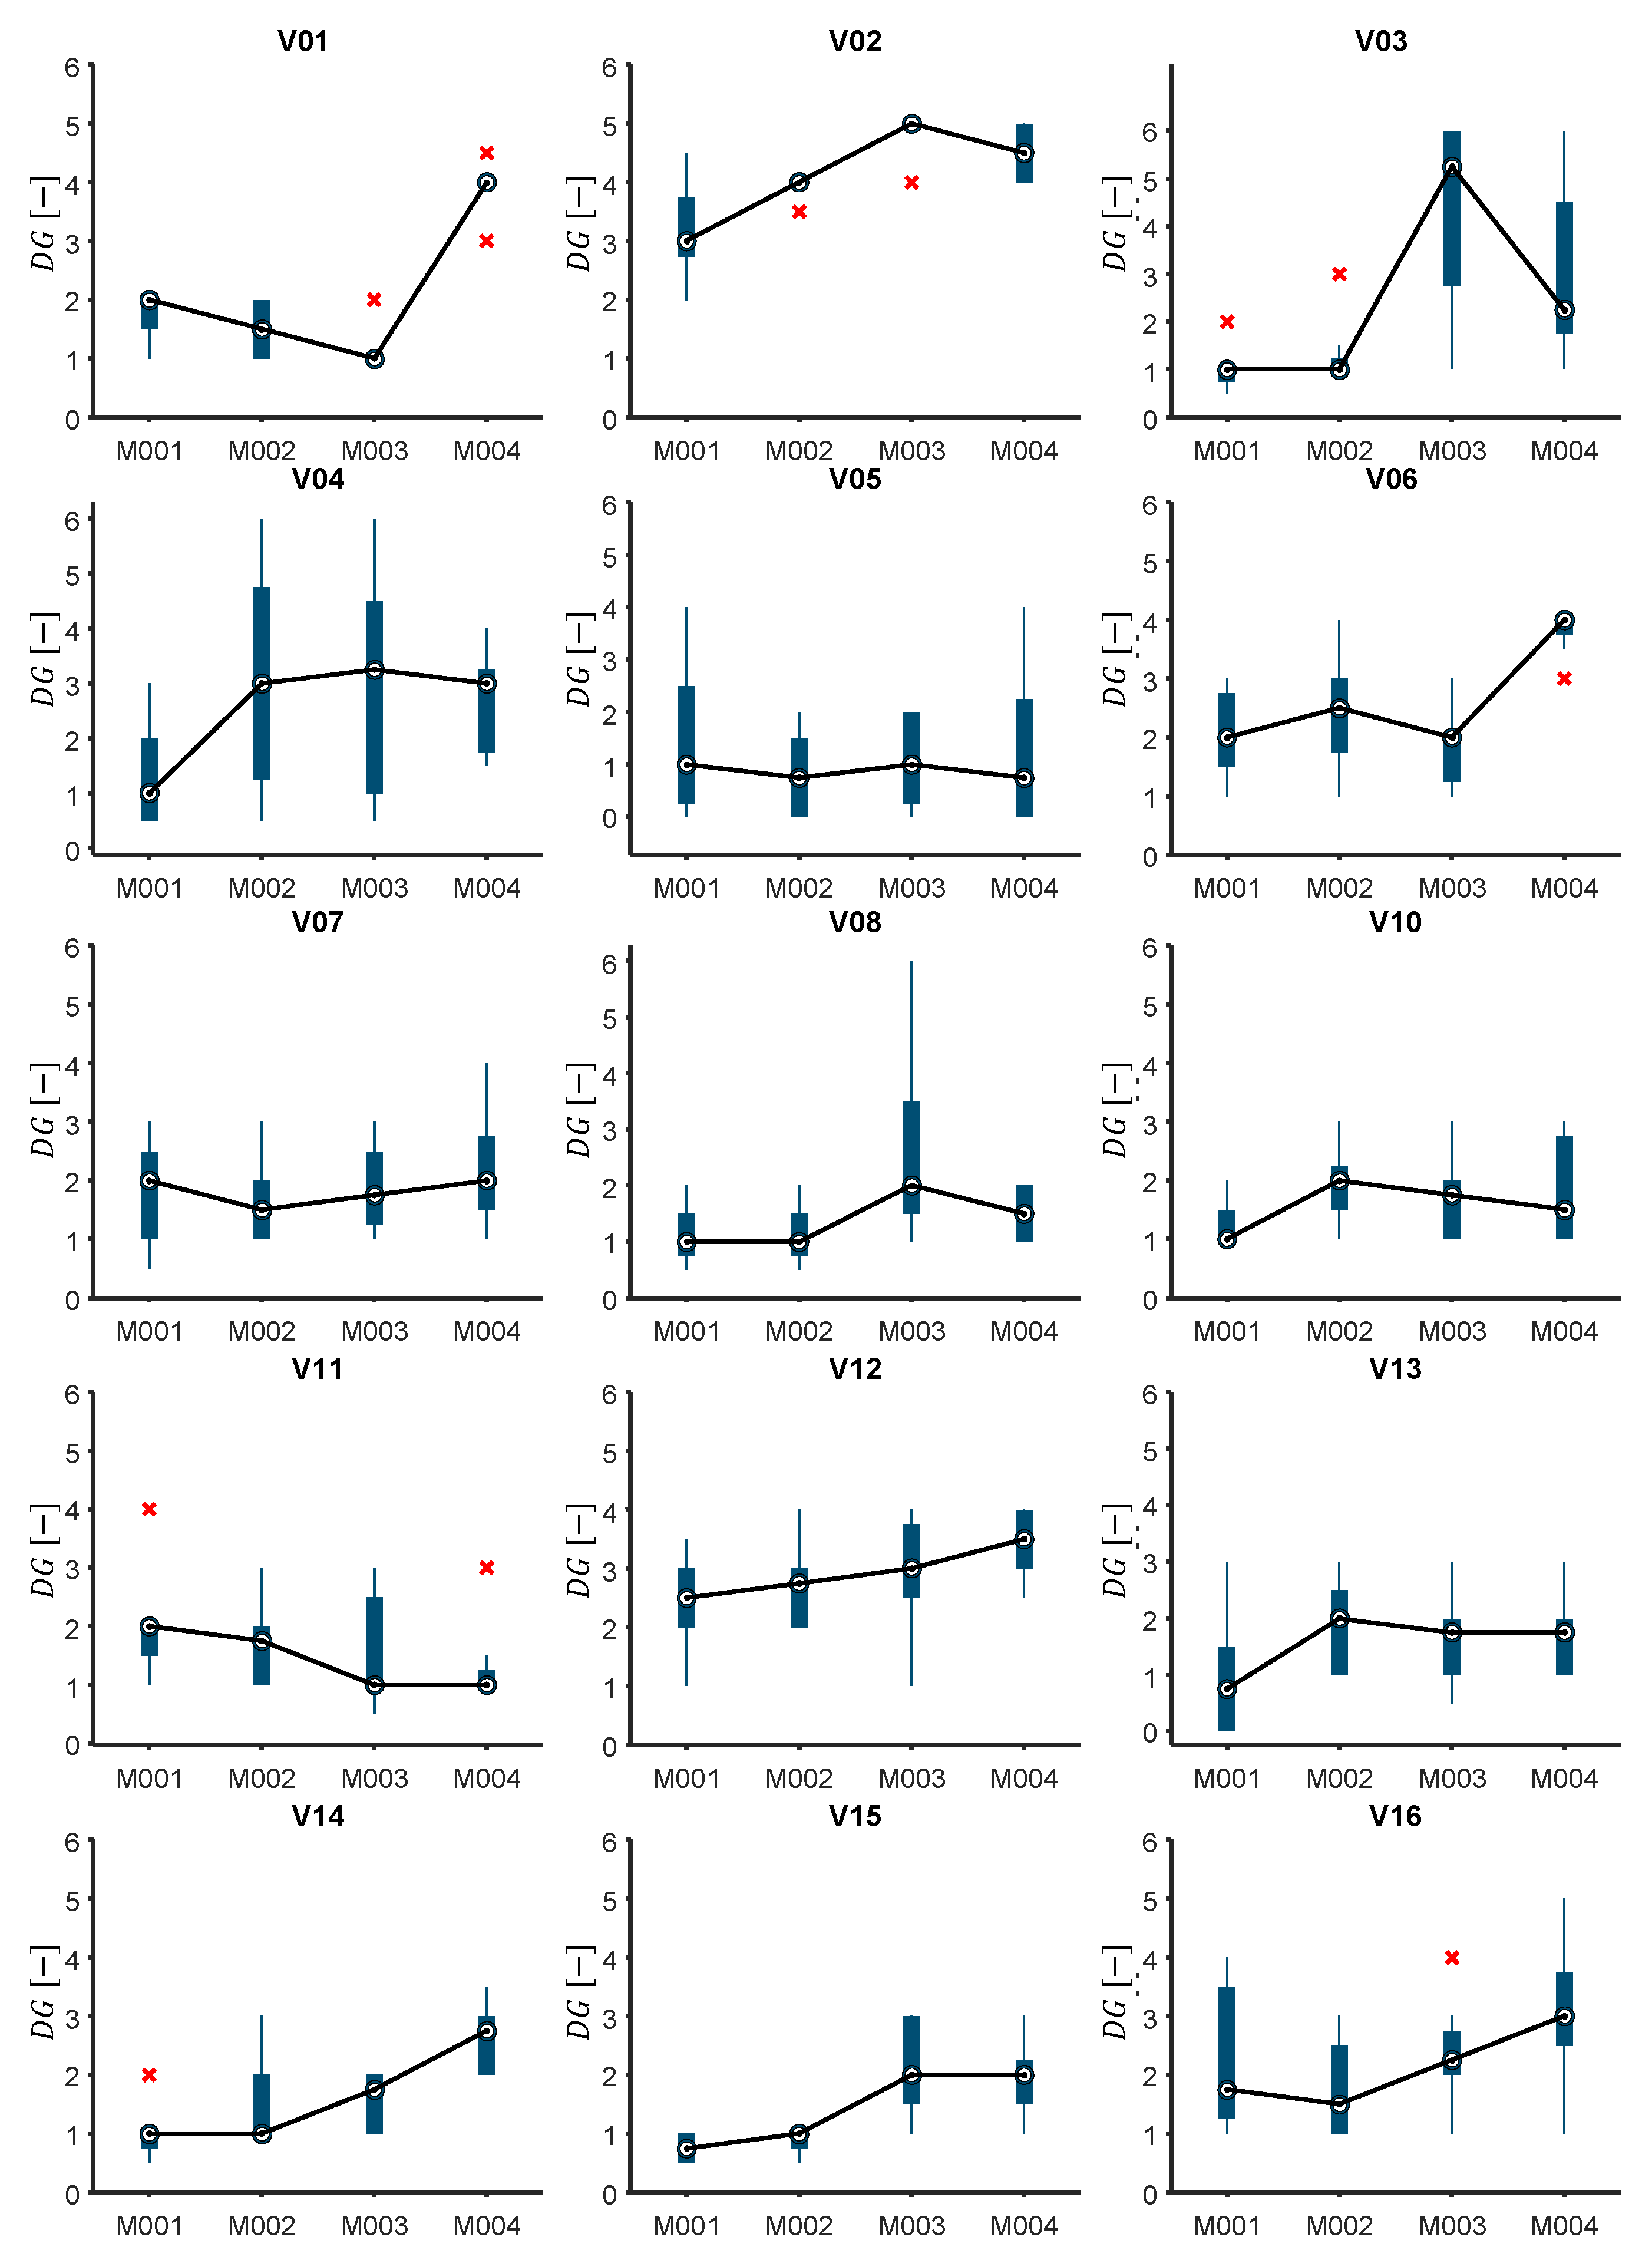
3.2.1. Correlation with the Damage Grade

First, the correlation between each surface property and the assessed damage grade is examined. The condition of each raceway after each damage period is comparatively described by the D G . If a surface property is related to the electrical bearing damage, it should correlate with the damage grade evaluated. The rank correlation between all damage grade evaluations after each damage period with the corresponding surface properties is calculated. Figure 8 shows the rank correlation coefficients between the damage grade of the surface and all investigated surface properties as a bar chart. In addition, the bounds for the significant correlation | R | 0.3 are plotted. A higher requirement for the correlation is not defined, because it would overestimate the results of the damage grade evaluation. It is observable that 19 of 45 surface properties investigated correlate with the damage-assessed damage grade.

3.2.2. Identification of Corrugation

In this section, it is examined whether bearings with pronounced corrugation can be distinguished with the aid of the measured surface properties. For this purpose, the data of the raceways examined are divided into two groups. Bearings that received a median rating of D G < 3 belong to set A = { D G < 3 } of bearings without corrugations, and the complement set B = { D G 3 } describes bearings with corrugation. Thus, there are 45 bearing surfaces in set A and 15 bearing surfaces in set B. Using the Wilcoxon rank-sum test, it can be quantified whether a certain threshold of a measured surface property is able to classify both sets. This procedure tests the hypothesis that two sets of data have the same median and therefore the same distribution. If the probability calculated in this process is below a critical value, this hypothesis can be rejected, and the two groups are different. P ( A = B ) < 0.05 is defined as the critical probability.
The result of the Wilcoxon rank-sum test for all investigated surface properties is shown in Figure 9. The dashed line indicates the threshold value above which the hypothesis of equal quantities can be rejected. It can be seen that 26 of the 45 properties studied meet the requirement.

3.2.3. Investigation of the Variation of the Surface Properties

Subsequently, the standard deviation of all investigated surface properties is compared to the interquartile range of the assessed damage grade. Therefore, the damage grade scale is assumed as metric, i.e., the grades are equidistant, and both the assessment and measured surface properties are normally distributed. To convert all quantities in relative values, a reference value for the quantity X is calculated from the 75 % quartile X 0.75 and the corresponding interquartile range Q X [29],
z u , X = X 0.75 + 1.5 · Q X .
This reference value is the upper limit, above which all measured data points are considered outliers. Thus, the relative variation of the damage grade is calculated from the arithmetic mean of the interquartile range Q ¯ D G ,
s D G = 0.5 · Q ¯ D G z u , D G ,
or for a surface property X from the arithmetic mean of standard deviation σ ¯ X respectivly,
s X = 0.67 · σ ¯ X z u , D G .
The different factors in Equations (2) and (3) are necessary to normalize the half interquartile range and the standard deviation.
Figure 10 shows the relative variation of the investigated surface properties. As a reference, the variation of the assessed damage grade s D G = 0.13 is shown as a dashed line. It is particularly noticeable that all values describing the skewness of the profile show a very high variation. In total, 21 properties fulfill the set requirement.

3.2.4. Investigation of the Correlation between the Magnitude and Variation of the Surface Property

The final requirement for suitable surface properties is the independence between the magnitude and the standard deviation of a measured property. This correlation can be by quantified by the rank correlation coefficient as shown in Figure 11. In total, 35 surface properties yield a coefficient below the critical value of | R X , σ X | < 0.8 , and thus, they fulfill the requirement of a low magnitude to medium correlation between the magnitude and the standard deviation of a measurement.

4. Discussion

From the examination of the requirements set, it is recognizable that 12 out of the 45 surface properties investigated meet all the requirements and, therefore, are suitable for qualitative and quantitative evaluation of electrical surface damage. However, especially for surface properties, which fulfill the first two requirements and fail the last two requirements, it is worth investigating whether a larger amount of scanned surface areas enables a reduction of the standard deviation or its correlation to the magnitude of the measured surface property.
A qualitative evaluation of electrical surface damage is possible by defining a threshold value for the respective surface property, which enables a differentiation of surfaces with corrugation damage from surfaces without corrugation damage. This differentiation is defined at the transition between the third quartile of set A   ( X 0.75 , A ) and the first quartile of set B   ( X 0.25 , B ) . If the quartiles overlap, the arithmetic mean of X 0.75 , A and X 0.25 , B is calculated as the critical value. If X 0.25 , B is greater than X 0.75 , A , X 0.25 , B is considered the critical value. Mathematically, this relationship is described as
X crit = { X 0.25 , B + X 0.75 , A 2 X 0.25 , B   if   X 0.25 , B < X 0.75 , A if   X 0.25 , B X 0.75 , A     .
These calculated critical values of all surface properties meeting the requirements are summarized in Table 4, the boxplots for all surface properties are found in Figure A2 in the Appendix A.
Next, it is checked whether the defined critical values are compatible with measured values from the literature. If test data from the literature can be delimited with the help of the critical values shown in Table 4, this is taken as confirmation of the corresponding threshold value. If a source gives values for surface damage that contradict the specific limit value but are within the 25 % above or below the limit value, the data from the corresponding source are not considered to contradict the threshold value. If the published data are outside this range, they are considered a deviation. For the remaining surface properties, no comparable data were found.
From comparison with measured data presented in the literature, it can be seen that four properties can either be confirmed or at least the data in the literature do not contradict the defined critical values. For three properties, a deviation is found in the literature, although for all of these properties, additional data were found that show no contradiction to the presented values. In this case, surfaces properties were presented, which are above the here-defined critical values without any corrugation patterns. This can be for several reasons: On the one hand, these publications use different bearings with different surface properties. On the other hand, the above-mentioned sources mainly show a false positive result ( α -error). This means that based on the surface properties, corrugation patterns should be present but are not. In contrast, false negative data ( β -error) have not been observed in the literature. Thus, it can be assumed that the critical surface property limit values are a statistical threshold below which corrugations rarely occur, and they can therefore be used as a critical damage value. To either confirm or adjust this limit values, larger data sets for the surface properties of electrically damaged bearings without corrugations, and especially for electrically damaged bearings with corrugations, are required.

5. Conclusions and Outlook

This paper presents surface properties suitable for the quantification of voltage-induced bearing damages and defines critical limit values that allow for a distinction between grey frosting and corrugations of the bearing surface. Therefore, the used experimental setup was presented to create electrical damages on thrust ball bearings, and the damage progression was evaluated. The damage grade of these surfaces is afterwards evaluated in a study, and the surface properties are measured. Based on defined requirements for suitable surface properties, the suitability of the investigated properties is evaluated and leads to 12 suitable surface properties. A critical value is derived for each of these properties, which allows for a distinction between crater damages like grey frosting and corrugation patterns. These values are discussed in comparison with measurements presented in other publications.
Further research can aim in different directions. First, the evaluated surface properties and the critical values have to be validated with additional surface data of bearings from test bench experiments as well as from real applications. Based on the surface properties, it is possible to derive changing rates of the surface property and investigate the effect of the operating conditions and the applied electric load on the changing rate of the respective property. Finally, the change of the surface properties has to be connected to changes in the condition monitoring data of the bearing. This can give the opportunity to evaluate the surface properties and allow for statements on the current electrical bearing damage state. If one can quantify the current damage state of a bearing surface via condition monitoring and if one is able to calculate the damage progression rate respective to the mechanical and electrical operating conditions, it will be possible to estimate the time that is left until a bearing reaches a critical surface property level. The time until a critical surface level is reached can be defined as the remaining safe operation time of the bearing. The here-presented surface properties and their critical values can therefore be a step towards a calculation of such a safe operation time until corrugation damages occur.

Author Contributions

Conceptualization, A.H.; methodology, A.H., A.Z. and F.M.B.-D.; investigation, A.H. and F.M.B.-D.; writing—original draft preparation, A.H., A.Z., F.M.B.-D. and E.K.; writing—review and editing, A.H. and S.P.; visualization, A.H. and A.Z.; supervision, E.K.; project administration, A.H.; funding acquisition, E.K. All authors have read and agreed to the published version of the manuscript.

Funding

Funded by the Deutsche Forschungsgemeinschaft (DFG, German Research Foundation), project numbers 401671541, 467849890 and 463357020.

Informed Consent Statement

Informed consent was obtained from all subjects involved in the study.

Data Availability Statement

The data presented in this study are openly available on TUdatalib at https://doi.org/10.48328/tudatalib-932, reference number [24].

Conflicts of Interest

The authors declare no conflict of interest.

Appendix A

Table A1. Operating conditions of all tests.
Test Nr.Axial Load (kN)Rotation Speed (rpm)Voltage (V)Frequency (f)Signal Form (-)
V013.52500520Sine
V021250055Sine
V0315002.55Sine
V043.55002.520Sine
V0512500520Square
V063.5250055Square
V073.55002.55Square
V0815002.520Square
V09125002.55Square
V103.5500520Square
V111500520Sine
V12150055Square
V133.525002.520Square
V143.525002.55Sine
V15125002.520Sine
V163.550055Sine
Figure A1. Assessed damage grade ( D G ) of tests V01–V16 of a 51305 axial ball bearing after 3   h (M001), 6   h (M002), 9   h (M003) and 21   h (M004) of electric damaging. Circles mark the median, boxes mark the interquartile range, vertical lines mark the overall range of values and crosses mark outliers.
Machines 10 00832 g0a1
Figure A2. Boxplots of the measured surface properties. The data are separated in two groups for data points with and without corrugations. The red line is the critical value, above which corrugations are likely.
Machines 10 00832 g0a2

References

  1. Muetze, A. Thousands of hits: On inverter-induced bearing currents, related work and the literature. e & i Elektrotechnik und Informationstechnik 2011, 128, 82–388. [Google Scholar] [CrossRef]
  2. Prashad, H. Tribology in Electrical Environments; Elsevier: Amsterdam, The Netherlands, 2006; Volume 49, pp. 1–494. [Google Scholar]
  3. Boyanton, H.E.; Hodges, G. Bearing fluting. IEEE Ind. Appl. Mag. 2002, 8, 53–57. [Google Scholar] [CrossRef]
  4. Busse, D.; Erdman, J.; Kerkman, R.J.; Schlegel, D.; Skibinski, G. System electrical parameters and their effects on bearing currents. IEEE Trans. Ind. Appl. 1997, 33, 577–584. [Google Scholar] [CrossRef]
  5. Gennaro, M.D.; Scheuermann, P.; Wellerdieck, T.; Ravello, V.; Pellegrino, G.; Trancho, E. The H2020 project FITGEN: Preliminary results and design guidelines of an integrated e-axle for the third-generation electric vehicles. In Proceedings of the 8th Transport Research Arena TRA 2020, Helsinki, Finland, 27–30 April 2020. [Google Scholar]
  6. Beyer, M.; Brown, G.; Gahagan, M.; Higuchi, T.; Hunt, G.; Huston, M.; Jayne, D.; McFadden, C.; Newcomb, T.; Patterson, S.; et al. Lubricant Concepts for Electrified Vehicle Transmissions and Axles. Tribol. Online 2019, 14, 428–437. [Google Scholar] [CrossRef]
  7. Graf, S.; Sauer, B. Simulative Untersuchungen des Einflusses elektromechanischer Belastungen an einem Axiallager auf die Glättung der Oberflächen und den Traganteil im Kugel-Laufbahnkontakt. Forsc. Ing. 2022, 86, 145–159. [Google Scholar] [CrossRef]
  8. Schiferl, R.F.; Melfi, M.J. Bearing current remediation options. IEEE Ind. Appl. Mag. 2004, 10, 40–50. [Google Scholar] [CrossRef]
  9. Lin, F.; Chau, K.T.; Chan, C.; Liu, C. Fault Diagnosis of Power Components in Electric Vehicles. J. Asian Electr. Veh. 2013, 11, 1659–1666. [Google Scholar] [CrossRef]
  10. Mütze, A. Bearing Currents in Inverter Fed AC-Motors. Ph.D. Thesis, Technische Universität Darmstadt, Darmstadt, Germany, 2004. [Google Scholar]
  11. He, F.; Xie, G.; Luo, J. Electrical bearing failures in electric vehicles. Friction 2020, 8, 4–28. [Google Scholar] [CrossRef]
  12. Schneider, V.; Behrendt, C.; Höltje, P.; Cornel, D.; Becker-Dombrowsky, F.M.; Puchtler, S.; Gutiérrez Guzmán, F.; Ponick, B.; Jacobs, G.; Kirchner, E. Electrical Bearing Damage, A Problem in the Nano- and Macro-Range. Lubricants 2022, 10, 194. [Google Scholar] [CrossRef]
  13. Wittek, E.; Kriese, M.; Tischmacher, H.; Gattermann, S.; Ponick, B.; Poll, G. Capacitances and lubricant film thicknesses of motor bearings under different operating conditions. In Proceedings of the XIX International Conference on Electrical Machines—ICEM, Rome, Italy, 6–8 September 2010; pp. 1–6. [Google Scholar] [CrossRef]
  14. Loos, J.; Bergmann, I.; Goss, M. Influence of Currents from Electrostatic Charges on WEC Formation in Rolling Bearings. Tribol. Trans. 2016, 59, 865–875. [Google Scholar] [CrossRef]
  15. Schirra, T.; Martin, G.; Vogel, S.; Kirchner, E. Ball Bearings as Sensors for Systematical Combination of Load and Failure Monitoring. In Proceedings of the DESIGN 2018 15th International Design Conference, Dubrovnik, Croatia, 21–24 May 2018; pp. 3011–3022. [Google Scholar] [CrossRef]
  16. Martin, G.; Becker, F.; Kirchner, E. A novel method for diagnosing rolling bearing surface damage by electric impedance analysis. Tribol. Int. 2021, 170, 107503. [Google Scholar] [CrossRef]
  17. Tischmacher, H. Bearing Wear Condition Identification on Converter-fed Motors. In Proceedings of the 2018 International Symposium on Power Electronics, Electrical Drives, Automation and Motion, Amalfi, Italy, 20–22 June 2018. [Google Scholar] [CrossRef]
  18. Bechev, D.; Gonda, A.; Capan, R.; Sauer, B. Untersuchung der Oberflächenmutationen und der Riffelbildung bei spannungsbeaufschlagten Wälzlagern. In VDI-Tagung Gleit-und Wälzlagerungen; VDI Verlag: Düsseldorf, Germany, 2019; pp. 301–312. [Google Scholar]
  19. Graf, S.; Sauer, B. Surface Mutation of the Bearing Raceway caused by electrical Current Passage in Mixed Friction Operation. Bear. World J. 2020, 5, 137–147. [Google Scholar]
  20. Zika, T.; Gebeshuber, I.C.; Buschbeck, F.; Preisinger, G.; Gröschl, M. Surface analysis on rolling bearings after exposure to defined electric stress. Proc. Inst. Mech. Eng. Part J J. Eng. Tribol. 2009, 223, 787–797. [Google Scholar] [CrossRef]
  21. Gemeinder, Y. Lagerimpedanz und Lagerschädigung bei Stromdurchgang in Umrichtergespeisten Elektrischen Maschinen. Ph.D. Thesis, TU Darmstadt, Darmstadt, Germany, 2016. [Google Scholar]
  22. Forschungsvereinigungs Antriebstechnik. Schädlicher Stromdurchgang 1—Untersuchung des Schädigungsmechanismus und der zulässigen Lagerstrombelastung von Wälzlagern in E-Motoren und Generatoren Verursacht Durch Parasitäre Hochfrequente Lagerströme; Forschungsvorhaben Nr. 650 I Heft 1127; Forschungsvereinigungs Antriebstechnik: Frankfurt am Main, Germany, 2015. [Google Scholar]
  23. Forschungsvereinigungs Antriebstechnik. Schädlicher Stromdurchgang 2—Methodik zur Praxisnahen Charakterisierung von Elektrischen Schmierstoffeigenschaften zur Verbesserung der Rechnerischen Vorhersage von Lagerströmen; Forschungsvorhaben Nr. 650 II Heft 1387; Forschungsvereinigungs Antriebstechnik: Frankfurt am Main, Germany, 2020. [Google Scholar]
  24. DIN EN ISO 4287:2010-07; Geometrische Produktspezifikation (GPS)—Oberflächenbeschaffenheit: Tastschnittverfahren—Benennungen, Definitionen und Kenngrößen der Oberflächenbeschaffenheit. ISO: Geneva, Switzerland, 2010.
  25. ISO 25178-2:2012; Geometrical Product Specifications (GPS)—Surface Texture: Areal—Part 2: Terms, Definitions and Surface texture Parameters. ISO: Geneva, Switzerland, 2012.
  26. Wilcoxon, F. Individual Comparisons by Ranking Methods. Biom. Bull. 1945, 1, 80. [Google Scholar] [CrossRef]
  27. Schirra, T.; Martin, G.; Puchtler, S.; Kirchner, E. Electric impedance of rolling bearings—Consideration of unloaded rolling elements. Tribol. Int. 2021, 158, 106927. [Google Scholar] [CrossRef]
  28. Harder, A.; Kirchner, E. Voltage Induced Damage Progression on the Raceway Surfaces of Thrust Ball Bearings, Part I: Surface Measurements; TUdatalib: Darmstadt, Germany, 2022. [Google Scholar] [CrossRef]
  29. Fahrmeir, L. Statistik: Der Weg zur Datenanalyse; Springer: Berlin/Heidelberg, Germany, 2016; ISBN 13 978-3662503713. [Google Scholar]
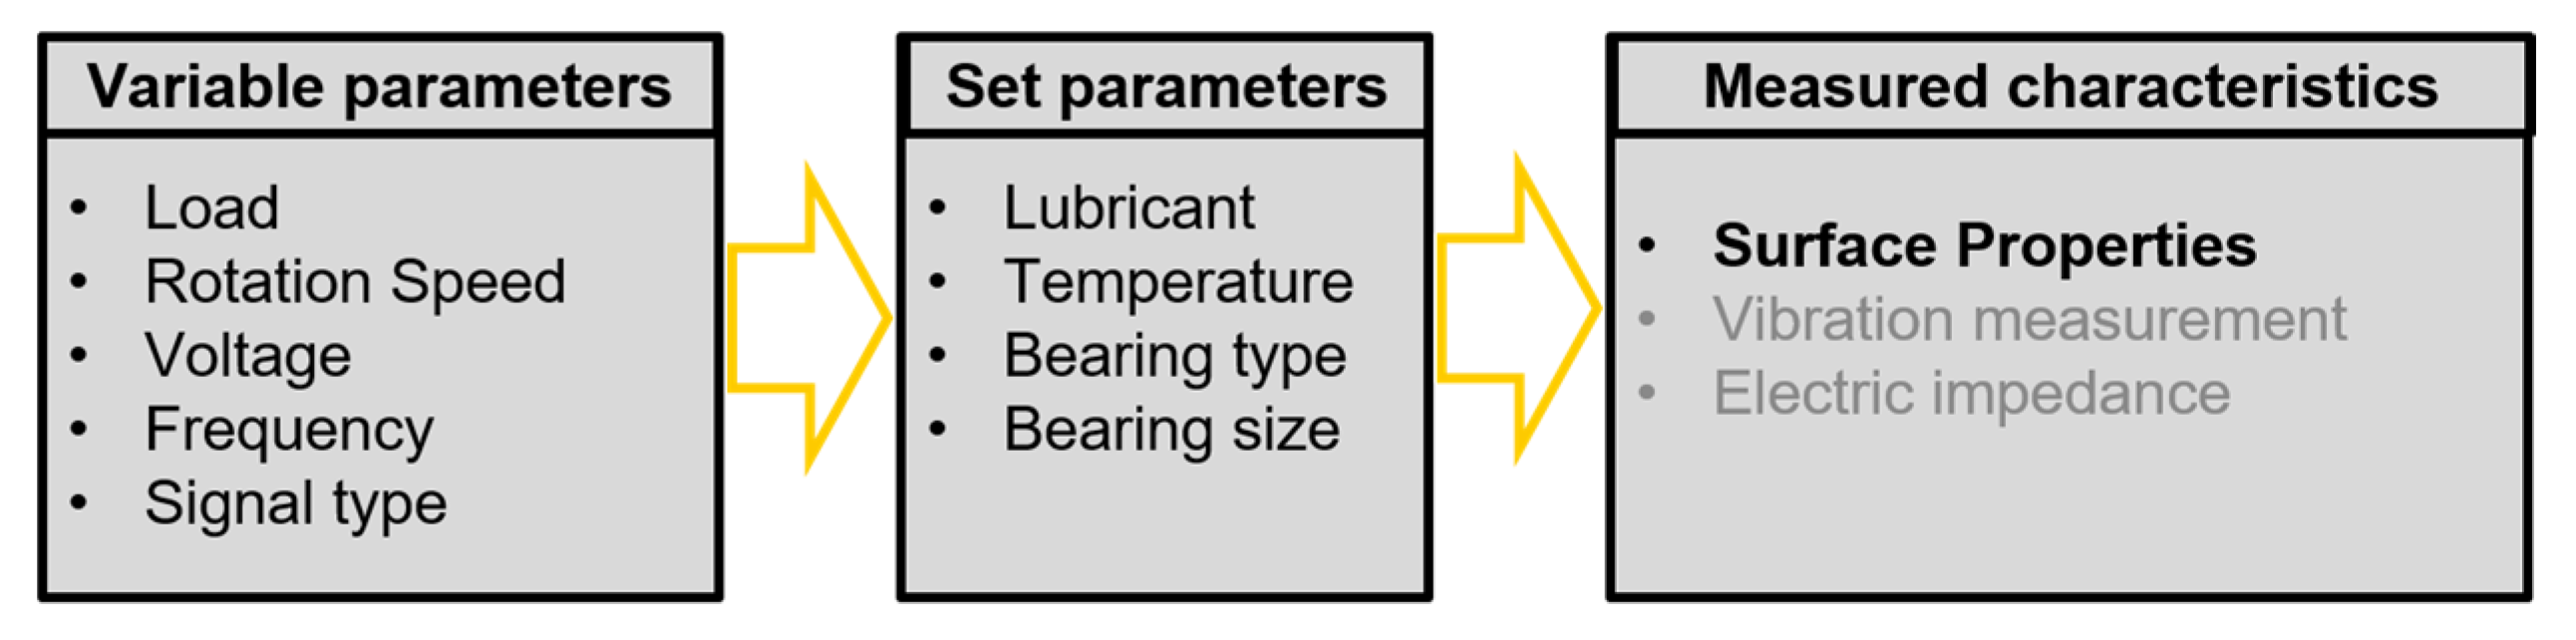
Figure 1. Different grades of bearing damages. ©2018 IEEE. Reprinted, with permission, from [17].
Machines 10 00832 g001
Figure 2. (left): Testing cell of the bearing test rig at the Technical University of Darmstadt; (right): sectioning and current path of the testing cell.
Machines 10 00832 g002
Figure 3. Design of the experiment.
Machines 10 00832 g003
Figure 4. Test setup.
Machines 10 00832 g004
Figure 5. Damaged bearing surface with the scanned areas.
Machines 10 00832 g005
Figure 6. Exemplary scan of the V09 raceway surface after 3 h, 6 h, 9 h and 21 h of voltage-induced surface damaging.
Machines 10 00832 g006
Figure 7. Assessed damage grade ( D G ) of test V09 of a 51305 axial ball bearing with axial load F A = 1   kN and rotational speed n = 2500   rpm with an applied square wave voltage V ^ = 2.5   V at f = 5   kHz after 3   h (M001), 6   h (M002), 9   h (M003) and 21   h (M004) of electric damaging. Circles mark the median, boxes mark the interquartile range, vertical lines mark the overall range of values and crosses mark outliers.
Machines 10 00832 g007
Figure 8. Rank correlation coefficients of the investigated surface properties with the assessed damage grade D G . All properties outside the marked boundary satisfy the requirement of significant correlation.
Machines 10 00832 g008
Figure 9. Result of the Wilcoxon rank-sum test for the investigation of the probability of equal sets A and B.
Machines 10 00832 g009
Figure 10. Relative variation of the investigated surface properties in comparison to the variation of the assessed damage grade (dashed line).
Machines 10 00832 g010
Figure 11. Correlation between mean value and standard deviation of surface properties.
Machines 10 00832 g011
Table 1. Experimental factors.
FactorUnit-+
Axial Load F Ax kN13.5
Rotation Speed n rpm5002500
Voltage U ^ V2.55
Frequency f Hz500020,000
Signal Form-Square WaveSine Wave
Table 2. Constant parameters.
ParameterValue
LubricantFVA3 reference oil
Oil Temperature T40 °C
Bearing TypeThrust ball bearing
Bearing Size51,305
Table 3. Characteristic surface parameters.
VariableParameterVariableParameter
X z Maximum Profile Height V m Material Volume
X t Total Profile Height V v Void Volume
X a Arithmetic Mean of Profile Ordinate V mp Material Volume of peaks
X q Quadratic Mean of Profile Ordinate V mc Material Volume at the core
X sk Skewness of Profile V vc Void Volume at the core
X ku Steepness of Profile V vv Void Volume at the valleys
X Sm Median Groove Width of Profile Elements S k Core height
X dq Quadratic Mean of Profile Pitch S pk Average peak height above the core
X mr Material Fraction of Profile S vk Average valley depth below the core
X dc Height Difference between two Intersection Lines
Table 4. Summary of critical values for corrugations for the respective surface properties.
Surface Property Critical   Value   X c r i t Comparison to Literature
S q , R 0.110   μ m No comparable data
S a , R 0.069   μ m No contradiction
S q , P 0.189   μ m Deviation; no contradiction [15,19]
S dq 0.353 No comparable data
V vv 0.030   μ m 3 μ m 2 No comparable data
S vk 0.289   μ m Deviation; no contradiction [14,15,19]
R z 0.285   μ m Deviation; no contradiction [17,18]
R t 0.824   μ m Confirmed [16,19]
R a 0.043   μ m No contradiction [17,18,19]
R q 0.062   μ m No contradiction [16,17,18,19]
R dq 4.596 ° No comparable data
W dq 0.436 ° No comparable data
Publisher’s Note: MDPI stays neutral with regard to jurisdictional claims in published maps and institutional affiliations.

