Article

Investigation of the Influence of Cutting Parameters on Conical Pick Cutting Performance and Rock Damage

1
College of Mechanical and Electronic Engineering, Shandong University of Science and Technology, Qingdao 266590, China
2
Shandong Normal University, Jinan 250358, China
3
College of Transportation, Shandong University of Science and Technology, Qingdao 266590, China
*
Author to whom correspondence should be addressed.
Machines 2022, 10(11), 1034; https://doi.org/10.3390/machines10111034
Submission received: 4 October 2022 / Revised: 3 November 2022 / Accepted: 3 November 2022 / Published: 5 November 2022
(This article belongs to the Section Machines Testing and Maintenance)

Abstract

:
Conical picks are applied to rock breaking, and the cutting parameters greatly influence cutting performance and rock damage. A conical pick rock-cutting numerical simulation model and software to provide a quantitative analysis of rock damage are established to research the influence of cutting parameters on cutting force and rock damage. The research results indicated that the average peak cutting force decreases with an increased cutting angle, and the average peak cutting force increases with a decreased cutting speed. The average peak cutting force of the second conical pick increases as the distance between double conical picks increases in the process of rock-cutting with double conical picks. There is a positive correlation between the volume of rock damage, the volume of rock breaking, and the cutting force of the conical pick. The research results provide a reference for optimizing the cutting parameters of conical picks.

1. Introduction

Conical picks have excellent cutting performance and are widely used in rock breaking. Too many scholars have researched conical pick-breaking. Evans [1] studied vertical rock breaking with a conical pick and concluded that rock failure is mainly a tensile failure; they concluded that rock breaking is positively correlated with the square of rock tensile strength and cutting depth and negatively correlated with rock toughness. Goktan [2] optimized the theoretical model of the rock-cutting force of the pick proposed by Evans and considered the influence of the cutting angle on the rock-breaking mechanical characteristics of the pick to establish a semi-empirical formula for the cutting force of a conical pick. The comparison between test results and calculation results shows that the model has good predictions for the cutting force of a conical pick. Shao [3,4] studied the influence of cutting parameters such as pick cutting angle, cutting speed, pick spacing and cutting depth on cutting force with single linear cutting tests using a conical pick. Coper et al. [5] studied the impact of different cutting conditions and cutting speeds on rock-breaking properties and concluded that compared with other spiral cutting modes, the double spiral cutting mode has the highest efficiency, and the rock-breaking mechanical properties of the pick are little affected by the cutting speed of the pick. Hekimoglu [6] proposed calculating the pick’s force through the finite cutting area of the cutting graph. Kotwica et al. [7] discussed the compact-rock mining process in terms of the energy it consumes. Saurabh et al. [8] researched the wear mechanism of conical picks by using field emission scanning electron microscopy and energy dispersive X-ray spectroscopy and studied the cracking mechanism of conical picks in the process of coal breaking [9,10,11]. Krauze et al. [12] used the C2 index to estimate the wear rate of conical picks from different manufacturers and developed software enabling the determination of cutting resistance to assess whether the cutting head and the pick arrangement are properly designed [13]. Mucha et al. [14] proposed a control procedure to determine the quality of the applied material for pick tips. Additionally, Deng [15] and Abouzar et al. [16] optimized the damage model through the continuous damage theory, which can better predict the stress-strain relationship of rock materials. Moreover, the optimized damage constitutive model can better explain and describe the mechanisms of internal change in rocks.
Huang et al. [17] conducted a numerical simulation using the particle flow constitutive model through the two-dimensional simulation software PFC. The results showed that the rock-breaking process of a conical pick can be divided into compression and tension. Rojek et al. [18] used the DEM software to establish the conical pick rock-cutting model, sorted and analyzed the data obtained from numerical simulation, and obtained the feasibility of their numerical simulation by comparing it with the test data. Jaime et al. [19] pointed out that it is challenging to simulate conical picks cutting rock owing to the rock breaking and crack propagation uncertainty in the conical pick rock-cutting process. Menezes et al. [20] found that the friction between conical picks and rocks greatly impacts rock breaking under high temperatures and high pressures with LS-DYNA building the simulation model. Fourmeau et al. [21] researched cutting rock with a drill with experiments and numerical simulations. Zhou et al. [22] applied LS-DYNA to study the rock damage in the pick-breaking rock process. Li et al. [23] studied the stress on conical picks of different cutting rollers through LS-DYNA simulation software to research the pick arrangement’s influence on cutting performance. Zhu et al. [24] simulated rock broken with different cutting conditions to research the wear of conical picks in the rock cutting process.
Domestic and foreign scholars have carried out theoretical research, experimental research and simulation research on pick rock breaking, which provides an important reference for studying the influence of cutting parameters on pick-breaking performance. The cutting parameters of conical picks include cutting speeds, cutting angles, cutting depths, and the distance between double conical picks. There is less research on the effect of the cutting parameters on rock damage. Based on ANSYS/LS-DYNA, we build a numerical model of a pick cutting rock to research the pick-cutting parameters’ effects on cutting performance and rock damage. The statistical software to assess rock damage is developed based on MATLAB to draw statistics on rock damage to lay the foundation for quantitative analysis. The conical pick cutting speeds are defined as 1, 3, 5, 7, and 9 m/s, and the cutting angles are defined as 40°, 45°, 50°, 55° and 60°. The distances between double conical picks are defined as 8, 15, 20, 25, 30, and 50 mm to investigate the cutting angle, cutting depth, cutting speed, and distance between double conical picks to research the average peak cutting force and rock damage.

2. Methods and Simulation Model

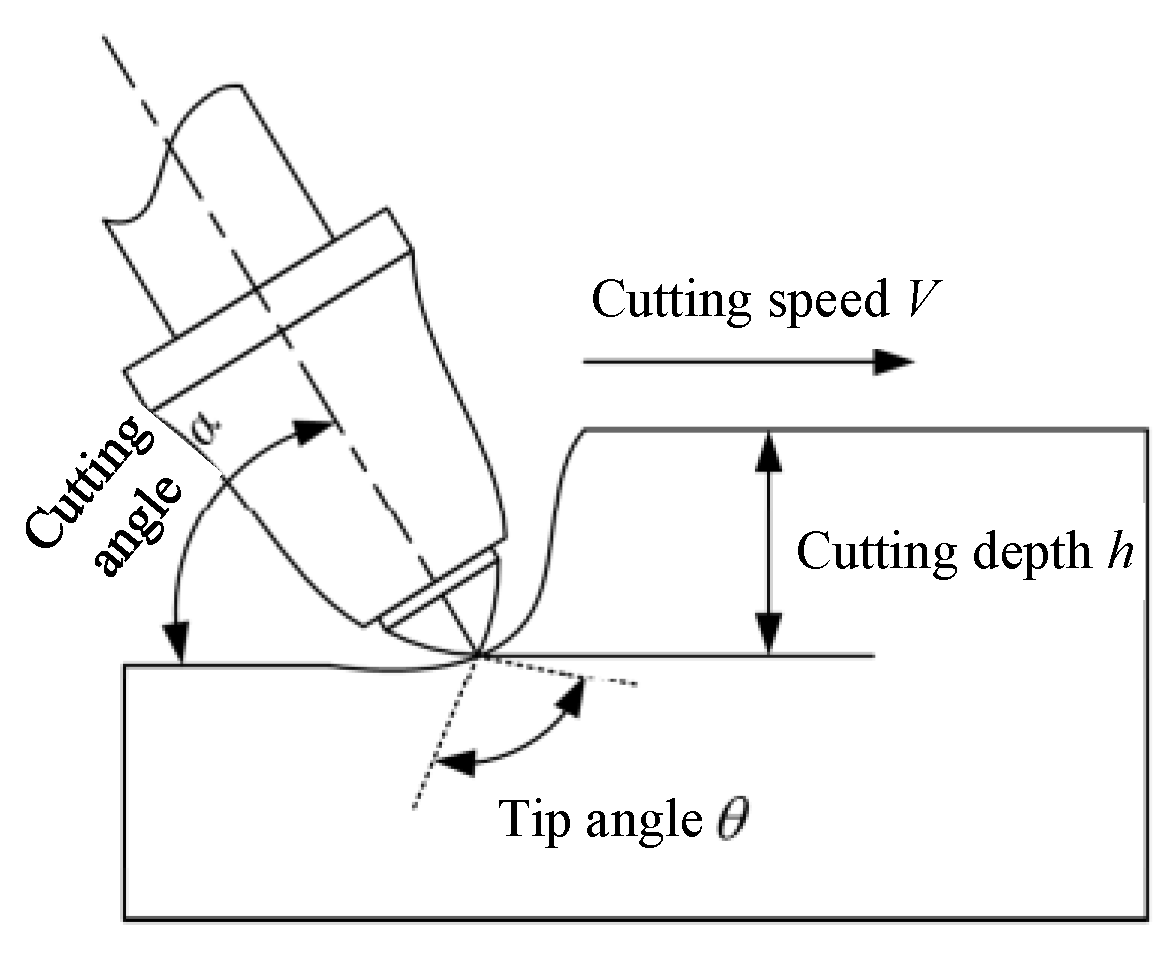
2.1. Cutting Force Model of a Conical Pick Cutting Rock

Because rock is an anisotropic quasi-brittle material with obvious anisotropy and discontinuity, rock-breaking mechanisms are different, and the fragment sizes of rock fractures are different. Evans put forward the rock-breaking theory of conical picks for the first time and pointed out that the main causes of rock failure are compressive failure and tensile failure. The cutting force calculation model of the conical pick is shown in Formula (1).
F c = 16   π σ t 2 h 2 c o s 2 ( θ / 2 ) σ c
Here, F c represents the average peak cutting force, θ represents the conical pick tip angle,   σ t represents the uniaxial tensile strength, σ c represents the uniaxial compressive strength, and h represents the cutting depth.
Roxborough et al. [25] studied the influence of the friction angle between the conical pick and rock on the peak cutting force, improved it according to the Evans rock-breaking theory, shown in Figure 1, and obtained a theoretical formula of pick cutting force, as shown in Formula (2).
F c = 16 π σ c h 2 σ t 2 [ 2 σ t + ( σ c c o s ( θ / 2 ) ) ( t a n ( ψ / 2 ) 1 + t a n ψ ) ] 2
Here, ψ represents the friction angle between the rock and conical pick, which ranges between 16° and 30°.
The conical pick rock-cutting force model by Evans has a slight shortcoming. Gokan modified the theoretical model and established a theoretical formula for the peak pick cutting force, as shown in Formula (3).
F c = 4 π σ t 2 h 2 s i n 2 ( θ / 2 + ψ ) c o s [ θ / 2 + ψ ]

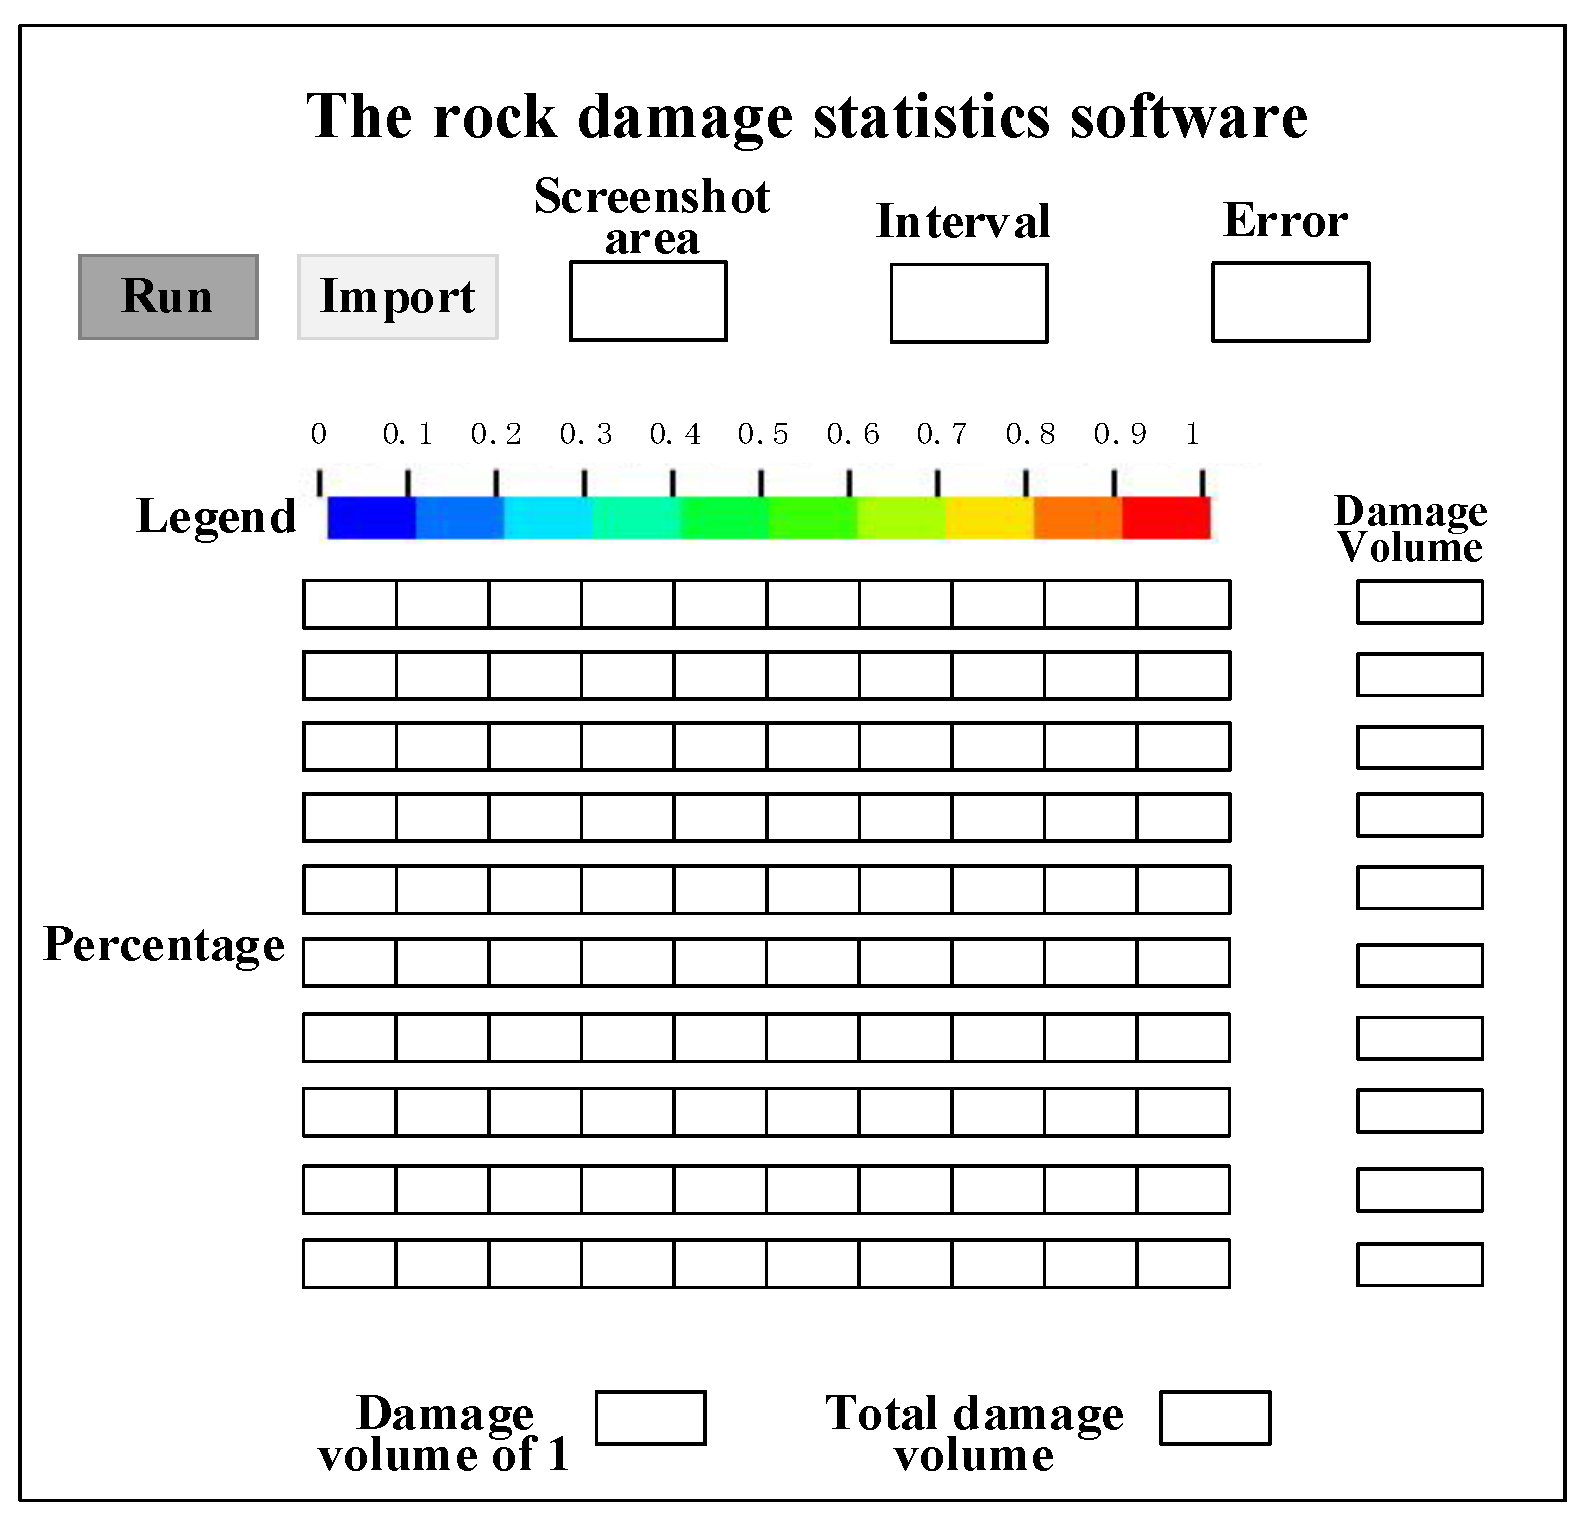
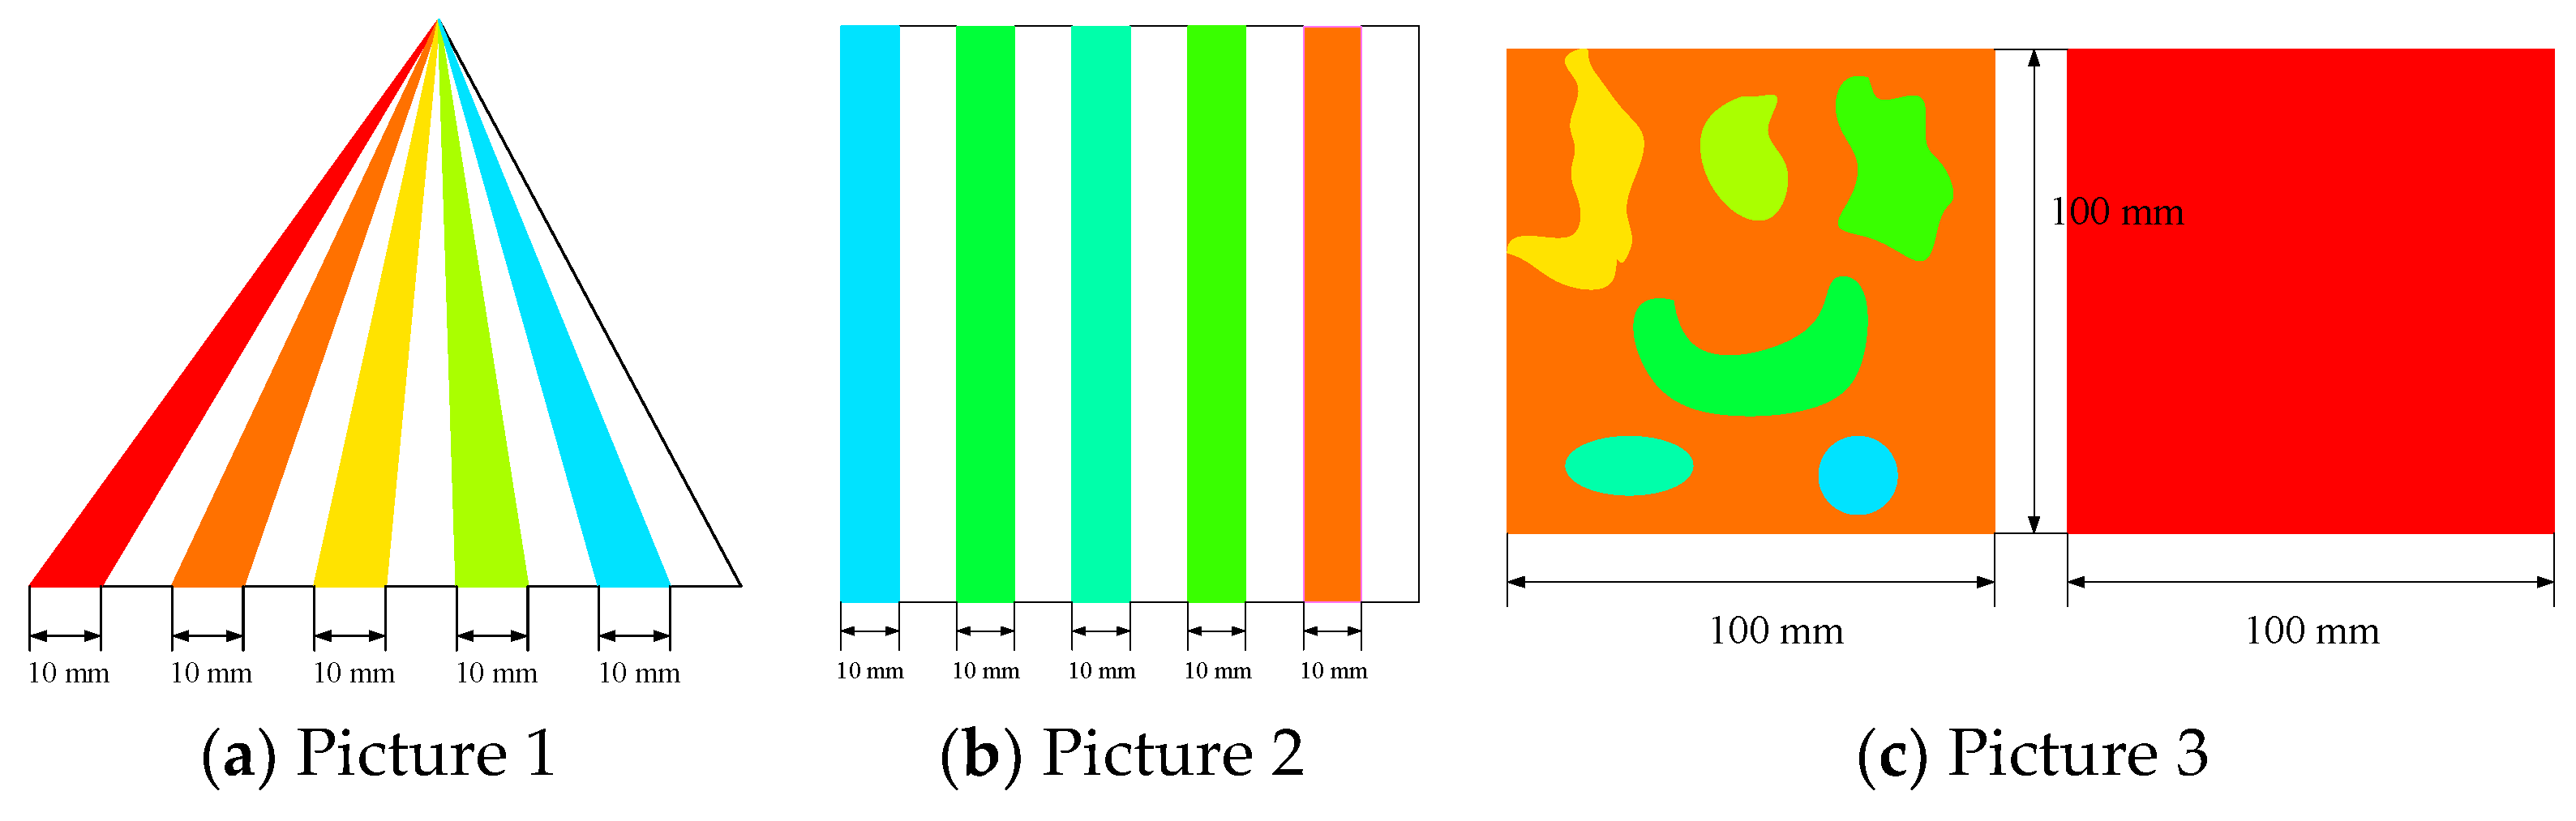
2.2. The Rock Damage Statistical Algorithm

In order to quantitatively analyze rock damage, a statistical model of the rock is established based on MATLAB. There are ten sections in the legend of the rock damage nephogram, and each color is assigned 0~1 in turn, as shown in Figure 2. The statistical method of rock damage adopts the ratio of different damage degree areas in each screenshot to rock screenshot and then obtains a more accurate rock damage volume through the cumulative method.
The pixels in the intercepted rock damage nephogram image contain three components of primary color information: R (red), G (green), and B (blue), and the value of each component is in the range of 0~255. The pixel matrix of the color image is stored as a three-dimensional matrix in MATLAB software. Each dimension represents different meanings. The first dimension represents the X coordinate of the pixel, the second dimension represents the Y coordinate of the pixel, the third dimension represents R, G and B, and the numbers 1, 2 and 3 in the third dimension represent R, G and B, respectively [26,27].
The RGB values of each color in the legend are obtained from the RGB color comparison table, as follows: (255,0,0), (255,113,0), (255,227,0), (170,255,0), (57,255,0), (0,255,57), (0,255,170), (0,227,255), (255,113,255), (255,0,255).
The RGB three-channel extraction value of the imported picture is obtained through MATLAB, and the total number of the whole picture is obtained. We compare the RGB value of the legend with each channel value, record the number of pixels that meet the three values simultaneously, and compare it with the total number of pixels to obtain the color proportion in the legend in the whole picture [28]. To improve the accuracy of color recognition and reduce the error, we take the original RGB value as the center and draw a ball in three-dimensional space according to a certain radius. The RGB values in this space are subject to pixel statistics according to the central RGB value, as shown in Figure 2b.
To facilitate batch processing of pictures and the rapid calculation of rock damage volume, the rock damage nephogram to be processed is numbered in sequence and saved in the same folder, and the pictures under the folder are processed by software. The test shows that the left-most blue color block in the legend represents a damage value of 0, and the values of other color blocks from left to right are 0.1, 0.2, 0.3, 0.4, 0.5, 0.6, 0.7, 0.8, 0.9, and 1.
The damage degree of the rock is added into the calculation of damage values to distinguish different degrees of damage of the rock. Each section’s damage area Formula (4) accumulates the area of rock damage of continuous screenshots to obtain the rock damage volume. The calculation formula of rock damage volume is shown in (4):
S j = i = 0 8 0.1 ( i + 1 ) A i S
Here, S j represents the damaged area of the j-th section, A i represents the percentage of each color in the section, and S represents the area of rock damage.
V t = j = 1 n S j d
Here, Vt represents the total damage volume, and d represents the intercept interval.

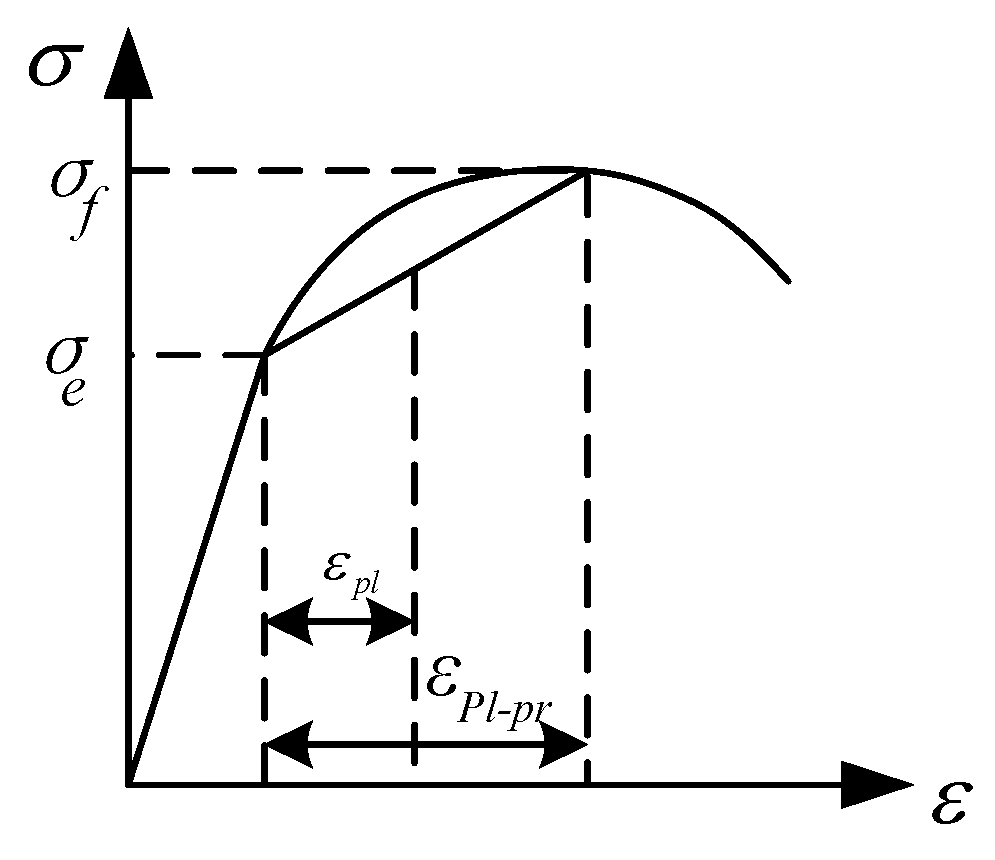
2.3. Constitutive Model of Rock Material

In the paper, the RHT model is applied to rock material, which can well simulate the problems of rock strain, damage, and breakage in the conical pick rock-cutting process. The RHT constitutive model mainly includes three surface functions: the failure surface, the elastic limit surface, and the linear strength function.
The failure stress σ f can be obtained by a quasi-static triaxial compression test. Due to the introduction of normalized pressure, p * = p / f c can be substituted into the failure surface equation. The expression of failure stress σ f is as follows:
σ f ( p ,   θ , ε ˙ ) = f c · σ T X C * ( p s ) · R 3 ( θ ) · F r a t e ( ε ˙ )
Here, R 3 ( θ ) represents the load angle factor,   S r a t e ( ε ˙ ) represents the dynamic strain rate factor, σ T X C * ( p s ) represents the quasi-static failure surface equivalent force,   p s = p / S r a t e ( ε ˙ ) represents the quasi-static pressure, f c represents the quasi-static uniaxial compressive strength, and p represents the actual hydrostatic pressure.
The elastic limit surface equation is derived from the failure surface equation, and its elastic limit stress pressure σ e is as in Formula (7):
σ e ( p , θ , ε ˙ ) = f c · σ T X C * ( p s , e l ) · R 3 ( θ ) · S r a t e ( ε ˙ ) · E e · E c a p
Here, E e represents the elastic scaling function, E c a p represents the “cap” function, and p s , e l = p s / E e represents the quasi-static elastic limit pressure.
Because the linear hardening equation is added to the RHT constitutive model, the strain-hardening effect of concrete and rock can be better shown. There is a linear strengthening stage between the final failure surface and the initial elastic limit surface, as shown in Figure 3. When the equivalent stress does not reach the linear strengthening limit stress, the deformation of the material is elastic. When the equivalent stress exceeds the strengthening limit, the material begins to produce plastic deformation, and the deformation gradually accumulates.
σ Y h a r d = σ e + ε p l ε p l p r × ( σ f σ e )
ε p l p r = σ f σ e 3 G × ( G e G e G p )
ξ = G e G p G e
We derive Equations (8)–(10) to obtain Equation (11).
σ Y h a r d = σ e + 3 G ξ ε p
Here, Ge represents the elastic shear modulus, Gp represents the plastic shear modulus, G represents the shear modulus, ε p represents the linear elastic equivalent cumulative plastic strain, and ξ represents the shear modulus coefficient.
When the external force on the material is greater than the failure stress, the cumulative damage value reaches 1. At this time, the material is completely broken. Due to confining pressure, friction between the broken parts remains, and the material bears shear stress. Residual stress is introduced into the RHT constitutive model, and the equation is shown as Formula (12).
σ r e = B × ( p * ) M
Here, B represents the residual stress intensity parameter, M represents the residual stress intensity index, and p * = p / f c represents the normalized pressure.

3. Modeling and Verification

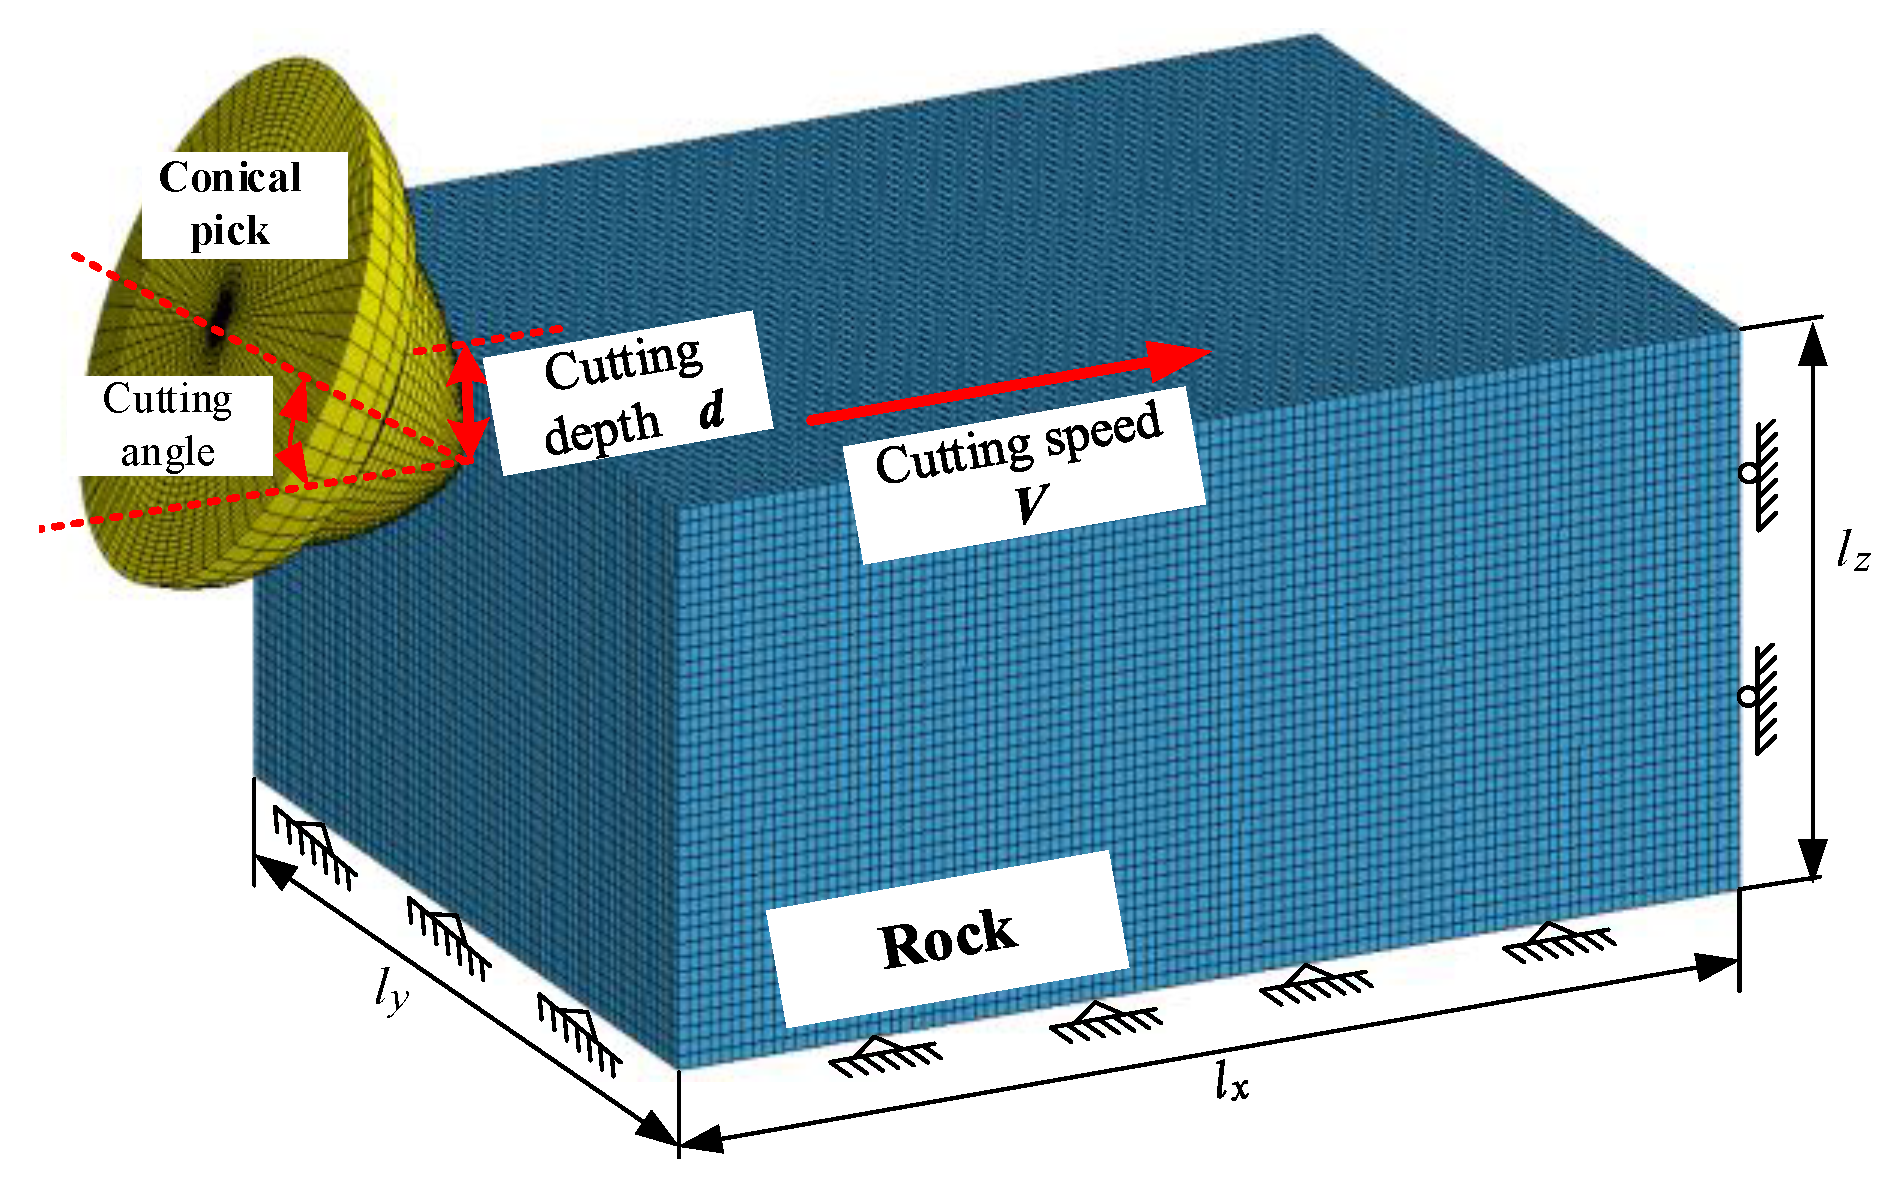
3.1. Numerical Simulation Model

Based on ANSYS/LS-DYNA, we built a rock-cutting model with a pick to study the effect of the cutting parameters on the cutting performance. The part of the pick that does not participate in the cutting was simplified and removed to increase the calculation efficiency. The tip angle of the pick was 80°, and the cutting angle of the pick was set to 55°. The rock model’s length, width and height were 50 mm, 100 mm and 30 mm, respectively. The element types of the rock and pick were a solid 164 solid elements for grid division. In the finite element simulation, this paper mainly studied the stress of the pick and the damage of the rock and defined the pick material as a rigid body. The rock material was defined as an RHT constitutive model with damage failure, and the contact type between rock and pick was ERODING_SURFACE_TO_SURFACE. Meanwhile, we added displacement constraints in the x-axial direction on the rock’s left and right surfaces and added displacement constraints in the y-axial order on the front and rear surfaces and the full direction in the lower surface, as shown in Figure 4. We added BOUNDARY_NON_REFLECTING to eliminate the influence of stress waves on rock breaking with the pick, realize an infinite rock in the numerical simulation and then simulate the actual cutting process. The key parameters of the rock material are shown in Table 1.

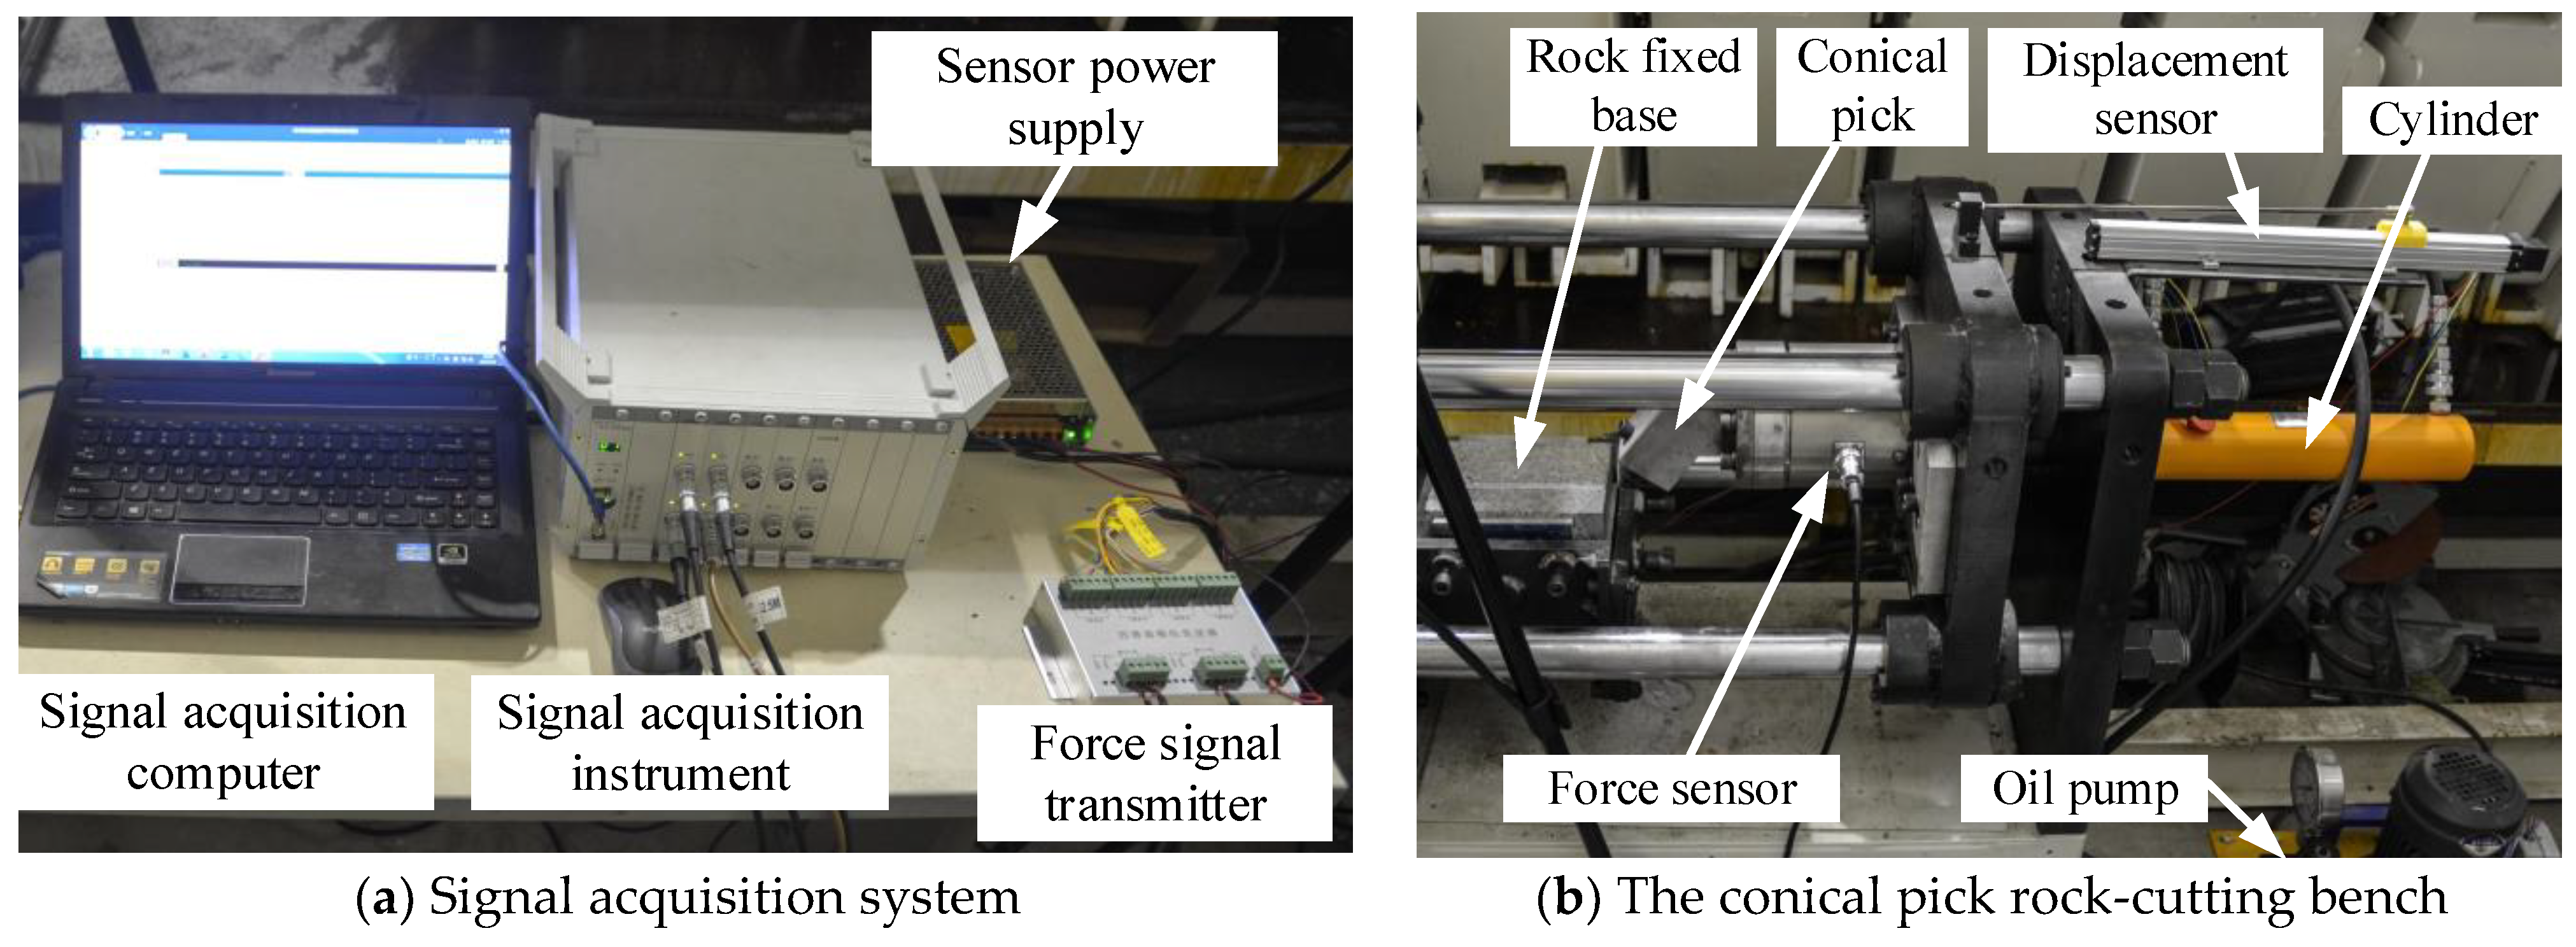
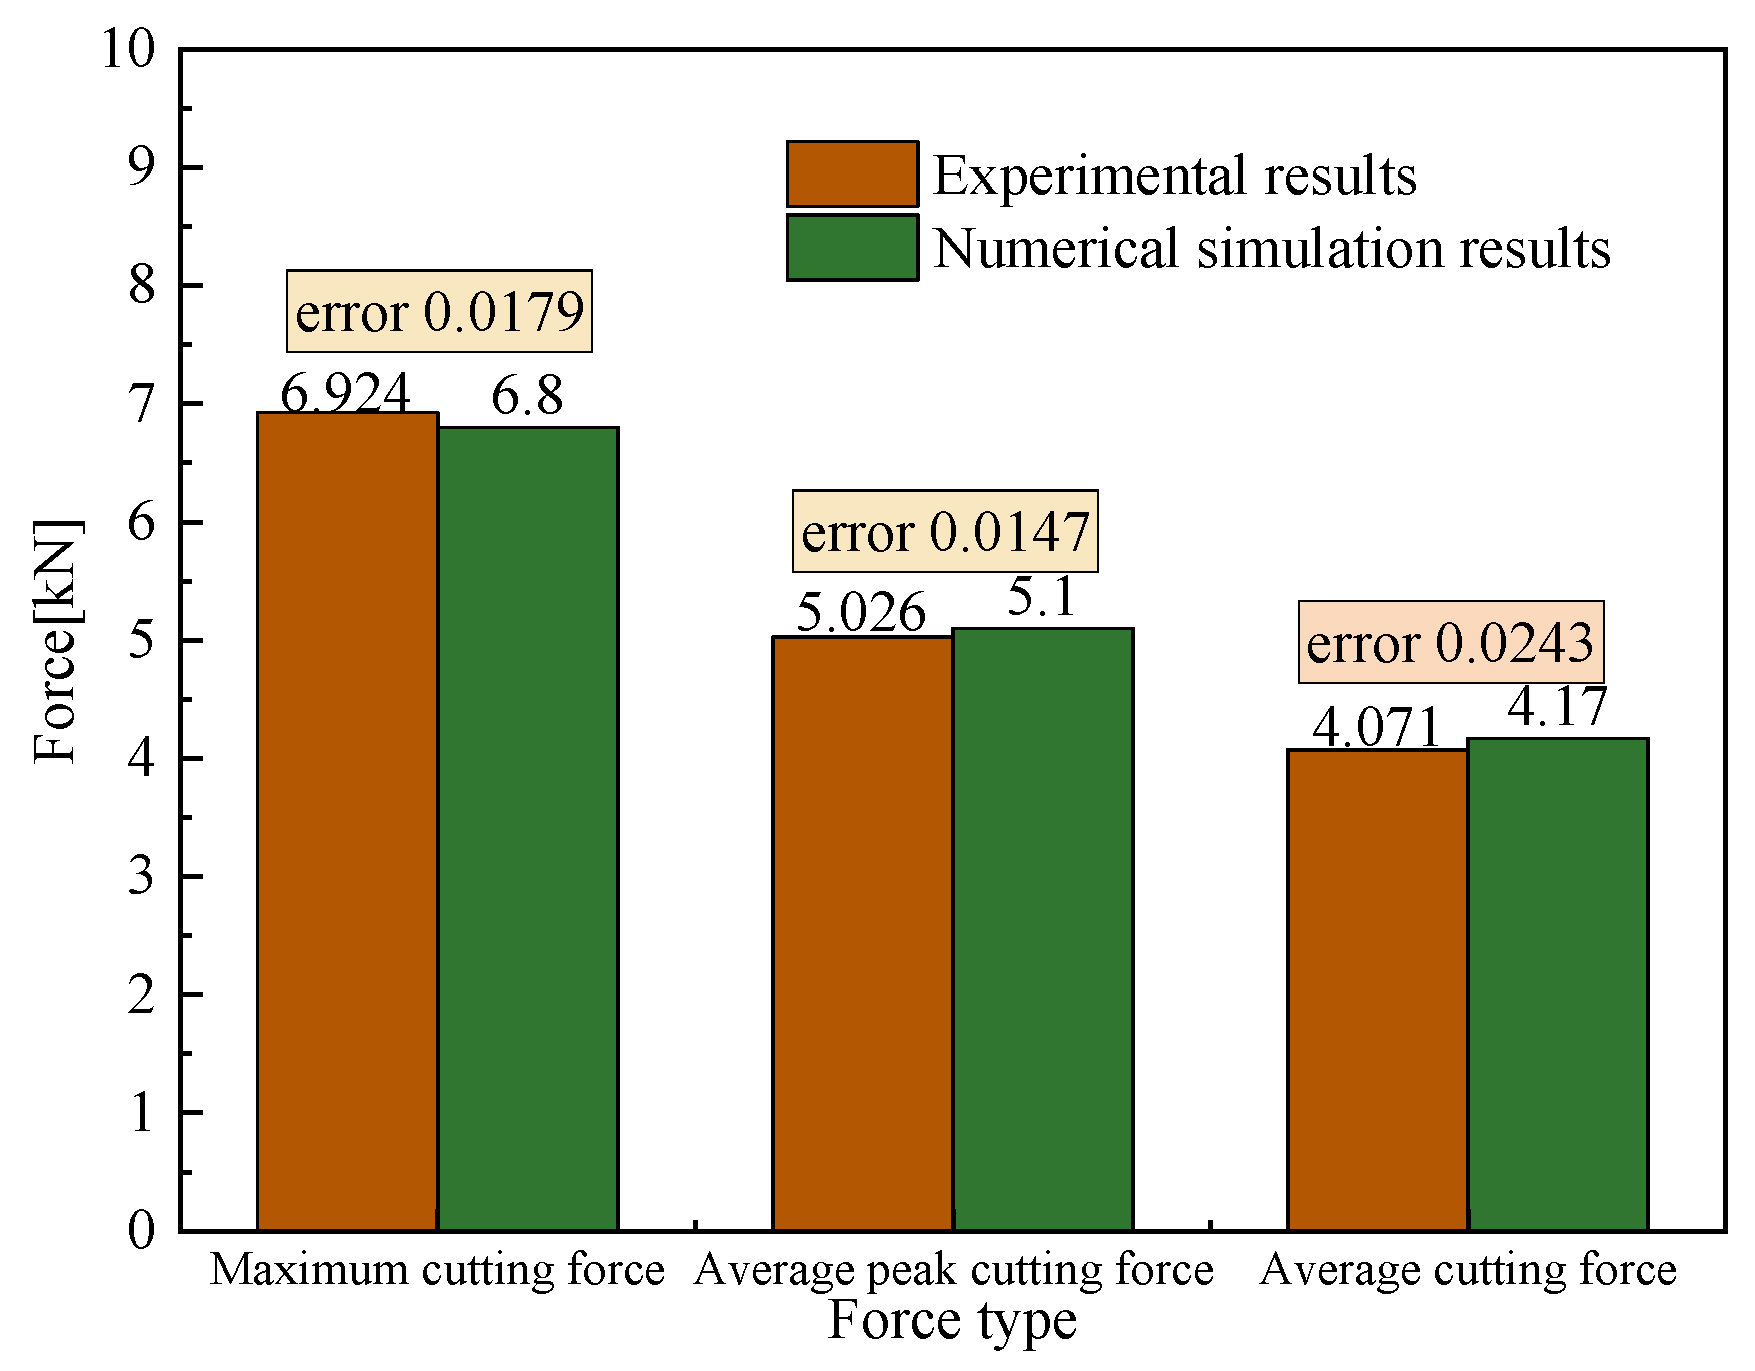
3.2. Verification and Modification

We established the conical pick rock-cutting test bench to verify the conical pick rock-cutting numerical simulation model, shown in Figure 5. The experimental test bench included the fixed rock base, the conical pick, a force sensor, a displacement sensor, a hydro-cylinder and an oil pump. The force sensor transmitted the signal to the signal acquisition instrument through the force signal transmitter, and then the data were recorded by the signal acquisition computer. The displacement sensor signal was transmitted to the signal acquisition instrument, and the signal acquisition computer recorded the displacement data. The signal acquisition frequency was set as 1000 Hz. The experimental test bench of conical pick rock-cutting could produce conical pick rock-cutting with various cutting parameters.
The experimental and numerical simulations of conical pick rock-cutting were carried out with a cutting speed of 2.0 m/s, cutting depth of 10 mm and a cutting angle of 50°. The experimental and numerical simulation results of conical pick rock-cutting are shown in Figure 6. We defined the error between the experimental and numerical simulation results as the ratio of the difference between the experimental results and numerical simulation results to the experimental results. The maximum force, average peak cutting force and average force error of the conical pick with experimental and numerical simulations are 1.79%, 1.47% and 2.43%, respectively, which is less than 5%. Therefore, the numerical simulation model is correct.

3.3. Establishing the Rock Damage Statistical Model

We established rock damage image statistical software based on MATLAB to conduct the statistical analysis of rock damage, which was carried out on the rock damage nephogram obtained by the LS-PrePost software. We analyzed the damage range in the rock damage nephogram to calculate the rock damage volume.
We applied the MATLAB function IMread to read the continuously intercepted rock damage cloud image and used it for the loop statement to automatically read the image data in a batch. The interface of the rock damage statistical software is shown in Figure 7. The interface mainly consists of four parts: an import section area, the interception interval, the percentage of each color in the legend, the error setting, the total damage volume and the volume with a damage value of 1. The software identifies the area of the imported damage section, solves the damage volume according to the preset damage formula and the necessary input parameters, and outputs it on the interface.

3.4. Establishing the Statistical Model of Rock and Modifications

According to the statistical algorithm for rock damage, the volume of rock damage can be obtained. The developed statistical rock damage software’s accuracy only depends on the accuracy of image recognition. Therefore, only some specific pictures need to be imported to verify the accuracy and feasibility of the software. We imported the test image into the software, set the cross-sectional area and interception interval to 1 mm, and output the results shown in the rock damage statistics interface, as shown in Figure 8.
The verification picture of the damage statistics software can be obtained from Figure 8. The area occupied by each color in Figure 8a,b is the same as that of other colors. Therefore, the software’s accuracy can be verified by comparing the proportion of each color. In Figure 8a,b, the area of different colors is the same, so the average of the software identification values of different colors is taken as the standard value of each color. The error is the ratio of the difference between the identification value and the standard value to the standard value. By observing Table 2, it can be concluded that the error of the required color proportion is less than 1%; the accuracy of the software in identifying irregular graphics can be verified by Figure 8c. The sum of the seven color areas in the figure on the left in Figure 8c is the same as the area occupied by red on the right. Combined with Table 2, it can be concluded that the error of irregular graphic area recognition is still within 1%. To sum up, the accuracy of rock damage statistics software meets the user’s requirements.

4. Results and Discussion

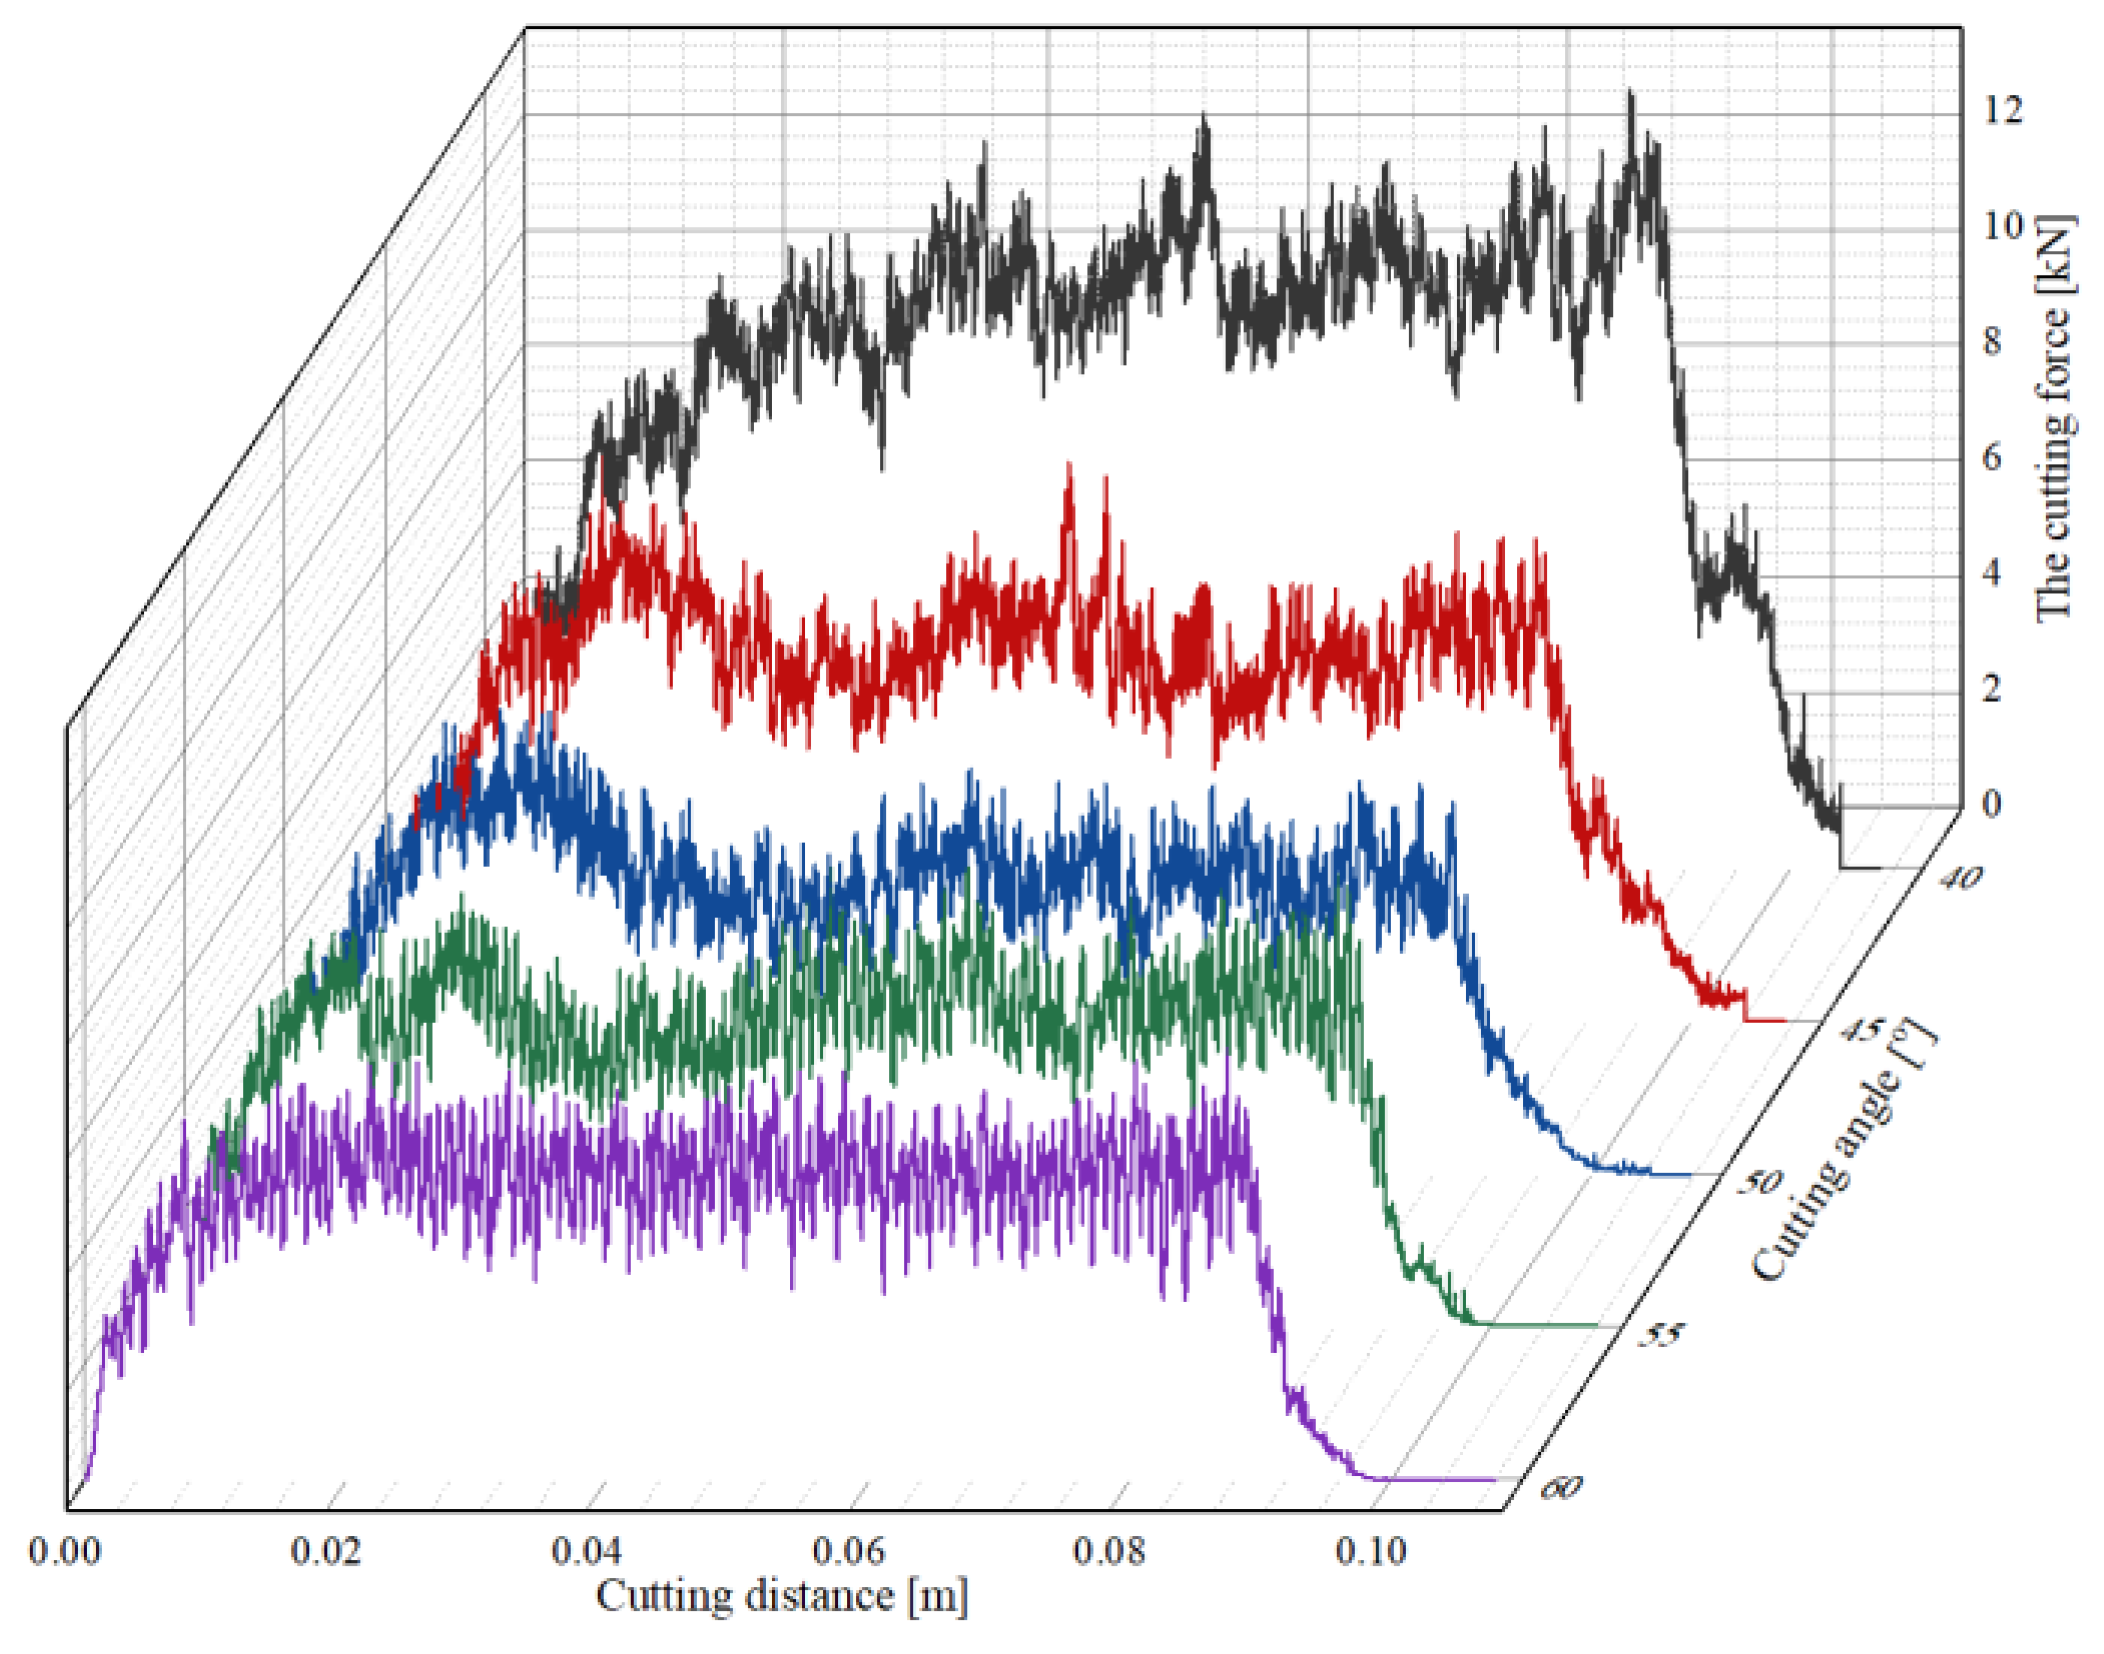
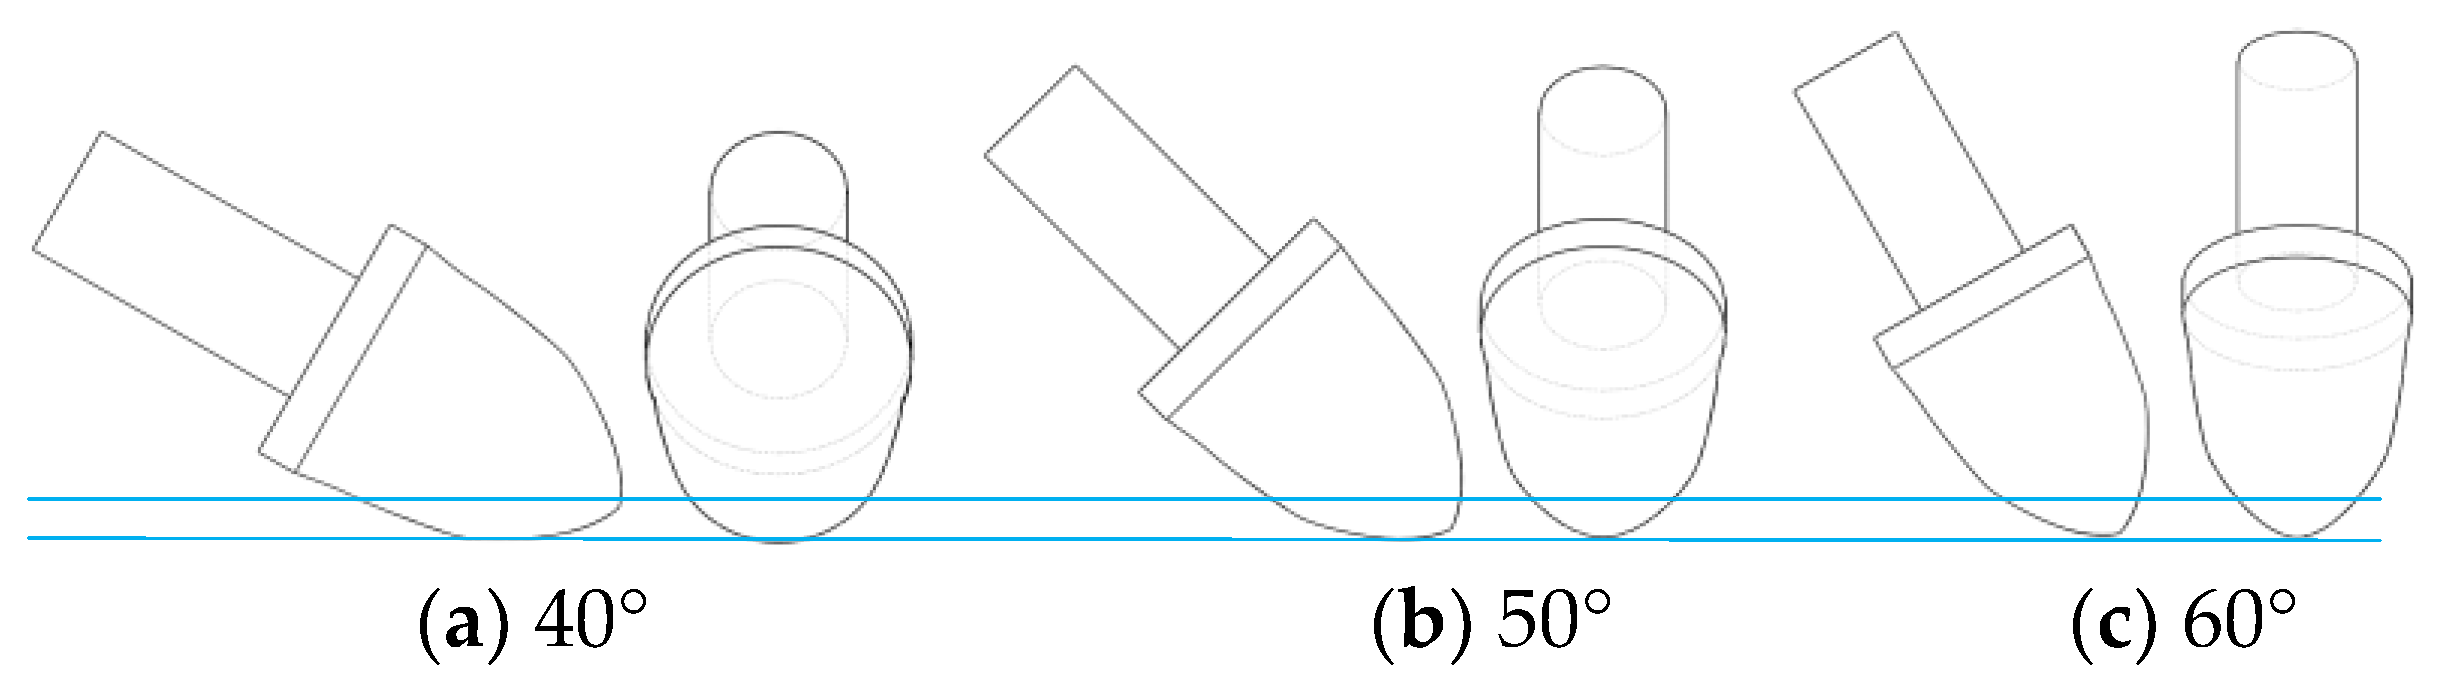
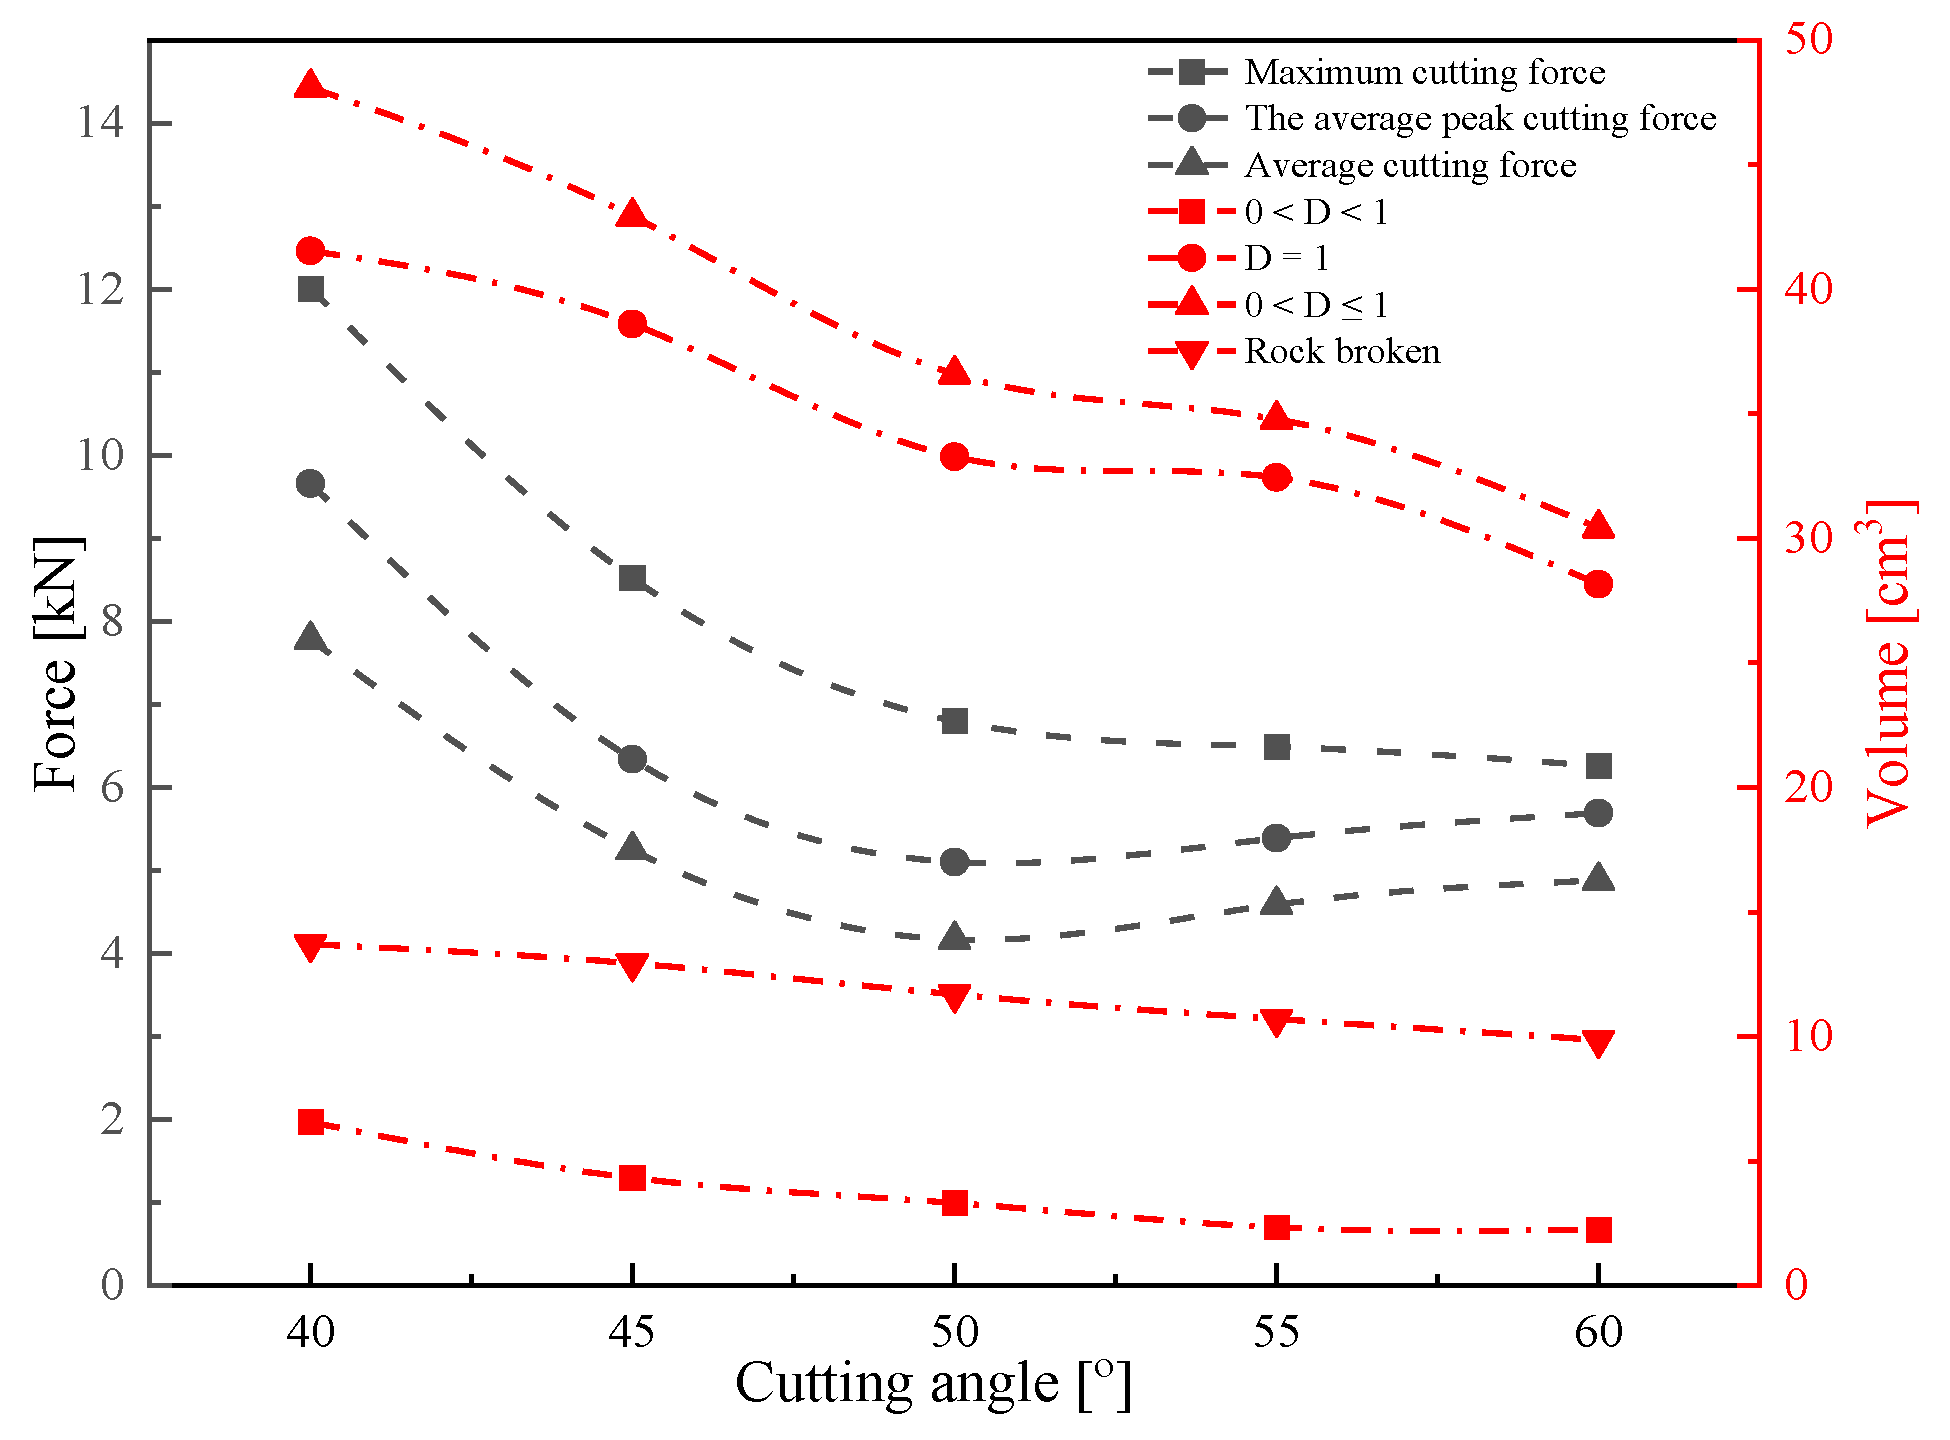
4.1. The Effect of Cutting Angle on Cutting Performance and Rock Damage

The conical pick cuts rock with a cutting speed of 3 m/s, cutting depth of 5 mm, and cutting angle of 40°, 45°, 50°, 55° and 60°. The cutting force curves of the conical pick rock-cutting numerical simulation are shown in Figure 9.
The cutting force curves show that the fluctuation and variation laws are different under different cutting angles. As the cutting angle increases, the fluctuation in the cutting force decreases gradually, the cutting process is stable, and the maximum peak force of the conical pick also decreases gradually. Because the interaction area between the conical pick and rock increases gradually with the cutting angle, the rock breaking volume with various cutting angles is different, resulting in different fluctuations in the conical pick force. Additionally, the cutting angles greatly affect rock damage, and the rock damage cloud with different cutting angles is shown in Figure 10. The volume of rock damage is greatly impacted by the cutting angle. The thickness of the rock damage with different cutting angles is basically the same, but the notch size of the rock damage is changed; therefore, as the cutting angle increases, the rock damage decreases.
It can be clearly seen from the rock damage nephogram and profile at different cutting angles that the rock damage area is located around the crushing area of the pick. Along the cutting direction of the pick, the rock damage range extends around the contact position between the pick’s tip and the rock’s center. As the cutting angle of the pick increases, the rock damage volume width decreases obviously, as shown in Figure 11. Due to the increased cutting angle, the contact area of the pick cutting the rock decreases. However, in the rock damage nephogram, the rock unit with a damage value of 1 still occupies the main position.
In order to accurately analyze the influence of cutting angle on the mechanical characteristics of the pick in the process of rock breaking, the pick force under different cutting angles is statistically analyzed. We take the average peak cutting force as the statistical standard of the conical pick, the average cutting force and the maximum cutting force Fmax. With an increase in cutting angle, the maximum peak force decreases gradually, but the decreasing range is smaller. The variation trend of the average peak cutting force and average force decreases first. When the cutting angle increases to 50°, the trend of cutting force changes from decreasing to increasing. The cutting force decreases gradually when the cutting angle increases from 40° to 50°. According to Figure 12, when the cutting angle is 50°, the average peak cutting force and average cutting force are smaller values. Therefore, designing the installation angle of the conical pick involves choosing a cutting angle near 50°, which has certain practical guiding significance. Additionally, the conical pick average peak cutting force results are similar to that of Zeng et al. [29].
According to the statistics of rock damage and crushing volume, the results of rock cutting with the pick at different cutting angles and the relationship curves between rock damage volume, rock crushing volume, and cutting angle are shown in Figure 12. It is evident that the cutting angle significantly impacts rock damage volume. As the cutting angle increases, the rock damage volume gradually decreases, and the crushing volume also gradually decreases, but the reduction range is small. The average peak cutting force and average force of the pick first decrease and increase as the cutting angle increases. Therefore, when the pick breaks the rock, each index of the rock breaking by the pick should be considered. The selection of the cutting angle should be about 50° in combination with the pick force and rock damage volume.

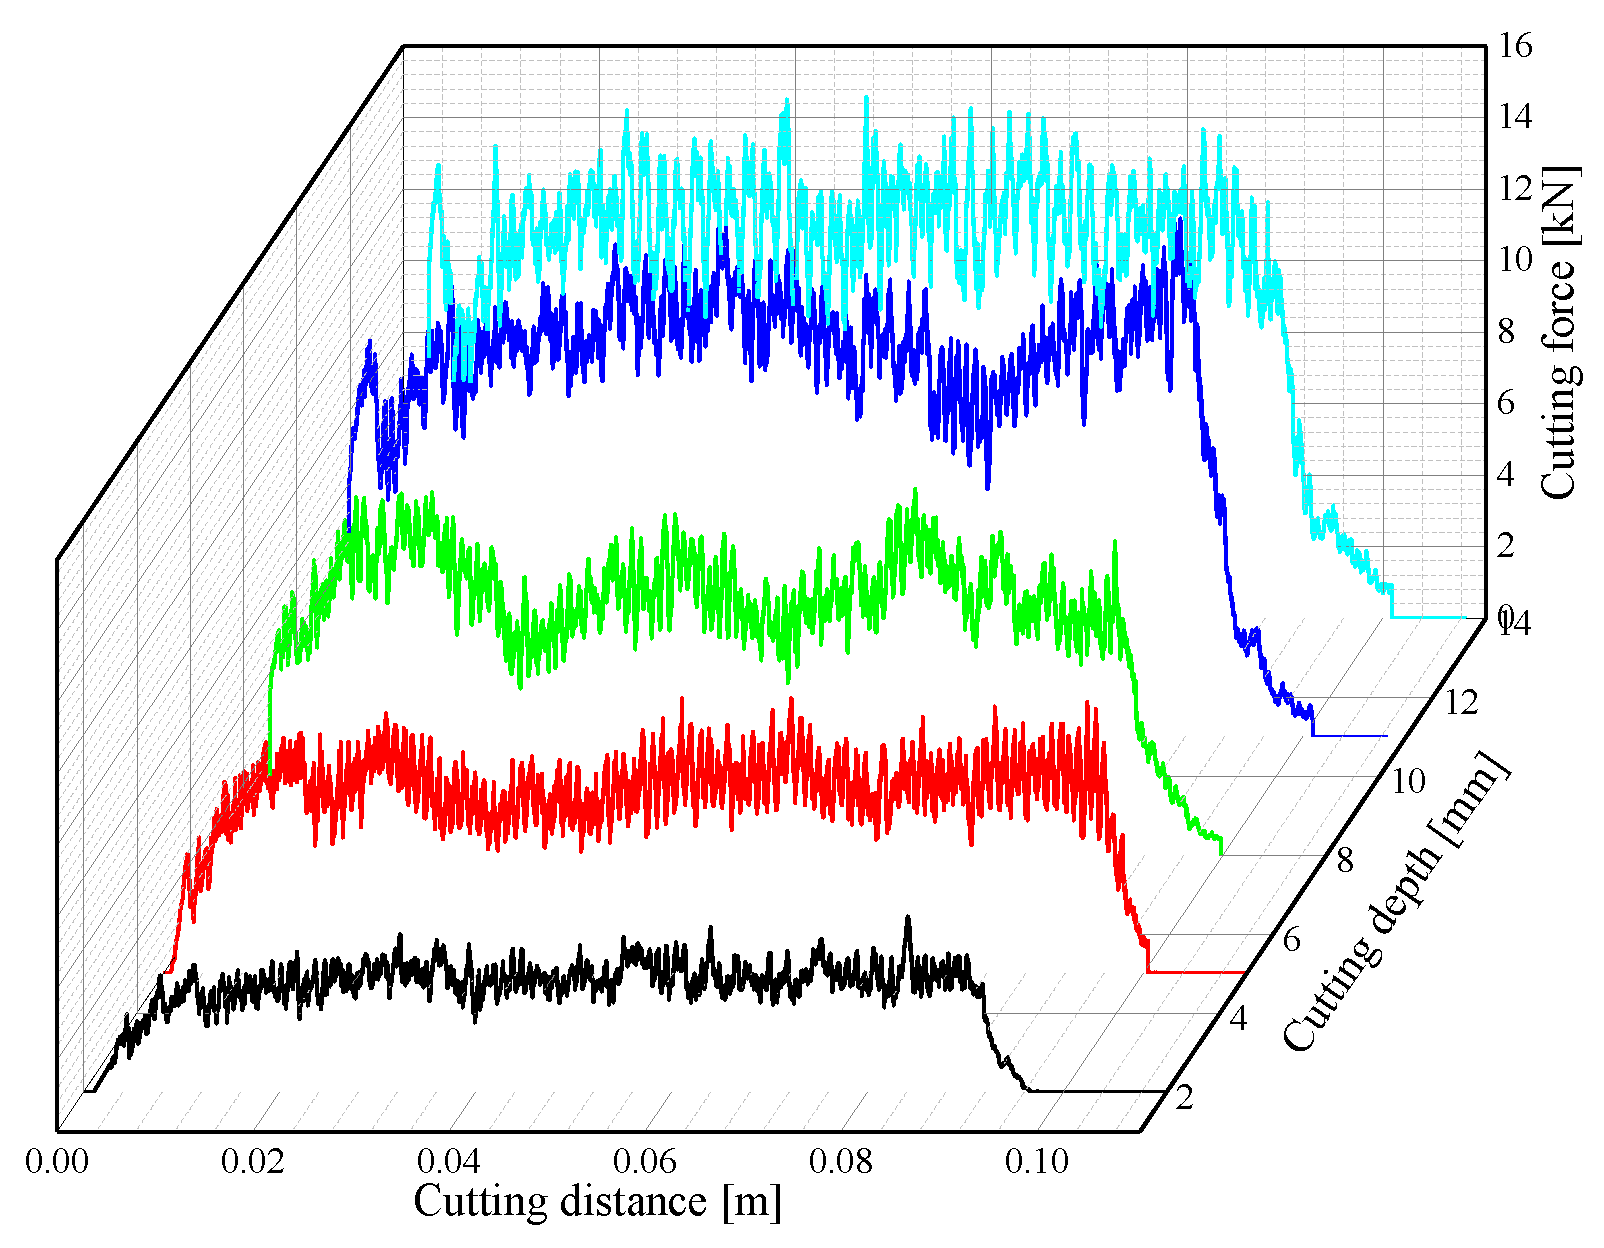
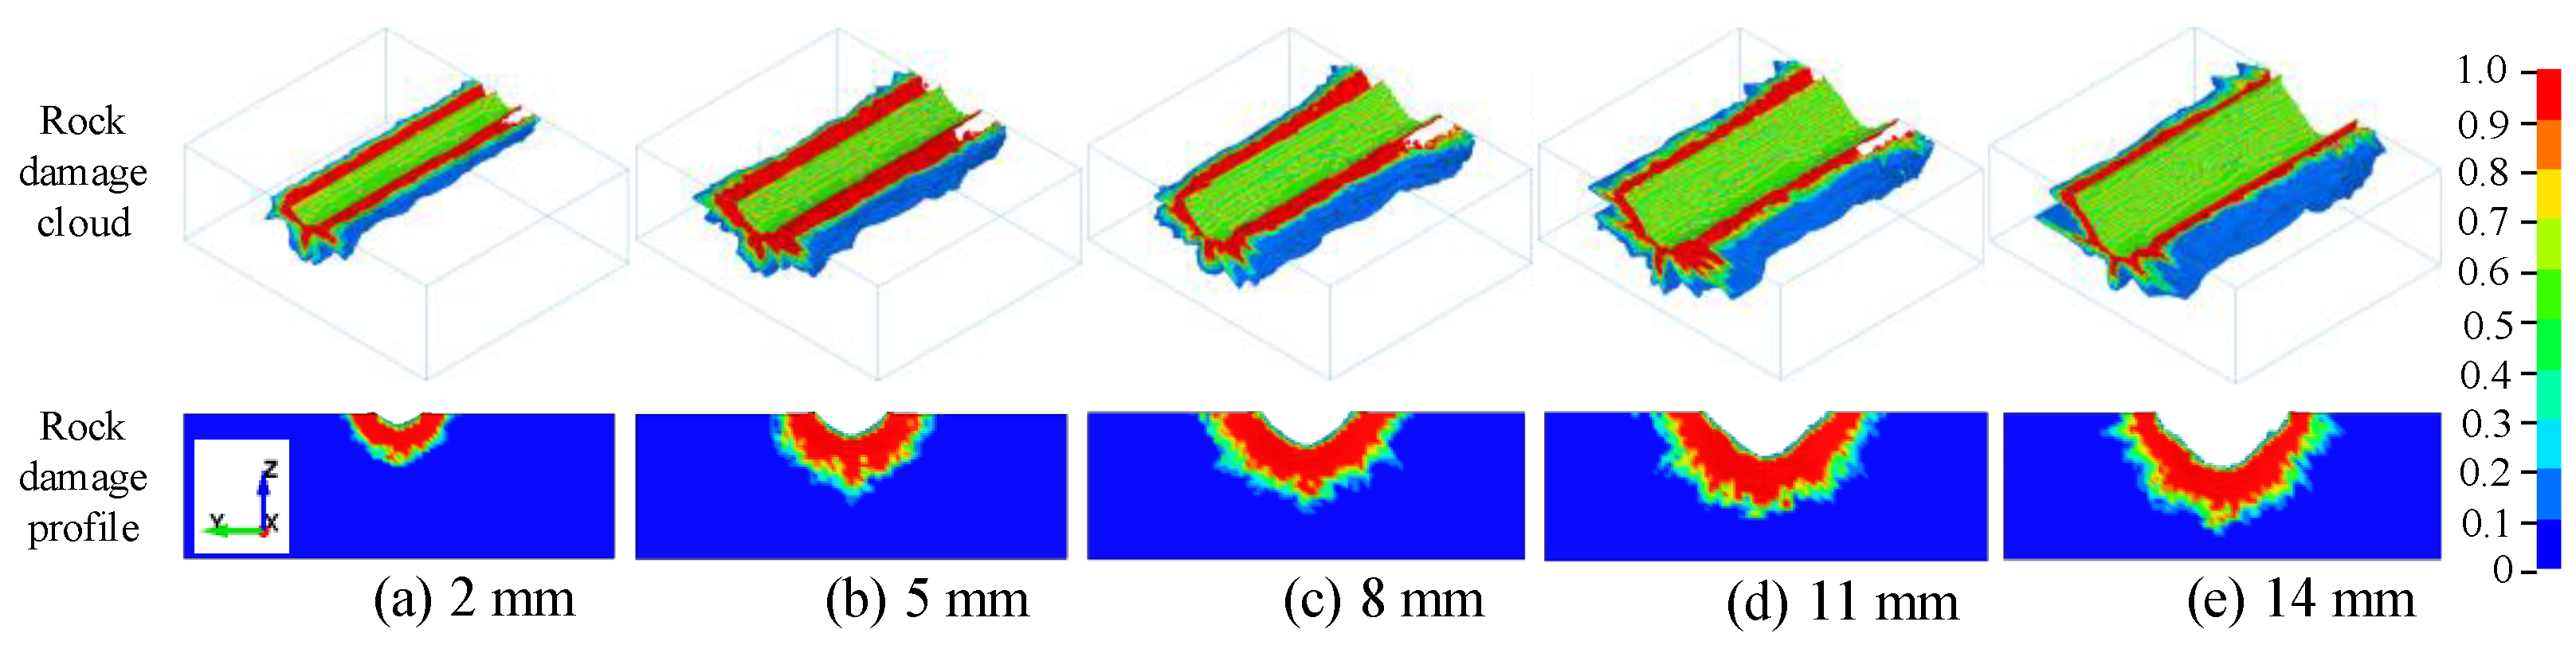
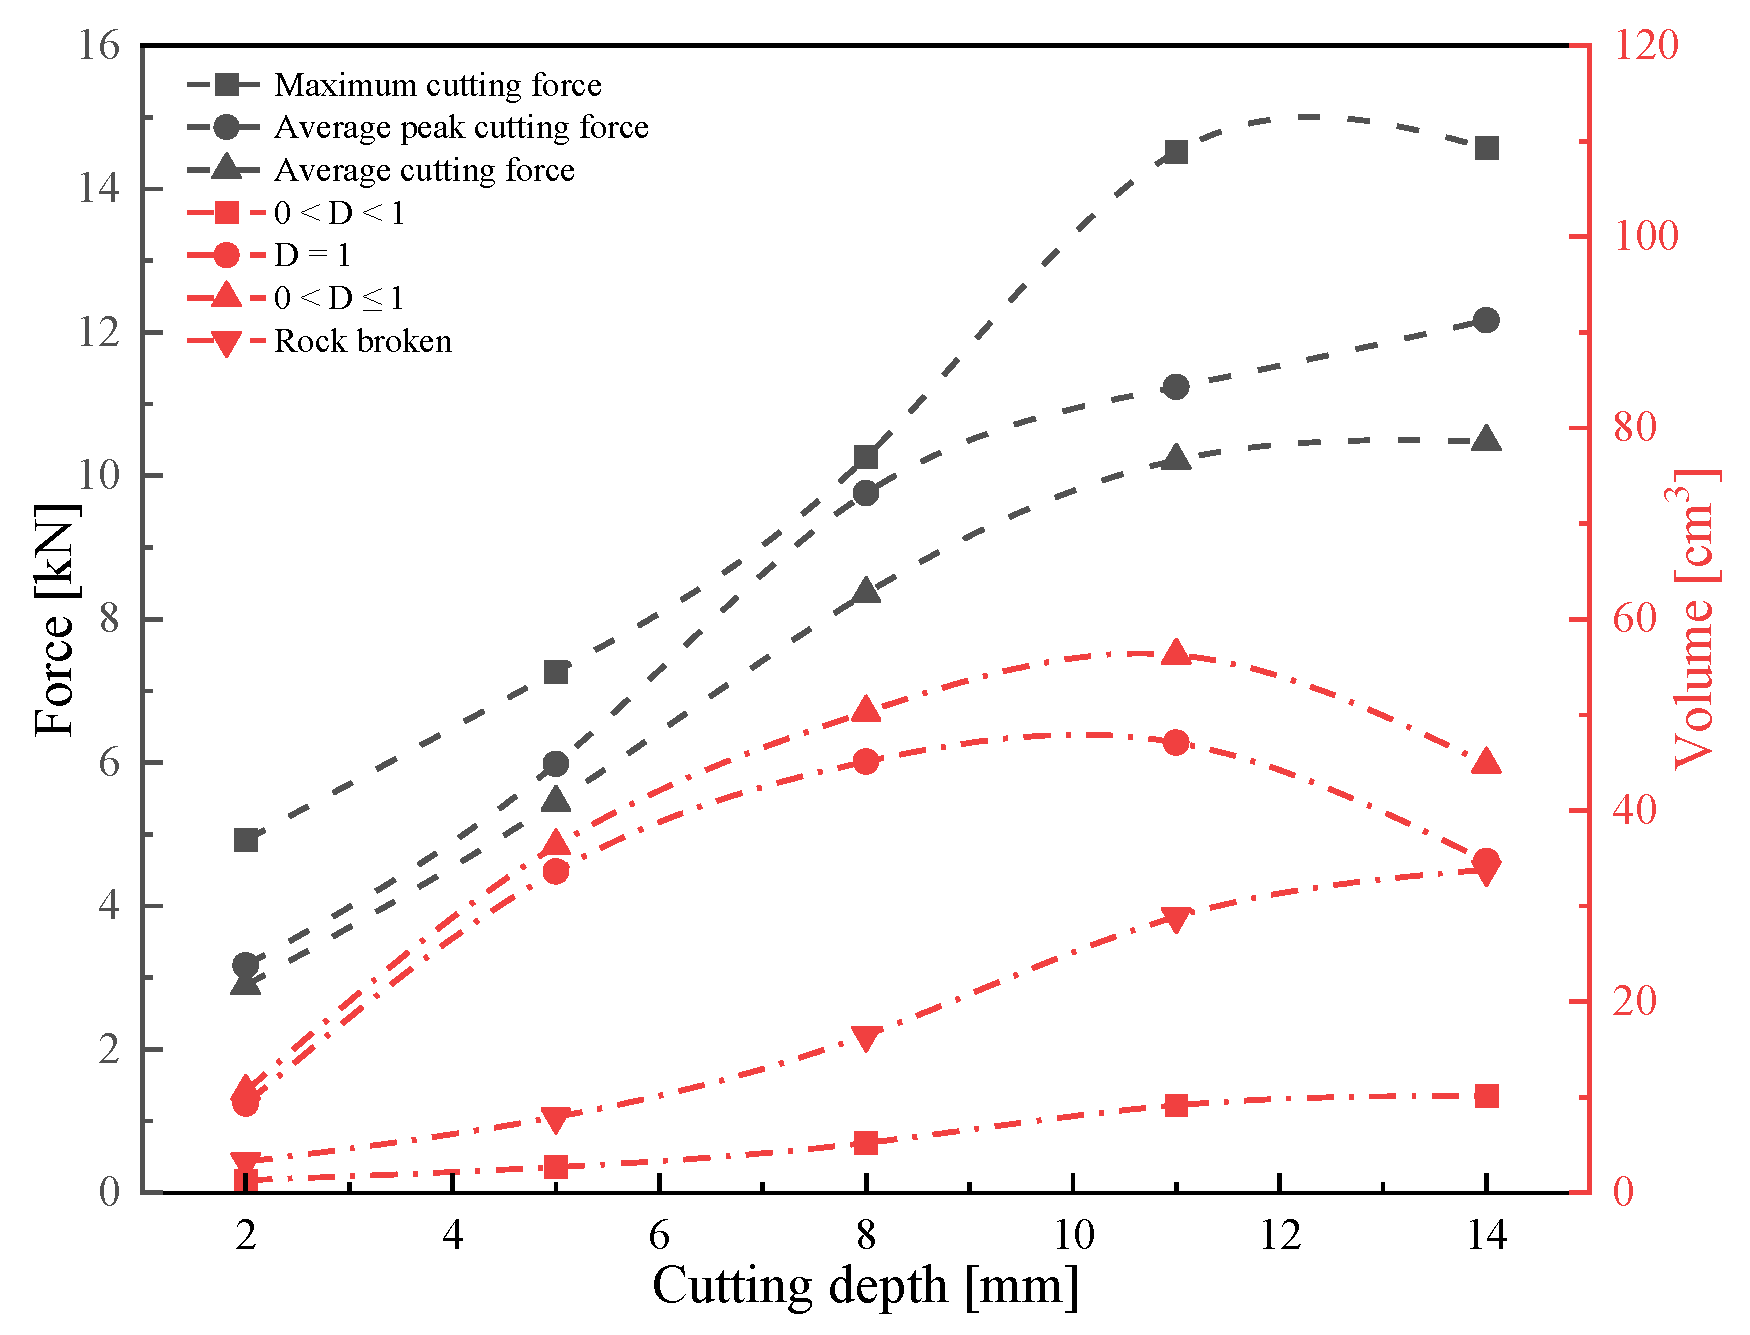
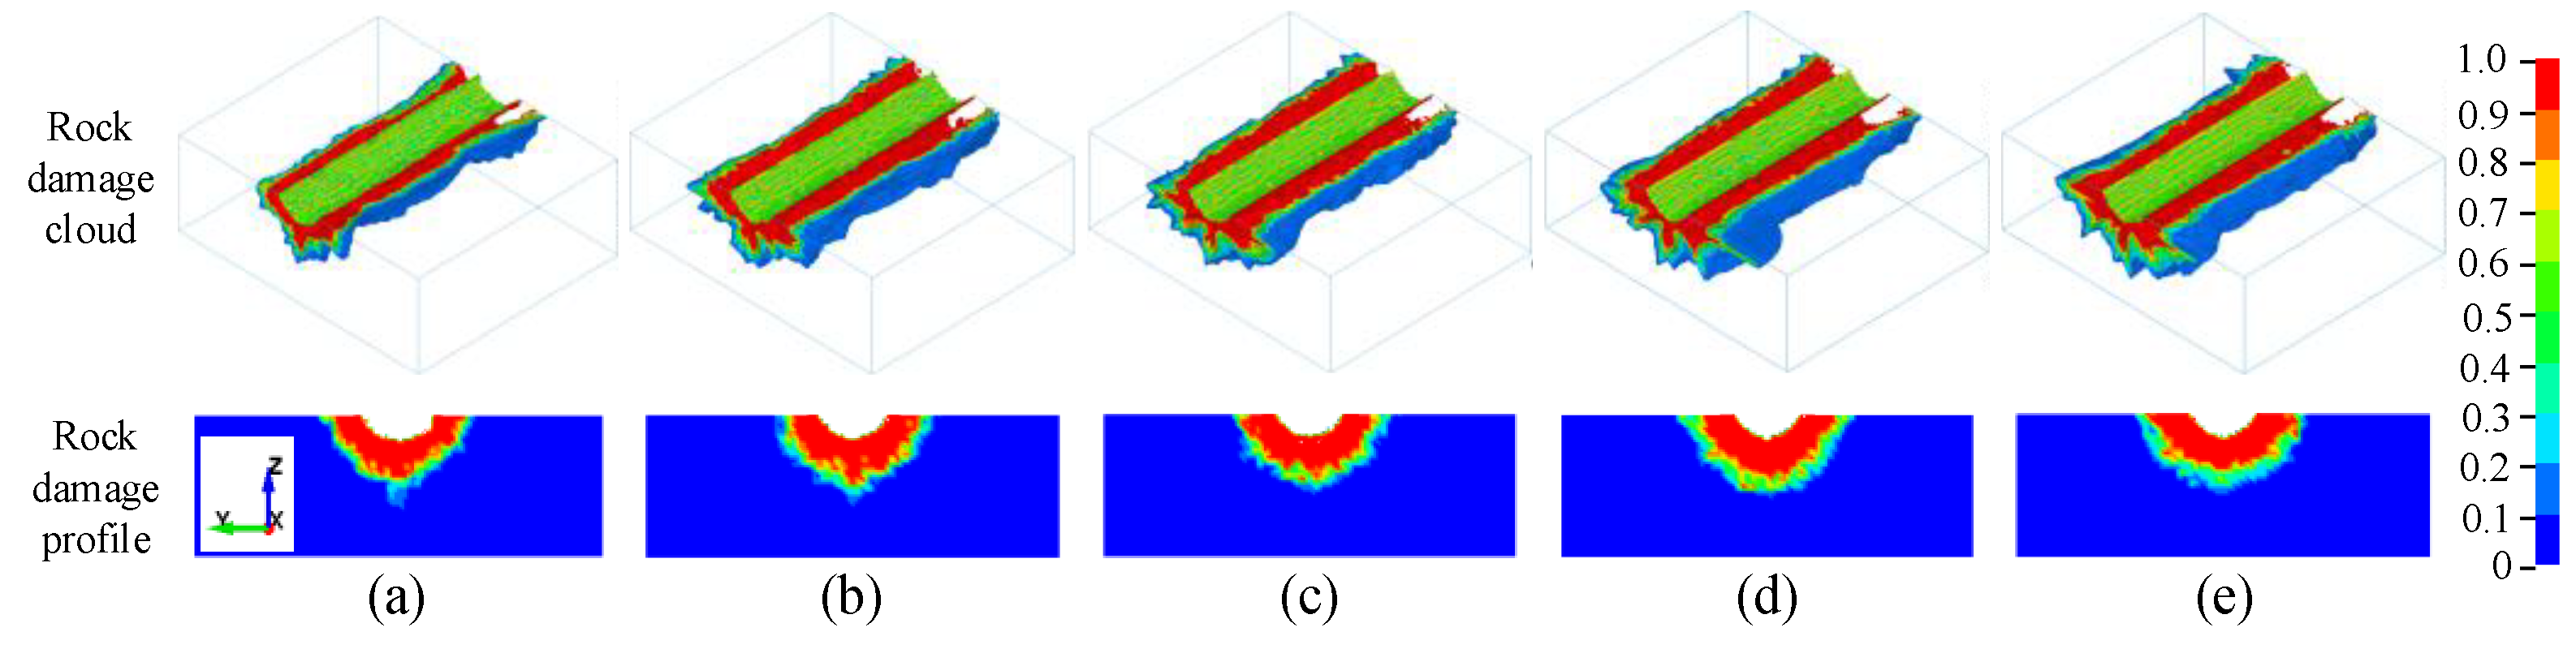
4.2. The Effect of Cutting Depth on Cutting Performance and Rock Damage

The conical pick cut the rock with a cutting angle of 55°, cutting speed of 3 m/s, and cutting depth of 2, 5, 8, 11 and 14 mm to study the effect of cutting depth on cutting performance. The cutting force curves of different cutting depths are shown in Figure 13. The cutting force curves of the conical pick at varying cutting depths are different, and the cutting force fluctuation is different. As the cutting depth increases, the average peak cutting force increases, and the interaction area between the conical and rock increases, which causes cutting resistance and friction for the conical pick.
The rock damage nephograms of conical pick rock-cutting with different cutting depths are shown in Figure 14. The crushing area of the rock is different under different cutting depths. The crushing volume tends to increase with increasing cutting depth, and the range of rock damage near the rock fracture area is different. The area of rock damage is located around the conical pick and rock interaction point. The damage scope extends outward, centered on the contact part between the pick tip and rock, forming a semicircular area viewed along the cutting direction. However, the rock damage range expansion changes with increasing cutting depth. On the free surface of the rock, the rock damage expends, showing a trend of first increasing and then decreasing with the increase in cutting depth. The expansion of the radius of the damaged area along the direction of the cutting depth increases first and then decreases. Therefore, the rock damage value increases first and then decreases.
Statistical analyses of the conical pick cutting force under different cutting depths, fitting curves of the maximum cutting force, average peak cutting force and average cutting forces with various cutting depths are shown in Figure 12. The average peak cutting force, maximum cutting force, and average cutting force of the pick increase gradually with the increase in cutting depth. Due to the structure and size of the pick, when the cutting depth increases to a certain extent, limited by the size of the pick, the contact area between the pick and the rock will not increase, and then the rock-breaking volume of the pick will not increase significantly. The cutting depth of the pick has an obvious impact on the rock-breaking mechanical properties of the pick. When the cutting depth is less than 11 mm, the pick force increases significantly with the increase in the cutting depth. Although increasing the cutting depth is conducive to rock crushing, it will increase the size and fluctuation of the pick force.
The statistics analyze rock damage and breakage with different cutting depths and fit the curves between rock damage volume and rock breakage with various cutting depths, as shown in Figure 15. With increasing cutting depth, the volume of rock damage rises first and then decreases, but the volume of rock breakage increases gradually. The volume of rock damage with a value of 1 accounts for a large proportion of the total volume of rock damage, and the part with a damage value of less than 1 accounts for a small proportion. With increasing cutting depth, the volume of rock damage with a value of 1 increases first and then decreases, and the volume of rock damage with a damage value less than 1 increases gradually, but the increased range decreases. The rock cutting depth has a great impact on rock damage volume; the rock damage volume increases first and then decreases, and the rock breakage volume increases. The average cutting force and average peak cutting force increase with increased cutting depth. The volumes of rock breakage and damage are smaller when the cutting depth is small. Therefore, the cutting depth should not be small. Meanwhile, increasing the cutting depth could increase the breakage volume such that the average peak cutting force and the average cutting force will increase. Additionally, the results of the conical pick rock-cutting with various cutting depths are similar to that of Lu et al. [30].

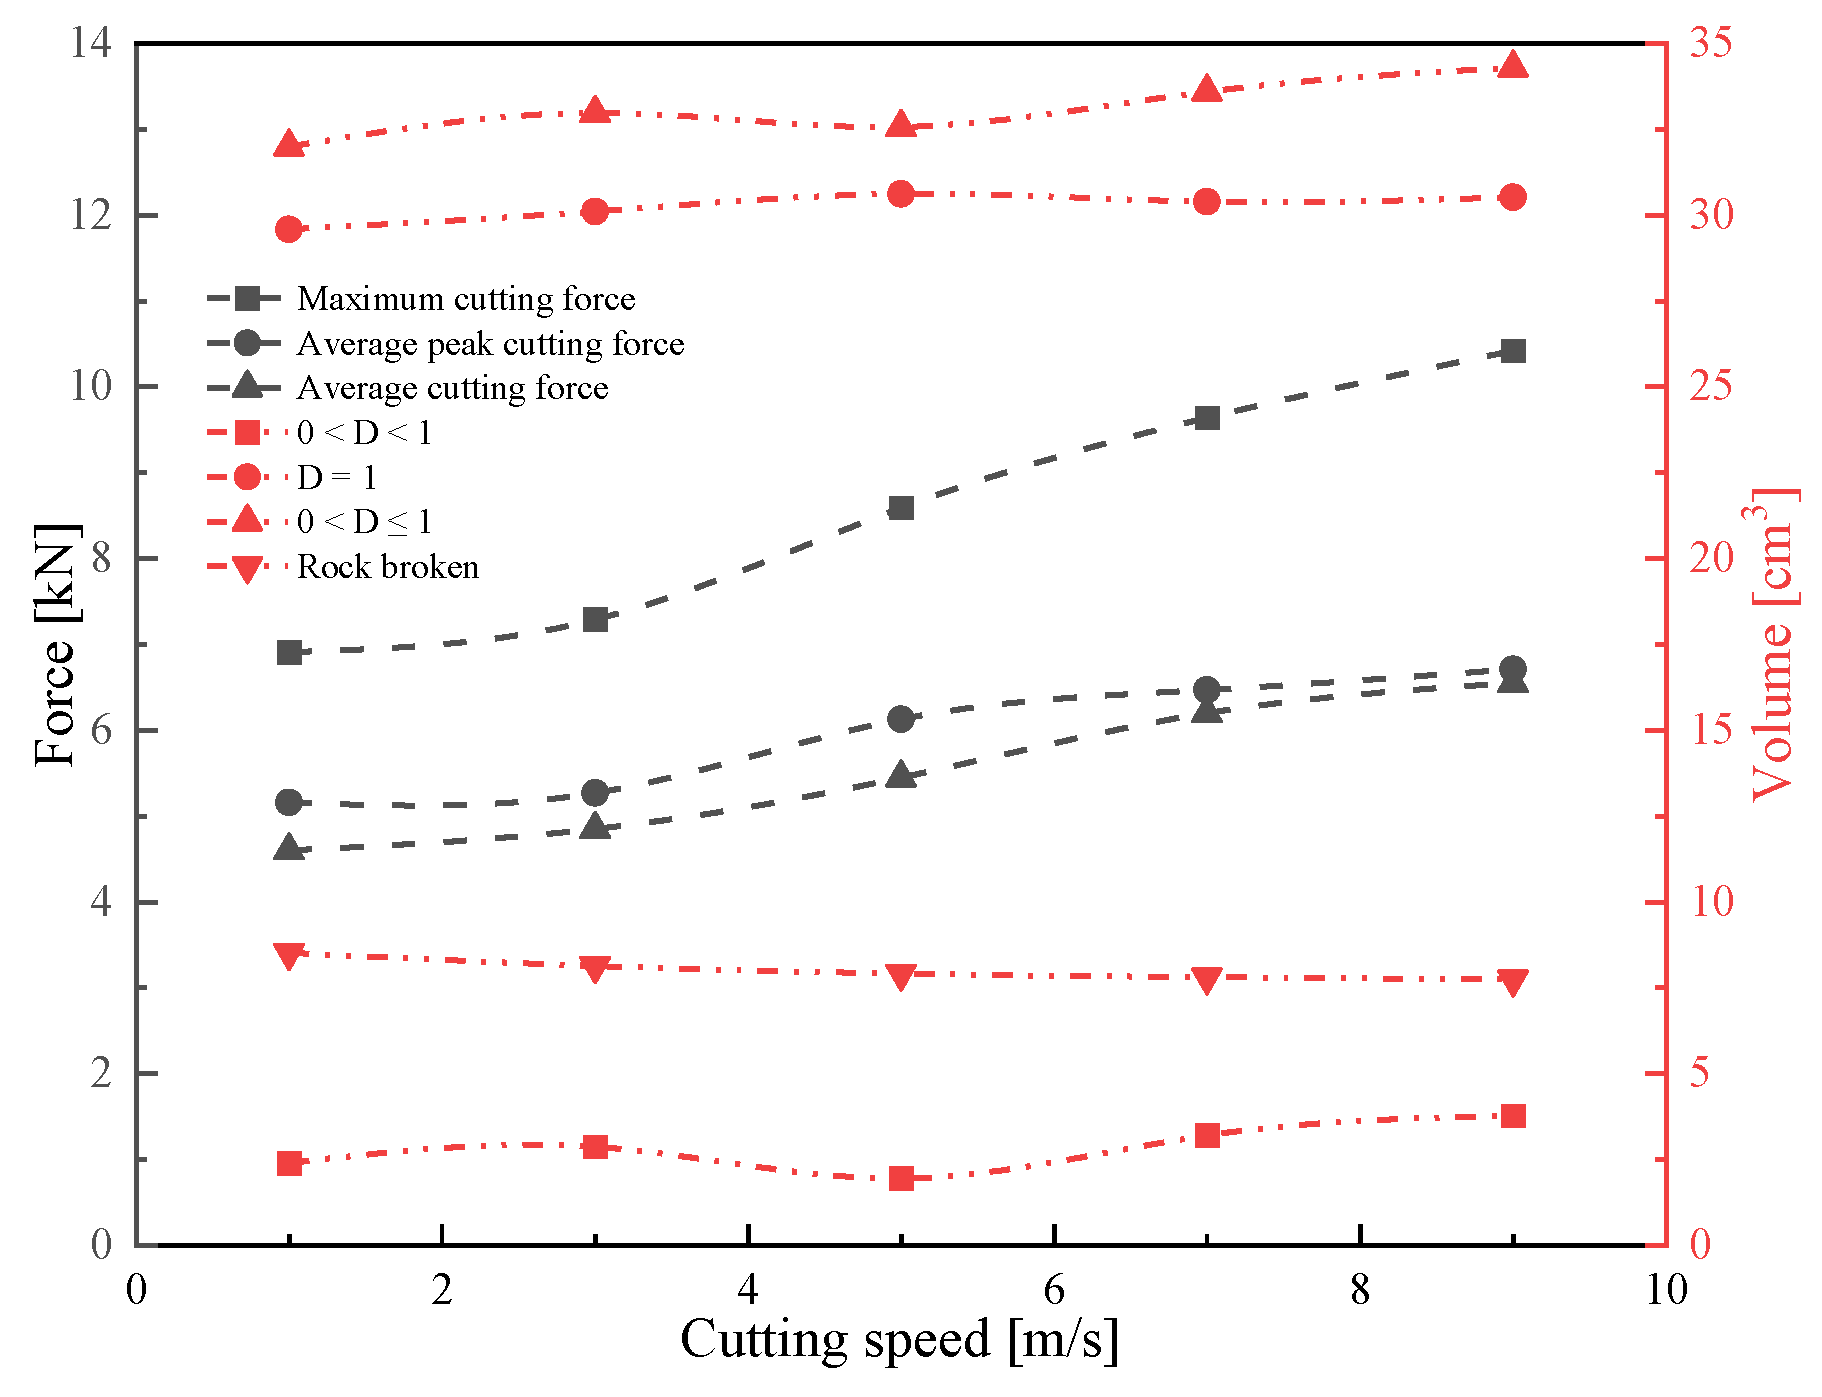
4.3. The Influence of Cutting Speed on Cutting Performance and Rock Damage

The conical pick cut rock with a cutting angle of 55°, cutting depth of 5 mm, and cutting speed of 1, 3, 5, 7, and m/s. The cutting force curves of conical pick rock-cutting with different cutting speeds are shown in Figure 16. There are some differences in the cutting force curve fluctuations. With increasing cutting speed, the cutting force curves’ fluctuation will be gentle.
The rock damage clouds with different cutting speeds are shown in Figure 17. The rock breakage area on the free surface changes little. The cutting speed of the conical pick has a great effect on rock damage and the rock damage area near the breakage area. According to the rock damage cloud profile, the rock damage area is located around the pick-crushing area. The rock damage range is roughly centered on the crushing area. It extends outward with a certain radius, similar to a semicircular area viewed along the pick’s cutting direction. With increasing cutting speed, the area of rock damage with a value between 0 and 1 tends to increase at the outer end face. However, the area with a damage value of 1 is not obviously affected by the change in cutting speed, and the trend of the rock volume proportion with a damage value of 1 remains unchanged.
The volume of rock damage with a damage value of 1 accounts for a large proportion of the total volume of rock damage volume, and the part with a damage value of less than 1 accounts for a small proportion. The whole rock damage volume has changed with the increase in cutting speed. The total volume of rock damage increases with increasing cutting speed, but the increased range is relatively small. The rock breakage crushing volume tends to decrease as cutting speed rises, according to Figure 17 and Figure 18. The sliding friction coefficient between the pick and the rock is reduced mainly due to the increase in cutting speed. The cutting speed increasing has a certain impact on the strain rate of the rock in that it increases the compressive force on the rock and reduces the crushing volume.
The fitting curves are shown in Figure 18 to research the relationship between the average cutting force, average peak cutting force, maximum cutting force and cutting speed. The average cutting force and peak cutting force have no apparent changes when cutting speeds are less than 3 m/s. However, the average cutting force and average peak cutting force have large differences, which is caused by the peak cutting force fluctuating violently. According to the formula for the calculation of the average peak cutting force, a peak cutting force less than the average cutting force does not participate in the calculation. As the cutting speed increases, the fluctuation in the cutting force decreases, and the difference between the average cutting force and the average peak cutting force decreases. The average peak cutting force increases as the cutting speed increases when the cutting speed is more than 3 m/s, but the increased range gradually decreases. At a higher cutting speed, the pick will have a certain impact on the strain rate of the rock, and the strain rate will change the dynamic strength of the rock. The dynamic strength of the rock is not affected under low strain rates, but under a certain strain rate, the rock’s tensile strength and compressive strength will increase. The cutting speed of the pick is positively correlated with the loading rate, and the strain rate of the rock is positively correlated with the loading rate. Therefore, an increase in pick cutting speed will increase rock strain rate and dynamic strength, change the physical properties of the rock, increase its compressive and tensile strength, and then increase the pick force.

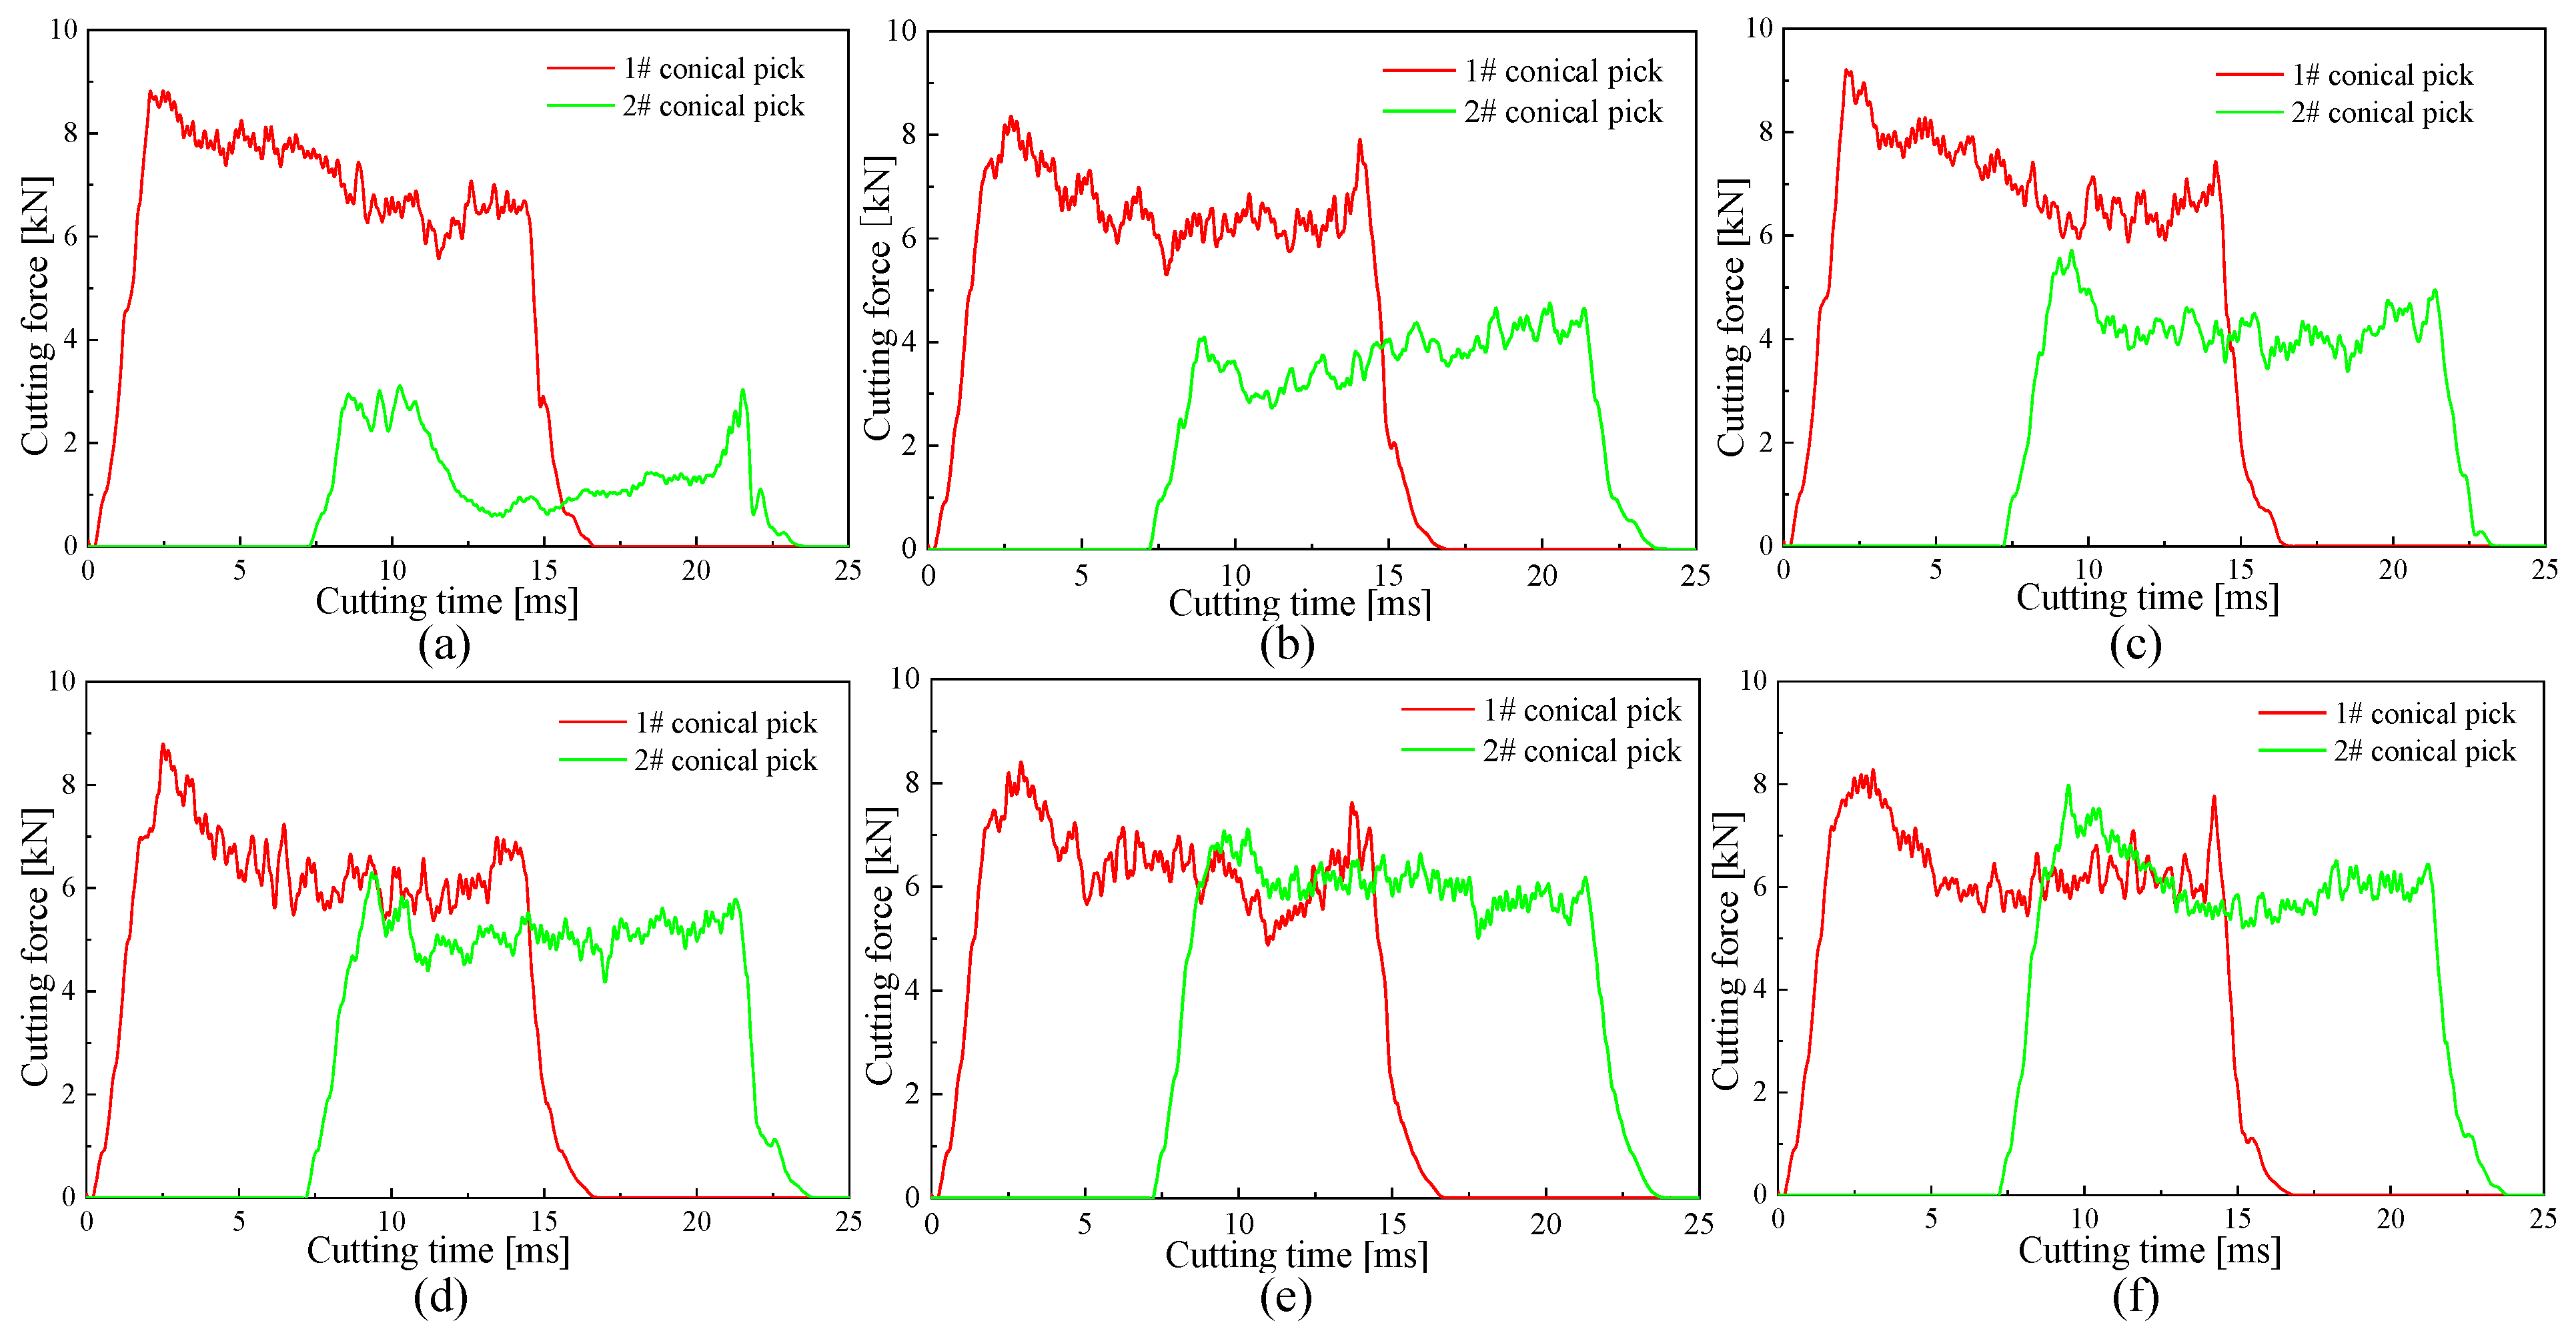
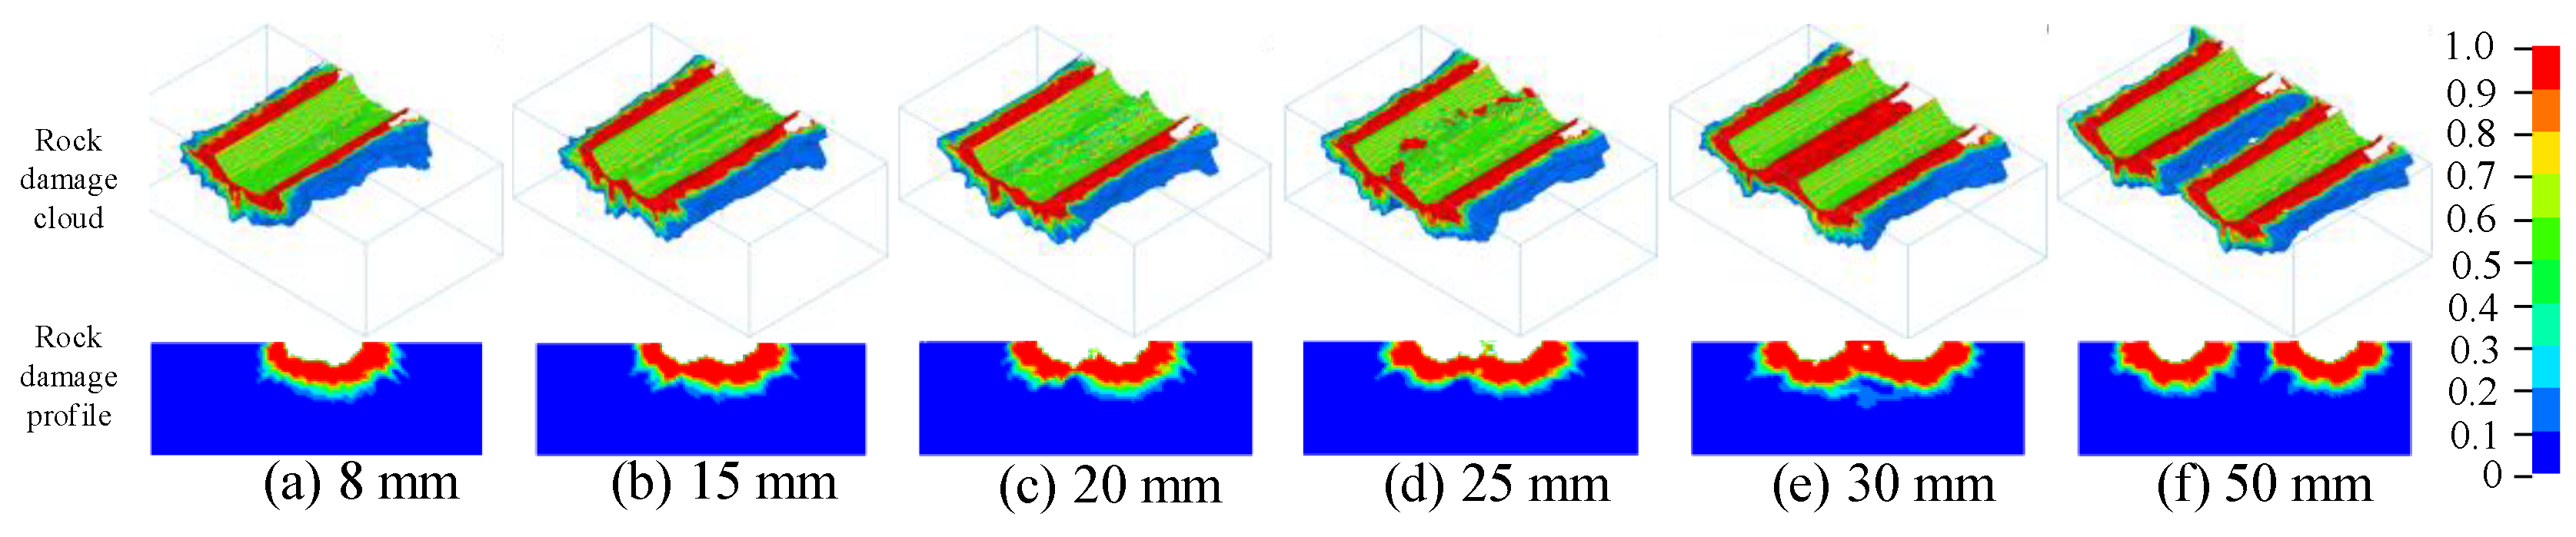
4.4. The Influence of the Distance between Double Conical Picks on Cutting Performance and Rock Damage

The conical picks cut rock with a cutting speed of 3 m/s, cutting angle of 55°, and cutting depth of 5 mm. The distance between the double conical picks was set as 50 mm along the X-axis and 8, 15, 20, 25, 30 and 50 mm along the Y-axis to analyze the influence of the distance between double conical picks on cutting performance and rock damage. The cutting force curves of double conical picks with different distances between them are shown in Figure 19. The cutting force curve of the conical pick increases when the conical pick contacts the rock. As the cutting distance increases, the cutting force curve increases sharply, and the fluctuation of the cutting force curve is relatively stable. The fluctuation of the curve of the cutting force of the double conical picks is different. The distance between double conical picks along the Y-axis greatly affects the fluctuation of the curve of the cutting force. When the distance is less, the second conical pick’s cutting force curve has a large fluctuation caused by the smaller distance between the double conical picks. The second conical pick will repeat the cutting process of the first conical pick. As the distance between the conical picks increases, the influence of the distance between the double conical picks decreases, becoming an uncorrelated cutting mode; the fluctuation of the curve of the cutting force of the second conical pick is similar to the first conical pick.
The distance between double conical picks affects the cutting force greatly; as the cutting distance increases, the cutting force of the first conical pick increases gradually, but the cutting force of the second conical pick demonstrates no change. As the distance between double conical picks increases, the volumes of rock damage and rock breakage increase first and are still stable, as shown in Figure 20.
The fitting curves between the cutting force, volume of rock damage and volume of rock breakage and the distance between conical picks along the Y-axis are shown in Figure 21. With the increase in pick spacing, the maximum peak force of the second conical pick increases gradually, and the average peak cutting force and average cutting force of the pick also increase gradually, but the increased range decreases. When the distance between the double conical picks increases to 50 mm, the average peak cutting force does not increase significantly compared with the distance between 30 mm. In the rock-cutting process with double conical picks, when increasing the distance between double conical picks, the second conical pick cutting mode transforms from a correlated cutting mode to an uncorrelated cutting mode. The increasing interaction area between the conical picks and the rock causes the cutting force to increase. Additionally, when the distance between double conical picks increases to a certain value, the cutting force of the second conical pick does not obviously change.

5. Conclusions

We establish a single conical pick and double conical pick linear rock-cutting rock numerical simulation based on the RHT constitutive model to investigate the effect of the cutting speed, cutting depth, cutting angle and distance between double conical picks on cutting performance and rock damage. The numerical simulation results show that under certain cutting conditions, the average peak cutting force of the conical pick increases with increasing cutting speed, cutting depth and pick spacing, but the increased amplitude decreases gradually. With the increase in the cutting angle, the average peak force of the pick decreases first and then increases. The cutting depth, angle, and distance between double conical picks greatly impact rock damage and crushing. With the increase in cutting depth, the rock damage volume first increases and then decreases, and the crushing volume gradually increases. However, the increasing range first increases and then decreases. The range of rock damage and fracture decreases gradually by increasing the cutting angle. With the increase in pick spacing, the rock damage volume and crushing range first increase and then decrease. The conclusion provides a basis for pick arrangement and the selection of reasonable cutting parameters.

Author Contributions

Conceptualization, Z.W. and Q.Z.; methodology, Q.Z.; software, Z.L.; validation, L.W. and H.W.; data curation, H.W.; writing—original draft preparation, Z.W.; writing—review and editing, Q.Z.; funding acquisition, Q.Z. and Z.L. All authors have read and agreed to the published version of the manuscript.

Funding

This work was supported by the projects of the Key Research and Development Project of China (Grant No. 2017YFC0603000), the Natural Science Foundation of Shandong Province (Grant No. ZR2019BEE069) and the National Natural Science Foundation of China (Grant No. 51974170).

Data Availability Statement

The data used to support the findings of this study are included within the article.

Conflicts of Interest

The authors declare no conflict of interest.

References

  1. Evans, I. A theory of the cutting force for point-attack picks. Int. J. Min. Eng. 1984, 2, 63–71. [Google Scholar] [CrossRef]
  2. Goktan, R.; Gunes, N. A semi-empirical approach to cutting force prediction for point attack picks. J. South Afr. Inst. Min. Metall. 2005, 105, 257–263. [Google Scholar]
  3. Shao, W. A Study of Rock Cutting with Point Attack Picks; The University of Queensland: St Lucia, QLD, Australia, 2016. [Google Scholar]
  4. Shao, W.; Li, X.; Sun, Y.; Huang, H. Parametric study of rock cutting with SMART∗CUT picks. Tunn. Undergr. Space Technol. 2017, 62, 134–144. [Google Scholar] [CrossRef]
  5. Copur, H.; Bilgin, N.; Balci, C.; Tumac, D.; Avunduk, E. Effects of different cutting patterns and experimental conditions on the performance of a conical drag tool. Rock Mech. Rock Eng. 2017, 50, 1585–1609. [Google Scholar] [CrossRef]
  6. Hekimoglu, O.; Ozdemir, L. Effect of angle of wrap on cutting performance of drum shearers and continuous miners. Min. Technol. 2013, 113, 118–122. [Google Scholar] [CrossRef]
  7. Kotwica, K.; Malkowski, P. Methods of Mechanical Mining of Compact-Rock—A Comparison of Efficiency and Energy Consumption. Energies 2019, 12, 3562. [Google Scholar] [CrossRef] [Green Version]
  8. Saurabh, D.; Somnath, C.; Sergej, H. Critical Damage Analysis of WC-Co Tip of Conical Pick due to Coal Excavation in Mines. Adv. Mater. Sci. Eng. 2015, 2015, 292046. [Google Scholar]
  9. Saurabh, D. On the Critical Assessment into Damage Behavior of a WC–Co Hard Metal Alloy Used in the Form of Rock Drill Bits. J. Fail. Anal. Prev. 2019, 19, 461–470. [Google Scholar]
  10. Saurabh, D.; Someath, C. Critical Analysis of Wear Mechanisms in Cemented Carbide. J. Mater. Eng. Perform. 2015, 24, 2628–2636. [Google Scholar]
  11. Saurabh, D.; Somnath, C.; Sergej, H. Wear Assessment of Conical Pick used in Coal Cutting Operation. Rock Mech. Rock Eng. 2015, 48, 2129–2139. [Google Scholar]
  12. Krauze, K.; Mucha, K.; Wydro, T.; Pieczora, E. Functional and Operational Requirements to Be Fulfilled by Conical Picks Regarding Their Wear Rate and Investment Costs. Energies 2021, 14, 3696. [Google Scholar] [CrossRef]
  13. Krauze, K.; Mucha, K.; Wydro, T.; Klempka, R. Assessment of the Structure of Cutting Heads with Regard to the Mining Machine Load Using Proprietary Software. Energies 2022, 15, 6886. [Google Scholar] [CrossRef]
  14. Mucha, K.; Augustyn-Nadzieja, J.; Szczotok, A.; Krauze, K. An Improved Procedure for the Quality Control of Sintered Carbide Tips for Mining Applications, Based on Quantitative Image Analysis of the Microstructure. Materials 2021, 14, 1236. [Google Scholar] [CrossRef] [PubMed]
  15. Deng, J.; Gu, D. On a statistical damage constitutive model for rock materials. Comput. Geosci. 2011, 37, 122–128. [Google Scholar] [CrossRef]
  16. Abouzar, V. An improved unified constitutive model for rock material and guidelines for its application in numerical modelling. Comput. Geotech. 2016, 80, 261–282. [Google Scholar]
  17. Huang, H.; Lecampion, B.; Detournay, E. Discrete element modeling of tool-rock interaction I: Rock cutting. Int. J. Numer. Anal. Methods Geomech. 2013, 37, 1913–1929. [Google Scholar] [CrossRef]
  18. Rojek, J. Discrete element modeling of rock cutting. Comput. Methods Mater. Sci. 2007, 7, 224–230. [Google Scholar]
  19. Jaime, M.; Zhou, Y.; Lin, J.; Gamwo, I.K. Finite element modeling of rock cutting and its fragmentation process. Int. J. Rock Mech. Min. Sci. 2015, 80, 137–146. [Google Scholar] [CrossRef] [Green Version]
  20. Menezes, P. Influence of cutter velocity, friction coefficient and rake angle on the formation of discontinuous rock fragments during rock cutting process. Int. J. Adv. Manuf. Technol. 2016, 90, 3811–3827. [Google Scholar] [CrossRef]
  21. Fourmeau, M.; Kane, A.; Hokka, M. Experimental and numerical study of drill bit drop tests on Kuru granite. Philos. Trans. 2017, 375, 20160176. [Google Scholar] [CrossRef] [Green Version]
  22. Zhou, Y.; Lin, J. Modeling the ductile–brittle failure mode transition in rock cutting. Eng. Fract. Mech. 2014, 127, 135–147. [Google Scholar] [CrossRef]
  23. Li, X.; Lv, Y.; Jiang, S. Effects of spiral line for pick arrangement on boom type roadheader cutting load. Int. J. Simul. Model. IJSIMM 2016, 15, 170–180. [Google Scholar] [CrossRef]
  24. Zhu, L.; Wei, T.; Liu, B.; Yu, T. Simulation analysis of rock braking mechanism of tunnel boring achine. Teh. Vjesn. 2016, 23, 169342. [Google Scholar]
  25. Roxborough, F.; Liu, Z. Theoretical considerations on pick shape in rock and coal cutting. In Proceedings of the sixth underground operator’s conference, Kalgoorlie, WA, Australia, 13–14 November 1995; Golosinski, T.S., Ed.; pp. 189–193. [Google Scholar]
  26. Zhang, Y. Design and Implementation of License Plate Image Recognition Based on MATLAB. Inf. Commulation 2019, 11, 79–81. [Google Scholar]
  27. Wang, W.; Ding, J.; Wang, P.; Lu, Z. Research on the image recognition of target sheet with MATLAB. Computer Era 2016, 11, 17–20+24. [Google Scholar]
  28. Liu, K. The Study on Image Recognition of Coal ang Gangue Boiundary Signatures Based on the Fractional Calculus; China University of Mining and Technology: Beijing, China, 2018. [Google Scholar]
  29. Zeng, Q.; Wang, Z.; Lu, Z.; Wan, L.; Liu, Z.; Zhang, X. Research on cutting performance and fatigue life of conical pick in cutting rock process. Sci. Prog. 2021, 104, 1–29. [Google Scholar] [CrossRef]
  30. Lu, Z.; Wan, L.; Zeng, Q.; Zhang, X.; Gao, K. Numerical Simulation of Fragment Separation during Rock Cutting Using a 3D Dynamic Finite Element Analysis Code. Adv. Mater. Sci. Eng. 2017, 2017, 3024918. [Google Scholar] [CrossRef]
Figure 1. The conical pick rock-cutting model.
Machines 10 01034 g001
Figure 2. Quantitative analysis of rock damage: (a) the rock damage legend, (b) RGB values and channel values and pixel statistics.
Machines 10 01034 g002
Figure 3. Diagram of the RHT material strain and hardening effect.
Machines 10 01034 g003
Figure 4. The numerical simulation model of a conical pick cutting rock.
Machines 10 01034 g004
Figure 5. The experimental test bench of conical pick rock-cutting.
Machines 10 01034 g005
Figure 6. The results of conical pick rock-cutting numerical simulation.
Machines 10 01034 g006
Figure 7. The interface of statistical rock damage software.
Machines 10 01034 g007
Figure 8. The verification pictures of damage statistics software.
Machines 10 01034 g008
Figure 9. The cutting force curves of conical pick with different cutting angles.
Machines 10 01034 g009
Figure 10. The rock damage cloud with different cutting angles.
Machines 10 01034 g010
Figure 11. The relationship between cutting angle and rock cutting area.
Machines 10 01034 g011
Figure 12. The rock damage and broken volume with various cutting angles.
Machines 10 01034 g012
Figure 13. The cutting force curves with the different cutting depths.
Machines 10 01034 g013
Figure 14. The rock damage nephogram with different cutting depths.
Machines 10 01034 g014
Figure 15. The rock damage and rock volume with various cutting depths.
Machines 10 01034 g015
Figure 16. The cutting force curves with different cutting speeds.
Machines 10 01034 g016
Figure 17. The rock damage clouds with different cutting speeds. (a) 1 m/s, (b) 3 m/s, (c) 5 m/s, (d) 7 m/s, (e) 9 m/s.
Machines 10 01034 g017
Figure 18. The rock damage and broken volume with various cutting speeds.
Machines 10 01034 g018
Figure 19. The cutting force curves of double conical picks with different distances: (a) 8 mm, (b) 15 mm, (c) 20 mm, (d) 25 mm, (e) 30 mm, and (f) 50 mm.
Machines 10 01034 g019
Figure 20. The rock damage cloud of the distances between double conical picks.
Machines 10 01034 g020
Figure 21. The forces and volumes of damaged and broken rock with various distances between double conical picks.
Machines 10 01034 g021
Table 1. Rock material key parameters.
ParametersCompressive Strength (MPa)Tensile Strength (MPa)Density (kg/m3)Poisson’s Ratio
Value141.206.672564.760.209
Table 2. The verification results of different pictures.
PictureThe Proportion of Each Color in the Whole Picture
Picture a0.04030.04040.04030.04050.0404000
Picture b0.10160.10140.10130.10060.1010000
Picture c0.00410.00510.00730.00610.00690.01180.15390.2112
Publisher’s Note: MDPI stays neutral with regard to jurisdictional claims in published maps and institutional affiliations.

