Article

The Dexterity Capability Map for a Seven-Degree-of-Freedom Manipulator

1
Technology and Engineering Center for Space Utilization, Chinese Academy of Sciences, Beijing 100094, China
2
School of Engineering Science, University of Chinese Academy of Sciences, Beijing 100049, China
*
Author to whom correspondence should be addressed.
Machines 2022, 10(11), 1038; https://doi.org/10.3390/machines10111038
Submission received: 13 October 2022 / Revised: 30 October 2022 / Accepted: 3 November 2022 / Published: 7 November 2022
(This article belongs to the Section Robotics, Mechatronics and Intelligent Machines)

Abstract

:
For a grasping task planner, the pre-planning of the reachable tip pose in a manipulator’s workspace is important. On this basis, for a seven-degree-of-freedom (7-DOF) redundant manipulator, it is very meaningful to study how to give full play to its redundant characteristics to achieve more dexterous grasping. In this paper, through the improved shape primitive method, the reachability spheres of the 7-DOF manipulator studied were more accurately captured, and a more accurate reachability capability map was generated. Then, based on the idea of redundancy angle discretization, the concept of the obstacle avoidance ability (OAA) index is innovatively proposed to measure the dexterity of the grasping task of the manipulator in a certain tip pose. Based on the OAA index axis, the distribution of the OAA index in each reachability sphere was analyzed. The prediction models of the OAA index of all reachability spheres in the workspace of the manipulator were obtained by the Levenberg–Marquardt algorithm and finally formed a dexterity capability map of the manipulator, which provides a new idea for the pre-planning of the dexterous grasping task of the redundant manipulator. Finally, we give the general frameworks of different grasping pre-planning by combining two kinds of capability maps and verify the effect.

1. Introduction

Human infants try to perform grabbing actions with their arms and accumulate experience in this process. In known scenarios, our brains can efficiently determine whether the grasping direction is feasible, and the process is empirical. Moreover, the grasping position and direction that the brain is more willing to choose often indicate that the arm has higher flexibility in this pose to cope with a complex environment. The realization of the above behavior comes from the brain’s accumulation of experience in the reachability and dexterity of the arm, and it forms an arm capability map to plan various grasping actions. For a 7-DOF manipulator, if it has a capability map, which stores the reachability and dexterity [1] information of the manipulator, it can effectively guide the manipulator to realize the grasping task planning in the regions where the hand tool center point (TCP) can be placed.
The most intuitive definition of manipulator workspace reachability is the workspace density proposed by Ebert [2]. He calculated the number of TCPs reaching the sub-workspace by equidistant sampling of each joint angle. The reachability of a manipulator in each sub-workspace is evaluated by the ratio of the number of TCPs to the volume of the sub-workspace. However, this method can only reflect the reachability preference of TCPs, and the guidance of grabbing actions lacks direction information. The manipulability ellipsoid in m-dimensional Euclidean space introduced by Yoshikawa [3] was designed to quantify the ease of arbitrarily changing the position and direction of the end-effector. Vahrenkamp [4,5] used extended manipulability measure to construct a quality distribution in the workspace, where he introduced the penalization function to reflect the impact of obstacles or joint limits. Xu [6] took the global manipulability based on the capability map as the quality index and extended some general manipulability indexes to the whole collaborative workspace to construct the capability mapping to find the optimal grasping posture. However, the manipulability measure itself is non-directional, so its direction preference cannot be identified. By optimizing the ratio of the global maximum and minimum singular values of the Jacobian matrix in the whole workspace, Stocco et al. [7] obtained the motion anisotropy measure in the workspace of the manipulator and obtained the global version of the condition number in the whole workspace. However, the condition number only represents the uniformity of the Jacobi matrix in all directions, and for a grasping task, it is undoubtedly the most meaningful to obtain the directional preference of the end-effector of the manipulator. When the manipulator tends to a certain configuration, the method of Stocco can only reflect whether the motion ability of each approaching direction is uniform and does not give a clear motion direction preference.
To solve the problem of the insufficient description of direction preference by the above methods, the reachability capability map proposed by Zacharias [8] stores the reachability information of tip poses in the workspace of the manipulator in the data structure, which can provide an efficient judgment for whether the tip pose to be detected is reachable. Then, Zacharias [9] combined Borst’s grasping planner [10] to complete the planner based on reachability capability map and analyzed the influence of obstacles on reachability in the workspace, then confirmed the applicability of this method in humanoid robots and multi-manipulator systems [11]. Ruehl [12] introduced the concept of graspability to measure the quality of the manipulator’s grasping posture and developed the discrete map of the environment for planning the grasping of objects on a platform. Wu [13] proposed a grasping tip pose generation method based on the Gaussian mixture model (GMM). Through offline training, the GMM of each small 3D voxel was established to describe the distribution of reachable directions. In the online grasping planning phase, sampling can be preferentially performed from areas with high probability of reachability.
However, these methods pre-plan the grasping tasks based on the reachability of the tip poses, and for a redundant manipulator, what role its most important redundancy plays in the grasping action was not considered in previous work. In other words, these methods only reflect the preference for grasping direction, but not for dexterity. Cao [14] considered the feasible arm angle range as a significant value for redundant manipulator dexterity. Then, the posture of the base of the manipulator is changed through the trunk of the humanoid robot; the operation range with higher dexterity is selected, and the dexterity capability map of the working space of the manipulator is reconstructed [15]. However, the self-collision of the manipulator in real situations is not considered, and the dexterity preference of the end-effector is not reflected.
Therefore, this paper aims to propose an index to measure the dexterity of the grasping action. In view of the shortcomings of the discussion above, the calculation process of this index includes the self-collision detection of the studied manipulator. At present, the research results of collision detection are very rich and mature. The collision detection algorithm based on the image space [16] can effectively use graphics hardware to judge the collision of two objects, which has high detection efficiency, but it is a method of exchanging efficiency for accuracy. The space decomposition method [17,18] is only suitable for scenes where objects are evenly distributed and sparse; otherwise, a large number of generated cells will take up much storage space and result in reduced efficiency. Bounding box technology [19] includes the axis-aligned bounding box (AABB) [20,21], bounding sphere [22], oriented bounding boxes (OBBs) [23], K-DOPs [24], etc. According to the shape of the joints and links of the manipulator, we choose appropriate bounding boxes to obtain better accuracy in collision detection. The hierarchical bounding box method is widely used in manipulator collision detection and has the advantage of higher efficiency and accuracy [25,26,27], which is more suitable for building the self-collision detection model in this paper.
Of course, in the obstacle avoidance path planning problem of a manipulator, the algorithm based on fuzzy logic [28] has high popularity and has been proven to be effective in collision-free path planning. In terms of trajectory obstacle avoidance, the obstacle avoidance optimization method based on gradient projection [29,30,31] has the advantage of high efficiency and good real-time performance. The above methods also provide a broad idea for the selection of collision detection methods in this paper.
Therefore, in this paper, we first establish the more accurate reachability capability map of the studied redundant manipulator. Then, we innovatively propose the obstacle avoidance ability index to measure the dexterity of a grasping tip pose of the manipulator and analyze its distribution in each reachability sphere. Finally, we attempt to establish a dexterity capability map for the pre-planning of the dexterous grasping task, and it is combined with the reachability capability map to generate pre-planners for the different grasping scenarios.

2. Analytical Solution of the Manipulator

In this section, we discuss the dexterity of the redundant manipulator under different tip poses, which requires a reasonable inverse kinematics solution method for the manipulator studied in this paper.
The mainstream numerical methods [29,32,33,34,35,36,37] have the problem of slow solution speed and face huge computational costs when analyzing the full workspace. Moreover, the numerical method can only obtain a set of feasible inverse kinematics solutions and can only judge whether the given tip pose is reachable.
Regarding analytical methods of redundant manipulator inverse kinematics, Crane [38] proposed fixing one joint of a 7-DOF manipulator and obtaining the analytical solution of the remaining 6-DOF subchain, thus obtaining the analytical inverse solutions of the redundant manipulator. Lee and Bejczy [39] put forward a method for deriving the inverse kinematics solution of any redundant manipulator based on the parameterization of joint variables. By selecting the appropriate joint parameters, the redundant arm can be converted into a parameterized non-redundant arm to obtain the inverse kinematics solution of the redundant arm. Shimizu et al. [40] proposed an analytical algorithm to avoid joint limits for a 7-DOF manipulator with an S-R-S configuration: all feasible inverse kinematics solutions were obtained within the joint limit by considering the arm angle as a redundant parameter. Tondu [41] compared the arm angle parameterization and joint parameterization methods using a 7R manipulator with an S-R-S configuration and demonstrated the feasibility of the joint parameterization method.
The above analytical methods verify the feasibility of using redundant parameter methods to find the analytical inverse kinematic solutions of redundant manipulators; in fact, by properly discretizing the redundancy angle, we can quantify the number of solution sets for the redundant manipulator, although it is infinite. In this way, we can measure the solvability of the manipulator in a certain tip pose. Therefore, the analytical method has potential for representing the dexterity of the redundant manipulators, and we describe in Section 2.4 how this analytical method reflects the obstacle avoidance ability of a tip pose.

2.1. Kinematics Model and Analysis

In this paper, a 7-DOF modular manipulator, which is shown in Figure 1, is studied. According to its configuration, the angle of the seventh joint is considered a redundancy parameter to find the inverse kinematic solution of the manipulator. That is, for a specific tip pose, if θ 7 is given, a finite number of collision-free analytical solutions for the remaining 6-DOF subchain can be found.
First, as indicated in Figure 2, the kinematics model of the manipulator is established using the modified Denavit–Hartenberg (D-H) method [42].
In order to simplify the calculation of the 6-DOF subchain, the kinematic modeling is improved, as shown in Figure 3, and its D-H parameters are shown in Table 1.
According to the configuration of the manipulator in Figure 4, the link Q P 7 is always perpendicular to the link Q P 6 . For a specific tip pose 7 0 T , if θ 7 is given, it is equivalent to the rotation by an angle α of the link Q P 6 around the axis z 7 . At this time, the 6-DOF subchain corresponds to a new tip pose 6 0 T , where
7 0 T = n o a P 7 0 0 0 1 ,
6 0 T = n o a P 6 0 0 0 1 = n x o x a x p x n y o y a y p y n z o z a z p z 0 0 0 1 .
We can rotate z 6 by an angle α around z 7 to obtain a :
a = z 6 cos α + ( 1 cos α ) ( a · z 6 ) · a + ( a × z 6 ) sin α .
Since o is always parallel to a ,
o = a ,
n = a × o ,
P 6 = P 7 d 7 a d 6 a .
The transformation matrix of each link in the 6-DOF subchain can be obtained from the D-H parameters, and the kinematic equation is
6 0 T = 1 0 T 2 1 T 3 2 T 4 3 T 5 4 T 6 5 T .
Since there are three joint axes of the 6-DOF subchain intersecting at one point, which satisfies the Pieper criterion [43], the 6-DOF manipulator must have finite analytical solutions.

2.2. Analytical Method for θ 4 , θ 6 , and θ 1

First, we used the analytical method to solve the expressions for the sixth joint and the first joint of the 6-DOF subchain. Here, we refer to a method proposed by Raghavan and Roth [44]. By left-multiplying both sides of Equation (7) by 2 1 T 1 1 0 T 1 and right-multiplying both sides of Equation (7) by 6 5 T 1 , we can obtain
2 1 T 1 1 0 T 1 6 0 T 6 5 T 1 = 3 2 T 4 3 T 5 4 T .
Assuming that the first three elements of the fourth column on the left and right sides of Equation (8) are column vectors P l and P r , respectively, if we let P l 2 = P r 2 , we can obtain
c 4 = ( p z d 1 ) 2 + p x 2 + p y 2 d 3 2 d 5 2 2 d 3 d 5 ,
θ 4 = ± arccos ( c 4 ) .
Assuming that the first three elements of the third column on the left and right sides of Equation (8) are column vectors I l and I r , respectively, if we let R l · I l = R r · I r , we can obtain
[ ( p z d 1 ) o z + p x o x + p y o y ] c 6 + [ ( p z d 1 ) n z + p x n x + p y n y ] s 6 = d 5 + d 3 c 4 .
We can use triangle substitution to obtain
θ 6 = atan 2 ( N ± M 1 2 + M 2 2 N 2 ) atan 2 ( M 1 , M 2 ) , M 1 = ( p z d 1 ) o z + p x o x + p y o y , M 2 = ( p z d 1 ) n z + p x n x + p y n y , N = d 5 + d 3 c 4 .
Let the elements of (3,3) and (3,4) of the left and right sides of Equation (8) be equal, respectively:
( p y c 1 p x s 1 ) = d 5 s 3 s 4 ,
( o y c 6 c 1 + n y s 6 c 1 o x c 6 s 1 n x s 6 s 1 ) = s 3 s 4 .
By substituting Equation (14) into Equation (13), the following equation can be obtained:
( d 5 o y c 6 + d 5 n y s 6 p y ) c 1 + ( d 5 o x c 6 d 5 n x s 6 + p x ) s 1 = 0 .
By triangle substitution,
θ 1 = atan 2 ( R 1 , R 2 ) , R 1 = d 5 o y c 6 + d 5 n y s 6 p y , R 2 = d 5 o x c 6 d 5 n x s 6 + p x ,
where θ 6 is related to θ 1 ; there are currently four sets of solutions.

2.3. Geometric Method for θ 2 , θ 3 , and θ 5

In Figure 5, it can be seen from the configuration of the manipulator that the links P 2 P 4 and P 4 P 6 are always perpendicular to the axis z 4 , where the direction vectors of the links are expressed as r 24 and r 46 . Since r 46 is always equal to z 5 and θ 6 has been obtained, by right-multiplying both sides of Equation (7) by 6 5 T 1 , we can obtain
6 0 T 6 5 T 1 = 1 0 T 2 1 T 3 2 T 4 3 T 5 4 T = 5 0 T ,
where
z 5 = r 46 = [ o x c 6 + n x s 6 , o y c 6 + n y s 6 , o z c 6 + n z s 6 ] T ,
P 5 = P 6 = [ p x , p y , p z ] T .
From Equations (18) and (19), we can obtain
P 2 = [ 0 , 0 , d 1 ] T ,
P 4 = d 5 r 46 + P 6 ,
y 2 = r 24 = P 4 P 2 P 4 P 2 .
When θ 2 = 0 , y 2 = z 1 = [ 0 , 0 , 1 ] T , and z 2 is always perpendicular to z 1 , y 2 and y 2 , so θ 2 is the angle that y 2 rotates around z 2 to y 2 :
c 2 = y 2 · y 2 y 2 · y 2 .
If c 2 = 1 , then y 2 = y 2 , that is θ 2 = 0 . If c 2 ( 1 , 1 ) , then it is necessary to determine whether y 2 × y 2 and z 2 point in the same direction. If they do, then θ 2 = arccos ( c 2 ) ; otherwise, θ 2 = arccos ( c 2 ) .
When θ 4 > 0 , θ 4 is the angle that r 24 rotates around z 4 to r 46 ; at this time, the axis of the fourth joint is
z 4 1 = r 24 × r 46 r 24 × r 46 .
Then,
c 3 = z 4 1 · z 2 z 4 1 · z 2 .
If c 3 = 1 , then z 2 = z 4 1 , that is θ 3 = 0 . If c 3 = 0 , then z 2 = z 4 1 , that is θ 3 = π . If c 3 = = ( 1 , 1 ) , then it is necessary to determine whether z 2 × z 4 1 and r 24 point in the same direction. If they do, then θ 3 = arccos ( c 3 ) ; otherwise, θ 3 = arccos ( c 3 ) .
Now, we know r 46 , z 6 and z 4 1 ; θ 5 is the angle that z 4 1 rotates around r 46 to z 6 , so
c 5 = z 4 1 · z 6 z 4 1 · z 6 .
If c 5 = 1 , then z 6 = z 4 1 , that is θ 5 = 0 . If c 5 = 0 , then z 6 = z 4 1 , that is, θ 5 = π . If c 5 ( 1 , 1 ) , then it is necessary to determine whether z 6 × z 4 1 and r 46 point in the same direction. If they do, then θ 5 = arccos ( c 5 ) ; otherwise, θ 5 = arccos ( c 5 ) .
When θ 4 < 0 , we can also obtain θ 3 and θ 5 using the above method.
It is worth noting that, if we let the elements of (3,3) and (3,4) on both sides of Equation (8) be equal, then
( p y c 1 p x s 1 ) = d 5 s 3 s 4 , n x c 1 c 2 s 6 + o y s 1 c 2 c 6 + n y s 1 c 2 s 6 + o x c 1 c 2 c 6 + o z s 2 c 6 + n z s 2 s 6 = c 3 s 4 .
Since θ 3 = atan 2 ( s 3 , c 3 ) , when s 4 = 0 , the 6-DOF subchain is in a singular posture, and at this time, θ 3 can take any value; θ 6 has only one solution. According to the geometric relationships of the manipulator, when s 4 0 , the value of θ 3 is related to the value of θ 4 . If, in this case, we use Equation (27) to find θ 3 , this will result in fewer solutions than normal.
Above all, when s 4 0 , there are four groups of analytical solutions of the 6-DOF subchain.

2.4. The Obstacle Avoidance Ability Index

The number of solutions of the manipulator for a certain tip pose reflects the dexterity of the manipulator, which also means the strength of its obstacle avoidance ability at this tip pose. For the 7-DOF redundant manipulator, although it has countless inverse solutions, the solvability in different tip poses is obviously not the same. In the above work, the angle of the seventh joint is considered a redundancy parameter, for a specific tip pose; if θ 7 is given, a finite number of collision-free analytical solutions for the remaining 6-DOF subchain can be found. We discretize the redundancy angle into n s , and each six-degree-of-freedom subchain has n i analytical solutions without self-collision. It is known that a six-degree-of-freedom subchain has at most n max solutions, we define the obstacle avoidance ability (OAA) index of the manipulator for a given tip pose as
O A A = i n s n i n s n max · 100
OAA is essentially an index to measure the approximate solvability and dexterity of the 7-DOF manipulator, and the optimal value is 100. If a tip pose is unreachable, the corresponding OAA index is 0. A higher OAA index means more solvable configurations for the manipulator to avoid obstacles. However, usually, the six-degree-of-freedom subchains corresponding to partial redundancy angles have analytical solutions, and the configurations corresponding to partial solutions may have self-collision; these will lead to the decrease of the OAA index. Considering the configuration of the manipulator in this paper, we adopted a dual OBB-sphere bounding volume hierarchy [26] to build the self-collision detection model of the manipulator.
In the pre-planning of a grasping task, finding the reachable tip pose is the primary task, and judging the dexterity of the reachable tip pose is the secondary task. In other words, judging the reachability of a tip pose is a prerequisite for discussing its OAA index. Next, we first discuss a reachability capability map approach to ensure the efficient and accurate determination of the reachability of a tip pose in the workspace of the manipulator.

3. The Reachability Capability Map Approach

In this section, we explore the reachability of the manipulator’s workspace with reference to the method proposed by Zacharias [8]. In particular, we propose a more suitable shape primitive method to store the grasping direction preference information in the workspace for more accurate grasping pre-planning.

3.1. Reachability Index of the Workspace

First, we briefly introduce the method proposed by Zacharias:
The workspace of the manipulator is surrounded by a cube, which is divided into smaller cubes of equal size representing the sub-workspace. A sphere is embedded in each sub-workspace, whose diameter is equal to the side length of the cube. On this sphere, N uniform points are generated, which represent the location of the hand tool center point (TCP), and all TCP frames are generated based on these points. The vector by which the spherical point points to the center of the sphere is the z-axis of a TCP frame, and the corresponding x-axis and y-axis are also generated, as shown in Figure 6. Different TCP frames at the same point can be obtained by rotating around the z-axis with a fixed stepsize. If an inverse kinematics solution is available for a rotating frame at a specific point p on the sphere, the point p is marked in the underlying data structure.
Among N uniform points, if R points have inverse kinematic solutions, we denote the reachability index D as:
D = R N · 100
As we analyzed in Section 2, as long as the z-axis of a tip pose is constant, the corresponding x-axis and y-axis changes do not affect the solvability of the tip pose. That is to say, as long as there is an inverse kinematics solution for any rotating frame of point p, all TCP frames corresponding to the point p are solvable. Therefore, we only need to perform inverse kinematics calculation on one TCP frame of a spherical point. In this paper, the diameter of each sphere is 50 mm, and 300 points are distributed on its surface by the spiral point algorithm [45]. The analytical method proposed in Section 2 is used to solve the inverse kinematics of the manipulator, then the reachability index D of all sub-workspaces is calculated by Equation (29) and marked by different colors. The reachability index distribution of the whole workspace of the manipulator is shown in Figure 7.
For better visibility, we divided the workspace of the manipulator into two parts by x-z plane, and the reachability index ranges from 0 to 100. As expected, moving to the interior of the workspace, the reachability index gradually reaches the maximum of 100, and moving to the base, the reachability index decreases. The sub-workspaces with a reachability index between 90 and 100 account for about 30.94 percent of the workspace, which shows that the end-effector of the manipulator has good directional reachability and can perform more grasping and moving tasks.

3.2. Capturing the Structure to Construct a Map

However, the reachability index is an undirected measure, which makes it impossible to determine the reachable direction in a grasp task. While analyzing the reachability index of the workspace, we also obtain the visual representation of the reachability of all sub-workspaces, which are called reachability spheres [8], and it can help us better explore the information of the reachable directions of all sub-workspaces. In this subsection, we study the geometric structure existing in each sub-workspace and use the reachability sphere to represent it.
Starting from the manipulator’s base, we selected a series of sub-workspaces distributed along the z-axis of the Cartesian coordinate system for analysis, as shown in Figure 8. As expected, it can be observed that, when entering the workspace (from the right), the number of reachable points increases. The shape of the distribution of these points starts from a cone-like body, and its opening angle increases gradually with the leftward movement until it becomes a sphere. As it moves to the left, the shape gradually transits to a cone-like body again. We analyzed and classified the distribution of reachable points of all sub-workspaces and selected five typical representatives to show in Figure 9.
Figure 9a,b represent the distribution of the reachable points in most sub-workspaces, which can be well represented by cone-like bodies and spheres. However, for Figure 9c–e, using the above two shapes to cover all reachable points will cause the mistake of covering the unreachable points. In fact, Reference [8] analyzed the distribution of reachable points and found that these points were mainly distributed in a cone-like structure and a ring-like structure. Then, the shape primitive such as a cone or cylinder is used to capture and approximate the structure of a reachability sphere, and the central axis a of the shape is calculated. It is only necessary to determine whether the z-axis of the tip pose to be detected is in the shape primitive, so as to determine whether the tip pose is reachable, which greatly reduces the computational cost. This method realizes the description of the reachable direction in a certain space, and the author proposed the shape fit error (SEF) to describe the error of shape primitives capturing reachable points. The ideal shape covers all R reachable points, and compared with the ideal shape, the suboptimal shape fails to cover r reachable points and incorrectly covers u reachable points. a represents the central axis of the shape primitive, and α represents the opening angle of the shape primitive, as shown in the middle of Figure 9.
S F E ( a , α ) = u + r R · 100 u + r R 100 u + r > R
For the manipulator studied in this paper, only using the shape primitives such as the cone-like bodies and spheres to capture reachable points can easily involve some unreachable points, which leads to a larger SEF. Therefore, it is necessary to propose an optimized shape primitive to capture and approximate the reachable points of Figure 9c–e to achieve a lower SEF. We next lay the foundation for Section 4 to analyze the obstacle avoidance ability of the manipulator in the sub-workspace.
In order to ensure a smaller capture error, we chose to capture and approximate unreachable points similar to Figure 9c–e using some shape primitives. In fact, these unreachable points can be completely covered by a cone-like body, and the cost is only to add several axes and opening angles. The increased judgment time can be almost ignored. Of course, we also found that the distribution of reachable points on a sphere was only presented as a connected domain. Therefore, we used the density-based spatial clustering of applications with noise (DBSCAN) to classify all sets of the unreachable points on a sphere and then calculated the central axis and opening angle of each class. In Figure 9h–j, there is more than one unreachable shape primitive; if the angles between the z-axis of the tip pose to be detected and the central axes of all the unreachable shape primitives are larger than their corresponding α , it can be judged that the tip pose is reachable. On the contrary, for Figure 9b, we used a cone-like shape primitive to capture and approximate the reachable points; if the angle between the z-axis of the tip pose to be detected and the central axis of the shape primitive is smaller than its corresponding α , it can be judged that the tip pose is reachable. Among them, we optimized all kinds of central axes by principal component analysis (PCA). In order to optimize each α to achieve the minimum SEF, we set the stepsize of α as 3 .
Therefore, we used the shape primitives of a single cone, multiple cones, and a sphere to capture the reachable or unreachable points of a sub-workspace to ensure that we obtain a smaller SEF. Of course, referring to the method of Zacharias, we also used a single cone and sphere to capture the reachable points of each sub-workspace for comparison with our results. The SEF of the reachability spheres in the workspace of the manipulator obtained by the two methods is shown in Figure 10.
In Figure 10, we can find that, although the SEFs of the reachable spheres obtained by the two methods were mostly less than 5, the SEF obtained by the original method was generally larger, especially at the edge of the workspace. The average SEF of all reachable spheres in Figure 10a was 1.11, and the standard deviation was 1.91. In Figure 10b, the average SEF of all reachable spheres was 2.23, and the standard deviation was 6.69. This shows that our model is more accurate in capturing the reachability of the tip poses, which facilitates further analysis of the OAA index of all reachability spheres.

4. Dexterity Capability Map

In Section 3, we focus on reducing the SEF of reachability spheres to improve the accuracy of shape primitives capturing reachable points, and there are two main considerations: first, a lower SEF can improve the accuracy of judging whether the tip pose to be detected can be reachable; second, for discussing the obstacle avoidance ability or solvable ability of a reachability sphere, we only care about the reachable points. In fact, in a sub-workspace, in addition to the different reachable direction preferences of the manipulator’s end-effector, the dexterity in different directions is also not the same. In this section, as the first step, we introduce a visualization scheme to express the obstacle avoidance ability of the manipulator in different sub-workspaces. In the second step, the OAA index information of each reachability sphere is retained as completely as possible for grasp planning with less storage and computing costs.

4.1. The Description of the Obstacle Avoidance Ability of the Workspace

In order to reflect the distribution of the obstacle avoidance ability of the manipulator workspace by visualization, referring to Equation (28), we define the obstacle avoidance ability index of a reachability sphere as Equation (31), where R represents the number of reachable points in the reachability sphere.
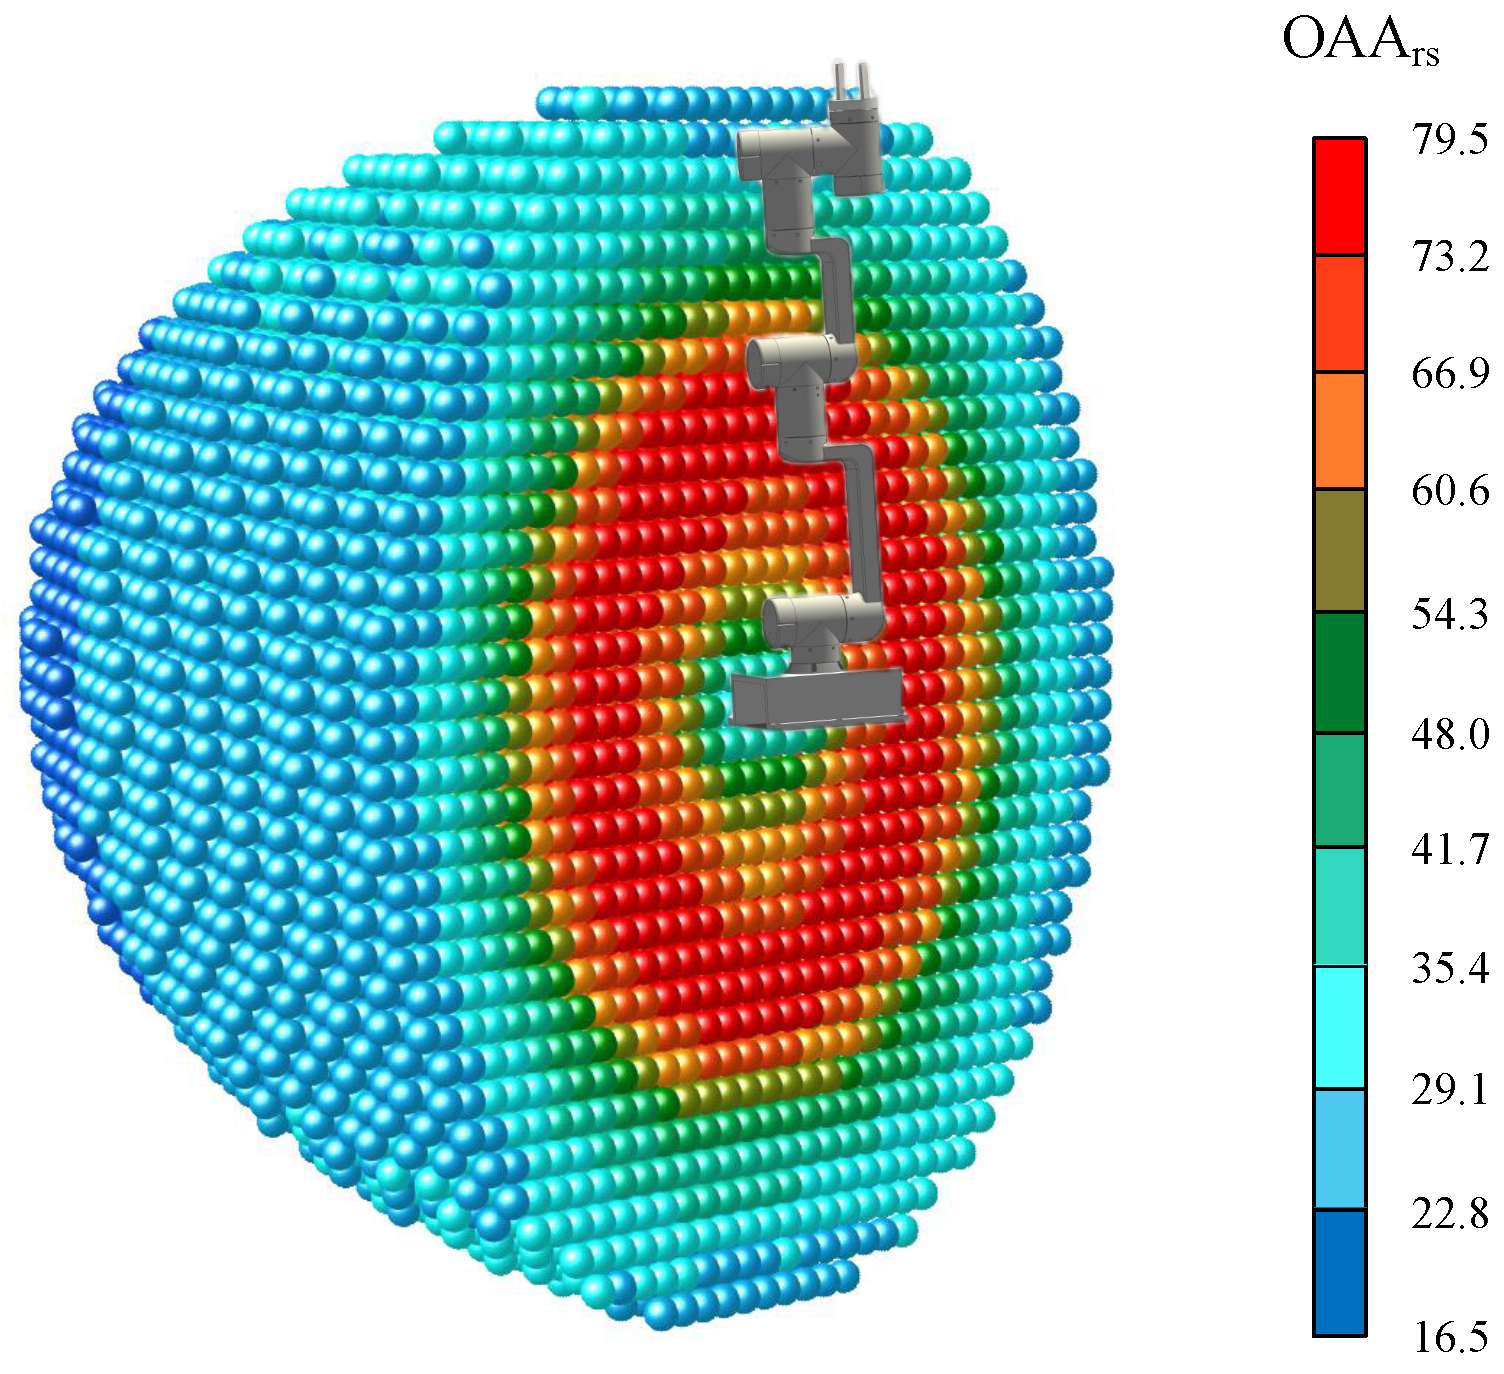
O A A r s = i R O A A i R
The distribution of the obstacle avoidance ability of all reachability spheres is shown in Figure 11. The top 10 percent space of O A A r s in Figure 11 is contained in the top 10 percent space of the reachability index in Figure 7, and the dexterity of the grasping action of the manipulator is optimal in this space. At the same time, the reachability indexes and the obstacle avoidance ability indexes of all reachability spheres are shown in Figure 12 in the form of a scatter plot, and we found that the relationship between the two was positively correlated, that is, for a sub-workspace, the higher its reachability index, the higher the dexterity of the end-effector is. However, for the sub-workspaces with the same reachability index, the corresponding O A A r s may be different, which also indicates that the reachability index alone cannot well reflect the dexterity of the end-effector in a sub-workspace.

4.2. Distribution and Fitting of the OAA Index of Reachability Spheres

For a reachable tip pose, O A A r s can only roughly represent its obstacle avoidance ability, and obtaining a more accurate OAA index requires the method in Section 2, which means more computational cost. Next, we discuss a more efficient method to estimate the OAA index of a given reachable tip pose by studying the distribution of the OAA index of each reachability sphere.
In fact, while solving the reachability of each TCP in Section 3, we also obtain the OAA index of each TCP. We used different colors for the OAA index of the reachable points of the reachability spheres in Figure 8. In Figure 13, the OAA index of the reachability spheres near the base changes gradiently along a certain axis, but it is independent of the central axis of the shape primitive. As it moves to the right, the reachability index of the reachability spheres increases gradually, and the change of the OAA index is also gradually regular: the OAA index always changes in a gradient along a certain axis, especially for the six reachability spheres on the right in Figure 13, which is generally consistent with the central axis of the shape primitive. We define this axis as the OAA index axis. It is worth noting that the TCP frames with a high OAA index in the reachability sphere are mainly distributed in the direction of the OAA index axis, and this indicates the preference of the dexterous direction of the end-effector. Therefore, we tried to find a suitable OAA index axis in each reachability sphere as the benchmark axis to describe the change of the OAA index. A better OAA index axis means that the angles β i [ 0 , π ] between the z-axis of each TCP frame and the benchmark axis has a higher correlation with their corresponding OAA index O A A i [ 0 , 100 ] , which is more conducive to fitting the change of the OAA index in a reachability sphere through a suitable regression function.
The commonly used correlation coefficients include the Pearson correlation coefficient, Spearman correlation coefficient, etc. The former is used to measure the linear correlation between the two variables, and the latter is used to measure the nonlinear correlation between the two variables, but the two are only suitable for monotonic changes. It can be clearly seen from Figure 13 that there are both positive and negative correlations in some reachability spheres with a reachability index of 100. Therefore, in this paper, the distance correlation coefficient [46] was used as an index to optimize the OAA index axis.
For a reachability sphere, an initial axis is given in advance, which is determined by the z-axes of TCP frames of the top 30 percent OAA index. Taking the initial axis as a center axis, a search range with an opening angle of ϵ was set, in which a new axis was randomly selected and the distance correlation coefficient of the corresponding data was calculated. If the coefficient was larger than that of the original axis, the OAA index axis was updated to the new axis; otherwise, the original search range was still used for searching. As the number of cycles increases, the OAA index axis would continue to approach the optimum. We set the number of cycles to 500 and ϵ to 20 .
According to the above method, we obtained the OAA index axis of each reachability sphere. In fact, the change trends of the OAA index can be classified into six cases, as shown at the top of Figure 14. To give a more intuitive representation of these distributions, the sample points p i = ( β i , O A A i ) are shown at the bottom of Figure 14. It is worth noting that, for the reachability spheres with a reachability index less than 100, the OAA index of all reachable points gradually decreased along the OAA index axis until it decreased to 0 (becoming unreachable points). Similarly, the OAA index of all reachable points gradually increased along the negative direction of the OAA index axis to 100. This exactly reflects how the tip poses of the sub-workspace transition from reachable to unreachable, as shown in cases 1–2 in Figure 14 especially.
We found that the potential relationship between the sample points of the OAA index within 0 to 100 seems to be polynomial, and it is obviously reasonable to use polynomial fitting for these points. We assumed that the range of β of these points was R 0 < O A A < 100 . However, these sample points were not enough to ensure the rationality of the change trend near the boundaries of R 0 < O A A < 100 , so we set up four kinds of boundary points to obtain a larger fitting range R 1 , and these boundary points also participated in the actual fitting work as new sample points.
p 0 : This is the nearest point outside R 0 < O A A < 100 , and its OAA index is 0. It was used to reflect the trend of the OAA index to 0, as shown in Cases 1, 2, 5, and 6 in the bottom of Figure 14.
p 100 : This is the nearest point outside R 0 < O A A < 100 , and its OAA index is 100. It was used to reflect the trend of the OAA index to 100, as shown in Cases 2-4 in the bottom of Figure 14.
p a : When there are no points with an OAA index of 100 or 0 in the left interval of R 0 < O A A < 100 , a new TCP is added to the surface of the reachability sphere with its z-axis in the same direction as the OAA index axis (pointing to the center of the reachability sphere), then its OAA index is calculated, as shown in Case 1 in the bottom of Figure 14.
p a : When there are no points with an OAA index of 100 or 0 in the right interval of R 0 < O A A < 100 , a new TCP is added to the surface of the reachability sphere with its z-axis in the opposite direction as the OAA index axis (pointing to the center of the reachability sphere), then its OAA index is calculated, as shown in Case 3 in the bottom of Figure 14.
However, Case 5 is special, and its OAA index axis is not in the shape primitive. In this case, we only let the right p 0 participate in the fitting work. In addition, we define a range R 2 , which only contains the sample points with an OAA index of 100, as shown in Cases 2–4 in the bottom of Figure 14. For the sample points in R 1 , we performed polynomial fitting by the Levenberg–Marquardt algorithm [47] to obtain a suitable polynomial function to predict the OAA index of a reachability sphere. For a given reachable tip pose p g , the angle between the z-axis and the OAA index axis is β g , and we define a prediction function as Equation (32). Using this prediction model, we can quickly obtain a prediction of the OAA index of p g .
O A A g = i = 0 k q i β g i , R 1 100 , R 2
Since we cannot fully supervise the fitting process of the sample points in R 1 of all reachability spheres, we set the following process: fit polynomial functions from degree 1 to degree k by a given training set, and select the most appropriate degree from the trained models using the testing set. In the previous work, we obtained an OAA index of 300 uniformly distributed points in each sub-workspace. Then, we added 400 uniformly distributed TCP frames to each sub-workspace and obtained their OAA index. Based on the above, the sample points in R 1 (including boundary points) were used as the training set and testing set, respectively. We define the mean-squared error (MSE) of the training set and the testing set as follows:
M S E t r a i n = 1 n i = 1 n ( O A A i O A ^ A i ) 2
M S E t e x t = 1 m j = 1 m ( O A A j O A ^ A j ) 2
where n and m represent the number of sample points in the training set and testing set, respectively. O A A i and O A A j represent the real OAA indexes. O A ^ A i and O A ^ A j represent the predicted OAA indexes. We needed to ensure that the model had a good generalization ability and a small mean-squared error in R 1 . For the least-squares problem, with the increase of the polynomial degree, M S E t r a i n will gradually decrease, but the complexity of the model will increase; it is easy for it to overfit locally. The Levenberg–Marquardt algorithm can avoid the problem of the ill-conditioned matrix and ensure the generalization ability of a training model. By selecting the minimum M S E t e x t , we can ensure that we selected the most appropriate model from the k models, while avoiding overfitting and underfitting.
In practice, we set the highest degree of the polynomial to 15, which is sufficient to predict the trend of the OAA index, and the decrease of M S E t r a i n was no longer significant. The setting of the highest polynomial degree was reasonable from the actual fitting effect, as shown in Figure 15.
We define the ratio of M S E t e x t to M S E t r a i n as r, as in Equation (35), to reflect the training effect of a prediction model. We think that the smaller r, the better the prediction of a model is. At the same time, as shown in Equation (36), we set all d reachable points in the newly generated 400 TCPs of each sub-workspace as a large testing set, and its mean absolute error (MAE) for Equation (32) was also calculated, which can intuitively reflect the error degree of each prediction model. Of course, it is meaningful to refer to M A E t e x t when r is small enough.
r = M S E t e x t M S E t r a i n
M A E t e x t = 1 d j = 1 d | O A A j O A A j ^ |
The prediction effect of the models near the base in Figure 16 was satisfactory, and their M A E t e x t in Figure 17 were somewhat on the large side. This is because self-collision was more likely to occur in these sub-workspaces, resulting in a large degree of dispersion of the sample points. In Figure 16, the models’ prediction effect on the reachability spheres near the workspace boundary was poor, while there were some reachability spheres with a very large M A E t e x t in this space, as shown in Figure 17. This was due to the small number of training sample points participating in the fitting, which led to the poor prediction effect of the training model. In fact, the prediction ability of a training model can be improved by increasing the reachable point density of the reachability sphere. In other words, we believe that more reachable points of a reachability sphere are more conducive to improving the training effect of a model, so that r of all sub-workspaces tends to a lower level, and then, the error degree of each prediction model is reasonably measured by M A E t e x t .
We randomly generated 1000 reachable tip poses in the sub-workspaces corresponding to the six reachability spheres in Figure 14. The OAA index of these tip poses was calculated by the method in Section 2 and the prediction models in this section, respectively. The average time cost of the former is Time 1; the average time cost of the latter is Time 2; the mean absolute error of the latter is also given. Experiments were run on an Intel i5-7400 CPU with 8 GB of RAM, and the results are shown in Table 2.
It can be seen that the prediction model proposed in this section was significantly better than the direct calculation of the OAA index in calculation time, and when r was closer to 1, the mean absolute error was closer to M A E t e x t . From the mean absolute error of Case 6, it also can be seen that the prediction was really poor when r was large.

4.3. Pre-Planners for Grasping Tasks

Based on the above discussion, we can obtain different pre-planners consisting of a reachability capability map and a dexterity capability map to complete the pre-planning of two grasping scenarios.
Grasping scenario 1: When a grasping tip pose in the workspace is determined, the reachability capability map of the pre-planner can be used to judge whether the grasping tip pose is reachable. If it is reachable, the planner can quickly give the OAA index of the tip pose to help us judge the dexterity of the grasping action.
Grasping scenario 2: When a grasping point in space is determined, we need to determine a reachable, dexterous grasping direction. First, the planner obtains the range of the reachable grasping direction through the reachability capability map. Then, within this range, the dexterity capability map quickly gives suggestions about the grasping direction with high dexterity.
We give the general process frameworks of two grasping scenarios in Figure 18, which is similar to the human brain’s grasp planning behavior. We randomly selected 500 random grasping tip poses and 500 random grasping points in the manipulator’s workspace to verify the actual effect of our planner in two grasping scenarios, respectively. In Table 3, the accuracy rate is used to represent the accuracy of the reachability judgment given by the two planners, the MAE to measure the error degree of the OAA index predicted by the pre-planners, and time to record the average time consumption in the pre-planning process. From the experimental results, our pre-planners had good performance in the accuracy of reachability judgment, and the mean prediction errors of the OAA index were also maintained at a small level. The mean time consumed by the whole pre-planning process was at the microsecond level, which indicates that the proposed method in this paper has a great advantage in computing time, and this advantage even may have great potential in the pre-planning of dexterous trajectories.

5. Discussion

In this paper, the analytical solution of the manipulator was obtained by discretizing the redundant angle. This method can not only judge the reachability of the positioning posture, but also expand this method. The obstacle avoidance ability index was proposed to reflect the dexterity of the manipulator in a certain posture. More importantly, this index provides a measure of the solvable ability of the redundant manipulator, which is convenient for us to better understand the redundancy characteristics of the redundant manipulator.
We discretized the entire workspace of the manipulator and captured the reachability spheres of each sub-workspace more accurately using a improved shape primitive method. Because, for the grasping task, the reachability judgment of a tip pose is the premise of dexterity judgment, a more accurate reachability capability map is needed. Based on this, we studied the distribution of the OAA index of each reachability sphere, and the gradient change occurred along its OAA index axis, which was helpful for us to model this change through a polynomial function. Especially in the discussion of Section 4, we found that in the process of the transition from reachable tip poses to unreachable tip poses, the OAA index gradually changed from positive to 0, which revealed the deeper change process of reachability.
Based on the OAA index, we tried to establish a dexterity capability map to help the pre-planner with grasp planning, which had a big advantage in computing time. However, the singularity information was not included in the capability map. In the actual control, the singular configuration can be transited by a reasonable control algorithm or can be avoided by adding the manipulability information in the workspace. Moreover, for the reachability sphere with fewer reachable points, the training effect of the prediction model was not ideal. If the number of reachable points of reachability sphere in each sub-workspace were increased to a higher number, it would help to improve the prediction ability of models, which is also our research direction in the future. Then, we attempted to use the reachability capability map and the dexterity capability map proposed in this paper to build pre-planners, which can give accurate dexterous grasping suggestions very efficiently. Therefore, it has great potential in the dexterous grasping task planning of redundant manipulators.

Author Contributions

Conceptualization, Y.Q. and C.Z.; Methodology, Y.Q. and C.Z.; Software, Y.Q.; Validation, C.Z. and Y.Q.; Formal Analysis, Y.Q.; Investigation, Y.Q. and Y.Z.; Resources, C.L. and K.W.; Data Curation, Y.Q.; Writing—Original Draft Preparation, Y.Q. and Y.Z.; Writing—Review Editing, Y.Q.; Visualization, Y.Q. and Y.Z.; Supervision, K.W.; Project Administration, C.L.; Funding Acquisition, K.W. All authors have read and agreed to the published version of the manuscript.

Funding

This work was financially supported by the National Natural Science Foundation of China (Grant Nos. 52205039, 52205303, and 52105011).

Conflicts of Interest

The authors declare no conflict of interest.

References

  1. Ma, R.R.; Dollar, A.M. On dexterity and dexterous manipulation. In Proceedings of the 2011 15th International Conference on Advanced Robotics (ICAR), Tallinn, Estonia, 20–23 June 2011; pp. 1–7. [Google Scholar]
  2. Ebert-Uphoff, I.; Chirikjian, G.S. Inverse kinematics of discretely actuated hyper-redundant manipulators using workspace densities. In Proceedings of the IEEE International Conference on Robotics and Automation, Minneapolis, MN, USA, 22–28 April 1996; Volume 1, pp. 139–145. [Google Scholar]
  3. Yoshikawa, T. Manipulability of robotic mechanisms. Int. J. Robot. Res. 1985, 4, 3–9. [Google Scholar] [CrossRef]
  4. Vahrenkamp, N.; Asfour, T.; Metta, G.; Sandini, G.; Dillmann, R. Manipulability analysis. In Proceedings of the 2012 12th IEEE-Ras International Conference on Humanoid Robots (Humanoids 2012), Osaka, Japan, 29 November–1 December 2012; pp. 568–573. [Google Scholar]
  5. Vahrenkamp, N.; Asfour, T. Representing the robot’s workspace through constrained manipulability analysis. Auton. Robot. 2015, 38, 17–30. [Google Scholar] [CrossRef]
  6. Xu, R.; Luo, J.; Wang, M. Optimal grasping pose for dual-arm space robot cooperative manipulation based on global manipulability. Acta Astronaut. 2021, 183, 300–309. [Google Scholar] [CrossRef]
  7. Stocco, L.; Salcudean, S.E.; Sassani, F. Fast constrained global minimax optimization of robot parameters. Robotica 1998, 16, 595–605. [Google Scholar] [CrossRef] [Green Version]
  8. Zacharias, F.; Borst, C.; Hirzinger, G. Capturing robot workspace structure: Representing robot capabilities. In Proceedings of the 2007 IEEE/RSJ International Conference on Intelligent Robots and Systems, San Diego, CA, USA, 29 October–2 November 2007; pp. 3229–3236. [Google Scholar]
  9. Zacharias, F.; Borst, C.; Hirzinger, G. Online generation of reachable grasps for dexterous manipulation using a representation of the reachable workspace. In Proceedings of the 2009 International Conference on Advanced Robotics, Munich, Germany, 22–26 June 2009; pp. 1–8. [Google Scholar]
  10. Borst, C.; Fischer, M.; Hirzinger, G. Grasping the dice by dicing the grasp. In Proceedings of the 2003 IEEE/RSJ International Conference on Intelligent Robots and Systems (IROS 2003) (Cat. No. 03CH37453), Las Vegas, NV, USA, 27–31 October 2003; Volume 4, pp. 3692–3697. [Google Scholar]
  11. Zacharias, F.; Borst, C.; Wolf, S.; Hirzinger, G. The capability map: A tool to analyze robot arm workspaces. Int. J. Humanoid Robot. 2013, 10, 1350031. [Google Scholar] [CrossRef]
  12. Ruehl, S.W.; Hermann, A.; Xue, Z.; Kerscher, T.; Dillmann, R. Graspability: A description of work surfaces for planning of robot manipulation sequences. In Proceedings of the 2011 IEEE International Conference on Robotics and Automation, Shanghai, China, 9–13 May 2011; pp. 496–502. [Google Scholar]
  13. Wu, W. A grasp-pose generation method based on Gaussian mixture models. Int. J. Adv. Robot. Syst. 2015, 12, 167. [Google Scholar] [CrossRef] [Green Version]
  14. Cao, B.; Sun, K.; Gu, Y.; Jin, M.; Liu, H. Workspace Analysis Based on Manipulator Pose Dexterity Map. In Proceedings of the 2018 3rd International Conference on Robotics and Automation Engineering (ICRAE), Guangzhou, China, 17–19 November 2018; pp. 166–170. [Google Scholar]
  15. Cao, B.; Sun, K.; Gu, Y.; Jin, M.; Liu, H. Humanoid Robot Torso Motion Planning Based on Manipulator Pose Dexterity Index. In Proceedings of the IOP Conference Series: Materials Science and Engineering; IOP Publishing: Bristol, UK, 2020; Volume 853, p. 012040. [Google Scholar]
  16. Baciu, G.; Wong, W.S.K. Image-based collision detection for deformable cloth models. IEEE Trans. Vis. Comput. Graph. 2004, 10, 649–663. [Google Scholar] [CrossRef]
  17. Moore, M.; Wilhelms, J. Collision detection and response for computer animation. In Proceedings of the 15th Annual Conference on Computer Graphics and Interactive Techniques, Atlanta, GA, USA, 1–5 August 1988; pp. 289–298. [Google Scholar]
  18. Ganter, M.; Isarankura, B. Dynamic collision detection using space partitioning. J. Mech. Des. 1993, 115, 150–155. [Google Scholar] [CrossRef]
  19. Webster, N.; McKechnie, J.L. Webster’s New Universal Unabridged Dictionary; Dorset & Baber: Houston, TX, USA, 1983. [Google Scholar]
  20. Smith, A.; Kitamura, Y.; Takemura, H.; Kishino, F. A simple and efficient method for accurate collision detection among deformable polyhedral objects in arbitrary motion. In Proceedings of the Virtual Reality Annual International Symposium’95, Online, 11–15 March 1995; pp. 136–145. [Google Scholar]
  21. van den Bergen, G. Efficient collision detection of complex deformable models using AABB trees. J. Graph. Tools 1997, 2, 1–13. [Google Scholar] [CrossRef]
  22. Palmer, I.J.; Grimsdale, R.L. Collision detection for animation using sphere-trees. In Proceedings of the Computer Graphics Forum; Wiley Online Library: Hoboken, NJ, USA, 1995; Volume 14, pp. 105–116. [Google Scholar]
  23. Gottschalk, S.; Lin, M.C.; Manocha, D. OBBTree: A hierarchical structure for rapid interference detection. In Proceedings of the 23rd annual Conference on Computer Graphics and Interactive Techniques, New Orleans, LA, USA, 4–9 August 1996; pp. 171–180. [Google Scholar]
  24. Klosowski, J.T.; Held, M.; Mitchell, J.S.; Sowizral, H.; Zikan, K. Efficient collision detection using bounding volume hierarchies of k-DOPs. IEEE Trans. Vis. Comput. Graph. 1998, 4, 21–36. [Google Scholar] [CrossRef]
  25. Chang, J.W.; Wang, W.; Kim, M.S. Efficient collision detection using a dual bounding volume hierarchy. In Proceedings of the International Conference on Geometric Modeling and Processing, Hangzhou, China, 23–25 April 2008; Springer: Berlin, Germany, 2008; pp. 143–154. [Google Scholar]
  26. Chang, J.W.; Wang, W.; Kim, M.S. Efficient collision detection using a dual OBB-sphere bounding volume hierarchy. Comput.-Aided Des. 2010, 42, 50–57. [Google Scholar] [CrossRef]
  27. Liang, T.; Song, W.G.; Hou, T.C.; Liu, L.L.; Cao, W.X.; Yan, Z. Collision detection of virtual plant based on bounding volume hierarchy: A case study on virtual wheat. J. Integr. Agric. 2018, 17, 306–314. [Google Scholar]
  28. Hentout, A.; Maoudj, A.; Aouache, M. A review of the literature on fuzzy-logic approaches for collision-free path planning of manipulator robots. In Artificial Intelligence Review; Springer: Berlin, Germany, 2022; pp. 1–76. [Google Scholar]
  29. Lee, K.K.; Buss, M. Obstacle avoidance for redundant robots using Jacobian transpose method. In Proceedings of the 2007 IEEE/RSJ International Conference on Intelligent Robots and Systems, San Diego, CA, USA, 29 October–2 November 2007; pp. 3515–3520. [Google Scholar]
  30. Xiao, L.; Zhang, Y. Dynamic design, numerical solution and effective verification of acceleration-level obstacle-avoidance scheme for robot manipulators. Int. J. Syst. Sci. 2016, 47, 932–945. [Google Scholar] [CrossRef]
  31. Chiriatti, G.; Palmieri, G.; Scoccia, C.; Palpacelli, M.C.; Callegari, M. Adaptive obstacle avoidance for a class of collaborative robots. Machines 2021, 9, 113. [Google Scholar] [CrossRef]
  32. Orin, D.E.; Schrader, W.W. Efficient computation of the Jacobian for robot manipulators. Int. J. Robot. Res. 1984, 3, 66–75. [Google Scholar] [CrossRef]
  33. Wolovich, W.A.; Elliott, H. A computational technique for inverse kinematics. In Proceedings of the 23rd IEEE Conference on Decision and Control, Las Vegas, NV, USA, 12–14 December 1984; pp. 1359–1363. [Google Scholar]
  34. Maciejewski, A.A.; Klein, C.A. Obstacle avoidance for kinematically redundant manipulators in dynamically varying environments. Int. J. Robot. Res. 1985, 4, 109–117. [Google Scholar] [CrossRef] [Green Version]
  35. Wampler, C.W. Manipulator inverse kinematic solutions based on vector formulations and damped least-squares methods. IEEE Trans. Syst. Man Cybern. 1986, 16, 93–101. [Google Scholar] [CrossRef]
  36. Nakamura, Y.; Hanafusa, H. Inverse kinematic solutions with singularity robustness for robot manipulator control. J. Dyn. Syst. Meas. Control 1986, 108, 163–171. [Google Scholar] [CrossRef]
  37. Deo, A.S.; Walker, I.D. Robot subtask performance with singularity robustness using optimal damped least-squares. In Proceedings of the 1992 IEEE International Conference on Robotics and Automation, Nice, France, 12–14 May 1992; IEEE Computer Society: Washington, DC, USA, 1992; pp. 434–435. [Google Scholar]
  38. Crane III, C.D.; Duffy, J.; Carnahan, T. A kinematic analysis of the space station remote manipulator system (SSRMS). J. Robot. Syst. 1991, 8, 637–658. [Google Scholar] [CrossRef]
  39. Lee, S.; Bejczy, A.K. Redundant arm kinematic control based on parameterization. In Proceedings of the 1991 IEEE International Conference on Robotics and Automation, Sacramento, CA, USA, 9–11 April 1991; IEEE Computer Society: Washington, DC, USA, 1991; pp. 458–459. [Google Scholar]
  40. Shimizu, M.; Kakuya, H.; Yoon, W.K.; Kitagaki, K.; Kosuge, K. Analytical inverse kinematic computation for 7-DOF redundant manipulators with joint limits and its application to redundancy resolution. IEEE Trans. Robot. 2008, 24, 1131–1142. [Google Scholar] [CrossRef]
  41. Tondu, B. A closed-form inverse kinematic modeling of a 7R anthropomorphic upper limb based on a joint parametrization. In Proceedings of the 2006 6th IEEE-RAS International Conference on Humanoid Robots, Genova, Italy, 4–6 December 2006; pp. 390–397. [Google Scholar]
  42. Craig, J.J. Introduction to Robotics: Mechanics and Control; Pearson Education: London, UK, 2005. [Google Scholar]
  43. Siciliano, B.; Khatib, O.; Kröger, T. Springer Handbook of Robotics; Springer: Berlin, Germany, 2008; Volume 200. [Google Scholar]
  44. Raghavan, M.; Roth, B. Inverse kinematics of the general 6R manipulator and related linkages. J. Mech. Des. 1993, 115, 502–508. [Google Scholar] [CrossRef]
  45. Saff, E.B.; Kuijlaars, A.B. Distributing many points on a sphere. Math. Intell. 1997, 19, 5–11. [Google Scholar] [CrossRef]
  46. Székely, G.J.; Rizzo, M.L.; Bakirov, N.K. Measuring and testing dependence by correlation of distances. Ann. Stat. 2007, 35, 2769–2794. [Google Scholar] [CrossRef]
  47. Moré, J.J. The Levenberg–Marquardt Algorithm: Implementation and Theory. In Numerical Analysis; Springer: Berlin, Germany, 1978; pp. 105–116. [Google Scholar]
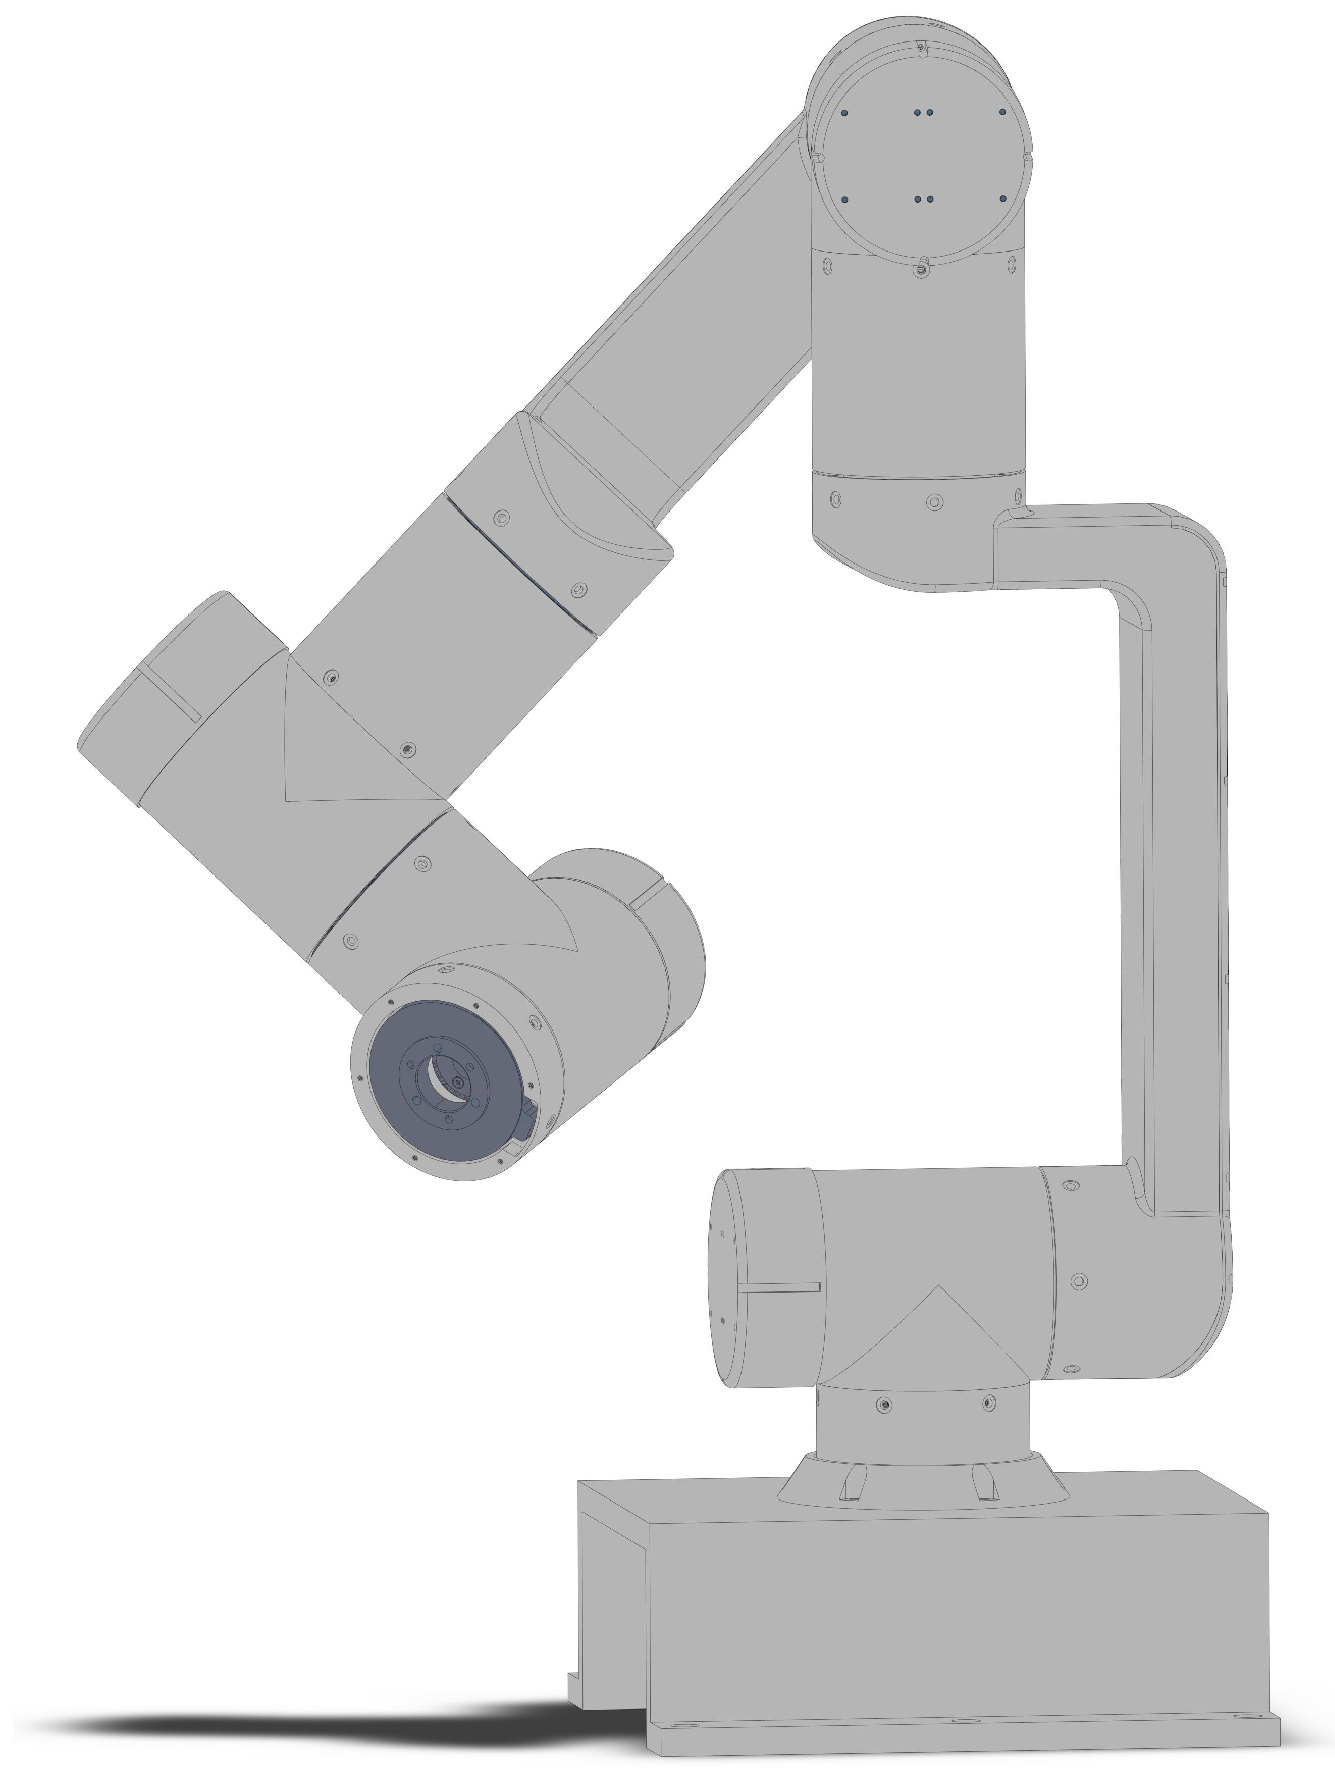
Figure 1. The modular manipulator studied in this paper.
Machines 10 01038 g001
Figure 2. The initial D-H model of the modular manipulator.
Machines 10 01038 g002
Figure 3. The improved D-H model.
Machines 10 01038 g003
Figure 4. In order to study the influence of the redundancy angle on the tip pose of the 6-DOF subchain, we give the geometric relationship between the seventh and sixth joints.
Machines 10 01038 g004
Figure 5. The geometric relations of the first six joints. When θ 6 and θ 1 are known, the corresponding values of the other four joint angles can be determined.
Machines 10 01038 g005
Figure 6. Schematic diagrams of the sub-workspace and TCP frames.
Machines 10 01038 g006
Figure 7. The distribution of the reachability index of all sub-workspaces in the workspace.
Machines 10 01038 g007
Figure 8. The reachability spheres of some continuous sub-workspaces, which represent the direction preference of the end-effector.
Machines 10 01038 g008
Figure 9. (ae) represent five representative reachability spheres and (fj) represent their corresponding shape primitives; the middle of the figure represents a cone-like shape primitive in our method.
Machines 10 01038 g009
Figure 10. The SEF of the reachability spheres in the workspace by the two methods.
Machines 10 01038 g010
Figure 11. The obstacle avoidance ability index of all reachability spheres in the workspace.
Machines 10 01038 g011
Figure 12. The relationship between the reachability indexes and the obstacle avoidance ability indexes of all reachability spheres.
Machines 10 01038 g012
Figure 13. The distribution of the OAA index of the reachability spheres in Figure 8.
Machines 10 01038 g013
Figure 14. The distributions of the OAA index for five typical reachability spheres and the distributions of their corresponding sample points, where D C represents the distance correlation coefficient of each two-dimensional sample point set.
Machines 10 01038 g014
Figure 15. The OAA index prediction model of each reachability sphere at the top of Figure 14 is given, where M S E t r a i n and M S E t e x t represent the mean-squared error of the sample points in R 1 of the training set and the testing set for the polynomial model, M A E t e x t represents the mean absolute error of all the testing points in the reachability sphere for the whole prediction model, and k represents the polynomial degree.
Machines 10 01038 g015
Figure 16. The r of the OAA index prediction model of each reachability sphere.
Machines 10 01038 g016
Figure 17. The M A E t e x t of the OAA index prediction model of each reachability sphere.
Machines 10 01038 g017
Figure 18. The planning processes frameworks of the pre-planners composed of reachability capability map and dexterity capability map in two grasping scenarios.
Machines 10 01038 g018
Table 1. The D-H parameters of the 6-DOF subchain of the improved kinematics model in Figure 3.
i α i 1 a i 1 d i θ i
100 d 1 0
290°000
3−90°0 d 3 0
490°000
5−90°0 d 5 0
690°000
Table 2. Two methods are used to calculate the OAA index of 1000 random tip poses in the sub-workspaces corresponding to the six reachability spheres in Figure 14, then the corresponding average time costs and mean absolute errors are given.
Time 1 (s)Time 2 (s)MAE
Case 10.161 0.9 × 10 5 2.822
Case 20.153 1.1 × 10 5 2.367
Case 30.122 1.3 × 10 5 2.659
Case 40.096 1.1 × 10 5 2.842
Case 50.159 1.2 × 10 5 3.156
Case 60.038 0.8 × 10 5 7.432
Table 3. The effect of pre-planners in two grasping scenarios.
Accuracy RateMAETime (s)
Grasping scenario 194.35%4.239 3.1 × 10 5
Grasping scenario 293.69%5.621 3.9 × 10 5
Publisher’s Note: MDPI stays neutral with regard to jurisdictional claims in published maps and institutional affiliations.